Project
Epithelial-Mesenchymal Transition, human (Scheel, 2011)
Navigation
Downloads
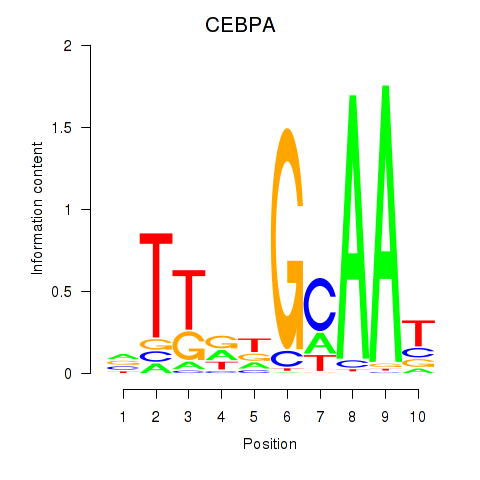
Results for CEBPA
Z-value: 1.85
Motif logo
Transcription factors associated with CEBPA
| Gene Symbol | Gene ID | Gene Info |
|---|---|---|
|
CEBPA
|
ENSG00000245848.2 | CEBPA |
Activity-expression correlation:
| Gene | Promoter | Pearson corr. coef. | P-value | Plot |
|---|---|---|---|---|
| CEBPA | hg19_v2_chr19_-_33793430_33793470 | 0.54 | 1.7e-01 | Click! |
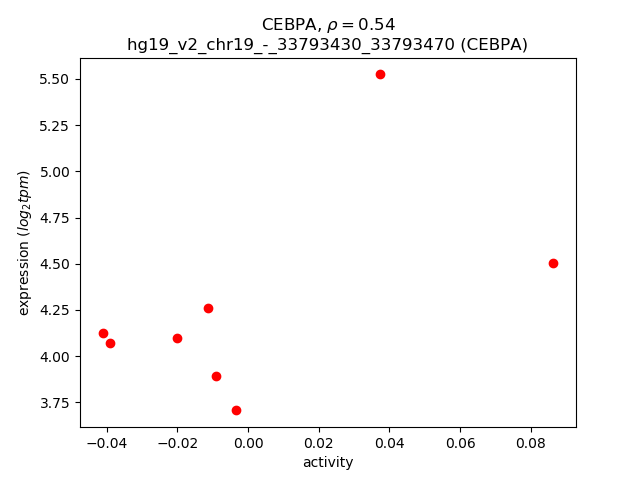
Activity profile of CEBPA motif
Sorted Z-values of CEBPA motif
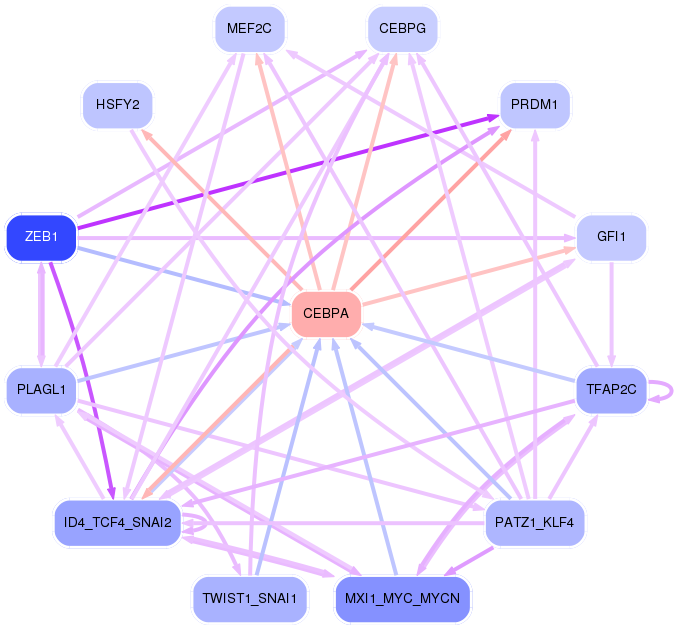
Network of associatons between targets according to the STRING database.

First level regulatory network of CEBPA
| Promoter | Score | Transcript | Gene | Gene Info |
|---|---|---|---|---|
| chr20_-_43883197 | 5.63 |
ENST00000338380.2 |
SLPI |
secretory leukocyte peptidase inhibitor |
| chr11_-_102668879 | 5.27 |
ENST00000315274.6 |
MMP1 |
matrix metallopeptidase 1 (interstitial collagenase) |
| chr20_+_58630972 | 4.37 |
ENST00000313426.1 |
C20orf197 |
chromosome 20 open reading frame 197 |
| chr18_+_61554932 | 3.55 |
ENST00000299502.4 ENST00000457692.1 ENST00000413956.1 |
SERPINB2 |
serpin peptidase inhibitor, clade B (ovalbumin), member 2 |
| chr19_-_35992780 | 3.14 |
ENST00000593342.1 ENST00000601650.1 ENST00000408915.2 |
DMKN |
dermokine |
| chr19_-_36004543 | 2.92 |
ENST00000339686.3 ENST00000447113.2 ENST00000440396.1 |
DMKN |
dermokine |
| chr11_-_18270182 | 2.87 |
ENST00000528349.1 ENST00000526900.1 ENST00000529528.1 ENST00000414546.2 ENST00000256733.4 |
SAA2 |
serum amyloid A2 |
| chr10_+_118187379 | 2.76 |
ENST00000369230.3 |
PNLIPRP3 |
pancreatic lipase-related protein 3 |
| chr11_+_18287721 | 2.74 |
ENST00000356524.4 |
SAA1 |
serum amyloid A1 |
| chr2_-_113594279 | 2.74 |
ENST00000416750.1 ENST00000418817.1 ENST00000263341.2 |
IL1B |
interleukin 1, beta |
| chr11_+_18287801 | 2.73 |
ENST00000532858.1 ENST00000405158.2 |
SAA1 |
serum amyloid A1 |
| chr1_+_152486950 | 2.62 |
ENST00000368790.3 |
CRCT1 |
cysteine-rich C-terminal 1 |
| chr19_-_6720686 | 2.62 |
ENST00000245907.6 |
C3 |
complement component 3 |
| chr12_-_123201337 | 2.54 |
ENST00000528880.2 |
HCAR3 |
hydroxycarboxylic acid receptor 3 |
| chr5_+_36608422 | 2.47 |
ENST00000381918.3 |
SLC1A3 |
solute carrier family 1 (glial high affinity glutamate transporter), member 3 |
| chr18_-_28622774 | 2.43 |
ENST00000434452.1 |
DSC3 |
desmocollin 3 |
| chr18_-_28622699 | 2.41 |
ENST00000360428.4 |
DSC3 |
desmocollin 3 |
| chr12_-_123187890 | 2.32 |
ENST00000328880.5 |
HCAR2 |
hydroxycarboxylic acid receptor 2 |
| chr4_-_10023095 | 2.22 |
ENST00000264784.3 |
SLC2A9 |
solute carrier family 2 (facilitated glucose transporter), member 9 |
| chr13_-_20805109 | 2.17 |
ENST00000241124.6 |
GJB6 |
gap junction protein, beta 6, 30kDa |
| chr12_-_95510743 | 2.14 |
ENST00000551521.1 |
FGD6 |
FYVE, RhoGEF and PH domain containing 6 |
| chr12_+_29376592 | 2.12 |
ENST00000182377.4 |
FAR2 |
fatty acyl CoA reductase 2 |
| chr9_+_130911770 | 1.99 |
ENST00000372998.1 |
LCN2 |
lipocalin 2 |
| chr2_+_223289208 | 1.92 |
ENST00000321276.7 |
SGPP2 |
sphingosine-1-phosphate phosphatase 2 |
| chr10_-_116444371 | 1.85 |
ENST00000533213.2 ENST00000369252.4 |
ABLIM1 |
actin binding LIM protein 1 |
| chr6_-_41130841 | 1.80 |
ENST00000373122.4 |
TREM2 |
triggering receptor expressed on myeloid cells 2 |
| chr12_+_29376673 | 1.77 |
ENST00000547116.1 |
FAR2 |
fatty acyl CoA reductase 2 |
| chr9_+_130911723 | 1.72 |
ENST00000277480.2 ENST00000373013.2 ENST00000540948.1 |
LCN2 |
lipocalin 2 |
| chr6_-_41130914 | 1.62 |
ENST00000373113.3 ENST00000338469.3 |
TREM2 |
triggering receptor expressed on myeloid cells 2 |
| chr14_+_96722539 | 1.59 |
ENST00000553356.1 |
BDKRB1 |
bradykinin receptor B1 |
| chr1_-_186649543 | 1.51 |
ENST00000367468.5 |
PTGS2 |
prostaglandin-endoperoxide synthase 2 (prostaglandin G/H synthase and cyclooxygenase) |
| chr5_+_140227048 | 1.45 |
ENST00000532602.1 |
PCDHA9 |
protocadherin alpha 9 |
| chr7_+_26191809 | 1.34 |
ENST00000056233.3 |
NFE2L3 |
nuclear factor, erythroid 2-like 3 |
| chr10_-_45474237 | 1.32 |
ENST00000448778.1 ENST00000298295.3 |
C10orf10 |
chromosome 10 open reading frame 10 |
| chr2_-_31637560 | 1.24 |
ENST00000379416.3 |
XDH |
xanthine dehydrogenase |
| chr6_+_30848557 | 1.23 |
ENST00000460944.2 ENST00000324771.8 |
DDR1 |
discoidin domain receptor tyrosine kinase 1 |
| chr18_-_61329118 | 1.23 |
ENST00000332821.8 ENST00000283752.5 |
SERPINB3 |
serpin peptidase inhibitor, clade B (ovalbumin), member 3 |
| chr17_-_76124711 | 1.17 |
ENST00000306591.7 ENST00000590602.1 |
TMC6 |
transmembrane channel-like 6 |
| chr19_-_54676846 | 1.17 |
ENST00000301187.4 |
TMC4 |
transmembrane channel-like 4 |
| chr1_+_82266053 | 1.15 |
ENST00000370715.1 ENST00000370713.1 ENST00000319517.6 ENST00000370717.2 ENST00000394879.1 ENST00000271029.4 ENST00000335786.5 |
LPHN2 |
latrophilin 2 |
| chr2_+_102608306 | 1.14 |
ENST00000332549.3 |
IL1R2 |
interleukin 1 receptor, type II |
| chr6_+_106534192 | 1.08 |
ENST00000369091.2 ENST00000369096.4 |
PRDM1 |
PR domain containing 1, with ZNF domain |
| chr7_+_18535786 | 1.08 |
ENST00000406072.1 |
HDAC9 |
histone deacetylase 9 |
| chr8_+_18248786 | 1.07 |
ENST00000520116.1 |
NAT2 |
N-acetyltransferase 2 (arylamine N-acetyltransferase) |
| chr12_-_86230315 | 1.05 |
ENST00000361228.3 |
RASSF9 |
Ras association (RalGDS/AF-6) domain family (N-terminal) member 9 |
| chr6_-_11779014 | 1.04 |
ENST00000229583.5 |
ADTRP |
androgen-dependent TFPI-regulating protein |
| chr19_-_54676884 | 1.03 |
ENST00000376591.4 |
TMC4 |
transmembrane channel-like 4 |
| chr8_+_18248755 | 0.99 |
ENST00000286479.3 |
NAT2 |
N-acetyltransferase 2 (arylamine N-acetyltransferase) |
| chr21_+_43619796 | 0.99 |
ENST00000398457.2 |
ABCG1 |
ATP-binding cassette, sub-family G (WHITE), member 1 |
| chr17_-_76124812 | 0.98 |
ENST00000592063.1 ENST00000589271.1 ENST00000322933.4 ENST00000589553.1 |
TMC6 |
transmembrane channel-like 6 |
| chr13_+_78109884 | 0.98 |
ENST00000377246.3 ENST00000349847.3 |
SCEL |
sciellin |
| chr13_+_78109804 | 0.97 |
ENST00000535157.1 |
SCEL |
sciellin |
| chr12_+_21207503 | 0.94 |
ENST00000545916.1 |
SLCO1B7 |
solute carrier organic anion transporter family, member 1B7 (non-functional) |
| chr1_+_62439037 | 0.93 |
ENST00000545929.1 |
INADL |
InaD-like (Drosophila) |
| chr1_-_153029980 | 0.93 |
ENST00000392653.2 |
SPRR2A |
small proline-rich protein 2A |
| chr12_+_101188547 | 0.90 |
ENST00000546991.1 ENST00000392979.3 |
ANO4 |
anoctamin 4 |
| chr1_+_111770278 | 0.90 |
ENST00000369748.4 |
CHI3L2 |
chitinase 3-like 2 |
| chr1_+_111770232 | 0.90 |
ENST00000369744.2 |
CHI3L2 |
chitinase 3-like 2 |
| chr9_-_140196703 | 0.89 |
ENST00000356628.2 |
NRARP |
NOTCH-regulated ankyrin repeat protein |
| chr12_+_101188718 | 0.88 |
ENST00000299222.9 ENST00000392977.3 |
ANO4 |
anoctamin 4 |
| chr4_-_139163491 | 0.86 |
ENST00000280612.5 |
SLC7A11 |
solute carrier family 7 (anionic amino acid transporter light chain, xc- system), member 11 |
| chr19_+_50084561 | 0.83 |
ENST00000246794.5 |
PRRG2 |
proline rich Gla (G-carboxyglutamic acid) 2 |
| chr2_-_101925055 | 0.83 |
ENST00000295317.3 |
RNF149 |
ring finger protein 149 |
| chr11_+_117947782 | 0.82 |
ENST00000522307.1 ENST00000523251.1 ENST00000437212.3 ENST00000522824.1 ENST00000522151.1 |
TMPRSS4 |
transmembrane protease, serine 4 |
| chr1_-_114429997 | 0.82 |
ENST00000471267.1 ENST00000393320.3 |
BCL2L15 |
BCL2-like 15 |
| chr12_+_19358228 | 0.80 |
ENST00000424268.1 ENST00000543806.1 |
PLEKHA5 |
pleckstrin homology domain containing, family A member 5 |
| chr1_+_196743912 | 0.80 |
ENST00000367425.4 |
CFHR3 |
complement factor H-related 3 |
| chr16_+_82090028 | 0.79 |
ENST00000568090.1 |
HSD17B2 |
hydroxysteroid (17-beta) dehydrogenase 2 |
| chr6_+_47666275 | 0.78 |
ENST00000327753.3 ENST00000283303.2 |
GPR115 |
G protein-coupled receptor 115 |
| chr1_+_196743943 | 0.75 |
ENST00000471440.2 ENST00000391985.3 |
CFHR3 |
complement factor H-related 3 |
| chr1_-_207095324 | 0.74 |
ENST00000530505.1 ENST00000367091.3 ENST00000442471.2 |
FAIM3 |
Fas apoptotic inhibitory molecule 3 |
| chr2_-_18770812 | 0.73 |
ENST00000359846.2 ENST00000304081.4 ENST00000600945.1 ENST00000532967.1 ENST00000444297.2 |
NT5C1B NT5C1B-RDH14 |
5'-nucleotidase, cytosolic IB NT5C1B-RDH14 readthrough |
| chr14_+_22782867 | 0.73 |
ENST00000390467.3 |
TRAV40 |
T cell receptor alpha variable 40 |
| chr9_-_117568365 | 0.73 |
ENST00000374045.4 |
TNFSF15 |
tumor necrosis factor (ligand) superfamily, member 15 |
| chrX_+_105192423 | 0.72 |
ENST00000540278.1 |
NRK |
Nik related kinase |
| chr7_-_32111009 | 0.72 |
ENST00000396184.3 ENST00000396189.2 ENST00000321453.7 |
PDE1C |
phosphodiesterase 1C, calmodulin-dependent 70kDa |
| chr8_+_118533049 | 0.72 |
ENST00000522839.1 |
MED30 |
mediator complex subunit 30 |
| chr8_+_27348649 | 0.71 |
ENST00000521780.1 ENST00000380476.3 ENST00000518379.1 ENST00000521684.1 |
EPHX2 |
epoxide hydrolase 2, cytoplasmic |
| chr2_+_163200598 | 0.70 |
ENST00000437150.2 ENST00000453113.2 |
GCA |
grancalcin, EF-hand calcium binding protein |
| chr14_+_96722152 | 0.70 |
ENST00000216629.6 |
BDKRB1 |
bradykinin receptor B1 |
| chr12_+_41831485 | 0.70 |
ENST00000539469.2 ENST00000298919.7 |
PDZRN4 |
PDZ domain containing ring finger 4 |
| chr21_-_46348626 | 0.70 |
ENST00000517563.1 |
ITGB2 |
integrin, beta 2 (complement component 3 receptor 3 and 4 subunit) |
| chr18_-_61311485 | 0.69 |
ENST00000436264.1 ENST00000356424.6 ENST00000341074.5 |
SERPINB4 |
serpin peptidase inhibitor, clade B (ovalbumin), member 4 |
| chr6_+_150920999 | 0.62 |
ENST00000367328.1 ENST00000367326.1 |
PLEKHG1 |
pleckstrin homology domain containing, family G (with RhoGef domain) member 1 |
| chr8_+_118532937 | 0.62 |
ENST00000297347.3 |
MED30 |
mediator complex subunit 30 |
| chr1_+_152658599 | 0.60 |
ENST00000368780.3 |
LCE2B |
late cornified envelope 2B |
| chr11_+_7597639 | 0.60 |
ENST00000533792.1 |
PPFIBP2 |
PTPRF interacting protein, binding protein 2 (liprin beta 2) |
| chr6_-_53409890 | 0.60 |
ENST00000229416.6 |
GCLC |
glutamate-cysteine ligase, catalytic subunit |
| chr18_-_52989525 | 0.58 |
ENST00000457482.3 |
TCF4 |
transcription factor 4 |
| chr1_+_196857144 | 0.58 |
ENST00000367416.2 ENST00000251424.4 ENST00000367418.2 |
CFHR4 |
complement factor H-related 4 |
| chr1_+_107682629 | 0.57 |
ENST00000370074.4 ENST00000370073.2 ENST00000370071.2 ENST00000542803.1 ENST00000370061.3 ENST00000370072.3 ENST00000370070.2 |
NTNG1 |
netrin G1 |
| chr12_+_21168630 | 0.57 |
ENST00000421593.2 |
SLCO1B7 |
solute carrier organic anion transporter family, member 1B7 (non-functional) |
| chr14_-_81893734 | 0.57 |
ENST00000555447.1 |
STON2 |
stonin 2 |
| chr11_-_104972158 | 0.56 |
ENST00000598974.1 ENST00000593315.1 ENST00000594519.1 ENST00000415981.2 ENST00000525374.1 ENST00000375707.1 |
CASP1 CARD16 CARD17 |
caspase 1, apoptosis-related cysteine peptidase caspase recruitment domain family, member 16 caspase recruitment domain family, member 17 |
| chr18_-_53070913 | 0.53 |
ENST00000568186.1 ENST00000564228.1 |
TCF4 |
transcription factor 4 |
| chr4_-_90756769 | 0.52 |
ENST00000345009.4 ENST00000505199.1 ENST00000502987.1 |
SNCA |
synuclein, alpha (non A4 component of amyloid precursor) |
| chr2_+_220306745 | 0.52 |
ENST00000431523.1 ENST00000396698.1 ENST00000396695.2 |
SPEG |
SPEG complex locus |
| chr10_-_75676400 | 0.52 |
ENST00000412307.2 |
C10orf55 |
chromosome 10 open reading frame 55 |
| chr4_-_153274078 | 0.52 |
ENST00000263981.5 |
FBXW7 |
F-box and WD repeat domain containing 7, E3 ubiquitin protein ligase |
| chrY_-_20935572 | 0.51 |
ENST00000382852.1 ENST00000344884.4 ENST00000304790.3 |
HSFY2 |
heat shock transcription factor, Y linked 2 |
| chr3_-_123339343 | 0.51 |
ENST00000578202.1 |
MYLK |
myosin light chain kinase |
| chr12_-_10007448 | 0.51 |
ENST00000538152.1 |
CLEC2B |
C-type lectin domain family 2, member B |
| chr11_-_104905840 | 0.51 |
ENST00000526568.1 ENST00000393136.4 ENST00000531166.1 ENST00000534497.1 ENST00000527979.1 ENST00000446369.1 ENST00000353247.5 ENST00000528974.1 ENST00000533400.1 ENST00000525825.1 ENST00000436863.3 |
CASP1 |
caspase 1, apoptosis-related cysteine peptidase |
| chr14_-_106781017 | 0.50 |
ENST00000390612.2 |
IGHV4-28 |
immunoglobulin heavy variable 4-28 |
| chr5_+_147258266 | 0.49 |
ENST00000296694.4 |
SCGB3A2 |
secretoglobin, family 3A, member 2 |
| chr3_-_4793274 | 0.48 |
ENST00000414938.1 |
EGOT |
eosinophil granule ontogeny transcript (non-protein coding) |
| chr17_+_56315787 | 0.48 |
ENST00000262290.4 ENST00000421678.2 |
LPO |
lactoperoxidase |
| chrY_+_20708557 | 0.48 |
ENST00000307393.2 ENST00000309834.4 ENST00000382856.2 |
HSFY1 |
heat shock transcription factor, Y-linked 1 |
| chr6_+_130339710 | 0.48 |
ENST00000526087.1 ENST00000533560.1 ENST00000361794.2 |
L3MBTL3 |
l(3)mbt-like 3 (Drosophila) |
| chr3_-_112693865 | 0.47 |
ENST00000471858.1 ENST00000295863.4 ENST00000308611.3 |
CD200R1 |
CD200 receptor 1 |
| chr6_-_32557610 | 0.47 |
ENST00000360004.5 |
HLA-DRB1 |
major histocompatibility complex, class II, DR beta 1 |
| chr3_-_123339418 | 0.47 |
ENST00000583087.1 |
MYLK |
myosin light chain kinase |
| chr7_+_123241908 | 0.47 |
ENST00000434204.1 ENST00000437535.1 ENST00000451215.1 |
ASB15 |
ankyrin repeat and SOCS box containing 15 |
| chr3_-_112218205 | 0.47 |
ENST00000383680.4 |
BTLA |
B and T lymphocyte associated |
| chr19_-_56249740 | 0.46 |
ENST00000590200.1 ENST00000332836.2 |
NLRP9 |
NLR family, pyrin domain containing 9 |
| chr12_-_48963829 | 0.45 |
ENST00000301046.2 ENST00000549817.1 |
LALBA |
lactalbumin, alpha- |
| chr7_-_121944491 | 0.45 |
ENST00000331178.4 ENST00000427185.2 ENST00000442488.2 |
FEZF1 |
FEZ family zinc finger 1 |
| chr11_+_60050026 | 0.45 |
ENST00000395016.3 |
MS4A4A |
membrane-spanning 4-domains, subfamily A, member 4A |
| chr6_-_30043539 | 0.44 |
ENST00000376751.3 ENST00000244360.6 |
RNF39 |
ring finger protein 39 |
| chr12_+_20963647 | 0.43 |
ENST00000381545.3 |
SLCO1B3 |
solute carrier organic anion transporter family, member 1B3 |
| chr12_-_46662772 | 0.43 |
ENST00000549049.1 ENST00000439706.1 ENST00000398637.5 |
SLC38A1 |
solute carrier family 38, member 1 |
| chr11_-_101454658 | 0.43 |
ENST00000344327.3 |
TRPC6 |
transient receptor potential cation channel, subfamily C, member 6 |
| chr8_-_72459885 | 0.43 |
ENST00000523987.1 |
RP11-1102P16.1 |
Uncharacterized protein |
| chr12_+_47473369 | 0.43 |
ENST00000546455.1 |
PCED1B |
PC-esterase domain containing 1B |
| chr12_+_20963632 | 0.43 |
ENST00000540853.1 ENST00000261196.2 |
SLCO1B3 |
solute carrier organic anion transporter family, member 1B3 |
| chr11_+_60048004 | 0.43 |
ENST00000532114.1 |
MS4A4A |
membrane-spanning 4-domains, subfamily A, member 4A |
| chr2_+_196521458 | 0.42 |
ENST00000409086.3 |
SLC39A10 |
solute carrier family 39 (zinc transporter), member 10 |
| chr1_-_114430169 | 0.42 |
ENST00000393316.3 |
BCL2L15 |
BCL2-like 15 |
| chr2_+_65663812 | 0.42 |
ENST00000606978.1 ENST00000377977.3 ENST00000536804.1 |
AC074391.1 |
AC074391.1 |
| chr1_-_153321301 | 0.42 |
ENST00000368739.3 |
PGLYRP4 |
peptidoglycan recognition protein 4 |
| chr3_+_118905564 | 0.42 |
ENST00000460625.1 |
UPK1B |
uroplakin 1B |
| chr16_-_2059797 | 0.41 |
ENST00000563630.1 |
ZNF598 |
zinc finger protein 598 |
| chr5_+_140227357 | 0.41 |
ENST00000378122.3 |
PCDHA9 |
protocadherin alpha 9 |
| chr3_-_143567262 | 0.40 |
ENST00000474151.1 ENST00000316549.6 |
SLC9A9 |
solute carrier family 9, subfamily A (NHE9, cation proton antiporter 9), member 9 |
| chr10_-_61900762 | 0.40 |
ENST00000355288.2 |
ANK3 |
ankyrin 3, node of Ranvier (ankyrin G) |
| chr9_-_39288092 | 0.39 |
ENST00000323947.7 ENST00000297668.6 ENST00000377656.2 ENST00000377659.1 |
CNTNAP3 |
contactin associated protein-like 3 |
| chr7_+_107224364 | 0.39 |
ENST00000491150.1 |
BCAP29 |
B-cell receptor-associated protein 29 |
| chr12_-_323689 | 0.39 |
ENST00000428720.1 |
SLC6A12 |
solute carrier family 6 (neurotransmitter transporter), member 12 |
| chr4_-_87028478 | 0.39 |
ENST00000515400.1 ENST00000395157.3 |
MAPK10 |
mitogen-activated protein kinase 10 |
| chr17_+_72426891 | 0.39 |
ENST00000392627.1 |
GPRC5C |
G protein-coupled receptor, family C, group 5, member C |
| chr10_+_95517566 | 0.38 |
ENST00000542308.1 |
LGI1 |
leucine-rich, glioma inactivated 1 |
| chr10_+_95517616 | 0.38 |
ENST00000371418.4 |
LGI1 |
leucine-rich, glioma inactivated 1 |
| chr3_+_10857885 | 0.38 |
ENST00000254488.2 ENST00000454147.1 |
SLC6A11 |
solute carrier family 6 (neurotransmitter transporter), member 11 |
| chr12_+_12966250 | 0.38 |
ENST00000352940.4 ENST00000358007.3 ENST00000544400.1 |
DDX47 |
DEAD (Asp-Glu-Ala-Asp) box polypeptide 47 |
| chr1_-_54304212 | 0.38 |
ENST00000540001.1 |
NDC1 |
NDC1 transmembrane nucleoporin |
| chr3_+_118892362 | 0.38 |
ENST00000497685.1 ENST00000264234.3 |
UPK1B |
uroplakin 1B |
| chr2_-_46769694 | 0.38 |
ENST00000522587.1 |
ATP6V1E2 |
ATPase, H+ transporting, lysosomal 31kDa, V1 subunit E2 |
| chr3_-_112693759 | 0.38 |
ENST00000440122.2 ENST00000490004.1 |
CD200R1 |
CD200 receptor 1 |
| chr19_-_54876558 | 0.37 |
ENST00000391742.2 ENST00000434277.2 |
LAIR1 |
leukocyte-associated immunoglobulin-like receptor 1 |
| chr3_+_48264816 | 0.37 |
ENST00000296435.2 ENST00000576243.1 |
CAMP |
cathelicidin antimicrobial peptide |
| chr14_+_22739823 | 0.37 |
ENST00000390464.2 |
TRAV38-1 |
T cell receptor alpha variable 38-1 |
| chr6_+_144185573 | 0.37 |
ENST00000237275.6 ENST00000539295.1 |
ZC2HC1B |
zinc finger, C2HC-type containing 1B |
| chr12_+_20522179 | 0.36 |
ENST00000359062.3 |
PDE3A |
phosphodiesterase 3A, cGMP-inhibited |
| chr1_-_52521831 | 0.36 |
ENST00000371626.4 |
TXNDC12 |
thioredoxin domain containing 12 (endoplasmic reticulum) |
| chr17_-_34270697 | 0.36 |
ENST00000585556.1 |
LYZL6 |
lysozyme-like 6 |
| chr10_+_97515409 | 0.35 |
ENST00000371207.3 ENST00000543964.1 |
ENTPD1 |
ectonucleoside triphosphate diphosphohydrolase 1 |
| chr9_+_27524283 | 0.35 |
ENST00000276943.2 |
IFNK |
interferon, kappa |
| chr17_+_57287228 | 0.35 |
ENST00000578922.1 ENST00000300917.5 |
SMG8 |
SMG8 nonsense mediated mRNA decay factor |
| chr6_+_26087646 | 0.35 |
ENST00000309234.6 |
HFE |
hemochromatosis |
| chr11_-_58980342 | 0.35 |
ENST00000361050.3 |
MPEG1 |
macrophage expressed 1 |
| chr14_-_23285011 | 0.35 |
ENST00000397532.3 |
SLC7A7 |
solute carrier family 7 (amino acid transporter light chain, y+L system), member 7 |
| chr11_+_59824127 | 0.35 |
ENST00000278865.3 |
MS4A3 |
membrane-spanning 4-domains, subfamily A, member 3 (hematopoietic cell-specific) |
| chr17_+_56315936 | 0.34 |
ENST00000543544.1 |
LPO |
lactoperoxidase |
| chr11_+_59824060 | 0.34 |
ENST00000395032.2 ENST00000358152.2 |
MS4A3 |
membrane-spanning 4-domains, subfamily A, member 3 (hematopoietic cell-specific) |
| chr16_+_56899114 | 0.34 |
ENST00000566786.1 ENST00000438926.2 ENST00000563236.1 ENST00000262502.5 |
SLC12A3 |
solute carrier family 12 (sodium/chloride transporter), member 3 |
| chr10_+_26727125 | 0.33 |
ENST00000376236.4 |
APBB1IP |
amyloid beta (A4) precursor protein-binding, family B, member 1 interacting protein |
| chr11_+_60048053 | 0.33 |
ENST00000337908.4 |
MS4A4A |
membrane-spanning 4-domains, subfamily A, member 4A |
| chr14_+_24540046 | 0.33 |
ENST00000397016.2 ENST00000537691.1 ENST00000560356.1 ENST00000558450.1 |
CPNE6 |
copine VI (neuronal) |
| chrX_+_16141667 | 0.32 |
ENST00000380289.2 |
GRPR |
gastrin-releasing peptide receptor |
| chr19_+_45394477 | 0.32 |
ENST00000252487.5 ENST00000405636.2 ENST00000592434.1 ENST00000426677.2 ENST00000589649.1 |
TOMM40 |
translocase of outer mitochondrial membrane 40 homolog (yeast) |
| chr13_+_96085847 | 0.32 |
ENST00000376873.3 |
CLDN10 |
claudin 10 |
| chr3_-_197300194 | 0.32 |
ENST00000358186.2 ENST00000431056.1 |
BDH1 |
3-hydroxybutyrate dehydrogenase, type 1 |
| chr5_+_161494521 | 0.32 |
ENST00000356592.3 |
GABRG2 |
gamma-aminobutyric acid (GABA) A receptor, gamma 2 |
| chr11_+_55594695 | 0.32 |
ENST00000378397.1 |
OR5L2 |
olfactory receptor, family 5, subfamily L, member 2 |
| chr18_-_19283649 | 0.31 |
ENST00000584464.1 ENST00000578270.1 |
ABHD3 |
abhydrolase domain containing 3 |
| chr19_-_36019123 | 0.31 |
ENST00000588674.1 ENST00000452271.2 ENST00000518157.1 |
SBSN |
suprabasin |
| chr4_+_144434584 | 0.31 |
ENST00000283131.3 |
SMARCA5 |
SWI/SNF related, matrix associated, actin dependent regulator of chromatin, subfamily a, member 5 |
| chr5_+_140430979 | 0.31 |
ENST00000306549.3 |
PCDHB1 |
protocadherin beta 1 |
| chr11_-_128737163 | 0.31 |
ENST00000324003.3 ENST00000392665.2 |
KCNJ1 |
potassium inwardly-rectifying channel, subfamily J, member 1 |
| chr5_-_145483932 | 0.31 |
ENST00000311450.4 |
PLAC8L1 |
PLAC8-like 1 |
| chr14_-_64194745 | 0.31 |
ENST00000247225.6 |
SGPP1 |
sphingosine-1-phosphate phosphatase 1 |
| chr16_-_2059748 | 0.31 |
ENST00000562103.1 ENST00000431526.1 |
ZNF598 |
zinc finger protein 598 |
| chr17_+_4336955 | 0.31 |
ENST00000355530.2 |
SPNS3 |
spinster homolog 3 (Drosophila) |
| chr17_-_73840415 | 0.31 |
ENST00000592386.1 ENST00000412096.2 ENST00000586147.1 |
UNC13D |
unc-13 homolog D (C. elegans) |
| chr19_+_6887571 | 0.31 |
ENST00000250572.8 ENST00000381407.5 ENST00000312053.4 ENST00000450315.3 ENST00000381404.4 |
EMR1 |
egf-like module containing, mucin-like, hormone receptor-like 1 |
| chr11_-_110583451 | 0.30 |
ENST00000260283.4 ENST00000528829.1 |
ARHGAP20 |
Rho GTPase activating protein 20 |
| chr21_-_46348694 | 0.30 |
ENST00000355153.4 ENST00000397850.2 |
ITGB2 |
integrin, beta 2 (complement component 3 receptor 3 and 4 subunit) |
| chr1_-_67519782 | 0.30 |
ENST00000235345.5 |
SLC35D1 |
solute carrier family 35 (UDP-GlcA/UDP-GalNAc transporter), member D1 |
| chrX_-_138914394 | 0.30 |
ENST00000327569.3 ENST00000361648.2 ENST00000370543.1 ENST00000359686.2 |
ATP11C |
ATPase, class VI, type 11C |
| chr11_+_63137251 | 0.30 |
ENST00000310969.4 ENST00000279178.3 |
SLC22A9 |
solute carrier family 22 (organic anion transporter), member 9 |
| chr11_-_128737259 | 0.30 |
ENST00000440599.2 ENST00000392666.1 ENST00000324036.3 |
KCNJ1 |
potassium inwardly-rectifying channel, subfamily J, member 1 |
| chr17_-_69198295 | 0.30 |
ENST00000569074.1 |
CASC17 |
cancer susceptibility candidate 17 (non-protein coding) |
| chr6_-_33037019 | 0.29 |
ENST00000437811.1 |
HLA-DPA1 |
major histocompatibility complex, class II, DP alpha 1 |
| chr1_-_154458520 | 0.29 |
ENST00000486773.1 |
SHE |
Src homology 2 domain containing E |
| chr16_+_56969284 | 0.29 |
ENST00000568358.1 |
HERPUD1 |
homocysteine-inducible, endoplasmic reticulum stress-inducible, ubiquitin-like domain member 1 |
| chr10_-_113943447 | 0.29 |
ENST00000369425.1 ENST00000348367.4 ENST00000423155.1 |
GPAM |
glycerol-3-phosphate acyltransferase, mitochondrial |
| chr21_+_34775181 | 0.29 |
ENST00000290219.6 |
IFNGR2 |
interferon gamma receptor 2 (interferon gamma transducer 1) |
| chr7_+_1126437 | 0.29 |
ENST00000413368.1 ENST00000397092.1 |
GPER1 |
G protein-coupled estrogen receptor 1 |
| chr14_-_23285069 | 0.28 |
ENST00000554758.1 ENST00000397528.4 |
SLC7A7 |
solute carrier family 7 (amino acid transporter light chain, y+L system), member 7 |
| chr19_+_17862274 | 0.28 |
ENST00000596536.1 ENST00000593870.1 ENST00000598086.1 ENST00000598932.1 ENST00000595023.1 ENST00000594068.1 ENST00000596507.1 ENST00000595033.1 ENST00000597718.1 |
FCHO1 |
FCH domain only 1 |
Gene Ontology Analysis
Gene overrepresentation in biological_process category:
| Log-likelihood per target | Total log-likelihood | Term | Description |
|---|---|---|---|
| 1.1 | 3.4 | GO:0032499 | positive regulation of antigen processing and presentation of peptide or polysaccharide antigen via MHC class II(GO:0002582) positive regulation of antigen processing and presentation of peptide antigen(GO:0002585) positive regulation of antigen processing and presentation of peptide antigen via MHC class II(GO:0002588) detection of peptidoglycan(GO:0032499) |
| 1.0 | 6.1 | GO:1903575 | cornified envelope assembly(GO:1903575) |
| 0.9 | 2.7 | GO:0060557 | positive regulation of vitamin metabolic process(GO:0046136) positive regulation of vitamin D biosynthetic process(GO:0060557) positive regulation of calcidiol 1-monooxygenase activity(GO:0060559) |
| 0.9 | 2.6 | GO:0001798 | positive regulation of type IIa hypersensitivity(GO:0001798) positive regulation of type II hypersensitivity(GO:0002894) |
| 0.7 | 3.7 | GO:0015688 | iron chelate transport(GO:0015688) siderophore transport(GO:0015891) |
| 0.6 | 3.9 | GO:0010025 | wax biosynthetic process(GO:0010025) wax metabolic process(GO:0010166) |
| 0.5 | 1.5 | GO:0090271 | positive regulation of fibroblast growth factor production(GO:0090271) |
| 0.4 | 2.3 | GO:0033031 | positive regulation of neutrophil apoptotic process(GO:0033031) |
| 0.3 | 2.4 | GO:0009449 | gamma-aminobutyric acid biosynthetic process(GO:0009449) |
| 0.3 | 1.2 | GO:0046110 | xanthine metabolic process(GO:0046110) |
| 0.3 | 1.2 | GO:0035425 | autocrine signaling(GO:0035425) |
| 0.3 | 0.9 | GO:0042270 | protection from natural killer cell mediated cytotoxicity(GO:0042270) |
| 0.3 | 1.1 | GO:0050712 | negative regulation of interleukin-1 alpha production(GO:0032690) negative regulation of interleukin-1 alpha secretion(GO:0050712) |
| 0.3 | 1.1 | GO:0050717 | regulation of interleukin-1 alpha secretion(GO:0050705) positive regulation of interleukin-1 alpha secretion(GO:0050717) |
| 0.2 | 1.0 | GO:0055099 | detection of endogenous stimulus(GO:0009726) response to high density lipoprotein particle(GO:0055099) |
| 0.2 | 0.7 | GO:0060722 | spongiotrophoblast cell proliferation(GO:0060720) regulation of spongiotrophoblast cell proliferation(GO:0060721) cell proliferation involved in embryonic placenta development(GO:0060722) regulation of cell proliferation involved in embryonic placenta development(GO:0060723) |
| 0.2 | 1.8 | GO:0061588 | calcium activated phospholipid scrambling(GO:0061588) calcium activated phosphatidylserine scrambling(GO:0061589) calcium activated phosphatidylcholine scrambling(GO:0061590) calcium activated galactosylceramide scrambling(GO:0061591) |
| 0.2 | 1.1 | GO:0033078 | extrathymic T cell differentiation(GO:0033078) |
| 0.2 | 0.6 | GO:0097069 | cellular response to thyroxine stimulus(GO:0097069) cellular response to L-phenylalanine derivative(GO:1904387) |
| 0.2 | 0.6 | GO:0002589 | regulation of antigen processing and presentation of peptide antigen via MHC class I(GO:0002589) negative regulation of antigen processing and presentation of peptide antigen via MHC class I(GO:0002590) regulation of T cell antigen processing and presentation(GO:0002625) positive regulation of iron ion transport(GO:0034758) positive regulation of iron ion transmembrane transport(GO:0034761) regulation of iron ion import(GO:1900390) regulation of ferrous iron import into cell(GO:1903989) positive regulation of ferrous iron import into cell(GO:1903991) regulation of ferrous iron binding(GO:1904432) positive regulation of ferrous iron binding(GO:1904434) regulation of transferrin receptor binding(GO:1904435) positive regulation of transferrin receptor binding(GO:1904437) regulation of ferrous iron import across plasma membrane(GO:1904438) positive regulation of ferrous iron import across plasma membrane(GO:1904440) response to iron ion starvation(GO:1990641) |
| 0.2 | 0.7 | GO:0072344 | rescue of stalled ribosome(GO:0072344) |
| 0.2 | 0.5 | GO:0030264 | nuclear fragmentation involved in apoptotic nuclear change(GO:0030264) |
| 0.2 | 0.7 | GO:0046271 | phenylpropanoid catabolic process(GO:0046271) |
| 0.2 | 5.8 | GO:0050716 | positive regulation of interleukin-1 secretion(GO:0050716) |
| 0.2 | 0.5 | GO:0005989 | lactose metabolic process(GO:0005988) lactose biosynthetic process(GO:0005989) |
| 0.1 | 0.4 | GO:0051714 | positive regulation of cytolysis in other organism(GO:0051714) |
| 0.1 | 2.2 | GO:0006670 | sphingosine metabolic process(GO:0006670) |
| 0.1 | 1.2 | GO:0061302 | smooth muscle cell-matrix adhesion(GO:0061302) |
| 0.1 | 5.1 | GO:0032461 | positive regulation of protein oligomerization(GO:0032461) |
| 0.1 | 0.4 | GO:0070631 | spindle pole body duplication(GO:0030474) spindle pole body organization(GO:0051300) spindle pole body localization(GO:0070631) establishment of spindle pole body localization(GO:0070632) spindle pole body localization to nuclear envelope(GO:0071789) establishment of spindle pole body localization to nuclear envelope(GO:0071790) |
| 0.1 | 2.1 | GO:0046415 | urate metabolic process(GO:0046415) |
| 0.1 | 0.3 | GO:0010430 | fatty acid omega-oxidation(GO:0010430) |
| 0.1 | 1.0 | GO:0060414 | aorta smooth muscle tissue morphogenesis(GO:0060414) |
| 0.1 | 5.3 | GO:0019731 | antibacterial humoral response(GO:0019731) |
| 0.1 | 0.6 | GO:0000821 | regulation of arginine metabolic process(GO:0000821) basic amino acid transmembrane transport(GO:1990822) |
| 0.1 | 0.5 | GO:0032227 | negative regulation of synaptic transmission, dopaminergic(GO:0032227) negative regulation of dopamine uptake involved in synaptic transmission(GO:0051585) norepinephrine uptake(GO:0051620) regulation of norepinephrine uptake(GO:0051621) negative regulation of norepinephrine uptake(GO:0051622) negative regulation of catecholamine uptake involved in synaptic transmission(GO:0051945) regulation of glutathione peroxidase activity(GO:1903282) positive regulation of glutathione peroxidase activity(GO:1903284) positive regulation of hydrogen peroxide catabolic process(GO:1903285) positive regulation of peroxidase activity(GO:2000470) |
| 0.1 | 0.5 | GO:2000638 | regulation of SREBP signaling pathway(GO:2000638) negative regulation of SREBP signaling pathway(GO:2000639) |
| 0.1 | 0.3 | GO:0006428 | isoleucyl-tRNA aminoacylation(GO:0006428) |
| 0.1 | 0.4 | GO:0072658 | maintenance of protein location in membrane(GO:0072658) maintenance of protein location in plasma membrane(GO:0072660) positive regulation of membrane depolarization during cardiac muscle cell action potential(GO:1900827) |
| 0.1 | 0.9 | GO:0014807 | regulation of somitogenesis(GO:0014807) |
| 0.1 | 0.4 | GO:0002399 | MHC class II protein complex assembly(GO:0002399) |
| 0.1 | 0.2 | GO:0070105 | positive regulation of interleukin-6-mediated signaling pathway(GO:0070105) |
| 0.1 | 0.3 | GO:0060133 | somatotropin secreting cell development(GO:0060133) |
| 0.1 | 2.5 | GO:0042730 | fibrinolysis(GO:0042730) |
| 0.1 | 0.4 | GO:0071460 | cellular response to cell-matrix adhesion(GO:0071460) |
| 0.1 | 0.5 | GO:0021797 | forebrain anterior/posterior pattern specification(GO:0021797) |
| 0.1 | 0.2 | GO:0044210 | 'de novo' CTP biosynthetic process(GO:0044210) |
| 0.1 | 0.2 | GO:0044205 | 'de novo' UMP biosynthetic process(GO:0044205) |
| 0.1 | 0.2 | GO:0038043 | interleukin-5-mediated signaling pathway(GO:0038043) |
| 0.1 | 3.4 | GO:1902475 | L-alpha-amino acid transmembrane transport(GO:1902475) |
| 0.1 | 0.3 | GO:0046952 | ketone body catabolic process(GO:0046952) |
| 0.1 | 0.4 | GO:0009753 | response to jasmonic acid(GO:0009753) cellular response to jasmonic acid stimulus(GO:0071395) |
| 0.1 | 0.2 | GO:0034140 | negative regulation of toll-like receptor 3 signaling pathway(GO:0034140) |
| 0.1 | 2.7 | GO:0043252 | sodium-independent organic anion transport(GO:0043252) |
| 0.1 | 0.4 | GO:0071321 | cellular response to cGMP(GO:0071321) |
| 0.1 | 0.2 | GO:0003172 | primary heart field specification(GO:0003138) sinoatrial valve development(GO:0003172) sinoatrial valve morphogenesis(GO:0003185) |
| 0.1 | 0.2 | GO:1903279 | regulation of calcium:sodium antiporter activity(GO:1903279) positive regulation of calcium:sodium antiporter activity(GO:1903281) |
| 0.1 | 0.1 | GO:0015827 | tryptophan transport(GO:0015827) |
| 0.1 | 2.3 | GO:0051281 | positive regulation of release of sequestered calcium ion into cytosol(GO:0051281) |
| 0.1 | 0.2 | GO:0035281 | pre-miRNA export from nucleus(GO:0035281) |
| 0.1 | 0.8 | GO:0015812 | gamma-aminobutyric acid transport(GO:0015812) |
| 0.1 | 0.4 | GO:0060125 | negative regulation of growth hormone secretion(GO:0060125) |
| 0.1 | 0.2 | GO:0015910 | peroxisomal long-chain fatty acid import(GO:0015910) |
| 0.1 | 0.7 | GO:0006032 | chitin metabolic process(GO:0006030) chitin catabolic process(GO:0006032) |
| 0.1 | 0.2 | GO:1902723 | negative regulation of skeletal muscle cell proliferation(GO:0014859) negative regulation of skeletal muscle satellite cell proliferation(GO:1902723) |
| 0.1 | 0.2 | GO:1902037 | negative regulation of hematopoietic stem cell differentiation(GO:1902037) |
| 0.1 | 0.3 | GO:0006065 | UDP-glucuronate biosynthetic process(GO:0006065) |
| 0.0 | 1.0 | GO:0002523 | leukocyte migration involved in inflammatory response(GO:0002523) |
| 0.0 | 0.4 | GO:0070973 | protein localization to endoplasmic reticulum exit site(GO:0070973) |
| 0.0 | 0.1 | GO:0060370 | susceptibility to T cell mediated cytotoxicity(GO:0060370) |
| 0.0 | 0.2 | GO:0010615 | positive regulation of cardiac muscle adaptation(GO:0010615) positive regulation of cardiac muscle hypertrophy in response to stress(GO:1903244) |
| 0.0 | 0.4 | GO:0007258 | JUN phosphorylation(GO:0007258) |
| 0.0 | 0.3 | GO:0060330 | regulation of response to interferon-gamma(GO:0060330) regulation of interferon-gamma-mediated signaling pathway(GO:0060334) |
| 0.0 | 0.7 | GO:1903071 | positive regulation of ER-associated ubiquitin-dependent protein catabolic process(GO:1903071) |
| 0.0 | 0.8 | GO:0006703 | estrogen biosynthetic process(GO:0006703) |
| 0.0 | 0.3 | GO:0036343 | psychomotor behavior(GO:0036343) |
| 0.0 | 0.2 | GO:1900920 | regulation of amino acid uptake involved in synaptic transmission(GO:0051941) regulation of glutamate uptake involved in transmission of nerve impulse(GO:0051946) regulation of L-glutamate import(GO:1900920) |
| 0.0 | 0.6 | GO:0003376 | sphingosine-1-phosphate signaling pathway(GO:0003376) sphingolipid mediated signaling pathway(GO:0090520) |
| 0.0 | 0.5 | GO:0090050 | positive regulation of cell migration involved in sprouting angiogenesis(GO:0090050) |
| 0.0 | 5.7 | GO:0070268 | cornification(GO:0070268) |
| 0.0 | 0.2 | GO:0010387 | COP9 signalosome assembly(GO:0010387) |
| 0.0 | 0.2 | GO:0006238 | CMP salvage(GO:0006238) CMP biosynthetic process(GO:0009224) CMP metabolic process(GO:0046035) |
| 0.0 | 0.3 | GO:0090206 | negative regulation of cholesterol biosynthetic process(GO:0045541) negative regulation of cholesterol metabolic process(GO:0090206) |
| 0.0 | 0.1 | GO:2001160 | regulation of histone H3-K79 methylation(GO:2001160) positive regulation of histone H3-K79 methylation(GO:2001162) |
| 0.0 | 0.4 | GO:0010606 | positive regulation of cytoplasmic mRNA processing body assembly(GO:0010606) |
| 0.0 | 0.2 | GO:0071034 | CUT catabolic process(GO:0071034) CUT metabolic process(GO:0071043) polyadenylation-dependent snoRNA 3'-end processing(GO:0071051) |
| 0.0 | 0.5 | GO:0043249 | erythrocyte maturation(GO:0043249) |
| 0.0 | 0.3 | GO:0072592 | oxygen metabolic process(GO:0072592) |
| 0.0 | 0.3 | GO:0008217 | regulation of blood pressure(GO:0008217) |
| 0.0 | 2.2 | GO:0051602 | response to electrical stimulus(GO:0051602) |
| 0.0 | 0.3 | GO:0051552 | flavone metabolic process(GO:0051552) |
| 0.0 | 0.3 | GO:0061042 | vascular wound healing(GO:0061042) |
| 0.0 | 0.3 | GO:0002329 | pre-B cell differentiation(GO:0002329) |
| 0.0 | 0.1 | GO:0003218 | cardiac left ventricle formation(GO:0003218) |
| 0.0 | 0.3 | GO:0055091 | phospholipid homeostasis(GO:0055091) |
| 0.0 | 0.1 | GO:1901877 | regulation of calcium ion binding(GO:1901876) negative regulation of calcium ion binding(GO:1901877) |
| 0.0 | 0.2 | GO:0043353 | enucleate erythrocyte differentiation(GO:0043353) |
| 0.0 | 2.7 | GO:0050918 | positive chemotaxis(GO:0050918) |
| 0.0 | 0.7 | GO:0007250 | activation of NF-kappaB-inducing kinase activity(GO:0007250) |
| 0.0 | 0.4 | GO:0016998 | cell wall macromolecule catabolic process(GO:0016998) |
| 0.0 | 0.1 | GO:1901165 | positive regulation of trophoblast cell migration(GO:1901165) |
| 0.0 | 0.2 | GO:0006686 | sphingomyelin biosynthetic process(GO:0006686) |
| 0.0 | 0.4 | GO:0050861 | positive regulation of B cell receptor signaling pathway(GO:0050861) |
| 0.0 | 0.4 | GO:1990118 | sodium ion import across plasma membrane(GO:0098719) sodium ion import into cell(GO:1990118) |
| 0.0 | 0.3 | GO:0018095 | protein polyglutamylation(GO:0018095) |
| 0.0 | 0.4 | GO:0006828 | manganese ion transport(GO:0006828) |
| 0.0 | 0.3 | GO:0016584 | nucleosome positioning(GO:0016584) |
| 0.0 | 0.1 | GO:0022614 | membrane to membrane docking(GO:0022614) |
| 0.0 | 0.2 | GO:0061299 | retina vasculature morphogenesis in camera-type eye(GO:0061299) |
| 0.0 | 0.5 | GO:0030150 | protein import into mitochondrial matrix(GO:0030150) |
| 0.0 | 0.3 | GO:0032790 | ribosome disassembly(GO:0032790) |
| 0.0 | 0.1 | GO:0050713 | negative regulation of interleukin-1 beta secretion(GO:0050713) |
| 0.0 | 0.1 | GO:1902715 | positive regulation of interferon-gamma secretion(GO:1902715) |
| 0.0 | 0.8 | GO:0042744 | hydrogen peroxide catabolic process(GO:0042744) |
| 0.0 | 0.6 | GO:1902236 | negative regulation of endoplasmic reticulum stress-induced intrinsic apoptotic signaling pathway(GO:1902236) |
| 0.0 | 0.1 | GO:0002933 | lipid hydroxylation(GO:0002933) |
| 0.0 | 0.3 | GO:0042904 | 9-cis-retinoic acid biosynthetic process(GO:0042904) 9-cis-retinoic acid metabolic process(GO:0042905) |
| 0.0 | 0.2 | GO:0002291 | T cell activation via T cell receptor contact with antigen bound to MHC molecule on antigen presenting cell(GO:0002291) |
| 0.0 | 0.1 | GO:1904640 | response to methionine(GO:1904640) |
| 0.0 | 0.1 | GO:1904381 | Golgi apparatus mannose trimming(GO:1904381) |
| 0.0 | 0.3 | GO:0043320 | natural killer cell degranulation(GO:0043320) |
| 0.0 | 0.1 | GO:1902161 | positive regulation of cyclic nucleotide-gated ion channel activity(GO:1902161) |
| 0.0 | 0.2 | GO:0002480 | antigen processing and presentation of exogenous peptide antigen via MHC class I, TAP-independent(GO:0002480) |
| 0.0 | 0.3 | GO:0042448 | progesterone metabolic process(GO:0042448) |
| 0.0 | 0.4 | GO:0002323 | natural killer cell activation involved in immune response(GO:0002323) |
| 0.0 | 0.1 | GO:0050955 | thermoception(GO:0050955) |
| 0.0 | 0.1 | GO:0002309 | T cell proliferation involved in immune response(GO:0002309) |
| 0.0 | 0.1 | GO:0050966 | detection of mechanical stimulus involved in sensory perception of pain(GO:0050966) |
| 0.0 | 0.1 | GO:0015742 | alpha-ketoglutarate transport(GO:0015742) |
| 0.0 | 0.4 | GO:0034656 | nucleobase-containing small molecule catabolic process(GO:0034656) |
| 0.0 | 0.3 | GO:0071420 | cellular response to histamine(GO:0071420) |
| 0.0 | 0.1 | GO:0080009 | mRNA methylation(GO:0080009) |
| 0.0 | 0.1 | GO:2000525 | defense response to nematode(GO:0002215) regulation of T cell costimulation(GO:2000523) positive regulation of T cell costimulation(GO:2000525) |
| 0.0 | 0.1 | GO:2000767 | positive regulation of cytoplasmic translation(GO:2000767) |
| 0.0 | 0.2 | GO:0046085 | adenosine metabolic process(GO:0046085) |
| 0.0 | 0.1 | GO:2001214 | positive regulation of vasculogenesis(GO:2001214) |
| 0.0 | 0.1 | GO:0035897 | proteolysis in other organism(GO:0035897) |
| 0.0 | 0.1 | GO:0090579 | transcriptional activation by promoter-enhancer looping(GO:0071733) gene looping(GO:0090202) dsDNA loop formation(GO:0090579) |
| 0.0 | 0.2 | GO:0035372 | protein localization to microtubule(GO:0035372) |
| 0.0 | 0.1 | GO:0010265 | SCF complex assembly(GO:0010265) |
| 0.0 | 0.2 | GO:0015693 | magnesium ion transport(GO:0015693) |
| 0.0 | 0.1 | GO:0045329 | carnitine biosynthetic process(GO:0045329) |
| 0.0 | 0.1 | GO:0097201 | negative regulation of transcription from RNA polymerase II promoter in response to stress(GO:0097201) |
| 0.0 | 0.1 | GO:0071763 | nuclear membrane organization(GO:0071763) |
| 0.0 | 1.0 | GO:0046847 | filopodium assembly(GO:0046847) |
| 0.0 | 0.2 | GO:0006122 | mitochondrial electron transport, ubiquinol to cytochrome c(GO:0006122) |
| 0.0 | 1.3 | GO:0030032 | lamellipodium assembly(GO:0030032) |
| 0.0 | 0.6 | GO:0048488 | synaptic vesicle endocytosis(GO:0048488) |
| 0.0 | 0.2 | GO:0002087 | regulation of respiratory gaseous exchange by neurological system process(GO:0002087) |
| 0.0 | 0.2 | GO:0042501 | serine phosphorylation of STAT protein(GO:0042501) |
| 0.0 | 0.4 | GO:0048268 | clathrin coat assembly(GO:0048268) |
| 0.0 | 0.1 | GO:0006228 | UTP biosynthetic process(GO:0006228) |
| 0.0 | 0.1 | GO:0048007 | antigen processing and presentation of lipid antigen via MHC class Ib(GO:0048003) antigen processing and presentation, exogenous lipid antigen via MHC class Ib(GO:0048007) |
| 0.0 | 0.1 | GO:0046668 | regulation of retinal cell programmed cell death(GO:0046668) |
| 0.0 | 0.8 | GO:0035690 | cellular response to drug(GO:0035690) |
| 0.0 | 0.8 | GO:0006195 | purine nucleotide catabolic process(GO:0006195) |
Gene overrepresentation in cellular_component category:
| Log-likelihood per target | Total log-likelihood | Term | Description |
|---|---|---|---|
| 0.2 | 1.2 | GO:0097179 | protease inhibitor complex(GO:0097179) |
| 0.2 | 5.8 | GO:0071682 | endocytic vesicle lumen(GO:0071682) |
| 0.2 | 0.6 | GO:0017109 | glutamate-cysteine ligase complex(GO:0017109) |
| 0.1 | 1.0 | GO:0034688 | integrin alphaM-beta2 complex(GO:0034688) |
| 0.1 | 4.8 | GO:0030057 | desmosome(GO:0030057) |
| 0.1 | 0.8 | GO:1990037 | Lewy body core(GO:1990037) |
| 0.1 | 0.4 | GO:0070762 | nuclear pore transmembrane ring(GO:0070762) |
| 0.1 | 3.9 | GO:0031231 | integral component of peroxisomal membrane(GO:0005779) intrinsic component of peroxisomal membrane(GO:0031231) |
| 0.1 | 0.6 | GO:1990357 | terminal web(GO:1990357) |
| 0.1 | 2.2 | GO:0005922 | connexon complex(GO:0005922) |
| 0.1 | 3.1 | GO:0001533 | cornified envelope(GO:0001533) |
| 0.1 | 0.3 | GO:0031213 | RSF complex(GO:0031213) |
| 0.1 | 0.5 | GO:1990452 | Parkin-FBXW7-Cul1 ubiquitin ligase complex(GO:1990452) |
| 0.1 | 1.0 | GO:0012510 | trans-Golgi network transport vesicle membrane(GO:0012510) |
| 0.1 | 0.2 | GO:0031251 | PAN complex(GO:0031251) |
| 0.1 | 0.2 | GO:0042565 | RNA nuclear export complex(GO:0042565) |
| 0.1 | 2.2 | GO:0034364 | high-density lipoprotein particle(GO:0034364) |
| 0.0 | 0.5 | GO:0044327 | dendritic spine head(GO:0044327) |
| 0.0 | 0.4 | GO:0036056 | filtration diaphragm(GO:0036056) slit diaphragm(GO:0036057) |
| 0.0 | 0.2 | GO:0001405 | presequence translocase-associated import motor(GO:0001405) |
| 0.0 | 0.4 | GO:0042612 | MHC class I protein complex(GO:0042612) |
| 0.0 | 2.9 | GO:0035580 | specific granule lumen(GO:0035580) |
| 0.0 | 0.3 | GO:0005742 | mitochondrial outer membrane translocase complex(GO:0005742) |
| 0.0 | 0.1 | GO:0071065 | alpha9-beta1 integrin-vascular cell adhesion molecule-1 complex(GO:0071065) |
| 0.0 | 0.7 | GO:0042611 | MHC protein complex(GO:0042611) |
| 0.0 | 3.8 | GO:0035578 | azurophil granule lumen(GO:0035578) |
| 0.0 | 0.4 | GO:0097524 | sperm plasma membrane(GO:0097524) |
| 0.0 | 3.2 | GO:0070821 | tertiary granule membrane(GO:0070821) |
| 0.0 | 0.3 | GO:0014701 | junctional sarcoplasmic reticulum membrane(GO:0014701) |
| 0.0 | 0.1 | GO:0042272 | nuclear RNA export factor complex(GO:0042272) |
| 0.0 | 2.8 | GO:0097517 | stress fiber(GO:0001725) contractile actin filament bundle(GO:0097517) |
| 0.0 | 1.0 | GO:0016592 | mediator complex(GO:0016592) |
| 0.0 | 0.1 | GO:0032585 | multivesicular body membrane(GO:0032585) |
| 0.0 | 0.1 | GO:0071006 | U2-type catalytic step 1 spliceosome(GO:0071006) |
| 0.0 | 0.1 | GO:0097058 | CRLF-CLCF1 complex(GO:0097058) |
| 0.0 | 0.4 | GO:0014731 | spectrin-associated cytoskeleton(GO:0014731) |
| 0.0 | 0.1 | GO:0031466 | Cul5-RING ubiquitin ligase complex(GO:0031466) |
| 0.0 | 0.1 | GO:0098592 | cytoplasmic side of apical plasma membrane(GO:0098592) |
| 0.0 | 0.2 | GO:0042101 | T cell receptor complex(GO:0042101) |
| 0.0 | 0.7 | GO:0046658 | anchored component of plasma membrane(GO:0046658) |
| 0.0 | 0.1 | GO:0031205 | endoplasmic reticulum Sec complex(GO:0031205) |
| 0.0 | 0.4 | GO:0033178 | proton-transporting two-sector ATPase complex, catalytic domain(GO:0033178) |
| 0.0 | 0.3 | GO:0098576 | lumenal side of membrane(GO:0098576) |
| 0.0 | 0.1 | GO:0030015 | CCR4-NOT core complex(GO:0030015) |
| 0.0 | 0.5 | GO:0005640 | nuclear outer membrane(GO:0005640) |
| 0.0 | 1.0 | GO:0016529 | sarcoplasmic reticulum(GO:0016529) |
| 0.0 | 0.2 | GO:0005750 | mitochondrial respiratory chain complex III(GO:0005750) respiratory chain complex III(GO:0045275) |
| 0.0 | 0.1 | GO:0005863 | striated muscle myosin thick filament(GO:0005863) |
| 0.0 | 0.2 | GO:0000176 | nuclear exosome (RNase complex)(GO:0000176) |
| 0.0 | 0.1 | GO:0005579 | membrane attack complex(GO:0005579) |
| 0.0 | 0.1 | GO:0016593 | Cdc73/Paf1 complex(GO:0016593) |
| 0.0 | 0.2 | GO:0036020 | endolysosome membrane(GO:0036020) |
| 0.0 | 0.5 | GO:0042571 | immunoglobulin complex, circulating(GO:0042571) |
| 0.0 | 0.1 | GO:0001674 | female germ cell nucleus(GO:0001674) |
Gene overrepresentation in molecular_function category:
| Log-likelihood per target | Total log-likelihood | Term | Description |
|---|---|---|---|
| 0.8 | 3.9 | GO:0080019 | fatty-acyl-CoA reductase (alcohol-forming) activity(GO:0080019) |
| 0.8 | 2.3 | GO:0004947 | bradykinin receptor activity(GO:0004947) |
| 0.5 | 2.1 | GO:0004060 | arylamine N-acetyltransferase activity(GO:0004060) |
| 0.5 | 3.4 | GO:0070891 | lipoteichoic acid binding(GO:0070891) |
| 0.4 | 2.5 | GO:0015501 | glutamate:sodium symporter activity(GO:0015501) |
| 0.3 | 1.4 | GO:0004666 | prostaglandin-endoperoxide synthase activity(GO:0004666) |
| 0.3 | 1.0 | GO:0034041 | sterol-transporting ATPase activity(GO:0034041) |
| 0.3 | 1.2 | GO:0047006 | 17-alpha,20-alpha-dihydroxypregn-4-en-3-one dehydrogenase activity(GO:0047006) |
| 0.2 | 1.2 | GO:0038062 | protein tyrosine kinase collagen receptor activity(GO:0038062) |
| 0.2 | 1.1 | GO:0004910 | interleukin-1, Type II, blocking receptor activity(GO:0004910) |
| 0.2 | 0.6 | GO:0004357 | glutamate-cysteine ligase activity(GO:0004357) |
| 0.2 | 2.5 | GO:0015143 | urate transmembrane transporter activity(GO:0015143) salt transmembrane transporter activity(GO:1901702) |
| 0.2 | 0.5 | GO:0017082 | mineralocorticoid receptor activity(GO:0017082) |
| 0.2 | 8.3 | GO:0042056 | chemoattractant activity(GO:0042056) |
| 0.2 | 0.9 | GO:0005294 | neutral L-amino acid secondary active transmembrane transporter activity(GO:0005294) |
| 0.1 | 1.2 | GO:0043546 | molybdopterin cofactor binding(GO:0043546) |
| 0.1 | 0.8 | GO:0005332 | gamma-aminobutyric acid:sodium symporter activity(GO:0005332) |
| 0.1 | 0.4 | GO:0004119 | cGMP-inhibited cyclic-nucleotide phosphodiesterase activity(GO:0004119) |
| 0.1 | 2.7 | GO:0005149 | interleukin-1 receptor binding(GO:0005149) |
| 0.1 | 0.7 | GO:0042577 | lipid phosphatase activity(GO:0042577) |
| 0.1 | 0.6 | GO:0046624 | sphingolipid transporter activity(GO:0046624) |
| 0.1 | 0.1 | GO:0004322 | ferroxidase activity(GO:0004322) oxidoreductase activity, oxidizing metal ions, oxygen as acceptor(GO:0016724) |
| 0.1 | 0.3 | GO:0004031 | aldehyde oxidase activity(GO:0004031) |
| 0.1 | 0.5 | GO:0004461 | lactose synthase activity(GO:0004461) |
| 0.1 | 2.5 | GO:0015125 | bile acid transmembrane transporter activity(GO:0015125) |
| 0.1 | 1.0 | GO:0030369 | ICAM-3 receptor activity(GO:0030369) |
| 0.1 | 0.4 | GO:0005283 | sodium:amino acid symporter activity(GO:0005283) |
| 0.1 | 0.3 | GO:0003858 | 3-hydroxybutyrate dehydrogenase activity(GO:0003858) |
| 0.1 | 0.4 | GO:0008745 | N-acetylmuramoyl-L-alanine amidase activity(GO:0008745) peptidoglycan receptor activity(GO:0016019) |
| 0.1 | 0.5 | GO:0060961 | phospholipase D inhibitor activity(GO:0060961) |
| 0.1 | 0.2 | GO:0019862 | IgA binding(GO:0019862) |
| 0.1 | 0.3 | GO:0004822 | isoleucine-tRNA ligase activity(GO:0004822) |
| 0.1 | 1.8 | GO:0017128 | phospholipid scramblase activity(GO:0017128) |
| 0.1 | 1.0 | GO:0004687 | myosin light chain kinase activity(GO:0004687) |
| 0.1 | 2.7 | GO:0004806 | triglyceride lipase activity(GO:0004806) |
| 0.1 | 0.3 | GO:0004366 | glycerol-3-phosphate O-acyltransferase activity(GO:0004366) |
| 0.1 | 0.6 | GO:0015272 | ATP-activated inward rectifier potassium channel activity(GO:0015272) |
| 0.1 | 1.1 | GO:0001011 | transcription factor activity, sequence-specific DNA binding, RNA polymerase recruiting(GO:0001011) transcription factor activity, TFIIB-class binding(GO:0001087) |
| 0.1 | 0.8 | GO:0004117 | calmodulin-dependent cyclic-nucleotide phosphodiesterase activity(GO:0004117) |
| 0.1 | 0.2 | GO:0003883 | CTP synthase activity(GO:0003883) |
| 0.1 | 0.2 | GO:0004088 | carbamoyl-phosphate synthase (ammonia) activity(GO:0004087) carbamoyl-phosphate synthase (glutamine-hydrolyzing) activity(GO:0004088) |
| 0.1 | 0.2 | GO:0004914 | interleukin-5 receptor activity(GO:0004914) |
| 0.1 | 0.3 | GO:0004966 | galanin receptor activity(GO:0004966) |
| 0.1 | 0.4 | GO:0016909 | JUN kinase activity(GO:0004705) SAP kinase activity(GO:0016909) |
| 0.1 | 0.5 | GO:0050816 | phosphothreonine binding(GO:0050816) |
| 0.1 | 1.1 | GO:0030881 | beta-2-microglobulin binding(GO:0030881) |
| 0.1 | 0.3 | GO:0052740 | 1-acyl-2-lysophosphatidylserine acylhydrolase activity(GO:0052740) |
| 0.1 | 1.2 | GO:0050700 | CARD domain binding(GO:0050700) |
| 0.1 | 7.9 | GO:0004867 | serine-type endopeptidase inhibitor activity(GO:0004867) |
| 0.1 | 0.3 | GO:0004906 | interferon-gamma receptor activity(GO:0004906) |
| 0.1 | 0.2 | GO:0090631 | pre-miRNA transporter activity(GO:0090631) |
| 0.1 | 1.0 | GO:0042809 | vitamin D receptor binding(GO:0042809) |
| 0.1 | 0.7 | GO:0004568 | chitinase activity(GO:0004568) |
| 0.0 | 0.8 | GO:0010314 | phosphatidylinositol-5-phosphate binding(GO:0010314) |
| 0.0 | 0.7 | GO:0070679 | inositol 1,4,5 trisphosphate binding(GO:0070679) |
| 0.0 | 0.2 | GO:0033188 | sphingomyelin synthase activity(GO:0033188) ceramide cholinephosphotransferase activity(GO:0047493) |
| 0.0 | 0.1 | GO:0002134 | pyrimidine nucleoside binding(GO:0001884) UTP binding(GO:0002134) pyrimidine ribonucleoside binding(GO:0032551) |
| 0.0 | 0.9 | GO:0008253 | 5'-nucleotidase activity(GO:0008253) |
| 0.0 | 0.6 | GO:0015174 | basic amino acid transmembrane transporter activity(GO:0015174) |
| 0.0 | 0.1 | GO:0016422 | mRNA (2'-O-methyladenosine-N6-)-methyltransferase activity(GO:0016422) |
| 0.0 | 0.4 | GO:0008553 | hydrogen-exporting ATPase activity, phosphorylative mechanism(GO:0008553) |
| 0.0 | 0.4 | GO:0015288 | porin activity(GO:0015288) |
| 0.0 | 0.7 | GO:0008349 | MAP kinase kinase kinase kinase activity(GO:0008349) |
| 0.0 | 0.1 | GO:0004618 | phosphoglycerate kinase activity(GO:0004618) |
| 0.0 | 4.9 | GO:0004222 | metalloendopeptidase activity(GO:0004222) |
| 0.0 | 0.4 | GO:0015386 | potassium:proton antiporter activity(GO:0015386) |
| 0.0 | 0.2 | GO:0004499 | N,N-dimethylaniline monooxygenase activity(GO:0004499) |
| 0.0 | 0.4 | GO:0003796 | lysozyme activity(GO:0003796) |
| 0.0 | 0.2 | GO:0016812 | hydrolase activity, acting on carbon-nitrogen (but not peptide) bonds, in cyclic amides(GO:0016812) |
| 0.0 | 0.3 | GO:0015165 | pyrimidine nucleotide-sugar transmembrane transporter activity(GO:0015165) |
| 0.0 | 0.2 | GO:0005324 | long-chain fatty acid transporter activity(GO:0005324) |
| 0.0 | 0.3 | GO:0043023 | ribosomal large subunit binding(GO:0043023) |
| 0.0 | 0.1 | GO:0034875 | oxidoreductase activity, acting on CH or CH2 groups, quinone or similar compound as acceptor(GO:0033695) caffeine oxidase activity(GO:0034875) |
| 0.0 | 0.1 | GO:0017025 | TBP-class protein binding(GO:0017025) |
| 0.0 | 1.1 | GO:1990841 | promoter-specific chromatin binding(GO:1990841) |
| 0.0 | 0.1 | GO:0008336 | gamma-butyrobetaine dioxygenase activity(GO:0008336) |
| 0.0 | 0.3 | GO:0008503 | benzodiazepine receptor activity(GO:0008503) |
| 0.0 | 0.1 | GO:0004769 | steroid delta-isomerase activity(GO:0004769) |
| 0.0 | 0.5 | GO:0031078 | histone deacetylase activity (H3-K14 specific)(GO:0031078) NAD-dependent histone deacetylase activity (H3-K14 specific)(GO:0032041) |
| 0.0 | 0.1 | GO:0004445 | inositol-polyphosphate 5-phosphatase activity(GO:0004445) phosphatidylinositol-3,4,5-trisphosphate 5-phosphatase activity(GO:0034485) |
| 0.0 | 0.3 | GO:0015377 | cation:chloride symporter activity(GO:0015377) |
| 0.0 | 0.8 | GO:0042605 | peptide antigen binding(GO:0042605) |
| 0.0 | 0.3 | GO:0001758 | retinal dehydrogenase activity(GO:0001758) |
| 0.0 | 0.4 | GO:0005132 | type I interferon receptor binding(GO:0005132) |
| 0.0 | 0.2 | GO:0070053 | thrombospondin receptor activity(GO:0070053) |
| 0.0 | 0.3 | GO:0005549 | odorant binding(GO:0005549) |
| 0.0 | 3.1 | GO:0005089 | Rho guanyl-nucleotide exchange factor activity(GO:0005089) |
| 0.0 | 0.1 | GO:0005260 | channel-conductance-controlling ATPase activity(GO:0005260) |
| 0.0 | 0.0 | GO:0017129 | triglyceride binding(GO:0017129) |
| 0.0 | 0.4 | GO:0017110 | nucleoside-diphosphatase activity(GO:0017110) |
| 0.0 | 0.2 | GO:0035251 | UDP-glucosyltransferase activity(GO:0035251) |
| 0.0 | 0.8 | GO:0004198 | calcium-dependent cysteine-type endopeptidase activity(GO:0004198) |
| 0.0 | 0.0 | GO:0004181 | metallocarboxypeptidase activity(GO:0004181) |
| 0.0 | 0.4 | GO:0016671 | oxidoreductase activity, acting on a sulfur group of donors, disulfide as acceptor(GO:0016671) |
| 0.0 | 0.1 | GO:0030171 | voltage-gated proton channel activity(GO:0030171) |
| 0.0 | 0.3 | GO:0035612 | AP-2 adaptor complex binding(GO:0035612) |
| 0.0 | 3.4 | GO:0005506 | iron ion binding(GO:0005506) |
| 0.0 | 0.1 | GO:0031783 | corticotropin hormone receptor binding(GO:0031780) type 5 melanocortin receptor binding(GO:0031783) |
| 0.0 | 0.4 | GO:0004535 | poly(A)-specific ribonuclease activity(GO:0004535) |
| 0.0 | 0.1 | GO:0008241 | peptidyl-dipeptidase activity(GO:0008241) |
| 0.0 | 0.2 | GO:0008312 | 7S RNA binding(GO:0008312) |
| 0.0 | 0.2 | GO:0004849 | uridine kinase activity(GO:0004849) |
| 0.0 | 0.3 | GO:0003680 | AT DNA binding(GO:0003680) |
| 0.0 | 1.6 | GO:0004866 | endopeptidase inhibitor activity(GO:0004866) |
| 0.0 | 0.4 | GO:0017056 | structural constituent of nuclear pore(GO:0017056) |
| 0.0 | 0.3 | GO:0043495 | protein anchor(GO:0043495) |
| 0.0 | 0.1 | GO:0032051 | clathrin light chain binding(GO:0032051) |
| 0.0 | 0.2 | GO:0016500 | protein-hormone receptor activity(GO:0016500) |
| 0.0 | 0.4 | GO:0045505 | dynein intermediate chain binding(GO:0045505) |
| 0.0 | 0.8 | GO:0004601 | peroxidase activity(GO:0004601) |
| 0.0 | 0.2 | GO:0008301 | DNA binding, bending(GO:0008301) |
| 0.0 | 0.1 | GO:0008131 | primary amine oxidase activity(GO:0008131) |
| 0.0 | 0.1 | GO:0004571 | mannosyl-oligosaccharide 1,2-alpha-mannosidase activity(GO:0004571) |
| 0.0 | 0.4 | GO:0005385 | zinc ion transmembrane transporter activity(GO:0005385) |
| 0.0 | 0.2 | GO:0017147 | Wnt-protein binding(GO:0017147) |
| 0.0 | 0.1 | GO:0003828 | alpha-N-acetylneuraminate alpha-2,8-sialyltransferase activity(GO:0003828) |
| 0.0 | 0.1 | GO:0050786 | RAGE receptor binding(GO:0050786) |
| 0.0 | 0.1 | GO:0015140 | malate transmembrane transporter activity(GO:0015140) |
| 0.0 | 0.8 | GO:0043022 | ribosome binding(GO:0043022) |
| 0.0 | 0.3 | GO:0001530 | lipopolysaccharide binding(GO:0001530) |
| 0.0 | 0.1 | GO:0043141 | ATP-dependent 5'-3' DNA helicase activity(GO:0043141) |
| 0.0 | 0.2 | GO:0015095 | magnesium ion transmembrane transporter activity(GO:0015095) |
Gene overrepresentation in C2:CP category:
| Log-likelihood per target | Total log-likelihood | Term | Description |
|---|---|---|---|
| 0.1 | 5.1 | PID TOLL ENDOGENOUS PATHWAY | Endogenous TLR signaling |
| 0.1 | 4.0 | PID ANTHRAX PATHWAY | Cellular roles of Anthrax toxin |
| 0.1 | 5.3 | PID SYNDECAN 1 PATHWAY | Syndecan-1-mediated signaling events |
| 0.1 | 1.5 | PID S1P S1P1 PATHWAY | S1P1 pathway |
| 0.0 | 2.6 | PID INTEGRIN2 PATHWAY | Beta2 integrin cell surface interactions |
| 0.0 | 0.4 | ST PAC1 RECEPTOR PATHWAY | PAC1 Receptor Pathway |
| 0.0 | 0.3 | PID S1P META PATHWAY | Sphingosine 1-phosphate (S1P) pathway |
| 0.0 | 1.0 | PID MYC PATHWAY | C-MYC pathway |
| 0.0 | 4.9 | NABA ECM REGULATORS | Genes encoding enzymes and their regulators involved in the remodeling of the extracellular matrix |
| 0.0 | 1.0 | SIG REGULATION OF THE ACTIN CYTOSKELETON BY RHO GTPASES | Genes related to regulation of the actin cytoskeleton |
| 0.0 | 0.2 | PID IL5 PATHWAY | IL5-mediated signaling events |
| 0.0 | 0.8 | PID NEPHRIN NEPH1 PATHWAY | Nephrin/Neph1 signaling in the kidney podocyte |
| 0.0 | 0.6 | PID IL12 STAT4 PATHWAY | IL12 signaling mediated by STAT4 |
| 0.0 | 0.6 | NABA BASEMENT MEMBRANES | Genes encoding structural components of basement membranes |
| 0.0 | 0.3 | PID IL23 PATHWAY | IL23-mediated signaling events |
| 0.0 | 0.3 | SA B CELL RECEPTOR COMPLEXES | Antigen binding to B cell receptors activates protein tyrosine kinases, such as the Src family, which ultimate activate MAP kinases. |
| 0.0 | 0.4 | PID INTEGRIN3 PATHWAY | Beta3 integrin cell surface interactions |
| 0.0 | 0.3 | ST INTERLEUKIN 4 PATHWAY | Interleukin 4 (IL-4) Pathway |
| 0.0 | 0.7 | PID HDAC CLASSII PATHWAY | Signaling events mediated by HDAC Class II |
| 0.0 | 0.5 | PID ALPHA SYNUCLEIN PATHWAY | Alpha-synuclein signaling |
Gene overrepresentation in C2:CP:REACTOME category:
| Log-likelihood per target | Total log-likelihood | Term | Description |
|---|---|---|---|
| 0.2 | 5.3 | REACTOME REGULATION OF INSULIN LIKE GROWTH FACTOR IGF ACTIVITY BY INSULIN LIKE GROWTH FACTOR BINDING PROTEINS IGFBPS | Genes involved in Regulation of Insulin-like Growth Factor (IGF) Activity by Insulin-like Growth Factor Binding Proteins (IGFBPs) |
| 0.2 | 5.6 | REACTOME ADVANCED GLYCOSYLATION ENDPRODUCT RECEPTOR SIGNALING | Genes involved in Advanced glycosylation endproduct receptor signaling |
| 0.1 | 3.4 | REACTOME OTHER SEMAPHORIN INTERACTIONS | Genes involved in Other semaphorin interactions |
| 0.1 | 2.0 | REACTOME PURINE CATABOLISM | Genes involved in Purine catabolism |
| 0.1 | 3.4 | REACTOME REGULATION OF COMPLEMENT CASCADE | Genes involved in Regulation of Complement cascade |
| 0.1 | 3.9 | REACTOME PEROXISOMAL LIPID METABOLISM | Genes involved in Peroxisomal lipid metabolism |
| 0.1 | 2.1 | REACTOME FACILITATIVE NA INDEPENDENT GLUCOSE TRANSPORTERS | Genes involved in Facilitative Na+-independent glucose transporters |
| 0.1 | 2.2 | REACTOME GAP JUNCTION ASSEMBLY | Genes involved in Gap junction assembly |
| 0.1 | 1.1 | REACTOME THE NLRP3 INFLAMMASOME | Genes involved in The NLRP3 inflammasome |
| 0.1 | 4.8 | REACTOME AMINO ACID AND OLIGOPEPTIDE SLC TRANSPORTERS | Genes involved in Amino acid and oligopeptide SLC transporters |
| 0.1 | 0.9 | REACTOME RECYCLING OF BILE ACIDS AND SALTS | Genes involved in Recycling of bile acids and salts |
| 0.1 | 2.5 | REACTOME SPHINGOLIPID DE NOVO BIOSYNTHESIS | Genes involved in Sphingolipid de novo biosynthesis |
| 0.1 | 1.3 | REACTOME ABCA TRANSPORTERS IN LIPID HOMEOSTASIS | Genes involved in ABCA transporters in lipid homeostasis |
| 0.1 | 0.7 | REACTOME ELEVATION OF CYTOSOLIC CA2 LEVELS | Genes involved in Elevation of cytosolic Ca2+ levels |
| 0.1 | 1.8 | REACTOME DCC MEDIATED ATTRACTIVE SIGNALING | Genes involved in DCC mediated attractive signaling |
| 0.1 | 0.4 | REACTOME JNK C JUN KINASES PHOSPHORYLATION AND ACTIVATION MEDIATED BY ACTIVATED HUMAN TAK1 | Genes involved in JNK (c-Jun kinases) phosphorylation and activation mediated by activated human TAK1 |
| 0.0 | 0.8 | REACTOME TRANSLOCATION OF ZAP 70 TO IMMUNOLOGICAL SYNAPSE | Genes involved in Translocation of ZAP-70 to Immunological synapse |
| 0.0 | 1.2 | REACTOME ACTIVATION OF GENES BY ATF4 | Genes involved in Activation of Genes by ATF4 |
| 0.0 | 0.2 | REACTOME TRAF6 MEDIATED IRF7 ACTIVATION IN TLR7 8 OR 9 SIGNALING | Genes involved in TRAF6 mediated IRF7 activation in TLR7/8 or 9 signaling |
| 0.0 | 1.8 | REACTOME IL1 SIGNALING | Genes involved in Interleukin-1 signaling |
| 0.0 | 1.2 | REACTOME TIGHT JUNCTION INTERACTIONS | Genes involved in Tight junction interactions |
| 0.0 | 0.4 | REACTOME NA CL DEPENDENT NEUROTRANSMITTER TRANSPORTERS | Genes involved in Na+/Cl- dependent neurotransmitter transporters |
| 0.0 | 0.4 | REACTOME CHEMOKINE RECEPTORS BIND CHEMOKINES | Genes involved in Chemokine receptors bind chemokines |
| 0.0 | 0.6 | REACTOME INWARDLY RECTIFYING K CHANNELS | Genes involved in Inwardly rectifying K+ channels |
| 0.0 | 5.5 | REACTOME G ALPHA I SIGNALLING EVENTS | Genes involved in G alpha (i) signalling events |
| 0.0 | 0.1 | REACTOME ACTIVATED TAK1 MEDIATES P38 MAPK ACTIVATION | Genes involved in activated TAK1 mediates p38 MAPK activation |
| 0.0 | 0.4 | REACTOME GLUCURONIDATION | Genes involved in Glucuronidation |
| 0.0 | 0.1 | REACTOME PEPTIDE CHAIN ELONGATION | Genes involved in Peptide chain elongation |
| 0.0 | 1.7 | REACTOME IMMUNOREGULATORY INTERACTIONS BETWEEN A LYMPHOID AND A NON LYMPHOID CELL | Genes involved in Immunoregulatory interactions between a Lymphoid and a non-Lymphoid cell |
| 0.0 | 0.4 | REACTOME ZINC TRANSPORTERS | Genes involved in Zinc transporters |
| 0.0 | 0.6 | REACTOME SULFUR AMINO ACID METABOLISM | Genes involved in Sulfur amino acid metabolism |
| 0.0 | 0.7 | REACTOME LATENT INFECTION OF HOMO SAPIENS WITH MYCOBACTERIUM TUBERCULOSIS | Genes involved in Latent infection of Homo sapiens with Mycobacterium tuberculosis |
| 0.0 | 1.0 | REACTOME SMOOTH MUSCLE CONTRACTION | Genes involved in Smooth Muscle Contraction |
| 0.0 | 0.1 | REACTOME METAL ION SLC TRANSPORTERS | Genes involved in Metal ion SLC transporters |
| 0.0 | 0.5 | REACTOME ASSOCIATION OF TRIC CCT WITH TARGET PROTEINS DURING BIOSYNTHESIS | Genes involved in Association of TriC/CCT with target proteins during biosynthesis |
| 0.0 | 1.2 | REACTOME PHASE1 FUNCTIONALIZATION OF COMPOUNDS | Genes involved in Phase 1 - Functionalization of compounds |
| 0.0 | 0.4 | REACTOME PYRIMIDINE METABOLISM | Genes involved in Pyrimidine metabolism |
| 0.0 | 0.4 | REACTOME INTERACTION BETWEEN L1 AND ANKYRINS | Genes involved in Interaction between L1 and Ankyrins |
| 0.0 | 0.3 | REACTOME DEPOSITION OF NEW CENPA CONTAINING NUCLEOSOMES AT THE CENTROMERE | Genes involved in Deposition of New CENPA-containing Nucleosomes at the Centromere |
| 0.0 | 0.8 | REACTOME AMYLOIDS | Genes involved in Amyloids |