Project
Epithelial-Mesenchymal Transition, human (Scheel, 2011)
Navigation
Downloads
Results for E2F2_E2F5
Z-value: 2.44
Motif logo
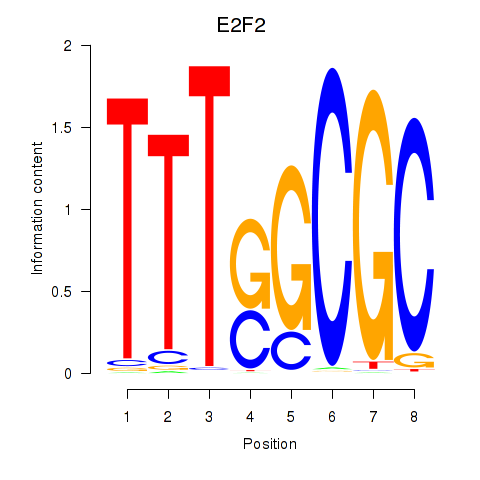
Transcription factors associated with E2F2_E2F5
| Gene Symbol | Gene ID | Gene Info |
|---|---|---|
|
E2F2
|
ENSG00000007968.6 | E2F2 |
|
E2F5
|
ENSG00000133740.6 | E2F5 |
Activity-expression correlation:
| Gene | Promoter | Pearson corr. coef. | P-value | Plot |
|---|---|---|---|---|
| E2F2 | hg19_v2_chr1_-_23857698_23857733 | 0.64 | 8.8e-02 | Click! |
| E2F5 | hg19_v2_chr8_+_86121448_86121494 | -0.50 | 2.1e-01 | Click! |
Activity profile of E2F2_E2F5 motif
Sorted Z-values of E2F2_E2F5 motif
Network of associatons between targets according to the STRING database.

First level regulatory network of E2F2_E2F5
| Promoter | Score | Transcript | Gene | Gene Info |
|---|---|---|---|---|
| chr1_-_36235529 | 2.27 |
ENST00000318121.3 ENST00000373220.3 ENST00000520551.1 |
CLSPN |
claspin |
| chr8_-_124408652 | 2.22 |
ENST00000287394.5 |
ATAD2 |
ATPase family, AAA domain containing 2 |
| chr11_-_19263145 | 1.63 |
ENST00000532666.1 ENST00000527884.1 |
E2F8 |
E2F transcription factor 8 |
| chr1_-_36235559 | 1.61 |
ENST00000251195.5 |
CLSPN |
claspin |
| chr16_-_3030283 | 1.50 |
ENST00000572619.1 ENST00000574415.1 ENST00000440027.2 ENST00000572059.1 |
PKMYT1 |
protein kinase, membrane associated tyrosine/threonine 1 |
| chr11_-_19262486 | 1.49 |
ENST00000250024.4 |
E2F8 |
E2F transcription factor 8 |
| chr2_+_27498289 | 1.45 |
ENST00000296097.3 ENST00000420191.1 |
DNAJC5G |
DnaJ (Hsp40) homolog, subfamily C, member 5 gamma |
| chr16_-_3030407 | 1.40 |
ENST00000431515.2 ENST00000574385.1 ENST00000576268.1 ENST00000574730.1 ENST00000575632.1 ENST00000573944.1 ENST00000262300.8 |
PKMYT1 |
protein kinase, membrane associated tyrosine/threonine 1 |
| chr2_+_27498331 | 1.30 |
ENST00000402462.1 ENST00000404433.1 ENST00000406962.1 |
DNAJC5G |
DnaJ (Hsp40) homolog, subfamily C, member 5 gamma |
| chr4_+_55524085 | 1.20 |
ENST00000412167.2 ENST00000288135.5 |
KIT |
v-kit Hardy-Zuckerman 4 feline sarcoma viral oncogene homolog |
| chr3_-_48229846 | 1.19 |
ENST00000302506.3 ENST00000351231.3 ENST00000437972.1 |
CDC25A |
cell division cycle 25A |
| chr13_+_32889605 | 1.16 |
ENST00000380152.3 ENST00000544455.1 ENST00000530893.2 |
BRCA2 |
breast cancer 2, early onset |
| chr20_-_32274179 | 1.05 |
ENST00000343380.5 |
E2F1 |
E2F transcription factor 1 |
| chr17_+_29158962 | 1.03 |
ENST00000321990.4 |
ATAD5 |
ATPase family, AAA domain containing 5 |
| chr10_+_13203543 | 1.03 |
ENST00000378714.3 ENST00000479669.1 ENST00000484800.2 |
MCM10 |
minichromosome maintenance complex component 10 |
| chr20_-_35724388 | 1.00 |
ENST00000344359.3 ENST00000373664.3 |
RBL1 |
retinoblastoma-like 1 (p107) |
| chr1_+_212208919 | 0.99 |
ENST00000366991.4 ENST00000542077.1 |
DTL |
denticleless E3 ubiquitin protein ligase homolog (Drosophila) |
| chr1_-_23857698 | 0.96 |
ENST00000361729.2 |
E2F2 |
E2F transcription factor 2 |
| chr11_+_62623544 | 0.96 |
ENST00000377890.2 ENST00000377891.2 ENST00000377889.2 |
SLC3A2 |
solute carrier family 3 (amino acid transporter heavy chain), member 2 |
| chr11_+_62623621 | 0.95 |
ENST00000535296.1 |
SLC3A2 |
solute carrier family 3 (amino acid transporter heavy chain), member 2 |
| chr11_+_62623512 | 0.95 |
ENST00000377892.1 |
SLC3A2 |
solute carrier family 3 (amino acid transporter heavy chain), member 2 |
| chr15_+_40987327 | 0.93 |
ENST00000423169.2 ENST00000267868.3 ENST00000557850.1 ENST00000532743.1 ENST00000382643.3 |
RAD51 |
RAD51 recombinase |
| chr15_+_32907691 | 0.91 |
ENST00000361627.3 ENST00000567348.1 ENST00000563864.1 ENST00000543522.1 |
ARHGAP11A |
Rho GTPase activating protein 11A |
| chr1_-_47779762 | 0.90 |
ENST00000371877.3 ENST00000360380.3 ENST00000337817.5 ENST00000447475.2 |
STIL |
SCL/TAL1 interrupting locus |
| chr2_+_17935119 | 0.84 |
ENST00000317402.7 |
GEN1 |
GEN1 Holliday junction 5' flap endonuclease |
| chr2_+_10262857 | 0.84 |
ENST00000304567.5 |
RRM2 |
ribonucleotide reductase M2 |
| chr20_-_5931109 | 0.80 |
ENST00000203001.2 |
TRMT6 |
tRNA methyltransferase 6 homolog (S. cerevisiae) |
| chr20_-_5931051 | 0.79 |
ENST00000453074.2 |
TRMT6 |
tRNA methyltransferase 6 homolog (S. cerevisiae) |
| chr2_+_17935383 | 0.78 |
ENST00000524465.1 ENST00000381254.2 ENST00000532257.1 |
GEN1 |
GEN1 Holliday junction 5' flap endonuclease |
| chr19_-_10305752 | 0.76 |
ENST00000540357.1 ENST00000359526.4 ENST00000340748.4 |
DNMT1 |
DNA (cytosine-5-)-methyltransferase 1 |
| chr3_+_44803209 | 0.73 |
ENST00000326047.4 |
KIF15 |
kinesin family member 15 |
| chr20_+_5931497 | 0.72 |
ENST00000378886.2 ENST00000265187.4 |
MCM8 |
minichromosome maintenance complex component 8 |
| chr13_-_110438914 | 0.71 |
ENST00000375856.3 |
IRS2 |
insulin receptor substrate 2 |
| chr2_-_235405679 | 0.69 |
ENST00000390645.2 |
ARL4C |
ADP-ribosylation factor-like 4C |
| chr13_-_26625169 | 0.68 |
ENST00000319420.3 |
SHISA2 |
shisa family member 2 |
| chr20_+_5931275 | 0.66 |
ENST00000378896.3 ENST00000378883.1 |
MCM8 |
minichromosome maintenance complex component 8 |
| chr10_+_62538089 | 0.66 |
ENST00000519078.2 ENST00000395284.3 ENST00000316629.4 |
CDK1 |
cyclin-dependent kinase 1 |
| chr10_+_62538248 | 0.63 |
ENST00000448257.2 |
CDK1 |
cyclin-dependent kinase 1 |
| chr8_+_94929168 | 0.62 |
ENST00000518107.1 ENST00000396200.3 |
PDP1 |
pyruvate dehyrogenase phosphatase catalytic subunit 1 |
| chr12_-_133263893 | 0.62 |
ENST00000535270.1 ENST00000320574.5 |
POLE |
polymerase (DNA directed), epsilon, catalytic subunit |
| chr8_+_94929077 | 0.61 |
ENST00000297598.4 ENST00000520614.1 |
PDP1 |
pyruvate dehyrogenase phosphatase catalytic subunit 1 |
| chr1_-_120612240 | 0.60 |
ENST00000256646.2 |
NOTCH2 |
notch 2 |
| chr7_-_99699538 | 0.56 |
ENST00000343023.6 ENST00000303887.5 |
MCM7 |
minichromosome maintenance complex component 7 |
| chr10_+_112327425 | 0.55 |
ENST00000361804.4 |
SMC3 |
structural maintenance of chromosomes 3 |
| chr8_+_94929110 | 0.54 |
ENST00000520728.1 |
PDP1 |
pyruvate dehyrogenase phosphatase catalytic subunit 1 |
| chr12_-_77459306 | 0.53 |
ENST00000547316.1 ENST00000416496.2 ENST00000550669.1 ENST00000322886.7 |
E2F7 |
E2F transcription factor 7 |
| chr14_+_51706886 | 0.52 |
ENST00000457354.2 |
TMX1 |
thioredoxin-related transmembrane protein 1 |
| chr2_-_17935059 | 0.51 |
ENST00000448223.2 ENST00000381272.4 ENST00000351948.4 |
SMC6 |
structural maintenance of chromosomes 6 |
| chrX_+_48554986 | 0.51 |
ENST00000376687.3 ENST00000453214.2 |
SUV39H1 |
suppressor of variegation 3-9 homolog 1 (Drosophila) |
| chr3_+_10068095 | 0.50 |
ENST00000287647.3 ENST00000383807.1 ENST00000383806.1 ENST00000419585.1 |
FANCD2 |
Fanconi anemia, complementation group D2 |
| chr2_-_232329186 | 0.50 |
ENST00000322723.4 |
NCL |
nucleolin |
| chr6_+_24775153 | 0.50 |
ENST00000356509.3 ENST00000230056.3 |
GMNN |
geminin, DNA replication inhibitor |
| chr4_+_30721968 | 0.48 |
ENST00000361762.2 |
PCDH7 |
protocadherin 7 |
| chr11_-_118966167 | 0.47 |
ENST00000530167.1 |
H2AFX |
H2A histone family, member X |
| chr5_-_36152031 | 0.45 |
ENST00000296603.4 |
LMBRD2 |
LMBR1 domain containing 2 |
| chr10_+_73724123 | 0.44 |
ENST00000373115.4 |
CHST3 |
carbohydrate (chondroitin 6) sulfotransferase 3 |
| chr6_+_116575329 | 0.44 |
ENST00000430252.2 ENST00000540275.1 ENST00000448740.2 |
DSE RP3-486I3.7 |
dermatan sulfate epimerase RP3-486I3.7 |
| chr4_+_154265784 | 0.44 |
ENST00000240488.3 |
MND1 |
meiotic nuclear divisions 1 homolog (S. cerevisiae) |
| chr21_-_30365136 | 0.42 |
ENST00000361371.5 ENST00000389194.2 ENST00000389195.2 |
LTN1 |
listerin E3 ubiquitin protein ligase 1 |
| chr5_-_79950775 | 0.42 |
ENST00000439211.2 |
DHFR |
dihydrofolate reductase |
| chrX_+_24711997 | 0.42 |
ENST00000379068.3 ENST00000379059.3 |
POLA1 |
polymerase (DNA directed), alpha 1, catalytic subunit |
| chr7_-_148581251 | 0.41 |
ENST00000478654.1 ENST00000460911.1 ENST00000350995.2 |
EZH2 |
enhancer of zeste homolog 2 (Drosophila) |
| chr22_-_38966172 | 0.41 |
ENST00000216024.2 |
DMC1 |
DNA meiotic recombinase 1 |
| chr20_+_25388293 | 0.41 |
ENST00000262460.4 ENST00000429262.2 |
GINS1 |
GINS complex subunit 1 (Psf1 homolog) |
| chr2_-_47168850 | 0.40 |
ENST00000409207.1 |
MCFD2 |
multiple coagulation factor deficiency 2 |
| chr7_-_158497431 | 0.40 |
ENST00000449727.2 ENST00000409339.3 ENST00000409423.1 ENST00000356309.3 |
NCAPG2 |
non-SMC condensin II complex, subunit G2 |
| chr6_-_52149475 | 0.40 |
ENST00000419835.2 ENST00000229854.7 ENST00000596288.1 |
MCM3 |
minichromosome maintenance complex component 3 |
| chr7_+_120590803 | 0.39 |
ENST00000315870.5 ENST00000339121.5 ENST00000445699.1 |
ING3 |
inhibitor of growth family, member 3 |
| chr10_+_96305535 | 0.39 |
ENST00000419900.1 ENST00000348459.5 ENST00000394045.1 ENST00000394044.1 ENST00000394036.1 |
HELLS |
helicase, lymphoid-specific |
| chr9_-_35080013 | 0.39 |
ENST00000378643.3 |
FANCG |
Fanconi anemia, complementation group G |
| chr7_-_148581360 | 0.39 |
ENST00000320356.2 ENST00000541220.1 ENST00000483967.1 ENST00000536783.1 |
EZH2 |
enhancer of zeste homolog 2 (Drosophila) |
| chr12_-_12849073 | 0.38 |
ENST00000332427.2 ENST00000540796.1 |
GPR19 |
G protein-coupled receptor 19 |
| chr1_-_54303934 | 0.38 |
ENST00000537333.1 |
NDC1 |
NDC1 transmembrane nucleoporin |
| chr8_-_15095832 | 0.37 |
ENST00000382080.1 |
SGCZ |
sarcoglycan, zeta |
| chr15_+_80987617 | 0.37 |
ENST00000258884.4 ENST00000558464.1 |
ABHD17C |
abhydrolase domain containing 17C |
| chr11_-_95522907 | 0.37 |
ENST00000358780.5 ENST00000542135.1 |
FAM76B |
family with sequence similarity 76, member B |
| chr4_-_130014609 | 0.36 |
ENST00000511426.1 |
SCLT1 |
sodium channel and clathrin linker 1 |
| chr16_+_28962128 | 0.36 |
ENST00000564978.1 ENST00000320805.4 |
NFATC2IP |
nuclear factor of activated T-cells, cytoplasmic, calcineurin-dependent 2 interacting protein |
| chr5_+_79950463 | 0.36 |
ENST00000265081.6 |
MSH3 |
mutS homolog 3 |
| chr14_-_50154921 | 0.35 |
ENST00000553805.2 ENST00000554396.1 ENST00000216367.5 ENST00000539565.2 |
POLE2 |
polymerase (DNA directed), epsilon 2, accessory subunit |
| chr11_-_85376121 | 0.35 |
ENST00000527447.1 |
CREBZF |
CREB/ATF bZIP transcription factor |
| chr4_+_178230985 | 0.35 |
ENST00000264596.3 |
NEIL3 |
nei endonuclease VIII-like 3 (E. coli) |
| chr1_+_179262905 | 0.35 |
ENST00000539888.1 ENST00000540564.1 ENST00000535686.1 ENST00000367619.3 |
SOAT1 |
sterol O-acyltransferase 1 |
| chr4_-_130014729 | 0.35 |
ENST00000281142.5 ENST00000434680.1 |
SCLT1 |
sodium channel and clathrin linker 1 |
| chr4_-_130014705 | 0.34 |
ENST00000503401.1 |
SCLT1 |
sodium channel and clathrin linker 1 |
| chr6_+_24775641 | 0.34 |
ENST00000378054.2 ENST00000476555.1 |
GMNN |
geminin, DNA replication inhibitor |
| chr2_-_55277692 | 0.34 |
ENST00000394611.2 |
RTN4 |
reticulon 4 |
| chr2_+_16080659 | 0.34 |
ENST00000281043.3 |
MYCN |
v-myc avian myelocytomatosis viral oncogene neuroblastoma derived homolog |
| chr10_+_103912137 | 0.34 |
ENST00000603742.1 ENST00000488254.2 ENST00000461421.1 ENST00000476468.1 ENST00000370007.5 |
NOLC1 |
nucleolar and coiled-body phosphoprotein 1 |
| chr1_-_100598444 | 0.34 |
ENST00000535161.1 ENST00000287482.5 |
SASS6 |
spindle assembly 6 homolog (C. elegans) |
| chr7_-_94285511 | 0.34 |
ENST00000265735.7 |
SGCE |
sarcoglycan, epsilon |
| chr15_-_64673665 | 0.34 |
ENST00000300035.4 |
KIAA0101 |
KIAA0101 |
| chr2_-_55277654 | 0.33 |
ENST00000337526.6 ENST00000317610.7 ENST00000357732.4 |
RTN4 |
reticulon 4 |
| chr7_+_6048856 | 0.33 |
ENST00000223029.3 ENST00000400479.2 ENST00000395236.2 |
AIMP2 |
aminoacyl tRNA synthetase complex-interacting multifunctional protein 2 |
| chr5_+_36876833 | 0.33 |
ENST00000282516.8 ENST00000448238.2 |
NIPBL |
Nipped-B homolog (Drosophila) |
| chr13_-_80915059 | 0.33 |
ENST00000377104.3 |
SPRY2 |
sprouty homolog 2 (Drosophila) |
| chrX_+_100353153 | 0.32 |
ENST00000423383.1 ENST00000218507.5 ENST00000403304.2 ENST00000435570.1 |
CENPI |
centromere protein I |
| chrX_+_123095546 | 0.32 |
ENST00000371157.3 ENST00000371145.3 ENST00000371144.3 |
STAG2 |
stromal antigen 2 |
| chrX_-_53449593 | 0.32 |
ENST00000375340.6 ENST00000322213.4 |
SMC1A |
structural maintenance of chromosomes 1A |
| chr15_-_66649010 | 0.32 |
ENST00000367709.4 ENST00000261881.4 |
TIPIN |
TIMELESS interacting protein |
| chrX_-_53711064 | 0.31 |
ENST00000342160.3 ENST00000446750.1 |
HUWE1 |
HECT, UBA and WWE domain containing 1, E3 ubiquitin protein ligase |
| chr2_-_47168906 | 0.31 |
ENST00000444761.2 ENST00000409147.1 |
MCFD2 |
multiple coagulation factor deficiency 2 |
| chr17_+_74380683 | 0.31 |
ENST00000592299.1 ENST00000590959.1 ENST00000323374.4 |
SPHK1 |
sphingosine kinase 1 |
| chr2_-_139537918 | 0.31 |
ENST00000272641.3 |
NXPH2 |
neurexophilin 2 |
| chr16_+_3019552 | 0.31 |
ENST00000572687.1 |
PAQR4 |
progestin and adipoQ receptor family member IV |
| chr9_-_99180597 | 0.30 |
ENST00000375256.4 |
ZNF367 |
zinc finger protein 367 |
| chr9_+_504674 | 0.30 |
ENST00000382297.2 |
KANK1 |
KN motif and ankyrin repeat domains 1 |
| chr7_-_94285472 | 0.30 |
ENST00000437425.2 ENST00000447873.1 ENST00000415788.2 |
SGCE |
sarcoglycan, epsilon |
| chr2_+_174219548 | 0.29 |
ENST00000347703.3 ENST00000392567.2 ENST00000306721.3 ENST00000410101.3 ENST00000410019.3 |
CDCA7 |
cell division cycle associated 7 |
| chr6_-_17706618 | 0.29 |
ENST00000262077.2 ENST00000537253.1 |
NUP153 |
nucleoporin 153kDa |
| chr10_+_103911926 | 0.28 |
ENST00000605788.1 ENST00000405356.1 |
NOLC1 |
nucleolar and coiled-body phosphoprotein 1 |
| chr16_+_3019246 | 0.28 |
ENST00000318782.8 ENST00000293978.8 |
PAQR4 |
progestin and adipoQ receptor family member IV |
| chr5_-_79950371 | 0.28 |
ENST00000511032.1 ENST00000504396.1 ENST00000505337.1 |
DHFR |
dihydrofolate reductase |
| chr6_+_37137939 | 0.28 |
ENST00000373509.5 |
PIM1 |
pim-1 oncogene |
| chr22_+_31031639 | 0.27 |
ENST00000343605.4 ENST00000300385.8 |
SLC35E4 |
solute carrier family 35, member E4 |
| chr2_-_55277512 | 0.27 |
ENST00000402434.2 |
RTN4 |
reticulon 4 |
| chr2_-_55277436 | 0.27 |
ENST00000354474.6 |
RTN4 |
reticulon 4 |
| chr1_+_240255166 | 0.27 |
ENST00000319653.9 |
FMN2 |
formin 2 |
| chr8_-_120868078 | 0.26 |
ENST00000313655.4 |
DSCC1 |
DNA replication and sister chromatid cohesion 1 |
| chr5_+_175875349 | 0.26 |
ENST00000261942.6 |
FAF2 |
Fas associated factor family member 2 |
| chr9_+_106856831 | 0.25 |
ENST00000303219.8 ENST00000374787.3 |
SMC2 |
structural maintenance of chromosomes 2 |
| chr7_+_116593568 | 0.25 |
ENST00000446490.1 |
ST7 |
suppression of tumorigenicity 7 |
| chr3_-_136471204 | 0.25 |
ENST00000480733.1 ENST00000383202.2 ENST00000236698.5 ENST00000434713.2 |
STAG1 |
stromal antigen 1 |
| chr7_-_94285402 | 0.25 |
ENST00000428696.2 ENST00000445866.2 |
SGCE |
sarcoglycan, epsilon |
| chr1_+_145209092 | 0.25 |
ENST00000362074.6 ENST00000344859.3 |
NOTCH2NL |
notch 2 N-terminal like |
| chr10_+_102672712 | 0.24 |
ENST00000370271.3 ENST00000370269.3 ENST00000609386.1 |
FAM178A |
family with sequence similarity 178, member A |
| chr11_-_74442430 | 0.24 |
ENST00000376332.3 |
CHRDL2 |
chordin-like 2 |
| chr3_-_133380731 | 0.24 |
ENST00000260810.5 |
TOPBP1 |
topoisomerase (DNA) II binding protein 1 |
| chr19_+_58694396 | 0.23 |
ENST00000326804.4 ENST00000345813.3 ENST00000424679.2 |
ZNF274 |
zinc finger protein 274 |
| chr1_+_151043070 | 0.23 |
ENST00000368918.3 ENST00000368917.1 |
GABPB2 |
GA binding protein transcription factor, beta subunit 2 |
| chr1_-_229694406 | 0.23 |
ENST00000344517.4 |
ABCB10 |
ATP-binding cassette, sub-family B (MDR/TAP), member 10 |
| chr15_+_41221536 | 0.23 |
ENST00000249749.5 |
DLL4 |
delta-like 4 (Drosophila) |
| chr1_-_243418621 | 0.23 |
ENST00000366544.1 ENST00000366543.1 |
CEP170 |
centrosomal protein 170kDa |
| chr4_+_71859156 | 0.22 |
ENST00000286648.5 ENST00000504730.1 ENST00000504952.1 |
DCK |
deoxycytidine kinase |
| chr19_+_50094866 | 0.22 |
ENST00000418929.2 |
PRR12 |
proline rich 12 |
| chr1_+_100598691 | 0.22 |
ENST00000370143.1 ENST00000370141.2 |
TRMT13 |
tRNA methyltransferase 13 homolog (S. cerevisiae) |
| chr7_+_116593292 | 0.22 |
ENST00000393446.2 ENST00000265437.5 ENST00000393451.3 |
ST7 |
suppression of tumorigenicity 7 |
| chr13_+_45694583 | 0.22 |
ENST00000340473.6 |
GTF2F2 |
general transcription factor IIF, polypeptide 2, 30kDa |
| chr11_-_95522639 | 0.21 |
ENST00000536839.1 |
FAM76B |
family with sequence similarity 76, member B |
| chr7_+_120591170 | 0.21 |
ENST00000431467.1 |
ING3 |
inhibitor of growth family, member 3 |
| chr3_+_10857885 | 0.21 |
ENST00000254488.2 ENST00000454147.1 |
SLC6A11 |
solute carrier family 6 (neurotransmitter transporter), member 11 |
| chr3_-_169381183 | 0.21 |
ENST00000494292.1 |
MECOM |
MDS1 and EVI1 complex locus |
| chr9_+_106856541 | 0.21 |
ENST00000286398.7 ENST00000440179.1 ENST00000374793.3 |
SMC2 |
structural maintenance of chromosomes 2 |
| chr3_-_49893958 | 0.21 |
ENST00000482243.1 ENST00000331456.2 ENST00000469027.1 |
TRAIP |
TRAF interacting protein |
| chr4_+_148538517 | 0.21 |
ENST00000296582.3 ENST00000508208.1 |
TMEM184C |
transmembrane protein 184C |
| chr7_+_26241325 | 0.21 |
ENST00000456948.1 ENST00000409747.1 |
CBX3 |
chromobox homolog 3 |
| chr7_+_99933730 | 0.21 |
ENST00000610247.1 |
PILRB |
paired immunoglobin-like type 2 receptor beta |
| chr22_+_35796056 | 0.21 |
ENST00000216122.4 |
MCM5 |
minichromosome maintenance complex component 5 |
| chr9_-_140484917 | 0.20 |
ENST00000298585.2 |
ZMYND19 |
zinc finger, MYND-type containing 19 |
| chr21_-_33104367 | 0.20 |
ENST00000286835.7 ENST00000399804.1 |
SCAF4 |
SR-related CTD-associated factor 4 |
| chr1_-_243418344 | 0.20 |
ENST00000366542.1 |
CEP170 |
centrosomal protein 170kDa |
| chrX_-_45710920 | 0.20 |
ENST00000456532.1 |
RP5-1158E12.3 |
RP5-1158E12.3 |
| chr8_+_48873479 | 0.19 |
ENST00000262105.2 |
MCM4 |
minichromosome maintenance complex component 4 |
| chr6_+_31707725 | 0.19 |
ENST00000375755.3 ENST00000375742.3 ENST00000375750.3 ENST00000425703.1 ENST00000534153.4 ENST00000375703.3 ENST00000375740.3 |
MSH5 |
mutS homolog 5 |
| chrX_-_75005054 | 0.19 |
ENST00000373359.2 |
MAGEE2 |
melanoma antigen family E, 2 |
| chr1_+_86046433 | 0.19 |
ENST00000451137.2 |
CYR61 |
cysteine-rich, angiogenic inducer, 61 |
| chr3_-_52719810 | 0.19 |
ENST00000424867.1 ENST00000394830.3 ENST00000431678.1 ENST00000450271.1 |
PBRM1 |
polybromo 1 |
| chr8_+_48873453 | 0.19 |
ENST00000523944.1 |
MCM4 |
minichromosome maintenance complex component 4 |
| chr8_+_95565947 | 0.19 |
ENST00000523011.1 |
RP11-267M23.4 |
RP11-267M23.4 |
| chr7_+_116593433 | 0.19 |
ENST00000323984.3 ENST00000393449.1 |
ST7 |
suppression of tumorigenicity 7 |
| chr22_+_35796108 | 0.18 |
ENST00000382011.5 ENST00000416905.1 |
MCM5 |
minichromosome maintenance complex component 5 |
| chr17_+_45726803 | 0.18 |
ENST00000535458.2 ENST00000583648.1 |
KPNB1 |
karyopherin (importin) beta 1 |
| chr16_-_10674528 | 0.18 |
ENST00000359543.3 |
EMP2 |
epithelial membrane protein 2 |
| chr3_-_51975942 | 0.18 |
ENST00000232888.6 |
RRP9 |
ribosomal RNA processing 9, small subunit (SSU) processome component, homolog (yeast) |
| chr2_+_219433588 | 0.18 |
ENST00000295701.5 |
RQCD1 |
RCD1 required for cell differentiation1 homolog (S. pombe) |
| chr11_+_125495862 | 0.18 |
ENST00000428830.2 ENST00000544373.1 ENST00000527013.1 ENST00000526937.1 ENST00000534685.1 |
CHEK1 |
checkpoint kinase 1 |
| chr16_+_58426296 | 0.18 |
ENST00000426538.2 ENST00000328514.7 ENST00000318129.5 |
GINS3 |
GINS complex subunit 3 (Psf3 homolog) |
| chr10_-_77161004 | 0.18 |
ENST00000418818.2 |
RP11-399K21.11 |
RP11-399K21.11 |
| chr12_-_122238913 | 0.17 |
ENST00000537157.1 |
AC084018.1 |
AC084018.1 |
| chr19_-_57352064 | 0.17 |
ENST00000326441.9 ENST00000593695.1 ENST00000599577.1 ENST00000594389.1 ENST00000423103.2 ENST00000598410.1 ENST00000593711.1 ENST00000391708.3 ENST00000221722.5 ENST00000599935.1 |
PEG3 ZIM2 |
paternally expressed 3 zinc finger, imprinted 2 |
| chr2_+_48010221 | 0.17 |
ENST00000234420.5 |
MSH6 |
mutS homolog 6 |
| chr3_-_10028366 | 0.17 |
ENST00000429759.1 |
EMC3 |
ER membrane protein complex subunit 3 |
| chrX_-_122866874 | 0.17 |
ENST00000245838.8 ENST00000355725.4 |
THOC2 |
THO complex 2 |
| chr5_-_137548997 | 0.16 |
ENST00000505120.1 ENST00000394886.2 ENST00000394884.3 |
CDC23 |
cell division cycle 23 |
| chr19_+_10764937 | 0.16 |
ENST00000449870.1 ENST00000318511.3 ENST00000420083.1 |
ILF3 |
interleukin enhancer binding factor 3, 90kDa |
| chr5_-_140998481 | 0.16 |
ENST00000518047.1 |
DIAPH1 |
diaphanous-related formin 1 |
| chr11_+_9406169 | 0.16 |
ENST00000379719.3 ENST00000527431.1 |
IPO7 |
importin 7 |
| chr3_+_182511266 | 0.16 |
ENST00000323116.5 ENST00000493826.1 |
ATP11B |
ATPase, class VI, type 11B |
| chr17_-_42580738 | 0.16 |
ENST00000585614.1 ENST00000591680.1 ENST00000434000.1 ENST00000588554.1 ENST00000592154.1 |
GPATCH8 |
G patch domain containing 8 |
| chr2_+_48010312 | 0.15 |
ENST00000540021.1 |
MSH6 |
mutS homolog 6 |
| chr1_+_13910194 | 0.15 |
ENST00000376057.4 ENST00000510906.1 |
PDPN |
podoplanin |
| chr5_-_140998616 | 0.15 |
ENST00000389054.3 ENST00000398562.2 ENST00000389057.5 ENST00000398566.3 ENST00000398557.4 ENST00000253811.6 |
DIAPH1 |
diaphanous-related formin 1 |
| chr16_+_29984962 | 0.15 |
ENST00000308893.4 |
TAOK2 |
TAO kinase 2 |
| chr3_+_41240925 | 0.15 |
ENST00000396183.3 ENST00000349496.5 ENST00000453024.1 |
CTNNB1 |
catenin (cadherin-associated protein), beta 1, 88kDa |
| chr17_+_74734052 | 0.14 |
ENST00000590514.1 |
MFSD11 |
major facilitator superfamily domain containing 11 |
| chr16_-_12009833 | 0.14 |
ENST00000420576.2 |
GSPT1 |
G1 to S phase transition 1 |
| chr18_+_2655849 | 0.14 |
ENST00000261598.8 |
SMCHD1 |
structural maintenance of chromosomes flexible hinge domain containing 1 |
| chr17_+_45727204 | 0.14 |
ENST00000290158.4 |
KPNB1 |
karyopherin (importin) beta 1 |
| chr22_+_35653445 | 0.14 |
ENST00000420166.1 ENST00000444518.2 ENST00000455359.1 ENST00000216106.5 |
HMGXB4 |
HMG box domain containing 4 |
| chr7_+_26241310 | 0.14 |
ENST00000396386.2 |
CBX3 |
chromobox homolog 3 |
| chr2_+_171571827 | 0.14 |
ENST00000375281.3 |
SP5 |
Sp5 transcription factor |
| chr5_-_176738883 | 0.14 |
ENST00000513169.1 ENST00000423571.2 ENST00000502529.1 ENST00000427908.2 |
MXD3 |
MAX dimerization protein 3 |
| chr12_+_27932803 | 0.14 |
ENST00000381271.2 |
KLHL42 |
kelch-like family member 42 |
| chr4_-_174256276 | 0.14 |
ENST00000296503.5 |
HMGB2 |
high mobility group box 2 |
| chr19_+_50887585 | 0.14 |
ENST00000440232.2 ENST00000601098.1 ENST00000599857.1 ENST00000593887.1 |
POLD1 |
polymerase (DNA directed), delta 1, catalytic subunit |
| chr8_-_95565673 | 0.13 |
ENST00000437199.1 ENST00000297591.5 ENST00000421249.2 |
KIAA1429 |
KIAA1429 |
| chr12_-_45270151 | 0.13 |
ENST00000429094.2 |
NELL2 |
NEL-like 2 (chicken) |
| chr1_-_151119087 | 0.13 |
ENST00000341697.3 ENST00000368914.3 |
SEMA6C |
sema domain, transmembrane domain (TM), and cytoplasmic domain, (semaphorin) 6C |
| chr2_-_27632390 | 0.13 |
ENST00000350803.4 ENST00000344034.4 |
PPM1G |
protein phosphatase, Mg2+/Mn2+ dependent, 1G |
| chr10_-_131762105 | 0.13 |
ENST00000368648.3 ENST00000355311.5 |
EBF3 |
early B-cell factor 3 |
Gene Ontology Analysis
Gene overrepresentation in biological_process category:
| Log-likelihood per target | Total log-likelihood | Term | Description |
|---|---|---|---|
| 1.2 | 3.6 | GO:0032877 | positive regulation of DNA endoreduplication(GO:0032877) |
| 0.6 | 2.9 | GO:0060356 | leucine import(GO:0060356) |
| 0.5 | 1.6 | GO:0071139 | resolution of recombination intermediates(GO:0071139) resolution of mitotic recombination intermediates(GO:0071140) |
| 0.5 | 1.1 | GO:0071930 | negative regulation of transcription involved in G1/S transition of mitotic cell cycle(GO:0071930) |
| 0.4 | 1.2 | GO:0038162 | response to stem cell factor(GO:0036215) cellular response to stem cell factor stimulus(GO:0036216) Kit signaling pathway(GO:0038109) erythropoietin-mediated signaling pathway(GO:0038162) |
| 0.3 | 4.1 | GO:0033314 | mitotic DNA replication checkpoint(GO:0033314) |
| 0.3 | 0.9 | GO:1990414 | replication-born double-strand break repair via sister chromatid exchange(GO:1990414) |
| 0.3 | 1.1 | GO:0006272 | leading strand elongation(GO:0006272) |
| 0.3 | 0.8 | GO:1904772 | hepatocyte homeostasis(GO:0036333) response to tetrachloromethane(GO:1904772) |
| 0.2 | 1.0 | GO:1990086 | lens fiber cell apoptotic process(GO:1990086) |
| 0.2 | 1.3 | GO:0014038 | regulation of Schwann cell differentiation(GO:0014038) |
| 0.2 | 1.3 | GO:0010216 | maintenance of DNA methylation(GO:0010216) |
| 0.2 | 1.5 | GO:0048478 | replication fork protection(GO:0048478) |
| 0.2 | 2.2 | GO:0031936 | negative regulation of chromatin silencing(GO:0031936) |
| 0.2 | 0.7 | GO:0046452 | dihydrofolate metabolic process(GO:0046452) |
| 0.1 | 0.8 | GO:0071163 | DNA replication preinitiation complex assembly(GO:0071163) |
| 0.1 | 1.1 | GO:0006268 | DNA unwinding involved in DNA replication(GO:0006268) |
| 0.1 | 0.4 | GO:0030474 | spindle pole body duplication(GO:0030474) spindle pole body organization(GO:0051300) spindle pole body localization(GO:0070631) establishment of spindle pole body localization(GO:0070632) spindle pole body localization to nuclear envelope(GO:0071789) establishment of spindle pole body localization to nuclear envelope(GO:0071790) |
| 0.1 | 0.7 | GO:0010748 | regulation of plasma membrane long-chain fatty acid transport(GO:0010746) negative regulation of plasma membrane long-chain fatty acid transport(GO:0010748) |
| 0.1 | 0.9 | GO:0033504 | floor plate development(GO:0033504) |
| 0.1 | 1.2 | GO:0071787 | endoplasmic reticulum tubular network assembly(GO:0071787) |
| 0.1 | 0.3 | GO:1903630 | regulation of aminoacyl-tRNA ligase activity(GO:1903630) |
| 0.1 | 0.3 | GO:0061010 | gall bladder development(GO:0061010) |
| 0.1 | 1.2 | GO:0032876 | negative regulation of DNA endoreduplication(GO:0032876) |
| 0.1 | 0.3 | GO:0046521 | sphingoid catabolic process(GO:0046521) |
| 0.1 | 0.3 | GO:2000393 | negative regulation of lamellipodium morphogenesis(GO:2000393) |
| 0.1 | 1.8 | GO:0010510 | regulation of acetyl-CoA biosynthetic process from pyruvate(GO:0010510) |
| 0.1 | 0.3 | GO:0032240 | negative regulation of nucleobase-containing compound transport(GO:0032240) negative regulation of RNA export from nucleus(GO:0046832) |
| 0.1 | 0.3 | GO:0051758 | homologous chromosome movement towards spindle pole involved in homologous chromosome segregation(GO:0051758) |
| 0.1 | 0.4 | GO:0042986 | positive regulation of amyloid precursor protein biosynthetic process(GO:0042986) |
| 0.1 | 0.1 | GO:0006267 | pre-replicative complex assembly involved in nuclear cell cycle DNA replication(GO:0006267) pre-replicative complex assembly(GO:0036388) pre-replicative complex assembly involved in cell cycle DNA replication(GO:1902299) |
| 0.1 | 0.3 | GO:0031291 | Ran protein signal transduction(GO:0031291) |
| 0.1 | 0.2 | GO:0002184 | cytoplasmic translational termination(GO:0002184) |
| 0.1 | 1.1 | GO:0045162 | clustering of voltage-gated sodium channels(GO:0045162) |
| 0.1 | 1.0 | GO:0048304 | positive regulation of isotype switching to IgG isotypes(GO:0048304) |
| 0.1 | 3.2 | GO:0006270 | DNA replication initiation(GO:0006270) |
| 0.1 | 0.5 | GO:2000348 | regulation of CD40 signaling pathway(GO:2000348) |
| 0.1 | 0.8 | GO:0061314 | Notch signaling involved in heart development(GO:0061314) |
| 0.1 | 0.7 | GO:0051096 | positive regulation of helicase activity(GO:0051096) |
| 0.1 | 0.8 | GO:0001833 | inner cell mass cell proliferation(GO:0001833) |
| 0.1 | 0.3 | GO:0051387 | negative regulation of neurotrophin TRK receptor signaling pathway(GO:0051387) |
| 0.1 | 0.2 | GO:1990764 | regulation of myofibroblast contraction(GO:1904328) myofibroblast contraction(GO:1990764) |
| 0.1 | 0.2 | GO:0032954 | regulation of cytokinetic process(GO:0032954) regulation of mitotic cytokinetic process(GO:1903436) positive regulation of mitotic cytokinetic process(GO:1903438) positive regulation of mitotic cytokinesis(GO:1903490) |
| 0.1 | 0.5 | GO:0010032 | meiotic chromosome condensation(GO:0010032) |
| 0.1 | 0.6 | GO:0007000 | nucleolus organization(GO:0007000) |
| 0.1 | 0.2 | GO:1904897 | regulation of hepatic stellate cell proliferation(GO:1904897) positive regulation of hepatic stellate cell proliferation(GO:1904899) hepatic stellate cell proliferation(GO:1990922) |
| 0.1 | 0.4 | GO:0042148 | strand invasion(GO:0042148) |
| 0.1 | 0.5 | GO:0000722 | telomere maintenance via recombination(GO:0000722) |
| 0.1 | 0.5 | GO:0036123 | histone H3-K9 dimethylation(GO:0036123) |
| 0.1 | 0.5 | GO:1901838 | positive regulation of transcription of nuclear large rRNA transcript from RNA polymerase I promoter(GO:1901838) |
| 0.0 | 1.8 | GO:0030488 | tRNA methylation(GO:0030488) |
| 0.0 | 0.1 | GO:2000017 | negative regulation of mitotic cell cycle, embryonic(GO:0045976) renal inner medulla development(GO:0072053) renal outer medulla development(GO:0072054) positive regulation of determination of dorsal identity(GO:2000017) |
| 0.0 | 0.3 | GO:0034088 | maintenance of sister chromatid cohesion(GO:0034086) maintenance of mitotic sister chromatid cohesion(GO:0034088) post-translational protein acetylation(GO:0034421) |
| 0.0 | 0.1 | GO:0002023 | reduction of food intake in response to dietary excess(GO:0002023) |
| 0.0 | 0.7 | GO:0040037 | negative regulation of fibroblast growth factor receptor signaling pathway(GO:0040037) |
| 0.0 | 0.2 | GO:0015917 | aminophospholipid transport(GO:0015917) |
| 0.0 | 0.1 | GO:0070682 | proteasome regulatory particle assembly(GO:0070682) |
| 0.0 | 0.1 | GO:0072185 | metanephric cap development(GO:0072185) metanephric cap morphogenesis(GO:0072186) metanephric cap mesenchymal cell proliferation involved in metanephros development(GO:0090094) |
| 0.0 | 0.3 | GO:1903800 | positive regulation of production of miRNAs involved in gene silencing by miRNA(GO:1903800) |
| 0.0 | 0.2 | GO:0009157 | deoxyribonucleoside monophosphate biosynthetic process(GO:0009157) |
| 0.0 | 0.9 | GO:0009263 | deoxyribonucleotide biosynthetic process(GO:0009263) |
| 0.0 | 0.1 | GO:0006597 | spermine biosynthetic process(GO:0006597) |
| 0.0 | 0.3 | GO:2000138 | positive regulation of cell proliferation involved in heart morphogenesis(GO:2000138) |
| 0.0 | 4.2 | GO:0000079 | regulation of cyclin-dependent protein serine/threonine kinase activity(GO:0000079) |
| 0.0 | 0.2 | GO:0003278 | apoptotic process involved in heart morphogenesis(GO:0003278) |
| 0.0 | 0.2 | GO:0035407 | histone H3-T11 phosphorylation(GO:0035407) |
| 0.0 | 0.4 | GO:0035372 | protein localization to microtubule(GO:0035372) |
| 0.0 | 0.1 | GO:0009257 | 10-formyltetrahydrofolate biosynthetic process(GO:0009257) |
| 0.0 | 0.1 | GO:1904031 | positive regulation of cyclin-dependent protein kinase activity(GO:1904031) |
| 0.0 | 0.2 | GO:0000389 | mRNA 3'-splice site recognition(GO:0000389) |
| 0.0 | 0.1 | GO:0006287 | base-excision repair, gap-filling(GO:0006287) |
| 0.0 | 0.2 | GO:0061084 | regulation of protein refolding(GO:0061083) negative regulation of protein refolding(GO:0061084) |
| 0.0 | 0.2 | GO:1900112 | regulation of histone H3-K9 trimethylation(GO:1900112) |
| 0.0 | 0.3 | GO:0070050 | neuron cellular homeostasis(GO:0070050) |
| 0.0 | 1.1 | GO:0031572 | G2 DNA damage checkpoint(GO:0031572) |
| 0.0 | 0.2 | GO:0090666 | scaRNA localization to Cajal body(GO:0090666) |
| 0.0 | 0.1 | GO:0060721 | spongiotrophoblast cell proliferation(GO:0060720) regulation of spongiotrophoblast cell proliferation(GO:0060721) cell proliferation involved in embryonic placenta development(GO:0060722) regulation of cell proliferation involved in embryonic placenta development(GO:0060723) |
| 0.0 | 0.1 | GO:0071043 | CUT catabolic process(GO:0071034) CUT metabolic process(GO:0071043) |
| 0.0 | 0.1 | GO:0009048 | dosage compensation by inactivation of X chromosome(GO:0009048) |
| 0.0 | 0.9 | GO:0030206 | chondroitin sulfate biosynthetic process(GO:0030206) |
| 0.0 | 0.2 | GO:0051026 | chiasma assembly(GO:0051026) |
| 0.0 | 0.1 | GO:0080009 | mRNA methylation(GO:0080009) |
| 0.0 | 0.1 | GO:0010825 | positive regulation of centrosome duplication(GO:0010825) |
| 0.0 | 0.6 | GO:0043968 | histone H2A acetylation(GO:0043968) |
| 0.0 | 0.2 | GO:0070836 | caveola assembly(GO:0070836) |
| 0.0 | 0.1 | GO:0030035 | microspike assembly(GO:0030035) |
| 0.0 | 0.1 | GO:0000354 | cis assembly of pre-catalytic spliceosome(GO:0000354) |
| 0.0 | 0.4 | GO:0035825 | reciprocal meiotic recombination(GO:0007131) reciprocal DNA recombination(GO:0035825) |
| 0.0 | 0.1 | GO:0007023 | post-chaperonin tubulin folding pathway(GO:0007023) |
| 0.0 | 0.1 | GO:0019264 | glycine biosynthetic process from serine(GO:0019264) |
| 0.0 | 0.2 | GO:0032968 | positive regulation of transcription elongation from RNA polymerase II promoter(GO:0032968) |
| 0.0 | 1.0 | GO:0043550 | regulation of lipid kinase activity(GO:0043550) |
| 0.0 | 0.1 | GO:0072369 | regulation of lipid transport by positive regulation of transcription from RNA polymerase II promoter(GO:0072369) |
| 0.0 | 0.2 | GO:0032688 | negative regulation of interferon-beta production(GO:0032688) |
| 0.0 | 0.1 | GO:0045141 | meiotic telomere clustering(GO:0045141) |
| 0.0 | 0.1 | GO:0045654 | positive regulation of megakaryocyte differentiation(GO:0045654) |
| 0.0 | 0.0 | GO:0034059 | response to anoxia(GO:0034059) |
| 0.0 | 0.2 | GO:0034975 | protein folding in endoplasmic reticulum(GO:0034975) |
| 0.0 | 0.2 | GO:0046784 | viral mRNA export from host cell nucleus(GO:0046784) |
| 0.0 | 0.1 | GO:0097167 | circadian regulation of translation(GO:0097167) |
| 0.0 | 0.1 | GO:0007352 | zygotic specification of dorsal/ventral axis(GO:0007352) |
| 0.0 | 0.0 | GO:1990637 | response to prolactin(GO:1990637) |
| 0.0 | 0.4 | GO:0046716 | muscle cell cellular homeostasis(GO:0046716) |
| 0.0 | 0.2 | GO:0015812 | gamma-aminobutyric acid transport(GO:0015812) |
| 0.0 | 0.1 | GO:0060075 | regulation of resting membrane potential(GO:0060075) |
| 0.0 | 0.2 | GO:1902187 | negative regulation of viral release from host cell(GO:1902187) |
| 0.0 | 0.4 | GO:0061641 | CENP-A containing nucleosome assembly(GO:0034080) CENP-A containing chromatin organization(GO:0061641) |
Gene overrepresentation in cellular_component category:
| Log-likelihood per target | Total log-likelihood | Term | Description |
|---|---|---|---|
| 0.4 | 0.4 | GO:0000811 | GINS complex(GO:0000811) |
| 0.4 | 1.1 | GO:0035189 | Rb-E2F complex(GO:0035189) |
| 0.3 | 1.4 | GO:0097362 | MCM8-MCM9 complex(GO:0097362) |
| 0.3 | 1.6 | GO:0031515 | tRNA (m1A) methyltransferase complex(GO:0031515) |
| 0.3 | 1.3 | GO:0097125 | cyclin B1-CDK1 complex(GO:0097125) |
| 0.2 | 0.7 | GO:0005873 | plus-end kinesin complex(GO:0005873) |
| 0.2 | 0.9 | GO:0005971 | ribonucleoside-diphosphate reductase complex(GO:0005971) |
| 0.2 | 0.3 | GO:0032301 | MutSalpha complex(GO:0032301) |
| 0.2 | 1.9 | GO:0042555 | MCM complex(GO:0042555) |
| 0.1 | 1.3 | GO:0016012 | sarcoglycan complex(GO:0016012) |
| 0.1 | 0.6 | GO:0035061 | interchromatin granule(GO:0035061) |
| 0.1 | 0.4 | GO:0070762 | nuclear pore transmembrane ring(GO:0070762) |
| 0.1 | 2.6 | GO:0000800 | lateral element(GO:0000800) |
| 0.1 | 0.4 | GO:0032302 | MutSbeta complex(GO:0032302) |
| 0.1 | 1.4 | GO:0031298 | replication fork protection complex(GO:0031298) |
| 0.1 | 0.3 | GO:0030893 | meiotic cohesin complex(GO:0030893) |
| 0.1 | 0.5 | GO:0033553 | rDNA heterochromatin(GO:0033553) |
| 0.1 | 0.6 | GO:0008622 | epsilon DNA polymerase complex(GO:0008622) |
| 0.1 | 0.6 | GO:0032777 | Piccolo NuA4 histone acetyltransferase complex(GO:0032777) |
| 0.1 | 0.9 | GO:0000796 | condensin complex(GO:0000796) |
| 0.1 | 0.1 | GO:0031261 | DNA replication preinitiation complex(GO:0031261) |
| 0.1 | 0.2 | GO:0018444 | translation release factor complex(GO:0018444) |
| 0.1 | 0.2 | GO:0005674 | transcription factor TFIIF complex(GO:0005674) |
| 0.1 | 1.1 | GO:0071439 | clathrin complex(GO:0071439) |
| 0.1 | 1.0 | GO:0031464 | Cul4A-RING E3 ubiquitin ligase complex(GO:0031464) |
| 0.1 | 0.4 | GO:0005658 | alpha DNA polymerase:primase complex(GO:0005658) |
| 0.1 | 0.3 | GO:0098536 | deuterosome(GO:0098536) |
| 0.1 | 0.3 | GO:0043625 | delta DNA polymerase complex(GO:0043625) |
| 0.1 | 0.8 | GO:0045120 | pronucleus(GO:0045120) |
| 0.0 | 1.5 | GO:0071782 | endoplasmic reticulum tubular network(GO:0071782) |
| 0.0 | 0.7 | GO:0001673 | male germ cell nucleus(GO:0001673) |
| 0.0 | 1.4 | GO:0005721 | pericentric heterochromatin(GO:0005721) |
| 0.0 | 0.2 | GO:0031428 | box C/D snoRNP complex(GO:0031428) |
| 0.0 | 0.1 | GO:0045293 | MIS complex(GO:0036396) mRNA editing complex(GO:0045293) |
| 0.0 | 1.2 | GO:0042629 | mast cell granule(GO:0042629) |
| 0.0 | 0.1 | GO:0034750 | Scrib-APC-beta-catenin complex(GO:0034750) |
| 0.0 | 0.3 | GO:0031390 | Ctf18 RFC-like complex(GO:0031390) |
| 0.0 | 0.1 | GO:0001740 | Barr body(GO:0001740) |
| 0.0 | 0.3 | GO:0043240 | Fanconi anaemia nuclear complex(GO:0043240) |
| 0.0 | 0.5 | GO:0044613 | nuclear pore central transport channel(GO:0044613) |
| 0.0 | 0.1 | GO:1990075 | periciliary membrane compartment(GO:1990075) |
| 0.0 | 0.1 | GO:1902937 | inward rectifier potassium channel complex(GO:1902937) |
| 0.0 | 0.1 | GO:0005663 | DNA replication factor C complex(GO:0005663) PCNA-p21 complex(GO:0070557) |
| 0.0 | 0.1 | GO:0033263 | CORVET complex(GO:0033263) |
| 0.0 | 0.6 | GO:0000793 | condensed chromosome(GO:0000793) |
| 0.0 | 0.3 | GO:0034098 | VCP-NPL4-UFD1 AAA ATPase complex(GO:0034098) |
| 0.0 | 0.2 | GO:0016589 | NURF complex(GO:0016589) |
| 0.0 | 0.2 | GO:0097197 | tetraspanin-enriched microdomain(GO:0097197) |
| 0.0 | 0.2 | GO:0000347 | THO complex(GO:0000347) THO complex part of transcription export complex(GO:0000445) |
| 0.0 | 0.2 | GO:0072546 | ER membrane protein complex(GO:0072546) |
| 0.0 | 0.2 | GO:0002199 | zona pellucida receptor complex(GO:0002199) |
| 0.0 | 0.3 | GO:0017101 | aminoacyl-tRNA synthetase multienzyme complex(GO:0017101) |
| 0.0 | 2.9 | GO:0048770 | melanosome(GO:0042470) pigment granule(GO:0048770) |
| 0.0 | 0.5 | GO:0031092 | platelet alpha granule membrane(GO:0031092) |
| 0.0 | 0.1 | GO:0008275 | gamma-tubulin small complex(GO:0008275) |
| 0.0 | 0.3 | GO:0071004 | U2-type prespliceosome(GO:0071004) |
| 0.0 | 0.1 | GO:0043190 | ATP-binding cassette (ABC) transporter complex(GO:0043190) |
Gene overrepresentation in molecular_function category:
| Log-likelihood per target | Total log-likelihood | Term | Description |
|---|---|---|---|
| 0.5 | 3.7 | GO:0010997 | anaphase-promoting complex binding(GO:0010997) |
| 0.3 | 1.2 | GO:0036033 | mediator complex binding(GO:0036033) |
| 0.3 | 1.8 | GO:0004741 | [pyruvate dehydrogenase (lipoamide)] phosphatase activity(GO:0004741) |
| 0.2 | 1.2 | GO:0010484 | H3 histone acetyltransferase activity(GO:0010484) |
| 0.2 | 0.9 | GO:0061731 | ribonucleoside-diphosphate reductase activity, thioredoxin disulfide as acceptor(GO:0004748) oxidoreductase activity, acting on CH or CH2 groups, disulfide as acceptor(GO:0016728) ribonucleoside-diphosphate reductase activity(GO:0061731) |
| 0.2 | 2.9 | GO:0005432 | calcium:sodium antiporter activity(GO:0005432) |
| 0.2 | 1.6 | GO:0008821 | crossover junction endodeoxyribonuclease activity(GO:0008821) |
| 0.1 | 0.7 | GO:0032142 | single guanine insertion binding(GO:0032142) |
| 0.1 | 0.8 | GO:0003886 | DNA (cytosine-5-)-methyltransferase activity(GO:0003886) |
| 0.1 | 0.5 | GO:0046974 | histone methyltransferase activity (H3-K9 specific)(GO:0046974) |
| 0.1 | 1.3 | GO:0000150 | recombinase activity(GO:0000150) |
| 0.1 | 0.7 | GO:0051870 | methotrexate binding(GO:0051870) |
| 0.1 | 0.6 | GO:0038049 | transcription factor activity, ligand-activated RNA polymerase II transcription factor binding(GO:0038049) |
| 0.1 | 1.6 | GO:0003688 | DNA replication origin binding(GO:0003688) |
| 0.1 | 0.8 | GO:0046976 | histone methyltransferase activity (H3-K27 specific)(GO:0046976) |
| 0.1 | 0.6 | GO:0001042 | RNA polymerase I core binding(GO:0001042) |
| 0.1 | 0.4 | GO:0047757 | chondroitin-glucuronate 5-epimerase activity(GO:0047757) |
| 0.1 | 0.2 | GO:0004137 | deoxycytidine kinase activity(GO:0004137) |
| 0.1 | 0.4 | GO:0044547 | DNA topoisomerase binding(GO:0044547) |
| 0.1 | 1.2 | GO:0004716 | receptor signaling protein tyrosine kinase activity(GO:0004716) |
| 0.1 | 0.6 | GO:0008310 | single-stranded DNA 3'-5' exodeoxyribonuclease activity(GO:0008310) |
| 0.1 | 0.4 | GO:0001517 | N-acetylglucosamine 6-O-sulfotransferase activity(GO:0001517) |
| 0.1 | 0.2 | GO:0034511 | U3 snoRNA binding(GO:0034511) |
| 0.1 | 1.3 | GO:0008353 | RNA polymerase II carboxy-terminal domain kinase activity(GO:0008353) |
| 0.1 | 0.3 | GO:0008481 | sphinganine kinase activity(GO:0008481) D-erythro-sphingosine kinase activity(GO:0017050) |
| 0.0 | 0.6 | GO:0001135 | transcription factor activity, RNA polymerase II transcription factor recruiting(GO:0001135) |
| 0.0 | 0.1 | GO:0001716 | L-amino-acid oxidase activity(GO:0001716) |
| 0.0 | 0.4 | GO:0000405 | bubble DNA binding(GO:0000405) |
| 0.0 | 0.5 | GO:0043138 | 3'-5' DNA helicase activity(GO:0043138) |
| 0.0 | 0.4 | GO:0031386 | protein tag(GO:0031386) |
| 0.0 | 0.4 | GO:1990226 | histone methyltransferase binding(GO:1990226) |
| 0.0 | 0.1 | GO:0004487 | methylenetetrahydrofolate dehydrogenase (NAD+) activity(GO:0004487) |
| 0.0 | 0.1 | GO:0097158 | pre-mRNA intronic pyrimidine-rich binding(GO:0097158) |
| 0.0 | 0.3 | GO:0035473 | lipase binding(GO:0035473) |
| 0.0 | 0.2 | GO:0005332 | gamma-aminobutyric acid:sodium symporter activity(GO:0005332) |
| 0.0 | 0.1 | GO:0030337 | DNA polymerase processivity factor activity(GO:0030337) dinucleotide insertion or deletion binding(GO:0032139) |
| 0.0 | 1.0 | GO:1990841 | promoter-specific chromatin binding(GO:1990841) |
| 0.0 | 0.2 | GO:0003747 | translation release factor activity(GO:0003747) translation termination factor activity(GO:0008079) |
| 0.0 | 0.2 | GO:0035402 | histone kinase activity (H3-T11 specific)(GO:0035402) |
| 0.0 | 0.8 | GO:0017056 | structural constituent of nuclear pore(GO:0017056) |
| 0.0 | 0.3 | GO:0003689 | DNA clamp loader activity(GO:0003689) protein-DNA loading ATPase activity(GO:0033170) |
| 0.0 | 1.0 | GO:0004003 | ATP-dependent DNA helicase activity(GO:0004003) |
| 0.0 | 0.2 | GO:0000990 | transcription factor activity, core RNA polymerase binding(GO:0000990) |
| 0.0 | 0.1 | GO:0044378 | non-sequence-specific DNA binding, bending(GO:0044378) |
| 0.0 | 0.2 | GO:0008094 | DNA-dependent ATPase activity(GO:0008094) |
| 0.0 | 0.5 | GO:0070182 | DNA polymerase binding(GO:0070182) |
| 0.0 | 0.1 | GO:0070698 | type I activin receptor binding(GO:0070698) |
| 0.0 | 0.2 | GO:0008517 | folic acid transporter activity(GO:0008517) |
| 0.0 | 0.7 | GO:0043014 | alpha-tubulin binding(GO:0043014) |
| 0.0 | 5.6 | GO:0001047 | core promoter binding(GO:0001047) |
| 0.0 | 0.5 | GO:0016864 | protein disulfide isomerase activity(GO:0003756) intramolecular oxidoreductase activity, transposing S-S bonds(GO:0016864) |
| 0.0 | 0.7 | GO:0003887 | DNA-directed DNA polymerase activity(GO:0003887) |
| 0.0 | 0.3 | GO:0043024 | ribosomal small subunit binding(GO:0043024) |
| 0.0 | 0.7 | GO:0071889 | 14-3-3 protein binding(GO:0071889) |
| 0.0 | 3.8 | GO:0042393 | histone binding(GO:0042393) |
| 0.0 | 2.0 | GO:0004386 | helicase activity(GO:0004386) |
| 0.0 | 0.2 | GO:0016018 | cyclosporin A binding(GO:0016018) |
| 0.0 | 0.9 | GO:0070491 | repressing transcription factor binding(GO:0070491) |
| 0.0 | 0.2 | GO:0030619 | U1 snRNA binding(GO:0030619) |
| 0.0 | 0.1 | GO:0004972 | NMDA glutamate receptor activity(GO:0004972) |
| 0.0 | 0.3 | GO:0008139 | nuclear localization sequence binding(GO:0008139) |
Gene overrepresentation in C2:CP category:
| Log-likelihood per target | Total log-likelihood | Term | Description |
|---|---|---|---|
| 0.2 | 2.5 | SA G2 AND M PHASES | Cdc25 activates the cdc2/cyclin B complex to induce the G2/M transition. |
| 0.1 | 7.3 | PID ATR PATHWAY | ATR signaling pathway |
| 0.1 | 2.0 | SA REG CASCADE OF CYCLIN EXPR | Expression of cyclins regulates progression through the cell cycle by activating cyclin-dependent kinases. |
| 0.0 | 2.6 | PID NFAT TFPATHWAY | Calcineurin-regulated NFAT-dependent transcription in lymphocytes |
| 0.0 | 0.4 | ST JAK STAT PATHWAY | Jak-STAT Pathway |
| 0.0 | 1.3 | PID ATM PATHWAY | ATM pathway |
| 0.0 | 0.9 | PID HEDGEHOG 2PATHWAY | Signaling events mediated by the Hedgehog family |
| 0.0 | 2.1 | PID E2F PATHWAY | E2F transcription factor network |
| 0.0 | 0.6 | PID SMAD2 3PATHWAY | Regulation of cytoplasmic and nuclear SMAD2/3 signaling |
| 0.0 | 1.2 | PID KIT PATHWAY | Signaling events mediated by Stem cell factor receptor (c-Kit) |
| 0.0 | 0.3 | PID IL5 PATHWAY | IL5-mediated signaling events |
| 0.0 | 0.7 | SIG IL4RECEPTOR IN B LYPHOCYTES | Genes related to IL4 rceptor signaling in B lymphocytes |
| 0.0 | 0.4 | PID FANCONI PATHWAY | Fanconi anemia pathway |
| 0.0 | 1.5 | PID P75 NTR PATHWAY | p75(NTR)-mediated signaling |
| 0.0 | 0.8 | PID NOTCH PATHWAY | Notch signaling pathway |
| 0.0 | 0.9 | PID AURORA B PATHWAY | Aurora B signaling |
| 0.0 | 0.3 | PID S1P S1P1 PATHWAY | S1P1 pathway |
Gene overrepresentation in C2:CP:REACTOME category:
| Log-likelihood per target | Total log-likelihood | Term | Description |
|---|---|---|---|
| 0.4 | 2.5 | REACTOME E2F ENABLED INHIBITION OF PRE REPLICATION COMPLEX FORMATION | Genes involved in E2F-enabled inhibition of pre-replication complex formation |
| 0.2 | 3.5 | REACTOME CDC6 ASSOCIATION WITH THE ORC ORIGIN COMPLEX | Genes involved in CDC6 association with the ORC:origin complex |
| 0.1 | 2.4 | REACTOME UNWINDING OF DNA | Genes involved in Unwinding of DNA |
| 0.1 | 2.8 | REACTOME CYCLIN A B1 ASSOCIATED EVENTS DURING G2 M TRANSITION | Genes involved in Cyclin A/B1 associated events during G2/M transition |
| 0.1 | 2.6 | REACTOME HOMOLOGOUS RECOMBINATION REPAIR OF REPLICATION INDEPENDENT DOUBLE STRAND BREAKS | Genes involved in Homologous recombination repair of replication-independent double-strand breaks |
| 0.1 | 2.0 | REACTOME ACTIVATION OF THE PRE REPLICATIVE COMPLEX | Genes involved in Activation of the pre-replicative complex |
| 0.1 | 0.8 | REACTOME ASSOCIATION OF LICENSING FACTORS WITH THE PRE REPLICATIVE COMPLEX | Genes involved in Association of licensing factors with the pre-replicative complex |
| 0.1 | 1.8 | REACTOME REGULATION OF PYRUVATE DEHYDROGENASE PDH COMPLEX | Genes involved in Regulation of pyruvate dehydrogenase (PDH) complex |
| 0.1 | 0.8 | REACTOME RECEPTOR LIGAND BINDING INITIATES THE SECOND PROTEOLYTIC CLEAVAGE OF NOTCH RECEPTOR | Genes involved in Receptor-ligand binding initiates the second proteolytic cleavage of Notch receptor |
| 0.1 | 0.5 | REACTOME REGULATION OF THE FANCONI ANEMIA PATHWAY | Genes involved in Regulation of the Fanconi anemia pathway |
| 0.1 | 1.2 | REACTOME G1 S SPECIFIC TRANSCRIPTION | Genes involved in G1/S-Specific Transcription |
| 0.1 | 2.9 | REACTOME BASIGIN INTERACTIONS | Genes involved in Basigin interactions |
| 0.1 | 1.0 | REACTOME G0 AND EARLY G1 | Genes involved in G0 and Early G1 |
| 0.1 | 0.3 | REACTOME PROCESSIVE SYNTHESIS ON THE LAGGING STRAND | Genes involved in Processive synthesis on the lagging strand |
| 0.1 | 0.7 | REACTOME SOS MEDIATED SIGNALLING | Genes involved in SOS-mediated signalling |
| 0.0 | 1.2 | REACTOME REGULATION OF KIT SIGNALING | Genes involved in Regulation of KIT signaling |
| 0.0 | 0.3 | REACTOME SPRY REGULATION OF FGF SIGNALING | Genes involved in Spry regulation of FGF signaling |
| 0.0 | 0.5 | REACTOME APOPTOSIS INDUCED DNA FRAGMENTATION | Genes involved in Apoptosis induced DNA fragmentation |
| 0.0 | 0.7 | REACTOME KINESINS | Genes involved in Kinesins |
| 0.0 | 0.3 | REACTOME FANCONI ANEMIA PATHWAY | Genes involved in Fanconi Anemia pathway |
| 0.0 | 0.5 | REACTOME TRANSPORT OF RIBONUCLEOPROTEINS INTO THE HOST NUCLEUS | Genes involved in Transport of Ribonucleoproteins into the Host Nucleus |
| 0.0 | 0.1 | REACTOME CTNNB1 PHOSPHORYLATION CASCADE | Genes involved in Beta-catenin phosphorylation cascade |
| 0.0 | 1.4 | REACTOME MITOTIC PROMETAPHASE | Genes involved in Mitotic Prometaphase |
| 0.0 | 0.4 | REACTOME RNA POL I TRANSCRIPTION | Genes involved in RNA Polymerase I Transcription |
| 0.0 | 0.4 | REACTOME CHONDROITIN SULFATE BIOSYNTHESIS | Genes involved in Chondroitin sulfate biosynthesis |
| 0.0 | 0.7 | REACTOME TRANSPORT TO THE GOLGI AND SUBSEQUENT MODIFICATION | Genes involved in Transport to the Golgi and subsequent modification |
| 0.0 | 0.2 | REACTOME ACTIVATION OF ATR IN RESPONSE TO REPLICATION STRESS | Genes involved in Activation of ATR in response to replication stress |
| 0.0 | 0.4 | REACTOME CHONDROITIN SULFATE DERMATAN SULFATE METABOLISM | Genes involved in Chondroitin sulfate/dermatan sulfate metabolism |