Project
Epithelial-Mesenchymal Transition, human (Scheel, 2011)
Navigation
Downloads
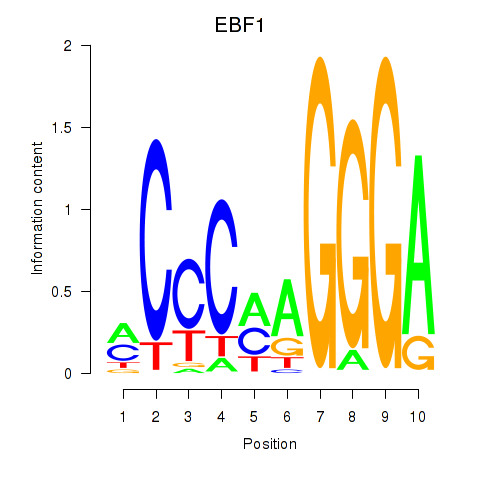
Results for EBF1
Z-value: 1.94
Motif logo
Transcription factors associated with EBF1
| Gene Symbol | Gene ID | Gene Info |
|---|---|---|
|
EBF1
|
ENSG00000164330.12 | EBF1 |
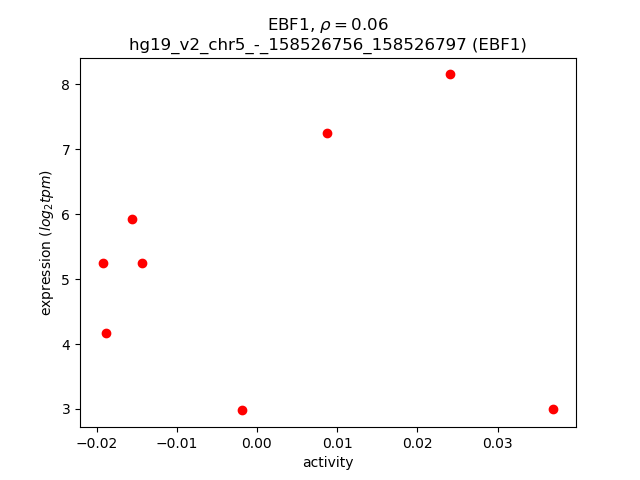
Activity-expression correlation:
| Gene | Promoter | Pearson corr. coef. | P-value | Plot |
|---|---|---|---|---|
| EBF1 | hg19_v2_chr5_-_158526756_158526797 | 0.06 | 8.8e-01 | Click! |
Activity profile of EBF1 motif
Sorted Z-values of EBF1 motif
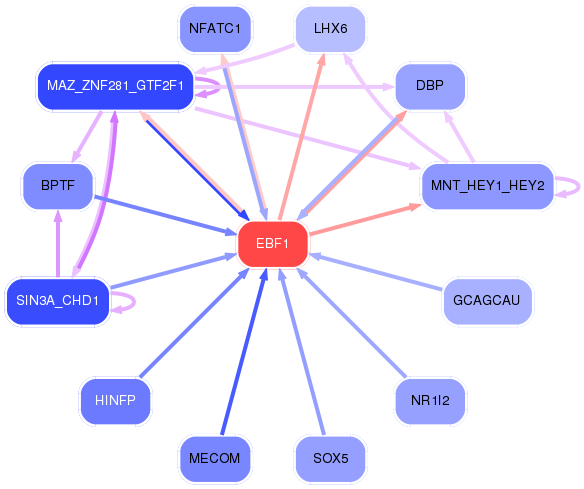
Network of associatons between targets according to the STRING database.

First level regulatory network of EBF1
| Promoter | Score | Transcript | Gene | Gene Info |
|---|---|---|---|---|
| chr14_-_22005018 | 2.02 |
ENST00000546363.1 |
SALL2 |
spalt-like transcription factor 2 |
| chr19_-_51456198 | 1.76 |
ENST00000594846.1 |
KLK5 |
kallikrein-related peptidase 5 |
| chr19_-_51456321 | 1.45 |
ENST00000391809.2 |
KLK5 |
kallikrein-related peptidase 5 |
| chr14_-_22005062 | 1.35 |
ENST00000317492.5 |
SALL2 |
spalt-like transcription factor 2 |
| chr19_-_51456344 | 1.24 |
ENST00000336334.3 ENST00000593428.1 |
KLK5 |
kallikrein-related peptidase 5 |
| chr8_+_22436248 | 1.23 |
ENST00000308354.7 |
PDLIM2 |
PDZ and LIM domain 2 (mystique) |
| chr19_+_35606692 | 1.19 |
ENST00000406242.3 ENST00000454903.2 |
FXYD3 |
FXYD domain containing ion transport regulator 3 |
| chr15_+_41136586 | 1.14 |
ENST00000431806.1 |
SPINT1 |
serine peptidase inhibitor, Kunitz type 1 |
| chr16_-_68269971 | 1.13 |
ENST00000565858.1 |
ESRP2 |
epithelial splicing regulatory protein 2 |
| chr19_+_35739897 | 1.12 |
ENST00000605618.1 ENST00000427250.1 ENST00000601623.1 |
LSR |
lipolysis stimulated lipoprotein receptor |
| chr19_+_35739631 | 1.09 |
ENST00000602003.1 ENST00000360798.3 ENST00000354900.3 |
LSR |
lipolysis stimulated lipoprotein receptor |
| chr19_+_35739782 | 1.06 |
ENST00000347609.4 |
LSR |
lipolysis stimulated lipoprotein receptor |
| chr17_+_48609903 | 1.06 |
ENST00000268933.3 |
EPN3 |
epsin 3 |
| chr2_+_89890533 | 1.06 |
ENST00000429992.2 |
IGKV2D-40 |
immunoglobulin kappa variable 2D-40 |
| chr12_-_53298841 | 1.03 |
ENST00000293308.6 |
KRT8 |
keratin 8 |
| chr11_-_72504681 | 0.99 |
ENST00000538536.1 ENST00000543304.1 ENST00000540587.1 ENST00000334805.6 |
STARD10 |
StAR-related lipid transfer (START) domain containing 10 |
| chr1_+_209602156 | 0.96 |
ENST00000429156.1 ENST00000366437.3 ENST00000603283.1 ENST00000431096.1 |
MIR205HG |
MIR205 host gene (non-protein coding) |
| chr1_+_2005425 | 0.95 |
ENST00000461106.2 |
PRKCZ |
protein kinase C, zeta |
| chr17_-_39677971 | 0.92 |
ENST00000393976.2 |
KRT15 |
keratin 15 |
| chr14_-_22005343 | 0.91 |
ENST00000327430.3 |
SALL2 |
spalt-like transcription factor 2 |
| chr7_+_26331541 | 0.89 |
ENST00000416246.1 ENST00000338523.4 ENST00000412416.1 |
SNX10 |
sorting nexin 10 |
| chr20_+_58296265 | 0.88 |
ENST00000395636.2 ENST00000361300.4 |
PHACTR3 |
phosphatase and actin regulator 3 |
| chr4_-_90758227 | 0.86 |
ENST00000506691.1 ENST00000394986.1 ENST00000506244.1 ENST00000394989.2 ENST00000394991.3 |
SNCA |
synuclein, alpha (non A4 component of amyloid precursor) |
| chr1_+_86889769 | 0.84 |
ENST00000370565.4 |
CLCA2 |
chloride channel accessory 2 |
| chr19_+_35606777 | 0.84 |
ENST00000604404.1 ENST00000435734.2 ENST00000603181.1 |
FXYD3 |
FXYD domain containing ion transport regulator 3 |
| chr6_+_30850697 | 0.84 |
ENST00000509639.1 ENST00000412274.2 ENST00000507901.1 ENST00000507046.1 ENST00000437124.2 ENST00000454612.2 ENST00000396342.2 |
DDR1 |
discoidin domain receptor tyrosine kinase 1 |
| chr1_-_6545502 | 0.84 |
ENST00000535355.1 |
PLEKHG5 |
pleckstrin homology domain containing, family G (with RhoGef domain) member 5 |
| chr10_-_116286656 | 0.83 |
ENST00000428430.1 ENST00000369266.3 ENST00000392952.3 |
ABLIM1 |
actin binding LIM protein 1 |
| chr2_+_233925064 | 0.83 |
ENST00000359570.5 ENST00000538935.1 |
INPP5D |
inositol polyphosphate-5-phosphatase, 145kDa |
| chr6_+_27215494 | 0.81 |
ENST00000230582.3 |
PRSS16 |
protease, serine, 16 (thymus) |
| chr6_+_150464155 | 0.81 |
ENST00000361131.4 |
PPP1R14C |
protein phosphatase 1, regulatory (inhibitor) subunit 14C |
| chr1_+_156117149 | 0.80 |
ENST00000435124.1 |
SEMA4A |
sema domain, immunoglobulin domain (Ig), transmembrane domain (TM) and short cytoplasmic domain, (semaphorin) 4A |
| chr1_+_6086380 | 0.80 |
ENST00000602612.1 ENST00000378087.3 ENST00000341524.1 ENST00000352527.1 |
KCNAB2 |
potassium voltage-gated channel, shaker-related subfamily, beta member 2 |
| chr2_+_220325977 | 0.80 |
ENST00000396686.1 ENST00000396689.2 |
SPEG |
SPEG complex locus |
| chr17_-_73874654 | 0.77 |
ENST00000254816.2 |
TRIM47 |
tripartite motif containing 47 |
| chr12_-_54778471 | 0.75 |
ENST00000550120.1 ENST00000394313.2 ENST00000547210.1 |
ZNF385A |
zinc finger protein 385A |
| chr4_-_90758118 | 0.74 |
ENST00000420646.2 |
SNCA |
synuclein, alpha (non A4 component of amyloid precursor) |
| chr6_+_36098262 | 0.74 |
ENST00000373761.6 ENST00000373766.5 |
MAPK13 |
mitogen-activated protein kinase 13 |
| chr19_-_49565254 | 0.74 |
ENST00000593537.1 |
NTF4 |
neurotrophin 4 |
| chr10_+_48355024 | 0.73 |
ENST00000395702.2 ENST00000442001.1 ENST00000433077.1 ENST00000436850.1 ENST00000494156.1 ENST00000586537.1 |
ZNF488 |
zinc finger protein 488 |
| chr11_+_1860200 | 0.72 |
ENST00000381911.1 |
TNNI2 |
troponin I type 2 (skeletal, fast) |
| chr1_+_14925173 | 0.72 |
ENST00000376030.2 ENST00000503743.1 ENST00000422387.2 |
KAZN |
kazrin, periplakin interacting protein |
| chr19_+_35739597 | 0.72 |
ENST00000361790.3 |
LSR |
lipolysis stimulated lipoprotein receptor |
| chr1_-_32801825 | 0.71 |
ENST00000329421.7 |
MARCKSL1 |
MARCKS-like 1 |
| chr19_+_45281118 | 0.71 |
ENST00000270279.3 ENST00000341505.4 |
CBLC |
Cbl proto-oncogene C, E3 ubiquitin protein ligase |
| chr9_-_117111222 | 0.71 |
ENST00000374079.4 |
AKNA |
AT-hook transcription factor |
| chr15_+_40532058 | 0.70 |
ENST00000260404.4 |
PAK6 |
p21 protein (Cdc42/Rac)-activated kinase 6 |
| chr19_+_35607166 | 0.70 |
ENST00000604255.1 ENST00000346446.5 ENST00000344013.6 ENST00000603449.1 ENST00000406988.1 ENST00000605550.1 ENST00000604804.1 ENST00000605552.1 |
FXYD3 |
FXYD domain containing ion transport regulator 3 |
| chr19_-_51487282 | 0.70 |
ENST00000595820.1 ENST00000597707.1 ENST00000336317.4 |
KLK7 |
kallikrein-related peptidase 7 |
| chr9_+_35673853 | 0.69 |
ENST00000378357.4 |
CA9 |
carbonic anhydrase IX |
| chr16_-_85784718 | 0.69 |
ENST00000602766.1 |
C16orf74 |
chromosome 16 open reading frame 74 |
| chr14_-_105635090 | 0.69 |
ENST00000331782.3 ENST00000347004.2 |
JAG2 |
jagged 2 |
| chr16_-_67260691 | 0.69 |
ENST00000447579.1 ENST00000393992.1 ENST00000424285.1 |
LRRC29 |
leucine rich repeat containing 29 |
| chr4_-_10041872 | 0.68 |
ENST00000309065.3 |
SLC2A9 |
solute carrier family 2 (facilitated glucose transporter), member 9 |
| chr10_-_105212059 | 0.68 |
ENST00000260743.5 |
CALHM2 |
calcium homeostasis modulator 2 |
| chr1_+_44401479 | 0.68 |
ENST00000438616.3 |
ARTN |
artemin |
| chr20_+_138089 | 0.68 |
ENST00000382388.3 |
DEFB127 |
defensin, beta 127 |
| chr18_-_28682374 | 0.67 |
ENST00000280904.6 |
DSC2 |
desmocollin 2 |
| chr19_+_45312347 | 0.67 |
ENST00000270233.6 ENST00000591520.1 |
BCAM |
basal cell adhesion molecule (Lutheran blood group) |
| chr1_-_153363452 | 0.66 |
ENST00000368732.1 ENST00000368733.3 |
S100A8 |
S100 calcium binding protein A8 |
| chr6_+_30848557 | 0.66 |
ENST00000460944.2 ENST00000324771.8 |
DDR1 |
discoidin domain receptor tyrosine kinase 1 |
| chr1_+_1981890 | 0.65 |
ENST00000378567.3 ENST00000468310.1 |
PRKCZ |
protein kinase C, zeta |
| chr1_+_6086354 | 0.65 |
ENST00000389632.4 ENST00000428161.1 |
KCNAB2 |
potassium voltage-gated channel, shaker-related subfamily, beta member 2 |
| chr11_+_1855645 | 0.65 |
ENST00000381968.3 ENST00000381978.3 |
SYT8 |
synaptotagmin VIII |
| chr11_+_1860832 | 0.64 |
ENST00000252898.7 |
TNNI2 |
troponin I type 2 (skeletal, fast) |
| chr11_-_119999611 | 0.64 |
ENST00000529044.1 |
TRIM29 |
tripartite motif containing 29 |
| chr12_+_10365404 | 0.64 |
ENST00000266458.5 ENST00000421801.2 ENST00000544284.1 ENST00000545047.1 ENST00000543602.1 ENST00000545887.1 |
GABARAPL1 |
GABA(A) receptor-associated protein like 1 |
| chr14_-_61747949 | 0.64 |
ENST00000355702.2 |
TMEM30B |
transmembrane protein 30B |
| chr6_+_33043703 | 0.64 |
ENST00000418931.2 ENST00000535465.1 |
HLA-DPB1 |
major histocompatibility complex, class II, DP beta 1 |
| chr4_-_90757364 | 0.63 |
ENST00000508895.1 |
SNCA |
synuclein, alpha (non A4 component of amyloid precursor) |
| chr15_+_74218787 | 0.63 |
ENST00000261921.7 |
LOXL1 |
lysyl oxidase-like 1 |
| chr11_-_104916034 | 0.63 |
ENST00000528513.1 ENST00000375706.2 ENST00000375704.3 |
CARD16 |
caspase recruitment domain family, member 16 |
| chr22_-_20231207 | 0.63 |
ENST00000425986.1 |
RTN4R |
reticulon 4 receptor |
| chr19_-_14945933 | 0.63 |
ENST00000322301.3 |
OR7A5 |
olfactory receptor, family 7, subfamily A, member 5 |
| chr19_+_751122 | 0.62 |
ENST00000215582.6 |
MISP |
mitotic spindle positioning |
| chr19_-_6720686 | 0.62 |
ENST00000245907.6 |
C3 |
complement component 3 |
| chr4_-_186877502 | 0.62 |
ENST00000431902.1 ENST00000284776.7 ENST00000415274.1 |
SORBS2 |
sorbin and SH3 domain containing 2 |
| chr1_-_156217875 | 0.62 |
ENST00000292291.5 |
PAQR6 |
progestin and adipoQ receptor family member VI |
| chr11_-_119999539 | 0.62 |
ENST00000541857.1 |
TRIM29 |
tripartite motif containing 29 |
| chr12_+_7055767 | 0.61 |
ENST00000447931.2 |
PTPN6 |
protein tyrosine phosphatase, non-receptor type 6 |
| chr10_-_105212141 | 0.61 |
ENST00000369788.3 |
CALHM2 |
calcium homeostasis modulator 2 |
| chr11_-_34535332 | 0.60 |
ENST00000257832.2 ENST00000429939.2 |
ELF5 |
E74-like factor 5 (ets domain transcription factor) |
| chr1_-_161008697 | 0.60 |
ENST00000318289.10 ENST00000368023.3 ENST00000368024.1 ENST00000423014.2 |
TSTD1 |
thiosulfate sulfurtransferase (rhodanese)-like domain containing 1 |
| chr12_+_7055631 | 0.59 |
ENST00000543115.1 ENST00000399448.1 |
PTPN6 |
protein tyrosine phosphatase, non-receptor type 6 |
| chr16_+_57662138 | 0.59 |
ENST00000562414.1 ENST00000561969.1 ENST00000562631.1 ENST00000563445.1 ENST00000565338.1 ENST00000567702.1 |
GPR56 |
G protein-coupled receptor 56 |
| chr11_-_87908600 | 0.59 |
ENST00000531138.1 ENST00000526372.1 ENST00000243662.6 |
RAB38 |
RAB38, member RAS oncogene family |
| chr2_+_223289208 | 0.59 |
ENST00000321276.7 |
SGPP2 |
sphingosine-1-phosphate phosphatase 2 |
| chr1_-_242612779 | 0.58 |
ENST00000427495.1 |
PLD5 |
phospholipase D family, member 5 |
| chr17_-_34122596 | 0.58 |
ENST00000250144.8 |
MMP28 |
matrix metallopeptidase 28 |
| chr8_+_22436635 | 0.58 |
ENST00000452226.1 ENST00000397760.4 ENST00000339162.7 ENST00000397761.2 |
PDLIM2 |
PDZ and LIM domain 2 (mystique) |
| chr2_-_31361543 | 0.58 |
ENST00000349752.5 |
GALNT14 |
UDP-N-acetyl-alpha-D-galactosamine:polypeptide N-acetylgalactosaminyltransferase 14 (GalNAc-T14) |
| chr16_+_68678892 | 0.58 |
ENST00000429102.2 |
CDH3 |
cadherin 3, type 1, P-cadherin (placental) |
| chr1_-_159915386 | 0.57 |
ENST00000361509.3 ENST00000368094.1 |
IGSF9 |
immunoglobulin superfamily, member 9 |
| chr3_-_165555200 | 0.57 |
ENST00000479451.1 ENST00000540653.1 ENST00000488954.1 ENST00000264381.3 |
BCHE |
butyrylcholinesterase |
| chr1_-_44497118 | 0.57 |
ENST00000537678.1 ENST00000466926.1 |
SLC6A9 |
solute carrier family 6 (neurotransmitter transporter, glycine), member 9 |
| chr17_-_39780819 | 0.56 |
ENST00000311208.8 |
KRT17 |
keratin 17 |
| chr17_-_39674668 | 0.56 |
ENST00000393981.3 |
KRT15 |
keratin 15 |
| chr1_-_156217822 | 0.56 |
ENST00000368270.1 |
PAQR6 |
progestin and adipoQ receptor family member VI |
| chr5_+_176237478 | 0.56 |
ENST00000329542.4 |
UNC5A |
unc-5 homolog A (C. elegans) |
| chr1_-_156217829 | 0.56 |
ENST00000356983.2 ENST00000335852.1 ENST00000340183.5 ENST00000540423.1 |
PAQR6 |
progestin and adipoQ receptor family member VI |
| chr6_+_30851840 | 0.55 |
ENST00000511510.1 ENST00000376569.3 ENST00000376575.3 ENST00000376570.4 ENST00000446312.1 ENST00000504927.1 |
DDR1 |
discoidin domain receptor tyrosine kinase 1 |
| chr15_+_43886057 | 0.55 |
ENST00000441322.1 ENST00000413657.2 ENST00000453733.1 |
CKMT1B |
creatine kinase, mitochondrial 1B |
| chr7_+_145813453 | 0.55 |
ENST00000361727.3 |
CNTNAP2 |
contactin associated protein-like 2 |
| chr17_-_39928106 | 0.54 |
ENST00000540235.1 |
JUP |
junction plakoglobin |
| chr17_-_7193711 | 0.54 |
ENST00000571464.1 |
YBX2 |
Y box binding protein 2 |
| chr8_+_22438009 | 0.54 |
ENST00000409417.1 |
PDLIM2 |
PDZ and LIM domain 2 (mystique) |
| chr1_-_27286897 | 0.53 |
ENST00000320567.5 |
C1orf172 |
chromosome 1 open reading frame 172 |
| chr1_+_15256230 | 0.53 |
ENST00000376028.4 ENST00000400798.2 |
KAZN |
kazrin, periplakin interacting protein |
| chr19_-_55652290 | 0.53 |
ENST00000589745.1 |
TNNT1 |
troponin T type 1 (skeletal, slow) |
| chr1_-_935491 | 0.53 |
ENST00000304952.6 |
HES4 |
hes family bHLH transcription factor 4 |
| chr19_+_18496957 | 0.52 |
ENST00000252809.3 |
GDF15 |
growth differentiation factor 15 |
| chr19_+_17337473 | 0.52 |
ENST00000598068.1 |
OCEL1 |
occludin/ELL domain containing 1 |
| chr15_+_43885252 | 0.52 |
ENST00000453782.1 ENST00000300283.6 ENST00000437924.1 ENST00000450086.2 |
CKMT1B |
creatine kinase, mitochondrial 1B |
| chr2_+_182321925 | 0.51 |
ENST00000339307.4 ENST00000397033.2 |
ITGA4 |
integrin, alpha 4 (antigen CD49D, alpha 4 subunit of VLA-4 receptor) |
| chr15_+_43985725 | 0.51 |
ENST00000413453.2 |
CKMT1A |
creatine kinase, mitochondrial 1A |
| chr15_+_43985084 | 0.51 |
ENST00000434505.1 ENST00000411750.1 |
CKMT1A |
creatine kinase, mitochondrial 1A |
| chrX_-_24665208 | 0.50 |
ENST00000356768.4 |
PCYT1B |
phosphate cytidylyltransferase 1, choline, beta |
| chr8_+_82644669 | 0.50 |
ENST00000297265.4 |
CHMP4C |
charged multivesicular body protein 4C |
| chrX_-_102565858 | 0.50 |
ENST00000449185.1 ENST00000536889.1 |
BEX2 |
brain expressed X-linked 2 |
| chr1_-_207206092 | 0.50 |
ENST00000359470.5 ENST00000461135.2 |
C1orf116 |
chromosome 1 open reading frame 116 |
| chr11_+_121447469 | 0.50 |
ENST00000532694.1 ENST00000534286.1 |
SORL1 |
sortilin-related receptor, L(DLR class) A repeats containing |
| chr8_-_80680078 | 0.49 |
ENST00000337919.5 ENST00000354724.3 |
HEY1 |
hes-related family bHLH transcription factor with YRPW motif 1 |
| chr6_+_80341000 | 0.49 |
ENST00000369838.4 |
SH3BGRL2 |
SH3 domain binding glutamic acid-rich protein like 2 |
| chr13_+_37005967 | 0.49 |
ENST00000440264.1 ENST00000449823.1 |
CCNA1 |
cyclin A1 |
| chr16_+_618837 | 0.49 |
ENST00000409439.2 |
PIGQ |
phosphatidylinositol glycan anchor biosynthesis, class Q |
| chr15_-_83378611 | 0.49 |
ENST00000542200.1 |
AP3B2 |
adaptor-related protein complex 3, beta 2 subunit |
| chr11_-_119991589 | 0.49 |
ENST00000526881.1 |
TRIM29 |
tripartite motif containing 29 |
| chr6_+_36097992 | 0.48 |
ENST00000211287.4 |
MAPK13 |
mitogen-activated protein kinase 13 |
| chr9_+_93564039 | 0.48 |
ENST00000375754.4 ENST00000375751.4 |
SYK |
spleen tyrosine kinase |
| chr22_-_45559540 | 0.48 |
ENST00000432502.1 |
CTA-217C2.1 |
CTA-217C2.1 |
| chr8_-_19459993 | 0.48 |
ENST00000454498.2 ENST00000520003.1 |
CSGALNACT1 |
chondroitin sulfate N-acetylgalactosaminyltransferase 1 |
| chrX_-_102565932 | 0.47 |
ENST00000372674.1 ENST00000372677.3 |
BEX2 |
brain expressed X-linked 2 |
| chr19_+_44081344 | 0.47 |
ENST00000599207.1 |
PINLYP |
phospholipase A2 inhibitor and LY6/PLAUR domain containing |
| chr13_+_113030625 | 0.47 |
ENST00000283550.3 |
SPACA7 |
sperm acrosome associated 7 |
| chr15_+_81591757 | 0.47 |
ENST00000558332.1 |
IL16 |
interleukin 16 |
| chr22_+_24990746 | 0.47 |
ENST00000456869.1 ENST00000411974.1 |
GGT1 |
gamma-glutamyltransferase 1 |
| chr16_-_85784557 | 0.47 |
ENST00000602675.1 |
C16orf74 |
chromosome 16 open reading frame 74 |
| chr1_+_6105974 | 0.47 |
ENST00000378083.3 |
KCNAB2 |
potassium voltage-gated channel, shaker-related subfamily, beta member 2 |
| chr16_-_85784634 | 0.47 |
ENST00000284245.4 ENST00000602914.1 |
C16orf74 |
chromosome 16 open reading frame 74 |
| chr16_+_3115611 | 0.47 |
ENST00000530890.1 ENST00000444393.3 ENST00000533097.2 ENST00000008180.9 ENST00000396890.2 ENST00000525228.1 ENST00000548652.1 ENST00000525377.2 ENST00000530538.2 ENST00000549213.1 ENST00000552936.1 ENST00000548476.1 ENST00000552664.1 ENST00000552356.1 ENST00000551513.1 ENST00000382213.3 ENST00000548246.1 |
IL32 |
interleukin 32 |
| chr19_-_38743878 | 0.46 |
ENST00000587515.1 |
PPP1R14A |
protein phosphatase 1, regulatory (inhibitor) subunit 14A |
| chr11_-_72504637 | 0.46 |
ENST00000536377.1 ENST00000359373.5 |
STARD10 ARAP1 |
StAR-related lipid transfer (START) domain containing 10 ArfGAP with RhoGAP domain, ankyrin repeat and PH domain 1 |
| chr11_+_56949221 | 0.46 |
ENST00000497933.1 |
LRRC55 |
leucine rich repeat containing 55 |
| chr19_-_55658650 | 0.46 |
ENST00000589226.1 |
TNNT1 |
troponin T type 1 (skeletal, slow) |
| chr14_-_21270995 | 0.46 |
ENST00000555698.1 ENST00000397970.4 ENST00000340900.3 |
RNASE1 |
ribonuclease, RNase A family, 1 (pancreatic) |
| chr1_-_117210290 | 0.46 |
ENST00000369483.1 ENST00000369486.3 |
IGSF3 |
immunoglobulin superfamily, member 3 |
| chr16_+_30751953 | 0.45 |
ENST00000483578.1 |
RP11-2C24.4 |
RP11-2C24.4 |
| chr19_-_49137762 | 0.45 |
ENST00000593500.1 |
DBP |
D site of albumin promoter (albumin D-box) binding protein |
| chr3_-_38691119 | 0.45 |
ENST00000333535.4 ENST00000413689.1 ENST00000443581.1 ENST00000425664.1 ENST00000451551.2 |
SCN5A |
sodium channel, voltage-gated, type V, alpha subunit |
| chr14_+_94640633 | 0.45 |
ENST00000304338.3 |
PPP4R4 |
protein phosphatase 4, regulatory subunit 4 |
| chr1_-_23694794 | 0.45 |
ENST00000374608.3 |
ZNF436 |
zinc finger protein 436 |
| chr13_-_20805109 | 0.44 |
ENST00000241124.6 |
GJB6 |
gap junction protein, beta 6, 30kDa |
| chr15_-_76005170 | 0.44 |
ENST00000308508.5 |
CSPG4 |
chondroitin sulfate proteoglycan 4 |
| chr11_+_66824276 | 0.44 |
ENST00000308831.2 |
RHOD |
ras homolog family member D |
| chr12_-_56882136 | 0.44 |
ENST00000311966.4 |
GLS2 |
glutaminase 2 (liver, mitochondrial) |
| chr4_-_186877806 | 0.44 |
ENST00000355634.5 |
SORBS2 |
sorbin and SH3 domain containing 2 |
| chr15_+_76196234 | 0.44 |
ENST00000540507.1 ENST00000565036.1 ENST00000569054.1 |
FBXO22 |
F-box protein 22 |
| chr14_+_96671016 | 0.43 |
ENST00000542454.2 ENST00000554311.1 ENST00000306005.3 ENST00000539359.1 ENST00000553811.1 |
BDKRB2 RP11-404P21.8 |
bradykinin receptor B2 Uncharacterized protein |
| chr1_+_11724167 | 0.43 |
ENST00000376753.4 |
FBXO6 |
F-box protein 6 |
| chr4_+_81118647 | 0.43 |
ENST00000415738.2 |
PRDM8 |
PR domain containing 8 |
| chr2_-_113594279 | 0.43 |
ENST00000416750.1 ENST00000418817.1 ENST00000263341.2 |
IL1B |
interleukin 1, beta |
| chr4_+_1795012 | 0.43 |
ENST00000481110.2 ENST00000340107.4 ENST00000440486.2 ENST00000412135.2 |
FGFR3 |
fibroblast growth factor receptor 3 |
| chr3_-_13921594 | 0.42 |
ENST00000285018.4 |
WNT7A |
wingless-type MMTV integration site family, member 7A |
| chr11_-_34535297 | 0.42 |
ENST00000532417.1 |
ELF5 |
E74-like factor 5 (ets domain transcription factor) |
| chr14_+_22458631 | 0.42 |
ENST00000390444.1 |
TRAV16 |
T cell receptor alpha variable 16 |
| chr1_-_28503693 | 0.42 |
ENST00000373857.3 |
PTAFR |
platelet-activating factor receptor |
| chr16_+_2867228 | 0.42 |
ENST00000005995.3 ENST00000574813.1 |
PRSS21 |
protease, serine, 21 (testisin) |
| chr1_-_21059029 | 0.42 |
ENST00000444387.2 ENST00000375031.1 ENST00000518294.1 |
SH2D5 |
SH2 domain containing 5 |
| chr16_+_2867164 | 0.42 |
ENST00000455114.1 ENST00000450020.3 |
PRSS21 |
protease, serine, 21 (testisin) |
| chr1_-_108507631 | 0.42 |
ENST00000527011.1 ENST00000370056.4 |
VAV3 |
vav 3 guanine nucleotide exchange factor |
| chr1_-_175161890 | 0.42 |
ENST00000545251.2 ENST00000423313.1 |
KIAA0040 |
KIAA0040 |
| chr17_-_4463856 | 0.41 |
ENST00000574584.1 ENST00000381550.3 ENST00000301395.3 |
GGT6 |
gamma-glutamyltransferase 6 |
| chr1_-_44497024 | 0.41 |
ENST00000372306.3 ENST00000372310.3 ENST00000475075.2 |
SLC6A9 |
solute carrier family 6 (neurotransmitter transporter, glycine), member 9 |
| chr2_-_31360887 | 0.41 |
ENST00000420311.2 ENST00000356174.3 ENST00000324589.5 |
GALNT14 |
UDP-N-acetyl-alpha-D-galactosamine:polypeptide N-acetylgalactosaminyltransferase 14 (GalNAc-T14) |
| chr6_+_31895467 | 0.41 |
ENST00000556679.1 ENST00000456570.1 |
CFB CFB |
complement factor B Complement factor B; Uncharacterized protein; cDNA FLJ55673, highly similar to Complement factor B |
| chr12_-_87232644 | 0.41 |
ENST00000549405.2 |
MGAT4C |
mannosyl (alpha-1,3-)-glycoprotein beta-1,4-N-acetylglucosaminyltransferase, isozyme C (putative) |
| chr1_+_26869597 | 0.40 |
ENST00000530003.1 |
RPS6KA1 |
ribosomal protein S6 kinase, 90kDa, polypeptide 1 |
| chr10_-_116286563 | 0.40 |
ENST00000369253.2 |
ABLIM1 |
actin binding LIM protein 1 |
| chr17_+_9548845 | 0.40 |
ENST00000570475.1 ENST00000285199.7 |
USP43 |
ubiquitin specific peptidase 43 |
| chr22_+_23161491 | 0.40 |
ENST00000390316.2 |
IGLV3-9 |
immunoglobulin lambda variable 3-9 (gene/pseudogene) |
| chr12_-_52911718 | 0.40 |
ENST00000548409.1 |
KRT5 |
keratin 5 |
| chr1_+_20915409 | 0.40 |
ENST00000375071.3 |
CDA |
cytidine deaminase |
| chr11_+_45944190 | 0.40 |
ENST00000401752.1 ENST00000389968.3 ENST00000325468.5 ENST00000536139.1 |
GYLTL1B |
glycosyltransferase-like 1B |
| chrX_+_102469997 | 0.39 |
ENST00000372695.5 ENST00000372691.3 |
BEX4 |
brain expressed, X-linked 4 |
| chr19_-_11688447 | 0.39 |
ENST00000590420.1 |
ACP5 |
acid phosphatase 5, tartrate resistant |
| chr1_-_156786634 | 0.39 |
ENST00000392306.2 ENST00000368199.3 |
SH2D2A |
SH2 domain containing 2A |
| chr22_+_40390930 | 0.39 |
ENST00000333407.6 |
FAM83F |
family with sequence similarity 83, member F |
| chr14_+_24867992 | 0.39 |
ENST00000382554.3 |
NYNRIN |
NYN domain and retroviral integrase containing |
| chr22_+_20748405 | 0.39 |
ENST00000400451.2 ENST00000403682.3 ENST00000357502.5 |
ZNF74 |
zinc finger protein 74 |
| chrX_-_31285042 | 0.39 |
ENST00000378680.2 ENST00000378723.3 |
DMD |
dystrophin |
| chr17_-_46507537 | 0.39 |
ENST00000336915.6 |
SKAP1 |
src kinase associated phosphoprotein 1 |
| chr17_+_78388959 | 0.39 |
ENST00000518137.1 ENST00000520367.1 ENST00000523999.1 ENST00000323854.5 ENST00000522751.1 |
ENDOV |
endonuclease V |
| chr12_+_26274917 | 0.39 |
ENST00000538142.1 |
SSPN |
sarcospan |
| chr12_-_49259643 | 0.39 |
ENST00000309739.5 |
RND1 |
Rho family GTPase 1 |
| chr12_+_72056773 | 0.39 |
ENST00000308086.2 |
THAP2 |
THAP domain containing, apoptosis associated protein 2 |
| chr22_+_20748456 | 0.38 |
ENST00000420626.1 ENST00000356671.5 |
ZNF74 |
zinc finger protein 74 |
| chr8_+_136470270 | 0.38 |
ENST00000524199.1 |
KHDRBS3 |
KH domain containing, RNA binding, signal transduction associated 3 |
| chr19_-_4454081 | 0.38 |
ENST00000591919.1 |
UBXN6 |
UBX domain protein 6 |
| chr17_-_42200996 | 0.38 |
ENST00000587135.1 ENST00000225983.6 ENST00000393622.2 ENST00000588703.1 |
HDAC5 |
histone deacetylase 5 |
| chr3_-_190040223 | 0.38 |
ENST00000295522.3 |
CLDN1 |
claudin 1 |
Gene Ontology Analysis
Gene overrepresentation in biological_process category:
| Log-likelihood per target | Total log-likelihood | Term | Description |
|---|---|---|---|
| 0.9 | 5.1 | GO:0002225 | positive regulation of antimicrobial peptide production(GO:0002225) positive regulation of antimicrobial humoral response(GO:0002760) positive regulation of antibacterial peptide production(GO:0002803) |
| 0.8 | 4.0 | GO:1904274 | tricellular tight junction assembly(GO:1904274) |
| 0.4 | 2.2 | GO:1903282 | negative regulation of dopamine uptake involved in synaptic transmission(GO:0051585) norepinephrine uptake(GO:0051620) regulation of norepinephrine uptake(GO:0051621) negative regulation of norepinephrine uptake(GO:0051622) negative regulation of catecholamine uptake involved in synaptic transmission(GO:0051945) regulation of glutathione peroxidase activity(GO:1903282) positive regulation of glutathione peroxidase activity(GO:1903284) positive regulation of hydrogen peroxide catabolic process(GO:1903285) positive regulation of peroxidase activity(GO:2000470) |
| 0.3 | 1.0 | GO:0061536 | glycine secretion(GO:0061536) glycine secretion, neurotransmission(GO:0061537) |
| 0.3 | 1.2 | GO:0033277 | abortive mitotic cell cycle(GO:0033277) |
| 0.3 | 0.8 | GO:0045658 | regulation of neutrophil differentiation(GO:0045658) negative regulation of neutrophil differentiation(GO:0045659) |
| 0.3 | 1.9 | GO:0070995 | NADPH oxidation(GO:0070995) |
| 0.2 | 0.9 | GO:0030037 | actin filament reorganization involved in cell cycle(GO:0030037) |
| 0.2 | 1.2 | GO:0002159 | desmosome assembly(GO:0002159) |
| 0.2 | 1.6 | GO:2001181 | positive regulation of interleukin-10 secretion(GO:2001181) |
| 0.2 | 2.1 | GO:0061302 | smooth muscle cell-matrix adhesion(GO:0061302) |
| 0.2 | 0.6 | GO:0016185 | synaptic vesicle budding from presynaptic endocytic zone membrane(GO:0016185) |
| 0.2 | 0.6 | GO:0001798 | positive regulation of type IIa hypersensitivity(GO:0001798) positive regulation of type II hypersensitivity(GO:0002894) |
| 0.2 | 1.0 | GO:0038018 | Wnt receptor catabolic process(GO:0038018) |
| 0.2 | 0.6 | GO:0051796 | regulation of monophenol monooxygenase activity(GO:0032771) positive regulation of monophenol monooxygenase activity(GO:0032773) negative regulation of catagen(GO:0051796) regulation of hair cycle by canonical Wnt signaling pathway(GO:0060901) positive regulation of melanosome transport(GO:1902910) |
| 0.2 | 0.6 | GO:0014016 | neuroblast differentiation(GO:0014016) |
| 0.2 | 0.6 | GO:0018153 | isopeptide cross-linking via N6-(L-isoglutamyl)-L-lysine(GO:0018153) isopeptide cross-linking(GO:0018262) |
| 0.2 | 0.7 | GO:0048867 | ganglion mother cell fate determination(GO:0007402) stem cell fate determination(GO:0048867) |
| 0.2 | 0.5 | GO:0071109 | superior temporal gyrus development(GO:0071109) |
| 0.2 | 1.0 | GO:0001712 | ectodermal cell fate commitment(GO:0001712) |
| 0.2 | 0.5 | GO:1902955 | regulation of choline O-acetyltransferase activity(GO:1902769) positive regulation of choline O-acetyltransferase activity(GO:1902771) negative regulation of tau-protein kinase activity(GO:1902948) positive regulation of early endosome to recycling endosome transport(GO:1902955) negative regulation of aspartic-type endopeptidase activity involved in amyloid precursor protein catabolic process(GO:1902960) negative regulation of neurofibrillary tangle assembly(GO:1902997) negative regulation of aspartic-type peptidase activity(GO:1905246) |
| 0.2 | 0.3 | GO:0002302 | CD8-positive, alpha-beta T cell differentiation involved in immune response(GO:0002302) |
| 0.2 | 0.9 | GO:1903238 | positive regulation of leukocyte tethering or rolling(GO:1903238) |
| 0.2 | 0.5 | GO:0002337 | B-1a B cell differentiation(GO:0002337) |
| 0.1 | 0.7 | GO:1902162 | mRNA localization resulting in posttranscriptional regulation of gene expression(GO:0010609) regulation of DNA damage response, signal transduction by p53 class mediator resulting in transcription of p21 class mediator(GO:1902162) positive regulation of DNA damage response, signal transduction by p53 class mediator resulting in transcription of p21 class mediator(GO:1902164) |
| 0.1 | 0.6 | GO:0071469 | detection of mechanical stimulus involved in sensory perception of touch(GO:0050976) cellular response to alkaline pH(GO:0071469) |
| 0.1 | 0.4 | GO:0060557 | positive regulation of vitamin metabolic process(GO:0046136) positive regulation of vitamin D biosynthetic process(GO:0060557) positive regulation of calcidiol 1-monooxygenase activity(GO:0060559) |
| 0.1 | 0.4 | GO:0031133 | regulation of axon diameter(GO:0031133) |
| 0.1 | 0.4 | GO:0019858 | cytosine metabolic process(GO:0019858) |
| 0.1 | 0.7 | GO:0061146 | Peyer's patch morphogenesis(GO:0061146) lymphocyte migration into lymphoid organs(GO:0097021) |
| 0.1 | 0.1 | GO:1902679 | negative regulation of RNA biosynthetic process(GO:1902679) |
| 0.1 | 0.5 | GO:0009386 | translational attenuation(GO:0009386) |
| 0.1 | 0.4 | GO:1903348 | positive regulation of bicellular tight junction assembly(GO:1903348) |
| 0.1 | 0.4 | GO:1904596 | regulation of connective tissue replacement involved in inflammatory response wound healing(GO:1904596) negative regulation of connective tissue replacement involved in inflammatory response wound healing(GO:1904597) regulation of advanced glycation end-product receptor activity(GO:1904603) negative regulation of advanced glycation end-product receptor activity(GO:1904604) negative regulation of connective tissue replacement(GO:1905204) |
| 0.1 | 0.4 | GO:0014724 | regulation of twitch skeletal muscle contraction(GO:0014724) fast-twitch skeletal muscle fiber contraction(GO:0031443) |
| 0.1 | 0.6 | GO:0032929 | negative regulation of superoxide anion generation(GO:0032929) |
| 0.1 | 1.4 | GO:0042492 | gamma-delta T cell differentiation(GO:0042492) |
| 0.1 | 0.7 | GO:0060373 | regulation of ventricular cardiac muscle cell membrane depolarization(GO:0060373) |
| 0.1 | 1.0 | GO:0061669 | spontaneous neurotransmitter secretion(GO:0061669) spontaneous synaptic transmission(GO:0098814) |
| 0.1 | 0.5 | GO:2000820 | negative regulation of transcription from RNA polymerase II promoter involved in smooth muscle cell differentiation(GO:2000820) |
| 0.1 | 0.5 | GO:0002086 | diaphragm contraction(GO:0002086) |
| 0.1 | 0.5 | GO:0050653 | chondroitin sulfate proteoglycan biosynthetic process, polysaccharide chain biosynthetic process(GO:0050653) |
| 0.1 | 0.4 | GO:1903926 | signal transduction involved in intra-S DNA damage checkpoint(GO:0072428) response to bisphenol A(GO:1903925) cellular response to bisphenol A(GO:1903926) |
| 0.1 | 0.1 | GO:0046668 | regulation of retinal cell programmed cell death(GO:0046668) |
| 0.1 | 0.6 | GO:0010760 | negative regulation of macrophage chemotaxis(GO:0010760) |
| 0.1 | 1.0 | GO:0006600 | creatine metabolic process(GO:0006600) |
| 0.1 | 0.3 | GO:0061502 | early endosome to recycling endosome transport(GO:0061502) |
| 0.1 | 0.7 | GO:0086073 | bundle of His cell-Purkinje myocyte adhesion involved in cell communication(GO:0086073) |
| 0.1 | 0.1 | GO:0071394 | cellular response to testosterone stimulus(GO:0071394) |
| 0.1 | 0.5 | GO:0035106 | operant conditioning(GO:0035106) |
| 0.1 | 0.8 | GO:0014721 | voluntary skeletal muscle contraction(GO:0003010) twitch skeletal muscle contraction(GO:0014721) slow-twitch skeletal muscle fiber contraction(GO:0031444) |
| 0.1 | 0.1 | GO:0099545 | trans-synaptic signaling by trans-synaptic complex(GO:0099545) |
| 0.1 | 1.1 | GO:0014809 | regulation of skeletal muscle contraction by regulation of release of sequestered calcium ion(GO:0014809) |
| 0.1 | 0.3 | GO:0021718 | superior olivary nucleus development(GO:0021718) superior olivary nucleus maturation(GO:0021722) |
| 0.1 | 0.3 | GO:0038043 | interleukin-5-mediated signaling pathway(GO:0038043) |
| 0.1 | 0.3 | GO:0006258 | UDP-glucose catabolic process(GO:0006258) galactose catabolic process via UDP-galactose(GO:0033499) |
| 0.1 | 0.4 | GO:1900186 | negative regulation of clathrin-mediated endocytosis(GO:1900186) negative regulation of caveolin-mediated endocytosis(GO:2001287) |
| 0.1 | 1.0 | GO:0032782 | bile acid secretion(GO:0032782) |
| 0.1 | 0.1 | GO:0039689 | negative stranded viral RNA replication(GO:0039689) multi-organism biosynthetic process(GO:0044034) |
| 0.1 | 0.3 | GO:0048633 | positive regulation of skeletal muscle tissue growth(GO:0048633) |
| 0.1 | 0.4 | GO:0030309 | poly-N-acetyllactosamine metabolic process(GO:0030309) |
| 0.1 | 0.3 | GO:1904806 | regulation of protein oxidation(GO:1904806) positive regulation of protein oxidation(GO:1904808) |
| 0.1 | 0.4 | GO:0006543 | glutamine catabolic process(GO:0006543) |
| 0.1 | 0.3 | GO:0021957 | corticospinal tract morphogenesis(GO:0021957) |
| 0.1 | 0.3 | GO:0042137 | sequestering of neurotransmitter(GO:0042137) |
| 0.1 | 0.6 | GO:1903232 | melanosome assembly(GO:1903232) |
| 0.1 | 0.5 | GO:0044878 | mitotic cytokinesis checkpoint(GO:0044878) |
| 0.1 | 0.1 | GO:0019740 | regulation of nitrogen utilization(GO:0006808) nitrogen utilization(GO:0019740) |
| 0.1 | 0.3 | GO:0042360 | vitamin E metabolic process(GO:0042360) |
| 0.1 | 0.3 | GO:0002215 | defense response to nematode(GO:0002215) |
| 0.1 | 0.1 | GO:0060433 | bronchus development(GO:0060433) lobar bronchus epithelium development(GO:0060481) lobar bronchus development(GO:0060482) |
| 0.1 | 0.1 | GO:0046532 | regulation of photoreceptor cell differentiation(GO:0046532) |
| 0.1 | 0.6 | GO:0033564 | anterior/posterior axon guidance(GO:0033564) |
| 0.1 | 0.6 | GO:0071494 | cellular response to UV-C(GO:0071494) |
| 0.1 | 0.2 | GO:0002408 | myeloid dendritic cell chemotaxis(GO:0002408) |
| 0.1 | 0.3 | GO:0090362 | positive regulation of platelet-derived growth factor production(GO:0090362) |
| 0.1 | 0.2 | GO:0034241 | macrophage fusion(GO:0034238) regulation of macrophage fusion(GO:0034239) positive regulation of macrophage fusion(GO:0034241) |
| 0.1 | 0.4 | GO:0032808 | lacrimal gland development(GO:0032808) |
| 0.1 | 0.4 | GO:1901093 | regulation of protein tetramerization(GO:1901090) negative regulation of protein tetramerization(GO:1901091) regulation of protein homotetramerization(GO:1901093) negative regulation of protein homotetramerization(GO:1901094) |
| 0.1 | 1.3 | GO:0050930 | induction of positive chemotaxis(GO:0050930) |
| 0.1 | 0.2 | GO:0003231 | cardiac ventricle development(GO:0003231) |
| 0.1 | 0.2 | GO:0045014 | carbon catabolite repression of transcription(GO:0045013) negative regulation of transcription by glucose(GO:0045014) |
| 0.1 | 0.1 | GO:2000479 | regulation of cAMP-dependent protein kinase activity(GO:2000479) |
| 0.1 | 0.4 | GO:0060574 | intestinal epithelial cell maturation(GO:0060574) |
| 0.1 | 0.1 | GO:0060164 | regulation of timing of neuron differentiation(GO:0060164) |
| 0.1 | 0.2 | GO:0002522 | leukocyte migration involved in immune response(GO:0002522) |
| 0.1 | 0.2 | GO:0015772 | disaccharide transport(GO:0015766) sucrose transport(GO:0015770) oligosaccharide transport(GO:0015772) |
| 0.1 | 0.6 | GO:0090487 | toxin catabolic process(GO:0009407) secondary metabolite catabolic process(GO:0090487) |
| 0.1 | 0.3 | GO:1903412 | response to bile acid(GO:1903412) |
| 0.1 | 0.2 | GO:1902595 | regulation of DNA replication origin binding(GO:1902595) |
| 0.1 | 0.3 | GO:0072369 | regulation of lipid transport by positive regulation of transcription from RNA polymerase II promoter(GO:0072369) |
| 0.1 | 1.2 | GO:0007021 | tubulin complex assembly(GO:0007021) |
| 0.1 | 0.2 | GO:0003064 | regulation of heart rate by hormone(GO:0003064) |
| 0.1 | 0.2 | GO:0002881 | negative regulation of chronic inflammatory response to non-antigenic stimulus(GO:0002881) |
| 0.1 | 0.3 | GO:1901631 | positive regulation of presynaptic membrane organization(GO:1901631) |
| 0.1 | 0.2 | GO:2000007 | apoptotic process involved in endocardial cushion morphogenesis(GO:0003277) tendon cell differentiation(GO:0035990) tendon formation(GO:0035992) intermediate mesoderm morphogenesis(GO:0048390) intermediate mesoderm formation(GO:0048391) intermediate mesodermal cell differentiation(GO:0048392) regulation of cardiac muscle fiber development(GO:0055018) positive regulation of cardiac muscle fiber development(GO:0055020) bud dilation involved in lung branching(GO:0060503) BMP signaling pathway involved in ureter morphogenesis(GO:0061149) renal system segmentation(GO:0061150) BMP signaling pathway involved in renal system segmentation(GO:0061151) pulmonary artery endothelial tube morphogenesis(GO:0061155) regulation of transcription from RNA polymerase II promoter involved in mesonephros development(GO:0061216) BMP signaling pathway involved in nephric duct formation(GO:0071893) negative regulation of branch elongation involved in ureteric bud branching(GO:0072096) negative regulation of branch elongation involved in ureteric bud branching by BMP signaling pathway(GO:0072097) anterior/posterior pattern specification involved in ureteric bud development(GO:0072099) specification of ureteric bud anterior/posterior symmetry(GO:0072100) specification of ureteric bud anterior/posterior symmetry by BMP signaling pathway(GO:0072101) ureter epithelial cell differentiation(GO:0072192) negative regulation of mesenchymal cell proliferation involved in ureter development(GO:0072200) positive regulation of cell proliferation involved in outflow tract morphogenesis(GO:1901964) cardiac jelly development(GO:1905072) regulation of metanephric S-shaped body morphogenesis(GO:2000004) negative regulation of metanephric S-shaped body morphogenesis(GO:2000005) regulation of metanephric comma-shaped body morphogenesis(GO:2000006) negative regulation of metanephric comma-shaped body morphogenesis(GO:2000007) |
| 0.1 | 0.3 | GO:0018101 | protein citrullination(GO:0018101) histone citrullination(GO:0036414) |
| 0.1 | 0.2 | GO:0016095 | polyprenol catabolic process(GO:0016095) |
| 0.1 | 0.4 | GO:0009099 | branched-chain amino acid biosynthetic process(GO:0009082) leucine biosynthetic process(GO:0009098) valine biosynthetic process(GO:0009099) |
| 0.1 | 0.7 | GO:0006657 | CDP-choline pathway(GO:0006657) |
| 0.1 | 0.4 | GO:0006196 | AMP catabolic process(GO:0006196) |
| 0.1 | 0.7 | GO:1900029 | positive regulation of ruffle assembly(GO:1900029) |
| 0.1 | 0.2 | GO:0002296 | T-helper 1 cell lineage commitment(GO:0002296) |
| 0.1 | 0.3 | GO:1901896 | positive regulation of calcium-transporting ATPase activity(GO:1901896) |
| 0.1 | 0.4 | GO:0002084 | protein depalmitoylation(GO:0002084) |
| 0.1 | 0.2 | GO:0061073 | ciliary body morphogenesis(GO:0061073) |
| 0.1 | 1.1 | GO:0060670 | branching involved in labyrinthine layer morphogenesis(GO:0060670) |
| 0.1 | 0.2 | GO:0032286 | central nervous system myelin maintenance(GO:0032286) |
| 0.1 | 0.3 | GO:0030035 | microspike assembly(GO:0030035) |
| 0.1 | 0.3 | GO:0003406 | retinal pigment epithelium development(GO:0003406) |
| 0.1 | 0.3 | GO:0070560 | protein secretion by platelet(GO:0070560) |
| 0.1 | 0.8 | GO:0051599 | response to hydrostatic pressure(GO:0051599) |
| 0.1 | 0.2 | GO:0072709 | cellular response to sorbitol(GO:0072709) |
| 0.1 | 0.2 | GO:0001560 | regulation of cell growth by extracellular stimulus(GO:0001560) |
| 0.1 | 0.6 | GO:0042699 | follicle-stimulating hormone signaling pathway(GO:0042699) |
| 0.1 | 0.7 | GO:0032119 | sequestering of zinc ion(GO:0032119) |
| 0.1 | 0.3 | GO:0006789 | bilirubin conjugation(GO:0006789) |
| 0.1 | 0.3 | GO:1903527 | positive regulation of membrane tubulation(GO:1903527) |
| 0.1 | 0.4 | GO:1902219 | negative regulation of intrinsic apoptotic signaling pathway in response to osmotic stress(GO:1902219) |
| 0.1 | 0.5 | GO:0019344 | cysteine biosynthetic process(GO:0019344) |
| 0.1 | 0.4 | GO:0007621 | negative regulation of female receptivity(GO:0007621) |
| 0.1 | 0.1 | GO:0048023 | regulation of melanin biosynthetic process(GO:0048021) positive regulation of melanin biosynthetic process(GO:0048023) regulation of secondary metabolite biosynthetic process(GO:1900376) positive regulation of secondary metabolite biosynthetic process(GO:1900378) |
| 0.1 | 0.5 | GO:0070236 | negative regulation of activation-induced cell death of T cells(GO:0070236) |
| 0.1 | 0.3 | GO:0043553 | negative regulation of phosphatidylinositol 3-kinase activity(GO:0043553) |
| 0.1 | 0.3 | GO:0014043 | negative regulation of neuron maturation(GO:0014043) |
| 0.1 | 0.2 | GO:0072092 | ureteric bud invasion(GO:0072092) |
| 0.1 | 0.3 | GO:0098967 | exocytic insertion of neurotransmitter receptor to plasma membrane(GO:0098881) exocytic insertion of neurotransmitter receptor to postsynaptic membrane(GO:0098967) |
| 0.1 | 0.4 | GO:0003431 | growth plate cartilage chondrocyte development(GO:0003431) |
| 0.1 | 0.5 | GO:0010265 | SCF complex assembly(GO:0010265) |
| 0.1 | 0.3 | GO:0019075 | virus maturation(GO:0019075) |
| 0.1 | 0.2 | GO:0070859 | circadian temperature homeostasis(GO:0060086) positive regulation of bile acid biosynthetic process(GO:0070859) positive regulation of bile acid metabolic process(GO:1904253) |
| 0.1 | 0.7 | GO:0070257 | positive regulation of mucus secretion(GO:0070257) |
| 0.1 | 0.6 | GO:1900028 | negative regulation of ruffle assembly(GO:1900028) |
| 0.1 | 0.2 | GO:0090214 | spongiotrophoblast layer developmental growth(GO:0090214) |
| 0.1 | 0.2 | GO:0046122 | purine deoxyribonucleoside metabolic process(GO:0046122) |
| 0.0 | 0.1 | GO:2000721 | positive regulation of transcription from RNA polymerase II promoter involved in smooth muscle cell differentiation(GO:2000721) |
| 0.0 | 0.5 | GO:1904936 | cerebral cortex GABAergic interneuron migration(GO:0021853) interneuron migration(GO:1904936) |
| 0.0 | 0.2 | GO:0021633 | optic nerve structural organization(GO:0021633) |
| 0.0 | 0.1 | GO:0021966 | corticospinal neuron axon guidance(GO:0021966) negative regulation of granulocyte chemotaxis(GO:0071623) negative regulation of mononuclear cell migration(GO:0071676) negative regulation of neutrophil chemotaxis(GO:0090024) negative regulation of neutrophil migration(GO:1902623) |
| 0.0 | 0.2 | GO:0010900 | negative regulation of phosphatidylcholine catabolic process(GO:0010900) |
| 0.0 | 0.5 | GO:0032049 | cardiolipin biosynthetic process(GO:0032049) |
| 0.0 | 0.3 | GO:0006021 | inositol biosynthetic process(GO:0006021) |
| 0.0 | 0.1 | GO:0090310 | negative regulation of methylation-dependent chromatin silencing(GO:0090310) |
| 0.0 | 0.0 | GO:0098905 | regulation of bundle of His cell action potential(GO:0098905) |
| 0.0 | 0.2 | GO:0009236 | cobalamin biosynthetic process(GO:0009236) |
| 0.0 | 0.0 | GO:0018282 | metal incorporation into metallo-sulfur cluster(GO:0018282) iron incorporation into metallo-sulfur cluster(GO:0018283) |
| 0.0 | 0.1 | GO:0070676 | intralumenal vesicle formation(GO:0070676) |
| 0.0 | 0.1 | GO:0006533 | aspartate catabolic process(GO:0006533) |
| 0.0 | 0.1 | GO:0043966 | histone H3 acetylation(GO:0043966) |
| 0.0 | 0.1 | GO:0071878 | negative regulation of adrenergic receptor signaling pathway(GO:0071878) |
| 0.0 | 0.4 | GO:0030512 | negative regulation of transforming growth factor beta receptor signaling pathway(GO:0030512) |
| 0.0 | 0.2 | GO:0019856 | 'de novo' pyrimidine nucleobase biosynthetic process(GO:0006207) pyrimidine nucleobase biosynthetic process(GO:0019856) |
| 0.0 | 0.3 | GO:0045084 | positive regulation of interleukin-12 biosynthetic process(GO:0045084) |
| 0.0 | 0.8 | GO:0046415 | urate metabolic process(GO:0046415) |
| 0.0 | 0.1 | GO:0001079 | nitrogen catabolite regulation of transcription from RNA polymerase II promoter(GO:0001079) nitrogen catabolite activation of transcription from RNA polymerase II promoter(GO:0001080) regulation of urea metabolic process(GO:0034255) intracellular bile acid receptor signaling pathway(GO:0038185) interleukin-17 secretion(GO:0072615) nitrogen catabolite regulation of transcription(GO:0090293) nitrogen catabolite activation of transcription(GO:0090294) regulation of nitrogen cycle metabolic process(GO:1903314) positive regulation of glutamate metabolic process(GO:2000213) regulation of ammonia assimilation cycle(GO:2001248) positive regulation of ammonia assimilation cycle(GO:2001250) |
| 0.0 | 0.6 | GO:0070863 | positive regulation of protein exit from endoplasmic reticulum(GO:0070863) |
| 0.0 | 0.2 | GO:0043353 | enucleate erythrocyte differentiation(GO:0043353) |
| 0.0 | 0.4 | GO:0042758 | long-chain fatty acid catabolic process(GO:0042758) |
| 0.0 | 0.5 | GO:0016322 | neuron remodeling(GO:0016322) |
| 0.0 | 0.2 | GO:0030382 | sperm mitochondrion organization(GO:0030382) |
| 0.0 | 0.1 | GO:0018057 | peptidyl-lysine oxidation(GO:0018057) |
| 0.0 | 0.0 | GO:0035378 | carbon dioxide transmembrane transport(GO:0035378) |
| 0.0 | 0.2 | GO:0001306 | age-dependent response to oxidative stress(GO:0001306) age-dependent response to reactive oxygen species(GO:0001315) regulation of systemic arterial blood pressure by acetylcholine(GO:0003068) vasodilation by acetylcholine involved in regulation of systemic arterial blood pressure(GO:0003069) regulation of systemic arterial blood pressure by neurotransmitter(GO:0003070) age-dependent general metabolic decline(GO:0007571) |
| 0.0 | 0.6 | GO:0007196 | adenylate cyclase-inhibiting G-protein coupled glutamate receptor signaling pathway(GO:0007196) |
| 0.0 | 0.2 | GO:0035553 | oxidative RNA demethylation(GO:0035513) oxidative single-stranded RNA demethylation(GO:0035553) |
| 0.0 | 0.0 | GO:1901837 | negative regulation of transcription of nuclear large rRNA transcript from RNA polymerase I promoter(GO:1901837) |
| 0.0 | 0.2 | GO:1990502 | dense core granule maturation(GO:1990502) |
| 0.0 | 0.1 | GO:0042100 | B cell proliferation(GO:0042100) |
| 0.0 | 0.2 | GO:0061098 | positive regulation of protein tyrosine kinase activity(GO:0061098) |
| 0.0 | 0.0 | GO:0060267 | positive regulation of respiratory burst(GO:0060267) |
| 0.0 | 0.2 | GO:0099640 | axo-dendritic protein transport(GO:0099640) |
| 0.0 | 0.6 | GO:0051798 | positive regulation of hair follicle development(GO:0051798) |
| 0.0 | 0.8 | GO:0032515 | negative regulation of phosphoprotein phosphatase activity(GO:0032515) |
| 0.0 | 0.2 | GO:0009439 | cyanate metabolic process(GO:0009439) cyanate catabolic process(GO:0009440) |
| 0.0 | 0.1 | GO:2000397 | regulation of ubiquitin-dependent endocytosis(GO:2000395) positive regulation of ubiquitin-dependent endocytosis(GO:2000397) |
| 0.0 | 0.0 | GO:0032375 | negative regulation of sterol transport(GO:0032372) negative regulation of cholesterol transport(GO:0032375) |
| 0.0 | 0.2 | GO:1990834 | response to odorant(GO:1990834) |
| 0.0 | 1.7 | GO:0043123 | positive regulation of I-kappaB kinase/NF-kappaB signaling(GO:0043123) |
| 0.0 | 0.1 | GO:0097091 | synaptic vesicle clustering(GO:0097091) |
| 0.0 | 0.4 | GO:0010968 | regulation of microtubule nucleation(GO:0010968) |
| 0.0 | 0.4 | GO:0032510 | endosome to lysosome transport via multivesicular body sorting pathway(GO:0032510) |
| 0.0 | 0.7 | GO:0048681 | negative regulation of axon regeneration(GO:0048681) |
| 0.0 | 0.9 | GO:0048714 | positive regulation of oligodendrocyte differentiation(GO:0048714) |
| 0.0 | 0.6 | GO:0035878 | nail development(GO:0035878) |
| 0.0 | 0.4 | GO:0097500 | receptor localization to nonmotile primary cilium(GO:0097500) |
| 0.0 | 0.3 | GO:0019264 | glycine biosynthetic process from serine(GO:0019264) |
| 0.0 | 0.2 | GO:0071321 | cellular response to cGMP(GO:0071321) |
| 0.0 | 0.1 | GO:0006788 | heme oxidation(GO:0006788) |
| 0.0 | 0.2 | GO:0038083 | peptidyl-tyrosine autophosphorylation(GO:0038083) |
| 0.0 | 0.0 | GO:0035970 | peptidyl-threonine dephosphorylation(GO:0035970) |
| 0.0 | 0.2 | GO:0060136 | embryonic process involved in female pregnancy(GO:0060136) |
| 0.0 | 0.9 | GO:0097320 | membrane tubulation(GO:0097320) |
| 0.0 | 0.1 | GO:0048611 | ectodermal digestive tract development(GO:0007439) embryonic ectodermal digestive tract development(GO:0048611) |
| 0.0 | 0.2 | GO:0061086 | negative regulation of histone H3-K27 methylation(GO:0061086) |
| 0.0 | 0.3 | GO:0033353 | S-adenosylmethionine cycle(GO:0033353) |
| 0.0 | 0.1 | GO:0035426 | extracellular matrix-cell signaling(GO:0035426) |
| 0.0 | 0.2 | GO:0045743 | positive regulation of fibroblast growth factor receptor signaling pathway(GO:0045743) |
| 0.0 | 0.1 | GO:1902723 | negative regulation of skeletal muscle cell proliferation(GO:0014859) negative regulation of skeletal muscle satellite cell proliferation(GO:1902723) |
| 0.0 | 0.1 | GO:2000297 | negative regulation of synapse maturation(GO:2000297) |
| 0.0 | 0.1 | GO:0014707 | branchiomeric skeletal muscle development(GO:0014707) |
| 0.0 | 0.6 | GO:0007175 | negative regulation of epidermal growth factor-activated receptor activity(GO:0007175) |
| 0.0 | 0.2 | GO:0051549 | positive regulation of keratinocyte migration(GO:0051549) |
| 0.0 | 0.1 | GO:0033685 | negative regulation of luteinizing hormone secretion(GO:0033685) |
| 0.0 | 0.2 | GO:0016554 | cytidine to uridine editing(GO:0016554) |
| 0.0 | 1.3 | GO:0060441 | epithelial tube branching involved in lung morphogenesis(GO:0060441) |
| 0.0 | 0.3 | GO:0002326 | B cell lineage commitment(GO:0002326) |
| 0.0 | 0.1 | GO:1903697 | negative regulation of microvillus assembly(GO:1903697) |
| 0.0 | 0.1 | GO:0021938 | ventral midline development(GO:0007418) smoothened signaling pathway involved in regulation of cerebellar granule cell precursor cell proliferation(GO:0021938) |
| 0.0 | 0.7 | GO:0071243 | cellular response to arsenic-containing substance(GO:0071243) |
| 0.0 | 0.9 | GO:0099517 | anterograde synaptic vesicle transport(GO:0048490) synaptic vesicle cytoskeletal transport(GO:0099514) synaptic vesicle transport along microtubule(GO:0099517) |
| 0.0 | 0.1 | GO:0060753 | regulation of mast cell chemotaxis(GO:0060753) |
| 0.0 | 0.1 | GO:2000402 | negative regulation of lymphocyte migration(GO:2000402) |
| 0.0 | 1.0 | GO:0061049 | physiological muscle hypertrophy(GO:0003298) physiological cardiac muscle hypertrophy(GO:0003301) cell growth involved in cardiac muscle cell development(GO:0061049) |
| 0.0 | 0.5 | GO:0006670 | sphingosine metabolic process(GO:0006670) |
| 0.0 | 0.3 | GO:0050428 | purine ribonucleoside bisphosphate biosynthetic process(GO:0034036) 3'-phosphoadenosine 5'-phosphosulfate biosynthetic process(GO:0050428) |
| 0.0 | 0.1 | GO:0021586 | pons maturation(GO:0021586) |
| 0.0 | 0.2 | GO:0061767 | negative regulation of lung blood pressure(GO:0061767) |
| 0.0 | 0.1 | GO:2001288 | positive regulation of caveolin-mediated endocytosis(GO:2001288) |
| 0.0 | 0.1 | GO:0060677 | ureteric bud elongation(GO:0060677) |
| 0.0 | 0.1 | GO:1904798 | positive regulation of core promoter binding(GO:1904798) |
| 0.0 | 0.2 | GO:0070827 | chromatin maintenance(GO:0070827) |
| 0.0 | 0.1 | GO:1902995 | regulation of phospholipid efflux(GO:1902994) positive regulation of phospholipid efflux(GO:1902995) |
| 0.0 | 0.6 | GO:2000480 | negative regulation of cAMP-dependent protein kinase activity(GO:2000480) |
| 0.0 | 0.3 | GO:0098887 | neurotransmitter receptor transport, endosome to postsynaptic membrane(GO:0098887) |
| 0.0 | 0.2 | GO:0035021 | negative regulation of Rac protein signal transduction(GO:0035021) |
| 0.0 | 0.0 | GO:0042048 | olfactory behavior(GO:0042048) |
| 0.0 | 0.2 | GO:0038007 | netrin-activated signaling pathway(GO:0038007) |
| 0.0 | 0.7 | GO:1902857 | positive regulation of nonmotile primary cilium assembly(GO:1902857) |
| 0.0 | 0.5 | GO:0016998 | cell wall macromolecule catabolic process(GO:0016998) |
| 0.0 | 0.3 | GO:0035690 | cellular response to drug(GO:0035690) |
| 0.0 | 0.2 | GO:0033504 | floor plate development(GO:0033504) |
| 0.0 | 0.1 | GO:2000824 | negative regulation of androgen receptor activity(GO:2000824) |
| 0.0 | 0.4 | GO:0090360 | platelet-derived growth factor production(GO:0090360) regulation of platelet-derived growth factor production(GO:0090361) |
| 0.0 | 0.2 | GO:0001878 | response to yeast(GO:0001878) |
| 0.0 | 0.2 | GO:0097428 | protein maturation by iron-sulfur cluster transfer(GO:0097428) |
| 0.0 | 0.1 | GO:0061739 | protein lipidation involved in autophagosome assembly(GO:0061739) |
| 0.0 | 0.1 | GO:2001193 | gamma-delta T cell activation involved in immune response(GO:0002290) negative regulation of interferon-beta secretion(GO:0035548) regulation of gamma-delta T cell activation involved in immune response(GO:2001191) positive regulation of gamma-delta T cell activation involved in immune response(GO:2001193) |
| 0.0 | 0.1 | GO:0010841 | positive regulation of circadian sleep/wake cycle, wakefulness(GO:0010841) |
| 0.0 | 0.1 | GO:1904247 | positive regulation of polynucleotide adenylyltransferase activity(GO:1904247) |
| 0.0 | 0.5 | GO:0048742 | regulation of skeletal muscle fiber development(GO:0048742) |
| 0.0 | 0.1 | GO:0006208 | pyrimidine nucleobase catabolic process(GO:0006208) thymine catabolic process(GO:0006210) thymine metabolic process(GO:0019859) |
| 0.0 | 0.2 | GO:0010836 | negative regulation of protein ADP-ribosylation(GO:0010836) |
| 0.0 | 2.8 | GO:0030032 | lamellipodium assembly(GO:0030032) |
| 0.0 | 0.1 | GO:2000452 | CD8-positive, alpha-beta cytotoxic T cell extravasation(GO:0035698) regulation of CD8-positive, alpha-beta cytotoxic T cell extravasation(GO:2000452) |
| 0.0 | 0.1 | GO:0042414 | epinephrine metabolic process(GO:0042414) epinephrine biosynthetic process(GO:0042418) |
| 0.0 | 0.5 | GO:0043562 | cellular response to nitrogen starvation(GO:0006995) cellular response to nitrogen levels(GO:0043562) |
| 0.0 | 0.9 | GO:0045063 | T-helper 1 cell differentiation(GO:0045063) |
| 0.0 | 0.9 | GO:0071539 | protein localization to centrosome(GO:0071539) |
| 0.0 | 0.1 | GO:1904327 | protein localization to cytosolic proteasome complex(GO:1904327) protein localization to cytosolic proteasome complex involved in ERAD pathway(GO:1904379) |
| 0.0 | 0.2 | GO:0000160 | phosphorelay signal transduction system(GO:0000160) |
| 0.0 | 0.5 | GO:0006516 | glycoprotein catabolic process(GO:0006516) |
| 0.0 | 0.3 | GO:0001675 | acrosome assembly(GO:0001675) |
| 0.0 | 0.1 | GO:0044313 | protein K6-linked deubiquitination(GO:0044313) |
| 0.0 | 0.1 | GO:0070911 | global genome nucleotide-excision repair(GO:0070911) |
| 0.0 | 0.2 | GO:2000491 | positive regulation of hepatic stellate cell activation(GO:2000491) |
| 0.0 | 0.2 | GO:0016557 | peroxisome membrane biogenesis(GO:0016557) |
| 0.0 | 0.2 | GO:0036444 | calcium ion transmembrane import into mitochondrion(GO:0036444) |
| 0.0 | 0.0 | GO:0003408 | optic cup formation involved in camera-type eye development(GO:0003408) |
| 0.0 | 0.2 | GO:0008582 | regulation of synaptic growth at neuromuscular junction(GO:0008582) |
| 0.0 | 0.3 | GO:0006777 | Mo-molybdopterin cofactor biosynthetic process(GO:0006777) Mo-molybdopterin cofactor metabolic process(GO:0019720) |
| 0.0 | 1.4 | GO:0007340 | acrosome reaction(GO:0007340) |
| 0.0 | 0.3 | GO:0007041 | lysosomal transport(GO:0007041) |
| 0.0 | 0.2 | GO:0006526 | arginine biosynthetic process(GO:0006526) |
| 0.0 | 0.2 | GO:0030421 | defecation(GO:0030421) |
| 0.0 | 0.2 | GO:1903899 | positive regulation of PERK-mediated unfolded protein response(GO:1903899) |
| 0.0 | 0.2 | GO:0019627 | urea metabolic process(GO:0019627) |
| 0.0 | 0.3 | GO:0030903 | notochord development(GO:0030903) |
| 0.0 | 0.1 | GO:0044334 | regulation of heparan sulfate proteoglycan biosynthetic process(GO:0010908) positive regulation of heparan sulfate proteoglycan biosynthetic process(GO:0010909) canonical Wnt signaling pathway involved in positive regulation of epithelial to mesenchymal transition(GO:0044334) positive regulation of proteoglycan biosynthetic process(GO:1902730) |
| 0.0 | 0.3 | GO:0043619 | regulation of transcription from RNA polymerase II promoter in response to oxidative stress(GO:0043619) |
| 0.0 | 0.6 | GO:0010971 | positive regulation of G2/M transition of mitotic cell cycle(GO:0010971) |
| 0.0 | 0.1 | GO:0003415 | chondrocyte hypertrophy(GO:0003415) |
| 0.0 | 0.1 | GO:0010862 | positive regulation of pathway-restricted SMAD protein phosphorylation(GO:0010862) |
| 0.0 | 0.4 | GO:0032495 | response to muramyl dipeptide(GO:0032495) |
| 0.0 | 0.1 | GO:0060282 | positive regulation of oocyte development(GO:0060282) |
| 0.0 | 0.1 | GO:1900738 | positive regulation of phospholipase C-activating G-protein coupled receptor signaling pathway(GO:1900738) |
| 0.0 | 0.9 | GO:0006730 | one-carbon metabolic process(GO:0006730) |
| 0.0 | 3.0 | GO:0070268 | cornification(GO:0070268) |
| 0.0 | 0.0 | GO:0055064 | cellular chloride ion homeostasis(GO:0030644) chloride ion homeostasis(GO:0055064) |
| 0.0 | 0.2 | GO:0021819 | layer formation in cerebral cortex(GO:0021819) |
| 0.0 | 0.3 | GO:0048298 | positive regulation of isotype switching to IgA isotypes(GO:0048298) |
| 0.0 | 0.1 | GO:2000543 | positive regulation of gastrulation(GO:2000543) |
| 0.0 | 1.8 | GO:2000649 | regulation of sodium ion transmembrane transporter activity(GO:2000649) |
| 0.0 | 0.1 | GO:0072675 | multinuclear osteoclast differentiation(GO:0072674) osteoclast fusion(GO:0072675) |
| 0.0 | 0.2 | GO:0048386 | positive regulation of retinoic acid receptor signaling pathway(GO:0048386) |
| 0.0 | 0.3 | GO:0090168 | Golgi reassembly(GO:0090168) |
| 0.0 | 0.0 | GO:0050690 | regulation of defense response to virus by virus(GO:0050690) |
| 0.0 | 0.1 | GO:0051012 | microtubule sliding(GO:0051012) |
| 0.0 | 0.1 | GO:0090258 | negative regulation of mitochondrial fission(GO:0090258) |
| 0.0 | 0.6 | GO:0044458 | motile cilium assembly(GO:0044458) |
| 0.0 | 0.1 | GO:0090156 | cellular sphingolipid homeostasis(GO:0090156) |
| 0.0 | 0.2 | GO:0050885 | neuromuscular process controlling balance(GO:0050885) |
| 0.0 | 0.1 | GO:1990573 | potassium ion import across plasma membrane(GO:1990573) |
| 0.0 | 0.3 | GO:1901741 | positive regulation of myoblast fusion(GO:1901741) |
| 0.0 | 0.1 | GO:1903760 | regulation of voltage-gated potassium channel activity involved in ventricular cardiac muscle cell action potential repolarization(GO:1903760) |
| 0.0 | 0.4 | GO:0030183 | B cell differentiation(GO:0030183) |
| 0.0 | 0.1 | GO:1902630 | regulation of membrane hyperpolarization(GO:1902630) |
| 0.0 | 0.1 | GO:0033522 | histone H2A ubiquitination(GO:0033522) |
| 0.0 | 0.2 | GO:0006857 | oligopeptide transport(GO:0006857) |
| 0.0 | 0.1 | GO:0060740 | prostate gland epithelium morphogenesis(GO:0060740) |
| 0.0 | 0.2 | GO:0032020 | ISG15-protein conjugation(GO:0032020) |
| 0.0 | 0.1 | GO:0036089 | cleavage furrow formation(GO:0036089) |
| 0.0 | 0.1 | GO:0019074 | viral genome packaging(GO:0019072) viral RNA genome packaging(GO:0019074) |
| 0.0 | 0.2 | GO:1900017 | positive regulation of cytokine production involved in inflammatory response(GO:1900017) |
| 0.0 | 0.1 | GO:0044027 | hypermethylation of CpG island(GO:0044027) |
| 0.0 | 0.1 | GO:1903093 | regulation of protein K48-linked deubiquitination(GO:1903093) negative regulation of protein K48-linked deubiquitination(GO:1903094) negative regulation of ubiquitin-specific protease activity(GO:2000157) |
| 0.0 | 0.1 | GO:1902613 | regulation of anti-Mullerian hormone signaling pathway(GO:1902612) negative regulation of anti-Mullerian hormone signaling pathway(GO:1902613) anti-Mullerian hormone signaling pathway(GO:1990262) |
| 0.0 | 0.1 | GO:1902445 | regulation of mitochondrial membrane permeability involved in programmed necrotic cell death(GO:1902445) |
| 0.0 | 0.4 | GO:0090051 | negative regulation of cell migration involved in sprouting angiogenesis(GO:0090051) |
| 0.0 | 0.2 | GO:1903818 | positive regulation of voltage-gated potassium channel activity(GO:1903818) |
| 0.0 | 0.1 | GO:0006436 | tryptophanyl-tRNA aminoacylation(GO:0006436) |
| 0.0 | 0.2 | GO:0032436 | positive regulation of proteasomal ubiquitin-dependent protein catabolic process(GO:0032436) |
| 0.0 | 0.2 | GO:0051873 | killing by host of symbiont cells(GO:0051873) |
| 0.0 | 0.1 | GO:0097411 | hypoxia-inducible factor-1alpha signaling pathway(GO:0097411) |
| 0.0 | 0.1 | GO:0035089 | establishment of apical/basal cell polarity(GO:0035089) establishment of epithelial cell apical/basal polarity(GO:0045198) |
| 0.0 | 0.1 | GO:1902361 | mitochondrial pyruvate transport(GO:0006850) mitochondrial pyruvate transmembrane transport(GO:1902361) |
| 0.0 | 0.0 | GO:0060994 | regulation of transcription from RNA polymerase II promoter involved in kidney development(GO:0060994) |
| 0.0 | 0.1 | GO:1904158 | axonemal central apparatus assembly(GO:1904158) |
| 0.0 | 0.1 | GO:0007198 | adenylate cyclase-inhibiting serotonin receptor signaling pathway(GO:0007198) |
| 0.0 | 0.1 | GO:0019060 | intracellular transport of viral protein in host cell(GO:0019060) symbiont intracellular protein transport in host(GO:0030581) intracellular protein transport in other organism involved in symbiotic interaction(GO:0051708) |
| 0.0 | 0.1 | GO:0002276 | basophil activation involved in immune response(GO:0002276) |
| 0.0 | 0.3 | GO:0010248 | establishment or maintenance of transmembrane electrochemical gradient(GO:0010248) |
| 0.0 | 0.1 | GO:1901079 | positive regulation of relaxation of muscle(GO:1901079) positive regulation of relaxation of cardiac muscle(GO:1901899) regulation of calcium ion import into sarcoplasmic reticulum(GO:1902080) negative regulation of calcium ion import into sarcoplasmic reticulum(GO:1902081) |
| 0.0 | 0.1 | GO:0042823 | pyridoxal phosphate biosynthetic process(GO:0042823) |
| 0.0 | 0.2 | GO:0030259 | lipid glycosylation(GO:0030259) |
| 0.0 | 0.1 | GO:0035609 | C-terminal protein deglutamylation(GO:0035609) |
| 0.0 | 0.2 | GO:0006122 | mitochondrial electron transport, ubiquinol to cytochrome c(GO:0006122) |
| 0.0 | 0.1 | GO:0098700 | neurotransmitter loading into synaptic vesicle(GO:0098700) |
| 0.0 | 0.1 | GO:0071442 | positive regulation of histone H3-K14 acetylation(GO:0071442) |
| 0.0 | 0.1 | GO:0070966 | nuclear-transcribed mRNA catabolic process, no-go decay(GO:0070966) |
| 0.0 | 0.2 | GO:0035634 | response to stilbenoid(GO:0035634) |
| 0.0 | 0.5 | GO:1900151 | regulation of nuclear-transcribed mRNA catabolic process, deadenylation-dependent decay(GO:1900151) positive regulation of nuclear-transcribed mRNA catabolic process, deadenylation-dependent decay(GO:1900153) |
| 0.0 | 0.4 | GO:0006388 | tRNA splicing, via endonucleolytic cleavage and ligation(GO:0006388) |
| 0.0 | 0.1 | GO:0055129 | L-proline biosynthetic process(GO:0055129) |
| 0.0 | 0.0 | GO:0048865 | stem cell fate commitment(GO:0048865) |
| 0.0 | 0.1 | GO:0034421 | post-translational protein acetylation(GO:0034421) |
| 0.0 | 0.2 | GO:0021702 | cerebellar Purkinje cell layer formation(GO:0021694) cerebellar Purkinje cell differentiation(GO:0021702) |
| 0.0 | 0.1 | GO:0035115 | embryonic forelimb morphogenesis(GO:0035115) |
| 0.0 | 0.0 | GO:0003285 | septum secundum development(GO:0003285) |
| 0.0 | 0.1 | GO:0034351 | regulation of glial cell apoptotic process(GO:0034350) negative regulation of glial cell apoptotic process(GO:0034351) |
| 0.0 | 0.1 | GO:0061566 | dADP phosphorylation(GO:0006174) dGDP phosphorylation(GO:0006186) AMP phosphorylation(GO:0006756) CDP phosphorylation(GO:0061508) dAMP phosphorylation(GO:0061565) CMP phosphorylation(GO:0061566) dCMP phosphorylation(GO:0061567) GDP phosphorylation(GO:0061568) UDP phosphorylation(GO:0061569) dCDP phosphorylation(GO:0061570) TDP phosphorylation(GO:0061571) |
| 0.0 | 0.1 | GO:0021615 | glossopharyngeal nerve morphogenesis(GO:0021615) |
| 0.0 | 0.2 | GO:0090315 | negative regulation of protein targeting to membrane(GO:0090315) |
| 0.0 | 0.0 | GO:0002775 | antimicrobial peptide production(GO:0002775) antibacterial peptide production(GO:0002778) |
| 0.0 | 0.1 | GO:1990910 | response to thapsigargin(GO:1904578) cellular response to thapsigargin(GO:1904579) response to hypobaric hypoxia(GO:1990910) |
| 0.0 | 0.2 | GO:0051195 | negative regulation of glycolytic process(GO:0045820) negative regulation of cofactor metabolic process(GO:0051195) negative regulation of coenzyme metabolic process(GO:0051198) |
| 0.0 | 0.2 | GO:0045761 | regulation of adenylate cyclase activity(GO:0045761) |
| 0.0 | 0.0 | GO:0014806 | negative regulation of muscle hyperplasia(GO:0014740) smooth muscle hyperplasia(GO:0014806) |
| 0.0 | 0.1 | GO:0001865 | NK T cell differentiation(GO:0001865) |
| 0.0 | 0.1 | GO:0002069 | columnar/cuboidal epithelial cell maturation(GO:0002069) glandular epithelial cell maturation(GO:0002071) type B pancreatic cell maturation(GO:0072560) |
| 0.0 | 0.1 | GO:0031017 | exocrine pancreas development(GO:0031017) |
| 0.0 | 0.1 | GO:1901314 | negative regulation of histone ubiquitination(GO:0033183) regulation of histone H2A K63-linked ubiquitination(GO:1901314) negative regulation of histone H2A K63-linked ubiquitination(GO:1901315) |
| 0.0 | 1.1 | GO:0032755 | positive regulation of interleukin-6 production(GO:0032755) |
| 0.0 | 0.0 | GO:0002644 | negative regulation of tolerance induction(GO:0002644) |
| 0.0 | 0.2 | GO:0030422 | production of siRNA involved in RNA interference(GO:0030422) |
| 0.0 | 0.2 | GO:0006704 | glucocorticoid biosynthetic process(GO:0006704) |
| 0.0 | 0.1 | GO:0019532 | oxalate transport(GO:0019532) |
| 0.0 | 1.2 | GO:0090502 | RNA phosphodiester bond hydrolysis, endonucleolytic(GO:0090502) |
| 0.0 | 0.1 | GO:1902750 | negative regulation of cell cycle G2/M phase transition(GO:1902750) |
| 0.0 | 0.0 | GO:0048213 | Golgi vesicle prefusion complex stabilization(GO:0048213) |
| 0.0 | 0.2 | GO:0002710 | negative regulation of T cell mediated immunity(GO:0002710) |
| 0.0 | 0.1 | GO:1903385 | regulation of homophilic cell adhesion(GO:1903385) |
| 0.0 | 0.1 | GO:0043457 | regulation of cellular respiration(GO:0043457) |
| 0.0 | 0.2 | GO:0019800 | peptide cross-linking via chondroitin 4-sulfate glycosaminoglycan(GO:0019800) |
| 0.0 | 0.2 | GO:0008228 | opsonization(GO:0008228) |
| 0.0 | 0.1 | GO:0015855 | pyrimidine nucleobase transport(GO:0015855) purine nucleobase transmembrane transport(GO:1904823) |
| 0.0 | 0.2 | GO:0097264 | self proteolysis(GO:0097264) |
| 0.0 | 0.1 | GO:0006041 | glucosamine metabolic process(GO:0006041) |
| 0.0 | 0.2 | GO:0019371 | cyclooxygenase pathway(GO:0019371) |
| 0.0 | 0.1 | GO:0034154 | toll-like receptor 7 signaling pathway(GO:0034154) |
| 0.0 | 0.3 | GO:1904886 | beta-catenin destruction complex disassembly(GO:1904886) |
| 0.0 | 0.1 | GO:0033234 | negative regulation of protein sumoylation(GO:0033234) |
| 0.0 | 0.1 | GO:0090154 | positive regulation of sphingolipid biosynthetic process(GO:0090154) positive regulation of ceramide biosynthetic process(GO:2000304) |
| 0.0 | 0.1 | GO:2000503 | regulation of natural killer cell chemotaxis(GO:2000501) positive regulation of natural killer cell chemotaxis(GO:2000503) |
| 0.0 | 0.1 | GO:0036229 | glutamine secretion(GO:0010585) L-glutamine import(GO:0036229) L-glutamine import into cell(GO:1903803) |
| 0.0 | 0.2 | GO:0015074 | DNA integration(GO:0015074) |
| 0.0 | 0.1 | GO:0045717 | negative regulation of fatty acid biosynthetic process(GO:0045717) |
| 0.0 | 0.1 | GO:0015911 | plasma membrane long-chain fatty acid transport(GO:0015911) |
| 0.0 | 0.1 | GO:0009798 | axis specification(GO:0009798) |
| 0.0 | 0.0 | GO:0002730 | regulation of dendritic cell cytokine production(GO:0002730) negative regulation of dendritic cell cytokine production(GO:0002731) |
| 0.0 | 0.1 | GO:1901097 | negative regulation of autophagosome maturation(GO:1901097) |
| 0.0 | 0.0 | GO:0006566 | threonine metabolic process(GO:0006566) |
| 0.0 | 0.1 | GO:0033690 | positive regulation of osteoblast proliferation(GO:0033690) |
| 0.0 | 0.0 | GO:0031016 | pancreas development(GO:0031016) |
| 0.0 | 0.2 | GO:0035914 | skeletal muscle cell differentiation(GO:0035914) |
| 0.0 | 0.1 | GO:0043392 | negative regulation of DNA binding(GO:0043392) |
| 0.0 | 0.1 | GO:0090131 | mesenchyme migration(GO:0090131) |
| 0.0 | 0.2 | GO:0016973 | poly(A)+ mRNA export from nucleus(GO:0016973) |
| 0.0 | 0.1 | GO:1901223 | negative regulation of NIK/NF-kappaB signaling(GO:1901223) |
| 0.0 | 0.9 | GO:0033275 | muscle filament sliding(GO:0030049) actin-myosin filament sliding(GO:0033275) |
| 0.0 | 0.0 | GO:0035573 | N-terminal protein amino acid methylation(GO:0006480) N-terminal peptidyl-alanine methylation(GO:0018011) N-terminal peptidyl-alanine trimethylation(GO:0018012) N-terminal peptidyl-glycine methylation(GO:0018013) N-terminal peptidyl-proline dimethylation(GO:0018016) peptidyl-alanine modification(GO:0018194) N-terminal peptidyl-proline methylation(GO:0035568) N-terminal peptidyl-serine methylation(GO:0035570) N-terminal peptidyl-serine dimethylation(GO:0035572) N-terminal peptidyl-serine trimethylation(GO:0035573) |
| 0.0 | 0.1 | GO:0014816 | skeletal muscle satellite cell differentiation(GO:0014816) |
| 0.0 | 0.1 | GO:0042264 | peptidyl-aspartic acid hydroxylation(GO:0042264) |
| 0.0 | 1.4 | GO:0031295 | T cell costimulation(GO:0031295) |
| 0.0 | 0.1 | GO:0010827 | regulation of glucose transport(GO:0010827) |
| 0.0 | 0.1 | GO:2001166 | regulation of histone H2B ubiquitination(GO:2001166) positive regulation of histone H2B ubiquitination(GO:2001168) |
| 0.0 | 0.0 | GO:0021650 | vestibulocochlear nerve formation(GO:0021650) |
| 0.0 | 0.1 | GO:0035721 | intraciliary retrograde transport(GO:0035721) |
| 0.0 | 0.1 | GO:0034227 | tRNA thio-modification(GO:0034227) |
| 0.0 | 0.1 | GO:0003352 | regulation of cilium movement(GO:0003352) |
| 0.0 | 0.4 | GO:0051602 | response to electrical stimulus(GO:0051602) |
| 0.0 | 0.1 | GO:0061179 | negative regulation of insulin secretion involved in cellular response to glucose stimulus(GO:0061179) |
| 0.0 | 0.1 | GO:0061762 | CAMKK-AMPK signaling cascade(GO:0061762) |
| 0.0 | 0.5 | GO:0090383 | phagosome acidification(GO:0090383) |
| 0.0 | 0.1 | GO:0036342 | post-anal tail morphogenesis(GO:0036342) |
| 0.0 | 0.1 | GO:1902268 | negative regulation of polyamine transmembrane transport(GO:1902268) |
| 0.0 | 0.4 | GO:0007141 | male meiosis I(GO:0007141) |
| 0.0 | 0.1 | GO:0090043 | regulation of tubulin deacetylation(GO:0090043) |
| 0.0 | 0.1 | GO:0045872 | regulation of rhodopsin gene expression(GO:0007468) positive regulation of rhodopsin gene expression(GO:0045872) |
| 0.0 | 0.3 | GO:0031293 | membrane protein intracellular domain proteolysis(GO:0031293) |
| 0.0 | 0.0 | GO:2001180 | negative regulation of interleukin-10 secretion(GO:2001180) |
| 0.0 | 0.1 | GO:0002726 | positive regulation of T cell cytokine production(GO:0002726) |
| 0.0 | 0.3 | GO:0006123 | mitochondrial electron transport, cytochrome c to oxygen(GO:0006123) |
| 0.0 | 0.1 | GO:0048096 | chromatin-mediated maintenance of transcription(GO:0048096) |
| 0.0 | 0.1 | GO:0002544 | chronic inflammatory response(GO:0002544) |
| 0.0 | 0.3 | GO:0033169 | histone H3-K9 demethylation(GO:0033169) |
| 0.0 | 0.4 | GO:0048268 | clathrin coat assembly(GO:0048268) |
| 0.0 | 0.0 | GO:0003199 | endocardial cushion to mesenchymal transition involved in heart valve formation(GO:0003199) |
| 0.0 | 0.2 | GO:0034356 | NAD biosynthesis via nicotinamide riboside salvage pathway(GO:0034356) |
| 0.0 | 0.3 | GO:0010172 | embryonic body morphogenesis(GO:0010172) |
| 0.0 | 0.1 | GO:0031118 | rRNA pseudouridine synthesis(GO:0031118) |
| 0.0 | 0.1 | GO:0045838 | positive regulation of membrane potential(GO:0045838) |
| 0.0 | 0.0 | GO:0044828 | negative regulation by host of viral genome replication(GO:0044828) |
| 0.0 | 0.1 | GO:0036158 | outer dynein arm assembly(GO:0036158) |
| 0.0 | 0.3 | GO:0006957 | complement activation, alternative pathway(GO:0006957) |
| 0.0 | 0.2 | GO:0070327 | thyroid hormone transport(GO:0070327) |
| 0.0 | 0.2 | GO:0002438 | acute inflammatory response to antigenic stimulus(GO:0002438) |
| 0.0 | 0.1 | GO:0051895 | negative regulation of focal adhesion assembly(GO:0051895) |
| 0.0 | 0.1 | GO:0032958 | inositol phosphate biosynthetic process(GO:0032958) |
| 0.0 | 0.0 | GO:1905245 | regulation of aspartic-type endopeptidase activity involved in amyloid precursor protein catabolic process(GO:1902959) regulation of aspartic-type peptidase activity(GO:1905245) |
| 0.0 | 0.1 | GO:0060638 | mesenchymal-epithelial cell signaling(GO:0060638) regulation of branching involved in salivary gland morphogenesis by mesenchymal-epithelial signaling(GO:0060665) |
| 0.0 | 0.0 | GO:0021894 | cerebral cortex GABAergic interneuron development(GO:0021894) |
| 0.0 | 0.0 | GO:0007172 | signal complex assembly(GO:0007172) |
| 0.0 | 0.0 | GO:0035621 | ER to Golgi ceramide transport(GO:0035621) |
| 0.0 | 0.2 | GO:0040015 | negative regulation of multicellular organism growth(GO:0040015) |
| 0.0 | 0.1 | GO:0006284 | base-excision repair(GO:0006284) |
| 0.0 | 0.2 | GO:0042036 | negative regulation of cytokine biosynthetic process(GO:0042036) |
| 0.0 | 0.2 | GO:0036315 | cellular response to sterol(GO:0036315) |
| 0.0 | 0.1 | GO:2001257 | regulation of cation channel activity(GO:2001257) |
| 0.0 | 0.1 | GO:0033119 | negative regulation of RNA splicing(GO:0033119) |
| 0.0 | 0.0 | GO:0008628 | hormone-mediated apoptotic signaling pathway(GO:0008628) |
| 0.0 | 0.1 | GO:1904355 | positive regulation of telomere capping(GO:1904355) |
| 0.0 | 0.0 | GO:0070898 | RNA polymerase III transcriptional preinitiation complex assembly(GO:0070898) |
| 0.0 | 2.3 | GO:0038095 | Fc-epsilon receptor signaling pathway(GO:0038095) |
| 0.0 | 0.1 | GO:0000056 | ribosomal small subunit export from nucleus(GO:0000056) |
| 0.0 | 0.1 | GO:0035641 | locomotory exploration behavior(GO:0035641) |
| 0.0 | 0.2 | GO:0031440 | regulation of mRNA 3'-end processing(GO:0031440) |
| 0.0 | 0.1 | GO:0042532 | negative regulation of tyrosine phosphorylation of STAT protein(GO:0042532) |
| 0.0 | 0.1 | GO:0045351 | type I interferon biosynthetic process(GO:0045351) |
| 0.0 | 1.6 | GO:0021915 | neural tube development(GO:0021915) |
| 0.0 | 0.1 | GO:2000825 | positive regulation of androgen receptor activity(GO:2000825) |
| 0.0 | 0.0 | GO:0097009 | energy homeostasis(GO:0097009) |
| 0.0 | 0.1 | GO:0007506 | gonadal mesoderm development(GO:0007506) |
| 0.0 | 0.1 | GO:0002082 | regulation of oxidative phosphorylation(GO:0002082) |
| 0.0 | 0.0 | GO:0001189 | RNA polymerase I transcriptional preinitiation complex assembly(GO:0001188) RNA polymerase I transcriptional preinitiation complex assembly at the promoter for the nuclear large rRNA transcript(GO:0001189) |
| 0.0 | 0.2 | GO:0006879 | cellular iron ion homeostasis(GO:0006879) |
| 0.0 | 0.2 | GO:0090090 | negative regulation of canonical Wnt signaling pathway(GO:0090090) |
| 0.0 | 0.2 | GO:0051601 | exocyst localization(GO:0051601) |
| 0.0 | 0.3 | GO:0032008 | positive regulation of TOR signaling(GO:0032008) |
| 0.0 | 0.1 | GO:0010536 | positive regulation of activation of Janus kinase activity(GO:0010536) |
| 0.0 | 0.1 | GO:0030046 | parallel actin filament bundle assembly(GO:0030046) |
Gene overrepresentation in cellular_component category:
| Log-likelihood per target | Total log-likelihood | Term | Description |
|---|---|---|---|
| 0.7 | 5.1 | GO:0097209 | epidermal lamellar body(GO:0097209) |
| 0.5 | 1.9 | GO:1990031 | pinceau fiber(GO:1990031) |
| 0.4 | 4.0 | GO:0061689 | tricellular tight junction(GO:0061689) |
| 0.1 | 1.1 | GO:0071664 | catenin-TCF7L2 complex(GO:0071664) |
| 0.1 | 4.2 | GO:0090545 | NuRD complex(GO:0016581) CHD-type complex(GO:0090545) |
| 0.1 | 0.5 | GO:0034669 | integrin alpha4-beta7 complex(GO:0034669) |
| 0.1 | 0.3 | GO:0005889 | hydrogen:potassium-exchanging ATPase complex(GO:0005889) |
| 0.1 | 1.6 | GO:0045179 | apical cortex(GO:0045179) |
| 0.1 | 1.3 | GO:0046581 | intercellular canaliculus(GO:0046581) |
| 0.1 | 0.4 | GO:0070557 | PCNA-p21 complex(GO:0070557) |
| 0.1 | 1.1 | GO:0016013 | syntrophin complex(GO:0016013) |
| 0.1 | 0.9 | GO:0031313 | extrinsic component of endosome membrane(GO:0031313) |
| 0.1 | 1.2 | GO:0042105 | alpha-beta T cell receptor complex(GO:0042105) |
| 0.1 | 2.5 | GO:0005861 | troponin complex(GO:0005861) |
| 0.1 | 0.9 | GO:1990111 | spermatoproteasome complex(GO:1990111) |
| 0.1 | 0.5 | GO:0031905 | early endosome lumen(GO:0031905) |
| 0.1 | 0.7 | GO:0019815 | B cell receptor complex(GO:0019815) |
| 0.1 | 0.1 | GO:0019866 | organelle inner membrane(GO:0019866) |
| 0.1 | 0.5 | GO:0097123 | cyclin A1-CDK2 complex(GO:0097123) |
| 0.1 | 0.6 | GO:0097179 | protease inhibitor complex(GO:0097179) |
| 0.1 | 0.3 | GO:0016529 | sarcoplasmic reticulum(GO:0016529) |
| 0.1 | 0.3 | GO:1990716 | axonemal central apparatus(GO:1990716) |
| 0.1 | 0.4 | GO:0031510 | SUMO activating enzyme complex(GO:0031510) |
| 0.1 | 1.2 | GO:0097512 | cardiac myofibril(GO:0097512) |
| 0.1 | 0.3 | GO:1990796 | photoreceptor cell terminal bouton(GO:1990796) |
| 0.1 | 0.2 | GO:0098855 | HCN channel complex(GO:0098855) |
| 0.1 | 0.2 | GO:0019008 | molybdopterin synthase complex(GO:0019008) |
| 0.1 | 0.3 | GO:0072558 | NLRP1 inflammasome complex(GO:0072558) |
| 0.1 | 0.3 | GO:0071149 | TEAD-2-YAP complex(GO:0071149) |
| 0.1 | 0.3 | GO:0016533 | cyclin-dependent protein kinase 5 holoenzyme complex(GO:0016533) |
| 0.1 | 0.3 | GO:0044301 | climbing fiber(GO:0044301) |
| 0.1 | 0.8 | GO:0033010 | paranodal junction(GO:0033010) |
| 0.1 | 0.2 | GO:0044354 | pinosome(GO:0044352) macropinosome(GO:0044354) |
| 0.1 | 2.1 | GO:0030057 | desmosome(GO:0030057) |
| 0.1 | 2.1 | GO:0031092 | platelet alpha granule membrane(GO:0031092) |
| 0.1 | 0.9 | GO:0005641 | nuclear envelope lumen(GO:0005641) |
| 0.1 | 0.4 | GO:0044292 | dendrite terminus(GO:0044292) |
| 0.1 | 0.2 | GO:0016600 | flotillin complex(GO:0016600) |
| 0.1 | 1.1 | GO:0001891 | phagocytic cup(GO:0001891) |
| 0.0 | 0.4 | GO:0071986 | Ragulator complex(GO:0071986) |
| 0.0 | 0.4 | GO:0070382 | exocytic vesicle(GO:0070382) |
| 0.0 | 0.4 | GO:0016589 | NURF complex(GO:0016589) |
| 0.0 | 0.0 | GO:0009986 | cell surface(GO:0009986) |
| 0.0 | 0.2 | GO:1990425 | ryanodine receptor complex(GO:1990425) |
| 0.0 | 0.9 | GO:0000177 | cytoplasmic exosome (RNase complex)(GO:0000177) |
| 0.0 | 0.1 | GO:0001725 | stress fiber(GO:0001725) contractile actin filament bundle(GO:0097517) |
| 0.0 | 0.7 | GO:0048786 | presynaptic active zone(GO:0048786) |
| 0.0 | 0.1 | GO:0001534 | radial spoke(GO:0001534) |
| 0.0 | 0.7 | GO:0060077 | inhibitory synapse(GO:0060077) |
| 0.0 | 0.1 | GO:0097058 | CRLF-CLCF1 complex(GO:0097058) |
| 0.0 | 0.1 | GO:0032009 | early phagosome(GO:0032009) |
| 0.0 | 0.5 | GO:0000506 | glycosylphosphatidylinositol-N-acetylglucosaminyltransferase (GPI-GnT) complex(GO:0000506) |
| 0.0 | 0.2 | GO:0030485 | smooth muscle contractile fiber(GO:0030485) |
| 0.0 | 0.6 | GO:0000815 | ESCRT III complex(GO:0000815) |
| 0.0 | 0.1 | GO:0001405 | presequence translocase-associated import motor(GO:0001405) |
| 0.0 | 0.0 | GO:1902710 | GABA receptor complex(GO:1902710) |
| 0.0 | 0.6 | GO:0001518 | voltage-gated sodium channel complex(GO:0001518) |
| 0.0 | 0.0 | GO:0070522 | nucleotide-excision repair factor 1 complex(GO:0000110) ERCC4-ERCC1 complex(GO:0070522) |
| 0.0 | 1.1 | GO:0016327 | apicolateral plasma membrane(GO:0016327) |
| 0.0 | 0.8 | GO:0031105 | septin complex(GO:0031105) |
| 0.0 | 0.1 | GO:0010370 | perinucleolar chromocenter(GO:0010370) |
| 0.0 | 0.3 | GO:0070552 | BRISC complex(GO:0070552) |
| 0.0 | 0.3 | GO:0098845 | postsynaptic endosome(GO:0098845) |
| 0.0 | 0.4 | GO:0032039 | integrator complex(GO:0032039) |
| 0.0 | 0.4 | GO:0097433 | dense body(GO:0097433) |
| 0.0 | 0.0 | GO:0031985 | Golgi cisterna(GO:0031985) |
| 0.0 | 0.6 | GO:0005614 | interstitial matrix(GO:0005614) |
| 0.0 | 0.8 | GO:0044295 | axonal growth cone(GO:0044295) |
| 0.0 | 0.1 | GO:0071458 | integral component of cytoplasmic side of endoplasmic reticulum membrane(GO:0071458) |
| 0.0 | 0.3 | GO:0097427 | microtubule bundle(GO:0097427) |
| 0.0 | 0.3 | GO:0034464 | BBSome(GO:0034464) |
| 0.0 | 0.1 | GO:0070876 | SOSS complex(GO:0070876) |
| 0.0 | 0.0 | GO:0017119 | Golgi transport complex(GO:0017119) |
| 0.0 | 0.2 | GO:1990393 | 3M complex(GO:1990393) |
| 0.0 | 0.3 | GO:0030123 | AP-3 adaptor complex(GO:0030123) |
| 0.0 | 0.3 | GO:0000813 | ESCRT I complex(GO:0000813) |
| 0.0 | 0.5 | GO:0042613 | MHC class II protein complex(GO:0042613) |
| 0.0 | 0.2 | GO:0035976 | AP1 complex(GO:0035976) |
| 0.0 | 0.3 | GO:0031301 | integral component of organelle membrane(GO:0031301) |
| 0.0 | 0.4 | GO:0005736 | DNA-directed RNA polymerase I complex(GO:0005736) |
| 0.0 | 0.1 | GO:0034750 | Scrib-APC-beta-catenin complex(GO:0034750) |
| 0.0 | 0.3 | GO:0033180 | proton-transporting V-type ATPase, V1 domain(GO:0033180) |
| 0.0 | 0.1 | GO:0070195 | growth hormone receptor complex(GO:0070195) |
| 0.0 | 0.2 | GO:0071144 | SMAD2-SMAD3 protein complex(GO:0071144) |
| 0.0 | 0.3 | GO:0043679 | axon terminus(GO:0043679) |
| 0.0 | 0.2 | GO:0045275 | mitochondrial respiratory chain complex III(GO:0005750) respiratory chain complex III(GO:0045275) |
| 0.0 | 0.4 | GO:0014731 | spectrin-associated cytoskeleton(GO:0014731) |
| 0.0 | 0.1 | GO:1990745 | EARP complex(GO:1990745) |
| 0.0 | 0.5 | GO:0070069 | cytochrome complex(GO:0070069) |
| 0.0 | 0.2 | GO:1990316 | ATG1/ULK1 kinase complex(GO:1990316) |
| 0.0 | 0.1 | GO:0017102 | methionyl glutamyl tRNA synthetase complex(GO:0017102) |
| 0.0 | 0.4 | GO:0005952 | cAMP-dependent protein kinase complex(GO:0005952) |
| 0.0 | 0.1 | GO:0031314 | extrinsic component of mitochondrial inner membrane(GO:0031314) |
| 0.0 | 0.1 | GO:0035339 | SPOTS complex(GO:0035339) |
| 0.0 | 0.1 | GO:0070435 | Shc-EGFR complex(GO:0070435) |
| 0.0 | 0.2 | GO:0097197 | tetraspanin-enriched microdomain(GO:0097197) |
| 0.0 | 0.2 | GO:0044300 | cerebellar mossy fiber(GO:0044300) |
| 0.0 | 0.1 | GO:0034688 | integrin alphaM-beta2 complex(GO:0034688) |
| 0.0 | 0.1 | GO:0032279 | asymmetric synapse(GO:0032279) |
| 0.0 | 0.7 | GO:0009925 | basal plasma membrane(GO:0009925) |
| 0.0 | 0.4 | GO:0005922 | connexon complex(GO:0005922) |
| 0.0 | 0.2 | GO:0000124 | SAGA complex(GO:0000124) |
| 0.0 | 0.4 | GO:0016459 | myosin complex(GO:0016459) |
| 0.0 | 1.4 | GO:0034707 | chloride channel complex(GO:0034707) |
| 0.0 | 0.2 | GO:0030130 | clathrin coat of trans-Golgi network vesicle(GO:0030130) |
| 0.0 | 0.2 | GO:0098574 | cytoplasmic side of lysosomal membrane(GO:0098574) |
| 0.0 | 0.2 | GO:0033017 | sarcoplasmic reticulum membrane(GO:0033017) |
| 0.0 | 0.7 | GO:1904115 | axon cytoplasm(GO:1904115) |
| 0.0 | 0.1 | GO:0072669 | tRNA-splicing ligase complex(GO:0072669) |
| 0.0 | 0.1 | GO:0043219 | lateral loop(GO:0043219) |
| 0.0 | 0.1 | GO:0097136 | Bcl-2 family protein complex(GO:0097136) |
| 0.0 | 0.0 | GO:0042583 | chromaffin granule(GO:0042583) |
| 0.0 | 0.7 | GO:0000791 | euchromatin(GO:0000791) |
| 0.0 | 0.5 | GO:0071339 | MLL1/2 complex(GO:0044665) MLL1 complex(GO:0071339) |
| 0.0 | 0.2 | GO:0030056 | hemidesmosome(GO:0030056) |
| 0.0 | 0.1 | GO:0097470 | ribbon synapse(GO:0097470) |
| 0.0 | 0.5 | GO:0044291 | cell-cell contact zone(GO:0044291) |
| 0.0 | 0.1 | GO:0030015 | CCR4-NOT core complex(GO:0030015) |
| 0.0 | 0.1 | GO:0035032 | phosphatidylinositol 3-kinase complex, class III(GO:0035032) |
| 0.0 | 0.1 | GO:0035838 | growing cell tip(GO:0035838) |
| 0.0 | 1.4 | GO:0036064 | ciliary basal body(GO:0036064) |
| 0.0 | 0.1 | GO:0070937 | CRD-mediated mRNA stability complex(GO:0070937) |
| 0.0 | 0.4 | GO:0044322 | endoplasmic reticulum quality control compartment(GO:0044322) |
| 0.0 | 0.1 | GO:0044194 | cytolytic granule(GO:0044194) |
| 0.0 | 0.2 | GO:0042627 | chylomicron(GO:0042627) |
| 0.0 | 0.2 | GO:0042405 | nuclear inclusion body(GO:0042405) |
| 0.0 | 0.3 | GO:0031528 | microvillus membrane(GO:0031528) |
| 0.0 | 0.1 | GO:0000137 | Golgi cis cisterna(GO:0000137) |
| 0.0 | 0.9 | GO:0000118 | histone deacetylase complex(GO:0000118) |
| 0.0 | 0.5 | GO:0035580 | specific granule lumen(GO:0035580) |
| 0.0 | 0.1 | GO:1990909 | Wnt signalosome(GO:1990909) |
Gene overrepresentation in molecular_function category:
| Log-likelihood per target | Total log-likelihood | Term | Description |
|---|---|---|---|
| 0.4 | 2.2 | GO:0060961 | phospholipase D inhibitor activity(GO:0060961) |
| 0.4 | 1.9 | GO:0038062 | protein tyrosine kinase collagen receptor activity(GO:0038062) |
| 0.3 | 0.6 | GO:0016641 | oxidoreductase activity, acting on the CH-NH2 group of donors, oxygen as acceptor(GO:0016641) |
| 0.2 | 1.0 | GO:0015375 | glycine:sodium symporter activity(GO:0015375) |
| 0.2 | 0.6 | GO:0038131 | neuregulin receptor activity(GO:0038131) |
| 0.2 | 0.6 | GO:0098782 | mechanically-gated potassium channel activity(GO:0098782) |
| 0.2 | 2.6 | GO:0031014 | troponin T binding(GO:0031014) |
| 0.2 | 0.6 | GO:0031896 | V2 vasopressin receptor binding(GO:0031896) |
| 0.2 | 1.6 | GO:0086083 | cell adhesive protein binding involved in bundle of His cell-Purkinje myocyte communication(GO:0086083) |
| 0.2 | 0.6 | GO:0035651 | AP-3 adaptor complex binding(GO:0035651) |
| 0.2 | 0.5 | GO:0008955 | peptidoglycan glycosyltransferase activity(GO:0008955) |
| 0.2 | 0.5 | GO:0036313 | phosphatidylinositol 3-kinase catalytic subunit binding(GO:0036313) |
| 0.1 | 0.4 | GO:0086062 | voltage-gated sodium channel activity involved in Purkinje myocyte action potential(GO:0086062) |
| 0.1 | 0.7 | GO:0004105 | choline-phosphate cytidylyltransferase activity(GO:0004105) |
| 0.1 | 0.6 | GO:0035939 | microsatellite binding(GO:0035939) |
| 0.1 | 1.0 | GO:0004111 | creatine kinase activity(GO:0004111) |
| 0.1 | 0.4 | GO:0004947 | bradykinin receptor activity(GO:0004947) |
| 0.1 | 0.8 | GO:0016314 | phosphatidylinositol-3,4,5-trisphosphate 3-phosphatase activity(GO:0016314) |
| 0.1 | 0.4 | GO:1904599 | advanced glycation end-product binding(GO:1904599) |
| 0.1 | 0.6 | GO:0001025 | RNA polymerase III transcription factor binding(GO:0001025) |
| 0.1 | 0.4 | GO:0031751 | D4 dopamine receptor binding(GO:0031751) |
| 0.1 | 0.7 | GO:0005166 | neurotrophin p75 receptor binding(GO:0005166) |
| 0.1 | 0.4 | GO:0019912 | cyclin-dependent protein kinase activating kinase activity(GO:0019912) |
| 0.1 | 0.6 | GO:0001641 | group II metabotropic glutamate receptor activity(GO:0001641) |
| 0.1 | 0.8 | GO:0035662 | Toll-like receptor 4 binding(GO:0035662) |
| 0.1 | 0.8 | GO:0004522 | ribonuclease A activity(GO:0004522) |
| 0.1 | 0.5 | GO:0004995 | tachykinin receptor activity(GO:0004995) |
| 0.1 | 0.3 | GO:0004574 | oligo-1,6-glucosidase activity(GO:0004574) |
| 0.1 | 0.5 | GO:0033265 | choline binding(GO:0033265) |
| 0.1 | 0.3 | GO:0016534 | cyclin-dependent protein kinase 5 activator activity(GO:0016534) |
| 0.1 | 0.3 | GO:0004914 | interleukin-5 receptor activity(GO:0004914) |
| 0.1 | 0.1 | GO:0030229 | very-low-density lipoprotein particle receptor activity(GO:0030229) |
| 0.1 | 0.1 | GO:0031692 | alpha-1B adrenergic receptor binding(GO:0031692) |
| 0.1 | 0.7 | GO:0019960 | C-X3-C chemokine binding(GO:0019960) |
| 0.1 | 0.4 | GO:0004359 | glutaminase activity(GO:0004359) |
| 0.1 | 0.3 | GO:0004530 | deoxyribonuclease I activity(GO:0004530) |
| 0.1 | 0.5 | GO:0045174 | oxidoreductase activity, acting on a sulfur group of donors, quinone or similar compound as acceptor(GO:0016672) glutathione dehydrogenase (ascorbate) activity(GO:0045174) methylarsonate reductase activity(GO:0050610) |
| 0.1 | 0.3 | GO:0015039 | ferredoxin-NADP+ reductase activity(GO:0004324) NADPH-adrenodoxin reductase activity(GO:0015039) oxidoreductase activity, acting on iron-sulfur proteins as donors(GO:0016730) oxidoreductase activity, acting on iron-sulfur proteins as donors, NAD or NADP as acceptor(GO:0016731) |
| 0.1 | 0.4 | GO:0004992 | platelet activating factor receptor activity(GO:0004992) |
| 0.1 | 0.4 | GO:0002046 | opsin binding(GO:0002046) |
| 0.1 | 0.2 | GO:0033878 | hormone-sensitive lipase activity(GO:0033878) |
| 0.1 | 0.2 | GO:0050698 | proteoglycan sulfotransferase activity(GO:0050698) |
| 0.1 | 0.2 | GO:0036134 | thromboxane-A synthase activity(GO:0004796) 12-hydroxyheptadecatrienoic acid synthase activity(GO:0036134) |
| 0.1 | 0.2 | GO:0086006 | voltage-gated sodium channel activity involved in cardiac muscle cell action potential(GO:0086006) |
| 0.1 | 0.4 | GO:0042289 | MHC class II protein binding(GO:0042289) |
| 0.1 | 1.9 | GO:0004697 | protein kinase C activity(GO:0004697) |
| 0.1 | 0.3 | GO:0022897 | peptide:proton symporter activity(GO:0015333) proton-dependent peptide secondary active transmembrane transporter activity(GO:0022897) |
| 0.1 | 0.2 | GO:0004672 | protein kinase activity(GO:0004672) |
| 0.1 | 0.2 | GO:0008506 | sucrose:proton symporter activity(GO:0008506) sucrose transmembrane transporter activity(GO:0008515) disaccharide transmembrane transporter activity(GO:0015154) oligosaccharide transmembrane transporter activity(GO:0015157) |
| 0.1 | 0.4 | GO:0008454 | alpha-1,3-mannosylglycoprotein 4-beta-N-acetylglucosaminyltransferase activity(GO:0008454) |
| 0.1 | 0.7 | GO:0004865 | protein serine/threonine phosphatase inhibitor activity(GO:0004865) |
| 0.1 | 0.2 | GO:0047325 | inositol tetrakisphosphate 1-kinase activity(GO:0047325) inositol-1,3,4-trisphosphate 6-kinase activity(GO:0052725) inositol-1,3,4-trisphosphate 5-kinase activity(GO:0052726) inositol-1,3,4,5,6-pentakisphosphate 1-phosphatase activity(GO:0052825) inositol-1,3,4,6-tetrakisphosphate 6-phosphatase activity(GO:0052830) inositol-1,3,4,6-tetrakisphosphate 1-phosphatase activity(GO:0052831) inositol-3,4,6-trisphosphate 1-kinase activity(GO:0052835) |
| 0.1 | 0.8 | GO:0005007 | fibroblast growth factor-activated receptor activity(GO:0005007) |
| 0.1 | 0.3 | GO:0004668 | protein-arginine deiminase activity(GO:0004668) |
| 0.1 | 0.1 | GO:0070905 | serine binding(GO:0070905) |
| 0.1 | 0.2 | GO:0047718 | indanol dehydrogenase activity(GO:0047718) |
| 0.1 | 0.4 | GO:0052656 | branched-chain-amino-acid transaminase activity(GO:0004084) L-leucine transaminase activity(GO:0052654) L-valine transaminase activity(GO:0052655) L-isoleucine transaminase activity(GO:0052656) |
| 0.1 | 0.7 | GO:0038132 | neuregulin binding(GO:0038132) |
| 0.1 | 0.2 | GO:0003845 | 11-beta-hydroxysteroid dehydrogenase [NAD(P)] activity(GO:0003845) |
| 0.1 | 1.8 | GO:0098641 | cadherin binding involved in cell-cell adhesion(GO:0098641) |
| 0.1 | 1.6 | GO:0002162 | dystroglycan binding(GO:0002162) |
| 0.1 | 1.4 | GO:0004707 | MAP kinase activity(GO:0004707) |
| 0.1 | 0.7 | GO:0031386 | protein tag(GO:0031386) |
| 0.1 | 0.2 | GO:0015319 | sodium:inorganic phosphate symporter activity(GO:0015319) |
| 0.1 | 0.3 | GO:0052832 | inositol monophosphate 1-phosphatase activity(GO:0008934) inositol monophosphate 3-phosphatase activity(GO:0052832) inositol monophosphate 4-phosphatase activity(GO:0052833) inositol monophosphate phosphatase activity(GO:0052834) |
| 0.1 | 0.6 | GO:0004652 | polynucleotide adenylyltransferase activity(GO:0004652) |
| 0.1 | 0.2 | GO:0005222 | intracellular cAMP activated cation channel activity(GO:0005222) |
| 0.1 | 0.2 | GO:0004052 | arachidonate 12-lipoxygenase activity(GO:0004052) |
| 0.1 | 0.3 | GO:0070644 | vitamin D response element binding(GO:0070644) |
| 0.1 | 0.9 | GO:0004859 | phospholipase inhibitor activity(GO:0004859) |
| 0.1 | 0.2 | GO:0004362 | glutathione-disulfide reductase activity(GO:0004362) |
| 0.1 | 0.6 | GO:0016888 | endodeoxyribonuclease activity, producing 5'-phosphomonoesters(GO:0016888) |
| 0.1 | 0.2 | GO:0016262 | protein N-acetylglucosaminyltransferase activity(GO:0016262) |
| 0.1 | 0.8 | GO:0009931 | calcium-dependent protein serine/threonine kinase activity(GO:0009931) |
| 0.1 | 0.2 | GO:0052836 | inositol 5-diphosphate pentakisphosphate 5-kinase activity(GO:0052836) inositol diphosphate tetrakisphosphate kinase activity(GO:0052839) |
| 0.1 | 0.3 | GO:0008269 | JAK pathway signal transduction adaptor activity(GO:0008269) |
| 0.0 | 0.2 | GO:0016784 | 3-mercaptopyruvate sulfurtransferase activity(GO:0016784) |
| 0.0 | 0.2 | GO:0033981 | D-dopachrome decarboxylase activity(GO:0033981) |
| 0.0 | 0.3 | GO:0043183 | vascular endothelial growth factor receptor 1 binding(GO:0043183) |
| 0.0 | 0.6 | GO:0098632 | protein binding involved in cell-cell adhesion(GO:0098632) |
| 0.0 | 0.3 | GO:0051525 | NFAT protein binding(GO:0051525) |
| 0.0 | 0.1 | GO:0097259 | tocopherol omega-hydroxylase activity(GO:0052870) alpha-tocopherol omega-hydroxylase activity(GO:0052871) 20-hydroxy-leukotriene B4 omega oxidase activity(GO:0097258) 20-aldehyde-leukotriene B4 20-monooxygenase activity(GO:0097259) |
| 0.0 | 0.1 | GO:0050659 | N-acetylgalactosamine 4-sulfate 6-O-sulfotransferase activity(GO:0050659) |
| 0.0 | 0.2 | GO:0008112 | nicotinamide N-methyltransferase activity(GO:0008112) pyridine N-methyltransferase activity(GO:0030760) |
| 0.0 | 0.2 | GO:0008426 | protein kinase C inhibitor activity(GO:0008426) |
| 0.0 | 0.4 | GO:0004046 | aminoacylase activity(GO:0004046) |
| 0.0 | 0.8 | GO:0030957 | Tat protein binding(GO:0030957) |
| 0.0 | 0.4 | GO:0005250 | A-type (transient outward) potassium channel activity(GO:0005250) |
| 0.0 | 0.6 | GO:0089720 | caspase binding(GO:0089720) |
| 0.0 | 0.2 | GO:0009041 | uridylate kinase activity(GO:0009041) |
| 0.0 | 1.2 | GO:0005001 | transmembrane receptor protein tyrosine phosphatase activity(GO:0005001) transmembrane receptor protein phosphatase activity(GO:0019198) |
| 0.0 | 0.2 | GO:0008665 | 2'-phosphotransferase activity(GO:0008665) |
| 0.0 | 0.3 | GO:0016802 | adenosylhomocysteinase activity(GO:0004013) trialkylsulfonium hydrolase activity(GO:0016802) |
| 0.0 | 0.1 | GO:1902122 | chenodeoxycholic acid binding(GO:1902122) |
| 0.0 | 0.0 | GO:0051765 | inositol tetrakisphosphate kinase activity(GO:0051765) |
| 0.0 | 0.6 | GO:1901702 | urate transmembrane transporter activity(GO:0015143) salt transmembrane transporter activity(GO:1901702) |
| 0.0 | 0.4 | GO:0008525 | phosphatidylcholine transporter activity(GO:0008525) |
| 0.0 | 2.5 | GO:0017080 | sodium channel regulator activity(GO:0017080) |
| 0.0 | 0.1 | GO:0034353 | RNA pyrophosphohydrolase activity(GO:0034353) |
| 0.0 | 0.4 | GO:0003876 | AMP deaminase activity(GO:0003876) adenosine-phosphate deaminase activity(GO:0047623) |
| 0.0 | 0.2 | GO:0035515 | oxidative RNA demethylase activity(GO:0035515) |
| 0.0 | 0.5 | GO:0017176 | phosphatidylinositol N-acetylglucosaminyltransferase activity(GO:0017176) |
| 0.0 | 1.0 | GO:0008239 | dipeptidyl-peptidase activity(GO:0008239) |
| 0.0 | 3.3 | GO:0097110 | scaffold protein binding(GO:0097110) |
| 0.0 | 0.6 | GO:0003993 | acid phosphatase activity(GO:0003993) |
| 0.0 | 0.6 | GO:0035325 | Toll-like receptor binding(GO:0035325) |
| 0.0 | 0.0 | GO:0017127 | cholesterol transporter activity(GO:0017127) |
| 0.0 | 0.7 | GO:0004089 | carbonate dehydratase activity(GO:0004089) |
| 0.0 | 0.1 | GO:0004618 | phosphoglycerate kinase activity(GO:0004618) |
| 0.0 | 0.7 | GO:0031701 | angiotensin receptor binding(GO:0031701) type 1 angiotensin receptor binding(GO:0031702) |
| 0.0 | 0.1 | GO:0004603 | phenylethanolamine N-methyltransferase activity(GO:0004603) |
| 0.0 | 0.1 | GO:0086089 | voltage-gated potassium channel activity involved in atrial cardiac muscle cell action potential repolarization(GO:0086089) |
| 0.0 | 0.3 | GO:0008732 | glycine hydroxymethyltransferase activity(GO:0004372) threonine aldolase activity(GO:0004793) L-allo-threonine aldolase activity(GO:0008732) |
| 0.0 | 0.2 | GO:0016639 | oxidoreductase activity, acting on the CH-NH2 group of donors, NAD or NADP as acceptor(GO:0016639) |
| 0.0 | 0.4 | GO:0003996 | acyl-CoA ligase activity(GO:0003996) |
| 0.0 | 0.1 | GO:0004392 | heme oxygenase (decyclizing) activity(GO:0004392) |
| 0.0 | 0.2 | GO:0008321 | Ral guanyl-nucleotide exchange factor activity(GO:0008321) |
| 0.0 | 0.4 | GO:0003810 | protein-glutamine gamma-glutamyltransferase activity(GO:0003810) |
| 0.0 | 0.6 | GO:0030306 | ADP-ribosylation factor binding(GO:0030306) |
| 0.0 | 0.1 | GO:0017130 | poly(C) RNA binding(GO:0017130) |
| 0.0 | 0.1 | GO:0004965 | G-protein coupled GABA receptor activity(GO:0004965) |
| 0.0 | 0.6 | GO:0004745 | retinol dehydrogenase activity(GO:0004745) |
| 0.0 | 0.3 | GO:0032051 | clathrin light chain binding(GO:0032051) |
| 0.0 | 0.3 | GO:0050544 | arachidonic acid binding(GO:0050544) |
| 0.0 | 0.1 | GO:0047066 | phospholipid-hydroperoxide glutathione peroxidase activity(GO:0047066) |
| 0.0 | 0.2 | GO:0016681 | ubiquinol-cytochrome-c reductase activity(GO:0008121) oxidoreductase activity, acting on diphenols and related substances as donors, cytochrome as acceptor(GO:0016681) |
| 0.0 | 0.7 | GO:0042609 | CD4 receptor binding(GO:0042609) |
| 0.0 | 0.3 | GO:0008474 | palmitoyl-(protein) hydrolase activity(GO:0008474) palmitoyl hydrolase activity(GO:0098599) |
| 0.0 | 0.2 | GO:0004630 | phospholipase D activity(GO:0004630) |
| 0.0 | 0.3 | GO:0035612 | AP-2 adaptor complex binding(GO:0035612) |
| 0.0 | 0.1 | GO:0035374 | chondroitin sulfate binding(GO:0035374) |
| 0.0 | 0.6 | GO:0015245 | fatty acid transporter activity(GO:0015245) |
| 0.0 | 0.2 | GO:0000155 | phosphorelay sensor kinase activity(GO:0000155) |
| 0.0 | 1.1 | GO:0030676 | Rac guanyl-nucleotide exchange factor activity(GO:0030676) |
| 0.0 | 0.2 | GO:0031962 | mineralocorticoid receptor binding(GO:0031962) |
| 0.0 | 0.8 | GO:0008093 | cytoskeletal adaptor activity(GO:0008093) |
| 0.0 | 1.4 | GO:0005109 | frizzled binding(GO:0005109) |
| 0.0 | 0.2 | GO:0071532 | ankyrin repeat binding(GO:0071532) |
| 0.0 | 0.3 | GO:0004303 | estradiol 17-beta-dehydrogenase activity(GO:0004303) |
| 0.0 | 0.1 | GO:0070579 | methylcytosine dioxygenase activity(GO:0070579) |
| 0.0 | 0.9 | GO:0008157 | protein phosphatase 1 binding(GO:0008157) |
| 0.0 | 0.7 | GO:0004862 | cAMP-dependent protein kinase inhibitor activity(GO:0004862) |
| 0.0 | 1.0 | GO:0004033 | aldo-keto reductase (NADP) activity(GO:0004033) |
| 0.0 | 0.4 | GO:0036312 | phosphatidylinositol 3-kinase regulatory subunit binding(GO:0036312) |
| 0.0 | 0.2 | GO:0005052 | peroxisome matrix targeting signal-1 binding(GO:0005052) |
| 0.0 | 0.2 | GO:0050815 | phosphoserine binding(GO:0050815) |
| 0.0 | 0.6 | GO:0038191 | neuropilin binding(GO:0038191) |
| 0.0 | 0.3 | GO:0045294 | alpha-catenin binding(GO:0045294) |
| 0.0 | 0.1 | GO:0050211 | procollagen galactosyltransferase activity(GO:0050211) |
| 0.0 | 0.5 | GO:0003796 | lysozyme activity(GO:0003796) |
| 0.0 | 0.8 | GO:0005212 | structural constituent of eye lens(GO:0005212) |
| 0.0 | 0.5 | GO:0042043 | neurexin family protein binding(GO:0042043) |
| 0.0 | 0.4 | GO:0001011 | transcription factor activity, sequence-specific DNA binding, RNA polymerase recruiting(GO:0001011) transcription factor activity, TFIIB-class binding(GO:0001087) |
| 0.0 | 0.1 | GO:0098640 | integrin binding involved in cell-matrix adhesion(GO:0098640) |
| 0.0 | 0.3 | GO:0070569 | uridylyltransferase activity(GO:0070569) |
| 0.0 | 0.2 | GO:0042296 | ISG15 transferase activity(GO:0042296) |
| 0.0 | 0.4 | GO:0047429 | nucleoside-triphosphate diphosphatase activity(GO:0047429) |
| 0.0 | 0.1 | GO:1904493 | Ac-Asp-Glu binding(GO:1904492) tetrahydrofolyl-poly(glutamate) polymer binding(GO:1904493) |
| 0.0 | 0.2 | GO:1902282 | voltage-gated potassium channel activity involved in ventricular cardiac muscle cell action potential repolarization(GO:1902282) |
| 0.0 | 0.1 | GO:0061599 | molybdopterin adenylyltransferase activity(GO:0061598) molybdopterin molybdotransferase activity(GO:0061599) |
| 0.0 | 0.3 | GO:0005068 | transmembrane receptor protein tyrosine kinase adaptor activity(GO:0005068) |
| 0.0 | 0.1 | GO:0052895 | norspermine:oxygen oxidoreductase activity(GO:0052894) N1-acetylspermine:oxygen oxidoreductase (N1-acetylspermidine-forming) activity(GO:0052895) |
| 0.0 | 0.0 | GO:0034041 | sterol-transporting ATPase activity(GO:0034041) |
| 0.0 | 0.3 | GO:0097322 | 7SK snRNA binding(GO:0097322) |
| 0.0 | 0.1 | GO:0033858 | N-acetylgalactosamine kinase activity(GO:0033858) |
| 0.0 | 0.1 | GO:0004720 | protein-lysine 6-oxidase activity(GO:0004720) |
| 0.0 | 0.2 | GO:0003956 | NAD(P)+-protein-arginine ADP-ribosyltransferase activity(GO:0003956) |
| 0.0 | 0.7 | GO:0005545 | 1-phosphatidylinositol binding(GO:0005545) |
| 0.0 | 0.3 | GO:0019531 | oxalate transmembrane transporter activity(GO:0019531) |
| 0.0 | 0.2 | GO:0070883 | pre-miRNA binding(GO:0070883) |
| 0.0 | 0.2 | GO:0001591 | dopamine neurotransmitter receptor activity, coupled via Gi/Go(GO:0001591) |
| 0.0 | 0.1 | GO:0099609 | microtubule lateral binding(GO:0099609) |
| 0.0 | 0.4 | GO:0050786 | RAGE receptor binding(GO:0050786) |
| 0.0 | 0.4 | GO:0036374 | glutathione hydrolase activity(GO:0036374) |
| 0.0 | 0.1 | GO:0001588 | dopamine neurotransmitter receptor activity, coupled via Gs(GO:0001588) dopamine neurotransmitter receptor activity(GO:0004952) |
| 0.0 | 0.7 | GO:0070003 | threonine-type endopeptidase activity(GO:0004298) threonine-type peptidase activity(GO:0070003) |
| 0.0 | 0.1 | GO:0047288 | monosialoganglioside sialyltransferase activity(GO:0047288) |
| 0.0 | 0.1 | GO:0004769 | steroid delta-isomerase activity(GO:0004769) |
| 0.0 | 0.1 | GO:0004090 | carbonyl reductase (NADPH) activity(GO:0004090) |
| 0.0 | 0.2 | GO:0030369 | ICAM-3 receptor activity(GO:0030369) |
| 0.0 | 0.4 | GO:0001054 | RNA polymerase I activity(GO:0001054) |
| 0.0 | 0.1 | GO:0003886 | DNA (cytosine-5-)-methyltransferase activity(GO:0003886) |
| 0.0 | 0.1 | GO:0004735 | pyrroline-5-carboxylate reductase activity(GO:0004735) |
| 0.0 | 1.0 | GO:0003785 | actin monomer binding(GO:0003785) |
| 0.0 | 0.2 | GO:0001730 | 2'-5'-oligoadenylate synthetase activity(GO:0001730) |
| 0.0 | 6.6 | GO:0004252 | serine-type endopeptidase activity(GO:0004252) |
| 0.0 | 0.3 | GO:0019855 | calcium channel inhibitor activity(GO:0019855) |
| 0.0 | 0.1 | GO:0036435 | K48-linked polyubiquitin binding(GO:0036435) |
| 0.0 | 0.1 | GO:0005026 | transforming growth factor beta receptor activity, type II(GO:0005026) |
| 0.0 | 0.1 | GO:0043237 | laminin-1 binding(GO:0043237) |
| 0.0 | 0.8 | GO:0001784 | phosphotyrosine binding(GO:0001784) |
| 0.0 | 0.1 | GO:0019136 | deoxynucleoside kinase activity(GO:0019136) |
| 0.0 | 0.0 | GO:0031697 | beta-1 adrenergic receptor binding(GO:0031697) |
| 0.0 | 0.1 | GO:0004140 | dephospho-CoA kinase activity(GO:0004140) |
| 0.0 | 0.2 | GO:0008201 | heparin binding(GO:0008201) |
| 0.0 | 0.2 | GO:0015379 | potassium:chloride symporter activity(GO:0015379) potassium ion symporter activity(GO:0022820) |
| 0.0 | 0.1 | GO:0004830 | tryptophan-tRNA ligase activity(GO:0004830) |
| 0.0 | 0.5 | GO:0030553 | cGMP binding(GO:0030553) |
| 0.0 | 0.1 | GO:0017077 | oxidative phosphorylation uncoupler activity(GO:0017077) |
| 0.0 | 0.1 | GO:0035379 | carbon dioxide transmembrane transporter activity(GO:0035379) |
| 0.0 | 0.1 | GO:0005131 | growth hormone receptor binding(GO:0005131) |
| 0.0 | 0.5 | GO:0001871 | pattern binding(GO:0001871) polysaccharide binding(GO:0030247) |
| 0.0 | 0.1 | GO:0008139 | nuclear localization sequence binding(GO:0008139) |
| 0.0 | 0.1 | GO:0030348 | syntaxin-3 binding(GO:0030348) |
| 0.0 | 0.1 | GO:0052794 | exo-alpha-(2->3)-sialidase activity(GO:0052794) exo-alpha-(2->6)-sialidase activity(GO:0052795) exo-alpha-(2->8)-sialidase activity(GO:0052796) |
| 0.0 | 0.7 | GO:0000983 | transcription factor activity, RNA polymerase II core promoter sequence-specific(GO:0000983) |
| 0.0 | 0.2 | GO:0039706 | co-receptor binding(GO:0039706) |
| 0.0 | 0.1 | GO:0051733 | ATP-dependent polydeoxyribonucleotide 5'-hydroxyl-kinase activity(GO:0046404) polydeoxyribonucleotide kinase activity(GO:0051733) ATP-dependent polynucleotide kinase activity(GO:0051734) polynucleotide phosphatase activity(GO:0098518) |
| 0.0 | 0.1 | GO:0004967 | glucagon receptor activity(GO:0004967) |
| 0.0 | 0.1 | GO:0030272 | 5-formyltetrahydrofolate cyclo-ligase activity(GO:0030272) |
| 0.0 | 0.2 | GO:0004117 | calmodulin-dependent cyclic-nucleotide phosphodiesterase activity(GO:0004117) |
| 0.0 | 0.3 | GO:0008061 | chitin binding(GO:0008061) |
| 0.0 | 0.1 | GO:0004711 | ribosomal protein S6 kinase activity(GO:0004711) |
| 0.0 | 0.7 | GO:0042605 | peptide antigen binding(GO:0042605) |
| 0.0 | 0.5 | GO:0005229 | intracellular calcium activated chloride channel activity(GO:0005229) |
| 0.0 | 0.1 | GO:0055077 | gap junction hemi-channel activity(GO:0055077) gap junction channel activity involved in SA node cell-atrial cardiac muscle cell electrical coupling(GO:0086020) |
| 0.0 | 0.3 | GO:0070016 | armadillo repeat domain binding(GO:0070016) |
| 0.0 | 0.1 | GO:0032089 | NACHT domain binding(GO:0032089) |
| 0.0 | 0.2 | GO:0019784 | NEDD8-specific protease activity(GO:0019784) |
| 0.0 | 0.1 | GO:1990254 | keratin filament binding(GO:1990254) |
| 0.0 | 0.1 | GO:0004489 | methylenetetrahydrofolate reductase (NAD(P)H) activity(GO:0004489) |
| 0.0 | 0.2 | GO:0016721 | superoxide dismutase activity(GO:0004784) oxidoreductase activity, acting on superoxide radicals as acceptor(GO:0016721) |
| 0.0 | 0.1 | GO:0050436 | microfibril binding(GO:0050436) |
| 0.0 | 0.2 | GO:0047499 | calcium-independent phospholipase A2 activity(GO:0047499) |
| 0.0 | 0.1 | GO:0030267 | hydroxypyruvate reductase activity(GO:0016618) glyoxylate reductase (NADP) activity(GO:0030267) |
| 0.0 | 0.1 | GO:0019534 | toxin transporter activity(GO:0019534) |
| 0.0 | 0.1 | GO:0015389 | pyrimidine- and adenine-specific:sodium symporter activity(GO:0015389) |
| 0.0 | 0.2 | GO:0004311 | farnesyltranstransferase activity(GO:0004311) |
| 0.0 | 0.1 | GO:0015271 | outward rectifier potassium channel activity(GO:0015271) |
| 0.0 | 0.1 | GO:0047756 | chondroitin 4-sulfotransferase activity(GO:0047756) |
| 0.0 | 0.1 | GO:0030144 | alpha-1,6-mannosylglycoprotein 6-beta-N-acetylglucosaminyltransferase activity(GO:0030144) |
| 0.0 | 0.3 | GO:0001134 | transcription factor activity, transcription factor recruiting(GO:0001134) |
| 0.0 | 0.1 | GO:0070740 | tubulin-glutamic acid ligase activity(GO:0070740) |
| 0.0 | 1.6 | GO:0003707 | steroid hormone receptor activity(GO:0003707) |
| 0.0 | 0.2 | GO:0038036 | sphingosine-1-phosphate receptor activity(GO:0038036) |
| 0.0 | 0.1 | GO:0008559 | xenobiotic-transporting ATPase activity(GO:0008559) |
| 0.0 | 0.1 | GO:0070891 | lipoteichoic acid binding(GO:0070891) |
| 0.0 | 1.0 | GO:0004407 | histone deacetylase activity(GO:0004407) |
| 0.0 | 0.4 | GO:0004602 | glutathione peroxidase activity(GO:0004602) |
| 0.0 | 0.2 | GO:0005391 | sodium:potassium-exchanging ATPase activity(GO:0005391) |
| 0.0 | 0.2 | GO:0032454 | histone demethylase activity (H3-K9 specific)(GO:0032454) |
| 0.0 | 0.3 | GO:0005149 | interleukin-1 receptor binding(GO:0005149) |
| 0.0 | 0.1 | GO:0004470 | malic enzyme activity(GO:0004470) |
| 0.0 | 0.1 | GO:0008131 | primary amine oxidase activity(GO:0008131) |
| 0.0 | 0.0 | GO:0031783 | corticotropin hormone receptor binding(GO:0031780) type 5 melanocortin receptor binding(GO:0031783) |
| 0.0 | 0.2 | GO:0035259 | glucocorticoid receptor binding(GO:0035259) |
| 0.0 | 0.0 | GO:0071885 | N-terminal protein N-methyltransferase activity(GO:0071885) |
| 0.0 | 0.1 | GO:0044736 | acid-sensing ion channel activity(GO:0044736) |
| 0.0 | 0.2 | GO:0009982 | pseudouridine synthase activity(GO:0009982) |
| 0.0 | 0.1 | GO:0009383 | rRNA (cytosine-C5-)-methyltransferase activity(GO:0009383) |
| 0.0 | 0.2 | GO:0044548 | S100 protein binding(GO:0044548) |
| 0.0 | 0.1 | GO:0008073 | ornithine decarboxylase inhibitor activity(GO:0008073) |
| 0.0 | 0.2 | GO:0004708 | MAP kinase kinase activity(GO:0004708) |
| 0.0 | 0.4 | GO:0004435 | phosphatidylinositol phospholipase C activity(GO:0004435) |
| 0.0 | 0.3 | GO:0008331 | high voltage-gated calcium channel activity(GO:0008331) |
| 0.0 | 0.1 | GO:0047522 | 13-prostaglandin reductase activity(GO:0036132) 15-oxoprostaglandin 13-oxidase activity(GO:0047522) |
| 0.0 | 0.2 | GO:0016723 | oxidoreductase activity, oxidizing metal ions, NAD or NADP as acceptor(GO:0016723) |
| 0.0 | 0.1 | GO:0097016 | L27 domain binding(GO:0097016) |
| 0.0 | 0.2 | GO:0005347 | ATP transmembrane transporter activity(GO:0005347) ADP transmembrane transporter activity(GO:0015217) |
| 0.0 | 0.0 | GO:0004740 | pyruvate dehydrogenase (acetyl-transferring) kinase activity(GO:0004740) |
| 0.0 | 0.0 | GO:0003938 | IMP dehydrogenase activity(GO:0003938) |
| 0.0 | 0.0 | GO:0004911 | interleukin-2 receptor activity(GO:0004911) interleukin-2 binding(GO:0019976) |
| 0.0 | 0.1 | GO:0003998 | acylphosphatase activity(GO:0003998) |
| 0.0 | 0.3 | GO:0051537 | 2 iron, 2 sulfur cluster binding(GO:0051537) |
| 0.0 | 0.0 | GO:0016429 | tRNA (adenine) methyltransferase activity(GO:0016426) tRNA (adenine-N1-)-methyltransferase activity(GO:0016429) |
| 0.0 | 0.3 | GO:0001972 | retinoic acid binding(GO:0001972) |
| 0.0 | 0.7 | GO:0005544 | calcium-dependent phospholipid binding(GO:0005544) |
| 0.0 | 0.1 | GO:0043422 | protein kinase B binding(GO:0043422) |
| 0.0 | 0.1 | GO:0004535 | poly(A)-specific ribonuclease activity(GO:0004535) |
| 0.0 | 0.2 | GO:0016594 | glycine binding(GO:0016594) |
| 0.0 | 0.5 | GO:0005164 | tumor necrosis factor receptor binding(GO:0005164) |
| 0.0 | 0.2 | GO:0005520 | insulin-like growth factor binding(GO:0005520) |
| 0.0 | 0.6 | GO:0048365 | Rac GTPase binding(GO:0048365) |
| 0.0 | 0.1 | GO:0005522 | profilin binding(GO:0005522) |
| 0.0 | 0.1 | GO:0047894 | flavonol 3-sulfotransferase activity(GO:0047894) steroid sulfotransferase activity(GO:0050294) |
| 0.0 | 0.5 | GO:0044390 | ubiquitin-like protein conjugating enzyme binding(GO:0044390) |
| 0.0 | 1.4 | GO:0004867 | serine-type endopeptidase inhibitor activity(GO:0004867) |
| 0.0 | 0.6 | GO:0004715 | non-membrane spanning protein tyrosine kinase activity(GO:0004715) |
| 0.0 | 0.1 | GO:0008046 | axon guidance receptor activity(GO:0008046) |
| 0.0 | 0.1 | GO:0043141 | ATP-dependent 5'-3' DNA helicase activity(GO:0043141) |
| 0.0 | 0.1 | GO:0032052 | bile acid binding(GO:0032052) |
| 0.0 | 0.0 | GO:0008309 | double-stranded DNA exodeoxyribonuclease activity(GO:0008309) |
Gene overrepresentation in C2:CP category:
| Log-likelihood per target | Total log-likelihood | Term | Description |
|---|---|---|---|
| 0.0 | 2.2 | PID ALPHA SYNUCLEIN PATHWAY | Alpha-synuclein signaling |
| 0.0 | 2.1 | PID INSULIN GLUCOSE PATHWAY | Insulin-mediated glucose transport |
| 0.0 | 0.9 | PID P38 GAMMA DELTA PATHWAY | Signaling mediated by p38-gamma and p38-delta |
| 0.0 | 1.8 | SA B CELL RECEPTOR COMPLEXES | Antigen binding to B cell receptors activates protein tyrosine kinases, such as the Src family, which ultimate activate MAP kinases. |
| 0.0 | 2.2 | PID EPHRINB REV PATHWAY | Ephrin B reverse signaling |
| 0.0 | 0.8 | PID ECADHERIN KERATINOCYTE PATHWAY | E-cadherin signaling in keratinocytes |
| 0.0 | 0.4 | PID IL23 PATHWAY | IL23-mediated signaling events |
| 0.0 | 2.0 | PID EPO PATHWAY | EPO signaling pathway |
| 0.0 | 0.4 | PID RANBP2 PATHWAY | Sumoylation by RanBP2 regulates transcriptional repression |
| 0.0 | 3.1 | PID TAP63 PATHWAY | Validated transcriptional targets of TAp63 isoforms |
| 0.0 | 0.3 | PID IL5 PATHWAY | IL5-mediated signaling events |
| 0.0 | 0.3 | ST TYPE I INTERFERON PATHWAY | Type I Interferon (alpha/beta IFN) Pathway |
| 0.0 | 0.9 | ST GA12 PATHWAY | G alpha 12 Pathway |
| 0.0 | 0.4 | SA REG CASCADE OF CYCLIN EXPR | Expression of cyclins regulates progression through the cell cycle by activating cyclin-dependent kinases. |
| 0.0 | 1.0 | PID FGF PATHWAY | FGF signaling pathway |
| 0.0 | 0.9 | PID TXA2PATHWAY | Thromboxane A2 receptor signaling |
| 0.0 | 0.6 | PID IL8 CXCR1 PATHWAY | IL8- and CXCR1-mediated signaling events |
| 0.0 | 0.4 | ST INTERLEUKIN 4 PATHWAY | Interleukin 4 (IL-4) Pathway |
| 0.0 | 1.3 | PID DELTA NP63 PATHWAY | Validated transcriptional targets of deltaNp63 isoforms |
| 0.0 | 0.3 | PID S1P S1P4 PATHWAY | S1P4 pathway |
| 0.0 | 0.5 | PID ERB GENOMIC PATHWAY | Validated nuclear estrogen receptor beta network |
| 0.0 | 0.2 | PID IL3 PATHWAY | IL3-mediated signaling events |
| 0.0 | 1.2 | PID P38 ALPHA BETA DOWNSTREAM PATHWAY | Signaling mediated by p38-alpha and p38-beta |
| 0.0 | 1.1 | SIG REGULATION OF THE ACTIN CYTOSKELETON BY RHO GTPASES | Genes related to regulation of the actin cytoskeleton |
| 0.0 | 0.2 | PID IL8 CXCR2 PATHWAY | IL8- and CXCR2-mediated signaling events |
| 0.0 | 0.3 | PID NETRIN PATHWAY | Netrin-mediated signaling events |
| 0.0 | 0.5 | PID INTEGRIN5 PATHWAY | Beta5 beta6 beta7 and beta8 integrin cell surface interactions |
| 0.0 | 0.3 | PID FRA PATHWAY | Validated transcriptional targets of AP1 family members Fra1 and Fra2 |
| 0.0 | 1.6 | PID P73PATHWAY | p73 transcription factor network |
| 0.0 | 0.2 | PID WNT NONCANONICAL PATHWAY | Noncanonical Wnt signaling pathway |
| 0.0 | 0.5 | PID IFNG PATHWAY | IFN-gamma pathway |
| 0.0 | 1.2 | PID REG GR PATHWAY | Glucocorticoid receptor regulatory network |
| 0.0 | 0.7 | PID HES HEY PATHWAY | Notch-mediated HES/HEY network |
| 0.0 | 0.4 | PID HDAC CLASSII PATHWAY | Signaling events mediated by HDAC Class II |
| 0.0 | 0.3 | PID GLYPICAN 1PATHWAY | Glypican 1 network |
| 0.0 | 0.3 | ST ERK1 ERK2 MAPK PATHWAY | ERK1/ERK2 MAPK Pathway |
| 0.0 | 0.2 | ST WNT CA2 CYCLIC GMP PATHWAY | Wnt/Ca2+/cyclic GMP signaling. |
| 0.0 | 0.4 | PID TOLL ENDOGENOUS PATHWAY | Endogenous TLR signaling |
| 0.0 | 0.4 | PID WNT SIGNALING PATHWAY | Wnt signaling network |
| 0.0 | 0.7 | PID VEGFR1 2 PATHWAY | Signaling events mediated by VEGFR1 and VEGFR2 |
| 0.0 | 0.7 | PID NFAT TFPATHWAY | Calcineurin-regulated NFAT-dependent transcription in lymphocytes |
| 0.0 | 0.1 | SIG CHEMOTAXIS | Genes related to chemotaxis |
| 0.0 | 0.5 | PID PS1 PATHWAY | Presenilin action in Notch and Wnt signaling |
| 0.0 | 0.4 | PID FOXO PATHWAY | FoxO family signaling |
Gene overrepresentation in C2:CP:REACTOME category:
| Log-likelihood per target | Total log-likelihood | Term | Description |
|---|---|---|---|
| 0.1 | 0.7 | REACTOME RECEPTOR LIGAND BINDING INITIATES THE SECOND PROTEOLYTIC CLEAVAGE OF NOTCH RECEPTOR | Genes involved in Receptor-ligand binding initiates the second proteolytic cleavage of Notch receptor |
| 0.1 | 1.8 | REACTOME TGF BETA RECEPTOR SIGNALING IN EMT EPITHELIAL TO MESENCHYMAL TRANSITION | Genes involved in TGF-beta receptor signaling in EMT (epithelial to mesenchymal transition) |
| 0.1 | 1.3 | REACTOME PECAM1 INTERACTIONS | Genes involved in PECAM1 interactions |
| 0.1 | 0.4 | REACTOME SYNTHESIS SECRETION AND DEACYLATION OF GHRELIN | Genes involved in Synthesis, Secretion, and Deacylation of Ghrelin |
| 0.1 | 1.4 | REACTOME DSCAM INTERACTIONS | Genes involved in DSCAM interactions |
| 0.1 | 1.5 | REACTOME DCC MEDIATED ATTRACTIVE SIGNALING | Genes involved in DCC mediated attractive signaling |
| 0.0 | 1.1 | REACTOME INITIAL TRIGGERING OF COMPLEMENT | Genes involved in Initial triggering of complement |
| 0.0 | 0.8 | REACTOME ACTIVATION OF RAC | Genes involved in Activation of Rac |
| 0.0 | 3.2 | REACTOME STRIATED MUSCLE CONTRACTION | Genes involved in Striated Muscle Contraction |
| 0.0 | 0.3 | REACTOME FGFR4 LIGAND BINDING AND ACTIVATION | Genes involved in FGFR4 ligand binding and activation |
| 0.0 | 0.7 | REACTOME REVERSIBLE HYDRATION OF CARBON DIOXIDE | Genes involved in Reversible Hydration of Carbon Dioxide |
| 0.0 | 1.1 | REACTOME NA CL DEPENDENT NEUROTRANSMITTER TRANSPORTERS | Genes involved in Na+/Cl- dependent neurotransmitter transporters |
| 0.0 | 0.0 | REACTOME BOTULINUM NEUROTOXICITY | Genes involved in Botulinum neurotoxicity |
| 0.0 | 0.6 | REACTOME ROLE OF DCC IN REGULATING APOPTOSIS | Genes involved in Role of DCC in regulating apoptosis |
| 0.0 | 1.3 | REACTOME ADHERENS JUNCTIONS INTERACTIONS | Genes involved in Adherens junctions interactions |
| 0.0 | 0.6 | REACTOME TANDEM PORE DOMAIN POTASSIUM CHANNELS | Genes involved in Tandem pore domain potassium channels |
| 0.0 | 1.1 | REACTOME REGULATION OF SIGNALING BY CBL | Genes involved in Regulation of signaling by CBL |
| 0.0 | 0.5 | REACTOME SIGNALING BY FGFR3 MUTANTS | Genes involved in Signaling by FGFR3 mutants |
| 0.0 | 1.1 | REACTOME ACTIVATED NOTCH1 TRANSMITS SIGNAL TO THE NUCLEUS | Genes involved in Activated NOTCH1 Transmits Signal to the Nucleus |
| 0.0 | 0.6 | REACTOME TRANSLOCATION OF ZAP 70 TO IMMUNOLOGICAL SYNAPSE | Genes involved in Translocation of ZAP-70 to Immunological synapse |
| 0.0 | 0.7 | REACTOME RETROGRADE NEUROTROPHIN SIGNALLING | Genes involved in Retrograde neurotrophin signalling |
| 0.0 | 0.1 | REACTOME REGULATION OF THE FANCONI ANEMIA PATHWAY | Genes involved in Regulation of the Fanconi anemia pathway |
| 0.0 | 0.4 | REACTOME REGULATION OF IFNG SIGNALING | Genes involved in Regulation of IFNG signaling |
| 0.0 | 0.5 | REACTOME PROCESSING OF INTRONLESS PRE MRNAS | Genes involved in Processing of Intronless Pre-mRNAs |
| 0.0 | 1.0 | REACTOME MYOGENESIS | Genes involved in Myogenesis |
| 0.0 | 2.0 | REACTOME AMYLOIDS | Genes involved in Amyloids |
| 0.0 | 0.4 | REACTOME G2 M DNA DAMAGE CHECKPOINT | Genes involved in G2/M DNA damage checkpoint |
| 0.0 | 0.7 | REACTOME BETA DEFENSINS | Genes involved in Beta defensins |
| 0.0 | 0.5 | REACTOME N GLYCAN ANTENNAE ELONGATION | Genes involved in N-Glycan antennae elongation |
| 0.0 | 0.4 | REACTOME PRE NOTCH PROCESSING IN GOLGI | Genes involved in Pre-NOTCH Processing in Golgi |
| 0.0 | 1.3 | REACTOME VOLTAGE GATED POTASSIUM CHANNELS | Genes involved in Voltage gated Potassium channels |
| 0.0 | 0.7 | REACTOME INTERACTION BETWEEN L1 AND ANKYRINS | Genes involved in Interaction between L1 and Ankyrins |
| 0.0 | 0.6 | REACTOME AMINO ACID SYNTHESIS AND INTERCONVERSION TRANSAMINATION | Genes involved in Amino acid synthesis and interconversion (transamination) |
| 0.0 | 0.5 | REACTOME PURINE SALVAGE | Genes involved in Purine salvage |
| 0.0 | 0.5 | REACTOME ERK MAPK TARGETS | Genes involved in ERK/MAPK targets |
| 0.0 | 0.5 | REACTOME SIGNALING BY ROBO RECEPTOR | Genes involved in Signaling by Robo receptor |
| 0.0 | 0.3 | REACTOME CTNNB1 PHOSPHORYLATION CASCADE | Genes involved in Beta-catenin phosphorylation cascade |
| 0.0 | 0.4 | REACTOME GAP JUNCTION ASSEMBLY | Genes involved in Gap junction assembly |
| 0.0 | 1.2 | REACTOME SIGNALING BY NOTCH1 | Genes involved in Signaling by NOTCH1 |
| 0.0 | 0.1 | REACTOME REGULATION OF KIT SIGNALING | Genes involved in Regulation of KIT signaling |
| 0.0 | 0.4 | REACTOME TETRAHYDROBIOPTERIN BH4 SYNTHESIS RECYCLING SALVAGE AND REGULATION | Genes involved in Tetrahydrobiopterin (BH4) synthesis, recycling, salvage and regulation |
| 0.0 | 1.7 | REACTOME CYCLIN E ASSOCIATED EVENTS DURING G1 S TRANSITION | Genes involved in Cyclin E associated events during G1/S transition |
| 0.0 | 1.4 | REACTOME METABOLISM OF VITAMINS AND COFACTORS | Genes involved in Metabolism of vitamins and cofactors |
| 0.0 | 0.2 | REACTOME IL 7 SIGNALING | Genes involved in Interleukin-7 signaling |
| 0.0 | 0.4 | REACTOME RORA ACTIVATES CIRCADIAN EXPRESSION | Genes involved in RORA Activates Circadian Expression |
| 0.0 | 0.3 | REACTOME ADVANCED GLYCOSYLATION ENDPRODUCT RECEPTOR SIGNALING | Genes involved in Advanced glycosylation endproduct receptor signaling |
| 0.0 | 0.2 | REACTOME SYNTHESIS OF BILE ACIDS AND BILE SALTS VIA 24 HYDROXYCHOLESTEROL | Genes involved in Synthesis of bile acids and bile salts via 24-hydroxycholesterol |
| 0.0 | 0.0 | REACTOME NEF MEDIATES DOWN MODULATION OF CELL SURFACE RECEPTORS BY RECRUITING THEM TO CLATHRIN ADAPTERS | Genes involved in Nef-mediates down modulation of cell surface receptors by recruiting them to clathrin adapters |
| 0.0 | 0.4 | REACTOME RNA POL III CHAIN ELONGATION | Genes involved in RNA Polymerase III Chain Elongation |
| 0.0 | 0.4 | REACTOME ENDOSOMAL SORTING COMPLEX REQUIRED FOR TRANSPORT ESCRT | Genes involved in Endosomal Sorting Complex Required For Transport (ESCRT) |
| 0.0 | 0.3 | REACTOME GLUCURONIDATION | Genes involved in Glucuronidation |
| 0.0 | 0.2 | REACTOME ANTIGEN ACTIVATES B CELL RECEPTOR LEADING TO GENERATION OF SECOND MESSENGERS | Genes involved in Antigen Activates B Cell Receptor Leading to Generation of Second Messengers |
| 0.0 | 0.6 | REACTOME COSTIMULATION BY THE CD28 FAMILY | Genes involved in Costimulation by the CD28 family |
| 0.0 | 0.9 | REACTOME INTERFERON GAMMA SIGNALING | Genes involved in Interferon gamma signaling |
| 0.0 | 0.5 | REACTOME IL 3 5 AND GM CSF SIGNALING | Genes involved in Interleukin-3, 5 and GM-CSF signaling |
| 0.0 | 0.3 | REACTOME PROTEOLYTIC CLEAVAGE OF SNARE COMPLEX PROTEINS | Genes involved in Proteolytic cleavage of SNARE complex proteins |
| 0.0 | 0.5 | REACTOME DARPP 32 EVENTS | Genes involved in DARPP-32 events |
| 0.0 | 0.3 | REACTOME OTHER SEMAPHORIN INTERACTIONS | Genes involved in Other semaphorin interactions |
| 0.0 | 0.2 | REACTOME HORMONE SENSITIVE LIPASE HSL MEDIATED TRIACYLGLYCEROL HYDROLYSIS | Genes involved in Hormone-sensitive lipase (HSL)-mediated triacylglycerol hydrolysis |
| 0.0 | 0.4 | REACTOME STEROID HORMONES | Genes involved in Steroid hormones |
| 0.0 | 0.3 | REACTOME REGULATION OF GENE EXPRESSION IN BETA CELLS | Genes involved in Regulation of gene expression in beta cells |
| 0.0 | 0.6 | REACTOME NCAM1 INTERACTIONS | Genes involved in NCAM1 interactions |
| 0.0 | 0.4 | REACTOME ASSOCIATION OF TRIC CCT WITH TARGET PROTEINS DURING BIOSYNTHESIS | Genes involved in Association of TriC/CCT with target proteins during biosynthesis |
| 0.0 | 0.1 | REACTOME RECYCLING OF BILE ACIDS AND SALTS | Genes involved in Recycling of bile acids and salts |