Project
Epithelial-Mesenchymal Transition, human (Scheel, 2011)
Navigation
Downloads
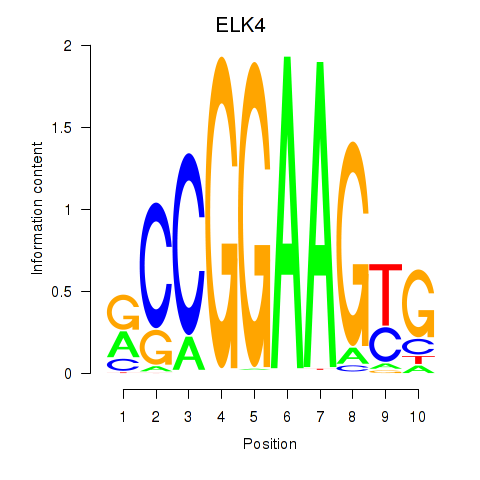
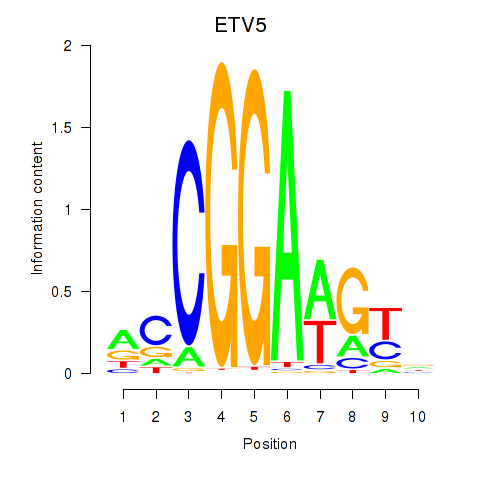
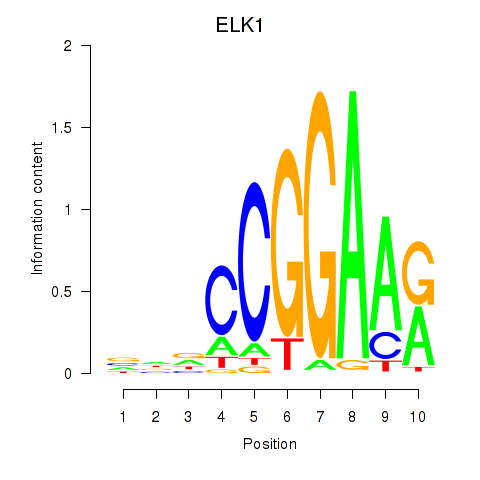
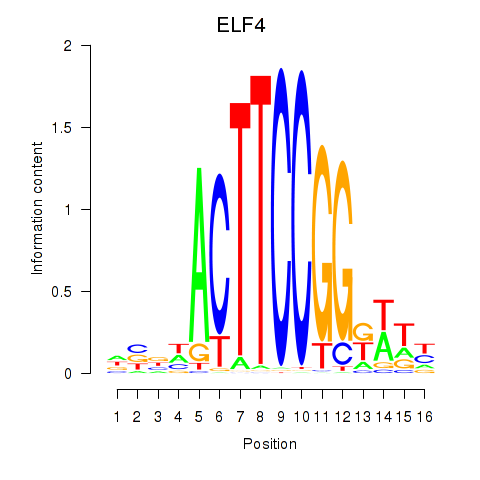
Results for ELK4_ETV5_ELK1_ELK3_ELF4
Z-value: 2.19
Motif logo

Transcription factors associated with ELK4_ETV5_ELK1_ELK3_ELF4
| Gene Symbol | Gene ID | Gene Info |
|---|---|---|
|
ELK4
|
ENSG00000158711.9 | ELK4 |
|
ETV5
|
ENSG00000244405.3 | ETV5 |
|
ELK1
|
ENSG00000126767.13 | ELK1 |
|
ELK3
|
ENSG00000111145.3 | ELK3 |
|
ELF4
|
ENSG00000102034.12 | ELF4 |
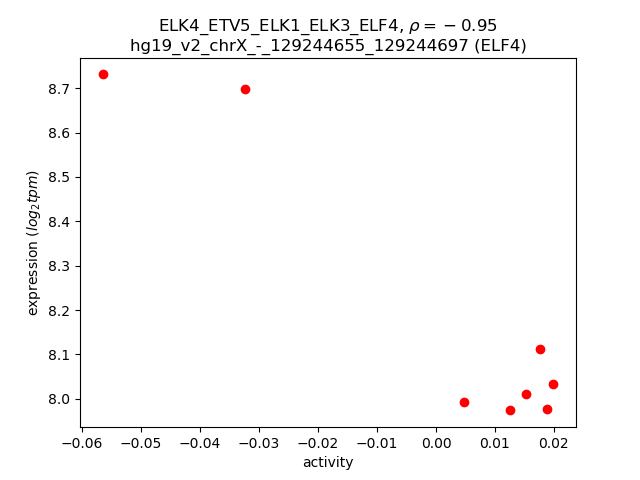
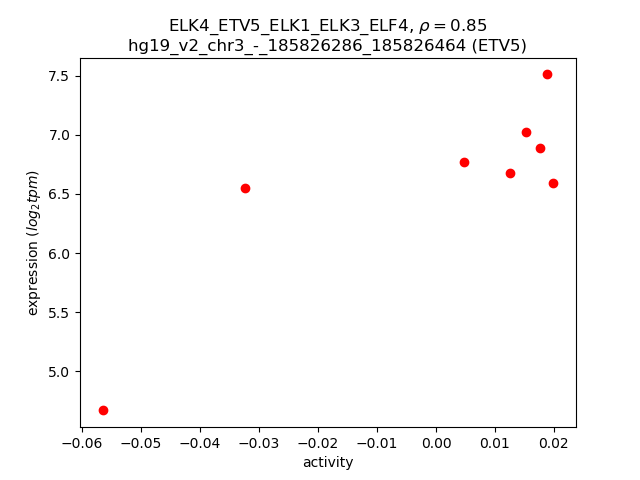
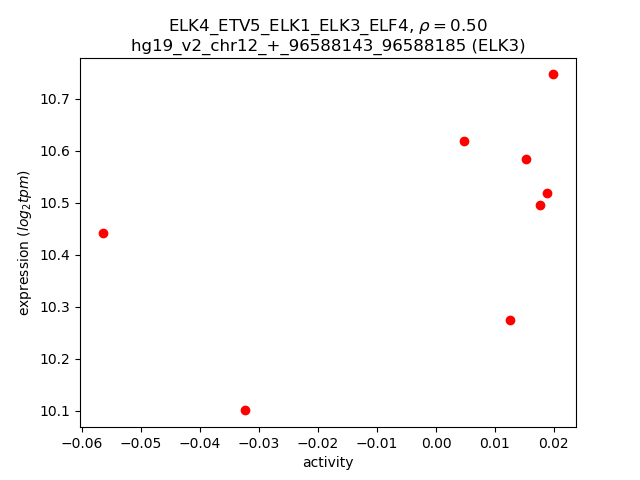
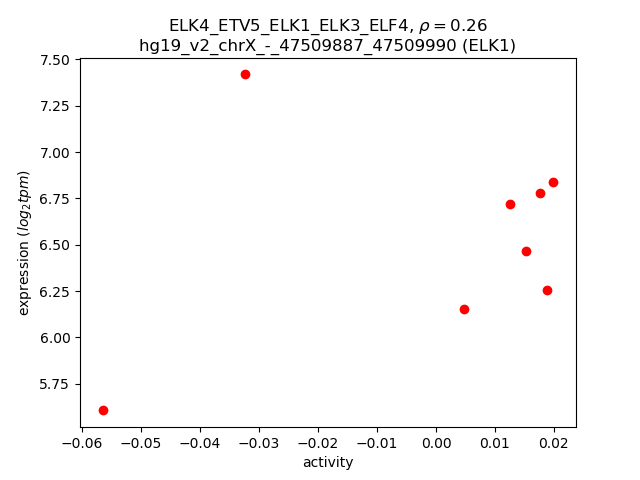
Activity-expression correlation:
| Gene | Promoter | Pearson corr. coef. | P-value | Plot |
|---|---|---|---|---|
| ELF4 | hg19_v2_chrX_-_129244655_129244697, hg19_v2_chrX_-_129244454_129244488 | -0.95 | 3.2e-04 | Click! |
| ETV5 | hg19_v2_chr3_-_185826286_185826464 | 0.85 | 7.9e-03 | Click! |
| ELK3 | hg19_v2_chr12_+_96588143_96588185 | 0.50 | 2.1e-01 | Click! |
| ELK1 | hg19_v2_chrX_-_47509887_47509990 | 0.26 | 5.3e-01 | Click! |
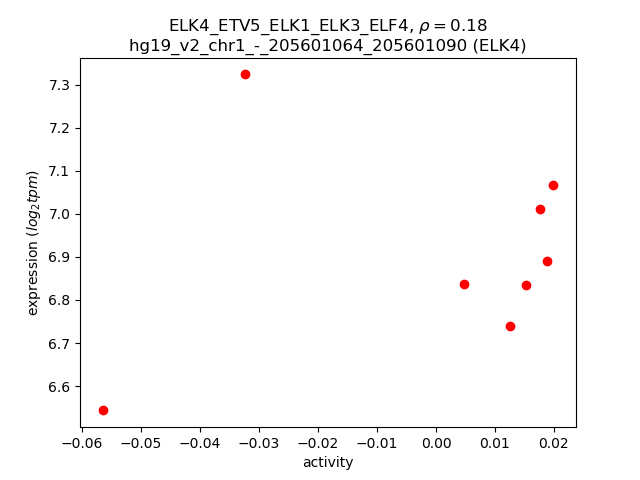
| ELK4 | hg19_v2_chr1_-_205601064_205601090 | 0.18 | 6.7e-01 | Click! |
Activity profile of ELK4_ETV5_ELK1_ELK3_ELF4 motif
Sorted Z-values of ELK4_ETV5_ELK1_ELK3_ELF4 motif
Network of associatons between targets according to the STRING database.

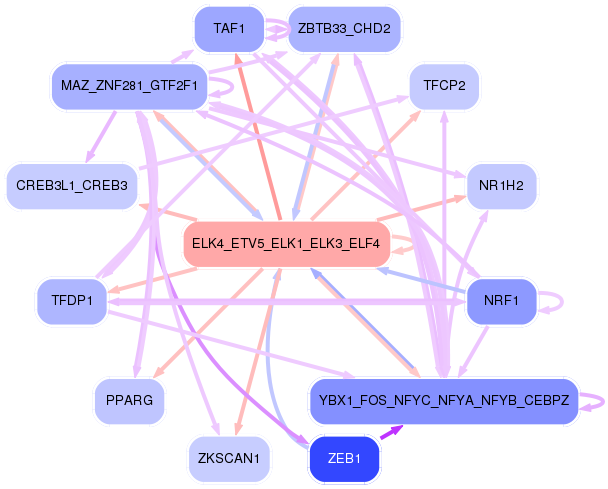
First level regulatory network of ELK4_ETV5_ELK1_ELK3_ELF4
| Promoter | Score | Transcript | Gene | Gene Info |
|---|---|---|---|---|
| chr19_-_8942962 | 3.27 |
ENST00000601372.1 |
ZNF558 |
zinc finger protein 558 |
| chr6_+_30524663 | 3.24 |
ENST00000376560.3 |
PRR3 |
proline rich 3 |
| chr13_-_33760216 | 3.23 |
ENST00000255486.4 |
STARD13 |
StAR-related lipid transfer (START) domain containing 13 |
| chr17_-_19281203 | 2.95 |
ENST00000487415.2 |
B9D1 |
B9 protein domain 1 |
| chr6_+_30525051 | 2.88 |
ENST00000376557.3 |
PRR3 |
proline rich 3 |
| chr1_+_22351977 | 2.68 |
ENST00000420503.1 ENST00000416769.1 ENST00000404210.2 |
LINC00339 |
long intergenic non-protein coding RNA 339 |
| chrX_+_70586140 | 2.63 |
ENST00000276072.3 |
TAF1 |
TAF1 RNA polymerase II, TATA box binding protein (TBP)-associated factor, 250kDa |
| chr12_+_7053172 | 2.59 |
ENST00000229281.5 |
C12orf57 |
chromosome 12 open reading frame 57 |
| chrX_-_153775426 | 2.53 |
ENST00000393562.2 |
G6PD |
glucose-6-phosphate dehydrogenase |
| chr5_+_180650271 | 2.52 |
ENST00000351937.5 ENST00000315073.5 |
TRIM41 |
tripartite motif containing 41 |
| chr8_-_120685608 | 2.52 |
ENST00000427067.2 |
ENPP2 |
ectonucleotide pyrophosphatase/phosphodiesterase 2 |
| chr12_+_108908962 | 2.47 |
ENST00000552695.1 ENST00000552758.1 ENST00000361549.2 |
FICD |
FIC domain containing |
| chr16_-_3355645 | 2.46 |
ENST00000396862.1 ENST00000573608.1 |
TIGD7 |
tigger transposable element derived 7 |
| chr17_+_19281034 | 2.45 |
ENST00000308406.5 ENST00000299612.7 |
MAPK7 |
mitogen-activated protein kinase 7 |
| chr19_-_45927097 | 2.41 |
ENST00000340192.7 |
ERCC1 |
excision repair cross-complementing rodent repair deficiency, complementation group 1 (includes overlapping antisense sequence) |
| chr12_+_120105558 | 2.40 |
ENST00000229328.5 ENST00000541640.1 |
PRKAB1 |
protein kinase, AMP-activated, beta 1 non-catalytic subunit |
| chr12_+_7052974 | 2.38 |
ENST00000544681.1 ENST00000537087.1 |
C12orf57 |
chromosome 12 open reading frame 57 |
| chr2_-_68547061 | 2.35 |
ENST00000263655.3 |
CNRIP1 |
cannabinoid receptor interacting protein 1 |
| chr12_-_58329819 | 2.35 |
ENST00000551421.1 |
RP11-620J15.3 |
RP11-620J15.3 |
| chrX_-_107018969 | 2.25 |
ENST00000372383.4 |
TSC22D3 |
TSC22 domain family, member 3 |
| chr2_-_27294500 | 2.20 |
ENST00000447619.1 ENST00000429985.1 ENST00000456793.1 |
OST4 |
oligosaccharyltransferase 4 homolog (S. cerevisiae) |
| chr10_-_50747064 | 2.19 |
ENST00000355832.5 ENST00000603152.1 ENST00000447839.2 |
ERCC6 PGBD3 ERCC6-PGBD3 |
excision repair cross-complementing rodent repair deficiency, complementation group 6 piggyBac transposable element derived 3 ERCC6-PGBD3 readthrough |
| chr6_-_30710447 | 2.19 |
ENST00000456573.2 |
FLOT1 |
flotillin 1 |
| chr8_-_87520971 | 2.17 |
ENST00000406452.3 |
RMDN1 |
regulator of microtubule dynamics 1 |
| chr12_+_7053228 | 2.17 |
ENST00000540506.2 |
C12orf57 |
chromosome 12 open reading frame 57 |
| chr16_+_20817761 | 2.15 |
ENST00000568046.1 ENST00000261377.6 |
AC004381.6 |
Putative RNA exonuclease NEF-sp |
| chr3_+_180319918 | 2.14 |
ENST00000296015.4 ENST00000491380.1 ENST00000412756.2 ENST00000382584.4 |
TTC14 |
tetratricopeptide repeat domain 14 |
| chr22_+_22020273 | 2.05 |
ENST00000412327.1 ENST00000335025.8 ENST00000398831.3 ENST00000492445.2 ENST00000458567.1 ENST00000406385.1 |
PPIL2 |
peptidylprolyl isomerase (cyclophilin)-like 2 |
| chr3_-_122134882 | 2.01 |
ENST00000330689.4 |
WDR5B |
WD repeat domain 5B |
| chr14_-_75593708 | 1.99 |
ENST00000557673.1 ENST00000238616.5 |
NEK9 |
NIMA-related kinase 9 |
| chr15_-_89089860 | 1.99 |
ENST00000558413.1 ENST00000564406.1 ENST00000268148.8 |
DET1 |
de-etiolated homolog 1 (Arabidopsis) |
| chr2_+_175260514 | 1.99 |
ENST00000424069.1 ENST00000427038.1 |
SCRN3 |
secernin 3 |
| chr1_-_160313025 | 1.99 |
ENST00000368069.3 ENST00000241704.7 |
COPA |
coatomer protein complex, subunit alpha |
| chr8_+_27168988 | 1.99 |
ENST00000397501.1 ENST00000338238.4 ENST00000544172.1 |
PTK2B |
protein tyrosine kinase 2 beta |
| chr5_-_139944196 | 1.98 |
ENST00000357560.4 |
APBB3 |
amyloid beta (A4) precursor protein-binding, family B, member 3 |
| chr14_+_100842735 | 1.97 |
ENST00000554998.1 ENST00000402312.3 ENST00000335290.6 ENST00000554175.1 |
WDR25 |
WD repeat domain 25 |
| chr16_+_20817839 | 1.96 |
ENST00000348433.6 ENST00000568501.1 ENST00000566276.1 |
AC004381.6 |
Putative RNA exonuclease NEF-sp |
| chr4_-_39640700 | 1.95 |
ENST00000295958.5 |
SMIM14 |
small integral membrane protein 14 |
| chr16_-_67260691 | 1.94 |
ENST00000447579.1 ENST00000393992.1 ENST00000424285.1 |
LRRC29 |
leucine rich repeat containing 29 |
| chr5_-_107717058 | 1.92 |
ENST00000359660.5 |
FBXL17 |
F-box and leucine-rich repeat protein 17 |
| chr6_-_30710510 | 1.89 |
ENST00000376389.3 |
FLOT1 |
flotillin 1 |
| chr2_+_175260451 | 1.87 |
ENST00000458563.1 ENST00000409673.3 ENST00000272732.6 ENST00000435964.1 |
SCRN3 |
secernin 3 |
| chr17_-_53809473 | 1.86 |
ENST00000575734.1 |
TMEM100 |
transmembrane protein 100 |
| chr4_-_39640513 | 1.85 |
ENST00000511809.1 ENST00000505729.1 |
SMIM14 |
small integral membrane protein 14 |
| chr2_-_120124383 | 1.84 |
ENST00000334816.7 |
C2orf76 |
chromosome 2 open reading frame 76 |
| chr11_+_61197508 | 1.82 |
ENST00000541135.1 ENST00000301761.2 |
RP11-286N22.8 SDHAF2 |
Uncharacterized protein succinate dehydrogenase complex assembly factor 2 |
| chr16_+_20818020 | 1.81 |
ENST00000564274.1 ENST00000563068.1 |
AC004381.6 |
Putative RNA exonuclease NEF-sp |
| chr2_-_120124258 | 1.79 |
ENST00000409877.1 ENST00000409523.1 ENST00000409466.2 ENST00000414534.1 |
C2orf76 |
chromosome 2 open reading frame 76 |
| chr20_-_48532046 | 1.79 |
ENST00000543716.1 |
SPATA2 |
spermatogenesis associated 2 |
| chr19_+_17326521 | 1.77 |
ENST00000593597.1 |
USE1 |
unconventional SNARE in the ER 1 homolog (S. cerevisiae) |
| chr19_-_10450287 | 1.75 |
ENST00000589261.1 ENST00000590569.1 ENST00000589580.1 ENST00000589249.1 |
ICAM3 |
intercellular adhesion molecule 3 |
| chr2_-_160919112 | 1.75 |
ENST00000283243.7 ENST00000392771.1 |
PLA2R1 |
phospholipase A2 receptor 1, 180kDa |
| chr2_+_71295733 | 1.73 |
ENST00000443938.2 ENST00000244204.6 |
NAGK |
N-acetylglucosamine kinase |
| chr1_-_1297157 | 1.73 |
ENST00000477278.2 |
MXRA8 |
matrix-remodelling associated 8 |
| chr19_-_58951496 | 1.73 |
ENST00000254166.3 |
ZNF132 |
zinc finger protein 132 |
| chr5_+_140071178 | 1.72 |
ENST00000508522.1 ENST00000448069.2 |
HARS2 |
histidyl-tRNA synthetase 2, mitochondrial |
| chr20_-_44485835 | 1.69 |
ENST00000457981.1 ENST00000426915.1 ENST00000217455.4 |
ACOT8 |
acyl-CoA thioesterase 8 |
| chr19_-_45926739 | 1.69 |
ENST00000589381.1 ENST00000591636.1 ENST00000013807.5 ENST00000592023.1 |
ERCC1 |
excision repair cross-complementing rodent repair deficiency, complementation group 1 (includes overlapping antisense sequence) |
| chr5_-_139943830 | 1.67 |
ENST00000412920.3 ENST00000511201.2 ENST00000356738.2 ENST00000354402.5 ENST00000358580.5 ENST00000508496.2 |
APBB3 |
amyloid beta (A4) precursor protein-binding, family B, member 3 |
| chr1_-_28969517 | 1.67 |
ENST00000263974.4 ENST00000373824.4 |
TAF12 |
TAF12 RNA polymerase II, TATA box binding protein (TBP)-associated factor, 20kDa |
| chr11_-_65655906 | 1.67 |
ENST00000533045.1 ENST00000338369.2 ENST00000357519.4 |
FIBP |
fibroblast growth factor (acidic) intracellular binding protein |
| chr8_-_77912431 | 1.66 |
ENST00000357039.4 ENST00000522527.1 |
PEX2 |
peroxisomal biogenesis factor 2 |
| chr14_-_89883412 | 1.65 |
ENST00000557258.1 |
FOXN3 |
forkhead box N3 |
| chr22_-_36877371 | 1.65 |
ENST00000403313.1 |
TXN2 |
thioredoxin 2 |
| chr7_-_97881429 | 1.65 |
ENST00000420697.1 ENST00000379795.3 ENST00000415086.1 ENST00000542604.1 ENST00000447648.2 |
TECPR1 |
tectonin beta-propeller repeat containing 1 |
| chr1_-_169337176 | 1.64 |
ENST00000472647.1 ENST00000367811.3 |
NME7 |
NME/NM23 family member 7 |
| chr3_-_49170405 | 1.63 |
ENST00000305544.4 ENST00000494831.1 |
LAMB2 |
laminin, beta 2 (laminin S) |
| chr12_-_58329888 | 1.60 |
ENST00000546580.1 |
RP11-620J15.3 |
RP11-620J15.3 |
| chr3_-_128880125 | 1.58 |
ENST00000393295.3 |
ISY1 |
ISY1 splicing factor homolog (S. cerevisiae) |
| chr2_+_65454926 | 1.58 |
ENST00000542850.1 ENST00000377982.4 |
ACTR2 |
ARP2 actin-related protein 2 homolog (yeast) |
| chr3_-_49170522 | 1.58 |
ENST00000418109.1 |
LAMB2 |
laminin, beta 2 (laminin S) |
| chr5_-_93447333 | 1.57 |
ENST00000395965.3 ENST00000505869.1 ENST00000509163.1 |
FAM172A |
family with sequence similarity 172, member A |
| chr2_-_99224915 | 1.57 |
ENST00000328709.3 ENST00000409997.1 |
COA5 |
cytochrome c oxidase assembly factor 5 |
| chrX_+_55478538 | 1.57 |
ENST00000342972.1 |
MAGEH1 |
melanoma antigen family H, 1 |
| chr19_+_16296191 | 1.56 |
ENST00000589852.1 ENST00000263384.7 ENST00000588367.1 ENST00000587351.1 |
FAM32A |
family with sequence similarity 32, member A |
| chr2_+_54198210 | 1.56 |
ENST00000607452.1 ENST00000422521.2 |
ACYP2 |
acylphosphatase 2, muscle type |
| chr20_+_62612470 | 1.55 |
ENST00000266079.4 ENST00000535781.1 |
PRPF6 |
pre-mRNA processing factor 6 |
| chr12_+_53443963 | 1.55 |
ENST00000546602.1 ENST00000552570.1 ENST00000549700.1 |
TENC1 |
tensin like C1 domain containing phosphatase (tensin 2) |
| chr2_+_65454863 | 1.54 |
ENST00000260641.5 |
ACTR2 |
ARP2 actin-related protein 2 homolog (yeast) |
| chr2_+_120124497 | 1.54 |
ENST00000355857.3 ENST00000535617.1 ENST00000535757.1 ENST00000409094.1 ENST00000311521.4 |
DBI |
diazepam binding inhibitor (GABA receptor modulator, acyl-CoA binding protein) |
| chr20_-_34542548 | 1.54 |
ENST00000305978.2 |
SCAND1 |
SCAN domain containing 1 |
| chr10_+_1102721 | 1.53 |
ENST00000263150.4 |
WDR37 |
WD repeat domain 37 |
| chr11_+_61197572 | 1.53 |
ENST00000542074.1 ENST00000534878.1 ENST00000537782.1 ENST00000543265.1 |
SDHAF2 |
succinate dehydrogenase complex assembly factor 2 |
| chr6_-_52441713 | 1.52 |
ENST00000182527.3 |
TRAM2 |
translocation associated membrane protein 2 |
| chr12_+_51632638 | 1.52 |
ENST00000549732.2 |
DAZAP2 |
DAZ associated protein 2 |
| chr20_-_34287220 | 1.50 |
ENST00000306750.3 |
NFS1 |
NFS1 cysteine desulfurase |
| chr4_+_74718906 | 1.50 |
ENST00000226524.3 |
PF4V1 |
platelet factor 4 variant 1 |
| chr8_-_100025238 | 1.49 |
ENST00000521696.1 |
RP11-410L14.2 |
RP11-410L14.2 |
| chr2_-_9563469 | 1.48 |
ENST00000484735.1 ENST00000456913.2 |
ITGB1BP1 |
integrin beta 1 binding protein 1 |
| chr1_-_10003372 | 1.47 |
ENST00000377223.1 ENST00000541052.1 ENST00000377213.1 |
LZIC |
leucine zipper and CTNNBIP1 domain containing |
| chr19_+_17326191 | 1.46 |
ENST00000595101.1 ENST00000596136.1 ENST00000379776.4 |
USE1 |
unconventional SNARE in the ER 1 homolog (S. cerevisiae) |
| chr9_+_90112590 | 1.46 |
ENST00000472284.1 |
DAPK1 |
death-associated protein kinase 1 |
| chr6_+_52442083 | 1.45 |
ENST00000606714.1 |
TRAM2-AS1 |
TRAM2 antisense RNA 1 (head to head) |
| chr1_+_110198689 | 1.45 |
ENST00000369836.4 |
GSTM4 |
glutathione S-transferase mu 4 |
| chr5_-_176730676 | 1.44 |
ENST00000393611.2 ENST00000303251.6 ENST00000303270.6 |
RAB24 |
RAB24, member RAS oncogene family |
| chr1_-_109618566 | 1.44 |
ENST00000338366.5 |
TAF13 |
TAF13 RNA polymerase II, TATA box binding protein (TBP)-associated factor, 18kDa |
| chr6_+_31620191 | 1.44 |
ENST00000375918.2 ENST00000375920.4 |
APOM |
apolipoprotein M |
| chr20_-_34638841 | 1.44 |
ENST00000565493.1 |
LINC00657 |
long intergenic non-protein coding RNA 657 |
| chr19_-_58090240 | 1.44 |
ENST00000196489.3 |
ZNF416 |
zinc finger protein 416 |
| chr19_+_17326141 | 1.43 |
ENST00000445667.2 ENST00000263897.5 |
USE1 |
unconventional SNARE in the ER 1 homolog (S. cerevisiae) |
| chr12_+_53443680 | 1.43 |
ENST00000314250.6 ENST00000451358.1 |
TENC1 |
tensin like C1 domain containing phosphatase (tensin 2) |
| chrX_+_70586082 | 1.43 |
ENST00000373790.4 ENST00000449580.1 ENST00000423759.1 |
TAF1 |
TAF1 RNA polymerase II, TATA box binding protein (TBP)-associated factor, 250kDa |
| chr5_-_140700322 | 1.43 |
ENST00000313368.5 |
TAF7 |
TAF7 RNA polymerase II, TATA box binding protein (TBP)-associated factor, 55kDa |
| chr20_-_45318230 | 1.43 |
ENST00000372114.3 |
TP53RK |
TP53 regulating kinase |
| chr14_-_53417732 | 1.43 |
ENST00000399304.3 ENST00000395631.2 ENST00000341590.3 ENST00000343279.4 |
FERMT2 |
fermitin family member 2 |
| chr4_-_156787425 | 1.42 |
ENST00000537611.2 |
ASIC5 |
acid-sensing (proton-gated) ion channel family member 5 |
| chr2_-_85839146 | 1.42 |
ENST00000306336.5 ENST00000409734.3 |
C2orf68 |
chromosome 2 open reading frame 68 |
| chr9_+_90112767 | 1.41 |
ENST00000408954.3 |
DAPK1 |
death-associated protein kinase 1 |
| chr7_+_120629653 | 1.41 |
ENST00000450913.2 ENST00000340646.5 |
CPED1 |
cadherin-like and PC-esterase domain containing 1 |
| chr14_+_61447832 | 1.41 |
ENST00000354886.2 ENST00000267488.4 |
SLC38A6 |
solute carrier family 38, member 6 |
| chr5_+_140071011 | 1.41 |
ENST00000230771.3 ENST00000509299.1 ENST00000503873.1 ENST00000435019.2 ENST00000437649.2 ENST00000432671.2 |
HARS2 |
histidyl-tRNA synthetase 2, mitochondrial |
| chr19_+_32896697 | 1.41 |
ENST00000586987.1 |
DPY19L3 |
dpy-19-like 3 (C. elegans) |
| chr14_+_61447927 | 1.40 |
ENST00000451406.1 |
SLC38A6 |
solute carrier family 38, member 6 |
| chr21_+_47706537 | 1.40 |
ENST00000397691.1 |
YBEY |
ybeY metallopeptidase (putative) |
| chr7_+_2281843 | 1.40 |
ENST00000356714.1 ENST00000397049.1 |
NUDT1 |
nudix (nucleoside diphosphate linked moiety X)-type motif 1 |
| chr19_-_53662257 | 1.40 |
ENST00000599096.1 ENST00000334197.7 ENST00000597183.1 ENST00000601804.1 ENST00000601469.2 ENST00000452676.2 |
ZNF347 |
zinc finger protein 347 |
| chr14_-_77923897 | 1.38 |
ENST00000343765.2 ENST00000327028.4 ENST00000556412.1 ENST00000557466.1 ENST00000448935.2 ENST00000553888.1 ENST00000557658.1 |
VIPAS39 |
VPS33B interacting protein, apical-basolateral polarity regulator, spe-39 homolog |
| chr3_-_178790057 | 1.38 |
ENST00000311417.2 |
ZMAT3 |
zinc finger, matrin-type 3 |
| chr5_-_140070897 | 1.38 |
ENST00000448240.1 ENST00000438307.2 ENST00000415192.2 ENST00000457527.2 ENST00000307633.3 ENST00000507746.1 ENST00000431330.2 |
HARS |
histidyl-tRNA synthetase |
| chr1_-_186344802 | 1.38 |
ENST00000451586.1 |
TPR |
translocated promoter region, nuclear basket protein |
| chr12_-_54867352 | 1.38 |
ENST00000305879.5 |
GTSF1 |
gametocyte specific factor 1 |
| chr11_+_118889142 | 1.37 |
ENST00000533632.1 |
TRAPPC4 |
trafficking protein particle complex 4 |
| chr4_-_107957454 | 1.37 |
ENST00000285311.3 |
DKK2 |
dickkopf WNT signaling pathway inhibitor 2 |
| chr9_+_130922537 | 1.37 |
ENST00000372994.1 |
C9orf16 |
chromosome 9 open reading frame 16 |
| chr7_+_7606497 | 1.35 |
ENST00000340080.4 ENST00000405785.1 ENST00000433635.1 |
MIOS |
missing oocyte, meiosis regulator, homolog (Drosophila) |
| chr2_+_71295717 | 1.34 |
ENST00000418807.3 ENST00000443872.2 |
NAGK |
N-acetylglucosamine kinase |
| chr3_+_52321827 | 1.33 |
ENST00000473032.1 ENST00000305690.8 ENST00000354773.4 ENST00000471180.1 ENST00000436784.2 |
GLYCTK |
glycerate kinase |
| chr1_+_110198944 | 1.32 |
ENST00000369833.1 |
GSTM4 |
glutathione S-transferase mu 4 |
| chr20_+_34287364 | 1.30 |
ENST00000374072.1 ENST00000397416.1 ENST00000336695.4 |
ROMO1 |
reactive oxygen species modulator 1 |
| chr11_+_118889456 | 1.29 |
ENST00000528230.1 ENST00000525303.1 ENST00000434101.2 ENST00000359005.4 ENST00000533058.1 |
TRAPPC4 |
trafficking protein particle complex 4 |
| chr1_-_1310530 | 1.29 |
ENST00000338370.3 ENST00000321751.5 ENST00000378853.3 |
AURKAIP1 |
aurora kinase A interacting protein 1 |
| chr21_-_38639601 | 1.29 |
ENST00000539844.1 ENST00000476950.1 ENST00000399001.1 |
DSCR3 |
Down syndrome critical region gene 3 |
| chr16_-_31085514 | 1.29 |
ENST00000300849.4 |
ZNF668 |
zinc finger protein 668 |
| chr3_+_42977846 | 1.29 |
ENST00000383748.4 |
KRBOX1 |
KRAB box domain containing 1 |
| chr13_+_76362974 | 1.27 |
ENST00000497947.2 |
LMO7 |
LIM domain 7 |
| chr15_-_63449663 | 1.27 |
ENST00000439025.1 |
RPS27L |
ribosomal protein S27-like |
| chrX_+_77166172 | 1.26 |
ENST00000343533.5 ENST00000350425.4 ENST00000341514.6 |
ATP7A |
ATPase, Cu++ transporting, alpha polypeptide |
| chr18_-_72265035 | 1.23 |
ENST00000585279.1 ENST00000580048.1 |
LINC00909 |
long intergenic non-protein coding RNA 909 |
| chr12_-_102455846 | 1.23 |
ENST00000545679.1 |
CCDC53 |
coiled-coil domain containing 53 |
| chr17_-_33288467 | 1.23 |
ENST00000436961.3 |
CCT6B |
chaperonin containing TCP1, subunit 6B (zeta 2) |
| chr19_+_9473676 | 1.23 |
ENST00000343499.4 ENST00000592912.1 |
ZNF177 |
zinc finger protein 177 |
| chr1_+_109102652 | 1.23 |
ENST00000370035.3 ENST00000405454.1 |
FAM102B |
family with sequence similarity 102, member B |
| chr20_+_34287194 | 1.22 |
ENST00000374078.1 ENST00000374077.3 |
ROMO1 |
reactive oxygen species modulator 1 |
| chr20_+_43595115 | 1.22 |
ENST00000372806.3 ENST00000396731.4 ENST00000372801.1 ENST00000499879.2 |
STK4 |
serine/threonine kinase 4 |
| chr16_-_67969888 | 1.22 |
ENST00000574576.2 |
PSMB10 |
proteasome (prosome, macropain) subunit, beta type, 10 |
| chrX_+_152760397 | 1.21 |
ENST00000331595.4 ENST00000431891.1 |
BGN |
biglycan |
| chr3_+_51976338 | 1.21 |
ENST00000417220.2 ENST00000431474.1 ENST00000398755.3 |
PARP3 |
poly (ADP-ribose) polymerase family, member 3 |
| chr16_+_83841448 | 1.21 |
ENST00000433866.2 |
HSBP1 |
heat shock factor binding protein 1 |
| chr7_+_2281882 | 1.20 |
ENST00000397046.1 ENST00000397048.1 ENST00000454650.1 |
NUDT1 |
nudix (nucleoside diphosphate linked moiety X)-type motif 1 |
| chr12_+_94071341 | 1.20 |
ENST00000542893.2 |
CRADD |
CASP2 and RIPK1 domain containing adaptor with death domain |
| chr1_+_26146397 | 1.20 |
ENST00000374303.2 ENST00000533762.1 ENST00000529116.1 ENST00000474295.1 ENST00000488327.2 ENST00000472643.1 ENST00000526894.1 ENST00000524618.1 ENST00000374307.5 |
MTFR1L |
mitochondrial fission regulator 1-like |
| chr17_-_47022140 | 1.19 |
ENST00000290330.3 |
SNF8 |
SNF8, ESCRT-II complex subunit |
| chr19_-_58459039 | 1.19 |
ENST00000282308.3 ENST00000598928.1 |
ZNF256 |
zinc finger protein 256 |
| chr1_+_162467595 | 1.19 |
ENST00000538489.1 ENST00000489294.1 |
UHMK1 |
U2AF homology motif (UHM) kinase 1 |
| chr11_+_6502675 | 1.19 |
ENST00000254616.6 ENST00000530751.1 |
TIMM10B |
translocase of inner mitochondrial membrane 10 homolog B (yeast) |
| chr3_-_28390581 | 1.19 |
ENST00000479665.1 |
AZI2 |
5-azacytidine induced 2 |
| chr17_-_33288522 | 1.19 |
ENST00000314144.5 |
CCT6B |
chaperonin containing TCP1, subunit 6B (zeta 2) |
| chr4_-_39529180 | 1.18 |
ENST00000515021.1 ENST00000510490.1 ENST00000316423.6 |
UGDH |
UDP-glucose 6-dehydrogenase |
| chr11_-_118550375 | 1.18 |
ENST00000525958.1 ENST00000264029.4 ENST00000397925.1 ENST00000529101.1 |
TREH |
trehalase (brush-border membrane glycoprotein) |
| chr3_+_49449636 | 1.18 |
ENST00000273590.3 |
TCTA |
T-cell leukemia translocation altered |
| chr19_-_8579030 | 1.18 |
ENST00000255616.8 ENST00000393927.4 |
ZNF414 |
zinc finger protein 414 |
| chr2_+_71295416 | 1.18 |
ENST00000455662.2 ENST00000531934.1 |
NAGK |
N-acetylglucosamine kinase |
| chr20_-_34287259 | 1.17 |
ENST00000397425.1 ENST00000540053.1 ENST00000541387.1 ENST00000374092.4 |
NFS1 |
NFS1 cysteine desulfurase |
| chr2_-_201753859 | 1.17 |
ENST00000409361.1 ENST00000392283.4 |
PPIL3 |
peptidylprolyl isomerase (cyclophilin)-like 3 |
| chr1_+_65886244 | 1.17 |
ENST00000344610.8 |
LEPR |
leptin receptor |
| chr11_-_118550346 | 1.17 |
ENST00000530256.1 |
TREH |
trehalase (brush-border membrane glycoprotein) |
| chr19_-_10446449 | 1.17 |
ENST00000592439.1 |
ICAM3 |
intercellular adhesion molecule 3 |
| chr19_+_32896646 | 1.17 |
ENST00000392250.2 |
DPY19L3 |
dpy-19-like 3 (C. elegans) |
| chr11_+_65769946 | 1.17 |
ENST00000533166.1 |
BANF1 |
barrier to autointegration factor 1 |
| chr17_-_8263538 | 1.16 |
ENST00000535173.1 |
AC135178.1 |
HCG1985372; Uncharacterized protein; cDNA FLJ37541 fis, clone BRCAN2026340 |
| chr2_-_201753980 | 1.16 |
ENST00000443398.1 ENST00000286175.8 ENST00000409449.1 |
PPIL3 |
peptidylprolyl isomerase (cyclophilin)-like 3 |
| chr3_-_184429735 | 1.16 |
ENST00000317897.3 |
MAGEF1 |
melanoma antigen family F, 1 |
| chr14_-_24701539 | 1.16 |
ENST00000534348.1 ENST00000524927.1 ENST00000250495.5 |
NEDD8-MDP1 NEDD8 |
NEDD8-MDP1 readthrough neural precursor cell expressed, developmentally down-regulated 8 |
| chr12_-_105630016 | 1.14 |
ENST00000258530.3 |
APPL2 |
adaptor protein, phosphotyrosine interaction, PH domain and leucine zipper containing 2 |
| chrX_-_134429952 | 1.14 |
ENST00000370764.1 |
ZNF75D |
zinc finger protein 75D |
| chrX_+_54834791 | 1.14 |
ENST00000218439.4 ENST00000375058.1 ENST00000375060.1 |
MAGED2 |
melanoma antigen family D, 2 |
| chr12_-_105629852 | 1.13 |
ENST00000551662.1 ENST00000553097.1 |
APPL2 |
adaptor protein, phosphotyrosine interaction, PH domain and leucine zipper containing 2 |
| chr8_+_13424352 | 1.13 |
ENST00000297324.4 |
C8orf48 |
chromosome 8 open reading frame 48 |
| chr21_+_45285050 | 1.12 |
ENST00000291572.8 |
AGPAT3 |
1-acylglycerol-3-phosphate O-acyltransferase 3 |
| chr5_-_153418407 | 1.12 |
ENST00000522858.1 ENST00000522634.1 ENST00000523705.1 ENST00000524246.1 ENST00000520313.1 ENST00000518102.1 ENST00000351797.4 ENST00000520667.1 ENST00000519808.1 ENST00000522395.1 |
FAM114A2 |
family with sequence similarity 114, member A2 |
| chr1_+_155829286 | 1.11 |
ENST00000368324.4 |
SYT11 |
synaptotagmin XI |
| chr1_+_3541543 | 1.11 |
ENST00000378344.2 ENST00000344579.5 |
TPRG1L |
tumor protein p63 regulated 1-like |
| chr2_-_131099897 | 1.11 |
ENST00000409127.1 ENST00000437688.2 ENST00000259229.2 |
CCDC115 |
coiled-coil domain containing 115 |
| chr7_+_135347215 | 1.10 |
ENST00000507606.1 |
C7orf73 |
chromosome 7 open reading frame 73 |
| chr16_+_12995614 | 1.10 |
ENST00000423335.2 |
SHISA9 |
shisa family member 9 |
| chrX_+_69353284 | 1.10 |
ENST00000342206.6 ENST00000356413.4 |
IGBP1 |
immunoglobulin (CD79A) binding protein 1 |
| chr9_+_131133598 | 1.09 |
ENST00000372853.4 ENST00000452446.1 ENST00000372850.1 ENST00000372847.1 |
URM1 |
ubiquitin related modifier 1 |
| chr4_+_926214 | 1.09 |
ENST00000514453.1 ENST00000515492.1 ENST00000509508.1 ENST00000515740.1 ENST00000508204.1 ENST00000510493.1 ENST00000514546.1 |
TMEM175 |
transmembrane protein 175 |
| chr19_+_7069426 | 1.09 |
ENST00000252840.6 ENST00000414706.1 |
ZNF557 |
zinc finger protein 557 |
| chr12_-_102455902 | 1.09 |
ENST00000240079.6 |
CCDC53 |
coiled-coil domain containing 53 |
| chr20_-_33872548 | 1.08 |
ENST00000374443.3 |
EIF6 |
eukaryotic translation initiation factor 6 |
| chr12_+_123464607 | 1.08 |
ENST00000543566.1 ENST00000315580.5 ENST00000542099.1 ENST00000392435.2 ENST00000413381.2 ENST00000426960.2 ENST00000453766.2 |
ARL6IP4 |
ADP-ribosylation-like factor 6 interacting protein 4 |
| chr8_+_182368 | 1.07 |
ENST00000522866.1 ENST00000398612.1 |
ZNF596 |
zinc finger protein 596 |
| chr19_+_7069690 | 1.07 |
ENST00000439035.2 |
ZNF557 |
zinc finger protein 557 |
| chr13_-_28024681 | 1.07 |
ENST00000381116.1 ENST00000381120.3 ENST00000431572.2 |
MTIF3 |
mitochondrial translational initiation factor 3 |
| chr6_-_31926629 | 1.07 |
ENST00000375425.5 ENST00000426722.1 ENST00000441998.1 ENST00000444811.2 ENST00000375429.3 |
NELFE |
negative elongation factor complex member E |
| chr3_+_191046810 | 1.07 |
ENST00000392455.3 ENST00000392456.3 |
CCDC50 |
coiled-coil domain containing 50 |
| chr7_+_92076740 | 1.07 |
ENST00000287957.3 |
GATAD1 |
GATA zinc finger domain containing 1 |
| chrX_-_15872914 | 1.07 |
ENST00000380291.1 ENST00000545766.1 ENST00000421527.2 ENST00000329235.2 |
AP1S2 |
adaptor-related protein complex 1, sigma 2 subunit |
| chr11_+_71791359 | 1.06 |
ENST00000419228.1 ENST00000435085.1 ENST00000307198.7 ENST00000538413.1 |
LRTOMT |
leucine rich transmembrane and O-methyltransferase domain containing |
Gene Ontology Analysis
Gene overrepresentation in biological_process category:
| Log-likelihood per target | Total log-likelihood | Term | Description |
|---|---|---|---|
| 1.5 | 4.5 | GO:0006427 | histidyl-tRNA aminoacylation(GO:0006427) |
| 1.1 | 3.4 | GO:0097032 | respiratory chain complex II assembly(GO:0034552) mitochondrial respiratory chain complex II assembly(GO:0034553) mitochondrial respiratory chain complex II biogenesis(GO:0097032) |
| 1.0 | 4.2 | GO:0006050 | mannosamine metabolic process(GO:0006050) N-acetylmannosamine metabolic process(GO:0006051) |
| 1.0 | 7.1 | GO:0036343 | psychomotor behavior(GO:0036343) |
| 0.9 | 2.8 | GO:0009051 | pentose-phosphate shunt, oxidative branch(GO:0009051) |
| 0.9 | 4.4 | GO:0036369 | transcription factor catabolic process(GO:0036369) |
| 0.9 | 3.5 | GO:0018282 | metal incorporation into metallo-sulfur cluster(GO:0018282) iron incorporation into metallo-sulfur cluster(GO:0018283) |
| 0.9 | 5.1 | GO:0000720 | pyrimidine dimer repair by nucleotide-excision repair(GO:0000720) |
| 0.8 | 5.0 | GO:0097498 | endothelial tube lumen extension(GO:0097498) |
| 0.8 | 1.6 | GO:0019521 | aldonic acid metabolic process(GO:0019520) D-gluconate metabolic process(GO:0019521) |
| 0.8 | 3.0 | GO:0090301 | regulation of neural crest formation(GO:0090299) negative regulation of neural crest formation(GO:0090301) negative regulation of fibroblast growth factor receptor signaling pathway involved in neural plate anterior/posterior pattern formation(GO:2000314) |
| 0.7 | 2.2 | GO:0006542 | glutamine biosynthetic process(GO:0006542) |
| 0.7 | 2.2 | GO:0031990 | mRNA export from nucleus in response to heat stress(GO:0031990) |
| 0.7 | 0.7 | GO:0090149 | mitochondrial membrane fission(GO:0090149) |
| 0.7 | 3.3 | GO:0072248 | metanephric glomerular epithelium development(GO:0072244) metanephric glomerular visceral epithelial cell differentiation(GO:0072248) metanephric glomerular visceral epithelial cell development(GO:0072249) metanephric glomerular epithelial cell differentiation(GO:0072312) metanephric glomerular epithelial cell development(GO:0072313) |
| 0.6 | 5.6 | GO:0018916 | nitrobenzene metabolic process(GO:0018916) |
| 0.6 | 5.1 | GO:0060355 | positive regulation of cell adhesion molecule production(GO:0060355) |
| 0.6 | 1.7 | GO:0032304 | negative regulation of icosanoid secretion(GO:0032304) |
| 0.5 | 2.7 | GO:0006203 | dGTP catabolic process(GO:0006203) |
| 0.5 | 2.6 | GO:0071279 | cellular response to cobalt ion(GO:0071279) |
| 0.5 | 2.1 | GO:2000538 | regulation of B cell chemotaxis(GO:2000537) positive regulation of B cell chemotaxis(GO:2000538) |
| 0.5 | 3.0 | GO:0016344 | meiotic chromosome movement towards spindle pole(GO:0016344) |
| 0.5 | 2.9 | GO:0051344 | regulation of cyclic-nucleotide phosphodiesterase activity(GO:0051342) negative regulation of cyclic-nucleotide phosphodiesterase activity(GO:0051344) |
| 0.5 | 0.5 | GO:1900242 | regulation of synaptic vesicle endocytosis(GO:1900242) |
| 0.5 | 2.4 | GO:0090182 | regulation of secretion of lysosomal enzymes(GO:0090182) |
| 0.5 | 2.4 | GO:0000350 | generation of catalytic spliceosome for second transesterification step(GO:0000350) |
| 0.5 | 2.3 | GO:0044565 | dendritic cell proliferation(GO:0044565) |
| 0.4 | 1.3 | GO:0018307 | enzyme active site formation(GO:0018307) |
| 0.4 | 1.8 | GO:0005986 | sucrose biosynthetic process(GO:0005986) |
| 0.4 | 0.4 | GO:0045005 | replication fork processing(GO:0031297) DNA-dependent DNA replication maintenance of fidelity(GO:0045005) |
| 0.4 | 1.6 | GO:0006408 | snRNA export from nucleus(GO:0006408) |
| 0.4 | 1.6 | GO:1902626 | assembly of large subunit precursor of preribosome(GO:1902626) |
| 0.4 | 3.3 | GO:0018406 | protein C-linked glycosylation(GO:0018103) peptidyl-tryptophan modification(GO:0018211) protein C-linked glycosylation via tryptophan(GO:0018317) protein C-linked glycosylation via 2'-alpha-mannosyl-L-tryptophan(GO:0018406) |
| 0.4 | 1.2 | GO:0071335 | submandibular salivary gland formation(GO:0060661) hair follicle cell proliferation(GO:0071335) regulation of hair follicle cell proliferation(GO:0071336) positive regulation of hair follicle cell proliferation(GO:0071338) |
| 0.4 | 1.9 | GO:1904579 | response to thapsigargin(GO:1904578) cellular response to thapsigargin(GO:1904579) |
| 0.4 | 2.7 | GO:0006290 | pyrimidine dimer repair(GO:0006290) |
| 0.4 | 3.0 | GO:0003065 | positive regulation of heart rate by epinephrine(GO:0003065) |
| 0.4 | 1.1 | GO:1990927 | calcium ion regulated lysosome exocytosis(GO:1990927) |
| 0.4 | 1.5 | GO:0046125 | thymidine metabolic process(GO:0046104) pyrimidine deoxyribonucleoside metabolic process(GO:0046125) |
| 0.4 | 1.1 | GO:0006844 | acyl carnitine transport(GO:0006844) acyl carnitine transmembrane transport(GO:1902616) |
| 0.4 | 2.6 | GO:0045079 | negative regulation of chemokine biosynthetic process(GO:0045079) |
| 0.4 | 1.8 | GO:0038108 | negative regulation of appetite by leptin-mediated signaling pathway(GO:0038108) |
| 0.4 | 2.5 | GO:1903772 | regulation of viral budding via host ESCRT complex(GO:1903772) |
| 0.4 | 1.4 | GO:2000825 | positive regulation of androgen receptor activity(GO:2000825) |
| 0.3 | 3.1 | GO:0007288 | sperm axoneme assembly(GO:0007288) |
| 0.3 | 1.4 | GO:0061624 | fructose catabolic process(GO:0006001) fructose catabolic process to hydroxyacetone phosphate and glyceraldehyde-3-phosphate(GO:0061624) |
| 0.3 | 2.0 | GO:2000158 | positive regulation of ubiquitin-specific protease activity(GO:2000158) |
| 0.3 | 3.0 | GO:0070236 | negative regulation of activation-induced cell death of T cells(GO:0070236) |
| 0.3 | 0.3 | GO:0009838 | abscission(GO:0009838) |
| 0.3 | 0.3 | GO:0032290 | peripheral nervous system myelin formation(GO:0032290) |
| 0.3 | 0.6 | GO:0007057 | spindle assembly involved in female meiosis I(GO:0007057) |
| 0.3 | 0.6 | GO:0090290 | positive regulation of osteoclast proliferation(GO:0090290) |
| 0.3 | 0.6 | GO:0019255 | glucose 1-phosphate metabolic process(GO:0019255) |
| 0.3 | 5.0 | GO:0001514 | selenocysteine incorporation(GO:0001514) translational readthrough(GO:0006451) |
| 0.3 | 0.6 | GO:0010039 | response to iron ion(GO:0010039) |
| 0.3 | 0.3 | GO:0019254 | carnitine metabolic process, CoA-linked(GO:0019254) |
| 0.3 | 0.9 | GO:1902568 | positive regulation of eosinophil degranulation(GO:0043311) positive regulation of eosinophil activation(GO:1902568) |
| 0.3 | 1.2 | GO:0060265 | positive regulation of respiratory burst involved in inflammatory response(GO:0060265) |
| 0.3 | 1.8 | GO:0006065 | UDP-glucuronate biosynthetic process(GO:0006065) |
| 0.3 | 0.3 | GO:0071941 | urea cycle(GO:0000050) urea metabolic process(GO:0019627) nitrogen cycle metabolic process(GO:0071941) |
| 0.3 | 1.2 | GO:0034445 | regulation of plasma lipoprotein particle oxidation(GO:0034444) negative regulation of plasma lipoprotein particle oxidation(GO:0034445) |
| 0.3 | 0.9 | GO:0000412 | histone peptidyl-prolyl isomerization(GO:0000412) |
| 0.3 | 2.3 | GO:0006933 | negative regulation of cell adhesion involved in substrate-bound cell migration(GO:0006933) |
| 0.3 | 0.6 | GO:0046070 | dGTP metabolic process(GO:0046070) |
| 0.3 | 1.1 | GO:0090071 | negative regulation of ribosome biogenesis(GO:0090071) |
| 0.3 | 1.9 | GO:2000124 | regulation of endocannabinoid signaling pathway(GO:2000124) |
| 0.3 | 0.8 | GO:0019860 | uracil metabolic process(GO:0019860) |
| 0.3 | 0.8 | GO:0006617 | SRP-dependent cotranslational protein targeting to membrane, signal sequence recognition(GO:0006617) |
| 0.3 | 1.1 | GO:0090234 | regulation of kinetochore assembly(GO:0090234) |
| 0.3 | 3.4 | GO:0015074 | DNA integration(GO:0015074) |
| 0.3 | 1.5 | GO:0006420 | arginyl-tRNA aminoacylation(GO:0006420) |
| 0.3 | 1.3 | GO:0060800 | regulation of cell differentiation involved in embryonic placenta development(GO:0060800) |
| 0.3 | 1.0 | GO:0031860 | telomeric 3' overhang formation(GO:0031860) |
| 0.2 | 1.2 | GO:2001106 | regulation of Rho guanyl-nucleotide exchange factor activity(GO:2001106) |
| 0.2 | 0.2 | GO:0006267 | pre-replicative complex assembly involved in nuclear cell cycle DNA replication(GO:0006267) pre-replicative complex assembly(GO:0036388) pre-replicative complex assembly involved in cell cycle DNA replication(GO:1902299) |
| 0.2 | 1.7 | GO:1902897 | regulation of postsynaptic density protein 95 clustering(GO:1902897) |
| 0.2 | 0.7 | GO:2000097 | regulation of smooth muscle cell-matrix adhesion(GO:2000097) |
| 0.2 | 1.5 | GO:0060399 | positive regulation of growth hormone receptor signaling pathway(GO:0060399) |
| 0.2 | 1.0 | GO:2000286 | receptor internalization involved in canonical Wnt signaling pathway(GO:2000286) |
| 0.2 | 1.0 | GO:0019427 | acetate biosynthetic process(GO:0019413) acetyl-CoA biosynthetic process from acetate(GO:0019427) propionate metabolic process(GO:0019541) propionate biosynthetic process(GO:0019542) |
| 0.2 | 0.7 | GO:0051685 | maintenance of ER location(GO:0051685) |
| 0.2 | 0.7 | GO:1900158 | negative regulation of osteoclast proliferation(GO:0090291) negative regulation of bone mineralization involved in bone maturation(GO:1900158) |
| 0.2 | 0.2 | GO:1902186 | viral release from host cell(GO:0019076) regulation of viral release from host cell(GO:1902186) |
| 0.2 | 0.9 | GO:0035262 | gonad morphogenesis(GO:0035262) |
| 0.2 | 2.1 | GO:0060842 | arterial endothelial cell differentiation(GO:0060842) |
| 0.2 | 0.7 | GO:0006550 | isoleucine catabolic process(GO:0006550) |
| 0.2 | 0.9 | GO:2001151 | regulation of renal water transport(GO:2001151) positive regulation of renal water transport(GO:2001153) |
| 0.2 | 2.1 | GO:0046618 | drug export(GO:0046618) |
| 0.2 | 1.6 | GO:1990592 | protein polyufmylation(GO:1990564) protein K69-linked ufmylation(GO:1990592) |
| 0.2 | 0.7 | GO:1903722 | regulation of centriole elongation(GO:1903722) |
| 0.2 | 0.9 | GO:0042247 | morphogenesis of follicular epithelium(GO:0016333) establishment or maintenance of polarity of follicular epithelium(GO:0016334) establishment of planar polarity of follicular epithelium(GO:0042247) |
| 0.2 | 1.8 | GO:0045629 | negative regulation of T-helper 2 cell differentiation(GO:0045629) |
| 0.2 | 0.7 | GO:0071418 | cellular response to amine stimulus(GO:0071418) |
| 0.2 | 0.4 | GO:2000793 | cell proliferation involved in heart valve development(GO:2000793) |
| 0.2 | 0.2 | GO:0045161 | neuronal ion channel clustering(GO:0045161) |
| 0.2 | 0.2 | GO:0039526 | suppression by virus of host apoptotic process(GO:0019050) modulation by virus of host apoptotic process(GO:0039526) |
| 0.2 | 0.9 | GO:0035720 | intraciliary anterograde transport(GO:0035720) |
| 0.2 | 0.4 | GO:1901668 | regulation of superoxide dismutase activity(GO:1901668) |
| 0.2 | 1.5 | GO:0033210 | leptin-mediated signaling pathway(GO:0033210) |
| 0.2 | 2.4 | GO:0001302 | replicative cell aging(GO:0001302) |
| 0.2 | 2.0 | GO:0035845 | photoreceptor cell outer segment organization(GO:0035845) |
| 0.2 | 0.4 | GO:0010847 | regulation of chromatin assembly(GO:0010847) |
| 0.2 | 0.2 | GO:0048246 | macrophage chemotaxis(GO:0048246) |
| 0.2 | 0.8 | GO:0032786 | positive regulation of DNA-templated transcription, elongation(GO:0032786) |
| 0.2 | 0.6 | GO:1903225 | negative regulation of endodermal cell differentiation(GO:1903225) |
| 0.2 | 3.8 | GO:0006662 | glycerol ether metabolic process(GO:0006662) |
| 0.2 | 0.2 | GO:1900120 | regulation of receptor binding(GO:1900120) |
| 0.2 | 1.9 | GO:1901525 | negative regulation of macromitophagy(GO:1901525) |
| 0.2 | 1.9 | GO:0038028 | insulin receptor signaling pathway via phosphatidylinositol 3-kinase(GO:0038028) |
| 0.2 | 0.6 | GO:0035674 | tricarboxylic acid transmembrane transport(GO:0035674) |
| 0.2 | 0.4 | GO:0097212 | lysosomal membrane organization(GO:0097212) |
| 0.2 | 2.8 | GO:0016559 | peroxisome fission(GO:0016559) |
| 0.2 | 1.2 | GO:0010269 | response to selenium ion(GO:0010269) |
| 0.2 | 0.6 | GO:0045897 | positive regulation of transcription during mitosis(GO:0045897) |
| 0.2 | 0.8 | GO:1902766 | skeletal muscle satellite cell migration(GO:1902766) |
| 0.2 | 1.2 | GO:0072675 | multinuclear osteoclast differentiation(GO:0072674) osteoclast fusion(GO:0072675) |
| 0.2 | 0.4 | GO:0043376 | regulation of CD8-positive, alpha-beta T cell differentiation(GO:0043376) |
| 0.2 | 1.0 | GO:0042631 | cellular response to water deprivation(GO:0042631) |
| 0.2 | 2.1 | GO:2000111 | positive regulation of macrophage apoptotic process(GO:2000111) |
| 0.2 | 4.6 | GO:0071447 | cellular response to hydroperoxide(GO:0071447) |
| 0.2 | 0.2 | GO:0000912 | assembly of actomyosin apparatus involved in cytokinesis(GO:0000912) actomyosin contractile ring assembly(GO:0000915) actomyosin contractile ring organization(GO:0044837) |
| 0.2 | 1.0 | GO:0070682 | proteasome regulatory particle assembly(GO:0070682) |
| 0.2 | 0.8 | GO:0036496 | regulation of translational initiation by eIF2 alpha dephosphorylation(GO:0036496) |
| 0.2 | 1.1 | GO:0001692 | histamine metabolic process(GO:0001692) |
| 0.2 | 0.6 | GO:0090598 | male genitalia morphogenesis(GO:0048808) male anatomical structure morphogenesis(GO:0090598) |
| 0.2 | 0.7 | GO:0018032 | protein amidation(GO:0018032) |
| 0.2 | 1.1 | GO:0019626 | short-chain fatty acid catabolic process(GO:0019626) |
| 0.2 | 0.4 | GO:0019859 | pyrimidine nucleobase catabolic process(GO:0006208) thymine catabolic process(GO:0006210) thymine metabolic process(GO:0019859) |
| 0.2 | 0.2 | GO:0033233 | regulation of protein sumoylation(GO:0033233) |
| 0.2 | 1.1 | GO:1902998 | macrophage proliferation(GO:0061517) microglial cell proliferation(GO:0061518) regulation of neuronal signal transduction(GO:1902847) positive regulation of neurofibrillary tangle assembly(GO:1902998) |
| 0.2 | 3.1 | GO:0009313 | oligosaccharide catabolic process(GO:0009313) |
| 0.2 | 0.7 | GO:0032687 | negative regulation of interferon-alpha production(GO:0032687) |
| 0.2 | 2.7 | GO:0030157 | pancreatic juice secretion(GO:0030157) |
| 0.2 | 0.2 | GO:0006286 | base-excision repair, base-free sugar-phosphate removal(GO:0006286) |
| 0.2 | 2.5 | GO:0046051 | UTP metabolic process(GO:0046051) |
| 0.2 | 1.8 | GO:0015846 | polyamine transport(GO:0015846) |
| 0.2 | 0.9 | GO:0019303 | D-ribose catabolic process(GO:0019303) |
| 0.2 | 0.9 | GO:0097327 | response to antineoplastic agent(GO:0097327) |
| 0.2 | 0.4 | GO:0045645 | regulation of eosinophil differentiation(GO:0045643) positive regulation of eosinophil differentiation(GO:0045645) |
| 0.2 | 0.5 | GO:1901896 | positive regulation of calcium-transporting ATPase activity(GO:1901896) |
| 0.2 | 0.2 | GO:0070585 | protein localization to mitochondrion(GO:0070585) |
| 0.2 | 0.2 | GO:0090669 | telomerase RNA stabilization(GO:0090669) |
| 0.2 | 3.8 | GO:0032515 | negative regulation of phosphoprotein phosphatase activity(GO:0032515) |
| 0.2 | 0.9 | GO:0001992 | regulation of systemic arterial blood pressure by vasopressin(GO:0001992) |
| 0.2 | 0.7 | GO:0044407 | biofilm formation(GO:0042710) single-species biofilm formation(GO:0044010) single-species biofilm formation in or on host organism(GO:0044407) regulation of single-species biofilm formation(GO:1900190) negative regulation of single-species biofilm formation(GO:1900191) regulation of single-species biofilm formation in or on host organism(GO:1900228) negative regulation of single-species biofilm formation in or on host organism(GO:1900229) |
| 0.2 | 0.7 | GO:1904566 | response to 1-oleoyl-sn-glycerol 3-phosphate(GO:1904565) cellular response to 1-oleoyl-sn-glycerol 3-phosphate(GO:1904566) |
| 0.2 | 0.7 | GO:2000435 | regulation of protein neddylation(GO:2000434) negative regulation of protein neddylation(GO:2000435) |
| 0.2 | 0.8 | GO:0016240 | autophagosome docking(GO:0016240) |
| 0.2 | 0.2 | GO:0015816 | glycine transport(GO:0015816) |
| 0.2 | 0.2 | GO:0002752 | cell surface pattern recognition receptor signaling pathway(GO:0002752) |
| 0.2 | 1.6 | GO:1903944 | regulation of hepatocyte apoptotic process(GO:1903943) negative regulation of hepatocyte apoptotic process(GO:1903944) |
| 0.2 | 0.6 | GO:0002904 | positive regulation of B cell apoptotic process(GO:0002904) |
| 0.2 | 0.6 | GO:0042412 | taurine biosynthetic process(GO:0042412) |
| 0.2 | 0.8 | GO:0099590 | neurotransmitter receptor internalization(GO:0099590) |
| 0.2 | 3.4 | GO:0019336 | phenol-containing compound catabolic process(GO:0019336) |
| 0.2 | 0.6 | GO:2000230 | negative regulation of pancreatic stellate cell proliferation(GO:2000230) |
| 0.2 | 0.2 | GO:1902824 | positive regulation of late endosome to lysosome transport(GO:1902824) |
| 0.2 | 1.3 | GO:0051106 | positive regulation of DNA ligation(GO:0051106) |
| 0.2 | 0.6 | GO:0070124 | mitochondrial translational initiation(GO:0070124) |
| 0.2 | 0.8 | GO:0060979 | vasculogenesis involved in coronary vascular morphogenesis(GO:0060979) |
| 0.2 | 0.5 | GO:0046338 | phosphatidylethanolamine catabolic process(GO:0046338) |
| 0.2 | 1.6 | GO:0048280 | vesicle fusion with Golgi apparatus(GO:0048280) |
| 0.2 | 1.2 | GO:0043473 | pigmentation(GO:0043473) |
| 0.2 | 0.2 | GO:0071494 | cellular response to UV-C(GO:0071494) |
| 0.2 | 0.3 | GO:2000270 | negative regulation of fibroblast apoptotic process(GO:2000270) |
| 0.2 | 0.6 | GO:0090035 | regulation of chaperone-mediated protein complex assembly(GO:0090034) positive regulation of chaperone-mediated protein complex assembly(GO:0090035) |
| 0.2 | 0.6 | GO:0061304 | retinal blood vessel morphogenesis(GO:0061304) |
| 0.2 | 0.6 | GO:0021539 | subthalamus development(GO:0021539) |
| 0.2 | 2.1 | GO:0031665 | negative regulation of lipopolysaccharide-mediated signaling pathway(GO:0031665) |
| 0.2 | 1.8 | GO:0000290 | deadenylation-dependent decapping of nuclear-transcribed mRNA(GO:0000290) |
| 0.1 | 0.6 | GO:0010966 | regulation of phosphate transport(GO:0010966) |
| 0.1 | 1.5 | GO:0046898 | response to cycloheximide(GO:0046898) |
| 0.1 | 2.8 | GO:2000394 | positive regulation of lamellipodium morphogenesis(GO:2000394) |
| 0.1 | 1.3 | GO:0016926 | protein desumoylation(GO:0016926) |
| 0.1 | 0.3 | GO:0051771 | negative regulation of nitric-oxide synthase biosynthetic process(GO:0051771) |
| 0.1 | 1.5 | GO:0051388 | positive regulation of neurotrophin TRK receptor signaling pathway(GO:0051388) |
| 0.1 | 1.3 | GO:0060059 | embryonic retina morphogenesis in camera-type eye(GO:0060059) |
| 0.1 | 0.7 | GO:0000289 | nuclear-transcribed mRNA poly(A) tail shortening(GO:0000289) |
| 0.1 | 0.1 | GO:0007185 | transmembrane receptor protein tyrosine phosphatase signaling pathway(GO:0007185) |
| 0.1 | 0.6 | GO:0010816 | substance P catabolic process(GO:0010814) calcitonin catabolic process(GO:0010816) endothelin maturation(GO:0034959) |
| 0.1 | 0.3 | GO:0097089 | methyl-branched fatty acid metabolic process(GO:0097089) |
| 0.1 | 0.7 | GO:0051414 | response to cortisol(GO:0051414) |
| 0.1 | 0.6 | GO:0046619 | optic placode formation involved in camera-type eye formation(GO:0046619) |
| 0.1 | 0.9 | GO:0010746 | regulation of plasma membrane long-chain fatty acid transport(GO:0010746) negative regulation of plasma membrane long-chain fatty acid transport(GO:0010748) negative regulation of fatty acid transport(GO:2000192) |
| 0.1 | 0.9 | GO:0006651 | diacylglycerol biosynthetic process(GO:0006651) |
| 0.1 | 1.1 | GO:0070294 | renal sodium ion absorption(GO:0070294) |
| 0.1 | 1.4 | GO:0070862 | negative regulation of protein exit from endoplasmic reticulum(GO:0070862) negative regulation of retrograde protein transport, ER to cytosol(GO:1904153) |
| 0.1 | 0.6 | GO:0046479 | glycosphingolipid catabolic process(GO:0046479) |
| 0.1 | 3.2 | GO:0048757 | endosome to melanosome transport(GO:0035646) endosome to pigment granule transport(GO:0043485) pigment granule maturation(GO:0048757) |
| 0.1 | 1.0 | GO:0043932 | ossification involved in bone remodeling(GO:0043932) |
| 0.1 | 1.5 | GO:0051001 | negative regulation of nitric-oxide synthase activity(GO:0051001) |
| 0.1 | 1.0 | GO:0051511 | regulation of unidimensional cell growth(GO:0051510) negative regulation of unidimensional cell growth(GO:0051511) establishment of cell polarity regulating cell shape(GO:0071964) regulation of establishment or maintenance of cell polarity regulating cell shape(GO:2000769) positive regulation of establishment or maintenance of cell polarity regulating cell shape(GO:2000771) regulation of establishment of cell polarity regulating cell shape(GO:2000782) positive regulation of establishment of cell polarity regulating cell shape(GO:2000784) positive regulation of barbed-end actin filament capping(GO:2000814) |
| 0.1 | 0.8 | GO:0018094 | protein polyglycylation(GO:0018094) |
| 0.1 | 0.1 | GO:0038109 | response to stem cell factor(GO:0036215) cellular response to stem cell factor stimulus(GO:0036216) Kit signaling pathway(GO:0038109) |
| 0.1 | 0.7 | GO:0060846 | vestibulocochlear nerve structural organization(GO:0021649) positive regulation of cytokine activity(GO:0060301) blood vessel endothelial cell fate commitment(GO:0060846) endothelial cell fate specification(GO:0060847) ganglion morphogenesis(GO:0061552) blood vessel endothelial cell fate specification(GO:0097101) endothelial tip cell fate specification(GO:0097102) VEGF-activated neuropilin signaling pathway involved in axon guidance(GO:1902378) dorsal root ganglion morphogenesis(GO:1904835) otic placode development(GO:1905040) |
| 0.1 | 0.4 | GO:0006566 | threonine metabolic process(GO:0006566) |
| 0.1 | 0.4 | GO:0097155 | fasciculation of sensory neuron axon(GO:0097155) |
| 0.1 | 0.4 | GO:2000302 | positive regulation of synaptic vesicle exocytosis(GO:2000302) |
| 0.1 | 2.0 | GO:0035878 | nail development(GO:0035878) |
| 0.1 | 0.7 | GO:0090131 | mesenchyme migration(GO:0090131) |
| 0.1 | 0.8 | GO:0023021 | termination of signal transduction(GO:0023021) |
| 0.1 | 0.8 | GO:0030242 | pexophagy(GO:0030242) |
| 0.1 | 0.9 | GO:0033564 | anterior/posterior axon guidance(GO:0033564) |
| 0.1 | 0.3 | GO:0090119 | vesicle-mediated cholesterol transport(GO:0090119) |
| 0.1 | 0.3 | GO:0061031 | endodermal digestive tract morphogenesis(GO:0061031) |
| 0.1 | 0.3 | GO:0045292 | mRNA cis splicing, via spliceosome(GO:0045292) |
| 0.1 | 0.1 | GO:0060577 | pulmonary vein morphogenesis(GO:0060577) |
| 0.1 | 0.5 | GO:1902807 | negative regulation of cell cycle G1/S phase transition(GO:1902807) |
| 0.1 | 0.1 | GO:1902774 | late endosome to lysosome transport(GO:1902774) |
| 0.1 | 2.7 | GO:0090110 | cargo loading into COPII-coated vesicle(GO:0090110) |
| 0.1 | 0.7 | GO:0046203 | spermidine catabolic process(GO:0046203) |
| 0.1 | 3.6 | GO:0051131 | chaperone-mediated protein complex assembly(GO:0051131) |
| 0.1 | 1.2 | GO:0097033 | respiratory chain complex III assembly(GO:0017062) mitochondrial respiratory chain complex III assembly(GO:0034551) mitochondrial respiratory chain complex III biogenesis(GO:0097033) |
| 0.1 | 0.3 | GO:0036292 | DNA rewinding(GO:0036292) |
| 0.1 | 1.2 | GO:0045039 | protein import into mitochondrial inner membrane(GO:0045039) |
| 0.1 | 1.8 | GO:0006108 | malate metabolic process(GO:0006108) |
| 0.1 | 0.1 | GO:0042832 | defense response to protozoan(GO:0042832) |
| 0.1 | 0.5 | GO:0007509 | mesoderm migration involved in gastrulation(GO:0007509) |
| 0.1 | 1.0 | GO:0075525 | viral translational termination-reinitiation(GO:0075525) |
| 0.1 | 0.4 | GO:0090277 | positive regulation of peptide secretion(GO:0002793) positive regulation of peptide hormone secretion(GO:0090277) |
| 0.1 | 0.4 | GO:0045360 | regulation of interleukin-1 biosynthetic process(GO:0045360) positive regulation of interleukin-1 biosynthetic process(GO:0045362) |
| 0.1 | 1.3 | GO:0002371 | dendritic cell cytokine production(GO:0002371) |
| 0.1 | 2.0 | GO:0034498 | early endosome to Golgi transport(GO:0034498) |
| 0.1 | 0.9 | GO:0071670 | smooth muscle cell chemotaxis(GO:0071670) |
| 0.1 | 0.4 | GO:1904530 | negative regulation of actin filament binding(GO:1904530) negative regulation of actin binding(GO:1904617) |
| 0.1 | 0.4 | GO:0045925 | positive regulation of female receptivity(GO:0045925) |
| 0.1 | 0.5 | GO:1904978 | regulation of endosome organization(GO:1904978) |
| 0.1 | 0.1 | GO:0002884 | type IV hypersensitivity(GO:0001806) regulation of type IV hypersensitivity(GO:0001807) negative regulation of type IV hypersensitivity(GO:0001808) negative regulation of hypersensitivity(GO:0002884) |
| 0.1 | 2.0 | GO:0033539 | fatty acid beta-oxidation using acyl-CoA dehydrogenase(GO:0033539) |
| 0.1 | 0.6 | GO:0019276 | UDP-N-acetylgalactosamine metabolic process(GO:0019276) |
| 0.1 | 1.9 | GO:0000244 | spliceosomal tri-snRNP complex assembly(GO:0000244) |
| 0.1 | 0.5 | GO:1990502 | dense core granule maturation(GO:1990502) |
| 0.1 | 0.8 | GO:0045007 | depurination(GO:0045007) |
| 0.1 | 0.7 | GO:0034628 | nicotinamide nucleotide biosynthetic process from aspartate(GO:0019355) 'de novo' NAD biosynthetic process from aspartate(GO:0034628) |
| 0.1 | 0.4 | GO:0036258 | multivesicular body assembly(GO:0036258) |
| 0.1 | 0.4 | GO:1903463 | regulation of mitotic cell cycle DNA replication(GO:1903463) |
| 0.1 | 0.7 | GO:0036111 | very long-chain fatty-acyl-CoA metabolic process(GO:0036111) |
| 0.1 | 0.5 | GO:0046113 | nucleobase catabolic process(GO:0046113) |
| 0.1 | 0.8 | GO:0090625 | mRNA cleavage involved in gene silencing by siRNA(GO:0090625) |
| 0.1 | 0.5 | GO:0046452 | dihydrofolate metabolic process(GO:0046452) |
| 0.1 | 3.1 | GO:0044804 | nucleophagy(GO:0044804) |
| 0.1 | 1.3 | GO:0097070 | ductus arteriosus closure(GO:0097070) |
| 0.1 | 0.4 | GO:1901165 | positive regulation of trophoblast cell migration(GO:1901165) |
| 0.1 | 1.1 | GO:0000707 | meiotic DNA recombinase assembly(GO:0000707) |
| 0.1 | 0.4 | GO:0046726 | positive regulation by virus of viral protein levels in host cell(GO:0046726) |
| 0.1 | 0.2 | GO:0045792 | negative regulation of cell size(GO:0045792) |
| 0.1 | 0.2 | GO:1901620 | regulation of smoothened signaling pathway involved in dorsal/ventral neural tube patterning(GO:1901620) |
| 0.1 | 0.7 | GO:0070940 | dephosphorylation of RNA polymerase II C-terminal domain(GO:0070940) |
| 0.1 | 0.1 | GO:0090402 | oncogene-induced cell senescence(GO:0090402) |
| 0.1 | 0.7 | GO:0070164 | negative regulation of adiponectin secretion(GO:0070164) |
| 0.1 | 0.3 | GO:0006447 | regulation of translational initiation by iron(GO:0006447) |
| 0.1 | 0.5 | GO:0034334 | adherens junction maintenance(GO:0034334) |
| 0.1 | 0.9 | GO:0050428 | purine ribonucleoside bisphosphate biosynthetic process(GO:0034036) 3'-phosphoadenosine 5'-phosphosulfate biosynthetic process(GO:0050428) |
| 0.1 | 0.2 | GO:0015911 | plasma membrane long-chain fatty acid transport(GO:0015911) |
| 0.1 | 0.3 | GO:0006597 | spermine biosynthetic process(GO:0006597) |
| 0.1 | 0.6 | GO:0046449 | creatinine metabolic process(GO:0046449) |
| 0.1 | 0.1 | GO:0044803 | multi-organism membrane organization(GO:0044803) |
| 0.1 | 0.4 | GO:0072137 | condensed mesenchymal cell proliferation(GO:0072137) |
| 0.1 | 1.0 | GO:0032025 | response to cobalt ion(GO:0032025) |
| 0.1 | 0.6 | GO:0060741 | prostate gland stromal morphogenesis(GO:0060741) |
| 0.1 | 0.3 | GO:0006174 | dADP phosphorylation(GO:0006174) dGDP phosphorylation(GO:0006186) AMP phosphorylation(GO:0006756) CDP phosphorylation(GO:0061508) dAMP phosphorylation(GO:0061565) CMP phosphorylation(GO:0061566) dCMP phosphorylation(GO:0061567) GDP phosphorylation(GO:0061568) UDP phosphorylation(GO:0061569) dCDP phosphorylation(GO:0061570) TDP phosphorylation(GO:0061571) |
| 0.1 | 0.8 | GO:0010911 | regulation of isomerase activity(GO:0010911) positive regulation of isomerase activity(GO:0010912) regulation of DNA topoisomerase (ATP-hydrolyzing) activity(GO:2000371) positive regulation of DNA topoisomerase (ATP-hydrolyzing) activity(GO:2000373) |
| 0.1 | 0.2 | GO:0043553 | negative regulation of phosphatidylinositol 3-kinase activity(GO:0043553) |
| 0.1 | 0.3 | GO:2000564 | CD8-positive, alpha-beta T cell proliferation(GO:0035740) regulation of CD8-positive, alpha-beta T cell proliferation(GO:2000564) |
| 0.1 | 0.5 | GO:0035105 | sterol regulatory element binding protein import into nucleus(GO:0035105) |
| 0.1 | 0.3 | GO:0015680 | intracellular copper ion transport(GO:0015680) |
| 0.1 | 1.0 | GO:1900028 | negative regulation of ruffle assembly(GO:1900028) |
| 0.1 | 1.7 | GO:0032968 | positive regulation of transcription elongation from RNA polymerase II promoter(GO:0032968) |
| 0.1 | 0.4 | GO:0043508 | negative regulation of JUN kinase activity(GO:0043508) |
| 0.1 | 1.7 | GO:0035751 | regulation of lysosomal lumen pH(GO:0035751) |
| 0.1 | 0.6 | GO:1903300 | negative regulation of glucokinase activity(GO:0033132) negative regulation of hexokinase activity(GO:1903300) |
| 0.1 | 0.3 | GO:2000698 | positive regulation of epithelial cell differentiation involved in kidney development(GO:2000698) positive regulation of nephron tubule epithelial cell differentiation(GO:2000768) |
| 0.1 | 1.4 | GO:0060155 | platelet dense granule organization(GO:0060155) |
| 0.1 | 0.6 | GO:0014722 | regulation of skeletal muscle contraction by calcium ion signaling(GO:0014722) |
| 0.1 | 1.0 | GO:2000580 | positive regulation of microtubule motor activity(GO:2000576) regulation of ATP-dependent microtubule motor activity, plus-end-directed(GO:2000580) positive regulation of ATP-dependent microtubule motor activity, plus-end-directed(GO:2000582) |
| 0.1 | 0.2 | GO:2001033 | negative regulation of double-strand break repair via nonhomologous end joining(GO:2001033) |
| 0.1 | 0.6 | GO:1900748 | positive regulation of vascular endothelial growth factor signaling pathway(GO:1900748) |
| 0.1 | 0.2 | GO:0003162 | atrioventricular node development(GO:0003162) |
| 0.1 | 0.7 | GO:0070278 | extracellular matrix constituent secretion(GO:0070278) |
| 0.1 | 5.2 | GO:0000413 | protein peptidyl-prolyl isomerization(GO:0000413) |
| 0.1 | 0.3 | GO:0042796 | snRNA transcription from RNA polymerase III promoter(GO:0042796) |
| 0.1 | 0.5 | GO:0048496 | maintenance of organ identity(GO:0048496) |
| 0.1 | 1.0 | GO:0097500 | receptor localization to nonmotile primary cilium(GO:0097500) |
| 0.1 | 1.7 | GO:0000338 | protein deneddylation(GO:0000338) |
| 0.1 | 0.3 | GO:0006059 | hexitol metabolic process(GO:0006059) inner medullary collecting duct development(GO:0072061) |
| 0.1 | 0.3 | GO:0044240 | multicellular organism lipid catabolic process(GO:0044240) |
| 0.1 | 0.3 | GO:0032618 | interleukin-15 production(GO:0032618) |
| 0.1 | 0.2 | GO:0033387 | putrescine biosynthetic process from ornithine(GO:0033387) |
| 0.1 | 2.2 | GO:1902857 | positive regulation of nonmotile primary cilium assembly(GO:1902857) |
| 0.1 | 0.1 | GO:0043366 | beta selection(GO:0043366) |
| 0.1 | 0.5 | GO:0007227 | signal transduction downstream of smoothened(GO:0007227) |
| 0.1 | 0.2 | GO:0006740 | NADPH regeneration(GO:0006740) |
| 0.1 | 0.2 | GO:0038162 | erythropoietin-mediated signaling pathway(GO:0038162) |
| 0.1 | 0.9 | GO:0070212 | protein poly-ADP-ribosylation(GO:0070212) |
| 0.1 | 0.6 | GO:2000035 | regulation of stem cell division(GO:2000035) |
| 0.1 | 0.8 | GO:0071394 | cellular response to testosterone stimulus(GO:0071394) |
| 0.1 | 3.2 | GO:0000038 | very long-chain fatty acid metabolic process(GO:0000038) |
| 0.1 | 0.3 | GO:0051598 | meiotic DNA double-strand break formation(GO:0042138) meiotic recombination checkpoint(GO:0051598) |
| 0.1 | 0.6 | GO:0035694 | mitochondrial protein catabolic process(GO:0035694) |
| 0.1 | 0.3 | GO:2000196 | positive regulation of female gonad development(GO:2000196) |
| 0.1 | 0.4 | GO:0015813 | L-glutamate transport(GO:0015813) |
| 0.1 | 0.3 | GO:0010992 | ubiquitin homeostasis(GO:0010992) |
| 0.1 | 0.5 | GO:0070086 | ubiquitin-dependent endocytosis(GO:0070086) |
| 0.1 | 0.3 | GO:0070781 | response to biotin(GO:0070781) |
| 0.1 | 1.8 | GO:0035493 | SNARE complex assembly(GO:0035493) |
| 0.1 | 0.5 | GO:0044208 | 'de novo' AMP biosynthetic process(GO:0044208) |
| 0.1 | 2.4 | GO:0045899 | positive regulation of RNA polymerase II transcriptional preinitiation complex assembly(GO:0045899) |
| 0.1 | 0.4 | GO:0015966 | diadenosine polyphosphate biosynthetic process(GO:0015960) diadenosine tetraphosphate metabolic process(GO:0015965) diadenosine tetraphosphate biosynthetic process(GO:0015966) |
| 0.1 | 1.5 | GO:0032836 | glomerular basement membrane development(GO:0032836) |
| 0.1 | 0.9 | GO:0051013 | microtubule severing(GO:0051013) |
| 0.1 | 0.4 | GO:2000645 | negative regulation of receptor catabolic process(GO:2000645) |
| 0.1 | 0.6 | GO:1901727 | positive regulation of histone deacetylase activity(GO:1901727) |
| 0.1 | 0.3 | GO:0019085 | early viral transcription(GO:0019085) |
| 0.1 | 0.4 | GO:0006990 | positive regulation of transcription from RNA polymerase II promoter involved in unfolded protein response(GO:0006990) |
| 0.1 | 0.3 | GO:0006620 | posttranslational protein targeting to membrane(GO:0006620) |
| 0.1 | 0.9 | GO:0043152 | induction of bacterial agglutination(GO:0043152) |
| 0.1 | 0.3 | GO:0045059 | positive thymic T cell selection(GO:0045059) |
| 0.1 | 0.4 | GO:0097527 | necroptotic signaling pathway(GO:0097527) |
| 0.1 | 0.3 | GO:0021986 | epithalamus development(GO:0021538) habenula development(GO:0021986) |
| 0.1 | 0.2 | GO:1901656 | glycoside transport(GO:1901656) |
| 0.1 | 0.3 | GO:1900276 | regulation of proteinase activated receptor activity(GO:1900276) negative regulation of phospholipase C-activating G-protein coupled receptor signaling pathway(GO:1900737) |
| 0.1 | 0.5 | GO:0033194 | response to hydroperoxide(GO:0033194) |
| 0.1 | 0.7 | GO:0014816 | skeletal muscle satellite cell differentiation(GO:0014816) |
| 0.1 | 0.4 | GO:0072086 | specification of loop of Henle identity(GO:0072086) |
| 0.1 | 0.4 | GO:0043983 | histone H4-K12 acetylation(GO:0043983) |
| 0.1 | 0.5 | GO:0045337 | geranyl diphosphate metabolic process(GO:0033383) geranyl diphosphate biosynthetic process(GO:0033384) farnesyl diphosphate biosynthetic process(GO:0045337) |
| 0.1 | 0.5 | GO:0034393 | positive regulation of smooth muscle cell apoptotic process(GO:0034393) |
| 0.1 | 0.5 | GO:0035407 | histone H3-T11 phosphorylation(GO:0035407) |
| 0.1 | 0.5 | GO:1901857 | positive regulation of cellular respiration(GO:1901857) |
| 0.1 | 0.5 | GO:0044858 | plasma membrane raft distribution(GO:0044855) plasma membrane raft localization(GO:0044856) plasma membrane raft polarization(GO:0044858) regulation of plasma membrane raft polarization(GO:1903906) |
| 0.1 | 0.5 | GO:0060267 | positive regulation of respiratory burst(GO:0060267) |
| 0.1 | 1.6 | GO:2000480 | negative regulation of cAMP-dependent protein kinase activity(GO:2000480) |
| 0.1 | 0.2 | GO:0033594 | response to hydroxyisoflavone(GO:0033594) |
| 0.1 | 0.4 | GO:0010757 | negative regulation of plasminogen activation(GO:0010757) |
| 0.1 | 0.5 | GO:0006657 | CDP-choline pathway(GO:0006657) |
| 0.1 | 0.8 | GO:0033578 | protein glycosylation in Golgi(GO:0033578) |
| 0.1 | 0.7 | GO:2000601 | positive regulation of Arp2/3 complex-mediated actin nucleation(GO:2000601) |
| 0.1 | 0.4 | GO:0061428 | negative regulation of transcription from RNA polymerase II promoter in response to hypoxia(GO:0061428) |
| 0.1 | 0.2 | GO:0021879 | forebrain neuron differentiation(GO:0021879) |
| 0.1 | 0.1 | GO:0019048 | modulation by virus of host morphology or physiology(GO:0019048) |
| 0.1 | 0.5 | GO:0035624 | receptor transactivation(GO:0035624) |
| 0.1 | 0.3 | GO:0038061 | NIK/NF-kappaB signaling(GO:0038061) |
| 0.1 | 0.8 | GO:0043578 | nuclear matrix organization(GO:0043578) nuclear matrix anchoring at nuclear membrane(GO:0090292) |
| 0.1 | 3.6 | GO:0015985 | energy coupled proton transport, down electrochemical gradient(GO:0015985) ATP synthesis coupled proton transport(GO:0015986) |
| 0.1 | 0.1 | GO:0048318 | axial mesoderm development(GO:0048318) |
| 0.1 | 0.3 | GO:0071922 | establishment of sister chromatid cohesion(GO:0034085) cohesin loading(GO:0071921) regulation of cohesin loading(GO:0071922) |
| 0.1 | 0.3 | GO:0044313 | protein K6-linked deubiquitination(GO:0044313) |
| 0.1 | 0.1 | GO:0007032 | endosome organization(GO:0007032) |
| 0.1 | 0.3 | GO:0034154 | toll-like receptor 7 signaling pathway(GO:0034154) |
| 0.1 | 0.8 | GO:0045742 | positive regulation of epidermal growth factor receptor signaling pathway(GO:0045742) positive regulation of ERBB signaling pathway(GO:1901186) |
| 0.1 | 2.1 | GO:0019800 | peptide cross-linking via chondroitin 4-sulfate glycosaminoglycan(GO:0019800) |
| 0.1 | 0.7 | GO:0045048 | protein insertion into ER membrane(GO:0045048) |
| 0.1 | 0.3 | GO:0035669 | TRAM-dependent toll-like receptor signaling pathway(GO:0035668) TRAM-dependent toll-like receptor 4 signaling pathway(GO:0035669) |
| 0.1 | 0.7 | GO:1902035 | positive regulation of hematopoietic stem cell proliferation(GO:1902035) |
| 0.1 | 0.9 | GO:0070493 | thrombin receptor signaling pathway(GO:0070493) |
| 0.1 | 0.3 | GO:0048382 | mesendoderm development(GO:0048382) |
| 0.1 | 0.1 | GO:0030309 | poly-N-acetyllactosamine metabolic process(GO:0030309) |
| 0.1 | 0.2 | GO:0006983 | ER overload response(GO:0006983) |
| 0.1 | 1.0 | GO:0048793 | pronephros development(GO:0048793) |
| 0.1 | 0.6 | GO:0098535 | de novo centriole assembly(GO:0098535) |
| 0.1 | 0.2 | GO:0016569 | covalent chromatin modification(GO:0016569) |
| 0.1 | 0.3 | GO:0046167 | glycerol-3-phosphate biosynthetic process(GO:0046167) |
| 0.1 | 0.5 | GO:2000909 | regulation of cholesterol import(GO:0060620) regulation of sterol import(GO:2000909) |
| 0.1 | 0.1 | GO:0051136 | regulation of NK T cell differentiation(GO:0051136) positive regulation of NK T cell differentiation(GO:0051138) |
| 0.1 | 0.2 | GO:0002384 | hepatic immune response(GO:0002384) |
| 0.1 | 0.6 | GO:1900119 | positive regulation of execution phase of apoptosis(GO:1900119) |
| 0.1 | 0.2 | GO:0051097 | negative regulation of helicase activity(GO:0051097) |
| 0.1 | 0.5 | GO:0097084 | vascular smooth muscle cell development(GO:0097084) |
| 0.1 | 1.5 | GO:2000114 | regulation of establishment of cell polarity(GO:2000114) |
| 0.1 | 1.5 | GO:0045116 | protein neddylation(GO:0045116) |
| 0.1 | 0.2 | GO:0002034 | regulation of blood vessel size by renin-angiotensin(GO:0002034) renal control of peripheral vascular resistance involved in regulation of systemic arterial blood pressure(GO:0003072) |
| 0.1 | 0.4 | GO:0097112 | gamma-aminobutyric acid receptor clustering(GO:0097112) |
| 0.1 | 0.5 | GO:0006931 | substrate-dependent cell migration, cell attachment to substrate(GO:0006931) |
| 0.1 | 0.3 | GO:0002331 | pre-B cell allelic exclusion(GO:0002331) |
| 0.1 | 0.4 | GO:0032962 | positive regulation of inositol trisphosphate biosynthetic process(GO:0032962) |
| 0.1 | 0.4 | GO:0097210 | response to gonadotropin-releasing hormone(GO:0097210) cellular response to gonadotropin-releasing hormone(GO:0097211) |
| 0.1 | 2.1 | GO:0051123 | RNA polymerase II transcriptional preinitiation complex assembly(GO:0051123) |
| 0.1 | 3.2 | GO:0032008 | positive regulation of TOR signaling(GO:0032008) |
| 0.1 | 0.5 | GO:0016480 | negative regulation of transcription from RNA polymerase III promoter(GO:0016480) |
| 0.1 | 1.3 | GO:0031573 | intra-S DNA damage checkpoint(GO:0031573) |
| 0.1 | 0.1 | GO:2000622 | regulation of nuclear-transcribed mRNA catabolic process, nonsense-mediated decay(GO:2000622) negative regulation of nuclear-transcribed mRNA catabolic process, nonsense-mediated decay(GO:2000623) |
| 0.1 | 1.2 | GO:0000715 | nucleotide-excision repair, DNA damage recognition(GO:0000715) |
| 0.1 | 0.1 | GO:2000812 | regulation of barbed-end actin filament capping(GO:2000812) |
| 0.1 | 0.1 | GO:0086053 | AV node cell to bundle of His cell communication by electrical coupling(GO:0086053) |
| 0.1 | 0.5 | GO:0055129 | L-proline biosynthetic process(GO:0055129) |
| 0.1 | 0.2 | GO:0007016 | cytoskeletal anchoring at plasma membrane(GO:0007016) |
| 0.1 | 0.9 | GO:0039536 | negative regulation of RIG-I signaling pathway(GO:0039536) |
| 0.1 | 0.5 | GO:0006102 | isocitrate metabolic process(GO:0006102) |
| 0.1 | 0.2 | GO:0060994 | regulation of transcription from RNA polymerase II promoter involved in kidney development(GO:0060994) |
| 0.1 | 0.2 | GO:0016260 | selenocysteine biosynthetic process(GO:0016260) |
| 0.1 | 0.1 | GO:0046833 | positive regulation of RNA export from nucleus(GO:0046833) |
| 0.1 | 0.7 | GO:0006552 | leucine catabolic process(GO:0006552) |
| 0.1 | 0.9 | GO:0048251 | elastic fiber assembly(GO:0048251) |
| 0.1 | 0.5 | GO:1902255 | positive regulation of intrinsic apoptotic signaling pathway by p53 class mediator(GO:1902255) |
| 0.1 | 0.1 | GO:0050653 | chondroitin sulfate proteoglycan biosynthetic process, polysaccharide chain biosynthetic process(GO:0050653) |
| 0.1 | 0.2 | GO:0015891 | iron chelate transport(GO:0015688) siderophore transport(GO:0015891) |
| 0.1 | 5.3 | GO:0006120 | mitochondrial electron transport, NADH to ubiquinone(GO:0006120) |
| 0.1 | 0.3 | GO:0010587 | miRNA catabolic process(GO:0010587) |
| 0.1 | 0.4 | GO:0006546 | glycine catabolic process(GO:0006546) glycine decarboxylation via glycine cleavage system(GO:0019464) |
| 0.1 | 0.1 | GO:0060398 | regulation of growth hormone receptor signaling pathway(GO:0060398) |
| 0.1 | 0.4 | GO:0003070 | age-dependent response to oxidative stress(GO:0001306) age-dependent response to reactive oxygen species(GO:0001315) regulation of systemic arterial blood pressure by acetylcholine(GO:0003068) vasodilation by acetylcholine involved in regulation of systemic arterial blood pressure(GO:0003069) regulation of systemic arterial blood pressure by neurotransmitter(GO:0003070) age-dependent general metabolic decline(GO:0007571) |
| 0.1 | 1.1 | GO:1903690 | negative regulation of wound healing, spreading of epidermal cells(GO:1903690) |
| 0.1 | 0.6 | GO:0032696 | negative regulation of interleukin-13 production(GO:0032696) |
| 0.1 | 0.2 | GO:0031548 | regulation of brain-derived neurotrophic factor receptor signaling pathway(GO:0031548) |
| 0.1 | 0.4 | GO:2001275 | positive regulation of glucose import in response to insulin stimulus(GO:2001275) |
| 0.1 | 0.1 | GO:0042450 | arginine biosynthetic process via ornithine(GO:0042450) |
| 0.1 | 0.3 | GO:0071545 | inositol phosphate catabolic process(GO:0071545) |
| 0.1 | 1.3 | GO:0071850 | mitotic cell cycle arrest(GO:0071850) |
| 0.1 | 0.3 | GO:0060729 | intestinal epithelial structure maintenance(GO:0060729) |
| 0.1 | 1.0 | GO:0016226 | iron-sulfur cluster assembly(GO:0016226) metallo-sulfur cluster assembly(GO:0031163) |
| 0.1 | 0.6 | GO:0022027 | interkinetic nuclear migration(GO:0022027) |
| 0.1 | 0.1 | GO:0044028 | DNA hypomethylation(GO:0044028) hypomethylation of CpG island(GO:0044029) |
| 0.1 | 0.1 | GO:0016458 | gene silencing(GO:0016458) |
| 0.1 | 2.0 | GO:0044458 | motile cilium assembly(GO:0044458) |
| 0.1 | 0.2 | GO:0070676 | intralumenal vesicle formation(GO:0070676) |
| 0.1 | 1.0 | GO:0006044 | N-acetylglucosamine metabolic process(GO:0006044) |
| 0.1 | 0.2 | GO:0018095 | protein polyglutamylation(GO:0018095) |
| 0.1 | 0.4 | GO:1902659 | regulation of glucose mediated signaling pathway(GO:1902659) |
| 0.1 | 0.2 | GO:0001928 | regulation of exocyst assembly(GO:0001928) regulation of exocyst localization(GO:0060178) |
| 0.1 | 3.9 | GO:0070979 | protein K11-linked ubiquitination(GO:0070979) |
| 0.1 | 0.2 | GO:0007172 | signal complex assembly(GO:0007172) |
| 0.1 | 1.1 | GO:0048227 | plasma membrane to endosome transport(GO:0048227) |
| 0.1 | 0.3 | GO:0072321 | chaperone-mediated protein transport(GO:0072321) |
| 0.1 | 0.2 | GO:0051384 | response to glucocorticoid(GO:0051384) |
| 0.1 | 0.3 | GO:0048806 | genitalia development(GO:0048806) |
| 0.1 | 0.2 | GO:0003363 | lamellipodium assembly involved in ameboidal cell migration(GO:0003363) extension of a leading process involved in cell motility in cerebral cortex radial glia guided migration(GO:0021816) |
| 0.1 | 0.2 | GO:0007157 | heterophilic cell-cell adhesion via plasma membrane cell adhesion molecules(GO:0007157) |
| 0.1 | 0.1 | GO:0034239 | macrophage fusion(GO:0034238) regulation of macrophage fusion(GO:0034239) positive regulation of macrophage fusion(GO:0034241) |
| 0.1 | 0.2 | GO:0042938 | dipeptide transport(GO:0042938) |
| 0.1 | 0.1 | GO:0070213 | protein auto-ADP-ribosylation(GO:0070213) |
| 0.1 | 0.1 | GO:0007113 | endomitotic cell cycle(GO:0007113) |
| 0.1 | 10.0 | GO:0006614 | SRP-dependent cotranslational protein targeting to membrane(GO:0006614) |
| 0.1 | 1.5 | GO:0006744 | ubiquinone biosynthetic process(GO:0006744) quinone biosynthetic process(GO:1901663) |
| 0.1 | 0.3 | GO:0061762 | CAMKK-AMPK signaling cascade(GO:0061762) |
| 0.1 | 0.1 | GO:0061030 | epithelial cell differentiation involved in mammary gland alveolus development(GO:0061030) |
| 0.1 | 0.3 | GO:0097010 | eukaryotic translation initiation factor 4F complex assembly(GO:0097010) |
| 0.1 | 0.1 | GO:0035376 | sterol import(GO:0035376) cholesterol import(GO:0070508) |
| 0.1 | 1.4 | GO:0097034 | mitochondrial respiratory chain complex IV assembly(GO:0033617) mitochondrial respiratory chain complex IV biogenesis(GO:0097034) |
| 0.1 | 5.5 | GO:0042147 | retrograde transport, endosome to Golgi(GO:0042147) |
| 0.1 | 0.1 | GO:0009447 | putrescine catabolic process(GO:0009447) |
| 0.1 | 0.2 | GO:0006598 | polyamine catabolic process(GO:0006598) |
| 0.1 | 0.3 | GO:0006311 | meiotic gene conversion(GO:0006311) |
| 0.1 | 0.2 | GO:1900114 | positive regulation of histone H3-K9 trimethylation(GO:1900114) |
| 0.1 | 0.4 | GO:0007023 | post-chaperonin tubulin folding pathway(GO:0007023) |
| 0.1 | 0.1 | GO:1903317 | regulation of protein processing(GO:0070613) regulation of protein maturation(GO:1903317) |
| 0.1 | 0.1 | GO:2000304 | positive regulation of sphingolipid biosynthetic process(GO:0090154) positive regulation of ceramide biosynthetic process(GO:2000304) |
| 0.1 | 0.3 | GO:0001880 | Mullerian duct regression(GO:0001880) |
| 0.1 | 0.7 | GO:0034465 | response to carbon monoxide(GO:0034465) |
| 0.1 | 0.3 | GO:2001240 | negative regulation of signal transduction in absence of ligand(GO:1901099) negative regulation of extrinsic apoptotic signaling pathway in absence of ligand(GO:2001240) |
| 0.1 | 0.7 | GO:0016082 | synaptic vesicle priming(GO:0016082) |
| 0.1 | 0.2 | GO:0006500 | N-terminal protein palmitoylation(GO:0006500) |
| 0.1 | 0.3 | GO:0071894 | histone H2B conserved C-terminal lysine ubiquitination(GO:0071894) |
| 0.1 | 0.2 | GO:0098935 | dendritic transport(GO:0098935) anterograde dendritic transport(GO:0098937) |
| 0.1 | 1.1 | GO:0035518 | histone H2A monoubiquitination(GO:0035518) |
| 0.1 | 0.9 | GO:0043247 | telomere maintenance in response to DNA damage(GO:0043247) |
| 0.1 | 0.5 | GO:0060136 | embryonic process involved in female pregnancy(GO:0060136) |
| 0.1 | 1.6 | GO:0042753 | positive regulation of circadian rhythm(GO:0042753) |
| 0.1 | 0.1 | GO:0051030 | snRNA transport(GO:0051030) |
| 0.1 | 1.0 | GO:1900364 | negative regulation of mRNA polyadenylation(GO:1900364) |
| 0.1 | 0.2 | GO:0014054 | positive regulation of gamma-aminobutyric acid secretion(GO:0014054) |
| 0.1 | 0.2 | GO:0003340 | negative regulation of mesenchymal to epithelial transition involved in metanephros morphogenesis(GO:0003340) |
| 0.1 | 0.2 | GO:1905244 | regulation of modification of synaptic structure(GO:1905244) |
| 0.1 | 0.2 | GO:0060152 | peroxisome localization(GO:0060151) microtubule-based peroxisome localization(GO:0060152) |
| 0.1 | 1.0 | GO:0007035 | vacuolar acidification(GO:0007035) |
| 0.1 | 0.3 | GO:0048861 | leukemia inhibitory factor signaling pathway(GO:0048861) |
| 0.1 | 1.1 | GO:0097151 | positive regulation of inhibitory postsynaptic potential(GO:0097151) modulation of inhibitory postsynaptic potential(GO:0098828) |
| 0.1 | 0.2 | GO:0060748 | tertiary branching involved in mammary gland duct morphogenesis(GO:0060748) |
| 0.1 | 0.3 | GO:0090043 | regulation of tubulin deacetylation(GO:0090043) |
| 0.1 | 0.3 | GO:2000690 | negative regulation of cardioblast differentiation(GO:0051892) regulation of cardiac muscle cell myoblast differentiation(GO:2000690) negative regulation of cardiac muscle cell myoblast differentiation(GO:2000691) |
| 0.1 | 0.2 | GO:0009258 | 10-formyltetrahydrofolate catabolic process(GO:0009258) |
| 0.1 | 0.8 | GO:0070935 | 3'-UTR-mediated mRNA stabilization(GO:0070935) |
| 0.1 | 0.2 | GO:0019417 | sulfur oxidation(GO:0019417) |
| 0.1 | 0.3 | GO:0035871 | protein K11-linked deubiquitination(GO:0035871) |
| 0.1 | 0.4 | GO:0034127 | regulation of MyD88-independent toll-like receptor signaling pathway(GO:0034127) |
| 0.1 | 1.1 | GO:0071157 | negative regulation of cell cycle arrest(GO:0071157) |
| 0.1 | 0.7 | GO:0048009 | insulin-like growth factor receptor signaling pathway(GO:0048009) |
| 0.1 | 0.2 | GO:0014876 | response to injury involved in regulation of muscle adaptation(GO:0014876) |
| 0.1 | 0.5 | GO:0051096 | regulation of helicase activity(GO:0051095) positive regulation of helicase activity(GO:0051096) |
| 0.1 | 0.6 | GO:1904778 | regulation of protein localization to cell cortex(GO:1904776) positive regulation of protein localization to cell cortex(GO:1904778) |
| 0.1 | 0.2 | GO:0035811 | negative regulation of urine volume(GO:0035811) |
| 0.1 | 5.2 | GO:0006890 | retrograde vesicle-mediated transport, Golgi to ER(GO:0006890) |
| 0.1 | 0.2 | GO:0010735 | positive regulation of transcription via serum response element binding(GO:0010735) |
| 0.1 | 0.5 | GO:0097577 | intracellular sequestering of iron ion(GO:0006880) sequestering of iron ion(GO:0097577) |
| 0.1 | 0.2 | GO:0046121 | deoxyribonucleoside catabolic process(GO:0046121) |
| 0.1 | 0.4 | GO:1902969 | mitotic DNA replication(GO:1902969) |
| 0.1 | 0.2 | GO:0098907 | protein localization to T-tubule(GO:0036371) regulation of SA node cell action potential(GO:0098907) |
| 0.1 | 0.3 | GO:0035865 | cellular response to potassium ion(GO:0035865) |
| 0.1 | 0.5 | GO:0071380 | cellular response to prostaglandin E stimulus(GO:0071380) |
| 0.1 | 0.2 | GO:0051714 | positive regulation of cytolysis in other organism(GO:0051714) |
| 0.1 | 0.1 | GO:0071320 | cellular response to cAMP(GO:0071320) |
| 0.1 | 0.2 | GO:0007097 | nuclear migration(GO:0007097) |
| 0.1 | 1.6 | GO:0016578 | histone deubiquitination(GO:0016578) |
| 0.1 | 0.1 | GO:0009450 | gamma-aminobutyric acid catabolic process(GO:0009450) |
| 0.1 | 0.5 | GO:0038030 | non-canonical Wnt signaling pathway via MAPK cascade(GO:0038030) non-canonical Wnt signaling pathway via JNK cascade(GO:0038031) |
| 0.1 | 1.7 | GO:0035735 | intraciliary transport involved in cilium morphogenesis(GO:0035735) |
| 0.1 | 0.5 | GO:0017185 | peptidyl-lysine hydroxylation(GO:0017185) |
| 0.1 | 0.4 | GO:0031086 | nuclear-transcribed mRNA catabolic process, deadenylation-independent decay(GO:0031086) |
| 0.1 | 0.8 | GO:0048172 | regulation of short-term neuronal synaptic plasticity(GO:0048172) |
| 0.1 | 0.3 | GO:0060628 | regulation of ER to Golgi vesicle-mediated transport(GO:0060628) |
| 0.1 | 0.4 | GO:0060754 | positive regulation of mast cell chemotaxis(GO:0060754) |
| 0.1 | 0.1 | GO:0007290 | spermatid nucleus elongation(GO:0007290) |
| 0.1 | 0.1 | GO:0033135 | regulation of peptidyl-serine phosphorylation(GO:0033135) |
| 0.1 | 1.2 | GO:0045663 | positive regulation of myoblast differentiation(GO:0045663) |
| 0.1 | 0.2 | GO:0019323 | pentose catabolic process(GO:0019323) |
| 0.1 | 0.5 | GO:0032534 | regulation of microvillus assembly(GO:0032534) |
| 0.1 | 0.2 | GO:0002879 | positive regulation of acute inflammatory response to non-antigenic stimulus(GO:0002879) |
| 0.1 | 0.2 | GO:0031064 | negative regulation of histone deacetylation(GO:0031064) |
| 0.1 | 0.2 | GO:0042357 | thiamine diphosphate metabolic process(GO:0042357) |
| 0.1 | 2.1 | GO:0016601 | Rac protein signal transduction(GO:0016601) |
| 0.1 | 0.2 | GO:0010897 | negative regulation of triglyceride catabolic process(GO:0010897) |
| 0.1 | 0.3 | GO:0051056 | regulation of small GTPase mediated signal transduction(GO:0051056) |
| 0.1 | 0.5 | GO:0036444 | calcium ion transmembrane import into mitochondrion(GO:0036444) |
| 0.1 | 0.2 | GO:1901624 | negative regulation of lymphocyte chemotaxis(GO:1901624) |
| 0.1 | 0.5 | GO:0070934 | CRD-mediated mRNA stabilization(GO:0070934) |
| 0.1 | 0.3 | GO:0006526 | arginine biosynthetic process(GO:0006526) |
| 0.1 | 0.1 | GO:0030218 | erythrocyte differentiation(GO:0030218) |
| 0.1 | 0.3 | GO:0031642 | negative regulation of myelination(GO:0031642) |
| 0.1 | 0.2 | GO:0043504 | mitochondrial DNA repair(GO:0043504) |
| 0.1 | 1.3 | GO:0007191 | adenylate cyclase-activating dopamine receptor signaling pathway(GO:0007191) |
| 0.1 | 0.2 | GO:0007031 | peroxisome organization(GO:0007031) |
| 0.1 | 0.3 | GO:0052551 | response to defense-related nitric oxide production by other organism involved in symbiotic interaction(GO:0052551) response to defense-related host nitric oxide production(GO:0052565) |
| 0.1 | 0.2 | GO:0002200 | somatic diversification of immune receptors(GO:0002200) |
| 0.1 | 0.2 | GO:1900075 | regulation of neuromuscular synaptic transmission(GO:1900073) positive regulation of neuromuscular synaptic transmission(GO:1900075) |
| 0.1 | 0.3 | GO:0015798 | myo-inositol transport(GO:0015798) |
| 0.1 | 1.6 | GO:0090022 | regulation of neutrophil chemotaxis(GO:0090022) |
| 0.1 | 0.6 | GO:1902083 | negative regulation of peptidyl-cysteine S-nitrosylation(GO:1902083) |
| 0.1 | 0.2 | GO:0006556 | S-adenosylmethionine biosynthetic process(GO:0006556) |
| 0.1 | 0.1 | GO:0002442 | serotonin production involved in inflammatory response(GO:0002351) serotonin secretion involved in inflammatory response(GO:0002442) serotonin secretion by platelet(GO:0002554) |
| 0.1 | 0.3 | GO:1902525 | regulation of protein monoubiquitination(GO:1902525) |
| 0.1 | 0.2 | GO:0002322 | B cell proliferation involved in immune response(GO:0002322) |
| 0.1 | 0.3 | GO:0061635 | regulation of protein complex stability(GO:0061635) |
| 0.1 | 0.4 | GO:0046836 | glycolipid transport(GO:0046836) |
| 0.1 | 0.3 | GO:0003356 | regulation of cilium movement(GO:0003352) regulation of cilium beat frequency(GO:0003356) |
| 0.1 | 0.6 | GO:0006621 | protein retention in ER lumen(GO:0006621) |
| 0.1 | 0.9 | GO:0031063 | regulation of histone deacetylation(GO:0031063) |
| 0.1 | 0.2 | GO:0050917 | sensory perception of umami taste(GO:0050917) |
| 0.1 | 0.2 | GO:0031016 | pancreas development(GO:0031016) |
| 0.1 | 0.5 | GO:0042989 | sequestering of actin monomers(GO:0042989) |
| 0.1 | 0.2 | GO:0030997 | regulation of centriole-centriole cohesion(GO:0030997) |
| 0.1 | 0.4 | GO:0031120 | snRNA pseudouridine synthesis(GO:0031120) |
| 0.1 | 0.2 | GO:0036337 | Fas signaling pathway(GO:0036337) regulation of Fas signaling pathway(GO:1902044) |
| 0.1 | 3.5 | GO:1902017 | regulation of cilium assembly(GO:1902017) |
| 0.1 | 0.5 | GO:0010891 | negative regulation of sequestering of triglyceride(GO:0010891) |
| 0.1 | 0.4 | GO:0016255 | attachment of GPI anchor to protein(GO:0016255) |
| 0.1 | 0.4 | GO:0097039 | protein linear polyubiquitination(GO:0097039) |
| 0.1 | 0.2 | GO:0021869 | forebrain ventricular zone progenitor cell division(GO:0021869) |
| 0.1 | 0.1 | GO:0032755 | positive regulation of interleukin-6 production(GO:0032755) |
| 0.1 | 0.7 | GO:0000185 | activation of MAPKKK activity(GO:0000185) |
| 0.1 | 0.1 | GO:1990262 | regulation of anti-Mullerian hormone signaling pathway(GO:1902612) negative regulation of anti-Mullerian hormone signaling pathway(GO:1902613) anti-Mullerian hormone signaling pathway(GO:1990262) |
| 0.1 | 0.8 | GO:0006020 | inositol metabolic process(GO:0006020) |
| 0.1 | 0.2 | GO:0001978 | regulation of systemic arterial blood pressure by carotid sinus baroreceptor feedback(GO:0001978) baroreceptor response to increased systemic arterial blood pressure(GO:0001983) |
| 0.1 | 0.4 | GO:0009263 | deoxyribonucleotide biosynthetic process(GO:0009263) |
| 0.1 | 0.8 | GO:0090190 | positive regulation of branching involved in ureteric bud morphogenesis(GO:0090190) |
| 0.1 | 0.2 | GO:0038193 | thromboxane A2 signaling pathway(GO:0038193) |
| 0.1 | 0.2 | GO:0048305 | immunoglobulin secretion(GO:0048305) |
| 0.1 | 1.4 | GO:0043101 | purine-containing compound salvage(GO:0043101) |
| 0.1 | 0.2 | GO:2000697 | negative regulation by virus of viral protein levels in host cell(GO:0046725) negative regulation of nephron tubule epithelial cell differentiation(GO:0072183) negative regulation of metanephric nephron tubule epithelial cell differentiation(GO:0072308) negative regulation of epithelial cell differentiation involved in kidney development(GO:2000697) |
| 0.1 | 0.2 | GO:0031116 | positive regulation of microtubule polymerization(GO:0031116) |
| 0.1 | 2.6 | GO:0042733 | embryonic digit morphogenesis(GO:0042733) |
| 0.1 | 0.2 | GO:0050760 | negative regulation of thymidylate synthase biosynthetic process(GO:0050760) |
| 0.0 | 0.0 | GO:1903902 | positive regulation of viral life cycle(GO:1903902) |
| 0.0 | 0.0 | GO:0035928 | rRNA import into mitochondrion(GO:0035928) rRNA transport(GO:0051029) |
| 0.0 | 0.5 | GO:0015939 | pantothenate metabolic process(GO:0015939) |
| 0.0 | 0.2 | GO:0000389 | mRNA 3'-splice site recognition(GO:0000389) |
| 0.0 | 0.2 | GO:0031572 | G2 DNA damage checkpoint(GO:0031572) |
| 0.0 | 0.2 | GO:2001013 | epithelial cell proliferation involved in renal tubule morphogenesis(GO:2001013) |
| 0.0 | 0.2 | GO:0098532 | histone H3-K27 trimethylation(GO:0098532) |
| 0.0 | 0.3 | GO:0035965 | cardiolipin acyl-chain remodeling(GO:0035965) |
| 0.0 | 0.9 | GO:0032703 | negative regulation of interleukin-2 production(GO:0032703) |
| 0.0 | 0.4 | GO:1901475 | pyruvate transport(GO:0006848) pyruvate transmembrane transport(GO:1901475) |
| 0.0 | 0.0 | GO:0001927 | exocyst assembly(GO:0001927) |
| 0.0 | 0.4 | GO:0031274 | positive regulation of pseudopodium assembly(GO:0031274) |
| 0.0 | 1.1 | GO:1902187 | negative regulation of viral release from host cell(GO:1902187) |
| 0.0 | 1.4 | GO:0034314 | Arp2/3 complex-mediated actin nucleation(GO:0034314) |
| 0.0 | 0.1 | GO:0006002 | fructose 6-phosphate metabolic process(GO:0006002) |
| 0.0 | 0.2 | GO:0032000 | positive regulation of fatty acid beta-oxidation(GO:0032000) |
| 0.0 | 0.2 | GO:0010499 | proteasomal ubiquitin-independent protein catabolic process(GO:0010499) |
| 0.0 | 0.9 | GO:0033622 | integrin activation(GO:0033622) |
| 0.0 | 0.2 | GO:0003190 | atrioventricular valve formation(GO:0003190) |
| 0.0 | 0.1 | GO:1902490 | regulation of sperm capacitation(GO:1902490) |
| 0.0 | 2.1 | GO:0050775 | positive regulation of dendrite morphogenesis(GO:0050775) |
| 0.0 | 1.8 | GO:0006298 | mismatch repair(GO:0006298) |
| 0.0 | 0.7 | GO:0006388 | tRNA splicing, via endonucleolytic cleavage and ligation(GO:0006388) |
| 0.0 | 0.4 | GO:0044211 | CTP salvage(GO:0044211) |
| 0.0 | 0.2 | GO:2000346 | negative regulation of hepatocyte proliferation(GO:2000346) |
| 0.0 | 0.1 | GO:0006367 | transcription initiation from RNA polymerase II promoter(GO:0006367) |
| 0.0 | 0.5 | GO:1904321 | response to forskolin(GO:1904321) cellular response to forskolin(GO:1904322) |
| 0.0 | 0.8 | GO:0033962 | cytoplasmic mRNA processing body assembly(GO:0033962) |
| 0.0 | 2.3 | GO:0034260 | negative regulation of GTPase activity(GO:0034260) |
| 0.0 | 1.0 | GO:0032012 | regulation of ARF protein signal transduction(GO:0032012) |
| 0.0 | 0.2 | GO:2001171 | regulation of ATP biosynthetic process(GO:2001169) positive regulation of ATP biosynthetic process(GO:2001171) |
| 0.0 | 0.6 | GO:0030422 | production of siRNA involved in RNA interference(GO:0030422) |
| 0.0 | 0.3 | GO:0042073 | intraciliary transport(GO:0042073) |
| 0.0 | 0.9 | GO:0009081 | branched-chain amino acid metabolic process(GO:0009081) branched-chain amino acid catabolic process(GO:0009083) |
| 0.0 | 0.1 | GO:0009138 | pyrimidine nucleoside diphosphate metabolic process(GO:0009138) |
| 0.0 | 0.2 | GO:0051256 | mitotic spindle midzone assembly(GO:0051256) |
| 0.0 | 0.1 | GO:1904528 | regulation of microtubule plus-end binding(GO:1903031) positive regulation of microtubule plus-end binding(GO:1903033) positive regulation of microtubule binding(GO:1904528) |
| 0.0 | 0.2 | GO:0061083 | regulation of protein refolding(GO:0061083) negative regulation of protein refolding(GO:0061084) |
| 0.0 | 0.9 | GO:0071294 | cellular response to zinc ion(GO:0071294) |
| 0.0 | 1.6 | GO:0060976 | coronary vasculature development(GO:0060976) |
| 0.0 | 0.0 | GO:0021678 | third ventricle development(GO:0021678) |
| 0.0 | 0.3 | GO:0045840 | positive regulation of mitotic nuclear division(GO:0045840) |
| 0.0 | 0.1 | GO:0022616 | DNA strand elongation(GO:0022616) |
| 0.0 | 1.2 | GO:0033574 | response to testosterone(GO:0033574) |
| 0.0 | 0.2 | GO:0033512 | L-lysine catabolic process to acetyl-CoA via saccharopine(GO:0033512) |
| 0.0 | 0.2 | GO:0045880 | positive regulation of smoothened signaling pathway(GO:0045880) |
| 0.0 | 0.3 | GO:0046604 | positive regulation of mitotic centrosome separation(GO:0046604) |
| 0.0 | 0.4 | GO:0051315 | attachment of mitotic spindle microtubules to kinetochore(GO:0051315) |
| 0.0 | 0.3 | GO:0006105 | succinate metabolic process(GO:0006105) |
| 0.0 | 0.6 | GO:0045669 | positive regulation of osteoblast differentiation(GO:0045669) |
| 0.0 | 0.8 | GO:1901750 | leukotriene D4 metabolic process(GO:1901748) leukotriene D4 biosynthetic process(GO:1901750) |
| 0.0 | 0.2 | GO:0009440 | cyanate metabolic process(GO:0009439) cyanate catabolic process(GO:0009440) |
| 0.0 | 0.0 | GO:0014049 | positive regulation of glutamate secretion(GO:0014049) |
| 0.0 | 0.4 | GO:0006528 | asparagine metabolic process(GO:0006528) |
| 0.0 | 0.2 | GO:0006538 | glutamate catabolic process(GO:0006538) |
| 0.0 | 0.1 | GO:0002188 | translation reinitiation(GO:0002188) |
| 0.0 | 0.7 | GO:0035456 | response to interferon-beta(GO:0035456) |
| 0.0 | 0.0 | GO:0002589 | regulation of antigen processing and presentation of peptide antigen via MHC class I(GO:0002589) negative regulation of antigen processing and presentation of peptide antigen via MHC class I(GO:0002590) |
| 0.0 | 0.5 | GO:0036158 | outer dynein arm assembly(GO:0036158) |
| 0.0 | 0.1 | GO:0061002 | negative regulation of dendritic spine morphogenesis(GO:0061002) |
| 0.0 | 1.0 | GO:0035455 | response to interferon-alpha(GO:0035455) |
| 0.0 | 0.5 | GO:2000766 | negative regulation of cytoplasmic translation(GO:2000766) |
| 0.0 | 0.3 | GO:0031914 | negative regulation of synaptic plasticity(GO:0031914) |
| 0.0 | 0.3 | GO:0009249 | protein lipoylation(GO:0009249) |
| 0.0 | 0.1 | GO:0021569 | rhombomere 3 development(GO:0021569) rhombomere 5 development(GO:0021571) central nervous system segmentation(GO:0035283) brain segmentation(GO:0035284) |
| 0.0 | 0.6 | GO:2000300 | regulation of synaptic vesicle exocytosis(GO:2000300) |
| 0.0 | 0.5 | GO:0032516 | positive regulation of phosphoprotein phosphatase activity(GO:0032516) |
| 0.0 | 0.1 | GO:0061107 | seminal vesicle development(GO:0061107) |
| 0.0 | 0.4 | GO:0048050 | post-embryonic eye morphogenesis(GO:0048050) |
| 0.0 | 0.2 | GO:0097384 | ergosterol biosynthetic process(GO:0006696) ergosterol metabolic process(GO:0008204) cellular lipid biosynthetic process(GO:0097384) |
| 0.0 | 0.1 | GO:0016340 | calcium-dependent cell-matrix adhesion(GO:0016340) |
| 0.0 | 0.4 | GO:0032202 | telomere assembly(GO:0032202) |
| 0.0 | 0.2 | GO:2000312 | regulation of kainate selective glutamate receptor activity(GO:2000312) |
| 0.0 | 0.1 | GO:1904479 | negative regulation of intestinal absorption(GO:1904479) |
| 0.0 | 0.1 | GO:0051785 | positive regulation of nuclear division(GO:0051785) |
| 0.0 | 0.2 | GO:0038003 | opioid receptor signaling pathway(GO:0038003) |
| 0.0 | 0.2 | GO:2000323 | negative regulation of glucocorticoid receptor signaling pathway(GO:2000323) |
| 0.0 | 1.3 | GO:0045948 | positive regulation of translational initiation(GO:0045948) |
| 0.0 | 0.1 | GO:0006669 | sphinganine-1-phosphate biosynthetic process(GO:0006669) |
| 0.0 | 0.1 | GO:1903377 | negative regulation of oxidative stress-induced neuron intrinsic apoptotic signaling pathway(GO:1903377) |
| 0.0 | 0.2 | GO:0070989 | oxidative demethylation(GO:0070989) |
| 0.0 | 0.0 | GO:1905098 | negative regulation of guanyl-nucleotide exchange factor activity(GO:1905098) |
| 0.0 | 0.3 | GO:0048387 | negative regulation of retinoic acid receptor signaling pathway(GO:0048387) |
| 0.0 | 0.1 | GO:0035912 | dorsal aorta morphogenesis(GO:0035912) |
| 0.0 | 0.2 | GO:0010216 | maintenance of DNA methylation(GO:0010216) |
| 0.0 | 0.4 | GO:1904684 | negative regulation of metalloendopeptidase activity(GO:1904684) |
| 0.0 | 0.1 | GO:0002572 | pro-T cell differentiation(GO:0002572) |
| 0.0 | 0.2 | GO:0060180 | female mating behavior(GO:0060180) |
| 0.0 | 2.0 | GO:0033120 | positive regulation of RNA splicing(GO:0033120) |
| 0.0 | 0.9 | GO:0071450 | cellular response to oxygen radical(GO:0071450) cellular response to superoxide(GO:0071451) |
| 0.0 | 0.3 | GO:0001766 | membrane raft polarization(GO:0001766) membrane raft distribution(GO:0031580) |
| 0.0 | 0.1 | GO:0006122 | mitochondrial electron transport, ubiquinol to cytochrome c(GO:0006122) |
| 0.0 | 0.1 | GO:0060017 | parathyroid gland development(GO:0060017) |
| 0.0 | 0.2 | GO:1905049 | negative regulation of metallopeptidase activity(GO:1905049) |
| 0.0 | 0.1 | GO:1902951 | negative regulation of dendritic spine maintenance(GO:1902951) |
| 0.0 | 0.5 | GO:0006384 | transcription initiation from RNA polymerase III promoter(GO:0006384) |
| 0.0 | 0.1 | GO:0032480 | negative regulation of type I interferon production(GO:0032480) |
| 0.0 | 0.4 | GO:0032486 | Rap protein signal transduction(GO:0032486) |
| 0.0 | 0.0 | GO:0010644 | cell communication by electrical coupling(GO:0010644) |
| 0.0 | 0.9 | GO:0007220 | Notch receptor processing(GO:0007220) |
| 0.0 | 0.2 | GO:0046349 | amino sugar biosynthetic process(GO:0046349) |
| 0.0 | 0.5 | GO:0001782 | B cell homeostasis(GO:0001782) |
| 0.0 | 0.2 | GO:0006975 | DNA damage induced protein phosphorylation(GO:0006975) |
| 0.0 | 0.1 | GO:1900371 | regulation of nucleotide biosynthetic process(GO:0030808) regulation of cAMP biosynthetic process(GO:0030817) regulation of purine nucleotide biosynthetic process(GO:1900371) |
| 0.0 | 0.1 | GO:0003383 | apical constriction(GO:0003383) |
| 0.0 | 0.5 | GO:0035641 | locomotory exploration behavior(GO:0035641) |
| 0.0 | 0.1 | GO:0071550 | death-inducing signaling complex assembly(GO:0071550) |
| 0.0 | 0.1 | GO:1900227 | positive regulation of NLRP3 inflammasome complex assembly(GO:1900227) |
| 0.0 | 4.8 | GO:2000134 | negative regulation of G1/S transition of mitotic cell cycle(GO:2000134) |
| 0.0 | 0.1 | GO:0060715 | syncytiotrophoblast cell differentiation involved in labyrinthine layer development(GO:0060715) |
| 0.0 | 0.2 | GO:0001672 | regulation of chromatin assembly or disassembly(GO:0001672) |
| 0.0 | 0.2 | GO:0032429 | regulation of phospholipase A2 activity(GO:0032429) |
| 0.0 | 0.1 | GO:0007171 | activation of transmembrane receptor protein tyrosine kinase activity(GO:0007171) |
| 0.0 | 0.8 | GO:0007095 | mitotic G2 DNA damage checkpoint(GO:0007095) |
| 0.0 | 1.7 | GO:0045839 | negative regulation of mitotic nuclear division(GO:0045839) |
| 0.0 | 0.5 | GO:0055003 | cardiac myofibril assembly(GO:0055003) |
| 0.0 | 0.1 | GO:0080184 | response to phenylpropanoid(GO:0080184) |
| 0.0 | 0.1 | GO:0010360 | negative regulation of anion channel activity(GO:0010360) Golgi to plasma membrane CFTR protein transport(GO:0043000) |
| 0.0 | 0.0 | GO:2000078 | glandular epithelial cell maturation(GO:0002071) type B pancreatic cell maturation(GO:0072560) positive regulation of type B pancreatic cell development(GO:2000078) |
| 0.0 | 0.4 | GO:0045329 | carnitine biosynthetic process(GO:0045329) |
| 0.0 | 0.3 | GO:0061088 | regulation of sequestering of zinc ion(GO:0061088) |
| 0.0 | 0.4 | GO:0008608 | attachment of spindle microtubules to kinetochore(GO:0008608) |
| 0.0 | 0.1 | GO:0006449 | regulation of translational termination(GO:0006449) |
| 0.0 | 0.2 | GO:0015808 | L-alanine transport(GO:0015808) |
| 0.0 | 0.1 | GO:0061743 | motor learning(GO:0061743) |
| 0.0 | 0.1 | GO:2000467 | positive regulation of glycogen (starch) synthase activity(GO:2000467) |
| 0.0 | 0.0 | GO:0043173 | nucleotide salvage(GO:0043173) |
| 0.0 | 0.5 | GO:0010759 | positive regulation of macrophage chemotaxis(GO:0010759) |
| 0.0 | 0.1 | GO:0044571 | [2Fe-2S] cluster assembly(GO:0044571) |
| 0.0 | 0.2 | GO:0048312 | intracellular distribution of mitochondria(GO:0048312) |
| 0.0 | 0.1 | GO:0051490 | negative regulation of filopodium assembly(GO:0051490) |
| 0.0 | 0.5 | GO:0045665 | negative regulation of neuron differentiation(GO:0045665) |
| 0.0 | 5.9 | GO:0002223 | innate immune response activating cell surface receptor signaling pathway(GO:0002220) stimulatory C-type lectin receptor signaling pathway(GO:0002223) |
| 0.0 | 0.1 | GO:0003014 | renal system process(GO:0003014) |
| 0.0 | 0.4 | GO:0007253 | cytoplasmic sequestering of NF-kappaB(GO:0007253) |
| 0.0 | 0.9 | GO:1901685 | glutathione derivative metabolic process(GO:1901685) glutathione derivative biosynthetic process(GO:1901687) |
| 0.0 | 0.5 | GO:0043568 | positive regulation of insulin-like growth factor receptor signaling pathway(GO:0043568) |
| 0.0 | 0.2 | GO:1903232 | melanosome assembly(GO:1903232) |
| 0.0 | 0.7 | GO:0060325 | face morphogenesis(GO:0060325) |
| 0.0 | 0.1 | GO:0006121 | mitochondrial electron transport, succinate to ubiquinone(GO:0006121) |
| 0.0 | 0.0 | GO:1903595 | positive regulation of histamine secretion by mast cell(GO:1903595) |
| 0.0 | 1.4 | GO:0043966 | histone H3 acetylation(GO:0043966) |
| 0.0 | 0.2 | GO:0061512 | protein localization to cilium(GO:0061512) |
| 0.0 | 0.6 | GO:1990118 | sodium ion import across plasma membrane(GO:0098719) sodium ion import into cell(GO:1990118) |
| 0.0 | 0.1 | GO:0006578 | amino-acid betaine biosynthetic process(GO:0006578) glycine betaine biosynthetic process from choline(GO:0019285) glycine betaine metabolic process(GO:0031455) glycine betaine biosynthetic process(GO:0031456) |
| 0.0 | 1.2 | GO:0070884 | regulation of calcineurin-NFAT signaling cascade(GO:0070884) |
| 0.0 | 0.1 | GO:2000342 | negative regulation of chemokine (C-X-C motif) ligand 2 production(GO:2000342) |
| 0.0 | 0.1 | GO:0032364 | oxygen homeostasis(GO:0032364) |
| 0.0 | 0.4 | GO:0030388 | fructose 1,6-bisphosphate metabolic process(GO:0030388) |
| 0.0 | 0.1 | GO:1990086 | lens fiber cell apoptotic process(GO:1990086) |
| 0.0 | 0.8 | GO:0007093 | mitotic cell cycle checkpoint(GO:0007093) |
| 0.0 | 0.5 | GO:0034643 | establishment of mitochondrion localization, microtubule-mediated(GO:0034643) mitochondrion transport along microtubule(GO:0047497) |
| 0.0 | 0.4 | GO:0016973 | poly(A)+ mRNA export from nucleus(GO:0016973) |
| 0.0 | 0.2 | GO:0071461 | cellular response to redox state(GO:0071461) |
| 0.0 | 0.3 | GO:0001778 | plasma membrane repair(GO:0001778) |
| 0.0 | 1.1 | GO:0006735 | NADH regeneration(GO:0006735) glycolytic process through fructose-6-phosphate(GO:0061615) glycolytic process through glucose-6-phosphate(GO:0061620) canonical glycolysis(GO:0061621) glucose catabolic process to pyruvate(GO:0061718) |
| 0.0 | 0.1 | GO:0009443 | pyridoxal 5'-phosphate salvage(GO:0009443) |
| 0.0 | 0.9 | GO:0036151 | phosphatidylcholine acyl-chain remodeling(GO:0036151) |
| 0.0 | 0.1 | GO:0045347 | negative regulation of MHC class II biosynthetic process(GO:0045347) |
| 0.0 | 0.1 | GO:0006406 | mRNA export from nucleus(GO:0006406) mRNA-containing ribonucleoprotein complex export from nucleus(GO:0071427) |
| 0.0 | 0.3 | GO:0048096 | chromatin-mediated maintenance of transcription(GO:0048096) |
| 0.0 | 0.1 | GO:0043686 | co-translational protein modification(GO:0043686) |
| 0.0 | 0.3 | GO:0060080 | inhibitory postsynaptic potential(GO:0060080) |
| 0.0 | 0.2 | GO:0035799 | ureter maturation(GO:0035799) |
| 0.0 | 0.1 | GO:0046174 | polyol catabolic process(GO:0046174) |
| 0.0 | 0.3 | GO:0052803 | histidine metabolic process(GO:0006547) imidazole-containing compound metabolic process(GO:0052803) |
| 0.0 | 0.4 | GO:1901071 | glucosamine-containing compound metabolic process(GO:1901071) |
| 0.0 | 1.5 | GO:0000186 | activation of MAPKK activity(GO:0000186) |
| 0.0 | 0.1 | GO:0072710 | response to hydroxyurea(GO:0072710) cellular response to hydroxyurea(GO:0072711) cellular response to camptothecin(GO:0072757) response to camptothecin(GO:1901563) |
| 0.0 | 0.5 | GO:0051220 | cytoplasmic sequestering of protein(GO:0051220) |
| 0.0 | 0.1 | GO:0001975 | response to amphetamine(GO:0001975) |
| 0.0 | 0.6 | GO:0006123 | mitochondrial electron transport, cytochrome c to oxygen(GO:0006123) |
| 0.0 | 0.1 | GO:0032780 | negative regulation of ATPase activity(GO:0032780) |
| 0.0 | 0.7 | GO:0019934 | cGMP-mediated signaling(GO:0019934) |
| 0.0 | 0.4 | GO:0010739 | positive regulation of protein kinase A signaling(GO:0010739) |
| 0.0 | 0.2 | GO:0048733 | sebaceous gland development(GO:0048733) |
| 0.0 | 0.1 | GO:0060124 | positive regulation of growth hormone secretion(GO:0060124) |
| 0.0 | 0.2 | GO:0019348 | dolichol metabolic process(GO:0019348) |
| 0.0 | 0.2 | GO:0014894 | response to muscle inactivity(GO:0014870) response to muscle inactivity involved in regulation of muscle adaptation(GO:0014877) response to denervation involved in regulation of muscle adaptation(GO:0014894) |
| 0.0 | 0.2 | GO:0035726 | common myeloid progenitor cell proliferation(GO:0035726) |
| 0.0 | 0.3 | GO:0086024 | adrenergic receptor signaling pathway involved in positive regulation of heart rate(GO:0086024) |
| 0.0 | 0.3 | GO:0035791 | platelet-derived growth factor receptor-beta signaling pathway(GO:0035791) |
| 0.0 | 0.3 | GO:0030050 | vesicle transport along actin filament(GO:0030050) actin filament-based transport(GO:0099515) |
| 0.0 | 0.6 | GO:0015991 | ATP hydrolysis coupled proton transport(GO:0015991) |
| 0.0 | 0.5 | GO:0016024 | CDP-diacylglycerol biosynthetic process(GO:0016024) |
| 0.0 | 0.6 | GO:0034587 | piRNA metabolic process(GO:0034587) |
| 0.0 | 0.1 | GO:0043248 | proteasome assembly(GO:0043248) |
| 0.0 | 1.4 | GO:0031640 | killing of cells of other organism(GO:0031640) disruption of cells of other organism(GO:0044364) |
| 0.0 | 0.1 | GO:0051970 | negative regulation of transmission of nerve impulse(GO:0051970) |
| 0.0 | 0.3 | GO:0000305 | response to oxygen radical(GO:0000305) |
| 0.0 | 0.2 | GO:0010626 | regulation of Schwann cell proliferation(GO:0010624) negative regulation of Schwann cell proliferation(GO:0010626) |
| 0.0 | 0.3 | GO:0006398 | mRNA 3'-end processing by stem-loop binding and cleavage(GO:0006398) |
| 0.0 | 0.2 | GO:0050955 | thermoception(GO:0050955) detection of chemical stimulus involved in sensory perception of pain(GO:0050968) |
| 0.0 | 0.1 | GO:0051901 | positive regulation of mitochondrial depolarization(GO:0051901) |
| 0.0 | 0.1 | GO:0060263 | regulation of respiratory burst(GO:0060263) |
| 0.0 | 0.4 | GO:0021534 | cell proliferation in hindbrain(GO:0021534) cell proliferation in external granule layer(GO:0021924) cerebellar granule cell precursor proliferation(GO:0021930) |
| 0.0 | 0.1 | GO:1990022 | RNA polymerase II complex import to nucleus(GO:0044376) RNA polymerase III complex localization to nucleus(GO:1990022) |
| 0.0 | 0.0 | GO:0052055 | modulation of molecular function in other organism(GO:0044359) negative regulation of molecular function in other organism(GO:0044362) modulation by symbiont of host molecular function(GO:0052055) modulation of catalytic activity in other organism involved in symbiotic interaction(GO:0052203) negative regulation of molecular function in other organism involved in symbiotic interaction(GO:0052204) modulation of molecular function in other organism involved in symbiotic interaction(GO:0052205) modulation by host of symbiont catalytic activity(GO:0052422) modification by host of symbiont molecular function(GO:0052428) |
| 0.0 | 0.1 | GO:0060070 | canonical Wnt signaling pathway(GO:0060070) |
| 0.0 | 0.1 | GO:0033080 | immature T cell proliferation in thymus(GO:0033080) regulation of immature T cell proliferation in thymus(GO:0033084) negative regulation of immature T cell proliferation(GO:0033087) negative regulation of immature T cell proliferation in thymus(GO:0033088) |
| 0.0 | 0.0 | GO:0045715 | negative regulation of low-density lipoprotein particle receptor biosynthetic process(GO:0045715) |
| 0.0 | 0.0 | GO:0002314 | germinal center B cell differentiation(GO:0002314) |
| 0.0 | 0.3 | GO:0046049 | UMP biosynthetic process(GO:0006222) pyrimidine ribonucleoside monophosphate metabolic process(GO:0009173) pyrimidine ribonucleoside monophosphate biosynthetic process(GO:0009174) UMP metabolic process(GO:0046049) |
| 0.0 | 0.2 | GO:0044387 | negative regulation of protein kinase activity by regulation of protein phosphorylation(GO:0044387) |
| 0.0 | 0.1 | GO:1903567 | negative regulation of protein localization to cilium(GO:1903565) regulation of protein localization to ciliary membrane(GO:1903567) negative regulation of protein localization to ciliary membrane(GO:1903568) |
| 0.0 | 0.8 | GO:0006646 | phosphatidylethanolamine biosynthetic process(GO:0006646) |
| 0.0 | 0.2 | GO:2000637 | positive regulation of gene silencing by miRNA(GO:2000637) |
| 0.0 | 0.1 | GO:0045200 | establishment or maintenance of neuroblast polarity(GO:0045196) establishment of neuroblast polarity(GO:0045200) |
| 0.0 | 0.2 | GO:0097354 | protein prenylation(GO:0018342) prenylation(GO:0097354) |
| 0.0 | 0.1 | GO:0071364 | cellular response to epidermal growth factor stimulus(GO:0071364) |
| 0.0 | 0.4 | GO:0048168 | regulation of neuronal synaptic plasticity(GO:0048168) |
| 0.0 | 0.1 | GO:0006739 | NADP metabolic process(GO:0006739) |
| 0.0 | 0.2 | GO:1903223 | positive regulation of oxidative stress-induced neuron death(GO:1903223) positive regulation of oxidative stress-induced neuron intrinsic apoptotic signaling pathway(GO:1903378) |
| 0.0 | 0.1 | GO:0006734 | NADH metabolic process(GO:0006734) |
| 0.0 | 0.2 | GO:0051770 | positive regulation of nitric-oxide synthase biosynthetic process(GO:0051770) |
| 0.0 | 0.2 | GO:0097484 | dendrite extension(GO:0097484) regulation of dendrite extension(GO:1903859) positive regulation of dendrite extension(GO:1903861) |
| 0.0 | 0.1 | GO:0000730 | DNA recombinase assembly(GO:0000730) double-strand break repair via synthesis-dependent strand annealing(GO:0045003) |
| 0.0 | 0.3 | GO:0023019 | signal transduction involved in regulation of gene expression(GO:0023019) |
| 0.0 | 0.4 | GO:0043562 | cellular response to nitrogen starvation(GO:0006995) cellular response to nitrogen levels(GO:0043562) |
| 0.0 | 0.2 | GO:0032988 | ribonucleoprotein complex disassembly(GO:0032988) |
| 0.0 | 0.1 | GO:1902715 | positive regulation of interferon-gamma secretion(GO:1902715) |
| 0.0 | 0.1 | GO:0072257 | metanephric nephron tubule epithelial cell differentiation(GO:0072257) regulation of metanephric nephron tubule epithelial cell differentiation(GO:0072307) |
| 0.0 | 0.3 | GO:0006824 | cobalt ion transport(GO:0006824) |
| 0.0 | 0.7 | GO:0008542 | visual learning(GO:0008542) |
| 0.0 | 0.0 | GO:0010868 | negative regulation of triglyceride biosynthetic process(GO:0010868) |
| 0.0 | 0.0 | GO:0006561 | proline biosynthetic process(GO:0006561) |
| 0.0 | 0.1 | GO:0006893 | Golgi to plasma membrane transport(GO:0006893) |
| 0.0 | 0.2 | GO:0032510 | endosome to lysosome transport via multivesicular body sorting pathway(GO:0032510) |
| 0.0 | 0.2 | GO:0044789 | modulation by host of viral release from host cell(GO:0044789) positive regulation by host of viral release from host cell(GO:0044791) |
| 0.0 | 0.1 | GO:1904707 | positive regulation of vascular smooth muscle cell proliferation(GO:1904707) |
| 0.0 | 0.1 | GO:0019605 | benzoate metabolic process(GO:0018874) butyrate metabolic process(GO:0019605) |
| 0.0 | 0.9 | GO:0050690 | regulation of defense response to virus by virus(GO:0050690) |
| 0.0 | 0.1 | GO:0014916 | regulation of lung blood pressure(GO:0014916) evasion or tolerance of host defenses by virus(GO:0019049) avoidance of host defenses(GO:0044413) evasion or tolerance of host defenses(GO:0044415) avoidance of defenses of other organism involved in symbiotic interaction(GO:0051832) evasion or tolerance of defenses of other organism involved in symbiotic interaction(GO:0051834) negative regulation of lung blood pressure(GO:0061767) |
| 0.0 | 0.1 | GO:0070987 | error-free translesion synthesis(GO:0070987) |
| 0.0 | 0.1 | GO:0048642 | negative regulation of skeletal muscle tissue development(GO:0048642) |
| 0.0 | 1.0 | GO:0019933 | cAMP-mediated signaling(GO:0019933) |
| 0.0 | 0.2 | GO:0003351 | epithelial cilium movement(GO:0003351) |
| 0.0 | 0.3 | GO:0043407 | negative regulation of MAP kinase activity(GO:0043407) |
| 0.0 | 0.2 | GO:0036438 | maintenance of lens transparency(GO:0036438) |
| 0.0 | 0.1 | GO:0006107 | oxaloacetate metabolic process(GO:0006107) |
| 0.0 | 0.1 | GO:0006987 | activation of signaling protein activity involved in unfolded protein response(GO:0006987) |
| 0.0 | 0.1 | GO:0010936 | negative regulation of macrophage cytokine production(GO:0010936) |
| 0.0 | 0.1 | GO:0001971 | negative regulation of activation of membrane attack complex(GO:0001971) |
| 0.0 | 0.0 | GO:0061061 | muscle structure development(GO:0061061) |
| 0.0 | 0.2 | GO:0044849 | estrous cycle(GO:0044849) |
| 0.0 | 0.2 | GO:0010133 | proline catabolic process to glutamate(GO:0010133) |
| 0.0 | 0.0 | GO:2000426 | negative regulation of apoptotic cell clearance(GO:2000426) |
| 0.0 | 0.2 | GO:0014041 | regulation of neuron maturation(GO:0014041) |
| 0.0 | 0.1 | GO:0002101 | tRNA wobble cytosine modification(GO:0002101) |
| 0.0 | 0.1 | GO:0045575 | basophil activation involved in immune response(GO:0002276) basophil activation(GO:0045575) |
| 0.0 | 0.1 | GO:1901674 | histone H3-K27 acetylation(GO:0043974) response to methylglyoxal(GO:0051595) regulation of histone H3-K27 acetylation(GO:1901674) negative regulation of histone H3-K27 acetylation(GO:1901675) |
| 0.0 | 0.1 | GO:0034454 | microtubule anchoring at centrosome(GO:0034454) |
| 0.0 | 0.1 | GO:0046379 | extracellular polysaccharide biosynthetic process(GO:0045226) extracellular polysaccharide metabolic process(GO:0046379) |
| 0.0 | 0.1 | GO:0000270 | peptidoglycan metabolic process(GO:0000270) peptidoglycan catabolic process(GO:0009253) |
| 0.0 | 0.2 | GO:0060158 | phospholipase C-activating dopamine receptor signaling pathway(GO:0060158) |
| 0.0 | 0.1 | GO:0014827 | intestine smooth muscle contraction(GO:0014827) |
| 0.0 | 2.1 | GO:1903214 | regulation of protein targeting to mitochondrion(GO:1903214) |
| 0.0 | 0.2 | GO:1903874 | ferrous iron transport(GO:0015684) ferrous iron transmembrane transport(GO:1903874) |
| 0.0 | 0.2 | GO:0008589 | regulation of smoothened signaling pathway(GO:0008589) |
| 0.0 | 0.5 | GO:0045879 | negative regulation of smoothened signaling pathway(GO:0045879) |
| 0.0 | 0.8 | GO:0006891 | intra-Golgi vesicle-mediated transport(GO:0006891) |
| 0.0 | 0.1 | GO:0030856 | regulation of epithelial cell differentiation(GO:0030856) |
| 0.0 | 0.2 | GO:0045786 | negative regulation of cell cycle(GO:0045786) |
| 0.0 | 0.4 | GO:0042276 | error-prone translesion synthesis(GO:0042276) |
| 0.0 | 1.4 | GO:0007050 | cell cycle arrest(GO:0007050) |
| 0.0 | 1.4 | GO:0001578 | microtubule bundle formation(GO:0001578) |
| 0.0 | 0.0 | GO:0006167 | AMP biosynthetic process(GO:0006167) |
| 0.0 | 0.0 | GO:0032493 | response to bacterial lipoprotein(GO:0032493) |
| 0.0 | 0.1 | GO:0019935 | cyclic-nucleotide-mediated signaling(GO:0019935) |
| 0.0 | 0.3 | GO:1904893 | negative regulation of JAK-STAT cascade(GO:0046426) negative regulation of STAT cascade(GO:1904893) |
| 0.0 | 0.1 | GO:0070562 | regulation of vitamin D receptor signaling pathway(GO:0070562) |
| 0.0 | 0.1 | GO:0008625 | extrinsic apoptotic signaling pathway via death domain receptors(GO:0008625) |
| 0.0 | 0.2 | GO:0017121 | phospholipid scrambling(GO:0017121) |
| 0.0 | 0.1 | GO:0097029 | mature conventional dendritic cell differentiation(GO:0097029) |
| 0.0 | 0.1 | GO:0060294 | cilium movement involved in cell motility(GO:0060294) |
| 0.0 | 0.2 | GO:1904262 | negative regulation of TORC1 signaling(GO:1904262) |
| 0.0 | 0.4 | GO:0006221 | pyrimidine nucleotide biosynthetic process(GO:0006221) |
| 0.0 | 0.6 | GO:0050427 | purine ribonucleoside bisphosphate metabolic process(GO:0034035) 3'-phosphoadenosine 5'-phosphosulfate metabolic process(GO:0050427) |
| 0.0 | 0.6 | GO:0071377 | cellular response to glucagon stimulus(GO:0071377) |
| 0.0 | 0.1 | GO:0060012 | synaptic transmission, glycinergic(GO:0060012) |
| 0.0 | 0.3 | GO:0007188 | adenylate cyclase-modulating G-protein coupled receptor signaling pathway(GO:0007188) |
| 0.0 | 0.5 | GO:0007179 | transforming growth factor beta receptor signaling pathway(GO:0007179) |
| 0.0 | 0.4 | GO:0048713 | regulation of oligodendrocyte differentiation(GO:0048713) |
| 0.0 | 0.0 | GO:0010751 | negative regulation of nitric oxide mediated signal transduction(GO:0010751) |
| 0.0 | 0.1 | GO:0003229 | ventricular cardiac muscle tissue development(GO:0003229) |
| 0.0 | 0.6 | GO:0051491 | positive regulation of filopodium assembly(GO:0051491) |
| 0.0 | 0.1 | GO:0018364 | peptidyl-glutamine methylation(GO:0018364) |
| 0.0 | 0.2 | GO:0033227 | dsRNA transport(GO:0033227) |
| 0.0 | 0.3 | GO:0007175 | negative regulation of epidermal growth factor-activated receptor activity(GO:0007175) |
| 0.0 | 0.1 | GO:0060849 | radial pattern formation(GO:0009956) regulation of transcription involved in lymphatic endothelial cell fate commitment(GO:0060849) |
| 0.0 | 0.8 | GO:0072332 | intrinsic apoptotic signaling pathway by p53 class mediator(GO:0072332) |
| 0.0 | 0.1 | GO:0072014 | proximal tubule development(GO:0072014) |
| 0.0 | 0.0 | GO:0036166 | phenotypic switching(GO:0036166) regulation of phenotypic switching(GO:1900239) |
| 0.0 | 0.0 | GO:0016999 | antibiotic metabolic process(GO:0016999) |
| 0.0 | 0.3 | GO:0009068 | aspartate family amino acid catabolic process(GO:0009068) |
| 0.0 | 0.1 | GO:0031017 | exocrine pancreas development(GO:0031017) |
| 0.0 | 0.8 | GO:0009060 | aerobic respiration(GO:0009060) |
| 0.0 | 0.1 | GO:0071468 | cellular response to acidic pH(GO:0071468) |
| 0.0 | 0.2 | GO:0035065 | regulation of histone acetylation(GO:0035065) regulation of peptidyl-lysine acetylation(GO:2000756) |
| 0.0 | 0.0 | GO:0036090 | cleavage furrow ingression(GO:0036090) |
| 0.0 | 0.0 | GO:0002018 | renin-angiotensin regulation of aldosterone production(GO:0002018) response to cGMP(GO:0070305) |
| 0.0 | 0.9 | GO:1901222 | regulation of NIK/NF-kappaB signaling(GO:1901222) |
| 0.0 | 0.0 | GO:0006678 | glucosylceramide metabolic process(GO:0006678) |
| 0.0 | 0.0 | GO:1902410 | mitotic cytokinetic process(GO:1902410) |
| 0.0 | 0.0 | GO:0002155 | regulation of thyroid hormone mediated signaling pathway(GO:0002155) |
| 0.0 | 0.1 | GO:0072386 | plus-end-directed vesicle transport along microtubule(GO:0072383) plus-end-directed organelle transport along microtubule(GO:0072386) |
| 0.0 | 0.1 | GO:0015853 | adenine transport(GO:0015853) |
| 0.0 | 0.2 | GO:0001945 | lymph vessel development(GO:0001945) |
| 0.0 | 0.1 | GO:0001777 | T cell homeostatic proliferation(GO:0001777) |
| 0.0 | 0.0 | GO:0061364 | apoptotic process involved in luteolysis(GO:0061364) |
| 0.0 | 0.2 | GO:0042135 | neurotransmitter catabolic process(GO:0042135) |
| 0.0 | 0.2 | GO:0070534 | protein K63-linked ubiquitination(GO:0070534) |
| 0.0 | 0.1 | GO:2001270 | regulation of cysteine-type endopeptidase activity involved in execution phase of apoptosis(GO:2001270) negative regulation of cysteine-type endopeptidase activity involved in execution phase of apoptosis(GO:2001271) |
| 0.0 | 0.1 | GO:0070528 | protein kinase C signaling(GO:0070528) |
| 0.0 | 0.0 | GO:0021650 | vestibulocochlear nerve formation(GO:0021650) |
| 0.0 | 0.2 | GO:2000675 | negative regulation of type B pancreatic cell apoptotic process(GO:2000675) |
| 0.0 | 1.8 | GO:0006369 | termination of RNA polymerase II transcription(GO:0006369) |
| 0.0 | 0.1 | GO:0010918 | positive regulation of mitochondrial membrane potential(GO:0010918) |
| 0.0 | 0.1 | GO:1904098 | regulation of protein O-linked glycosylation(GO:1904098) positive regulation of protein O-linked glycosylation(GO:1904100) |
| 0.0 | 0.2 | GO:0071502 | cellular response to temperature stimulus(GO:0071502) |
| 0.0 | 0.1 | GO:0045651 | positive regulation of macrophage differentiation(GO:0045651) |
| 0.0 | 0.3 | GO:0050982 | detection of mechanical stimulus(GO:0050982) |
| 0.0 | 0.0 | GO:0042822 | pyridoxal phosphate metabolic process(GO:0042822) |
| 0.0 | 0.1 | GO:1902746 | regulation of lens fiber cell differentiation(GO:1902746) |
| 0.0 | 0.1 | GO:0010889 | regulation of sequestering of triglyceride(GO:0010889) sequestering of triglyceride(GO:0030730) |
| 0.0 | 0.0 | GO:0072007 | mesangial cell differentiation(GO:0072007) glomerular mesangial cell differentiation(GO:0072008) kidney interstitial fibroblast differentiation(GO:0072071) renal interstitial fibroblast development(GO:0072141) mesangial cell development(GO:0072143) glomerular mesangial cell development(GO:0072144) |
| 0.0 | 0.4 | GO:2000369 | regulation of clathrin-mediated endocytosis(GO:2000369) |
| 0.0 | 0.0 | GO:1902037 | negative regulation of hematopoietic stem cell differentiation(GO:1902037) |
| 0.0 | 0.6 | GO:0043968 | histone H2A acetylation(GO:0043968) |
| 0.0 | 0.1 | GO:0009093 | cysteine catabolic process(GO:0009093) L-cysteine catabolic process(GO:0019448) L-cysteine metabolic process(GO:0046439) |
| 0.0 | 0.1 | GO:2000676 | positive regulation of type B pancreatic cell apoptotic process(GO:2000676) |
| 0.0 | 0.1 | GO:0008090 | retrograde axonal transport(GO:0008090) |
| 0.0 | 0.0 | GO:0045091 | regulation of single stranded viral RNA replication via double stranded DNA intermediate(GO:0045091) |
| 0.0 | 0.0 | GO:0007181 | transforming growth factor beta receptor complex assembly(GO:0007181) |
| 0.0 | 1.1 | GO:0001895 | retina homeostasis(GO:0001895) |
| 0.0 | 0.0 | GO:0007161 | calcium-independent cell-matrix adhesion(GO:0007161) |
| 0.0 | 0.1 | GO:0034162 | toll-like receptor 9 signaling pathway(GO:0034162) |
| 0.0 | 0.2 | GO:0008635 | activation of cysteine-type endopeptidase activity involved in apoptotic process by cytochrome c(GO:0008635) |
| 0.0 | 0.9 | GO:0033275 | muscle filament sliding(GO:0030049) actin-myosin filament sliding(GO:0033275) |
| 0.0 | 0.5 | GO:0008045 | motor neuron axon guidance(GO:0008045) |
| 0.0 | 0.1 | GO:1902630 | regulation of membrane hyperpolarization(GO:1902630) |
| 0.0 | 0.0 | GO:0008355 | olfactory learning(GO:0008355) |
| 0.0 | 0.4 | GO:0043154 | negative regulation of cysteine-type endopeptidase activity involved in apoptotic process(GO:0043154) |
| 0.0 | 0.1 | GO:0035873 | lactate transport(GO:0015727) lactate transmembrane transport(GO:0035873) |
| 0.0 | 0.3 | GO:0006359 | regulation of transcription from RNA polymerase III promoter(GO:0006359) |
| 0.0 | 0.2 | GO:0007168 | receptor guanylyl cyclase signaling pathway(GO:0007168) |
| 0.0 | 0.1 | GO:0046952 | ketone body catabolic process(GO:0046952) |
| 0.0 | 0.2 | GO:0006654 | phosphatidic acid biosynthetic process(GO:0006654) |
| 0.0 | 0.4 | GO:0006376 | mRNA splice site selection(GO:0006376) |
| 0.0 | 0.2 | GO:0006068 | ethanol catabolic process(GO:0006068) |
| 0.0 | 0.1 | GO:0006436 | tryptophanyl-tRNA aminoacylation(GO:0006436) |
| 0.0 | 0.4 | GO:2001222 | regulation of neuron migration(GO:2001222) |
| 0.0 | 0.4 | GO:0050821 | protein stabilization(GO:0050821) |
| 0.0 | 0.1 | GO:0000733 | DNA strand renaturation(GO:0000733) |
| 0.0 | 0.3 | GO:0046710 | GDP metabolic process(GO:0046710) |
| 0.0 | 0.1 | GO:0043985 | histone H4-R3 methylation(GO:0043985) |
| 0.0 | 0.0 | GO:0006565 | L-serine catabolic process(GO:0006565) |
| 0.0 | 0.2 | GO:0048304 | positive regulation of isotype switching to IgG isotypes(GO:0048304) |
| 0.0 | 0.1 | GO:0048311 | mitochondrion distribution(GO:0048311) |
| 0.0 | 0.0 | GO:0046294 | formaldehyde catabolic process(GO:0046294) |
| 0.0 | 0.0 | GO:0060920 | cardiac pacemaker cell differentiation(GO:0060920) cardiac pacemaker cell development(GO:0060926) |
| 0.0 | 0.4 | GO:0034389 | lipid particle organization(GO:0034389) |
| 0.0 | 0.1 | GO:0097068 | response to thyroxine(GO:0097068) response to L-phenylalanine derivative(GO:1904386) |
| 0.0 | 0.1 | GO:0031987 | locomotion involved in locomotory behavior(GO:0031987) |
| 0.0 | 0.1 | GO:0048286 | lung alveolus development(GO:0048286) |
| 0.0 | 0.0 | GO:0046598 | positive regulation of viral entry into host cell(GO:0046598) |
| 0.0 | 0.1 | GO:0060338 | regulation of type I interferon-mediated signaling pathway(GO:0060338) |
| 0.0 | 0.1 | GO:0070221 | sulfide oxidation(GO:0019418) sulfide oxidation, using sulfide:quinone oxidoreductase(GO:0070221) |
| 0.0 | 0.1 | GO:0043126 | regulation of 1-phosphatidylinositol 4-kinase activity(GO:0043126) positive regulation of 1-phosphatidylinositol 4-kinase activity(GO:0043128) |
| 0.0 | 0.4 | GO:0006937 | regulation of muscle contraction(GO:0006937) |
| 0.0 | 0.1 | GO:0055059 | asymmetric neuroblast division(GO:0055059) |
| 0.0 | 0.7 | GO:0038128 | ERBB2 signaling pathway(GO:0038128) |
| 0.0 | 0.1 | GO:0009312 | oligosaccharide biosynthetic process(GO:0009312) |
| 0.0 | 0.3 | GO:0048268 | clathrin coat assembly(GO:0048268) |
| 0.0 | 0.6 | GO:0046461 | neutral lipid catabolic process(GO:0046461) acylglycerol catabolic process(GO:0046464) |
| 0.0 | 0.2 | GO:0031643 | positive regulation of myelination(GO:0031643) |
| 0.0 | 0.1 | GO:0030539 | male genitalia development(GO:0030539) |
| 0.0 | 0.1 | GO:0019509 | L-methionine biosynthetic process from methylthioadenosine(GO:0019509) |
| 0.0 | 0.3 | GO:0014003 | oligodendrocyte development(GO:0014003) |
| 0.0 | 0.1 | GO:0051450 | myoblast proliferation(GO:0051450) |
| 0.0 | 0.1 | GO:0051549 | positive regulation of keratinocyte migration(GO:0051549) |
| 0.0 | 0.3 | GO:0042737 | drug catabolic process(GO:0042737) |
| 0.0 | 0.4 | GO:0045830 | positive regulation of isotype switching(GO:0045830) positive regulation of DNA recombination(GO:0045911) |
| 0.0 | 0.2 | GO:0006026 | aminoglycan catabolic process(GO:0006026) glycosaminoglycan catabolic process(GO:0006027) |
| 0.0 | 0.1 | GO:0051354 | negative regulation of oxidoreductase activity(GO:0051354) |
| 0.0 | 0.2 | GO:0030450 | regulation of complement activation, classical pathway(GO:0030450) negative regulation of complement activation, classical pathway(GO:0045959) |
| 0.0 | 0.7 | GO:0006749 | glutathione metabolic process(GO:0006749) |
| 0.0 | 0.0 | GO:0015811 | L-cystine transport(GO:0015811) |
| 0.0 | 0.1 | GO:0042426 | choline catabolic process(GO:0042426) |
| 0.0 | 0.1 | GO:0030043 | actin filament fragmentation(GO:0030043) |
| 0.0 | 0.0 | GO:0043137 | DNA replication, Okazaki fragment processing(GO:0033567) DNA replication, removal of RNA primer(GO:0043137) |
| 0.0 | 0.1 | GO:0045654 | positive regulation of megakaryocyte differentiation(GO:0045654) |
| 0.0 | 0.1 | GO:0046597 | negative regulation of viral entry into host cell(GO:0046597) |
| 0.0 | 0.2 | GO:0006559 | L-phenylalanine metabolic process(GO:0006558) L-phenylalanine catabolic process(GO:0006559) erythrose 4-phosphate/phosphoenolpyruvate family amino acid metabolic process(GO:1902221) erythrose 4-phosphate/phosphoenolpyruvate family amino acid catabolic process(GO:1902222) |
| 0.0 | 0.2 | GO:0070050 | neuron cellular homeostasis(GO:0070050) |
| 0.0 | 0.6 | GO:0042531 | positive regulation of tyrosine phosphorylation of STAT protein(GO:0042531) |
| 0.0 | 0.6 | GO:0090090 | negative regulation of canonical Wnt signaling pathway(GO:0090090) |
| 0.0 | 0.0 | GO:0021535 | cell migration in hindbrain(GO:0021535) |
| 0.0 | 0.4 | GO:0072661 | protein targeting to plasma membrane(GO:0072661) |
| 0.0 | 0.0 | GO:0090230 | regulation of centromere complex assembly(GO:0090230) |
| 0.0 | 0.1 | GO:0021812 | neuronal-glial interaction involved in cerebral cortex radial glia guided migration(GO:0021812) |
| 0.0 | 0.3 | GO:0070536 | protein K63-linked deubiquitination(GO:0070536) |
| 0.0 | 0.2 | GO:0030318 | melanocyte differentiation(GO:0030318) |
| 0.0 | 0.1 | GO:0045599 | negative regulation of fat cell differentiation(GO:0045599) |
| 0.0 | 0.6 | GO:0034508 | centromere complex assembly(GO:0034508) |
| 0.0 | 0.1 | GO:0043392 | negative regulation of DNA binding(GO:0043392) |
| 0.0 | 0.0 | GO:1904781 | positive regulation of protein localization to centrosome(GO:1904781) |
| 0.0 | 0.1 | GO:0036150 | phosphatidylserine acyl-chain remodeling(GO:0036150) |
| 0.0 | 0.1 | GO:0072502 | cellular phosphate ion homeostasis(GO:0030643) cellular divalent inorganic anion homeostasis(GO:0072501) cellular trivalent inorganic anion homeostasis(GO:0072502) |
| 0.0 | 0.0 | GO:0060335 | positive regulation of response to interferon-gamma(GO:0060332) positive regulation of interferon-gamma-mediated signaling pathway(GO:0060335) |
| 0.0 | 0.0 | GO:0048069 | eye pigmentation(GO:0048069) |
| 0.0 | 0.2 | GO:0042118 | endothelial cell activation(GO:0042118) |
| 0.0 | 0.2 | GO:0045162 | clustering of voltage-gated sodium channels(GO:0045162) |
| 0.0 | 0.1 | GO:0030100 | regulation of endocytosis(GO:0030100) |
| 0.0 | 0.2 | GO:1901655 | cellular response to ketone(GO:1901655) |
| 0.0 | 0.1 | GO:0010818 | T cell chemotaxis(GO:0010818) |
| 0.0 | 0.9 | GO:0009062 | fatty acid catabolic process(GO:0009062) |
| 0.0 | 0.1 | GO:0045650 | regulation of macrophage differentiation(GO:0045649) negative regulation of macrophage differentiation(GO:0045650) |
| 0.0 | 0.0 | GO:0061669 | spontaneous neurotransmitter secretion(GO:0061669) spontaneous synaptic transmission(GO:0098814) |
| 0.0 | 0.0 | GO:0000454 | snoRNA guided rRNA pseudouridine synthesis(GO:0000454) |
| 0.0 | 0.1 | GO:0006517 | protein deglycosylation(GO:0006517) |
| 0.0 | 0.1 | GO:1904977 | lymphatic endothelial cell migration(GO:1904977) |
| 0.0 | 0.1 | GO:0044346 | fibroblast apoptotic process(GO:0044346) regulation of fibroblast apoptotic process(GO:2000269) |
| 0.0 | 0.0 | GO:0019482 | beta-alanine metabolic process(GO:0019482) |
| 0.0 | 0.1 | GO:0001675 | acrosome assembly(GO:0001675) |
| 0.0 | 0.2 | GO:0042438 | melanin metabolic process(GO:0006582) melanin biosynthetic process(GO:0042438) |
| 0.0 | 0.0 | GO:0042475 | odontogenesis of dentin-containing tooth(GO:0042475) |
| 0.0 | 0.0 | GO:0060164 | regulation of timing of neuron differentiation(GO:0060164) |
| 0.0 | 0.1 | GO:0032930 | positive regulation of superoxide anion generation(GO:0032930) |
| 0.0 | 0.0 | GO:0086046 | membrane depolarization during SA node cell action potential(GO:0086046) |
| 0.0 | 0.0 | GO:0033327 | Leydig cell differentiation(GO:0033327) |
| 0.0 | 0.1 | GO:0060999 | positive regulation of dendritic spine development(GO:0060999) |
| 0.0 | 0.1 | GO:0009048 | dosage compensation(GO:0007549) dosage compensation by inactivation of X chromosome(GO:0009048) |
| 0.0 | 0.1 | GO:0007320 | insemination(GO:0007320) |
| 0.0 | 0.1 | GO:0045065 | cytotoxic T cell differentiation(GO:0045065) |
| 0.0 | 0.1 | GO:0046902 | regulation of mitochondrial membrane permeability(GO:0046902) |
| 0.0 | 0.2 | GO:0071168 | protein localization to chromatin(GO:0071168) |
| 0.0 | 0.1 | GO:0007498 | mesoderm development(GO:0007498) |
| 0.0 | 0.1 | GO:0045739 | positive regulation of DNA repair(GO:0045739) |
| 0.0 | 0.1 | GO:1904714 | regulation of chaperone-mediated autophagy(GO:1904714) |
| 0.0 | 0.3 | GO:0030199 | collagen fibril organization(GO:0030199) |
| 0.0 | 0.1 | GO:0032291 | central nervous system myelination(GO:0022010) axon ensheathment in central nervous system(GO:0032291) |
| 0.0 | 0.1 | GO:0030033 | microvillus assembly(GO:0030033) |
| 0.0 | 0.1 | GO:2001014 | regulation of skeletal muscle cell differentiation(GO:2001014) |
| 0.0 | 0.1 | GO:1903817 | negative regulation of delayed rectifier potassium channel activity(GO:1902260) negative regulation of voltage-gated potassium channel activity(GO:1903817) |
| 0.0 | 1.3 | GO:0002433 | immune response-regulating cell surface receptor signaling pathway involved in phagocytosis(GO:0002433) Fc-gamma receptor signaling pathway involved in phagocytosis(GO:0038096) |
| 0.0 | 0.0 | GO:0021696 | cerebellar cortex development(GO:0021695) cerebellar cortex morphogenesis(GO:0021696) |
| 0.0 | 0.1 | GO:0035583 | sequestering of TGFbeta in extracellular matrix(GO:0035583) |
| 0.0 | 0.1 | GO:0043316 | cytotoxic T cell degranulation(GO:0043316) constitutive secretory pathway(GO:0045054) regulation of constitutive secretory pathway(GO:1903433) positive regulation of constitutive secretory pathway(GO:1903435) |
| 0.0 | 0.0 | GO:0043044 | ATP-dependent chromatin remodeling(GO:0043044) |
| 0.0 | 0.1 | GO:0050861 | positive regulation of B cell receptor signaling pathway(GO:0050861) |
| 0.0 | 0.1 | GO:0060318 | regulation of definitive erythrocyte differentiation(GO:0010724) definitive erythrocyte differentiation(GO:0060318) |
| 0.0 | 0.1 | GO:0031293 | membrane protein intracellular domain proteolysis(GO:0031293) |
| 0.0 | 0.3 | GO:0032060 | bleb assembly(GO:0032060) |
| 0.0 | 0.2 | GO:0060292 | long term synaptic depression(GO:0060292) |
| 0.0 | 0.1 | GO:0010529 | regulation of transposition(GO:0010528) negative regulation of transposition(GO:0010529) |
| 0.0 | 0.0 | GO:0010727 | negative regulation of hydrogen peroxide metabolic process(GO:0010727) |
| 0.0 | 0.0 | GO:0019287 | isopentenyl diphosphate biosynthetic process, mevalonate pathway(GO:0019287) |
| 0.0 | 0.4 | GO:1904837 | beta-catenin-TCF complex assembly(GO:1904837) |
| 0.0 | 0.0 | GO:0072102 | glomerulus morphogenesis(GO:0072102) |
| 0.0 | 0.1 | GO:0007608 | sensory perception of smell(GO:0007608) |
| 0.0 | 0.0 | GO:0033762 | response to glucagon(GO:0033762) |
| 0.0 | 0.7 | GO:0045445 | myoblast differentiation(GO:0045445) |
| 0.0 | 0.0 | GO:0045955 | negative regulation of calcium ion-dependent exocytosis(GO:0045955) |
| 0.0 | 0.0 | GO:2000774 | positive regulation of cellular senescence(GO:2000774) |
| 0.0 | 0.2 | GO:0010831 | positive regulation of myotube differentiation(GO:0010831) |
| 0.0 | 0.0 | GO:1900060 | negative regulation of sphingolipid biosynthetic process(GO:0090155) cellular sphingolipid homeostasis(GO:0090156) negative regulation of ceramide biosynthetic process(GO:1900060) |
| 0.0 | 0.3 | GO:0050873 | brown fat cell differentiation(GO:0050873) |
| 0.0 | 0.6 | GO:0050853 | B cell receptor signaling pathway(GO:0050853) |
| 0.0 | 0.2 | GO:0097352 | autophagosome maturation(GO:0097352) |
| 0.0 | 0.2 | GO:0030500 | regulation of bone mineralization(GO:0030500) |
| 0.0 | 0.4 | GO:0071277 | cellular response to calcium ion(GO:0071277) |
| 0.0 | 0.0 | GO:0035313 | wound healing, spreading of epidermal cells(GO:0035313) |
| 0.0 | 0.1 | GO:0045721 | negative regulation of gluconeogenesis(GO:0045721) |
| 0.0 | 0.1 | GO:0003334 | keratinocyte development(GO:0003334) |
| 0.0 | 0.1 | GO:0045023 | G0 to G1 transition(GO:0045023) |
| 0.0 | 0.5 | GO:0070206 | protein trimerization(GO:0070206) |
| 0.0 | 0.1 | GO:0097120 | receptor localization to synapse(GO:0097120) |
| 0.0 | 0.1 | GO:0035773 | insulin secretion involved in cellular response to glucose stimulus(GO:0035773) |
| 0.0 | 0.1 | GO:0034770 | histone H4-K20 methylation(GO:0034770) |
| 0.0 | 0.0 | GO:1900122 | positive regulation of receptor binding(GO:1900122) |
| 0.0 | 0.1 | GO:0045725 | positive regulation of glycogen biosynthetic process(GO:0045725) |
| 0.0 | 0.0 | GO:0007021 | tubulin complex assembly(GO:0007021) |
| 0.0 | 0.1 | GO:0032201 | telomere maintenance via semi-conservative replication(GO:0032201) |
| 0.0 | 0.0 | GO:1902177 | positive regulation of oxidative stress-induced intrinsic apoptotic signaling pathway(GO:1902177) |
| 0.0 | 0.1 | GO:0006471 | protein ADP-ribosylation(GO:0006471) |
| 0.0 | 0.1 | GO:0043981 | histone H4-K5 acetylation(GO:0043981) histone H4-K8 acetylation(GO:0043982) |
| 0.0 | 0.1 | GO:0030225 | macrophage differentiation(GO:0030225) |
| 0.0 | 0.1 | GO:0051601 | exocyst localization(GO:0051601) |
| 0.0 | 0.1 | GO:0072189 | ureter development(GO:0072189) |
| 0.0 | 0.1 | GO:0090084 | negative regulation of inclusion body assembly(GO:0090084) |
| 0.0 | 0.0 | GO:0002011 | morphogenesis of an epithelial sheet(GO:0002011) |
| 0.0 | 0.1 | GO:0043153 | entrainment of circadian clock by photoperiod(GO:0043153) |
Gene overrepresentation in cellular_component category:
| Log-likelihood per target | Total log-likelihood | Term | Description |
|---|---|---|---|
| 1.1 | 3.2 | GO:0005608 | laminin-3 complex(GO:0005608) |
| 0.8 | 2.3 | GO:1902636 | kinociliary basal body(GO:1902636) |
| 0.7 | 5.1 | GO:0000110 | nucleotide-excision repair factor 1 complex(GO:0000110) |
| 0.6 | 2.4 | GO:0071020 | post-spliceosomal complex(GO:0071020) |
| 0.6 | 4.1 | GO:0000408 | EKC/KEOPS complex(GO:0000408) |
| 0.5 | 3.0 | GO:1902560 | GMP reductase complex(GO:1902560) |
| 0.5 | 1.4 | GO:0034365 | discoidal high-density lipoprotein particle(GO:0034365) |
| 0.4 | 1.8 | GO:0005846 | nuclear cap binding complex(GO:0005846) |
| 0.4 | 1.8 | GO:0097224 | sperm connecting piece(GO:0097224) |
| 0.4 | 2.7 | GO:1990726 | Lsm1-7-Pat1 complex(GO:1990726) |
| 0.4 | 4.8 | GO:0016600 | flotillin complex(GO:0016600) |
| 0.4 | 1.5 | GO:0032044 | DSIF complex(GO:0032044) |
| 0.3 | 1.0 | GO:0034657 | GID complex(GO:0034657) |
| 0.3 | 1.3 | GO:0033596 | TSC1-TSC2 complex(GO:0033596) |
| 0.3 | 1.2 | GO:0048787 | presynaptic active zone membrane(GO:0048787) |
| 0.3 | 0.3 | GO:0005953 | CAAX-protein geranylgeranyltransferase complex(GO:0005953) |
| 0.3 | 2.6 | GO:0071986 | Ragulator complex(GO:0071986) |
| 0.3 | 0.8 | GO:0031084 | BLOC-2 complex(GO:0031084) |
| 0.3 | 0.8 | GO:0000814 | ESCRT II complex(GO:0000814) |
| 0.3 | 4.4 | GO:0030008 | TRAPP complex(GO:0030008) |
| 0.3 | 2.4 | GO:1990111 | spermatoproteasome complex(GO:1990111) |
| 0.3 | 4.1 | GO:0000124 | SAGA complex(GO:0000124) |
| 0.3 | 1.8 | GO:0089701 | U2AF(GO:0089701) |
| 0.3 | 0.5 | GO:0019815 | B cell receptor complex(GO:0019815) |
| 0.2 | 0.2 | GO:0005656 | nuclear pre-replicative complex(GO:0005656) pre-replicative complex(GO:0036387) |
| 0.2 | 3.6 | GO:0030478 | actin cap(GO:0030478) |
| 0.2 | 0.7 | GO:0033565 | ESCRT-0 complex(GO:0033565) |
| 0.2 | 1.8 | GO:0016272 | prefoldin complex(GO:0016272) |
| 0.2 | 3.1 | GO:0030126 | COPI vesicle coat(GO:0030126) |
| 0.2 | 5.9 | GO:0031083 | BLOC-1 complex(GO:0031083) |
| 0.2 | 2.4 | GO:0005786 | signal recognition particle, endoplasmic reticulum targeting(GO:0005786) |
| 0.2 | 1.1 | GO:0020018 | ciliary pocket(GO:0020016) ciliary pocket membrane(GO:0020018) |
| 0.2 | 2.1 | GO:0000322 | storage vacuole(GO:0000322) |
| 0.2 | 0.6 | GO:0005588 | collagen type V trimer(GO:0005588) |
| 0.2 | 1.0 | GO:0035370 | UBC13-UEV1A complex(GO:0035370) |
| 0.2 | 1.4 | GO:0042589 | zymogen granule membrane(GO:0042589) |
| 0.2 | 3.8 | GO:0005862 | muscle thin filament tropomyosin(GO:0005862) |
| 0.2 | 0.6 | GO:0070435 | Shc-EGFR complex(GO:0070435) |
| 0.2 | 1.0 | GO:0032021 | NELF complex(GO:0032021) |
| 0.2 | 0.6 | GO:0044614 | nuclear pore cytoplasmic filaments(GO:0044614) |
| 0.2 | 2.7 | GO:0031464 | Cul4A-RING E3 ubiquitin ligase complex(GO:0031464) |
| 0.2 | 1.5 | GO:0042719 | mitochondrial intermembrane space protein transporter complex(GO:0042719) |
| 0.2 | 1.7 | GO:0031467 | Cul7-RING ubiquitin ligase complex(GO:0031467) |
| 0.2 | 0.6 | GO:0016935 | glycine-gated chloride channel complex(GO:0016935) |
| 0.2 | 0.6 | GO:0005674 | transcription factor TFIIF complex(GO:0005674) |
| 0.2 | 0.9 | GO:0042643 | actomyosin, actin portion(GO:0042643) |
| 0.2 | 1.3 | GO:1990130 | Iml1 complex(GO:1990130) |
| 0.2 | 3.4 | GO:0008540 | proteasome regulatory particle, base subcomplex(GO:0008540) |
| 0.2 | 1.9 | GO:0016593 | Cdc73/Paf1 complex(GO:0016593) |
| 0.2 | 0.7 | GO:0043293 | apoptosome(GO:0043293) |
| 0.2 | 0.5 | GO:0033185 | dolichol-phosphate-mannose synthase complex(GO:0033185) |
| 0.2 | 4.4 | GO:0097440 | apical dendrite(GO:0097440) |
| 0.2 | 0.3 | GO:0097526 | spliceosomal tri-snRNP complex(GO:0097526) |
| 0.2 | 0.2 | GO:0033269 | internode region of axon(GO:0033269) |
| 0.2 | 2.3 | GO:0000407 | pre-autophagosomal structure(GO:0000407) |
| 0.2 | 0.8 | GO:1990246 | uniplex complex(GO:1990246) |
| 0.2 | 3.8 | GO:0031588 | nucleotide-activated protein kinase complex(GO:0031588) |
| 0.2 | 2.0 | GO:0035985 | senescence-associated heterochromatin focus(GO:0035985) |
| 0.2 | 1.1 | GO:0002177 | manchette(GO:0002177) |
| 0.2 | 0.6 | GO:0005753 | mitochondrial proton-transporting ATP synthase complex(GO:0005753) proton-transporting ATP synthase complex(GO:0045259) |
| 0.2 | 1.0 | GO:0030981 | cortical microtubule cytoskeleton(GO:0030981) |
| 0.2 | 0.6 | GO:0070288 | intracellular ferritin complex(GO:0008043) ferritin complex(GO:0070288) |
| 0.2 | 0.5 | GO:0034272 | phosphatidylinositol 3-kinase complex, class III, type I(GO:0034271) phosphatidylinositol 3-kinase complex, class III, type II(GO:0034272) |
| 0.2 | 5.8 | GO:0005669 | transcription factor TFIID complex(GO:0005669) |
| 0.2 | 0.3 | GO:0071598 | neuronal ribonucleoprotein granule(GO:0071598) |
| 0.1 | 0.3 | GO:0033391 | chromatoid body(GO:0033391) |
| 0.1 | 2.5 | GO:0030897 | HOPS complex(GO:0030897) |
| 0.1 | 0.6 | GO:0031302 | intrinsic component of endosome membrane(GO:0031302) |
| 0.1 | 2.6 | GO:0042405 | nuclear inclusion body(GO:0042405) |
| 0.1 | 0.7 | GO:0090498 | extrinsic component of Golgi membrane(GO:0090498) |
| 0.1 | 1.8 | GO:0034464 | BBSome(GO:0034464) |
| 0.1 | 1.0 | GO:0032777 | Piccolo NuA4 histone acetyltransferase complex(GO:0032777) |
| 0.1 | 0.7 | GO:0005943 | phosphatidylinositol 3-kinase complex, class IA(GO:0005943) |
| 0.1 | 1.0 | GO:0000015 | phosphopyruvate hydratase complex(GO:0000015) |
| 0.1 | 0.7 | GO:0030906 | retromer, cargo-selective complex(GO:0030906) |
| 0.1 | 5.3 | GO:0030140 | trans-Golgi network transport vesicle(GO:0030140) |
| 0.1 | 1.1 | GO:0033063 | Rad51B-Rad51C-Rad51D-XRCC2 complex(GO:0033063) |
| 0.1 | 0.6 | GO:0070876 | SOSS complex(GO:0070876) |
| 0.1 | 1.0 | GO:0034715 | pICln-Sm protein complex(GO:0034715) |
| 0.1 | 1.3 | GO:0042587 | glycogen granule(GO:0042587) |
| 0.1 | 2.8 | GO:0030127 | COPII vesicle coat(GO:0030127) |
| 0.1 | 0.4 | GO:0097454 | Schwann cell microvillus(GO:0097454) |
| 0.1 | 1.4 | GO:0070765 | gamma-secretase complex(GO:0070765) |
| 0.1 | 0.4 | GO:0032299 | ribonuclease H2 complex(GO:0032299) |
| 0.1 | 0.9 | GO:0043203 | axon hillock(GO:0043203) |
| 0.1 | 0.5 | GO:0045160 | myosin I complex(GO:0045160) |
| 0.1 | 0.6 | GO:0044305 | calyx of Held(GO:0044305) |
| 0.1 | 2.0 | GO:0008385 | IkappaB kinase complex(GO:0008385) |
| 0.1 | 0.6 | GO:0010370 | perinucleolar chromocenter(GO:0010370) |
| 0.1 | 0.4 | GO:0030289 | protein phosphatase 4 complex(GO:0030289) |
| 0.1 | 0.7 | GO:0034274 | Atg12-Atg5-Atg16 complex(GO:0034274) |
| 0.1 | 0.4 | GO:0097629 | extrinsic component of omegasome membrane(GO:0097629) |
| 0.1 | 0.5 | GO:0034751 | aryl hydrocarbon receptor complex(GO:0034751) |
| 0.1 | 0.6 | GO:0000836 | Hrd1p ubiquitin ligase complex(GO:0000836) |
| 0.1 | 0.1 | GO:0019034 | viral replication complex(GO:0019034) |
| 0.1 | 0.9 | GO:0030062 | mitochondrial tricarboxylic acid cycle enzyme complex(GO:0030062) |
| 0.1 | 0.3 | GO:0005742 | mitochondrial outer membrane translocase complex(GO:0005742) |
| 0.1 | 0.8 | GO:0030870 | Mre11 complex(GO:0030870) |
| 0.1 | 0.7 | GO:0032311 | angiogenin-PRI complex(GO:0032311) |
| 0.1 | 2.1 | GO:0036038 | MKS complex(GO:0036038) |
| 0.1 | 0.8 | GO:0042406 | extrinsic component of endoplasmic reticulum membrane(GO:0042406) |
| 0.1 | 1.5 | GO:0097136 | Bcl-2 family protein complex(GO:0097136) |
| 0.1 | 2.2 | GO:0031265 | CD95 death-inducing signaling complex(GO:0031265) |
| 0.1 | 1.7 | GO:0097386 | glial cell projection(GO:0097386) |
| 0.1 | 0.3 | GO:0005956 | protein kinase CK2 complex(GO:0005956) |
| 0.1 | 2.1 | GO:0036064 | ciliary basal body(GO:0036064) |
| 0.1 | 2.5 | GO:0043194 | axon initial segment(GO:0043194) |
| 0.1 | 1.9 | GO:0032045 | guanyl-nucleotide exchange factor complex(GO:0032045) |
| 0.1 | 0.7 | GO:0005662 | DNA replication factor A complex(GO:0005662) |
| 0.1 | 0.1 | GO:0045293 | MIS complex(GO:0036396) mRNA editing complex(GO:0045293) |
| 0.1 | 1.9 | GO:0005885 | Arp2/3 protein complex(GO:0005885) |
| 0.1 | 0.4 | GO:0031465 | Cul4B-RING E3 ubiquitin ligase complex(GO:0031465) |
| 0.1 | 1.3 | GO:0016461 | unconventional myosin complex(GO:0016461) |
| 0.1 | 0.1 | GO:0005790 | smooth endoplasmic reticulum(GO:0005790) |
| 0.1 | 1.0 | GO:0035686 | sperm fibrous sheath(GO:0035686) |
| 0.1 | 0.6 | GO:0000275 | mitochondrial proton-transporting ATP synthase complex, catalytic core F(1)(GO:0000275) |
| 0.1 | 0.4 | GO:0019867 | outer membrane(GO:0019867) |
| 0.1 | 0.9 | GO:0071953 | elastic fiber(GO:0071953) |
| 0.1 | 0.3 | GO:0072517 | viral factory(GO:0039713) cytoplasmic viral factory(GO:0039714) host cell viral assembly compartment(GO:0072517) |
| 0.1 | 2.1 | GO:0080008 | Cul4-RING E3 ubiquitin ligase complex(GO:0080008) |
| 0.1 | 0.4 | GO:0045272 | plasma membrane respiratory chain complex I(GO:0045272) |
| 0.1 | 1.6 | GO:0000276 | mitochondrial proton-transporting ATP synthase complex, coupling factor F(o)(GO:0000276) |
| 0.1 | 0.7 | GO:0070852 | cell body fiber(GO:0070852) |
| 0.1 | 0.4 | GO:0031510 | SUMO activating enzyme complex(GO:0031510) |
| 0.1 | 0.5 | GO:0032444 | activin responsive factor complex(GO:0032444) |
| 0.1 | 6.0 | GO:0005747 | mitochondrial respiratory chain complex I(GO:0005747) NADH dehydrogenase complex(GO:0030964) respiratory chain complex I(GO:0045271) |
| 0.1 | 0.3 | GO:0000939 | condensed chromosome inner kinetochore(GO:0000939) |
| 0.1 | 1.1 | GO:0005869 | dynactin complex(GO:0005869) |
| 0.1 | 0.5 | GO:0031262 | Ndc80 complex(GO:0031262) |
| 0.1 | 2.3 | GO:0030992 | intraciliary transport particle B(GO:0030992) |
| 0.1 | 0.3 | GO:0045323 | interleukin-1 receptor complex(GO:0045323) |
| 0.1 | 0.1 | GO:0000307 | cyclin-dependent protein kinase holoenzyme complex(GO:0000307) |
| 0.1 | 0.3 | GO:0043291 | RAVE complex(GO:0043291) |
| 0.1 | 0.2 | GO:0070381 | endosome to plasma membrane transport vesicle(GO:0070381) |
| 0.1 | 0.3 | GO:0031264 | death-inducing signaling complex(GO:0031264) |
| 0.1 | 0.2 | GO:0031501 | mannosyltransferase complex(GO:0031501) |
| 0.1 | 2.3 | GO:0031307 | integral component of mitochondrial outer membrane(GO:0031307) |
| 0.1 | 0.6 | GO:0030915 | Smc5-Smc6 complex(GO:0030915) |
| 0.1 | 0.8 | GO:0031462 | Cul2-RING ubiquitin ligase complex(GO:0031462) |
| 0.1 | 0.3 | GO:0097135 | cyclin E2-CDK2 complex(GO:0097135) |
| 0.1 | 3.0 | GO:0005680 | anaphase-promoting complex(GO:0005680) |
| 0.1 | 1.0 | GO:0000164 | protein phosphatase type 1 complex(GO:0000164) |
| 0.1 | 0.5 | GO:0071547 | piP-body(GO:0071547) |
| 0.1 | 1.3 | GO:0005849 | mRNA cleavage factor complex(GO:0005849) |
| 0.1 | 0.8 | GO:0097487 | multivesicular body, internal vesicle(GO:0097487) |
| 0.1 | 0.5 | GO:0097013 | phagocytic vesicle lumen(GO:0097013) |
| 0.1 | 6.0 | GO:0022627 | cytosolic small ribosomal subunit(GO:0022627) |
| 0.1 | 0.7 | GO:0061574 | ASAP complex(GO:0061574) |
| 0.1 | 0.8 | GO:0030015 | CCR4-NOT core complex(GO:0030015) |
| 0.1 | 0.3 | GO:0031310 | integral component of vacuolar membrane(GO:0031166) intrinsic component of vacuolar membrane(GO:0031310) |
| 0.1 | 1.1 | GO:0000813 | ESCRT I complex(GO:0000813) |
| 0.1 | 0.4 | GO:1990425 | ryanodine receptor complex(GO:1990425) |
| 0.1 | 1.2 | GO:0031209 | SCAR complex(GO:0031209) |
| 0.1 | 0.2 | GO:0048269 | methionine adenosyltransferase complex(GO:0048269) |
| 0.1 | 0.5 | GO:0030914 | STAGA complex(GO:0030914) |
| 0.1 | 0.7 | GO:0030991 | intraciliary transport particle A(GO:0030991) |
| 0.1 | 0.5 | GO:0070545 | PeBoW complex(GO:0070545) |
| 0.1 | 0.7 | GO:0005964 | phosphorylase kinase complex(GO:0005964) |
| 0.1 | 0.2 | GO:0097232 | lamellar body membrane(GO:0097232) alveolar lamellar body membrane(GO:0097233) |
| 0.1 | 0.8 | GO:0070652 | HAUS complex(GO:0070652) |
| 0.1 | 0.1 | GO:0070461 | SAGA-type complex(GO:0070461) |
| 0.1 | 0.3 | GO:0043625 | delta DNA polymerase complex(GO:0043625) |
| 0.1 | 0.4 | GO:0090661 | box H/ACA scaRNP complex(GO:0072589) box H/ACA telomerase RNP complex(GO:0090661) |
| 0.1 | 2.0 | GO:0000145 | exocyst(GO:0000145) |
| 0.1 | 0.6 | GO:0097433 | dense body(GO:0097433) |
| 0.1 | 0.7 | GO:0036157 | outer dynein arm(GO:0036157) |
| 0.1 | 0.3 | GO:0071797 | LUBAC complex(GO:0071797) |
| 0.1 | 1.6 | GO:0031105 | septin complex(GO:0031105) |
| 0.1 | 0.3 | GO:0097362 | MCM8-MCM9 complex(GO:0097362) |
| 0.1 | 1.6 | GO:0005839 | proteasome core complex(GO:0005839) |
| 0.1 | 0.4 | GO:0072357 | PTW/PP1 phosphatase complex(GO:0072357) |
| 0.1 | 1.2 | GO:0070971 | endoplasmic reticulum exit site(GO:0070971) |
| 0.1 | 0.9 | GO:0098647 | collagen type VI trimer(GO:0005589) collagen beaded filament(GO:0098647) |
| 0.1 | 0.9 | GO:0008091 | spectrin(GO:0008091) |
| 0.1 | 0.3 | GO:0005971 | ribonucleoside-diphosphate reductase complex(GO:0005971) |
| 0.1 | 0.7 | GO:1990124 | messenger ribonucleoprotein complex(GO:1990124) |
| 0.1 | 0.3 | GO:0005845 | mRNA cap binding complex(GO:0005845) RNA cap binding complex(GO:0034518) |
| 0.1 | 0.3 | GO:0002193 | MAML1-RBP-Jkappa- ICN1 complex(GO:0002193) |
| 0.1 | 0.4 | GO:0042105 | alpha-beta T cell receptor complex(GO:0042105) |
| 0.1 | 0.1 | GO:0000153 | cytoplasmic ubiquitin ligase complex(GO:0000153) |
| 0.1 | 0.4 | GO:0033503 | HULC complex(GO:0033503) |
| 0.1 | 0.1 | GO:0016013 | syntrophin complex(GO:0016013) |
| 0.1 | 0.3 | GO:0035749 | myelin sheath adaxonal region(GO:0035749) |
| 0.1 | 0.9 | GO:0072559 | NLRP3 inflammasome complex(GO:0072559) |
| 0.1 | 4.9 | GO:0048475 | membrane coat(GO:0030117) coated membrane(GO:0048475) |
| 0.1 | 0.2 | GO:0005873 | plus-end kinesin complex(GO:0005873) |
| 0.1 | 1.1 | GO:0097539 | ciliary transition fiber(GO:0097539) |
| 0.1 | 0.6 | GO:0031233 | intrinsic component of external side of plasma membrane(GO:0031233) |
| 0.1 | 4.0 | GO:0000315 | organellar large ribosomal subunit(GO:0000315) mitochondrial large ribosomal subunit(GO:0005762) |
| 0.1 | 1.1 | GO:0005832 | chaperonin-containing T-complex(GO:0005832) |
| 0.1 | 0.1 | GO:0031372 | UBC13-MMS2 complex(GO:0031372) |
| 0.1 | 1.2 | GO:0035145 | exon-exon junction complex(GO:0035145) |
| 0.1 | 0.6 | GO:0005750 | mitochondrial respiratory chain complex III(GO:0005750) respiratory chain complex III(GO:0045275) |
| 0.1 | 2.5 | GO:0016460 | myosin II complex(GO:0016460) |
| 0.1 | 0.4 | GO:0044354 | pinosome(GO:0044352) macropinosome(GO:0044354) |
| 0.1 | 0.8 | GO:0033270 | paranode region of axon(GO:0033270) |
| 0.1 | 0.5 | GO:0098636 | protein complex involved in cell adhesion(GO:0098636) |
| 0.1 | 2.2 | GO:0031941 | filamentous actin(GO:0031941) |
| 0.1 | 0.2 | GO:0097679 | symbiont-containing vacuole(GO:0020003) symbiont-containing vacuole membrane(GO:0020005) other organism cytoplasm(GO:0097679) |
| 0.1 | 0.2 | GO:0034681 | integrin alpha11-beta1 complex(GO:0034681) |
| 0.1 | 0.5 | GO:0072669 | tRNA-splicing ligase complex(GO:0072669) |
| 0.1 | 0.6 | GO:0031527 | filopodium membrane(GO:0031527) |
| 0.1 | 0.8 | GO:0005671 | Ada2/Gcn5/Ada3 transcription activator complex(GO:0005671) |
| 0.1 | 1.3 | GO:0046540 | U4/U6 x U5 tri-snRNP complex(GO:0046540) |
| 0.1 | 0.2 | GO:1990812 | growth cone filopodium(GO:1990812) |
| 0.1 | 3.0 | GO:0005834 | heterotrimeric G-protein complex(GO:0005834) |
| 0.0 | 0.1 | GO:0044753 | amphisome(GO:0044753) |
| 0.0 | 0.1 | GO:0031466 | Cul5-RING ubiquitin ligase complex(GO:0031466) |
| 0.0 | 0.5 | GO:0090665 | dystrophin-associated glycoprotein complex(GO:0016010) glycoprotein complex(GO:0090665) |
| 0.0 | 0.0 | GO:0005683 | U7 snRNP(GO:0005683) |
| 0.0 | 0.6 | GO:0042622 | photoreceptor outer segment membrane(GO:0042622) |
| 0.0 | 0.7 | GO:0005942 | phosphatidylinositol 3-kinase complex(GO:0005942) |
| 0.0 | 5.8 | GO:0015934 | large ribosomal subunit(GO:0015934) |
| 0.0 | 0.4 | GO:0005638 | lamin filament(GO:0005638) |
| 0.0 | 0.4 | GO:0000793 | condensed chromosome(GO:0000793) |
| 0.0 | 0.4 | GO:0031931 | TORC1 complex(GO:0031931) |
| 0.0 | 0.2 | GO:0000439 | core TFIIH complex(GO:0000439) |
| 0.0 | 0.4 | GO:0071204 | histone pre-mRNA 3'end processing complex(GO:0071204) |
| 0.0 | 0.5 | GO:0099634 | postsynaptic specialization membrane(GO:0099634) |
| 0.0 | 9.1 | GO:0005777 | peroxisome(GO:0005777) microbody(GO:0042579) |
| 0.0 | 2.9 | GO:0031201 | SNARE complex(GO:0031201) |
| 0.0 | 1.1 | GO:0032591 | dendritic spine membrane(GO:0032591) |
| 0.0 | 0.6 | GO:0043083 | synaptic cleft(GO:0043083) |
| 0.0 | 0.2 | GO:0033588 | Elongator holoenzyme complex(GO:0033588) |
| 0.0 | 0.3 | GO:0001940 | male pronucleus(GO:0001940) |
| 0.0 | 0.1 | GO:0097361 | CIA complex(GO:0097361) |
| 0.0 | 0.3 | GO:0005658 | alpha DNA polymerase:primase complex(GO:0005658) |
| 0.0 | 0.2 | GO:0071062 | alphav-beta3 integrin-vitronectin complex(GO:0071062) |
| 0.0 | 1.1 | GO:0000922 | spindle pole(GO:0000922) |
| 0.0 | 0.3 | GO:0001740 | Barr body(GO:0001740) |
| 0.0 | 1.0 | GO:0046658 | anchored component of plasma membrane(GO:0046658) |
| 0.0 | 0.7 | GO:0043186 | P granule(GO:0043186) pole plasm(GO:0045495) germ plasm(GO:0060293) |
| 0.0 | 0.4 | GO:0030905 | retromer, tubulation complex(GO:0030905) |
| 0.0 | 0.3 | GO:0000172 | ribonuclease MRP complex(GO:0000172) |
| 0.0 | 0.1 | GO:0036026 | protein C inhibitor-TMPRSS7 complex(GO:0036024) protein C inhibitor-TMPRSS11E complex(GO:0036025) protein C inhibitor-PLAT complex(GO:0036026) protein C inhibitor-PLAU complex(GO:0036027) protein C inhibitor-thrombin complex(GO:0036028) protein C inhibitor-KLK3 complex(GO:0036029) protein C inhibitor-plasma kallikrein complex(GO:0036030) serine protease inhibitor complex(GO:0097180) protein C inhibitor-coagulation factor V complex(GO:0097181) protein C inhibitor-coagulation factor Xa complex(GO:0097182) protein C inhibitor-coagulation factor XI complex(GO:0097183) |
| 0.0 | 0.4 | GO:0097413 | Lewy body(GO:0097413) |
| 0.0 | 0.6 | GO:0035068 | micro-ribonucleoprotein complex(GO:0035068) |
| 0.0 | 0.1 | GO:0000229 | cytoplasmic chromosome(GO:0000229) |
| 0.0 | 4.4 | GO:0071013 | catalytic step 2 spliceosome(GO:0071013) |
| 0.0 | 2.1 | GO:0008180 | COP9 signalosome(GO:0008180) |
| 0.0 | 0.8 | GO:0044322 | endoplasmic reticulum quality control compartment(GO:0044322) |
| 0.0 | 0.3 | GO:0070937 | CRD-mediated mRNA stability complex(GO:0070937) |
| 0.0 | 0.9 | GO:0005689 | U12-type spliceosomal complex(GO:0005689) |
| 0.0 | 0.0 | GO:0042721 | mitochondrial inner membrane protein insertion complex(GO:0042721) |
| 0.0 | 0.2 | GO:1990604 | IRE1-TRAF2-ASK1 complex(GO:1990604) |
| 0.0 | 0.2 | GO:0005896 | interleukin-6 receptor complex(GO:0005896) |
| 0.0 | 10.7 | GO:0001726 | ruffle(GO:0001726) |
| 0.0 | 0.2 | GO:0036449 | microtubule minus-end(GO:0036449) |
| 0.0 | 0.9 | GO:0031235 | intrinsic component of the cytoplasmic side of the plasma membrane(GO:0031235) |
| 0.0 | 3.4 | GO:0031463 | Cul3-RING ubiquitin ligase complex(GO:0031463) |
| 0.0 | 3.8 | GO:0005776 | autophagosome(GO:0005776) |
| 0.0 | 0.1 | GO:0035189 | Rb-E2F complex(GO:0035189) |
| 0.0 | 0.6 | GO:0033178 | proton-transporting two-sector ATPase complex, catalytic domain(GO:0033178) |
| 0.0 | 0.9 | GO:0005868 | cytoplasmic dynein complex(GO:0005868) |
| 0.0 | 0.2 | GO:0005602 | complement component C1 complex(GO:0005602) |
| 0.0 | 0.3 | GO:0010494 | cytoplasmic stress granule(GO:0010494) |
| 0.0 | 0.3 | GO:0016012 | sarcoglycan complex(GO:0016012) |
| 0.0 | 0.1 | GO:0016342 | catenin complex(GO:0016342) |
| 0.0 | 0.3 | GO:0033018 | sarcoplasmic reticulum lumen(GO:0033018) |
| 0.0 | 0.1 | GO:0097196 | Shu complex(GO:0097196) |
| 0.0 | 0.1 | GO:0043190 | ATP-binding cassette (ABC) transporter complex(GO:0043190) |
| 0.0 | 0.2 | GO:0005851 | eukaryotic translation initiation factor 2B complex(GO:0005851) |
| 0.0 | 0.7 | GO:0005912 | adherens junction(GO:0005912) |
| 0.0 | 0.2 | GO:0098837 | postsynaptic recycling endosome(GO:0098837) |
| 0.0 | 1.2 | GO:0008023 | transcription elongation factor complex(GO:0008023) |
| 0.0 | 0.1 | GO:0061200 | clathrin-sculpted gamma-aminobutyric acid transport vesicle(GO:0061200) clathrin-sculpted gamma-aminobutyric acid transport vesicle membrane(GO:0061202) |
| 0.0 | 0.4 | GO:0098827 | endoplasmic reticulum tubular network(GO:0071782) endoplasmic reticulum subcompartment(GO:0098827) |
| 0.0 | 0.2 | GO:0002081 | outer acrosomal membrane(GO:0002081) |
| 0.0 | 0.1 | GO:0033061 | Swi5-Sfr1 complex(GO:0032798) DNA recombinase mediator complex(GO:0033061) |
| 0.0 | 0.2 | GO:0032133 | chromosome passenger complex(GO:0032133) |
| 0.0 | 0.3 | GO:0071141 | SMAD protein complex(GO:0071141) |
| 0.0 | 0.2 | GO:0044327 | dendritic spine head(GO:0044327) |
| 0.0 | 0.1 | GO:0005577 | fibrinogen complex(GO:0005577) |
| 0.0 | 1.1 | GO:0035861 | site of double-strand break(GO:0035861) |
| 0.0 | 0.1 | GO:0031515 | tRNA (m1A) methyltransferase complex(GO:0031515) |
| 0.0 | 1.2 | GO:0005581 | collagen trimer(GO:0005581) |
| 0.0 | 0.5 | GO:0071437 | invadopodium(GO:0071437) |
| 0.0 | 0.1 | GO:0016533 | cyclin-dependent protein kinase 5 holoenzyme complex(GO:0016533) |
| 0.0 | 0.2 | GO:1990589 | ATF4-CREB1 transcription factor complex(GO:1990589) |
| 0.0 | 0.1 | GO:0032144 | 4-aminobutyrate transaminase complex(GO:0032144) |
| 0.0 | 0.1 | GO:0070552 | BRISC complex(GO:0070552) |
| 0.0 | 3.8 | GO:0017053 | transcriptional repressor complex(GO:0017053) |
| 0.0 | 0.1 | GO:0032301 | MutSalpha complex(GO:0032301) |
| 0.0 | 0.5 | GO:0045121 | membrane raft(GO:0045121) membrane microdomain(GO:0098857) |
| 0.0 | 0.4 | GO:0033179 | proton-transporting V-type ATPase, V0 domain(GO:0033179) |
| 0.0 | 0.0 | GO:0034719 | SMN-Sm protein complex(GO:0034719) |
| 0.0 | 0.1 | GO:0034363 | intermediate-density lipoprotein particle(GO:0034363) |
| 0.0 | 0.1 | GO:0070557 | PCNA-p21 complex(GO:0070557) |
| 0.0 | 0.2 | GO:0032389 | MutLalpha complex(GO:0032389) |
| 0.0 | 0.9 | GO:0097546 | ciliary base(GO:0097546) |
| 0.0 | 0.2 | GO:0008537 | proteasome activator complex(GO:0008537) |
| 0.0 | 2.9 | GO:0016605 | PML body(GO:0016605) |
| 0.0 | 0.3 | GO:0097431 | mitotic spindle pole(GO:0097431) |
| 0.0 | 0.1 | GO:0000243 | commitment complex(GO:0000243) |
| 0.0 | 0.1 | GO:0033177 | proton-transporting two-sector ATPase complex, proton-transporting domain(GO:0033177) |
| 0.0 | 0.1 | GO:0042575 | DNA polymerase complex(GO:0042575) |
| 0.0 | 4.0 | GO:0030496 | midbody(GO:0030496) |
| 0.0 | 0.9 | GO:0005657 | replication fork(GO:0005657) |
| 0.0 | 0.4 | GO:0031430 | M band(GO:0031430) |
| 0.0 | 0.1 | GO:0005726 | perichromatin fibrils(GO:0005726) |
| 0.0 | 12.1 | GO:0005759 | mitochondrial matrix(GO:0005759) |
| 0.0 | 1.9 | GO:0005811 | lipid particle(GO:0005811) |
| 0.0 | 1.6 | GO:0000118 | histone deacetylase complex(GO:0000118) |
| 0.0 | 0.4 | GO:0034993 | microtubule organizing center attachment site(GO:0034992) LINC complex(GO:0034993) |
| 0.0 | 0.1 | GO:0032593 | insulin-responsive compartment(GO:0032593) |
| 0.0 | 0.0 | GO:0071159 | NF-kappaB complex(GO:0071159) |
| 0.0 | 3.9 | GO:0030018 | Z disc(GO:0030018) |
| 0.0 | 0.1 | GO:0009331 | glycerol-3-phosphate dehydrogenase complex(GO:0009331) |
| 0.0 | 0.4 | GO:0035102 | PRC1 complex(GO:0035102) |
| 0.0 | 1.4 | GO:0043195 | terminal bouton(GO:0043195) |
| 0.0 | 0.0 | GO:0070761 | pre-snoRNP complex(GO:0070761) |
| 0.0 | 0.1 | GO:0032009 | early phagosome(GO:0032009) |
| 0.0 | 0.3 | GO:0005751 | mitochondrial respiratory chain complex IV(GO:0005751) |
| 0.0 | 0.1 | GO:0034669 | integrin alpha4-beta7 complex(GO:0034669) |
| 0.0 | 0.1 | GO:1990907 | beta-catenin-TCF complex(GO:1990907) |
| 0.0 | 0.5 | GO:0001527 | microfibril(GO:0001527) fibril(GO:0043205) |
| 0.0 | 0.2 | GO:0031616 | spindle pole centrosome(GO:0031616) |
| 0.0 | 0.1 | GO:0071148 | TEAD-1-YAP complex(GO:0071148) |
| 0.0 | 0.0 | GO:0009330 | DNA topoisomerase complex (ATP-hydrolyzing)(GO:0009330) |
| 0.0 | 0.4 | GO:0005938 | cell cortex(GO:0005938) |
| 0.0 | 0.2 | GO:0071004 | U2-type prespliceosome(GO:0071004) |
| 0.0 | 0.2 | GO:0033165 | interphotoreceptor matrix(GO:0033165) |
| 0.0 | 0.4 | GO:0005852 | eukaryotic translation initiation factor 3 complex(GO:0005852) |
| 0.0 | 0.2 | GO:0031232 | extrinsic component of external side of plasma membrane(GO:0031232) |
| 0.0 | 2.5 | GO:0005796 | Golgi lumen(GO:0005796) |
| 0.0 | 0.2 | GO:0044297 | cell body(GO:0044297) |
| 0.0 | 0.1 | GO:0009925 | basal plasma membrane(GO:0009925) |
| 0.0 | 0.3 | GO:0030027 | lamellipodium(GO:0030027) |
| 0.0 | 0.7 | GO:0005840 | ribosome(GO:0005840) |
| 0.0 | 0.7 | GO:0005844 | polysome(GO:0005844) |
| 0.0 | 0.1 | GO:0005606 | laminin-1 complex(GO:0005606) laminin-2 complex(GO:0005607) laminin-10 complex(GO:0043259) |
| 0.0 | 0.2 | GO:0000940 | condensed chromosome outer kinetochore(GO:0000940) |
| 0.0 | 0.4 | GO:0099738 | cell cortex region(GO:0099738) |
| 0.0 | 7.9 | GO:0005925 | focal adhesion(GO:0005925) |
| 0.0 | 1.7 | GO:0031093 | platelet alpha granule lumen(GO:0031093) |
| 0.0 | 0.1 | GO:0071203 | WASH complex(GO:0071203) |
| 0.0 | 11.4 | GO:0016604 | nuclear body(GO:0016604) |
| 0.0 | 0.8 | GO:0016592 | mediator complex(GO:0016592) |
| 0.0 | 0.4 | GO:0002080 | acrosomal membrane(GO:0002080) |
| 0.0 | 0.4 | GO:0005614 | interstitial matrix(GO:0005614) |
| 0.0 | 0.1 | GO:0044295 | axonal growth cone(GO:0044295) |
| 0.0 | 0.7 | GO:0005681 | spliceosomal complex(GO:0005681) |
| 0.0 | 0.0 | GO:0097179 | protease inhibitor complex(GO:0097179) |
| 0.0 | 0.2 | GO:0044666 | MLL3/4 complex(GO:0044666) |
| 0.0 | 0.0 | GO:0097169 | AIM2 inflammasome complex(GO:0097169) |
| 0.0 | 0.2 | GO:0032590 | dendrite membrane(GO:0032590) |
| 0.0 | 0.1 | GO:1990131 | Gtr1-Gtr2 GTPase complex(GO:1990131) |
| 0.0 | 1.7 | GO:0043197 | dendritic spine(GO:0043197) |
| 0.0 | 0.1 | GO:0018995 | host(GO:0018995) host cell(GO:0043657) |
| 0.0 | 0.9 | GO:0043235 | receptor complex(GO:0043235) |
| 0.0 | 0.1 | GO:0045273 | mitochondrial respiratory chain complex II, succinate dehydrogenase complex (ubiquinone)(GO:0005749) succinate dehydrogenase complex (ubiquinone)(GO:0045257) respiratory chain complex II(GO:0045273) succinate dehydrogenase complex(GO:0045281) fumarate reductase complex(GO:0045283) |
| 0.0 | 0.4 | GO:0097381 | photoreceptor disc membrane(GO:0097381) |
| 0.0 | 0.1 | GO:0030868 | smooth endoplasmic reticulum membrane(GO:0030868) smooth endoplasmic reticulum part(GO:0097425) |
| 0.0 | 0.0 | GO:0042720 | mitochondrial inner membrane peptidase complex(GO:0042720) |
| 0.0 | 0.4 | GO:1902711 | GABA-A receptor complex(GO:1902711) |
| 0.0 | 0.0 | GO:0014802 | terminal cisterna(GO:0014802) |
| 0.0 | 0.1 | GO:0043020 | NADPH oxidase complex(GO:0043020) |
| 0.0 | 0.1 | GO:0032982 | myosin filament(GO:0032982) |
| 0.0 | 0.3 | GO:0035577 | azurophil granule membrane(GO:0035577) |
| 0.0 | 0.1 | GO:0008290 | F-actin capping protein complex(GO:0008290) |
| 0.0 | 0.1 | GO:0042765 | GPI-anchor transamidase complex(GO:0042765) |
| 0.0 | 0.1 | GO:0097129 | cyclin D2-CDK4 complex(GO:0097129) |
| 0.0 | 0.1 | GO:0016442 | RISC complex(GO:0016442) RNAi effector complex(GO:0031332) |
| 0.0 | 0.1 | GO:0005652 | nuclear lamina(GO:0005652) |
| 0.0 | 0.1 | GO:0001520 | outer dense fiber(GO:0001520) |
| 0.0 | 0.0 | GO:0071458 | integral component of cytoplasmic side of endoplasmic reticulum membrane(GO:0071458) |
| 0.0 | 0.0 | GO:0043198 | dendritic shaft(GO:0043198) |
| 0.0 | 0.0 | GO:0033263 | CORVET complex(GO:0033263) |
| 0.0 | 0.1 | GO:0005854 | nascent polypeptide-associated complex(GO:0005854) |
| 0.0 | 0.1 | GO:0097255 | R2TP complex(GO:0097255) |
| 0.0 | 0.4 | GO:0001669 | acrosomal vesicle(GO:0001669) |
| 0.0 | 0.0 | GO:0001652 | granular component(GO:0001652) |
| 0.0 | 0.1 | GO:0000788 | nuclear nucleosome(GO:0000788) |
| 0.0 | 0.0 | GO:0097452 | GAIT complex(GO:0097452) |
| 0.0 | 0.1 | GO:0035631 | CD40 receptor complex(GO:0035631) |
| 0.0 | 0.1 | GO:0036452 | ESCRT complex(GO:0036452) |
| 0.0 | 0.3 | GO:0031012 | extracellular matrix(GO:0031012) |
| 0.0 | 0.0 | GO:0032300 | mismatch repair complex(GO:0032300) |
| 0.0 | 0.0 | GO:0031251 | PAN complex(GO:0031251) |
| 0.0 | 0.1 | GO:0001741 | XY body(GO:0001741) |
Gene overrepresentation in molecular_function category:
| Log-likelihood per target | Total log-likelihood | Term | Description |
|---|---|---|---|
| 1.5 | 4.5 | GO:0004821 | histidine-tRNA ligase activity(GO:0004821) |
| 1.4 | 4.3 | GO:0045127 | N-acetylglucosamine kinase activity(GO:0045127) |
| 1.4 | 5.5 | GO:0061628 | H3K27me3 modified histone binding(GO:0061628) |
| 1.2 | 3.5 | GO:0031071 | cysteine desulfurase activity(GO:0031071) |
| 0.9 | 2.7 | GO:0004345 | glucose-6-phosphate dehydrogenase activity(GO:0004345) |
| 0.8 | 2.5 | GO:0035539 | 8-oxo-7,8-dihydroguanosine triphosphate pyrophosphatase activity(GO:0008413) 8-oxo-7,8-dihydrodeoxyguanosine triphosphate pyrophosphatase activity(GO:0035539) |
| 0.8 | 2.4 | GO:0070566 | adenylyltransferase activity(GO:0070566) |
| 0.7 | 5.1 | GO:1990599 | 3' overhang single-stranded DNA endodeoxyribonuclease activity(GO:1990599) |
| 0.7 | 2.2 | GO:0016211 | glutamate-ammonia ligase activity(GO:0004356) ammonia ligase activity(GO:0016211) acid-ammonia (or amide) ligase activity(GO:0016880) |
| 0.7 | 2.1 | GO:0000384 | first spliceosomal transesterification activity(GO:0000384) |
| 0.7 | 2.0 | GO:0043423 | 3-phosphoinositide-dependent protein kinase binding(GO:0043423) |
| 0.6 | 2.5 | GO:0047391 | alkylglycerophosphoethanolamine phosphodiesterase activity(GO:0047391) |
| 0.5 | 3.1 | GO:0003998 | acylphosphatase activity(GO:0003998) |
| 0.5 | 1.5 | GO:0032767 | copper-dependent protein binding(GO:0032767) |
| 0.5 | 3.0 | GO:0016657 | GMP reductase activity(GO:0003920) oxidoreductase activity, acting on NAD(P)H, nitrogenous group as acceptor(GO:0016657) |
| 0.5 | 1.4 | GO:0004797 | thymidine kinase activity(GO:0004797) |
| 0.5 | 2.3 | GO:0008113 | peptide-methionine (S)-S-oxide reductase activity(GO:0008113) |
| 0.5 | 0.5 | GO:0017162 | aryl hydrocarbon receptor binding(GO:0017162) |
| 0.4 | 1.8 | GO:0042132 | fructose 1,6-bisphosphate 1-phosphatase activity(GO:0042132) |
| 0.4 | 1.7 | GO:0003986 | acetyl-CoA hydrolase activity(GO:0003986) |
| 0.4 | 1.6 | GO:0047066 | phospholipid-hydroperoxide glutathione peroxidase activity(GO:0047066) |
| 0.4 | 1.2 | GO:0032427 | GBD domain binding(GO:0032427) |
| 0.4 | 1.9 | GO:0002046 | opsin binding(GO:0002046) |
| 0.4 | 0.4 | GO:0070506 | high-density lipoprotein particle receptor activity(GO:0070506) |
| 0.4 | 1.1 | GO:0015227 | acyl carnitine transmembrane transporter activity(GO:0015227) |
| 0.4 | 1.1 | GO:0015039 | ferredoxin-NADP+ reductase activity(GO:0004324) NADPH-adrenodoxin reductase activity(GO:0015039) oxidoreductase activity, acting on iron-sulfur proteins as donors(GO:0016730) oxidoreductase activity, acting on iron-sulfur proteins as donors, NAD or NADP as acceptor(GO:0016731) |
| 0.3 | 0.3 | GO:0046899 | nucleoside triphosphate adenylate kinase activity(GO:0046899) |
| 0.3 | 3.1 | GO:0043426 | MRF binding(GO:0043426) |
| 0.3 | 3.0 | GO:0016206 | catechol O-methyltransferase activity(GO:0016206) |
| 0.3 | 2.0 | GO:0035800 | deubiquitinase activator activity(GO:0035800) |
| 0.3 | 3.0 | GO:0008158 | hedgehog receptor activity(GO:0008158) |
| 0.3 | 1.7 | GO:0033857 | diphosphoinositol-pentakisphosphate kinase activity(GO:0033857) |
| 0.3 | 2.9 | GO:0070739 | protein-glutamic acid ligase activity(GO:0070739) |
| 0.3 | 2.6 | GO:0030628 | pre-mRNA 3'-splice site binding(GO:0030628) |
| 0.3 | 1.3 | GO:0016404 | 15-hydroxyprostaglandin dehydrogenase (NAD+) activity(GO:0016404) |
| 0.3 | 1.2 | GO:0071209 | U7 snRNA binding(GO:0071209) |
| 0.3 | 1.8 | GO:0036042 | long-chain fatty acyl-CoA binding(GO:0036042) |
| 0.3 | 1.8 | GO:0015307 | drug:proton antiporter activity(GO:0015307) |
| 0.3 | 1.2 | GO:0034191 | apolipoprotein A-I receptor binding(GO:0034191) |
| 0.3 | 1.2 | GO:0051021 | GDP-dissociation inhibitor binding(GO:0051021) Rho GDP-dissociation inhibitor binding(GO:0051022) |
| 0.3 | 5.4 | GO:0043295 | glutathione binding(GO:0043295) |
| 0.3 | 0.8 | GO:0016899 | oxidoreductase activity, acting on the CH-OH group of donors, oxygen as acceptor(GO:0016899) |
| 0.3 | 0.8 | GO:0005173 | stem cell factor receptor binding(GO:0005173) |
| 0.3 | 1.8 | GO:0035368 | selenocysteine insertion sequence binding(GO:0035368) |
| 0.3 | 2.1 | GO:0030942 | endoplasmic reticulum signal peptide binding(GO:0030942) |
| 0.3 | 1.0 | GO:0008670 | 2,4-dienoyl-CoA reductase (NADPH) activity(GO:0008670) |
| 0.3 | 1.5 | GO:0004814 | arginine-tRNA ligase activity(GO:0004814) |
| 0.3 | 1.0 | GO:0016230 | sphingomyelin phosphodiesterase activator activity(GO:0016230) |
| 0.2 | 1.2 | GO:0032810 | sterol response element binding(GO:0032810) |
| 0.2 | 0.7 | GO:0004362 | glutathione-disulfide reductase activity(GO:0004362) |
| 0.2 | 0.7 | GO:0019961 | interferon binding(GO:0019961) |
| 0.2 | 1.4 | GO:0032089 | NACHT domain binding(GO:0032089) |
| 0.2 | 2.0 | GO:0005000 | vasopressin receptor activity(GO:0005000) |
| 0.2 | 0.7 | GO:0004852 | uroporphyrinogen-III synthase activity(GO:0004852) |
| 0.2 | 1.3 | GO:0044736 | acid-sensing ion channel activity(GO:0044736) |
| 0.2 | 4.0 | GO:0070513 | death domain binding(GO:0070513) |
| 0.2 | 0.7 | GO:0034038 | deoxyhypusine synthase activity(GO:0034038) |
| 0.2 | 1.3 | GO:0039552 | RIG-I binding(GO:0039552) |
| 0.2 | 1.3 | GO:0070137 | ubiquitin-like protein-specific endopeptidase activity(GO:0070137) SUMO-specific endopeptidase activity(GO:0070139) |
| 0.2 | 2.1 | GO:0043023 | ribosomal large subunit binding(GO:0043023) |
| 0.2 | 0.8 | GO:0000702 | oxidized base lesion DNA N-glycosylase activity(GO:0000702) |
| 0.2 | 2.3 | GO:0036402 | proteasome-activating ATPase activity(GO:0036402) |
| 0.2 | 1.0 | GO:0052740 | 1-acyl-2-lysophosphatidylserine acylhydrolase activity(GO:0052740) |
| 0.2 | 0.2 | GO:0004645 | phosphorylase activity(GO:0004645) |
| 0.2 | 3.3 | GO:0004679 | AMP-activated protein kinase activity(GO:0004679) |
| 0.2 | 0.6 | GO:0019136 | deoxynucleoside kinase activity(GO:0019136) |
| 0.2 | 1.2 | GO:0004792 | thiosulfate sulfurtransferase activity(GO:0004792) |
| 0.2 | 0.2 | GO:0016312 | inositol bisphosphate phosphatase activity(GO:0016312) |
| 0.2 | 1.4 | GO:0030060 | L-malate dehydrogenase activity(GO:0030060) |
| 0.2 | 0.8 | GO:0032184 | SUMO polymer binding(GO:0032184) |
| 0.2 | 2.3 | GO:0016290 | palmitoyl-CoA hydrolase activity(GO:0016290) |
| 0.2 | 0.7 | GO:0004504 | peptidylglycine monooxygenase activity(GO:0004504) peptidylamidoglycolate lyase activity(GO:0004598) |
| 0.2 | 0.6 | GO:0052856 | NADHX epimerase activity(GO:0052856) NADPHX epimerase activity(GO:0052857) |
| 0.2 | 1.1 | GO:0008853 | exodeoxyribonuclease III activity(GO:0008853) |
| 0.2 | 0.5 | GO:0016649 | electron-transferring-flavoprotein dehydrogenase activity(GO:0004174) oxidoreductase activity, acting on the CH-NH group of donors, quinone or similar compound as acceptor(GO:0016649) |
| 0.2 | 0.5 | GO:0030626 | U12 snRNA binding(GO:0030626) |
| 0.2 | 0.7 | GO:0008195 | phosphatidate phosphatase activity(GO:0008195) |
| 0.2 | 0.5 | GO:0004582 | dolichyl-phosphate beta-D-mannosyltransferase activity(GO:0004582) |
| 0.2 | 0.7 | GO:0050262 | ribosylnicotinamide kinase activity(GO:0050262) ribosylnicotinate kinase activity(GO:0061769) |
| 0.2 | 0.5 | GO:0008192 | RNA guanylyltransferase activity(GO:0008192) |
| 0.2 | 1.7 | GO:0000340 | RNA 7-methylguanosine cap binding(GO:0000340) |
| 0.2 | 0.8 | GO:0004306 | ethanolamine-phosphate cytidylyltransferase activity(GO:0004306) |
| 0.2 | 0.7 | GO:0005017 | platelet-derived growth factor-activated receptor activity(GO:0005017) |
| 0.2 | 0.5 | GO:0047661 | racemase and epimerase activity, acting on amino acids and derivatives(GO:0016855) racemase activity, acting on amino acids and derivatives(GO:0036361) amino-acid racemase activity(GO:0047661) |
| 0.2 | 2.0 | GO:0031386 | protein tag(GO:0031386) |
| 0.2 | 0.3 | GO:0019911 | structural constituent of myelin sheath(GO:0019911) |
| 0.2 | 0.5 | GO:0008798 | beta-aspartyl-peptidase activity(GO:0008798) |
| 0.2 | 1.6 | GO:0055104 | ligase inhibitor activity(GO:0055104) ubiquitin ligase inhibitor activity(GO:1990948) |
| 0.2 | 0.6 | GO:0009041 | uridylate kinase activity(GO:0009041) |
| 0.2 | 0.5 | GO:0003863 | alpha-ketoacid dehydrogenase activity(GO:0003826) 3-methyl-2-oxobutanoate dehydrogenase (2-methylpropanoyl-transferring) activity(GO:0003863) |
| 0.2 | 0.2 | GO:0017057 | 6-phosphogluconolactonase activity(GO:0017057) |
| 0.2 | 0.6 | GO:0004782 | sulfinoalanine decarboxylase activity(GO:0004782) |
| 0.2 | 0.9 | GO:0019776 | Atg8 ligase activity(GO:0019776) |
| 0.2 | 0.5 | GO:0004492 | methylmalonyl-CoA decarboxylase activity(GO:0004492) |
| 0.2 | 1.7 | GO:0004865 | protein serine/threonine phosphatase inhibitor activity(GO:0004865) |
| 0.2 | 0.6 | GO:0033981 | D-dopachrome decarboxylase activity(GO:0033981) |
| 0.2 | 0.3 | GO:0042809 | vitamin D receptor binding(GO:0042809) |
| 0.2 | 0.9 | GO:0043515 | kinetochore binding(GO:0043515) |
| 0.2 | 1.5 | GO:0051287 | NAD binding(GO:0051287) |
| 0.2 | 0.8 | GO:0047179 | platelet-activating factor acetyltransferase activity(GO:0047179) |
| 0.1 | 0.6 | GO:0001069 | regulatory region RNA binding(GO:0001069) |
| 0.1 | 0.4 | GO:0015439 | heme-transporting ATPase activity(GO:0015439) |
| 0.1 | 0.7 | GO:0003987 | acetate-CoA ligase activity(GO:0003987) |
| 0.1 | 0.4 | GO:0016532 | superoxide dismutase copper chaperone activity(GO:0016532) |
| 0.1 | 0.4 | GO:0004017 | adenylate kinase activity(GO:0004017) |
| 0.1 | 0.6 | GO:0004180 | carboxypeptidase activity(GO:0004180) |
| 0.1 | 0.9 | GO:0004800 | thyroxine 5'-deiodinase activity(GO:0004800) |
| 0.1 | 1.0 | GO:0043813 | phosphatidylinositol-3,5-bisphosphate 5-phosphatase activity(GO:0043813) |
| 0.1 | 0.8 | GO:0070735 | protein-glycine ligase activity(GO:0070735) |
| 0.1 | 0.1 | GO:0044388 | small protein activating enzyme binding(GO:0044388) |
| 0.1 | 0.7 | GO:0047237 | glucuronylgalactosylproteoglycan 4-beta-N-acetylgalactosaminyltransferase activity(GO:0047237) |
| 0.1 | 0.4 | GO:0005137 | interleukin-5 receptor binding(GO:0005137) |
| 0.1 | 1.0 | GO:0004634 | phosphopyruvate hydratase activity(GO:0004634) |
| 0.1 | 0.3 | GO:0008449 | N-acetylglucosamine-6-sulfatase activity(GO:0008449) |
| 0.1 | 2.0 | GO:0000339 | RNA cap binding(GO:0000339) |
| 0.1 | 0.4 | GO:0032440 | 2-alkenal reductase [NAD(P)] activity(GO:0032440) |
| 0.1 | 0.5 | GO:0000822 | inositol hexakisphosphate binding(GO:0000822) |
| 0.1 | 0.1 | GO:0004045 | aminoacyl-tRNA hydrolase activity(GO:0004045) |
| 0.1 | 0.8 | GO:0031752 | D5 dopamine receptor binding(GO:0031752) |
| 0.1 | 0.7 | GO:0004523 | RNA-DNA hybrid ribonuclease activity(GO:0004523) |
| 0.1 | 4.0 | GO:0004298 | threonine-type endopeptidase activity(GO:0004298) threonine-type peptidase activity(GO:0070003) |
| 0.1 | 0.6 | GO:0016453 | C-acetyltransferase activity(GO:0016453) |
| 0.1 | 0.5 | GO:0004803 | transposase activity(GO:0004803) |
| 0.1 | 1.0 | GO:0001103 | RNA polymerase II repressing transcription factor binding(GO:0001103) |
| 0.1 | 0.4 | GO:0008330 | protein tyrosine/threonine phosphatase activity(GO:0008330) |
| 0.1 | 1.3 | GO:0052629 | phosphatidylinositol-3,5-bisphosphate 3-phosphatase activity(GO:0052629) |
| 0.1 | 3.7 | GO:0016805 | dipeptidase activity(GO:0016805) |
| 0.1 | 0.4 | GO:0070260 | tyrosyl-RNA phosphodiesterase activity(GO:0036317) 5'-tyrosyl-DNA phosphodiesterase activity(GO:0070260) |
| 0.1 | 0.4 | GO:0004020 | adenylylsulfate kinase activity(GO:0004020) sulfate adenylyltransferase activity(GO:0004779) sulfate adenylyltransferase (ATP) activity(GO:0004781) |
| 0.1 | 0.4 | GO:0035034 | histone acetyltransferase regulator activity(GO:0035034) |
| 0.1 | 0.4 | GO:0070991 | medium-chain-acyl-CoA dehydrogenase activity(GO:0070991) |
| 0.1 | 0.8 | GO:0016681 | ubiquinol-cytochrome-c reductase activity(GO:0008121) oxidoreductase activity, acting on diphenols and related substances as donors, cytochrome as acceptor(GO:0016681) |
| 0.1 | 6.9 | GO:0003755 | peptidyl-prolyl cis-trans isomerase activity(GO:0003755) |
| 0.1 | 0.4 | GO:0010698 | acetyltransferase activator activity(GO:0010698) |
| 0.1 | 0.7 | GO:0000309 | nicotinamide-nucleotide adenylyltransferase activity(GO:0000309) |
| 0.1 | 0.4 | GO:0005048 | signal sequence binding(GO:0005048) |
| 0.1 | 1.3 | GO:0031995 | insulin-like growth factor II binding(GO:0031995) |
| 0.1 | 0.7 | GO:0033989 | 3alpha,7alpha,12alpha-trihydroxy-5beta-cholest-24-enoyl-CoA hydratase activity(GO:0033989) 17-beta-hydroxysteroid dehydrogenase (NAD+) activity(GO:0044594) |
| 0.1 | 0.4 | GO:0008466 | glycogenin glucosyltransferase activity(GO:0008466) |
| 0.1 | 3.5 | GO:0005092 | GDP-dissociation inhibitor activity(GO:0005092) |
| 0.1 | 0.4 | GO:0050613 | delta14-sterol reductase activity(GO:0050613) |
| 0.1 | 0.4 | GO:0001147 | transcription termination site sequence-specific DNA binding(GO:0001147) transcription termination site DNA binding(GO:0001160) |
| 0.1 | 2.6 | GO:0004861 | cyclin-dependent protein serine/threonine kinase inhibitor activity(GO:0004861) |
| 0.1 | 0.2 | GO:0016846 | carbon-sulfur lyase activity(GO:0016846) |
| 0.1 | 0.3 | GO:0061663 | NEDD8 ligase activity(GO:0061663) |
| 0.1 | 0.6 | GO:0004348 | glucosylceramidase activity(GO:0004348) |
| 0.1 | 4.2 | GO:0017075 | syntaxin-1 binding(GO:0017075) |
| 0.1 | 1.4 | GO:0043274 | phospholipase binding(GO:0043274) |
| 0.1 | 0.1 | GO:0005119 | smoothened binding(GO:0005119) |
| 0.1 | 0.1 | GO:0004096 | catalase activity(GO:0004096) |
| 0.1 | 0.6 | GO:0004419 | hydroxymethylglutaryl-CoA lyase activity(GO:0004419) |
| 0.1 | 1.6 | GO:0005168 | neurotrophin TRKA receptor binding(GO:0005168) |
| 0.1 | 0.3 | GO:0090541 | MIT domain binding(GO:0090541) |
| 0.1 | 0.6 | GO:0016934 | extracellular-glycine-gated ion channel activity(GO:0016933) extracellular-glycine-gated chloride channel activity(GO:0016934) |
| 0.1 | 0.2 | GO:0005167 | neurotrophin TRK receptor binding(GO:0005167) |
| 0.1 | 2.7 | GO:0004707 | MAP kinase activity(GO:0004707) |
| 0.1 | 0.4 | GO:0004047 | aminomethyltransferase activity(GO:0004047) |
| 0.1 | 3.7 | GO:0030296 | protein tyrosine kinase activator activity(GO:0030296) |
| 0.1 | 0.7 | GO:0008597 | calcium-dependent protein serine/threonine phosphatase regulator activity(GO:0008597) |
| 0.1 | 0.3 | GO:0003955 | NAD(P)H dehydrogenase (quinone) activity(GO:0003955) |
| 0.1 | 0.4 | GO:0051373 | FATZ binding(GO:0051373) |
| 0.1 | 0.5 | GO:1990050 | phosphatidic acid transporter activity(GO:1990050) |
| 0.1 | 0.7 | GO:0016941 | natriuretic peptide receptor activity(GO:0016941) |
| 0.1 | 0.4 | GO:0016842 | amidine-lyase activity(GO:0016842) |
| 0.1 | 1.2 | GO:0050072 | m7G(5')pppN diphosphatase activity(GO:0050072) |
| 0.1 | 0.9 | GO:0003997 | acyl-CoA oxidase activity(GO:0003997) |
| 0.1 | 0.5 | GO:0004105 | choline-phosphate cytidylyltransferase activity(GO:0004105) |
| 0.1 | 0.9 | GO:0008568 | microtubule-severing ATPase activity(GO:0008568) |
| 0.1 | 0.1 | GO:0030145 | manganese ion binding(GO:0030145) |
| 0.1 | 0.8 | GO:0060072 | large conductance calcium-activated potassium channel activity(GO:0060072) |
| 0.1 | 0.4 | GO:0017089 | glycolipid transporter activity(GO:0017089) |
| 0.1 | 0.6 | GO:0004735 | pyrroline-5-carboxylate reductase activity(GO:0004735) |
| 0.1 | 4.7 | GO:0005484 | SNAP receptor activity(GO:0005484) |
| 0.1 | 1.9 | GO:0070273 | phosphatidylinositol-4-phosphate binding(GO:0070273) |
| 0.1 | 0.4 | GO:0016623 | aldehyde oxidase activity(GO:0004031) oxidoreductase activity, acting on the aldehyde or oxo group of donors, oxygen as acceptor(GO:0016623) |
| 0.1 | 0.6 | GO:0015137 | citrate transmembrane transporter activity(GO:0015137) tricarboxylic acid transmembrane transporter activity(GO:0015142) |
| 0.1 | 0.5 | GO:0004957 | prostaglandin E receptor activity(GO:0004957) |
| 0.1 | 2.6 | GO:0000030 | mannosyltransferase activity(GO:0000030) |
| 0.1 | 1.6 | GO:0034452 | dynactin binding(GO:0034452) |
| 0.1 | 0.3 | GO:0070888 | E-box binding(GO:0070888) |
| 0.1 | 0.3 | GO:0004676 | 3-phosphoinositide-dependent protein kinase activity(GO:0004676) |
| 0.1 | 0.1 | GO:0097642 | calcitonin family receptor activity(GO:0097642) |
| 0.1 | 0.6 | GO:0004084 | branched-chain-amino-acid transaminase activity(GO:0004084) L-leucine transaminase activity(GO:0052654) L-valine transaminase activity(GO:0052655) L-isoleucine transaminase activity(GO:0052656) |
| 0.1 | 1.1 | GO:0034062 | RNA polymerase activity(GO:0034062) |
| 0.1 | 0.7 | GO:0038085 | vascular endothelial growth factor binding(GO:0038085) |
| 0.1 | 1.0 | GO:0042731 | PH domain binding(GO:0042731) |
| 0.1 | 2.4 | GO:0017166 | vinculin binding(GO:0017166) |
| 0.1 | 0.4 | GO:0050265 | RNA uridylyltransferase activity(GO:0050265) |
| 0.1 | 1.7 | GO:0047372 | acylglycerol lipase activity(GO:0047372) |
| 0.1 | 0.6 | GO:0019209 | kinase activator activity(GO:0019209) |
| 0.1 | 0.9 | GO:0008420 | CTD phosphatase activity(GO:0008420) |
| 0.1 | 0.4 | GO:0008428 | ribonuclease inhibitor activity(GO:0008428) |
| 0.1 | 0.7 | GO:0043237 | laminin-1 binding(GO:0043237) |
| 0.1 | 0.7 | GO:0050815 | phosphoserine binding(GO:0050815) |
| 0.1 | 1.5 | GO:0005522 | profilin binding(GO:0005522) |
| 0.1 | 0.6 | GO:0016004 | phospholipase activator activity(GO:0016004) |
| 0.1 | 5.5 | GO:0008137 | NADH dehydrogenase (ubiquinone) activity(GO:0008137) NADH dehydrogenase (quinone) activity(GO:0050136) |
| 0.1 | 0.9 | GO:0003910 | DNA ligase activity(GO:0003909) DNA ligase (ATP) activity(GO:0003910) |
| 0.1 | 0.5 | GO:0004161 | dimethylallyltranstransferase activity(GO:0004161) geranyltranstransferase activity(GO:0004337) |
| 0.1 | 0.3 | GO:0019789 | SUMO transferase activity(GO:0019789) |
| 0.1 | 1.2 | GO:0000150 | recombinase activity(GO:0000150) |
| 0.1 | 0.5 | GO:0035402 | histone kinase activity (H3-T11 specific)(GO:0035402) |
| 0.1 | 0.7 | GO:0035727 | lysophosphatidic acid binding(GO:0035727) |
| 0.1 | 0.2 | GO:0035515 | oxidative RNA demethylase activity(GO:0035515) |
| 0.1 | 1.6 | GO:0004862 | cAMP-dependent protein kinase inhibitor activity(GO:0004862) |
| 0.1 | 0.5 | GO:0004647 | phosphoserine phosphatase activity(GO:0004647) |
| 0.1 | 0.4 | GO:0008079 | translation release factor activity(GO:0003747) translation termination factor activity(GO:0008079) |
| 0.1 | 0.8 | GO:0005143 | interleukin-12 receptor binding(GO:0005143) |
| 0.1 | 0.2 | GO:0043425 | bHLH transcription factor binding(GO:0043425) |
| 0.1 | 0.5 | GO:0047631 | ADP-ribose diphosphatase activity(GO:0047631) |
| 0.1 | 0.4 | GO:0044729 | hemi-methylated DNA-binding(GO:0044729) |
| 0.1 | 0.7 | GO:0046923 | ER retention sequence binding(GO:0046923) |
| 0.1 | 0.3 | GO:0004370 | glycerol kinase activity(GO:0004370) |
| 0.1 | 1.3 | GO:0004791 | thioredoxin-disulfide reductase activity(GO:0004791) |
| 0.1 | 0.9 | GO:0019531 | oxalate transmembrane transporter activity(GO:0019531) |
| 0.1 | 0.3 | GO:0032554 | purine deoxyribonucleotide binding(GO:0032554) |
| 0.1 | 0.2 | GO:0031711 | angiotensin type I receptor activity(GO:0001596) bradykinin receptor binding(GO:0031711) |
| 0.1 | 0.3 | GO:0071253 | connexin binding(GO:0071253) |
| 0.1 | 0.8 | GO:0032036 | myosin heavy chain binding(GO:0032036) |
| 0.1 | 2.4 | GO:0016922 | ligand-dependent nuclear receptor binding(GO:0016922) |
| 0.1 | 1.1 | GO:0031005 | filamin binding(GO:0031005) |
| 0.1 | 0.6 | GO:0004614 | phosphoglucomutase activity(GO:0004614) |
| 0.1 | 0.8 | GO:0004602 | glutathione peroxidase activity(GO:0004602) |
| 0.1 | 3.0 | GO:0017134 | fibroblast growth factor binding(GO:0017134) |
| 0.1 | 0.2 | GO:0004487 | methylenetetrahydrofolate dehydrogenase (NAD+) activity(GO:0004487) |
| 0.1 | 4.7 | GO:0035255 | ionotropic glutamate receptor binding(GO:0035255) |
| 0.1 | 0.2 | GO:0050254 | rhodopsin kinase activity(GO:0050254) |
| 0.1 | 1.3 | GO:0008656 | cysteine-type endopeptidase activator activity involved in apoptotic process(GO:0008656) |
| 0.1 | 1.7 | GO:0042609 | CD4 receptor binding(GO:0042609) |
| 0.1 | 7.8 | GO:0008307 | structural constituent of muscle(GO:0008307) |
| 0.1 | 0.6 | GO:0004955 | prostaglandin receptor activity(GO:0004955) |
| 0.1 | 0.1 | GO:0048408 | epidermal growth factor binding(GO:0048408) |
| 0.1 | 0.3 | GO:0016639 | oxidoreductase activity, acting on the CH-NH2 group of donors, NAD or NADP as acceptor(GO:0016639) |
| 0.1 | 0.2 | GO:0031716 | calcitonin receptor binding(GO:0031716) |
| 0.1 | 0.2 | GO:0016781 | selenide, water dikinase activity(GO:0004756) phosphotransferase activity, paired acceptors(GO:0016781) |
| 0.1 | 0.2 | GO:0010309 | acireductone dioxygenase [iron(II)-requiring] activity(GO:0010309) |
| 0.1 | 0.4 | GO:0004771 | sterol esterase activity(GO:0004771) |
| 0.1 | 1.1 | GO:0050786 | RAGE receptor binding(GO:0050786) |
| 0.1 | 0.9 | GO:0032027 | myosin light chain binding(GO:0032027) |
| 0.1 | 0.6 | GO:0046935 | 1-phosphatidylinositol-3-kinase regulator activity(GO:0046935) |
| 0.1 | 0.9 | GO:0042975 | peroxisome proliferator activated receptor binding(GO:0042975) |
| 0.1 | 0.2 | GO:0003941 | L-serine ammonia-lyase activity(GO:0003941) L-threonine ammonia-lyase activity(GO:0004794) |
| 0.1 | 2.4 | GO:0097200 | cysteine-type endopeptidase activity involved in execution phase of apoptosis(GO:0097200) |
| 0.1 | 0.4 | GO:1990460 | leptin receptor binding(GO:1990460) |
| 0.1 | 0.3 | GO:0004449 | isocitrate dehydrogenase (NAD+) activity(GO:0004449) |
| 0.1 | 1.6 | GO:0005095 | GTPase inhibitor activity(GO:0005095) |
| 0.1 | 0.3 | GO:0047751 | 3-oxo-5-alpha-steroid 4-dehydrogenase activity(GO:0003865) steroid dehydrogenase activity, acting on the CH-CH group of donors(GO:0033765) cholestenone 5-alpha-reductase activity(GO:0047751) |
| 0.1 | 0.2 | GO:0036313 | phosphatidylinositol 3-kinase catalytic subunit binding(GO:0036313) |
| 0.1 | 0.3 | GO:0043398 | HLH domain binding(GO:0043398) |
| 0.1 | 1.6 | GO:0043495 | protein anchor(GO:0043495) |
| 0.1 | 1.0 | GO:0000062 | fatty-acyl-CoA binding(GO:0000062) |
| 0.1 | 1.6 | GO:0045504 | dynein heavy chain binding(GO:0045504) |
| 0.1 | 0.7 | GO:0004689 | phosphorylase kinase activity(GO:0004689) |
| 0.1 | 0.1 | GO:0035514 | DNA demethylase activity(GO:0035514) |
| 0.1 | 1.8 | GO:0070008 | serine-type exopeptidase activity(GO:0070008) |
| 0.1 | 1.9 | GO:0017160 | Ral GTPase binding(GO:0017160) |
| 0.1 | 0.6 | GO:0034597 | phosphatidylinositol-4,5-bisphosphate 4-phosphatase activity(GO:0034597) |
| 0.1 | 0.3 | GO:0035663 | Toll-like receptor 2 binding(GO:0035663) |
| 0.1 | 2.3 | GO:0030374 | ligand-dependent nuclear receptor transcription coactivator activity(GO:0030374) |
| 0.1 | 0.3 | GO:0008179 | adenylate cyclase binding(GO:0008179) |
| 0.1 | 0.6 | GO:0016724 | ferroxidase activity(GO:0004322) oxidoreductase activity, oxidizing metal ions, oxygen as acceptor(GO:0016724) |
| 0.1 | 0.4 | GO:0051870 | methotrexate binding(GO:0051870) |
| 0.1 | 2.0 | GO:0004550 | nucleoside diphosphate kinase activity(GO:0004550) |
| 0.1 | 0.3 | GO:0044378 | non-sequence-specific DNA binding, bending(GO:0044378) |
| 0.1 | 0.2 | GO:0000253 | 3-keto sterol reductase activity(GO:0000253) |
| 0.1 | 0.3 | GO:0034057 | RNA strand-exchange activity(GO:0034057) |
| 0.1 | 0.4 | GO:0004471 | malic enzyme activity(GO:0004470) malate dehydrogenase (decarboxylating) (NAD+) activity(GO:0004471) malate dehydrogenase (decarboxylating) (NADP+) activity(GO:0004473) |
| 0.1 | 3.2 | GO:0032266 | phosphatidylinositol-3-phosphate binding(GO:0032266) |
| 0.1 | 0.3 | GO:0042954 | lipoprotein transporter activity(GO:0042954) |
| 0.1 | 0.2 | GO:0052894 | norspermine:oxygen oxidoreductase activity(GO:0052894) N1-acetylspermine:oxygen oxidoreductase (N1-acetylspermidine-forming) activity(GO:0052895) |
| 0.1 | 0.3 | GO:0004594 | pantothenate kinase activity(GO:0004594) |
| 0.1 | 0.1 | GO:0015929 | hexosaminidase activity(GO:0015929) |
| 0.1 | 0.3 | GO:0004774 | succinate-CoA ligase activity(GO:0004774) |
| 0.1 | 0.6 | GO:0008379 | thioredoxin peroxidase activity(GO:0008379) |
| 0.1 | 0.4 | GO:0036312 | phosphatidylinositol 3-kinase regulatory subunit binding(GO:0036312) |
| 0.1 | 0.2 | GO:0034739 | histone deacetylase activity (H4-K16 specific)(GO:0034739) |
| 0.1 | 2.3 | GO:0016798 | hydrolase activity, acting on glycosyl bonds(GO:0016798) |
| 0.1 | 0.5 | GO:0005087 | Ran guanyl-nucleotide exchange factor activity(GO:0005087) |
| 0.1 | 0.7 | GO:0051371 | muscle alpha-actinin binding(GO:0051371) |
| 0.1 | 0.7 | GO:0009374 | biotin binding(GO:0009374) |
| 0.1 | 2.3 | GO:0071889 | 14-3-3 protein binding(GO:0071889) |
| 0.1 | 0.3 | GO:0008665 | 2'-phosphotransferase activity(GO:0008665) |
| 0.1 | 0.5 | GO:0001517 | N-acetylglucosamine 6-O-sulfotransferase activity(GO:0001517) |
| 0.1 | 0.2 | GO:0004019 | adenylosuccinate synthase activity(GO:0004019) |
| 0.1 | 0.2 | GO:0003983 | UTP:glucose-1-phosphate uridylyltransferase activity(GO:0003983) UTP-monosaccharide-1-phosphate uridylyltransferase activity(GO:0051748) |
| 0.1 | 0.2 | GO:0016155 | formyltetrahydrofolate dehydrogenase activity(GO:0016155) |
| 0.1 | 0.1 | GO:0019787 | ubiquitin-like protein transferase activity(GO:0019787) |
| 0.1 | 0.4 | GO:0016538 | cyclin-dependent protein serine/threonine kinase regulator activity(GO:0016538) |
| 0.1 | 0.3 | GO:0004748 | ribonucleoside-diphosphate reductase activity, thioredoxin disulfide as acceptor(GO:0004748) oxidoreductase activity, acting on CH or CH2 groups, disulfide as acceptor(GO:0016728) ribonucleoside-diphosphate reductase activity(GO:0061731) |
| 0.1 | 0.2 | GO:1903135 | cupric ion binding(GO:1903135) |
| 0.1 | 0.3 | GO:0030346 | protein phosphatase 2B binding(GO:0030346) |
| 0.1 | 4.2 | GO:0017112 | Rab guanyl-nucleotide exchange factor activity(GO:0017112) |
| 0.1 | 1.3 | GO:0051537 | 2 iron, 2 sulfur cluster binding(GO:0051537) |
| 0.1 | 0.4 | GO:0008273 | calcium, potassium:sodium antiporter activity(GO:0008273) |
| 0.1 | 0.2 | GO:0004139 | deoxyribose-phosphate aldolase activity(GO:0004139) |
| 0.1 | 0.5 | GO:0004630 | phospholipase D activity(GO:0004630) |
| 0.1 | 0.2 | GO:0031871 | proteinase activated receptor binding(GO:0031871) |
| 0.1 | 0.8 | GO:0050998 | nitric-oxide synthase binding(GO:0050998) |
| 0.1 | 2.5 | GO:0044390 | ubiquitin-like protein conjugating enzyme binding(GO:0044390) |
| 0.1 | 0.7 | GO:0022821 | potassium:proton antiporter activity(GO:0015386) potassium ion antiporter activity(GO:0022821) |
| 0.1 | 0.5 | GO:0070742 | C2H2 zinc finger domain binding(GO:0070742) |
| 0.1 | 0.3 | GO:0004468 | lysine N-acetyltransferase activity, acting on acetyl phosphate as donor(GO:0004468) |
| 0.1 | 0.4 | GO:0008318 | protein prenyltransferase activity(GO:0008318) |
| 0.1 | 0.1 | GO:0098639 | collagen binding involved in cell-matrix adhesion(GO:0098639) |
| 0.1 | 0.2 | GO:0003988 | acetyl-CoA C-acyltransferase activity(GO:0003988) |
| 0.1 | 0.2 | GO:0004694 | eukaryotic translation initiation factor 2alpha kinase activity(GO:0004694) |
| 0.1 | 0.1 | GO:0035197 | siRNA binding(GO:0035197) |
| 0.1 | 0.2 | GO:0019981 | interleukin-6 receptor activity(GO:0004915) interleukin-6 binding(GO:0019981) |
| 0.1 | 0.5 | GO:0004849 | uridine kinase activity(GO:0004849) |
| 0.1 | 0.3 | GO:0097100 | supercoiled DNA binding(GO:0097100) |
| 0.1 | 0.1 | GO:0043532 | angiostatin binding(GO:0043532) |
| 0.1 | 0.3 | GO:0050253 | retinyl-palmitate esterase activity(GO:0050253) |
| 0.1 | 0.1 | GO:0005171 | hepatocyte growth factor receptor binding(GO:0005171) |
| 0.1 | 0.3 | GO:0042030 | ATPase inhibitor activity(GO:0042030) |
| 0.1 | 0.5 | GO:0008553 | hydrogen-exporting ATPase activity, phosphorylative mechanism(GO:0008553) |
| 0.1 | 0.1 | GO:0042903 | tubulin deacetylase activity(GO:0042903) |
| 0.1 | 0.5 | GO:0045159 | myosin II binding(GO:0045159) |
| 0.1 | 1.5 | GO:0046933 | proton-transporting ATP synthase activity, rotational mechanism(GO:0046933) |
| 0.1 | 0.2 | GO:0005124 | scavenger receptor binding(GO:0005124) |
| 0.1 | 1.1 | GO:0008013 | beta-catenin binding(GO:0008013) |
| 0.1 | 1.9 | GO:0004709 | MAP kinase kinase kinase activity(GO:0004709) |
| 0.1 | 0.2 | GO:0031731 | CCR6 chemokine receptor binding(GO:0031731) |
| 0.1 | 0.4 | GO:0035005 | 1-phosphatidylinositol-4-phosphate 3-kinase activity(GO:0035005) |
| 0.1 | 0.6 | GO:0030371 | translation repressor activity(GO:0030371) |
| 0.1 | 7.0 | GO:0008565 | protein transporter activity(GO:0008565) |
| 0.1 | 0.2 | GO:0071566 | UFM1 activating enzyme activity(GO:0071566) |
| 0.1 | 0.2 | GO:0005176 | ErbB-2 class receptor binding(GO:0005176) |
| 0.1 | 0.2 | GO:0004382 | guanosine-diphosphatase activity(GO:0004382) |
| 0.1 | 0.2 | GO:0005477 | pyruvate secondary active transmembrane transporter activity(GO:0005477) |
| 0.1 | 0.5 | GO:0043024 | ribosomal small subunit binding(GO:0043024) |
| 0.1 | 0.9 | GO:0004559 | alpha-mannosidase activity(GO:0004559) |
| 0.1 | 0.5 | GO:0035312 | 5'-3' exodeoxyribonuclease activity(GO:0035312) |
| 0.1 | 0.7 | GO:0004028 | 3-chloroallyl aldehyde dehydrogenase activity(GO:0004028) |
| 0.1 | 0.2 | GO:0004960 | thromboxane receptor activity(GO:0004960) thromboxane A2 receptor activity(GO:0004961) |
| 0.1 | 0.5 | GO:0034513 | box H/ACA snoRNA binding(GO:0034513) |
| 0.1 | 0.7 | GO:0019826 | oxygen sensor activity(GO:0019826) |
| 0.1 | 1.5 | GO:0000900 | translation repressor activity, nucleic acid binding(GO:0000900) |
| 0.1 | 0.3 | GO:0043022 | ribosome binding(GO:0043022) |
| 0.1 | 0.2 | GO:0008384 | IkappaB kinase activity(GO:0008384) |
| 0.0 | 0.2 | GO:0008508 | bile acid:sodium symporter activity(GO:0008508) |
| 0.0 | 0.1 | GO:0016715 | oxidoreductase activity, acting on paired donors, with incorporation or reduction of molecular oxygen, reduced ascorbate as one donor, and incorporation of one atom of oxygen(GO:0016715) |
| 0.0 | 0.9 | GO:0005521 | lamin binding(GO:0005521) |
| 0.0 | 0.2 | GO:0050693 | LBD domain binding(GO:0050693) |
| 0.0 | 1.7 | GO:0003785 | actin monomer binding(GO:0003785) |
| 0.0 | 0.2 | GO:0003896 | DNA primase activity(GO:0003896) |
| 0.0 | 0.7 | GO:0031681 | G-protein beta-subunit binding(GO:0031681) |
| 0.0 | 0.7 | GO:0008409 | 5'-3' exonuclease activity(GO:0008409) |
| 0.0 | 1.2 | GO:0035497 | cAMP response element binding(GO:0035497) |
| 0.0 | 0.2 | GO:0004999 | vasoactive intestinal polypeptide receptor activity(GO:0004999) |
| 0.0 | 0.2 | GO:0050833 | pyruvate transmembrane transporter activity(GO:0050833) |
| 0.0 | 0.1 | GO:0036137 | kynurenine-oxoglutarate transaminase activity(GO:0016212) kynurenine aminotransferase activity(GO:0036137) |
| 0.0 | 0.3 | GO:0001165 | RNA polymerase I upstream control element sequence-specific DNA binding(GO:0001165) |
| 0.0 | 0.2 | GO:0004667 | prostaglandin-D synthase activity(GO:0004667) |
| 0.0 | 0.1 | GO:0070653 | high-density lipoprotein particle receptor binding(GO:0070653) |
| 0.0 | 1.0 | GO:0019992 | diacylglycerol binding(GO:0019992) |
| 0.0 | 0.3 | GO:0032138 | single base insertion or deletion binding(GO:0032138) |
| 0.0 | 0.1 | GO:0003954 | NADH dehydrogenase activity(GO:0003954) |
| 0.0 | 0.4 | GO:0043199 | sulfate binding(GO:0043199) |
| 0.0 | 0.1 | GO:0000980 | RNA polymerase II distal enhancer sequence-specific DNA binding(GO:0000980) |
| 0.0 | 0.2 | GO:0015189 | L-lysine transmembrane transporter activity(GO:0015189) |
| 0.0 | 0.5 | GO:0046790 | virion binding(GO:0046790) |
| 0.0 | 0.8 | GO:0036374 | glutathione hydrolase activity(GO:0036374) |
| 0.0 | 0.3 | GO:0015272 | ATP-activated inward rectifier potassium channel activity(GO:0015272) |
| 0.0 | 0.8 | GO:0003730 | mRNA 3'-UTR binding(GO:0003730) |
| 0.0 | 0.3 | GO:0051033 | nucleic acid transmembrane transporter activity(GO:0051032) RNA transmembrane transporter activity(GO:0051033) |
| 0.0 | 0.2 | GO:0023024 | MHC class I protein complex binding(GO:0023024) |
| 0.0 | 0.1 | GO:0004157 | dihydropyrimidinase activity(GO:0004157) |
| 0.0 | 0.3 | GO:0004725 | protein tyrosine phosphatase activity(GO:0004725) |
| 0.0 | 0.4 | GO:0005004 | GPI-linked ephrin receptor activity(GO:0005004) |
| 0.0 | 1.0 | GO:0043395 | heparan sulfate proteoglycan binding(GO:0043395) |
| 0.0 | 0.2 | GO:0034236 | protein kinase A catalytic subunit binding(GO:0034236) |
| 0.0 | 0.3 | GO:0016721 | superoxide dismutase activity(GO:0004784) oxidoreductase activity, acting on superoxide radicals as acceptor(GO:0016721) |
| 0.0 | 0.1 | GO:0033149 | FFAT motif binding(GO:0033149) |
| 0.0 | 0.1 | GO:0030627 | pre-mRNA 5'-splice site binding(GO:0030627) |
| 0.0 | 2.8 | GO:0002039 | p53 binding(GO:0002039) |
| 0.0 | 10.2 | GO:0003735 | structural constituent of ribosome(GO:0003735) |
| 0.0 | 1.1 | GO:0050750 | low-density lipoprotein particle receptor binding(GO:0050750) |
| 0.0 | 0.2 | GO:0031727 | CCR2 chemokine receptor binding(GO:0031727) |
| 0.0 | 0.1 | GO:0004140 | dephospho-CoA kinase activity(GO:0004140) |
| 0.0 | 0.1 | GO:0004923 | leukemia inhibitory factor receptor activity(GO:0004923) |
| 0.0 | 0.3 | GO:1990829 | C-rich single-stranded DNA binding(GO:1990829) |
| 0.0 | 0.3 | GO:0004499 | N,N-dimethylaniline monooxygenase activity(GO:0004499) |
| 0.0 | 0.7 | GO:0050681 | androgen receptor binding(GO:0050681) |
| 0.0 | 0.2 | GO:0004430 | 1-phosphatidylinositol 4-kinase activity(GO:0004430) |
| 0.0 | 1.0 | GO:0097602 | cullin family protein binding(GO:0097602) |
| 0.0 | 1.2 | GO:0003887 | DNA-directed DNA polymerase activity(GO:0003887) |
| 0.0 | 0.2 | GO:0016499 | orexin receptor activity(GO:0016499) |
| 0.0 | 1.0 | GO:0008301 | DNA binding, bending(GO:0008301) |
| 0.0 | 0.6 | GO:0045236 | CXCR chemokine receptor binding(GO:0045236) |
| 0.0 | 0.1 | GO:1901567 | icosanoid binding(GO:0050542) fatty acid derivative binding(GO:1901567) |
| 0.0 | 1.1 | GO:0005086 | ARF guanyl-nucleotide exchange factor activity(GO:0005086) |
| 0.0 | 0.2 | GO:0001849 | complement component C1q binding(GO:0001849) |
| 0.0 | 0.2 | GO:0004616 | phosphogluconate dehydrogenase (decarboxylating) activity(GO:0004616) |
| 0.0 | 0.4 | GO:0047499 | calcium-independent phospholipase A2 activity(GO:0047499) |
| 0.0 | 0.8 | GO:0070300 | phosphatidic acid binding(GO:0070300) |
| 0.0 | 0.3 | GO:0061133 | endopeptidase activator activity(GO:0061133) |
| 0.0 | 0.1 | GO:0008410 | CoA-transferase activity(GO:0008410) |
| 0.0 | 0.7 | GO:0001965 | G-protein alpha-subunit binding(GO:0001965) |
| 0.0 | 0.3 | GO:0004969 | histamine receptor activity(GO:0004969) |
| 0.0 | 0.2 | GO:0004359 | glutaminase activity(GO:0004359) |
| 0.0 | 0.2 | GO:0097604 | temperature-gated cation channel activity(GO:0097604) |
| 0.0 | 0.1 | GO:0045134 | uridine-diphosphatase activity(GO:0045134) |
| 0.0 | 0.2 | GO:0042289 | MHC class II protein binding(GO:0042289) |
| 0.0 | 0.2 | GO:0035035 | histone acetyltransferase binding(GO:0035035) |
| 0.0 | 1.3 | GO:0000993 | RNA polymerase II core binding(GO:0000993) |
| 0.0 | 2.6 | GO:0061733 | peptide-lysine-N-acetyltransferase activity(GO:0061733) |
| 0.0 | 0.9 | GO:0004653 | polypeptide N-acetylgalactosaminyltransferase activity(GO:0004653) |
| 0.0 | 0.2 | GO:0001162 | RNA polymerase II intronic transcription regulatory region sequence-specific DNA binding(GO:0001162) |
| 0.0 | 0.5 | GO:0022851 | GABA-gated chloride ion channel activity(GO:0022851) |
| 0.0 | 0.1 | GO:0004310 | farnesyl-diphosphate farnesyltransferase activity(GO:0004310) squalene synthase activity(GO:0051996) |
| 0.0 | 0.2 | GO:0022858 | L-alanine transmembrane transporter activity(GO:0015180) alanine transmembrane transporter activity(GO:0022858) |
| 0.0 | 1.6 | GO:0004364 | glutathione transferase activity(GO:0004364) |
| 0.0 | 1.2 | GO:0003950 | NAD+ ADP-ribosyltransferase activity(GO:0003950) |
| 0.0 | 0.9 | GO:0016854 | racemase and epimerase activity(GO:0016854) |
| 0.0 | 0.3 | GO:0034979 | NAD-dependent histone deacetylase activity(GO:0017136) NAD-dependent protein deacetylase activity(GO:0034979) |
| 0.0 | 0.1 | GO:0005136 | interleukin-4 receptor binding(GO:0005136) |
| 0.0 | 0.1 | GO:0034618 | arginine binding(GO:0034618) |
| 0.0 | 0.4 | GO:0004332 | fructose-bisphosphate aldolase activity(GO:0004332) |
| 0.0 | 0.1 | GO:0010858 | calcium-dependent protein kinase regulator activity(GO:0010858) |
| 0.0 | 0.1 | GO:0004450 | isocitrate dehydrogenase (NADP+) activity(GO:0004450) |
| 0.0 | 0.1 | GO:0001716 | L-amino-acid oxidase activity(GO:0001716) |
| 0.0 | 0.6 | GO:0036442 | hydrogen-exporting ATPase activity(GO:0036442) ATPase activity, coupled to transmembrane movement of ions, rotational mechanism(GO:0044769) proton-transporting ATPase activity, rotational mechanism(GO:0046961) |
| 0.0 | 0.1 | GO:0004351 | glutamate decarboxylase activity(GO:0004351) |
| 0.0 | 1.1 | GO:0019200 | carbohydrate kinase activity(GO:0019200) |
| 0.0 | 0.1 | GO:0047783 | steroid 11-beta-monooxygenase activity(GO:0004507) corticosterone 18-monooxygenase activity(GO:0047783) |
| 0.0 | 2.1 | GO:0048306 | calcium-dependent protein binding(GO:0048306) |
| 0.0 | 0.1 | GO:0035241 | protein-arginine omega-N monomethyltransferase activity(GO:0035241) |
| 0.0 | 0.0 | GO:0016701 | oxidoreductase activity, acting on single donors with incorporation of molecular oxygen(GO:0016701) |
| 0.0 | 0.1 | GO:0031852 | mu-type opioid receptor binding(GO:0031852) |
| 0.0 | 0.2 | GO:1902444 | riboflavin binding(GO:1902444) |
| 0.0 | 0.8 | GO:0048487 | beta-tubulin binding(GO:0048487) |
| 0.0 | 0.4 | GO:0005246 | calcium channel regulator activity(GO:0005246) |
| 0.0 | 0.2 | GO:0047844 | deoxycytidine deaminase activity(GO:0047844) |
| 0.0 | 0.1 | GO:0008478 | pyridoxal kinase activity(GO:0008478) lithium ion binding(GO:0031403) |
| 0.0 | 1.0 | GO:0005159 | insulin-like growth factor receptor binding(GO:0005159) |
| 0.0 | 0.1 | GO:0098640 | integrin binding involved in cell-matrix adhesion(GO:0098640) |
| 0.0 | 0.2 | GO:1990825 | sequence-specific mRNA binding(GO:1990825) |
| 0.0 | 0.3 | GO:0042805 | actinin binding(GO:0042805) |
| 0.0 | 0.9 | GO:0008191 | metalloendopeptidase inhibitor activity(GO:0008191) |
| 0.0 | 0.3 | GO:0003857 | 3-hydroxyacyl-CoA dehydrogenase activity(GO:0003857) |
| 0.0 | 7.1 | GO:0051015 | actin filament binding(GO:0051015) |
| 0.0 | 0.1 | GO:0052590 | sn-glycerol-3-phosphate:ubiquinone oxidoreductase activity(GO:0052590) sn-glycerol-3-phosphate:ubiquinone-8 oxidoreductase activity(GO:0052591) |
| 0.0 | 0.1 | GO:0005330 | dopamine:sodium symporter activity(GO:0005330) |
| 0.0 | 0.1 | GO:0052839 | inositol 5-diphosphate pentakisphosphate 5-kinase activity(GO:0052836) inositol diphosphate tetrakisphosphate kinase activity(GO:0052839) |
| 0.0 | 0.2 | GO:0061676 | importin-alpha family protein binding(GO:0061676) |
| 0.0 | 0.3 | GO:0031698 | beta-2 adrenergic receptor binding(GO:0031698) |
| 0.0 | 0.5 | GO:0005537 | mannose binding(GO:0005537) |
| 0.0 | 0.1 | GO:0009378 | four-way junction helicase activity(GO:0009378) |
| 0.0 | 0.3 | GO:0032190 | acrosin binding(GO:0032190) |
| 0.0 | 0.2 | GO:0001223 | transcription coactivator binding(GO:0001223) |
| 0.0 | 0.1 | GO:0008112 | nicotinamide N-methyltransferase activity(GO:0008112) pyridine N-methyltransferase activity(GO:0030760) |
| 0.0 | 0.1 | GO:0042799 | histone methyltransferase activity (H4-K20 specific)(GO:0042799) |
| 0.0 | 0.1 | GO:0051538 | 3 iron, 4 sulfur cluster binding(GO:0051538) |
| 0.0 | 0.4 | GO:0004568 | chitinase activity(GO:0004568) |
| 0.0 | 0.1 | GO:0046870 | cadmium ion binding(GO:0046870) |
| 0.0 | 1.6 | GO:0061650 | ubiquitin-like protein conjugating enzyme activity(GO:0061650) |
| 0.0 | 0.1 | GO:0043125 | ErbB-3 class receptor binding(GO:0043125) |
| 0.0 | 0.2 | GO:0071933 | Arp2/3 complex binding(GO:0071933) |
| 0.0 | 5.1 | GO:0003714 | transcription corepressor activity(GO:0003714) |
| 0.0 | 0.2 | GO:0090554 | phosphatidylcholine-translocating ATPase activity(GO:0090554) |
| 0.0 | 0.3 | GO:0003707 | steroid hormone receptor activity(GO:0003707) |
| 0.0 | 0.1 | GO:0035877 | death effector domain binding(GO:0035877) |
| 0.0 | 0.1 | GO:0047298 | 4-aminobutyrate transaminase activity(GO:0003867) succinate-semialdehyde dehydrogenase binding(GO:0032145) (S)-3-amino-2-methylpropionate transaminase activity(GO:0047298) |
| 0.0 | 0.0 | GO:0036041 | long-chain fatty acid binding(GO:0036041) |
| 0.0 | 0.2 | GO:0004522 | ribonuclease A activity(GO:0004522) |
| 0.0 | 0.4 | GO:0030618 | transforming growth factor beta receptor, pathway-specific cytoplasmic mediator activity(GO:0030618) |
| 0.0 | 0.2 | GO:0043184 | vascular endothelial growth factor receptor 2 binding(GO:0043184) |
| 0.0 | 0.0 | GO:0005310 | dicarboxylic acid transmembrane transporter activity(GO:0005310) |
| 0.0 | 0.3 | GO:0032794 | GTPase activating protein binding(GO:0032794) |
| 0.0 | 0.6 | GO:0070530 | K63-linked polyubiquitin binding(GO:0070530) |
| 0.0 | 0.0 | GO:0018479 | benzaldehyde dehydrogenase (NAD+) activity(GO:0018479) |
| 0.0 | 0.1 | GO:0045518 | interleukin-22 receptor binding(GO:0045518) |
| 0.0 | 0.1 | GO:0032422 | purine-rich negative regulatory element binding(GO:0032422) |
| 0.0 | 0.1 | GO:0031685 | adenosine receptor binding(GO:0031685) |
| 0.0 | 0.1 | GO:0008479 | queuine tRNA-ribosyltransferase activity(GO:0008479) |
| 0.0 | 0.4 | GO:0045295 | gamma-catenin binding(GO:0045295) |
| 0.0 | 0.2 | GO:0004873 | asialoglycoprotein receptor activity(GO:0004873) |
| 0.0 | 0.8 | GO:0031489 | myosin V binding(GO:0031489) |
| 0.0 | 0.3 | GO:0004551 | nucleotide diphosphatase activity(GO:0004551) |
| 0.0 | 1.9 | GO:0001076 | transcription factor activity, RNA polymerase II transcription factor binding(GO:0001076) |
| 0.0 | 0.1 | GO:0033743 | peptide-methionine (R)-S-oxide reductase activity(GO:0033743) |
| 0.0 | 0.4 | GO:1990247 | N6-methyladenosine-containing RNA binding(GO:1990247) |
| 0.0 | 0.1 | GO:0050698 | proteoglycan sulfotransferase activity(GO:0050698) |
| 0.0 | 0.1 | GO:0001512 | dihydronicotinamide riboside quinone reductase activity(GO:0001512) melatonin binding(GO:1904408) |
| 0.0 | 0.4 | GO:0008140 | cAMP response element binding protein binding(GO:0008140) |
| 0.0 | 1.6 | GO:0008138 | protein tyrosine/serine/threonine phosphatase activity(GO:0008138) |
| 0.0 | 0.1 | GO:0004514 | nicotinate-nucleotide diphosphorylase (carboxylating) activity(GO:0004514) |
| 0.0 | 0.1 | GO:0016812 | hydrolase activity, acting on carbon-nitrogen (but not peptide) bonds, in cyclic amides(GO:0016812) |
| 0.0 | 0.3 | GO:0008235 | metalloexopeptidase activity(GO:0008235) |
| 0.0 | 0.2 | GO:0001075 | transcription factor activity, RNA polymerase II core promoter sequence-specific binding involved in preinitiation complex assembly(GO:0001075) |
| 0.0 | 1.3 | GO:0050699 | WW domain binding(GO:0050699) |
| 0.0 | 0.1 | GO:0070569 | uridylyltransferase activity(GO:0070569) |
| 0.0 | 0.2 | GO:0070491 | repressing transcription factor binding(GO:0070491) |
| 0.0 | 0.1 | GO:0030158 | protein xylosyltransferase activity(GO:0030158) |
| 0.0 | 0.2 | GO:0003960 | NADPH:quinone reductase activity(GO:0003960) |
| 0.0 | 0.2 | GO:0016300 | tRNA (uracil) methyltransferase activity(GO:0016300) |
| 0.0 | 0.1 | GO:0000386 | second spliceosomal transesterification activity(GO:0000386) |
| 0.0 | 0.1 | GO:0004677 | DNA-dependent protein kinase activity(GO:0004677) |
| 0.0 | 0.1 | GO:0050501 | hyaluronan synthase activity(GO:0050501) |
| 0.0 | 0.1 | GO:0004998 | transferrin receptor activity(GO:0004998) |
| 0.0 | 1.1 | GO:0005546 | phosphatidylinositol-4,5-bisphosphate binding(GO:0005546) |
| 0.0 | 0.0 | GO:0016018 | cyclosporin A binding(GO:0016018) |
| 0.0 | 0.1 | GO:0086077 | gap junction channel activity involved in AV node cell-bundle of His cell electrical coupling(GO:0086077) |
| 0.0 | 0.1 | GO:0032052 | bile acid binding(GO:0032052) |
| 0.0 | 0.2 | GO:0043422 | protein kinase B binding(GO:0043422) |
| 0.0 | 0.1 | GO:0001515 | opioid peptide activity(GO:0001515) |
| 0.0 | 0.2 | GO:0003958 | NADPH-hemoprotein reductase activity(GO:0003958) |
| 0.0 | 0.2 | GO:0005161 | platelet-derived growth factor receptor binding(GO:0005161) |
| 0.0 | 0.2 | GO:0048156 | tau protein binding(GO:0048156) |
| 0.0 | 0.1 | GO:0003835 | beta-galactoside alpha-2,6-sialyltransferase activity(GO:0003835) |
| 0.0 | 0.1 | GO:0071207 | histone pre-mRNA stem-loop binding(GO:0071207) |
| 0.0 | 0.1 | GO:0004611 | phosphoenolpyruvate carboxykinase activity(GO:0004611) phosphoenolpyruvate carboxykinase (GTP) activity(GO:0004613) |
| 0.0 | 0.1 | GO:0043120 | tumor necrosis factor binding(GO:0043120) |
| 0.0 | 0.1 | GO:0000104 | succinate dehydrogenase activity(GO:0000104) |
| 0.0 | 0.1 | GO:0004505 | phenylalanine 4-monooxygenase activity(GO:0004505) |
| 0.0 | 0.1 | GO:0052596 | tryptamine:oxygen oxidoreductase (deaminating) activity(GO:0052593) aminoacetone:oxygen oxidoreductase(deaminating) activity(GO:0052594) aliphatic-amine oxidase activity(GO:0052595) phenethylamine:oxygen oxidoreductase (deaminating) activity(GO:0052596) |
| 0.0 | 0.3 | GO:0030911 | TPR domain binding(GO:0030911) |
| 0.0 | 0.5 | GO:0000979 | RNA polymerase II core promoter sequence-specific DNA binding(GO:0000979) |
| 0.0 | 0.2 | GO:0008109 | N-acetyllactosaminide beta-1,6-N-acetylglucosaminyltransferase activity(GO:0008109) |
| 0.0 | 0.1 | GO:0030197 | extracellular matrix constituent, lubricant activity(GO:0030197) |
| 0.0 | 0.1 | GO:0015129 | lactate transmembrane transporter activity(GO:0015129) |
| 0.0 | 0.1 | GO:0005057 | receptor signaling protein activity(GO:0005057) |
| 0.0 | 0.0 | GO:0051430 | corticotropin-releasing hormone receptor 1 binding(GO:0051430) |
| 0.0 | 0.3 | GO:0017154 | semaphorin receptor activity(GO:0017154) |
| 0.0 | 0.1 | GO:0015207 | ATP:ADP antiporter activity(GO:0005471) adenine transmembrane transporter activity(GO:0015207) |
| 0.0 | 0.1 | GO:0015220 | choline transmembrane transporter activity(GO:0015220) |
| 0.0 | 0.2 | GO:0050733 | RS domain binding(GO:0050733) |
| 0.0 | 0.2 | GO:0097371 | MDM2/MDM4 family protein binding(GO:0097371) |
| 0.0 | 0.2 | GO:0035198 | miRNA binding(GO:0035198) |
| 0.0 | 37.8 | GO:0003700 | nucleic acid binding transcription factor activity(GO:0001071) transcription factor activity, sequence-specific DNA binding(GO:0003700) |
| 0.0 | 0.1 | GO:0030957 | Tat protein binding(GO:0030957) |
| 0.0 | 0.7 | GO:0005547 | phosphatidylinositol-3,4,5-trisphosphate binding(GO:0005547) |
| 0.0 | 0.1 | GO:0008312 | 7S RNA binding(GO:0008312) |
| 0.0 | 0.2 | GO:0033192 | calmodulin-dependent protein phosphatase activity(GO:0033192) |
| 0.0 | 0.2 | GO:0004032 | alditol:NADP+ 1-oxidoreductase activity(GO:0004032) |
| 0.0 | 8.6 | GO:0030695 | GTPase regulator activity(GO:0030695) |
| 0.0 | 0.1 | GO:0017050 | sphinganine kinase activity(GO:0008481) D-erythro-sphingosine kinase activity(GO:0017050) |
| 0.0 | 0.6 | GO:0005520 | insulin-like growth factor binding(GO:0005520) |
| 0.0 | 0.1 | GO:0008502 | melatonin receptor activity(GO:0008502) |
| 0.0 | 0.4 | GO:0031418 | L-ascorbic acid binding(GO:0031418) |
| 0.0 | 0.1 | GO:0008073 | ornithine decarboxylase inhibitor activity(GO:0008073) |
| 0.0 | 0.1 | GO:0005324 | long-chain fatty acid transporter activity(GO:0005324) |
| 0.0 | 0.1 | GO:0001102 | RNA polymerase II activating transcription factor binding(GO:0001102) |
| 0.0 | 0.3 | GO:0019887 | protein kinase regulator activity(GO:0019887) |
| 0.0 | 0.0 | GO:1904315 | neurotransmitter receptor activity involved in regulation of postsynaptic membrane potential(GO:0099529) transmitter-gated ion channel activity involved in regulation of postsynaptic membrane potential(GO:1904315) |
| 0.0 | 0.1 | GO:0070883 | pre-miRNA binding(GO:0070883) |
| 0.0 | 0.0 | GO:0030337 | DNA polymerase processivity factor activity(GO:0030337) |
| 0.0 | 0.1 | GO:0004830 | tryptophan-tRNA ligase activity(GO:0004830) |
| 0.0 | 0.0 | GO:0004167 | dopachrome isomerase activity(GO:0004167) |
| 0.0 | 0.1 | GO:0003953 | NAD+ nucleosidase activity(GO:0003953) NAD(P)+ nucleosidase activity(GO:0050135) |
| 0.0 | 0.2 | GO:0043548 | phosphatidylinositol 3-kinase binding(GO:0043548) |
| 0.0 | 0.1 | GO:0035673 | oligopeptide transmembrane transporter activity(GO:0035673) |
| 0.0 | 0.3 | GO:0031683 | G-protein beta/gamma-subunit complex binding(GO:0031683) |
| 0.0 | 0.1 | GO:0008808 | cardiolipin synthase activity(GO:0008808) phosphatidyltransferase activity(GO:0030572) CDP-diacylglycerol-phosphatidylglycerol phosphatidyltransferase activity(GO:0043337) |
| 0.0 | 1.2 | GO:0031072 | heat shock protein binding(GO:0031072) |
| 0.0 | 0.1 | GO:0031433 | telethonin binding(GO:0031433) |
| 0.0 | 1.7 | GO:0047485 | protein N-terminus binding(GO:0047485) |
| 0.0 | 0.4 | GO:0005402 | sugar:proton symporter activity(GO:0005351) cation:sugar symporter activity(GO:0005402) |
| 0.0 | 0.1 | GO:0031849 | olfactory receptor binding(GO:0031849) |
| 0.0 | 0.1 | GO:0016866 | intramolecular transferase activity(GO:0016866) |
| 0.0 | 0.1 | GO:0008453 | alanine-glyoxylate transaminase activity(GO:0008453) |
| 0.0 | 1.8 | GO:0019903 | protein phosphatase binding(GO:0019903) |
| 0.0 | 0.2 | GO:0042043 | neurexin family protein binding(GO:0042043) |
| 0.0 | 0.2 | GO:0015187 | glycine transmembrane transporter activity(GO:0015187) |
| 0.0 | 0.1 | GO:0004704 | NF-kappaB-inducing kinase activity(GO:0004704) |
| 0.0 | 0.1 | GO:0047696 | beta-adrenergic receptor kinase activity(GO:0047696) |
| 0.0 | 0.4 | GO:0008349 | MAP kinase kinase kinase kinase activity(GO:0008349) |
| 0.0 | 0.1 | GO:0033265 | choline binding(GO:0033265) |
| 0.0 | 0.1 | GO:0031996 | thioesterase binding(GO:0031996) |
| 0.0 | 0.3 | GO:0004385 | guanylate kinase activity(GO:0004385) |
| 0.0 | 0.8 | GO:0016301 | kinase activity(GO:0016301) |
| 0.0 | 0.1 | GO:0010859 | calcium-dependent cysteine-type endopeptidase inhibitor activity(GO:0010859) |
| 0.0 | 0.9 | GO:0004112 | cyclic-nucleotide phosphodiesterase activity(GO:0004112) |
| 0.0 | 0.2 | GO:0005545 | 1-phosphatidylinositol binding(GO:0005545) |
| 0.0 | 0.2 | GO:0015093 | ferrous iron transmembrane transporter activity(GO:0015093) |
| 0.0 | 1.2 | GO:0001540 | beta-amyloid binding(GO:0001540) |
| 0.0 | 0.1 | GO:0001032 | RNA polymerase III type 3 promoter DNA binding(GO:0001032) |
| 0.0 | 0.2 | GO:0047760 | butyrate-CoA ligase activity(GO:0047760) |
| 0.0 | 0.1 | GO:0003846 | 2-acylglycerol O-acyltransferase activity(GO:0003846) |
| 0.0 | 0.3 | GO:0033558 | histone deacetylase activity(GO:0004407) protein deacetylase activity(GO:0033558) |
| 0.0 | 0.9 | GO:0005044 | scavenger receptor activity(GO:0005044) |
| 0.0 | 0.0 | GO:0051733 | ATP-dependent polydeoxyribonucleotide 5'-hydroxyl-kinase activity(GO:0046404) polydeoxyribonucleotide kinase activity(GO:0051733) ATP-dependent polynucleotide kinase activity(GO:0051734) |
| 0.0 | 0.1 | GO:1990380 | Lys48-specific deubiquitinase activity(GO:1990380) |
| 0.0 | 0.1 | GO:0015057 | thrombin receptor activity(GO:0015057) |
| 0.0 | 0.1 | GO:0032050 | clathrin heavy chain binding(GO:0032050) |
| 0.0 | 0.3 | GO:0042800 | histone methyltransferase activity (H3-K4 specific)(GO:0042800) |
| 0.0 | 0.1 | GO:0001594 | trace-amine receptor activity(GO:0001594) |
| 0.0 | 0.1 | GO:0043138 | 3'-5' DNA helicase activity(GO:0043138) |
| 0.0 | 0.4 | GO:0016303 | 1-phosphatidylinositol-3-kinase activity(GO:0016303) |
| 0.0 | 0.1 | GO:0016670 | oxidoreductase activity, acting on a sulfur group of donors, oxygen as acceptor(GO:0016670) |
| 0.0 | 0.2 | GO:0033691 | sialic acid binding(GO:0033691) |
| 0.0 | 0.3 | GO:0030331 | estrogen receptor binding(GO:0030331) |
| 0.0 | 0.2 | GO:0004143 | diacylglycerol kinase activity(GO:0004143) |
| 0.0 | 0.0 | GO:0008329 | lipopolysaccharide receptor activity(GO:0001875) signaling pattern recognition receptor activity(GO:0008329) pattern recognition receptor activity(GO:0038187) |
| 0.0 | 0.0 | GO:0043522 | leucine zipper domain binding(GO:0043522) |
| 0.0 | 0.2 | GO:0004065 | arylsulfatase activity(GO:0004065) |
| 0.0 | 0.2 | GO:0008381 | mechanically-gated ion channel activity(GO:0008381) mechanically gated channel activity(GO:0022833) |
| 0.0 | 0.1 | GO:0004623 | phospholipase A2 activity(GO:0004623) |
| 0.0 | 0.6 | GO:0004683 | calmodulin-dependent protein kinase activity(GO:0004683) |
| 0.0 | 0.0 | GO:0047708 | biotinidase activity(GO:0047708) |
| 0.0 | 0.2 | GO:0004012 | phospholipid-translocating ATPase activity(GO:0004012) |
| 0.0 | 0.2 | GO:0005132 | type I interferon receptor binding(GO:0005132) |
| 0.0 | 0.0 | GO:0070878 | primary miRNA binding(GO:0070878) |
| 0.0 | 0.1 | GO:0004726 | non-membrane spanning protein tyrosine phosphatase activity(GO:0004726) |
| 0.0 | 0.2 | GO:0051879 | Hsp90 protein binding(GO:0051879) |
| 0.0 | 0.0 | GO:0033592 | RNA strand annealing activity(GO:0033592) |
| 0.0 | 0.1 | GO:0003923 | GPI-anchor transamidase activity(GO:0003923) |
| 0.0 | 0.1 | GO:0000268 | peroxisome targeting sequence binding(GO:0000268) |
| 0.0 | 0.5 | GO:0031491 | nucleosome binding(GO:0031491) |
| 0.0 | 0.0 | GO:0015141 | succinate transmembrane transporter activity(GO:0015141) |
| 0.0 | 0.1 | GO:0000293 | ferric-chelate reductase activity(GO:0000293) |
| 0.0 | 0.2 | GO:0005540 | hyaluronic acid binding(GO:0005540) |
| 0.0 | 0.1 | GO:1990381 | ubiquitin-specific protease binding(GO:1990381) |
| 0.0 | 0.0 | GO:0030550 | acetylcholine receptor inhibitor activity(GO:0030550) |
| 0.0 | 0.0 | GO:0031545 | peptidyl-proline 4-dioxygenase activity(GO:0031545) |
| 0.0 | 0.0 | GO:0004132 | dCMP deaminase activity(GO:0004132) |
| 0.0 | 0.2 | GO:0022841 | potassium ion leak channel activity(GO:0022841) |
| 0.0 | 1.3 | GO:0019783 | ubiquitin-like protein-specific protease activity(GO:0019783) |
| 0.0 | 0.1 | GO:0001871 | pattern binding(GO:0001871) polysaccharide binding(GO:0030247) |
| 0.0 | 0.1 | GO:0016861 | intramolecular oxidoreductase activity, interconverting aldoses and ketoses(GO:0016861) |
| 0.0 | 0.0 | GO:0004609 | phosphatidylserine decarboxylase activity(GO:0004609) |
| 0.0 | 0.1 | GO:0004859 | phospholipase inhibitor activity(GO:0004859) lipase inhibitor activity(GO:0055102) |
| 0.0 | 0.0 | GO:0034584 | piRNA binding(GO:0034584) |
| 0.0 | 0.0 | GO:0043891 | glyceraldehyde-3-phosphate dehydrogenase (NAD+) (phosphorylating) activity(GO:0004365) glyceraldehyde-3-phosphate dehydrogenase (NAD(P)+) (phosphorylating) activity(GO:0043891) |
| 0.0 | 0.2 | GO:0005158 | insulin receptor binding(GO:0005158) |
| 0.0 | 0.1 | GO:0005131 | growth hormone receptor binding(GO:0005131) |
| 0.0 | 0.4 | GO:0042162 | telomeric DNA binding(GO:0042162) |
| 0.0 | 7.9 | GO:0008270 | zinc ion binding(GO:0008270) |
| 0.0 | 0.1 | GO:0050291 | sphingosine N-acyltransferase activity(GO:0050291) |
| 0.0 | 0.1 | GO:0019763 | immunoglobulin receptor activity(GO:0019763) |
| 0.0 | 0.0 | GO:0097027 | ubiquitin-protein transferase activator activity(GO:0097027) |
| 0.0 | 0.0 | GO:0004060 | arylamine N-acetyltransferase activity(GO:0004060) |
| 0.0 | 0.3 | GO:0005212 | structural constituent of eye lens(GO:0005212) |
| 0.0 | 0.1 | GO:0004459 | L-lactate dehydrogenase activity(GO:0004459) |
| 0.0 | 0.1 | GO:0046527 | glucosyltransferase activity(GO:0046527) |
| 0.0 | 0.3 | GO:0005184 | neuropeptide hormone activity(GO:0005184) |
| 0.0 | 0.0 | GO:0003746 | translation elongation factor activity(GO:0003746) |
| 0.0 | 0.2 | GO:0071949 | FAD binding(GO:0071949) |
| 0.0 | 0.1 | GO:0019864 | IgG binding(GO:0019864) |
| 0.0 | 0.0 | GO:0004089 | carbonate dehydratase activity(GO:0004089) |
| 0.0 | 0.1 | GO:0070412 | R-SMAD binding(GO:0070412) |
Gene overrepresentation in C2:CP category:
| Log-likelihood per target | Total log-likelihood | Term | Description |
|---|---|---|---|
| 0.2 | 5.8 | PID ARF 3PATHWAY | Arf1 pathway |
| 0.2 | 3.6 | PID S1P S1P4 PATHWAY | S1P4 pathway |
| 0.1 | 4.2 | SA PTEN PATHWAY | PTEN is a tumor suppressor that dephosphorylates the lipid messenger phosphatidylinositol triphosphate. |
| 0.1 | 4.3 | SA G1 AND S PHASES | Cdk2, 4, and 6 bind cyclin D in G1, while cdk2/cyclin E promotes the G1/S transition. |
| 0.1 | 2.5 | PID INTEGRIN4 PATHWAY | Alpha6 beta4 integrin-ligand interactions |
| 0.1 | 5.3 | SIG PIP3 SIGNALING IN B LYMPHOCYTES | Genes related to PIP3 signaling in B lymphocytes |
| 0.1 | 2.1 | SA FAS SIGNALING | The TNF-type receptor Fas induces apoptosis on ligand binding. |
| 0.1 | 2.2 | SA PROGRAMMED CELL DEATH | Programmed cell death, or apoptosis, eliminates damaged or unneeded cells. |
| 0.1 | 2.8 | ST GA12 PATHWAY | G alpha 12 Pathway |
| 0.1 | 3.5 | PID RXR VDR PATHWAY | RXR and RAR heterodimerization with other nuclear receptor |
| 0.1 | 4.1 | PID NETRIN PATHWAY | Netrin-mediated signaling events |
| 0.1 | 0.9 | ST IL 13 PATHWAY | Interleukin 13 (IL-13) Pathway |
| 0.1 | 1.4 | PID THROMBIN PAR4 PATHWAY | PAR4-mediated thrombin signaling events |
| 0.1 | 3.3 | SIG CHEMOTAXIS | Genes related to chemotaxis |
| 0.1 | 0.8 | ST TYPE I INTERFERON PATHWAY | Type I Interferon (alpha/beta IFN) Pathway |
| 0.1 | 1.7 | PID PS1 PATHWAY | Presenilin action in Notch and Wnt signaling |
| 0.1 | 1.2 | PID ALK2 PATHWAY | ALK2 signaling events |
| 0.1 | 0.7 | PID RANBP2 PATHWAY | Sumoylation by RanBP2 regulates transcriptional repression |
| 0.1 | 0.8 | PID FAK PATHWAY | Signaling events mediated by focal adhesion kinase |
| 0.1 | 4.6 | PID P53 REGULATION PATHWAY | p53 pathway |
| 0.1 | 1.4 | PID VEGFR1 2 PATHWAY | Signaling events mediated by VEGFR1 and VEGFR2 |
| 0.1 | 2.0 | PID FAS PATHWAY | FAS (CD95) signaling pathway |
| 0.1 | 2.7 | PID P38 MK2 PATHWAY | p38 signaling mediated by MAPKAP kinases |
| 0.1 | 1.5 | PID HIV NEF PATHWAY | HIV-1 Nef: Negative effector of Fas and TNF-alpha |
| 0.1 | 0.9 | PID KIT PATHWAY | Signaling events mediated by Stem cell factor receptor (c-Kit) |
| 0.1 | 1.2 | PID PI3K PLC TRK PATHWAY | Trk receptor signaling mediated by PI3K and PLC-gamma |
| 0.1 | 1.1 | PID SYNDECAN 3 PATHWAY | Syndecan-3-mediated signaling events |
| 0.1 | 1.6 | PID RET PATHWAY | Signaling events regulated by Ret tyrosine kinase |
| 0.0 | 1.4 | PID HDAC CLASSIII PATHWAY | Signaling events mediated by HDAC Class III |
| 0.0 | 2.5 | PID INTEGRIN2 PATHWAY | Beta2 integrin cell surface interactions |
| 0.0 | 2.6 | PID HEDGEHOG GLI PATHWAY | Hedgehog signaling events mediated by Gli proteins |
| 0.0 | 1.3 | PID LIS1 PATHWAY | Lissencephaly gene (LIS1) in neuronal migration and development |
| 0.0 | 3.8 | PID RB 1PATHWAY | Regulation of retinoblastoma protein |
| 0.0 | 1.7 | PID SYNDECAN 2 PATHWAY | Syndecan-2-mediated signaling events |
| 0.0 | 1.4 | PID RAS PATHWAY | Regulation of Ras family activation |
| 0.0 | 2.0 | PID AURORA A PATHWAY | Aurora A signaling |
| 0.0 | 0.2 | ST INTERFERON GAMMA PATHWAY | Interferon gamma pathway. |
| 0.0 | 1.5 | PID UPA UPAR PATHWAY | Urokinase-type plasminogen activator (uPA) and uPAR-mediated signaling |
| 0.0 | 0.7 | PID ARF6 DOWNSTREAM PATHWAY | Arf6 downstream pathway |
| 0.0 | 0.6 | PID ERB GENOMIC PATHWAY | Validated nuclear estrogen receptor beta network |
| 0.0 | 1.0 | PID P38 MKK3 6PATHWAY | p38 MAPK signaling pathway |
| 0.0 | 1.3 | PID ERBB2 ERBB3 PATHWAY | ErbB2/ErbB3 signaling events |
| 0.0 | 0.9 | PID TCR JNK PATHWAY | JNK signaling in the CD4+ TCR pathway |
| 0.0 | 1.8 | PID AR TF PATHWAY | Regulation of Androgen receptor activity |
| 0.0 | 0.7 | PID CD40 PATHWAY | CD40/CD40L signaling |
| 0.0 | 2.3 | NABA PROTEOGLYCANS | Genes encoding proteoglycans |
| 0.0 | 1.9 | PID ECADHERIN NASCENT AJ PATHWAY | E-cadherin signaling in the nascent adherens junction |
| 0.0 | 0.8 | PID EPHB FWD PATHWAY | EPHB forward signaling |
| 0.0 | 1.5 | PID PDGFRB PATHWAY | PDGFR-beta signaling pathway |
| 0.0 | 0.6 | PID PRL SIGNALING EVENTS PATHWAY | Signaling events mediated by PRL |
| 0.0 | 0.2 | PID IL2 PI3K PATHWAY | IL2 signaling events mediated by PI3K |
| 0.0 | 1.4 | PID FCER1 PATHWAY | Fc-epsilon receptor I signaling in mast cells |
| 0.0 | 0.5 | PID P38 GAMMA DELTA PATHWAY | Signaling mediated by p38-gamma and p38-delta |
| 0.0 | 1.8 | PID CDC42 PATHWAY | CDC42 signaling events |
| 0.0 | 0.6 | ST JNK MAPK PATHWAY | JNK MAPK Pathway |
| 0.0 | 0.6 | PID FOXO PATHWAY | FoxO family signaling |
| 0.0 | 1.6 | PID IL4 2PATHWAY | IL4-mediated signaling events |
| 0.0 | 1.1 | PID AJDISS 2PATHWAY | Posttranslational regulation of adherens junction stability and dissassembly |
| 0.0 | 0.2 | ST PHOSPHOINOSITIDE 3 KINASE PATHWAY | PI3K Pathway |
| 0.0 | 0.7 | PID HDAC CLASSII PATHWAY | Signaling events mediated by HDAC Class II |
| 0.0 | 0.3 | PID AVB3 OPN PATHWAY | Osteopontin-mediated events |
| 0.0 | 0.6 | PID IL6 7 PATHWAY | IL6-mediated signaling events |
| 0.0 | 0.1 | PID ECADHERIN KERATINOCYTE PATHWAY | E-cadherin signaling in keratinocytes |
| 0.0 | 0.4 | PID VEGF VEGFR PATHWAY | VEGF and VEGFR signaling network |
| 0.0 | 0.2 | ST GA13 PATHWAY | G alpha 13 Pathway |
| 0.0 | 0.4 | PID INSULIN GLUCOSE PATHWAY | Insulin-mediated glucose transport |
| 0.0 | 0.8 | PID TCR CALCIUM PATHWAY | Calcium signaling in the CD4+ TCR pathway |
| 0.0 | 0.5 | PID RHOA PATHWAY | RhoA signaling pathway |
| 0.0 | 0.5 | ST WNT CA2 CYCLIC GMP PATHWAY | Wnt/Ca2+/cyclic GMP signaling. |
| 0.0 | 0.0 | PID S1P S1P1 PATHWAY | S1P1 pathway |
| 0.0 | 0.3 | ST G ALPHA S PATHWAY | G alpha s Pathway |
| 0.0 | 0.8 | PID ARF6 TRAFFICKING PATHWAY | Arf6 trafficking events |
| 0.0 | 0.3 | PID BETA CATENIN DEG PATHWAY | Degradation of beta catenin |
| 0.0 | 0.8 | PID AP1 PATHWAY | AP-1 transcription factor network |
| 0.0 | 0.9 | PID CASPASE PATHWAY | Caspase cascade in apoptosis |
| 0.0 | 4.4 | NABA ECM GLYCOPROTEINS | Genes encoding structural ECM glycoproteins |
| 0.0 | 0.3 | PID NCADHERIN PATHWAY | N-cadherin signaling events |
| 0.0 | 0.7 | PID HNF3B PATHWAY | FOXA2 and FOXA3 transcription factor networks |
| 0.0 | 0.0 | PID S1P S1P2 PATHWAY | S1P2 pathway |
| 0.0 | 0.4 | PID RHODOPSIN PATHWAY | Visual signal transduction: Rods |
| 0.0 | 0.5 | PID INTEGRIN A4B1 PATHWAY | Alpha4 beta1 integrin signaling events |
| 0.0 | 0.1 | PID INSULIN PATHWAY | Insulin Pathway |
| 0.0 | 0.3 | ST T CELL SIGNAL TRANSDUCTION | T Cell Signal Transduction |
| 0.0 | 0.0 | PID IFNG PATHWAY | IFN-gamma pathway |
| 0.0 | 0.2 | SIG REGULATION OF THE ACTIN CYTOSKELETON BY RHO GTPASES | Genes related to regulation of the actin cytoskeleton |
| 0.0 | 0.2 | ST WNT BETA CATENIN PATHWAY | Wnt/beta-catenin Pathway |
| 0.0 | 0.5 | PID CDC42 REG PATHWAY | Regulation of CDC42 activity |
| 0.0 | 0.5 | PID PTP1B PATHWAY | Signaling events mediated by PTP1B |
| 0.0 | 0.1 | ST G ALPHA I PATHWAY | G alpha i Pathway |
| 0.0 | 0.3 | PID INTEGRIN1 PATHWAY | Beta1 integrin cell surface interactions |
| 0.0 | 0.1 | PID IL2 1PATHWAY | IL2-mediated signaling events |
| 0.0 | 0.3 | PID MYC PATHWAY | C-MYC pathway |
Gene overrepresentation in C2:CP:REACTOME category:
| Log-likelihood per target | Total log-likelihood | Term | Description |
|---|---|---|---|
| 0.4 | 6.5 | REACTOME ROLE OF DCC IN REGULATING APOPTOSIS | Genes involved in Role of DCC in regulating apoptosis |
| 0.4 | 1.5 | REACTOME FORMATION OF TRANSCRIPTION COUPLED NER TC NER REPAIR COMPLEX | Genes involved in Formation of transcription-coupled NER (TC-NER) repair complex |
| 0.3 | 3.1 | REACTOME APOBEC3G MEDIATED RESISTANCE TO HIV1 INFECTION | Genes involved in APOBEC3G mediated resistance to HIV-1 infection |
| 0.3 | 3.8 | REACTOME COPI MEDIATED TRANSPORT | Genes involved in COPI Mediated Transport |
| 0.3 | 0.6 | REACTOME SCF BETA TRCP MEDIATED DEGRADATION OF EMI1 | Genes involved in SCF-beta-TrCP mediated degradation of Emi1 |
| 0.3 | 0.6 | REACTOME NEGATIVE REGULATION OF THE PI3K AKT NETWORK | Genes involved in Negative regulation of the PI3K/AKT network |
| 0.3 | 1.3 | REACTOME ABORTIVE ELONGATION OF HIV1 TRANSCRIPT IN THE ABSENCE OF TAT | Genes involved in Abortive elongation of HIV-1 transcript in the absence of Tat |
| 0.2 | 2.6 | REACTOME DIGESTION OF DIETARY CARBOHYDRATE | Genes involved in Digestion of dietary carbohydrate |
| 0.2 | 4.6 | REACTOME REGULATION OF RHEB GTPASE ACTIVITY BY AMPK | Genes involved in Regulation of Rheb GTPase activity by AMPK |
| 0.2 | 0.4 | REACTOME PHOSPHORYLATION OF CD3 AND TCR ZETA CHAINS | Genes involved in Phosphorylation of CD3 and TCR zeta chains |
| 0.2 | 3.2 | REACTOME ALPHA LINOLENIC ACID ALA METABOLISM | Genes involved in alpha-linolenic acid (ALA) metabolism |
| 0.2 | 2.7 | REACTOME SLBP DEPENDENT PROCESSING OF REPLICATION DEPENDENT HISTONE PRE MRNAS | Genes involved in SLBP Dependent Processing of Replication-Dependent Histone Pre-mRNAs |
| 0.2 | 2.5 | REACTOME ERKS ARE INACTIVATED | Genes involved in ERKs are inactivated |
| 0.1 | 9.5 | REACTOME SMOOTH MUSCLE CONTRACTION | Genes involved in Smooth Muscle Contraction |
| 0.1 | 2.9 | REACTOME MRNA DECAY BY 5 TO 3 EXORIBONUCLEASE | Genes involved in mRNA Decay by 5' to 3' Exoribonuclease |
| 0.1 | 2.7 | REACTOME MITOCHONDRIAL FATTY ACID BETA OXIDATION | Genes involved in Mitochondrial Fatty Acid Beta-Oxidation |
| 0.1 | 4.0 | REACTOME FORMATION OF INCISION COMPLEX IN GG NER | Genes involved in Formation of incision complex in GG-NER |
| 0.1 | 6.3 | REACTOME RNA POL II TRANSCRIPTION PRE INITIATION AND PROMOTER OPENING | Genes involved in RNA Polymerase II Transcription Pre-Initiation And Promoter Opening |
| 0.1 | 3.7 | REACTOME CELL EXTRACELLULAR MATRIX INTERACTIONS | Genes involved in Cell-extracellular matrix interactions |
| 0.1 | 0.5 | REACTOME AUTODEGRADATION OF THE E3 UBIQUITIN LIGASE COP1 | Genes involved in Autodegradation of the E3 ubiquitin ligase COP1 |
| 0.1 | 0.2 | REACTOME RIG I MDA5 MEDIATED INDUCTION OF IFN ALPHA BETA PATHWAYS | Genes involved in RIG-I/MDA5 mediated induction of IFN-alpha/beta pathways |
| 0.1 | 1.4 | REACTOME SYNTHESIS OF PIPS AT THE LATE ENDOSOME MEMBRANE | Genes involved in Synthesis of PIPs at the late endosome membrane |
| 0.1 | 1.5 | REACTOME IKK COMPLEX RECRUITMENT MEDIATED BY RIP1 | Genes involved in IKK complex recruitment mediated by RIP1 |
| 0.1 | 1.2 | REACTOME INHIBITION OF REPLICATION INITIATION OF DAMAGED DNA BY RB1 E2F1 | Genes involved in Inhibition of replication initiation of damaged DNA by RB1/E2F1 |
| 0.1 | 4.5 | REACTOME G BETA GAMMA SIGNALLING THROUGH PI3KGAMMA | Genes involved in G beta:gamma signalling through PI3Kgamma |
| 0.1 | 1.8 | REACTOME NEF MEDIATED DOWNREGULATION OF MHC CLASS I COMPLEX CELL SURFACE EXPRESSION | Genes involved in Nef mediated downregulation of MHC class I complex cell surface expression |
| 0.1 | 4.8 | REACTOME GLUTATHIONE CONJUGATION | Genes involved in Glutathione conjugation |
| 0.1 | 2.3 | REACTOME CITRIC ACID CYCLE TCA CYCLE | Genes involved in Citric acid cycle (TCA cycle) |
| 0.1 | 1.8 | REACTOME SIGNALING BY NOTCH3 | Genes involved in Signaling by NOTCH3 |
| 0.1 | 2.6 | REACTOME REGULATION OF INSULIN LIKE GROWTH FACTOR IGF ACTIVITY BY INSULIN LIKE GROWTH FACTOR BINDING PROTEINS IGFBPS | Genes involved in Regulation of Insulin-like Growth Factor (IGF) Activity by Insulin-like Growth Factor Binding Proteins (IGFBPs) |
| 0.1 | 2.3 | REACTOME FORMATION OF ATP BY CHEMIOSMOTIC COUPLING | Genes involved in Formation of ATP by chemiosmotic coupling |
| 0.1 | 0.8 | REACTOME AKT PHOSPHORYLATES TARGETS IN THE CYTOSOL | Genes involved in AKT phosphorylates targets in the cytosol |
| 0.1 | 8.5 | REACTOME RESPIRATORY ELECTRON TRANSPORT | Genes involved in Respiratory electron transport |
| 0.1 | 0.2 | REACTOME REGULATION OF INSULIN SECRETION BY GLUCAGON LIKE PEPTIDE1 | Genes involved in Regulation of Insulin Secretion by Glucagon-like Peptide-1 |
| 0.1 | 45.0 | REACTOME GENERIC TRANSCRIPTION PATHWAY | Genes involved in Generic Transcription Pathway |
| 0.1 | 1.3 | REACTOME COMMON PATHWAY | Genes involved in Common Pathway |
| 0.1 | 2.2 | REACTOME PURINE SALVAGE | Genes involved in Purine salvage |
| 0.1 | 2.4 | REACTOME AMINO ACID SYNTHESIS AND INTERCONVERSION TRANSAMINATION | Genes involved in Amino acid synthesis and interconversion (transamination) |
| 0.1 | 2.4 | REACTOME INSULIN SYNTHESIS AND PROCESSING | Genes involved in Insulin Synthesis and Processing |
| 0.1 | 12.3 | REACTOME PEPTIDE CHAIN ELONGATION | Genes involved in Peptide chain elongation |
| 0.1 | 7.3 | REACTOME AUTODEGRADATION OF CDH1 BY CDH1 APC C | Genes involved in Autodegradation of Cdh1 by Cdh1:APC/C |
| 0.1 | 1.4 | REACTOME SIGNAL ATTENUATION | Genes involved in Signal attenuation |
| 0.1 | 0.5 | REACTOME ER PHAGOSOME PATHWAY | Genes involved in ER-Phagosome pathway |
| 0.1 | 2.8 | REACTOME SYNTHESIS AND INTERCONVERSION OF NUCLEOTIDE DI AND TRIPHOSPHATES | Genes involved in Synthesis and interconversion of nucleotide di- and triphosphates |
| 0.1 | 0.1 | REACTOME CDK MEDIATED PHOSPHORYLATION AND REMOVAL OF CDC6 | Genes involved in CDK-mediated phosphorylation and removal of Cdc6 |
| 0.1 | 2.3 | REACTOME HORMONE SENSITIVE LIPASE HSL MEDIATED TRIACYLGLYCEROL HYDROLYSIS | Genes involved in Hormone-sensitive lipase (HSL)-mediated triacylglycerol hydrolysis |
| 0.1 | 2.2 | REACTOME CRMPS IN SEMA3A SIGNALING | Genes involved in CRMPs in Sema3A signaling |
| 0.1 | 2.0 | REACTOME BRANCHED CHAIN AMINO ACID CATABOLISM | Genes involved in Branched-chain amino acid catabolism |
| 0.1 | 1.3 | REACTOME DOPAMINE NEUROTRANSMITTER RELEASE CYCLE | Genes involved in Dopamine Neurotransmitter Release Cycle |
| 0.1 | 1.6 | REACTOME GLUCURONIDATION | Genes involved in Glucuronidation |
| 0.1 | 1.3 | REACTOME IL 6 SIGNALING | Genes involved in Interleukin-6 signaling |
| 0.1 | 2.0 | REACTOME SIGNALING BY HIPPO | Genes involved in Signaling by Hippo |
| 0.1 | 3.7 | REACTOME GLUCONEOGENESIS | Genes involved in Gluconeogenesis |
| 0.1 | 0.7 | REACTOME REGULATION OF ORNITHINE DECARBOXYLASE ODC | Genes involved in Regulation of ornithine decarboxylase (ODC) |
| 0.1 | 2.3 | REACTOME CASPASE MEDIATED CLEAVAGE OF CYTOSKELETAL PROTEINS | Genes involved in Caspase-mediated cleavage of cytoskeletal proteins |
| 0.1 | 1.2 | REACTOME TRYPTOPHAN CATABOLISM | Genes involved in Tryptophan catabolism |
| 0.1 | 0.9 | REACTOME ETHANOL OXIDATION | Genes involved in Ethanol oxidation |
| 0.1 | 1.7 | REACTOME DCC MEDIATED ATTRACTIVE SIGNALING | Genes involved in DCC mediated attractive signaling |
| 0.1 | 0.9 | REACTOME PURINE CATABOLISM | Genes involved in Purine catabolism |
| 0.1 | 1.9 | REACTOME SIGNALING BY FGFR1 FUSION MUTANTS | Genes involved in Signaling by FGFR1 fusion mutants |
| 0.1 | 0.7 | REACTOME PROSTANOID LIGAND RECEPTORS | Genes involved in Prostanoid ligand receptors |
| 0.1 | 1.4 | REACTOME PROTEOLYTIC CLEAVAGE OF SNARE COMPLEX PROTEINS | Genes involved in Proteolytic cleavage of SNARE complex proteins |
| 0.1 | 0.9 | REACTOME SEMA3A PAK DEPENDENT AXON REPULSION | Genes involved in Sema3A PAK dependent Axon repulsion |
| 0.1 | 1.1 | REACTOME DOWNREGULATION OF ERBB2 ERBB3 SIGNALING | Genes involved in Downregulation of ERBB2:ERBB3 signaling |
| 0.1 | 2.0 | REACTOME CHONDROITIN SULFATE BIOSYNTHESIS | Genes involved in Chondroitin sulfate biosynthesis |
| 0.1 | 2.1 | REACTOME G1 PHASE | Genes involved in G1 Phase |
| 0.1 | 0.2 | REACTOME P53 DEPENDENT G1 DNA DAMAGE RESPONSE | Genes involved in p53-Dependent G1 DNA Damage Response |
| 0.1 | 0.1 | REACTOME ELEVATION OF CYTOSOLIC CA2 LEVELS | Genes involved in Elevation of cytosolic Ca2+ levels |
| 0.1 | 2.1 | REACTOME TRAF6 MEDIATED IRF7 ACTIVATION | Genes involved in TRAF6 mediated IRF7 activation |
| 0.1 | 1.9 | REACTOME RAP1 SIGNALLING | Genes involved in Rap1 signalling |
| 0.1 | 1.7 | REACTOME PYRIMIDINE METABOLISM | Genes involved in Pyrimidine metabolism |
| 0.1 | 1.0 | REACTOME LYSOSOME VESICLE BIOGENESIS | Genes involved in Lysosome Vesicle Biogenesis |
| 0.1 | 1.2 | REACTOME RETROGRADE NEUROTROPHIN SIGNALLING | Genes involved in Retrograde neurotrophin signalling |
| 0.1 | 0.3 | REACTOME SEMA3A PLEXIN REPULSION SIGNALING BY INHIBITING INTEGRIN ADHESION | Genes involved in SEMA3A-Plexin repulsion signaling by inhibiting Integrin adhesion |
| 0.0 | 0.9 | REACTOME THROMBIN SIGNALLING THROUGH PROTEINASE ACTIVATED RECEPTORS PARS | Genes involved in Thrombin signalling through proteinase activated receptors (PARs) |
| 0.0 | 1.2 | REACTOME RESOLUTION OF AP SITES VIA THE MULTIPLE NUCLEOTIDE PATCH REPLACEMENT PATHWAY | Genes involved in Resolution of AP sites via the multiple-nucleotide patch replacement pathway |
| 0.0 | 1.6 | REACTOME SYNTHESIS OF PIPS AT THE PLASMA MEMBRANE | Genes involved in Synthesis of PIPs at the plasma membrane |
| 0.0 | 1.4 | REACTOME DEGRADATION OF THE EXTRACELLULAR MATRIX | Genes involved in Degradation of the extracellular matrix |
| 0.0 | 1.6 | REACTOME INTRINSIC PATHWAY FOR APOPTOSIS | Genes involved in Intrinsic Pathway for Apoptosis |
| 0.0 | 0.2 | REACTOME RORA ACTIVATES CIRCADIAN EXPRESSION | Genes involved in RORA Activates Circadian Expression |
| 0.0 | 2.4 | REACTOME TRANS GOLGI NETWORK VESICLE BUDDING | Genes involved in trans-Golgi Network Vesicle Budding |
| 0.0 | 1.0 | REACTOME SYNTHESIS OF PE | Genes involved in Synthesis of PE |
| 0.0 | 0.9 | REACTOME SIGNAL REGULATORY PROTEIN SIRP FAMILY INTERACTIONS | Genes involved in Signal regulatory protein (SIRP) family interactions |
| 0.0 | 0.9 | REACTOME EXTRINSIC PATHWAY FOR APOPTOSIS | Genes involved in Extrinsic Pathway for Apoptosis |
| 0.0 | 0.2 | REACTOME ADP SIGNALLING THROUGH P2RY12 | Genes involved in ADP signalling through P2Y purinoceptor 12 |
| 0.0 | 0.2 | REACTOME SIGNAL AMPLIFICATION | Genes involved in Signal amplification |
| 0.0 | 0.6 | REACTOME SIGNALING BY FGFR1 MUTANTS | Genes involved in Signaling by FGFR1 mutants |
| 0.0 | 1.1 | REACTOME NEGATIVE REGULATORS OF RIG I MDA5 SIGNALING | Genes involved in Negative regulators of RIG-I/MDA5 signaling |
| 0.0 | 0.9 | REACTOME SYNTHESIS OF PA | Genes involved in Synthesis of PA |
| 0.0 | 0.3 | REACTOME ACYL CHAIN REMODELLING OF PC | Genes involved in Acyl chain remodelling of PC |
| 0.0 | 1.3 | REACTOME NOTCH1 INTRACELLULAR DOMAIN REGULATES TRANSCRIPTION | Genes involved in NOTCH1 Intracellular Domain Regulates Transcription |
| 0.0 | 1.1 | REACTOME ANTIGEN PRESENTATION FOLDING ASSEMBLY AND PEPTIDE LOADING OF CLASS I MHC | Genes involved in Antigen Presentation: Folding, assembly and peptide loading of class I MHC |
| 0.0 | 0.9 | REACTOME POST CHAPERONIN TUBULIN FOLDING PATHWAY | Genes involved in Post-chaperonin tubulin folding pathway |
| 0.0 | 0.2 | REACTOME DSCAM INTERACTIONS | Genes involved in DSCAM interactions |
| 0.0 | 0.7 | REACTOME ORGANIC CATION ANION ZWITTERION TRANSPORT | Genes involved in Organic cation/anion/zwitterion transport |
| 0.0 | 0.7 | REACTOME ENDOGENOUS STEROLS | Genes involved in Endogenous sterols |
| 0.0 | 0.7 | REACTOME ENOS ACTIVATION AND REGULATION | Genes involved in eNOS activation and regulation |
| 0.0 | 0.2 | REACTOME KERATAN SULFATE BIOSYNTHESIS | Genes involved in Keratan sulfate biosynthesis |
| 0.0 | 0.9 | REACTOME TERMINATION OF O GLYCAN BIOSYNTHESIS | Genes involved in Termination of O-glycan biosynthesis |
| 0.0 | 5.9 | REACTOME ANTIGEN PROCESSING UBIQUITINATION PROTEASOME DEGRADATION | Genes involved in Antigen processing: Ubiquitination & Proteasome degradation |
| 0.0 | 2.3 | REACTOME LOSS OF NLP FROM MITOTIC CENTROSOMES | Genes involved in Loss of Nlp from mitotic centrosomes |
| 0.0 | 1.2 | REACTOME CA DEPENDENT EVENTS | Genes involved in Ca-dependent events |
| 0.0 | 1.2 | REACTOME TRANSCRIPTIONAL REGULATION OF WHITE ADIPOCYTE DIFFERENTIATION | Genes involved in Transcriptional Regulation of White Adipocyte Differentiation |
| 0.0 | 1.0 | REACTOME CGMP EFFECTS | Genes involved in cGMP effects |
| 0.0 | 0.3 | REACTOME ANDROGEN BIOSYNTHESIS | Genes involved in Androgen biosynthesis |
| 0.0 | 0.8 | REACTOME ENDOSOMAL SORTING COMPLEX REQUIRED FOR TRANSPORT ESCRT | Genes involved in Endosomal Sorting Complex Required For Transport (ESCRT) |
| 0.0 | 0.5 | REACTOME ACYL CHAIN REMODELLING OF PI | Genes involved in Acyl chain remodelling of PI |
| 0.0 | 0.8 | REACTOME CHOLESTEROL BIOSYNTHESIS | Genes involved in Cholesterol biosynthesis |
| 0.0 | 1.0 | REACTOME LIGAND GATED ION CHANNEL TRANSPORT | Genes involved in Ligand-gated ion channel transport |
| 0.0 | 0.3 | REACTOME NITRIC OXIDE STIMULATES GUANYLATE CYCLASE | Genes involved in Nitric oxide stimulates guanylate cyclase |
| 0.0 | 0.1 | REACTOME DAG AND IP3 SIGNALING | Genes involved in DAG and IP3 signaling |
| 0.0 | 0.2 | REACTOME TRAF6 MEDIATED INDUCTION OF TAK1 COMPLEX | Genes involved in TRAF6 mediated induction of TAK1 complex |
| 0.0 | 0.3 | REACTOME TRANSPORT OF GLUCOSE AND OTHER SUGARS BILE SALTS AND ORGANIC ACIDS METAL IONS AND AMINE COMPOUNDS | Genes involved in Transport of glucose and other sugars, bile salts and organic acids, metal ions and amine compounds |
| 0.0 | 0.4 | REACTOME BILE SALT AND ORGANIC ANION SLC TRANSPORTERS | Genes involved in Bile salt and organic anion SLC transporters |
| 0.0 | 0.6 | REACTOME RNA POL III TRANSCRIPTION INITIATION FROM TYPE 3 PROMOTER | Genes involved in RNA Polymerase III Transcription Initiation From Type 3 Promoter |
| 0.0 | 0.1 | REACTOME CROSS PRESENTATION OF SOLUBLE EXOGENOUS ANTIGENS ENDOSOMES | Genes involved in Cross-presentation of soluble exogenous antigens (endosomes) |
| 0.0 | 0.6 | REACTOME AMINE DERIVED HORMONES | Genes involved in Amine-derived hormones |
| 0.0 | 0.5 | REACTOME TGF BETA RECEPTOR SIGNALING ACTIVATES SMADS | Genes involved in TGF-beta receptor signaling activates SMADs |
| 0.0 | 2.3 | REACTOME INTEGRIN CELL SURFACE INTERACTIONS | Genes involved in Integrin cell surface interactions |
| 0.0 | 0.2 | REACTOME PROLONGED ERK ACTIVATION EVENTS | Genes involved in Prolonged ERK activation events |
| 0.0 | 0.3 | REACTOME CREATION OF C4 AND C2 ACTIVATORS | Genes involved in Creation of C4 and C2 activators |
| 0.0 | 0.0 | REACTOME REGULATION OF SIGNALING BY CBL | Genes involved in Regulation of signaling by CBL |
| 0.0 | 0.5 | REACTOME METABOLISM OF PORPHYRINS | Genes involved in Metabolism of porphyrins |
| 0.0 | 0.6 | REACTOME INSULIN RECEPTOR RECYCLING | Genes involved in Insulin receptor recycling |
| 0.0 | 0.3 | REACTOME SYNTHESIS OF SUBSTRATES IN N GLYCAN BIOSYTHESIS | Genes involved in Synthesis of substrates in N-glycan biosythesis |
| 0.0 | 0.1 | REACTOME PROSTACYCLIN SIGNALLING THROUGH PROSTACYCLIN RECEPTOR | Genes involved in Prostacyclin signalling through prostacyclin receptor |
| 0.0 | 4.2 | REACTOME SIGNALING BY RHO GTPASES | Genes involved in Signaling by Rho GTPases |
| 0.0 | 0.0 | REACTOME RESOLUTION OF AP SITES VIA THE SINGLE NUCLEOTIDE REPLACEMENT PATHWAY | Genes involved in Resolution of AP sites via the single-nucleotide replacement pathway |
| 0.0 | 0.4 | REACTOME DARPP 32 EVENTS | Genes involved in DARPP-32 events |
| 0.0 | 0.1 | REACTOME INITIAL TRIGGERING OF COMPLEMENT | Genes involved in Initial triggering of complement |
| 0.0 | 0.3 | REACTOME METABOLISM OF POLYAMINES | Genes involved in Metabolism of polyamines |
| 0.0 | 0.0 | REACTOME CS DS DEGRADATION | Genes involved in CS/DS degradation |
| 0.0 | 0.1 | REACTOME REGULATION OF IFNG SIGNALING | Genes involved in Regulation of IFNG signaling |
| 0.0 | 0.3 | REACTOME REGULATION OF GENE EXPRESSION IN BETA CELLS | Genes involved in Regulation of gene expression in beta cells |
| 0.0 | 0.1 | REACTOME REGULATION OF IFNA SIGNALING | Genes involved in Regulation of IFNA signaling |
| 0.0 | 0.2 | REACTOME IL RECEPTOR SHC SIGNALING | Genes involved in Interleukin receptor SHC signaling |
| 0.0 | 0.2 | REACTOME RECYCLING OF BILE ACIDS AND SALTS | Genes involved in Recycling of bile acids and salts |
| 0.0 | 0.1 | REACTOME PROLACTIN RECEPTOR SIGNALING | Genes involved in Prolactin receptor signaling |
| 0.0 | 0.0 | REACTOME REGULATION OF KIT SIGNALING | Genes involved in Regulation of KIT signaling |
| 0.0 | 0.2 | REACTOME GLUCAGON TYPE LIGAND RECEPTORS | Genes involved in Glucagon-type ligand receptors |
| 0.0 | 0.8 | REACTOME METABOLISM OF VITAMINS AND COFACTORS | Genes involved in Metabolism of vitamins and cofactors |
| 0.0 | 0.1 | REACTOME TRAF6 MEDIATED IRF7 ACTIVATION IN TLR7 8 OR 9 SIGNALING | Genes involved in TRAF6 mediated IRF7 activation in TLR7/8 or 9 signaling |
| 0.0 | 0.2 | REACTOME GABA SYNTHESIS RELEASE REUPTAKE AND DEGRADATION | Genes involved in GABA synthesis, release, reuptake and degradation |