Project
Epithelial-Mesenchymal Transition, human (Scheel, 2011)
Navigation
Downloads
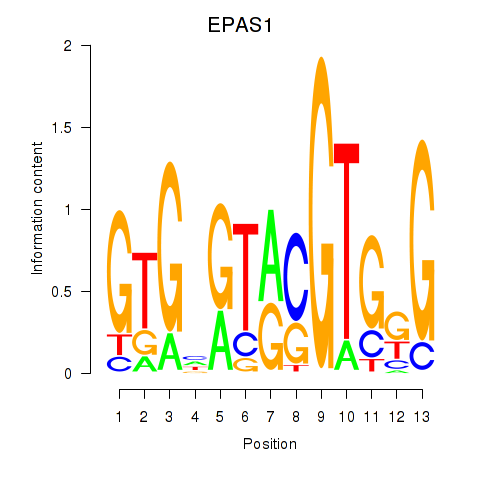
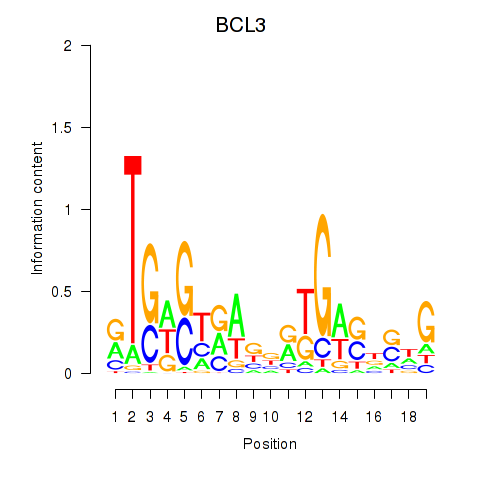
Results for EPAS1_BCL3
Z-value: 2.21
Motif logo
Transcription factors associated with EPAS1_BCL3
| Gene Symbol | Gene ID | Gene Info |
|---|---|---|
|
EPAS1
|
ENSG00000116016.9 | EPAS1 |
|
BCL3
|
ENSG00000069399.8 | BCL3 |
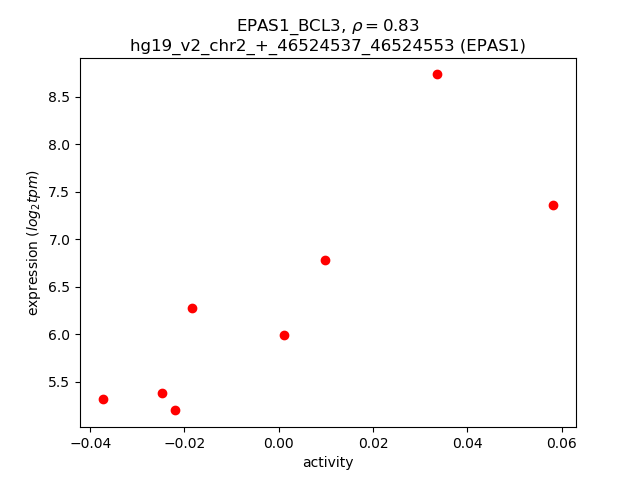
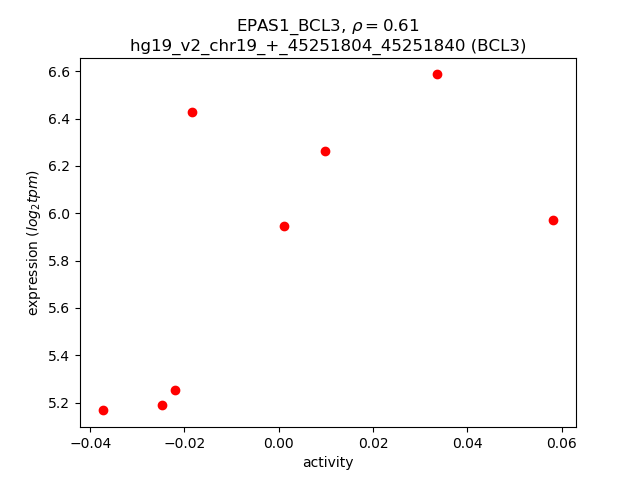
Activity-expression correlation:
| Gene | Promoter | Pearson corr. coef. | P-value | Plot |
|---|---|---|---|---|
| EPAS1 | hg19_v2_chr2_+_46524537_46524553 | 0.83 | 1.0e-02 | Click! |
| BCL3 | hg19_v2_chr19_+_45251804_45251840 | 0.61 | 1.1e-01 | Click! |
Activity profile of EPAS1_BCL3 motif
Sorted Z-values of EPAS1_BCL3 motif
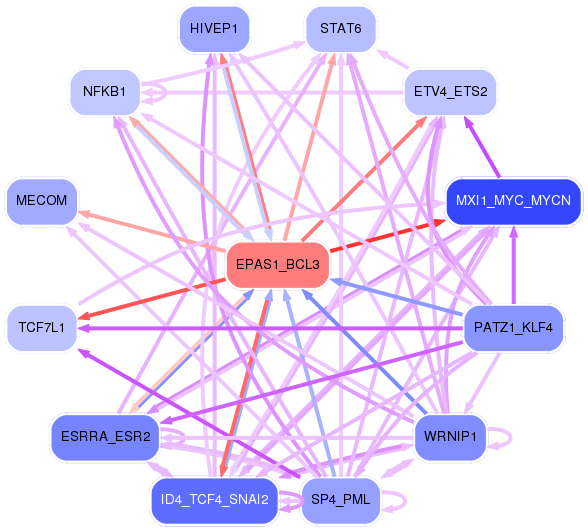
Network of associatons between targets according to the STRING database.

First level regulatory network of EPAS1_BCL3
| Promoter | Score | Transcript | Gene | Gene Info |
|---|---|---|---|---|
| chr16_+_57662419 | 4.91 |
ENST00000388812.4 ENST00000538815.1 ENST00000456916.1 ENST00000567154.1 ENST00000388813.5 ENST00000562558.1 ENST00000566271.2 |
GPR56 |
G protein-coupled receptor 56 |
| chr5_+_52776228 | 4.78 |
ENST00000256759.3 |
FST |
follistatin |
| chr5_+_52776449 | 3.48 |
ENST00000396947.3 |
FST |
follistatin |
| chr20_+_44637526 | 3.23 |
ENST00000372330.3 |
MMP9 |
matrix metallopeptidase 9 (gelatinase B, 92kDa gelatinase, 92kDa type IV collagenase) |
| chr18_+_61254534 | 3.07 |
ENST00000269489.5 |
SERPINB13 |
serpin peptidase inhibitor, clade B (ovalbumin), member 13 |
| chr3_-_116163830 | 2.79 |
ENST00000333617.4 |
LSAMP |
limbic system-associated membrane protein |
| chr16_+_22825475 | 2.73 |
ENST00000261374.3 |
HS3ST2 |
heparan sulfate (glucosamine) 3-O-sulfotransferase 2 |
| chr6_-_40555176 | 2.73 |
ENST00000338305.6 |
LRFN2 |
leucine rich repeat and fibronectin type III domain containing 2 |
| chr18_+_61254570 | 2.54 |
ENST00000344731.5 |
SERPINB13 |
serpin peptidase inhibitor, clade B (ovalbumin), member 13 |
| chr2_+_102618428 | 2.50 |
ENST00000457817.1 |
IL1R2 |
interleukin 1 receptor, type II |
| chr4_+_40198527 | 2.48 |
ENST00000381799.5 |
RHOH |
ras homolog family member H |
| chr12_-_86230315 | 2.46 |
ENST00000361228.3 |
RASSF9 |
Ras association (RalGDS/AF-6) domain family (N-terminal) member 9 |
| chr15_+_40531621 | 2.42 |
ENST00000560346.1 |
PAK6 |
p21 protein (Cdc42/Rac)-activated kinase 6 |
| chr2_-_238499303 | 2.33 |
ENST00000409576.1 |
RAB17 |
RAB17, member RAS oncogene family |
| chr15_+_40532058 | 2.32 |
ENST00000260404.4 |
PAK6 |
p21 protein (Cdc42/Rac)-activated kinase 6 |
| chr8_-_134309335 | 2.19 |
ENST00000522890.1 ENST00000323851.7 ENST00000518176.1 ENST00000354944.5 ENST00000537882.1 ENST00000522476.1 ENST00000518066.1 ENST00000521544.1 ENST00000518480.1 ENST00000523892.1 |
NDRG1 |
N-myc downstream regulated 1 |
| chr6_+_130686856 | 2.16 |
ENST00000296978.3 |
TMEM200A |
transmembrane protein 200A |
| chr16_-_31147020 | 2.02 |
ENST00000568261.1 ENST00000567797.1 ENST00000317508.6 |
PRSS8 |
protease, serine, 8 |
| chr10_+_111967345 | 1.96 |
ENST00000332674.5 ENST00000453116.1 |
MXI1 |
MAX interactor 1, dimerization protein |
| chr1_+_152486950 | 1.95 |
ENST00000368790.3 |
CRCT1 |
cysteine-rich C-terminal 1 |
| chr11_+_10472223 | 1.94 |
ENST00000396554.3 ENST00000524866.1 |
AMPD3 |
adenosine monophosphate deaminase 3 |
| chr1_-_153588765 | 1.84 |
ENST00000368701.1 ENST00000344616.2 |
S100A14 |
S100 calcium binding protein A14 |
| chr2_-_238499337 | 1.83 |
ENST00000411462.1 ENST00000409822.1 |
RAB17 |
RAB17, member RAS oncogene family |
| chr17_+_73750699 | 1.83 |
ENST00000584939.1 |
ITGB4 |
integrin, beta 4 |
| chr6_-_136847610 | 1.81 |
ENST00000454590.1 ENST00000432797.2 |
MAP7 |
microtubule-associated protein 7 |
| chr1_+_209602156 | 1.80 |
ENST00000429156.1 ENST00000366437.3 ENST00000603283.1 ENST00000431096.1 |
MIR205HG |
MIR205 host gene (non-protein coding) |
| chr19_-_43382142 | 1.79 |
ENST00000597058.1 |
PSG1 |
pregnancy specific beta-1-glycoprotein 1 |
| chr6_-_136847099 | 1.76 |
ENST00000438100.2 |
MAP7 |
microtubule-associated protein 7 |
| chr16_+_71660079 | 1.73 |
ENST00000565261.1 ENST00000268485.3 ENST00000299952.4 |
MARVELD3 |
MARVEL domain containing 3 |
| chr14_+_71108460 | 1.70 |
ENST00000256367.2 |
TTC9 |
tetratricopeptide repeat domain 9 |
| chr8_+_27348626 | 1.61 |
ENST00000517536.1 |
EPHX2 |
epoxide hydrolase 2, cytoplasmic |
| chr2_+_85360499 | 1.53 |
ENST00000282111.3 |
TCF7L1 |
transcription factor 7-like 1 (T-cell specific, HMG-box) |
| chr16_-_68269971 | 1.50 |
ENST00000565858.1 |
ESRP2 |
epithelial splicing regulatory protein 2 |
| chr1_+_153003671 | 1.49 |
ENST00000307098.4 |
SPRR1B |
small proline-rich protein 1B |
| chr1_+_92495528 | 1.48 |
ENST00000370383.4 |
EPHX4 |
epoxide hydrolase 4 |
| chr2_-_238499131 | 1.45 |
ENST00000538644.1 |
RAB17 |
RAB17, member RAS oncogene family |
| chr20_+_9049682 | 1.43 |
ENST00000334005.3 ENST00000378473.3 |
PLCB4 |
phospholipase C, beta 4 |
| chr12_+_4385230 | 1.42 |
ENST00000536537.1 |
CCND2 |
cyclin D2 |
| chr5_+_167181917 | 1.41 |
ENST00000519204.1 |
TENM2 |
teneurin transmembrane protein 2 |
| chr12_+_10163231 | 1.41 |
ENST00000396502.1 ENST00000338896.5 |
CLEC12B |
C-type lectin domain family 12, member B |
| chr19_-_51456198 | 1.33 |
ENST00000594846.1 |
KLK5 |
kallikrein-related peptidase 5 |
| chr18_+_61445007 | 1.31 |
ENST00000447428.1 ENST00000546027.1 |
SERPINB7 |
serpin peptidase inhibitor, clade B (ovalbumin), member 7 |
| chr5_+_52285144 | 1.28 |
ENST00000296585.5 |
ITGA2 |
integrin, alpha 2 (CD49B, alpha 2 subunit of VLA-2 receptor) |
| chr3_-_56809685 | 1.28 |
ENST00000413728.2 |
ARHGEF3 |
Rho guanine nucleotide exchange factor (GEF) 3 |
| chr18_+_21452964 | 1.27 |
ENST00000587184.1 |
LAMA3 |
laminin, alpha 3 |
| chr16_+_82068830 | 1.27 |
ENST00000199936.4 |
HSD17B2 |
hydroxysteroid (17-beta) dehydrogenase 2 |
| chr18_+_21452804 | 1.27 |
ENST00000269217.6 |
LAMA3 |
laminin, alpha 3 |
| chr14_-_54420133 | 1.27 |
ENST00000559501.1 ENST00000558984.1 |
BMP4 |
bone morphogenetic protein 4 |
| chr18_-_53089723 | 1.26 |
ENST00000561992.1 ENST00000562512.2 |
TCF4 |
transcription factor 4 |
| chr15_+_41136216 | 1.23 |
ENST00000562057.1 ENST00000344051.4 |
SPINT1 |
serine peptidase inhibitor, Kunitz type 1 |
| chr7_-_41742697 | 1.21 |
ENST00000242208.4 |
INHBA |
inhibin, beta A |
| chr19_+_34287751 | 1.19 |
ENST00000590771.1 ENST00000589786.1 ENST00000284006.6 ENST00000588881.1 |
KCTD15 |
potassium channel tetramerization domain containing 15 |
| chr20_-_36793774 | 1.18 |
ENST00000361475.2 |
TGM2 |
transglutaminase 2 |
| chr11_-_108464465 | 1.17 |
ENST00000525344.1 |
EXPH5 |
exophilin 5 |
| chr11_-_79151695 | 1.16 |
ENST00000278550.7 |
TENM4 |
teneurin transmembrane protein 4 |
| chr15_+_43886057 | 1.13 |
ENST00000441322.1 ENST00000413657.2 ENST00000453733.1 |
CKMT1B |
creatine kinase, mitochondrial 1B |
| chr15_+_41136586 | 1.11 |
ENST00000431806.1 |
SPINT1 |
serine peptidase inhibitor, Kunitz type 1 |
| chr11_-_125366089 | 1.10 |
ENST00000366139.3 ENST00000278919.3 |
FEZ1 |
fasciculation and elongation protein zeta 1 (zygin I) |
| chr3_-_12800751 | 1.09 |
ENST00000435218.2 ENST00000435575.1 |
TMEM40 |
transmembrane protein 40 |
| chr15_+_43985725 | 1.05 |
ENST00000413453.2 |
CKMT1A |
creatine kinase, mitochondrial 1A |
| chr20_+_51588873 | 1.05 |
ENST00000371497.5 |
TSHZ2 |
teashirt zinc finger homeobox 2 |
| chr1_+_46640750 | 1.04 |
ENST00000372003.1 |
TSPAN1 |
tetraspanin 1 |
| chr17_-_41623009 | 1.04 |
ENST00000393664.2 |
ETV4 |
ets variant 4 |
| chr3_-_69435428 | 1.04 |
ENST00000542259.1 |
FRMD4B |
FERM domain containing 4B |
| chr1_+_186798073 | 1.03 |
ENST00000367466.3 ENST00000442353.2 |
PLA2G4A |
phospholipase A2, group IVA (cytosolic, calcium-dependent) |
| chr15_+_48009541 | 1.03 |
ENST00000536845.2 ENST00000558816.1 |
SEMA6D |
sema domain, transmembrane domain (TM), and cytoplasmic domain, (semaphorin) 6D |
| chr11_+_10471836 | 1.02 |
ENST00000444303.2 |
AMPD3 |
adenosine monophosphate deaminase 3 |
| chr3_-_69435224 | 1.01 |
ENST00000398540.3 |
FRMD4B |
FERM domain containing 4B |
| chr19_-_36004543 | 1.01 |
ENST00000339686.3 ENST00000447113.2 ENST00000440396.1 |
DMKN |
dermokine |
| chr16_+_71660052 | 1.01 |
ENST00000567566.1 |
MARVELD3 |
MARVEL domain containing 3 |
| chr2_-_31360887 | 1.01 |
ENST00000420311.2 ENST00000356174.3 ENST00000324589.5 |
GALNT14 |
UDP-N-acetyl-alpha-D-galactosamine:polypeptide N-acetylgalactosaminyltransferase 14 (GalNAc-T14) |
| chr6_+_12012536 | 0.99 |
ENST00000379388.2 |
HIVEP1 |
human immunodeficiency virus type I enhancer binding protein 1 |
| chr3_+_14444063 | 0.99 |
ENST00000454876.2 ENST00000360861.3 ENST00000416216.2 |
SLC6A6 |
solute carrier family 6 (neurotransmitter transporter), member 6 |
| chr19_-_43099070 | 0.97 |
ENST00000244336.5 |
CEACAM8 |
carcinoembryonic antigen-related cell adhesion molecule 8 |
| chr19_-_52227221 | 0.97 |
ENST00000222115.1 ENST00000540069.2 |
HAS1 |
hyaluronan synthase 1 |
| chr7_+_121513143 | 0.96 |
ENST00000393386.2 |
PTPRZ1 |
protein tyrosine phosphatase, receptor-type, Z polypeptide 1 |
| chr11_+_69924639 | 0.95 |
ENST00000538023.1 ENST00000398543.2 |
ANO1 |
anoctamin 1, calcium activated chloride channel |
| chr3_-_193272588 | 0.94 |
ENST00000295548.3 |
ATP13A4 |
ATPase type 13A4 |
| chr17_-_41623075 | 0.93 |
ENST00000545089.1 |
ETV4 |
ets variant 4 |
| chr19_+_7660716 | 0.93 |
ENST00000160298.4 ENST00000446248.2 |
CAMSAP3 |
calmodulin regulated spectrin-associated protein family, member 3 |
| chr11_-_72433346 | 0.93 |
ENST00000334211.8 |
ARAP1 |
ArfGAP with RhoGAP domain, ankyrin repeat and PH domain 1 |
| chr20_-_36793663 | 0.92 |
ENST00000536701.1 ENST00000536724.1 |
TGM2 |
transglutaminase 2 |
| chr8_+_21915368 | 0.92 |
ENST00000265800.5 ENST00000517418.1 |
DMTN |
dematin actin binding protein |
| chr1_-_28520384 | 0.91 |
ENST00000305392.3 |
PTAFR |
platelet-activating factor receptor |
| chr19_+_45843994 | 0.91 |
ENST00000391946.2 |
KLC3 |
kinesin light chain 3 |
| chrX_+_17393543 | 0.88 |
ENST00000380060.3 |
NHS |
Nance-Horan syndrome (congenital cataracts and dental anomalies) |
| chr6_-_11807277 | 0.88 |
ENST00000379415.2 |
ADTRP |
androgen-dependent TFPI-regulating protein |
| chr8_+_27348649 | 0.87 |
ENST00000521780.1 ENST00000380476.3 ENST00000518379.1 ENST00000521684.1 |
EPHX2 |
epoxide hydrolase 2, cytoplasmic |
| chr19_+_45844018 | 0.84 |
ENST00000585434.1 |
KLC3 |
kinesin light chain 3 |
| chr3_-_9291063 | 0.84 |
ENST00000383836.3 |
SRGAP3 |
SLIT-ROBO Rho GTPase activating protein 3 |
| chr7_+_86273952 | 0.83 |
ENST00000536043.1 |
GRM3 |
glutamate receptor, metabotropic 3 |
| chr1_+_3388181 | 0.82 |
ENST00000418137.1 ENST00000413250.2 |
ARHGEF16 |
Rho guanine nucleotide exchange factor (GEF) 16 |
| chr7_+_86274145 | 0.81 |
ENST00000439827.1 ENST00000394720.2 ENST00000421579.1 |
GRM3 |
glutamate receptor, metabotropic 3 |
| chrX_-_119445263 | 0.80 |
ENST00000309720.5 |
TMEM255A |
transmembrane protein 255A |
| chr8_+_101170257 | 0.79 |
ENST00000251809.3 |
SPAG1 |
sperm associated antigen 1 |
| chr12_-_28124903 | 0.79 |
ENST00000395872.1 ENST00000354417.3 ENST00000201015.4 |
PTHLH |
parathyroid hormone-like hormone |
| chr1_+_233749739 | 0.79 |
ENST00000366621.3 |
KCNK1 |
potassium channel, subfamily K, member 1 |
| chr13_+_37006421 | 0.79 |
ENST00000255465.4 |
CCNA1 |
cyclin A1 |
| chr6_+_43737939 | 0.79 |
ENST00000372067.3 |
VEGFA |
vascular endothelial growth factor A |
| chr8_+_110374683 | 0.79 |
ENST00000378402.5 |
PKHD1L1 |
polycystic kidney and hepatic disease 1 (autosomal recessive)-like 1 |
| chr11_+_102188224 | 0.77 |
ENST00000263464.3 |
BIRC3 |
baculoviral IAP repeat containing 3 |
| chr1_+_13910479 | 0.77 |
ENST00000509009.1 |
PDPN |
podoplanin |
| chr6_-_134373732 | 0.76 |
ENST00000275230.5 |
SLC2A12 |
solute carrier family 2 (facilitated glucose transporter), member 12 |
| chr17_-_41623691 | 0.76 |
ENST00000545954.1 |
ETV4 |
ets variant 4 |
| chr4_+_140586922 | 0.76 |
ENST00000265498.1 ENST00000506797.1 |
MGST2 |
microsomal glutathione S-transferase 2 |
| chr8_-_81083890 | 0.75 |
ENST00000518937.1 |
TPD52 |
tumor protein D52 |
| chrX_-_119445306 | 0.75 |
ENST00000371369.4 ENST00000440464.1 ENST00000519908.1 |
TMEM255A |
transmembrane protein 255A |
| chr12_-_85306562 | 0.75 |
ENST00000551612.1 ENST00000450363.3 ENST00000552192.1 |
SLC6A15 |
solute carrier family 6 (neutral amino acid transporter), member 15 |
| chr8_+_123793633 | 0.74 |
ENST00000314393.4 |
ZHX2 |
zinc fingers and homeoboxes 2 |
| chr3_-_189838670 | 0.74 |
ENST00000319332.5 |
LEPREL1 |
leprecan-like 1 |
| chr3_-_13921594 | 0.74 |
ENST00000285018.4 |
WNT7A |
wingless-type MMTV integration site family, member 7A |
| chr1_+_174769006 | 0.73 |
ENST00000489615.1 |
RABGAP1L |
RAB GTPase activating protein 1-like |
| chr13_+_37006398 | 0.73 |
ENST00000418263.1 |
CCNA1 |
cyclin A1 |
| chr1_+_82266053 | 0.72 |
ENST00000370715.1 ENST00000370713.1 ENST00000319517.6 ENST00000370717.2 ENST00000394879.1 ENST00000271029.4 ENST00000335786.5 |
LPHN2 |
latrophilin 2 |
| chr15_+_33603147 | 0.72 |
ENST00000415757.3 ENST00000389232.4 |
RYR3 |
ryanodine receptor 3 |
| chrX_+_105937068 | 0.71 |
ENST00000324342.3 |
RNF128 |
ring finger protein 128, E3 ubiquitin protein ligase |
| chr14_+_61995722 | 0.71 |
ENST00000556347.1 |
RP11-47I22.4 |
RP11-47I22.4 |
| chr12_-_8815404 | 0.71 |
ENST00000359478.2 ENST00000396549.2 |
MFAP5 |
microfibrillar associated protein 5 |
| chr11_+_76494253 | 0.71 |
ENST00000333090.4 |
TSKU |
tsukushi, small leucine rich proteoglycan |
| chr17_-_41623259 | 0.71 |
ENST00000538265.1 ENST00000591713.1 |
ETV4 |
ets variant 4 |
| chr19_-_55658650 | 0.70 |
ENST00000589226.1 |
TNNT1 |
troponin T type 1 (skeletal, slow) |
| chr10_+_5566916 | 0.70 |
ENST00000315238.1 |
CALML3 |
calmodulin-like 3 |
| chr9_-_14722715 | 0.69 |
ENST00000380911.3 |
CER1 |
cerberus 1, DAN family BMP antagonist |
| chr1_-_44497024 | 0.69 |
ENST00000372306.3 ENST00000372310.3 ENST00000475075.2 |
SLC6A9 |
solute carrier family 6 (neurotransmitter transporter, glycine), member 9 |
| chr1_+_15479054 | 0.68 |
ENST00000376014.3 ENST00000451326.2 |
TMEM51 |
transmembrane protein 51 |
| chr12_+_50451462 | 0.68 |
ENST00000447966.2 |
ASIC1 |
acid-sensing (proton-gated) ion channel 1 |
| chr1_-_221915418 | 0.67 |
ENST00000323825.3 ENST00000366899.3 |
DUSP10 |
dual specificity phosphatase 10 |
| chr7_-_44365020 | 0.67 |
ENST00000395747.2 ENST00000347193.4 ENST00000346990.4 ENST00000258682.6 ENST00000353625.4 ENST00000421607.1 ENST00000424197.1 ENST00000502837.2 ENST00000350811.3 ENST00000395749.2 |
CAMK2B |
calcium/calmodulin-dependent protein kinase II beta |
| chr1_+_117452669 | 0.67 |
ENST00000393203.2 |
PTGFRN |
prostaglandin F2 receptor inhibitor |
| chr22_-_37545972 | 0.66 |
ENST00000216223.5 |
IL2RB |
interleukin 2 receptor, beta |
| chr17_-_41623716 | 0.66 |
ENST00000319349.5 |
ETV4 |
ets variant 4 |
| chr1_+_15479021 | 0.66 |
ENST00000428417.1 |
TMEM51 |
transmembrane protein 51 |
| chr4_-_89152474 | 0.64 |
ENST00000515655.1 |
ABCG2 |
ATP-binding cassette, sub-family G (WHITE), member 2 |
| chr20_-_43743790 | 0.63 |
ENST00000307971.4 ENST00000372789.4 |
WFDC5 |
WAP four-disulfide core domain 5 |
| chr16_+_57673430 | 0.62 |
ENST00000540164.2 ENST00000568531.1 |
GPR56 |
G protein-coupled receptor 56 |
| chr11_-_72492878 | 0.62 |
ENST00000535054.1 ENST00000545082.1 |
STARD10 |
StAR-related lipid transfer (START) domain containing 10 |
| chr3_-_46735155 | 0.62 |
ENST00000318962.4 |
ALS2CL |
ALS2 C-terminal like |
| chr7_-_142120321 | 0.61 |
ENST00000390377.1 |
TRBV7-7 |
T cell receptor beta variable 7-7 |
| chr14_+_68086515 | 0.61 |
ENST00000261783.3 |
ARG2 |
arginase 2 |
| chr19_+_45844032 | 0.60 |
ENST00000589837.1 |
KLC3 |
kinesin light chain 3 |
| chr19_-_55660561 | 0.60 |
ENST00000587758.1 ENST00000356783.5 ENST00000291901.8 ENST00000588426.1 ENST00000588147.1 ENST00000536926.1 ENST00000588981.1 |
TNNT1 |
troponin T type 1 (skeletal, slow) |
| chr12_+_50451331 | 0.60 |
ENST00000228468.4 |
ASIC1 |
acid-sensing (proton-gated) ion channel 1 |
| chr13_+_37005967 | 0.59 |
ENST00000440264.1 ENST00000449823.1 |
CCNA1 |
cyclin A1 |
| chr17_+_7942424 | 0.59 |
ENST00000573359.1 |
ALOX15B |
arachidonate 15-lipoxygenase, type B |
| chr19_-_11688447 | 0.59 |
ENST00000590420.1 |
ACP5 |
acid phosphatase 5, tartrate resistant |
| chr16_-_70719925 | 0.58 |
ENST00000338779.6 |
MTSS1L |
metastasis suppressor 1-like |
| chr9_-_14910990 | 0.58 |
ENST00000380881.4 ENST00000422223.2 |
FREM1 |
FRAS1 related extracellular matrix 1 |
| chr1_+_13910757 | 0.57 |
ENST00000376061.4 ENST00000513143.1 |
PDPN |
podoplanin |
| chr1_+_160765919 | 0.57 |
ENST00000341032.4 ENST00000368041.2 ENST00000368040.1 |
LY9 |
lymphocyte antigen 9 |
| chr1_+_160765884 | 0.57 |
ENST00000392203.4 |
LY9 |
lymphocyte antigen 9 |
| chr1_+_26869597 | 0.57 |
ENST00000530003.1 |
RPS6KA1 |
ribosomal protein S6 kinase, 90kDa, polypeptide 1 |
| chr12_+_122459757 | 0.57 |
ENST00000261822.4 |
BCL7A |
B-cell CLL/lymphoma 7A |
| chr1_-_44497118 | 0.56 |
ENST00000537678.1 ENST00000466926.1 |
SLC6A9 |
solute carrier family 6 (neurotransmitter transporter, glycine), member 9 |
| chr8_+_21916680 | 0.56 |
ENST00000358242.3 ENST00000415253.1 |
DMTN |
dematin actin binding protein |
| chr12_+_56473628 | 0.55 |
ENST00000549282.1 ENST00000549061.1 ENST00000267101.3 |
ERBB3 |
v-erb-b2 avian erythroblastic leukemia viral oncogene homolog 3 |
| chr1_-_184006611 | 0.55 |
ENST00000546159.1 |
COLGALT2 |
collagen beta(1-O)galactosyltransferase 2 |
| chrX_-_32173579 | 0.55 |
ENST00000359836.1 ENST00000343523.2 ENST00000378707.3 ENST00000541735.1 ENST00000474231.1 |
DMD |
dystrophin |
| chr1_+_15480197 | 0.55 |
ENST00000400796.3 ENST00000434578.2 ENST00000376008.2 |
TMEM51 |
transmembrane protein 51 |
| chr1_+_202172848 | 0.55 |
ENST00000255432.7 |
LGR6 |
leucine-rich repeat containing G protein-coupled receptor 6 |
| chr21_+_46117087 | 0.55 |
ENST00000400365.3 |
KRTAP10-12 |
keratin associated protein 10-12 |
| chr8_+_21916710 | 0.55 |
ENST00000523266.1 ENST00000519907.1 |
DMTN |
dematin actin binding protein |
| chr11_-_75062730 | 0.54 |
ENST00000420843.2 ENST00000360025.3 |
ARRB1 |
arrestin, beta 1 |
| chr1_+_13910194 | 0.53 |
ENST00000376057.4 ENST00000510906.1 |
PDPN |
podoplanin |
| chr1_-_28520447 | 0.52 |
ENST00000539896.1 |
PTAFR |
platelet-activating factor receptor |
| chr11_+_60869867 | 0.51 |
ENST00000347785.3 |
CD5 |
CD5 molecule |
| chr16_-_23521710 | 0.51 |
ENST00000562117.1 ENST00000567468.1 ENST00000562944.1 ENST00000309859.4 |
GGA2 |
golgi-associated, gamma adaptin ear containing, ARF binding protein 2 |
| chr12_+_56473939 | 0.51 |
ENST00000450146.2 |
ERBB3 |
v-erb-b2 avian erythroblastic leukemia viral oncogene homolog 3 |
| chr1_+_24646002 | 0.51 |
ENST00000356046.2 |
GRHL3 |
grainyhead-like 3 (Drosophila) |
| chr11_-_75062829 | 0.50 |
ENST00000393505.4 |
ARRB1 |
arrestin, beta 1 |
| chr1_+_24645807 | 0.50 |
ENST00000361548.4 |
GRHL3 |
grainyhead-like 3 (Drosophila) |
| chr22_-_39637135 | 0.50 |
ENST00000440375.1 |
PDGFB |
platelet-derived growth factor beta polypeptide |
| chr1_+_24645865 | 0.49 |
ENST00000342072.4 |
GRHL3 |
grainyhead-like 3 (Drosophila) |
| chr1_+_160765860 | 0.49 |
ENST00000368037.5 |
LY9 |
lymphocyte antigen 9 |
| chr17_+_73717516 | 0.49 |
ENST00000200181.3 ENST00000339591.3 |
ITGB4 |
integrin, beta 4 |
| chr3_-_171177852 | 0.49 |
ENST00000284483.8 ENST00000475336.1 ENST00000357327.5 ENST00000460047.1 ENST00000488470.1 ENST00000470834.1 |
TNIK |
TRAF2 and NCK interacting kinase |
| chr10_+_23983671 | 0.49 |
ENST00000376462.1 |
KIAA1217 |
KIAA1217 |
| chr19_-_38743878 | 0.48 |
ENST00000587515.1 |
PPP1R14A |
protein phosphatase 1, regulatory (inhibitor) subunit 14A |
| chr2_+_74881398 | 0.48 |
ENST00000339773.5 ENST00000434486.1 |
SEMA4F |
sema domain, immunoglobulin domain (Ig), transmembrane domain (TM) and short cytoplasmic domain, (semaphorin) 4F |
| chr1_+_33219592 | 0.48 |
ENST00000373481.3 |
KIAA1522 |
KIAA1522 |
| chr19_-_52035044 | 0.47 |
ENST00000359982.4 ENST00000436458.1 ENST00000425629.3 ENST00000391797.3 ENST00000343300.4 |
SIGLEC6 |
sialic acid binding Ig-like lectin 6 |
| chr3_-_168865522 | 0.47 |
ENST00000464456.1 |
MECOM |
MDS1 and EVI1 complex locus |
| chr12_-_57505121 | 0.47 |
ENST00000538913.2 ENST00000537215.2 ENST00000454075.3 ENST00000554825.1 ENST00000553275.1 ENST00000300134.3 |
STAT6 |
signal transducer and activator of transcription 6, interleukin-4 induced |
| chr5_-_33984786 | 0.47 |
ENST00000296589.4 |
SLC45A2 |
solute carrier family 45, member 2 |
| chr2_+_203499901 | 0.47 |
ENST00000303116.6 ENST00000392238.2 |
FAM117B |
family with sequence similarity 117, member B |
| chr10_+_24497704 | 0.47 |
ENST00000376456.4 ENST00000458595.1 |
KIAA1217 |
KIAA1217 |
| chrX_-_133792480 | 0.46 |
ENST00000359237.4 |
PLAC1 |
placenta-specific 1 |
| chr4_-_143767428 | 0.46 |
ENST00000513000.1 ENST00000509777.1 ENST00000503927.1 |
INPP4B |
inositol polyphosphate-4-phosphatase, type II, 105kDa |
| chr4_-_146859623 | 0.45 |
ENST00000379448.4 ENST00000513320.1 |
ZNF827 |
zinc finger protein 827 |
| chr4_+_103423055 | 0.45 |
ENST00000505458.1 |
NFKB1 |
nuclear factor of kappa light polypeptide gene enhancer in B-cells 1 |
| chr6_-_138820624 | 0.45 |
ENST00000343505.5 |
NHSL1 |
NHS-like 1 |
| chr10_-_103880209 | 0.45 |
ENST00000425280.1 |
LDB1 |
LIM domain binding 1 |
| chr10_-_14590644 | 0.45 |
ENST00000378470.1 |
FAM107B |
family with sequence similarity 107, member B |
| chr4_-_105416039 | 0.45 |
ENST00000394767.2 |
CXXC4 |
CXXC finger protein 4 |
| chr14_+_105147464 | 0.45 |
ENST00000540171.2 |
RP11-982M15.6 |
RP11-982M15.6 |
| chr2_-_74780176 | 0.45 |
ENST00000409549.1 |
LOXL3 |
lysyl oxidase-like 3 |
| chr14_+_22694606 | 0.45 |
ENST00000390463.3 |
TRAV36DV7 |
T cell receptor alpha variable 36/delta variable 7 |
| chr4_-_186732048 | 0.44 |
ENST00000448662.2 ENST00000439049.1 ENST00000420158.1 ENST00000431808.1 ENST00000319471.9 |
SORBS2 |
sorbin and SH3 domain containing 2 |
| chr2_+_11273179 | 0.44 |
ENST00000381585.3 ENST00000405022.3 |
C2orf50 |
chromosome 2 open reading frame 50 |
| chr12_-_24103954 | 0.44 |
ENST00000441133.2 ENST00000545921.1 |
SOX5 |
SRY (sex determining region Y)-box 5 |
| chr16_+_3014269 | 0.44 |
ENST00000575885.1 ENST00000571007.1 ENST00000319500.6 |
KREMEN2 |
kringle containing transmembrane protein 2 |
Gene Ontology Analysis
Gene overrepresentation in biological_process category:
| Log-likelihood per target | Total log-likelihood | Term | Description |
|---|---|---|---|
| 1.1 | 5.6 | GO:0002415 | immunoglobulin transcytosis in epithelial cells mediated by polymeric immunoglobulin receptor(GO:0002415) |
| 0.9 | 9.0 | GO:0032926 | negative regulation of activin receptor signaling pathway(GO:0032926) |
| 0.7 | 2.1 | GO:0018262 | isopeptide cross-linking via N6-(L-isoglutamyl)-L-lysine(GO:0018153) isopeptide cross-linking(GO:0018262) |
| 0.6 | 2.5 | GO:0050712 | negative regulation of interleukin-1 alpha production(GO:0032690) negative regulation of interleukin-1 alpha secretion(GO:0050712) |
| 0.6 | 1.9 | GO:1904328 | regulation of myofibroblast contraction(GO:1904328) myofibroblast contraction(GO:1990764) |
| 0.6 | 2.5 | GO:0046271 | phenylpropanoid catabolic process(GO:0046271) |
| 0.5 | 1.5 | GO:0061536 | glycine secretion(GO:0061536) glycine secretion, neurotransmission(GO:0061537) |
| 0.5 | 3.0 | GO:0006196 | AMP catabolic process(GO:0006196) |
| 0.5 | 1.4 | GO:1904298 | positive regulation of neutrophil degranulation(GO:0043315) cellular response to gravity(GO:0071258) positive regulation of neutrophil activation(GO:1902565) regulation of transcytosis(GO:1904298) positive regulation of transcytosis(GO:1904300) regulation of maternal process involved in parturition(GO:1904301) positive regulation of maternal process involved in parturition(GO:1904303) response to 2-O-acetyl-1-O-hexadecyl-sn-glycero-3-phosphocholine(GO:1904316) cellular response to 2-O-acetyl-1-O-hexadecyl-sn-glycero-3-phosphocholine(GO:1904317) |
| 0.4 | 5.4 | GO:0097283 | keratinocyte apoptotic process(GO:0097283) regulation of keratinocyte apoptotic process(GO:1902172) |
| 0.4 | 1.3 | GO:0033341 | regulation of collagen binding(GO:0033341) |
| 0.4 | 1.3 | GO:0003277 | apoptotic process involved in endocardial cushion morphogenesis(GO:0003277) tendon cell differentiation(GO:0035990) tendon formation(GO:0035992) intermediate mesoderm morphogenesis(GO:0048390) intermediate mesoderm formation(GO:0048391) intermediate mesodermal cell differentiation(GO:0048392) regulation of cardiac muscle fiber development(GO:0055018) positive regulation of cardiac muscle fiber development(GO:0055020) bud dilation involved in lung branching(GO:0060503) BMP signaling pathway involved in ureter morphogenesis(GO:0061149) renal system segmentation(GO:0061150) BMP signaling pathway involved in renal system segmentation(GO:0061151) pulmonary artery endothelial tube morphogenesis(GO:0061155) regulation of transcription from RNA polymerase II promoter involved in mesonephros development(GO:0061216) BMP signaling pathway involved in nephric duct formation(GO:0071893) negative regulation of branch elongation involved in ureteric bud branching(GO:0072096) negative regulation of branch elongation involved in ureteric bud branching by BMP signaling pathway(GO:0072097) anterior/posterior pattern specification involved in ureteric bud development(GO:0072099) specification of ureteric bud anterior/posterior symmetry(GO:0072100) specification of ureteric bud anterior/posterior symmetry by BMP signaling pathway(GO:0072101) ureter epithelial cell differentiation(GO:0072192) negative regulation of mesenchymal cell proliferation involved in ureter development(GO:0072200) positive regulation of cell proliferation involved in outflow tract morphogenesis(GO:1901964) cardiac jelly development(GO:1905072) regulation of metanephric S-shaped body morphogenesis(GO:2000004) negative regulation of metanephric S-shaped body morphogenesis(GO:2000005) regulation of metanephric comma-shaped body morphogenesis(GO:2000006) negative regulation of metanephric comma-shaped body morphogenesis(GO:2000007) |
| 0.4 | 2.0 | GO:1901731 | positive regulation of platelet aggregation(GO:1901731) |
| 0.4 | 1.2 | GO:0060279 | regulation of ovulation(GO:0060278) positive regulation of ovulation(GO:0060279) |
| 0.4 | 1.2 | GO:0032289 | central nervous system myelin formation(GO:0032289) |
| 0.4 | 1.1 | GO:0015770 | disaccharide transport(GO:0015766) sucrose transport(GO:0015770) oligosaccharide transport(GO:0015772) |
| 0.4 | 3.2 | GO:2001268 | negative regulation of cysteine-type endopeptidase activity involved in apoptotic signaling pathway(GO:2001268) |
| 0.3 | 1.3 | GO:0090362 | positive regulation of platelet-derived growth factor production(GO:0090362) |
| 0.3 | 1.3 | GO:0030037 | actin filament reorganization involved in cell cycle(GO:0030037) |
| 0.3 | 0.8 | GO:1903572 | regulation of protein kinase D signaling(GO:1903570) positive regulation of protein kinase D signaling(GO:1903572) |
| 0.3 | 1.0 | GO:0006663 | platelet activating factor biosynthetic process(GO:0006663) |
| 0.3 | 1.0 | GO:0032929 | negative regulation of superoxide anion generation(GO:0032929) |
| 0.3 | 0.8 | GO:0031133 | regulation of axon diameter(GO:0031133) |
| 0.2 | 0.7 | GO:0061073 | ciliary body morphogenesis(GO:0061073) |
| 0.2 | 1.3 | GO:0002803 | positive regulation of antimicrobial peptide production(GO:0002225) positive regulation of antimicrobial humoral response(GO:0002760) positive regulation of antibacterial peptide production(GO:0002803) |
| 0.2 | 0.9 | GO:1905174 | metanephric glomerular mesangial cell development(GO:0072255) reversible differentiation(GO:0090677) cell dedifferentiation involved in phenotypic switching(GO:0090678) positive regulation of phenotypic switching(GO:1900241) regulation of vascular smooth muscle cell dedifferentiation(GO:1905174) positive regulation of vascular smooth muscle cell dedifferentiation(GO:1905176) vascular smooth muscle cell dedifferentiation(GO:1990936) |
| 0.2 | 2.2 | GO:0032287 | peripheral nervous system myelin maintenance(GO:0032287) |
| 0.2 | 2.7 | GO:1902414 | protein localization to cell junction(GO:1902414) |
| 0.2 | 1.3 | GO:0050915 | sensory perception of sour taste(GO:0050915) |
| 0.2 | 1.0 | GO:1903575 | cornified envelope assembly(GO:1903575) |
| 0.2 | 4.8 | GO:0031581 | hemidesmosome assembly(GO:0031581) |
| 0.2 | 1.0 | GO:0070444 | oligodendrocyte progenitor proliferation(GO:0070444) regulation of oligodendrocyte progenitor proliferation(GO:0070445) |
| 0.2 | 2.8 | GO:0035641 | locomotory exploration behavior(GO:0035641) |
| 0.2 | 0.5 | GO:0045226 | extracellular polysaccharide biosynthetic process(GO:0045226) extracellular polysaccharide metabolic process(GO:0046379) |
| 0.2 | 0.9 | GO:0045218 | zonula adherens maintenance(GO:0045218) |
| 0.2 | 0.5 | GO:1900127 | positive regulation of hyaluronan biosynthetic process(GO:1900127) |
| 0.1 | 0.4 | GO:0018057 | peptidyl-lysine oxidation(GO:0018057) |
| 0.1 | 0.6 | GO:0002296 | T-helper 1 cell lineage commitment(GO:0002296) |
| 0.1 | 1.1 | GO:0035524 | proline transmembrane transport(GO:0035524) |
| 0.1 | 1.6 | GO:0002767 | immune response-inhibiting cell surface receptor signaling pathway(GO:0002767) |
| 0.1 | 0.6 | GO:1904327 | protein localization to cytosolic proteasome complex(GO:1904327) protein localization to cytosolic proteasome complex involved in ERAD pathway(GO:1904379) |
| 0.1 | 0.4 | GO:2001226 | negative regulation of chloride transport(GO:2001226) |
| 0.1 | 1.0 | GO:0051121 | hepoxilin metabolic process(GO:0051121) hepoxilin biosynthetic process(GO:0051122) |
| 0.1 | 0.9 | GO:2000491 | positive regulation of hepatic stellate cell activation(GO:2000491) |
| 0.1 | 0.7 | GO:0060266 | negative regulation of respiratory burst involved in inflammatory response(GO:0060266) |
| 0.1 | 0.4 | GO:2000282 | regulation of cellular amine catabolic process(GO:0033241) negative regulation of cellular amine catabolic process(GO:0033242) negative regulation of the force of heart contraction(GO:0098736) regulation of arginine catabolic process(GO:1900081) negative regulation of arginine catabolic process(GO:1900082) regulation of citrulline biosynthetic process(GO:1903248) negative regulation of citrulline biosynthetic process(GO:1903249) regulation of cellular amino acid biosynthetic process(GO:2000282) negative regulation of cellular amino acid biosynthetic process(GO:2000283) |
| 0.1 | 0.5 | GO:0035905 | ascending aorta development(GO:0035905) ascending aorta morphogenesis(GO:0035910) |
| 0.1 | 0.7 | GO:0046985 | positive regulation of hemoglobin biosynthetic process(GO:0046985) |
| 0.1 | 0.1 | GO:0098582 | innate vocalization behavior(GO:0098582) |
| 0.1 | 1.1 | GO:0002329 | pre-B cell differentiation(GO:0002329) |
| 0.1 | 1.1 | GO:2000741 | positive regulation of mesenchymal stem cell differentiation(GO:2000741) |
| 0.1 | 1.1 | GO:0031444 | slow-twitch skeletal muscle fiber contraction(GO:0031444) |
| 0.1 | 2.3 | GO:0060670 | branching involved in labyrinthine layer morphogenesis(GO:0060670) |
| 0.1 | 0.2 | GO:0060061 | Spemann organizer formation(GO:0060061) |
| 0.1 | 0.5 | GO:0090214 | spongiotrophoblast layer developmental growth(GO:0090214) |
| 0.1 | 0.6 | GO:1990523 | bone regeneration(GO:1990523) |
| 0.1 | 0.7 | GO:0038110 | interleukin-2-mediated signaling pathway(GO:0038110) |
| 0.1 | 1.1 | GO:1902902 | negative regulation of autophagosome assembly(GO:1902902) |
| 0.1 | 0.2 | GO:0016080 | synaptic vesicle targeting(GO:0016080) |
| 0.1 | 1.1 | GO:0006600 | creatine metabolic process(GO:0006600) |
| 0.1 | 0.3 | GO:0035408 | histone H3-T6 phosphorylation(GO:0035408) |
| 0.1 | 1.0 | GO:0015705 | iodide transport(GO:0015705) |
| 0.1 | 0.9 | GO:0071286 | cellular response to magnesium ion(GO:0071286) |
| 0.1 | 0.4 | GO:0002268 | follicular dendritic cell differentiation(GO:0002268) |
| 0.1 | 0.3 | GO:1901876 | regulation of calcium ion binding(GO:1901876) negative regulation of calcium ion binding(GO:1901877) |
| 0.1 | 1.5 | GO:0007196 | adenylate cyclase-inhibiting G-protein coupled glutamate receptor signaling pathway(GO:0007196) |
| 0.1 | 2.0 | GO:0072540 | T-helper 17 cell lineage commitment(GO:0072540) |
| 0.1 | 0.9 | GO:0002088 | lens development in camera-type eye(GO:0002088) |
| 0.1 | 0.4 | GO:0061092 | regulation of phospholipid translocation(GO:0061091) positive regulation of phospholipid translocation(GO:0061092) |
| 0.1 | 0.4 | GO:0071469 | detection of mechanical stimulus involved in sensory perception of touch(GO:0050976) cellular response to alkaline pH(GO:0071469) |
| 0.1 | 1.0 | GO:0090240 | positive regulation of histone H4 acetylation(GO:0090240) |
| 0.1 | 0.4 | GO:1901842 | negative regulation of high voltage-gated calcium channel activity(GO:1901842) |
| 0.1 | 0.1 | GO:1900104 | hyaluranon cable assembly(GO:0036118) regulation of hyaluranon cable assembly(GO:1900104) positive regulation of hyaluranon cable assembly(GO:1900106) |
| 0.1 | 0.3 | GO:0006738 | nicotinamide riboside catabolic process(GO:0006738) nicotinamide riboside metabolic process(GO:0046495) pyridine nucleoside metabolic process(GO:0070637) pyridine nucleoside catabolic process(GO:0070638) |
| 0.1 | 1.5 | GO:0097264 | self proteolysis(GO:0097264) |
| 0.1 | 0.5 | GO:0007352 | zygotic specification of dorsal/ventral axis(GO:0007352) |
| 0.1 | 0.4 | GO:0043542 | endothelial cell migration(GO:0043542) |
| 0.1 | 1.1 | GO:0070424 | regulation of nucleotide-binding oligomerization domain containing signaling pathway(GO:0070424) |
| 0.1 | 0.4 | GO:0071233 | cellular response to leucine(GO:0071233) |
| 0.1 | 0.4 | GO:0099538 | synaptic signaling via neuropeptide(GO:0099538) trans-synaptic signaling by neuropeptide(GO:0099540) trans-synaptic signaling by neuropeptide, modulating synaptic transmission(GO:0099551) |
| 0.1 | 0.2 | GO:0051885 | positive regulation of anagen(GO:0051885) |
| 0.1 | 0.3 | GO:1903659 | regulation of complement-dependent cytotoxicity(GO:1903659) |
| 0.1 | 0.4 | GO:1904158 | axonemal central apparatus assembly(GO:1904158) |
| 0.1 | 0.5 | GO:0034383 | low-density lipoprotein particle clearance(GO:0034383) |
| 0.1 | 1.3 | GO:0090179 | planar cell polarity pathway involved in neural tube closure(GO:0090179) |
| 0.1 | 0.2 | GO:1902630 | regulation of membrane hyperpolarization(GO:1902630) |
| 0.1 | 0.4 | GO:0006710 | androgen catabolic process(GO:0006710) |
| 0.1 | 0.1 | GO:2000051 | negative regulation of non-canonical Wnt signaling pathway(GO:2000051) |
| 0.1 | 0.8 | GO:0060075 | regulation of resting membrane potential(GO:0060075) |
| 0.1 | 0.7 | GO:1904352 | positive regulation of protein catabolic process in the vacuole(GO:1904352) |
| 0.1 | 0.4 | GO:2000490 | negative regulation of hepatic stellate cell activation(GO:2000490) |
| 0.1 | 0.5 | GO:0007256 | activation of JNKK activity(GO:0007256) |
| 0.1 | 0.1 | GO:0014734 | skeletal muscle hypertrophy(GO:0014734) |
| 0.1 | 1.0 | GO:0006703 | estrogen biosynthetic process(GO:0006703) |
| 0.1 | 2.1 | GO:0007141 | male meiosis I(GO:0007141) |
| 0.1 | 0.3 | GO:0090038 | negative regulation of protein kinase C signaling(GO:0090038) |
| 0.1 | 0.8 | GO:0035360 | positive regulation of peroxisome proliferator activated receptor signaling pathway(GO:0035360) |
| 0.1 | 0.5 | GO:0097475 | motor neuron migration(GO:0097475) |
| 0.1 | 0.2 | GO:1905205 | positive regulation of connective tissue replacement(GO:1905205) |
| 0.1 | 0.2 | GO:1902725 | trans-synaptic signaling by trans-synaptic complex(GO:0099545) negative regulation of satellite cell differentiation(GO:1902725) |
| 0.1 | 0.6 | GO:0042908 | xenobiotic transport(GO:0042908) |
| 0.1 | 0.1 | GO:0072718 | response to cisplatin(GO:0072718) |
| 0.1 | 0.3 | GO:0001951 | intestinal D-glucose absorption(GO:0001951) |
| 0.1 | 1.3 | GO:0003334 | keratinocyte development(GO:0003334) |
| 0.1 | 0.2 | GO:0060370 | susceptibility to T cell mediated cytotoxicity(GO:0060370) |
| 0.1 | 0.4 | GO:0014877 | response to muscle inactivity involved in regulation of muscle adaptation(GO:0014877) response to denervation involved in regulation of muscle adaptation(GO:0014894) |
| 0.1 | 1.7 | GO:0071624 | positive regulation of granulocyte chemotaxis(GO:0071624) |
| 0.1 | 1.6 | GO:0090162 | establishment of epithelial cell polarity(GO:0090162) |
| 0.1 | 0.1 | GO:0090206 | negative regulation of cholesterol biosynthetic process(GO:0045541) negative regulation of cholesterol metabolic process(GO:0090206) |
| 0.1 | 0.3 | GO:0006072 | glycerol-3-phosphate metabolic process(GO:0006072) |
| 0.1 | 0.2 | GO:1903697 | negative regulation of microvillus assembly(GO:1903697) |
| 0.1 | 0.2 | GO:0060681 | branch elongation involved in ureteric bud branching(GO:0060681) |
| 0.1 | 0.6 | GO:0014809 | regulation of skeletal muscle contraction by regulation of release of sequestered calcium ion(GO:0014809) |
| 0.0 | 0.3 | GO:0032468 | Golgi calcium ion homeostasis(GO:0032468) |
| 0.0 | 0.2 | GO:0000711 | meiotic DNA repair synthesis(GO:0000711) |
| 0.0 | 1.0 | GO:0014733 | regulation of skeletal muscle adaptation(GO:0014733) |
| 0.0 | 0.4 | GO:0072205 | metanephric collecting duct development(GO:0072205) |
| 0.0 | 0.7 | GO:0000050 | urea cycle(GO:0000050) |
| 0.0 | 1.5 | GO:0060445 | branching involved in salivary gland morphogenesis(GO:0060445) |
| 0.0 | 1.2 | GO:0006750 | glutathione biosynthetic process(GO:0006750) |
| 0.0 | 0.2 | GO:0003409 | optic cup structural organization(GO:0003409) |
| 0.0 | 0.1 | GO:0045659 | regulation of eosinophil differentiation(GO:0045643) positive regulation of eosinophil differentiation(GO:0045645) regulation of neutrophil differentiation(GO:0045658) negative regulation of neutrophil differentiation(GO:0045659) |
| 0.0 | 0.2 | GO:0048842 | positive regulation of axon extension involved in axon guidance(GO:0048842) |
| 0.0 | 0.2 | GO:0060332 | positive regulation of response to interferon-gamma(GO:0060332) positive regulation of interferon-gamma-mediated signaling pathway(GO:0060335) |
| 0.0 | 0.1 | GO:0060164 | regulation of timing of neuron differentiation(GO:0060164) |
| 0.0 | 0.1 | GO:0003415 | chondrocyte hypertrophy(GO:0003415) |
| 0.0 | 0.1 | GO:0016525 | negative regulation of angiogenesis(GO:0016525) negative regulation of blood vessel morphogenesis(GO:2000181) |
| 0.0 | 0.3 | GO:0002084 | protein depalmitoylation(GO:0002084) |
| 0.0 | 0.2 | GO:0034154 | toll-like receptor 7 signaling pathway(GO:0034154) |
| 0.0 | 0.3 | GO:0019236 | response to pheromone(GO:0019236) |
| 0.0 | 0.3 | GO:0070649 | polar body extrusion after meiotic divisions(GO:0040038) formin-nucleated actin cable assembly(GO:0070649) |
| 0.0 | 0.2 | GO:0015692 | lead ion transport(GO:0015692) |
| 0.0 | 0.8 | GO:0071481 | cellular response to X-ray(GO:0071481) |
| 0.0 | 0.2 | GO:0034436 | glycoprotein transport(GO:0034436) |
| 0.0 | 0.1 | GO:0071393 | cellular response to progesterone stimulus(GO:0071393) |
| 0.0 | 0.1 | GO:0030222 | eosinophil differentiation(GO:0030222) |
| 0.0 | 0.3 | GO:0048050 | post-embryonic eye morphogenesis(GO:0048050) |
| 0.0 | 1.2 | GO:0042994 | cytoplasmic sequestering of transcription factor(GO:0042994) |
| 0.0 | 0.3 | GO:0060315 | negative regulation of ryanodine-sensitive calcium-release channel activity(GO:0060315) |
| 0.0 | 0.3 | GO:0033183 | negative regulation of histone ubiquitination(GO:0033183) regulation of histone H2A K63-linked ubiquitination(GO:1901314) negative regulation of histone H2A K63-linked ubiquitination(GO:1901315) |
| 0.0 | 0.2 | GO:0001757 | somite specification(GO:0001757) |
| 0.0 | 0.1 | GO:1900369 | negative regulation of RNA interference(GO:1900369) |
| 0.0 | 0.1 | GO:0071895 | odontoblast differentiation(GO:0071895) |
| 0.0 | 0.7 | GO:0018298 | protein-chromophore linkage(GO:0018298) |
| 0.0 | 0.9 | GO:0070886 | positive regulation of calcineurin-NFAT signaling cascade(GO:0070886) |
| 0.0 | 3.6 | GO:0006970 | response to osmotic stress(GO:0006970) |
| 0.0 | 0.0 | GO:1903895 | negative regulation of IRE1-mediated unfolded protein response(GO:1903895) |
| 0.0 | 0.1 | GO:0002101 | tRNA wobble cytosine modification(GO:0002101) |
| 0.0 | 0.5 | GO:0016998 | cell wall macromolecule catabolic process(GO:0016998) |
| 0.0 | 0.3 | GO:1902866 | regulation of retina development in camera-type eye(GO:1902866) |
| 0.0 | 0.3 | GO:0007221 | positive regulation of transcription of Notch receptor target(GO:0007221) |
| 0.0 | 1.0 | GO:0070286 | axonemal dynein complex assembly(GO:0070286) |
| 0.0 | 0.1 | GO:1904719 | excitatory chemical synaptic transmission(GO:0098976) regulation of AMPA glutamate receptor clustering(GO:1904717) positive regulation of AMPA glutamate receptor clustering(GO:1904719) |
| 0.0 | 0.3 | GO:1902572 | negative regulation of serine-type endopeptidase activity(GO:1900004) negative regulation of serine-type peptidase activity(GO:1902572) |
| 0.0 | 0.5 | GO:0050965 | detection of temperature stimulus involved in sensory perception(GO:0050961) detection of temperature stimulus involved in sensory perception of pain(GO:0050965) |
| 0.0 | 1.8 | GO:0034260 | negative regulation of GTPase activity(GO:0034260) |
| 0.0 | 0.3 | GO:0010635 | regulation of mitochondrial fusion(GO:0010635) |
| 0.0 | 1.1 | GO:0021591 | ventricular system development(GO:0021591) |
| 0.0 | 0.1 | GO:0070236 | negative regulation of activation-induced cell death of T cells(GO:0070236) |
| 0.0 | 0.1 | GO:0050932 | regulation of melanocyte differentiation(GO:0045634) positive regulation of melanocyte differentiation(GO:0045636) positive regulation of developmental pigmentation(GO:0048087) regulation of pigment cell differentiation(GO:0050932) positive regulation of pigment cell differentiation(GO:0050942) positive regulation of neuroepithelial cell differentiation(GO:1902913) |
| 0.0 | 0.3 | GO:0002051 | osteoblast fate commitment(GO:0002051) |
| 0.0 | 0.1 | GO:0046013 | T cell homeostatic proliferation(GO:0001777) regulation of T cell homeostatic proliferation(GO:0046013) |
| 0.0 | 2.1 | GO:0008088 | axo-dendritic transport(GO:0008088) |
| 0.0 | 0.1 | GO:0015842 | aminergic neurotransmitter loading into synaptic vesicle(GO:0015842) |
| 0.0 | 1.9 | GO:0018149 | peptide cross-linking(GO:0018149) |
| 0.0 | 0.1 | GO:1903568 | negative regulation of protein localization to cilium(GO:1903565) regulation of protein localization to ciliary membrane(GO:1903567) negative regulation of protein localization to ciliary membrane(GO:1903568) |
| 0.0 | 0.1 | GO:0034476 | U1 snRNA 3'-end processing(GO:0034473) U5 snRNA 3'-end processing(GO:0034476) |
| 0.0 | 0.1 | GO:0050917 | sensory perception of sweet taste(GO:0050916) sensory perception of umami taste(GO:0050917) |
| 0.0 | 0.2 | GO:0019060 | intracellular transport of viral protein in host cell(GO:0019060) symbiont intracellular protein transport in host(GO:0030581) intracellular protein transport in other organism involved in symbiotic interaction(GO:0051708) |
| 0.0 | 0.2 | GO:0070544 | histone H3-K36 demethylation(GO:0070544) |
| 0.0 | 0.1 | GO:0045586 | regulation of gamma-delta T cell differentiation(GO:0045586) |
| 0.0 | 0.1 | GO:0043397 | corticotropin-releasing hormone secretion(GO:0043396) regulation of corticotropin-releasing hormone secretion(GO:0043397) |
| 0.0 | 0.4 | GO:0015732 | prostaglandin transport(GO:0015732) |
| 0.0 | 0.1 | GO:0050902 | leukocyte adhesive activation(GO:0050902) |
| 0.0 | 0.2 | GO:0097411 | hypoxia-inducible factor-1alpha signaling pathway(GO:0097411) |
| 0.0 | 0.1 | GO:0033578 | protein glycosylation in Golgi(GO:0033578) |
| 0.0 | 0.1 | GO:0045953 | negative regulation of natural killer cell mediated cytotoxicity(GO:0045953) |
| 0.0 | 0.1 | GO:2000721 | positive regulation of transcription from RNA polymerase II promoter involved in smooth muscle cell differentiation(GO:2000721) |
| 0.0 | 0.0 | GO:2000296 | negative regulation of hydrogen peroxide catabolic process(GO:2000296) |
| 0.0 | 0.5 | GO:0035988 | chondrocyte proliferation(GO:0035988) |
| 0.0 | 0.4 | GO:0010944 | negative regulation of transcription by competitive promoter binding(GO:0010944) |
| 0.0 | 1.5 | GO:1904837 | beta-catenin-TCF complex assembly(GO:1904837) |
| 0.0 | 0.3 | GO:0099638 | endosome to plasma membrane protein transport(GO:0099638) |
| 0.0 | 0.2 | GO:2000400 | positive regulation of T cell differentiation in thymus(GO:0033089) positive regulation of thymocyte aggregation(GO:2000400) |
| 0.0 | 0.0 | GO:0032423 | regulation of mismatch repair(GO:0032423) positive regulation of mismatch repair(GO:0032425) |
| 0.0 | 0.1 | GO:0006836 | neurotransmitter transport(GO:0006836) |
| 0.0 | 0.1 | GO:0050771 | negative regulation of axonogenesis(GO:0050771) |
| 0.0 | 0.7 | GO:0034389 | lipid particle organization(GO:0034389) |
| 0.0 | 0.2 | GO:1902739 | interferon-alpha secretion(GO:0072642) regulation of interferon-alpha secretion(GO:1902739) positive regulation of interferon-alpha secretion(GO:1902741) |
| 0.0 | 0.6 | GO:0016254 | preassembly of GPI anchor in ER membrane(GO:0016254) |
| 0.0 | 0.5 | GO:0003301 | physiological muscle hypertrophy(GO:0003298) physiological cardiac muscle hypertrophy(GO:0003301) cell growth involved in cardiac muscle cell development(GO:0061049) |
| 0.0 | 0.1 | GO:0043324 | eye pigment biosynthetic process(GO:0006726) eye pigment metabolic process(GO:0042441) pigment metabolic process involved in developmental pigmentation(GO:0043324) pigment metabolic process involved in pigmentation(GO:0043474) |
| 0.0 | 0.4 | GO:0072643 | interferon-gamma secretion(GO:0072643) |
| 0.0 | 0.1 | GO:0048690 | modulation by virus of host transcription(GO:0019056) regulation of sprouting of injured axon(GO:0048686) positive regulation of sprouting of injured axon(GO:0048687) regulation of axon extension involved in regeneration(GO:0048690) positive regulation of axon extension involved in regeneration(GO:0048691) modulation by symbiont of host transcription(GO:0052026) |
| 0.0 | 0.6 | GO:0030517 | negative regulation of axon extension(GO:0030517) |
| 0.0 | 0.3 | GO:0048266 | behavioral response to pain(GO:0048266) |
| 0.0 | 0.4 | GO:0045332 | phospholipid translocation(GO:0045332) |
| 0.0 | 0.3 | GO:0090361 | platelet-derived growth factor production(GO:0090360) regulation of platelet-derived growth factor production(GO:0090361) |
| 0.0 | 0.4 | GO:0035728 | response to hepatocyte growth factor(GO:0035728) |
| 0.0 | 0.2 | GO:0007217 | tachykinin receptor signaling pathway(GO:0007217) |
| 0.0 | 6.0 | GO:0007266 | Rho protein signal transduction(GO:0007266) |
| 0.0 | 0.4 | GO:0050930 | induction of positive chemotaxis(GO:0050930) |
| 0.0 | 0.0 | GO:0030224 | monocyte differentiation(GO:0030224) |
| 0.0 | 0.1 | GO:0019418 | sulfide oxidation(GO:0019418) sulfide oxidation, using sulfide:quinone oxidoreductase(GO:0070221) |
| 0.0 | 0.4 | GO:0007171 | activation of transmembrane receptor protein tyrosine kinase activity(GO:0007171) |
| 0.0 | 0.2 | GO:0035095 | behavioral response to nicotine(GO:0035095) |
| 0.0 | 0.2 | GO:0035279 | mRNA cleavage involved in gene silencing by miRNA(GO:0035279) mRNA cleavage involved in gene silencing(GO:0098795) |
| 0.0 | 0.1 | GO:0070358 | actin polymerization-dependent cell motility(GO:0070358) |
| 0.0 | 0.1 | GO:0031914 | negative regulation of synaptic plasticity(GO:0031914) |
| 0.0 | 1.3 | GO:0007585 | respiratory gaseous exchange(GO:0007585) |
| 0.0 | 0.1 | GO:0051792 | medium-chain fatty acid biosynthetic process(GO:0051792) |
| 0.0 | 0.1 | GO:1901223 | negative regulation of NIK/NF-kappaB signaling(GO:1901223) |
| 0.0 | 0.1 | GO:0080009 | mRNA methylation(GO:0080009) |
| 0.0 | 0.0 | GO:0001575 | globoside metabolic process(GO:0001575) |
| 0.0 | 0.1 | GO:0002023 | reduction of food intake in response to dietary excess(GO:0002023) |
| 0.0 | 0.1 | GO:0072364 | regulation of cellular ketone metabolic process by regulation of transcription from RNA polymerase II promoter(GO:0072364) |
| 0.0 | 0.1 | GO:0032581 | ER-dependent peroxisome organization(GO:0032581) |
| 0.0 | 0.1 | GO:0007406 | negative regulation of neuroblast proliferation(GO:0007406) |
| 0.0 | 0.1 | GO:0090309 | positive regulation of methylation-dependent chromatin silencing(GO:0090309) |
| 0.0 | 0.1 | GO:0033132 | negative regulation of glucokinase activity(GO:0033132) negative regulation of hexokinase activity(GO:1903300) |
| 0.0 | 0.2 | GO:0000290 | deadenylation-dependent decapping of nuclear-transcribed mRNA(GO:0000290) |
| 0.0 | 0.1 | GO:0006013 | mannose metabolic process(GO:0006013) |
| 0.0 | 0.0 | GO:0072717 | response to actinomycin D(GO:0072716) cellular response to actinomycin D(GO:0072717) |
| 0.0 | 0.1 | GO:0045078 | positive regulation of interferon-gamma biosynthetic process(GO:0045078) |
| 0.0 | 0.4 | GO:0045663 | positive regulation of myoblast differentiation(GO:0045663) |
| 0.0 | 0.2 | GO:0002076 | osteoblast development(GO:0002076) |
| 0.0 | 2.3 | GO:0006024 | glycosaminoglycan biosynthetic process(GO:0006024) |
| 0.0 | 0.4 | GO:1904659 | hexose transmembrane transport(GO:0035428) glucose transmembrane transport(GO:1904659) |
| 0.0 | 0.6 | GO:0097435 | fibril organization(GO:0097435) |
| 0.0 | 0.2 | GO:0010886 | positive regulation of cholesterol storage(GO:0010886) |
| 0.0 | 0.3 | GO:0007413 | axonal fasciculation(GO:0007413) |
| 0.0 | 0.1 | GO:2000275 | cellular amide catabolic process(GO:0043605) regulation of oxidative phosphorylation uncoupler activity(GO:2000275) |
| 0.0 | 0.1 | GO:0071321 | positive regulation of oocyte development(GO:0060282) cellular response to cGMP(GO:0071321) |
| 0.0 | 0.1 | GO:0060161 | positive regulation of dopamine receptor signaling pathway(GO:0060161) |
| 0.0 | 0.1 | GO:1903445 | intermembrane transport(GO:0046909) protein transport from ciliary membrane to plasma membrane(GO:1903445) |
| 0.0 | 0.1 | GO:0001967 | suckling behavior(GO:0001967) |
| 0.0 | 0.9 | GO:0016266 | O-glycan processing(GO:0016266) |
| 0.0 | 0.3 | GO:0050901 | leukocyte tethering or rolling(GO:0050901) |
| 0.0 | 0.5 | GO:0071425 | hematopoietic stem cell proliferation(GO:0071425) |
| 0.0 | 0.2 | GO:1904886 | beta-catenin destruction complex disassembly(GO:1904886) |
| 0.0 | 0.1 | GO:0030916 | otic vesicle formation(GO:0030916) |
| 0.0 | 0.3 | GO:0048934 | peripheral nervous system neuron differentiation(GO:0048934) peripheral nervous system neuron development(GO:0048935) |
| 0.0 | 0.2 | GO:0043010 | camera-type eye development(GO:0043010) |
| 0.0 | 0.1 | GO:0042428 | serotonin metabolic process(GO:0042428) |
| 0.0 | 0.1 | GO:0071344 | diphosphate metabolic process(GO:0071344) |
| 0.0 | 1.2 | GO:0003333 | amino acid transmembrane transport(GO:0003333) |
| 0.0 | 0.1 | GO:0010587 | miRNA catabolic process(GO:0010587) |
| 0.0 | 0.4 | GO:0045880 | positive regulation of smoothened signaling pathway(GO:0045880) |
| 0.0 | 0.1 | GO:0038060 | nitric oxide-cGMP-mediated signaling pathway(GO:0038060) |
| 0.0 | 0.3 | GO:0010738 | regulation of protein kinase A signaling(GO:0010738) |
| 0.0 | 0.1 | GO:1901164 | negative regulation of trophoblast cell migration(GO:1901164) |
| 0.0 | 0.1 | GO:0010571 | positive regulation of nuclear cell cycle DNA replication(GO:0010571) |
| 0.0 | 0.1 | GO:0044571 | [2Fe-2S] cluster assembly(GO:0044571) |
| 0.0 | 0.6 | GO:0030279 | negative regulation of ossification(GO:0030279) |
| 0.0 | 0.1 | GO:0016188 | synaptic vesicle maturation(GO:0016188) |
| 0.0 | 0.1 | GO:0048007 | antigen processing and presentation of lipid antigen via MHC class Ib(GO:0048003) antigen processing and presentation, exogenous lipid antigen via MHC class Ib(GO:0048007) |
| 0.0 | 0.1 | GO:0018344 | protein geranylgeranylation(GO:0018344) |
| 0.0 | 0.2 | GO:0038092 | nodal signaling pathway(GO:0038092) |
| 0.0 | 0.1 | GO:0032688 | negative regulation of interferon-beta production(GO:0032688) |
| 0.0 | 0.1 | GO:0031915 | positive regulation of synaptic plasticity(GO:0031915) |
| 0.0 | 0.0 | GO:0019836 | hemolysis by symbiont of host erythrocytes(GO:0019836) hemolysis in other organism(GO:0044179) hemolysis in other organism involved in symbiotic interaction(GO:0052331) |
| 0.0 | 0.1 | GO:0019075 | virus maturation(GO:0019075) |
| 0.0 | 1.2 | GO:0043647 | inositol phosphate metabolic process(GO:0043647) |
| 0.0 | 0.0 | GO:0008628 | hormone-mediated apoptotic signaling pathway(GO:0008628) |
| 0.0 | 0.0 | GO:0060574 | intestinal epithelial cell maturation(GO:0060574) |
| 0.0 | 0.1 | GO:0043922 | negative regulation by host of viral transcription(GO:0043922) |
| 0.0 | 0.0 | GO:0042796 | snRNA transcription from RNA polymerase III promoter(GO:0042796) |
| 0.0 | 0.1 | GO:0018230 | peptidyl-L-cysteine S-palmitoylation(GO:0018230) peptidyl-S-diacylglycerol-L-cysteine biosynthetic process from peptidyl-cysteine(GO:0018231) |
| 0.0 | 0.3 | GO:0048268 | clathrin coat assembly(GO:0048268) |
| 0.0 | 0.3 | GO:0045063 | T-helper 1 cell differentiation(GO:0045063) |
| 0.0 | 0.1 | GO:0007042 | lysosomal lumen acidification(GO:0007042) |
| 0.0 | 0.0 | GO:0060736 | prostate gland growth(GO:0060736) |
| 0.0 | 0.0 | GO:0090100 | positive regulation of transmembrane receptor protein serine/threonine kinase signaling pathway(GO:0090100) |
| 0.0 | 0.3 | GO:0090200 | positive regulation of release of cytochrome c from mitochondria(GO:0090200) |
| 0.0 | 0.2 | GO:0035518 | histone H2A monoubiquitination(GO:0035518) |
| 0.0 | 0.2 | GO:0002456 | T cell mediated immunity(GO:0002456) |
| 0.0 | 0.3 | GO:0060384 | innervation(GO:0060384) |
| 0.0 | 0.1 | GO:0019934 | cGMP-mediated signaling(GO:0019934) |
| 0.0 | 0.1 | GO:0031648 | protein destabilization(GO:0031648) |
| 0.0 | 0.1 | GO:0000055 | ribosomal large subunit export from nucleus(GO:0000055) ribosomal small subunit export from nucleus(GO:0000056) |
| 0.0 | 0.1 | GO:1904903 | ESCRT complex disassembly(GO:1904896) ESCRT III complex disassembly(GO:1904903) |
Gene overrepresentation in cellular_component category:
| Log-likelihood per target | Total log-likelihood | Term | Description |
|---|---|---|---|
| 0.4 | 2.1 | GO:0097123 | cyclin A1-CDK2 complex(GO:0097123) |
| 0.3 | 1.0 | GO:0072534 | perineuronal net(GO:0072534) |
| 0.3 | 2.5 | GO:0005610 | laminin-5 complex(GO:0005610) |
| 0.3 | 1.3 | GO:0034666 | integrin alpha2-beta1 complex(GO:0034666) |
| 0.2 | 1.4 | GO:0097129 | cyclin D2-CDK4 complex(GO:0097129) |
| 0.2 | 0.7 | GO:0043512 | inhibin complex(GO:0043511) inhibin A complex(GO:0043512) |
| 0.2 | 1.3 | GO:0097209 | epidermal lamellar body(GO:0097209) |
| 0.2 | 1.9 | GO:0097197 | tetraspanin-enriched microdomain(GO:0097197) |
| 0.2 | 0.8 | GO:1902937 | inward rectifier potassium channel complex(GO:1902937) |
| 0.1 | 2.4 | GO:0035253 | ciliary rootlet(GO:0035253) |
| 0.1 | 2.4 | GO:0012510 | trans-Golgi network transport vesicle membrane(GO:0012510) |
| 0.1 | 0.6 | GO:0071818 | BAT3 complex(GO:0071818) ER membrane insertion complex(GO:0072379) |
| 0.1 | 2.2 | GO:0031095 | platelet dense tubular network membrane(GO:0031095) |
| 0.1 | 0.4 | GO:0033257 | Bcl3/NF-kappaB2 complex(GO:0033257) |
| 0.1 | 2.3 | GO:0030056 | hemidesmosome(GO:0030056) |
| 0.1 | 7.6 | GO:0055038 | recycling endosome membrane(GO:0055038) |
| 0.1 | 0.9 | GO:0005915 | zonula adherens(GO:0005915) |
| 0.1 | 0.6 | GO:0033256 | I-kappaB/NF-kappaB complex(GO:0033256) |
| 0.1 | 0.4 | GO:1990131 | Gtr1-Gtr2 GTPase complex(GO:1990131) |
| 0.1 | 0.3 | GO:0031251 | PAN complex(GO:0031251) |
| 0.1 | 1.6 | GO:0005861 | troponin complex(GO:0005861) |
| 0.1 | 0.4 | GO:0042272 | nuclear RNA export factor complex(GO:0042272) |
| 0.1 | 0.6 | GO:0046581 | intercellular canaliculus(GO:0046581) |
| 0.1 | 0.6 | GO:0016013 | syntrophin complex(GO:0016013) |
| 0.1 | 0.4 | GO:1990393 | 3M complex(GO:1990393) |
| 0.0 | 1.1 | GO:0001527 | microfibril(GO:0001527) fibril(GO:0043205) |
| 0.0 | 0.1 | GO:0097059 | CNTFR-CLCF1 complex(GO:0097059) |
| 0.0 | 2.3 | GO:0001772 | immunological synapse(GO:0001772) |
| 0.0 | 0.2 | GO:0036502 | Derlin-1-VIMP complex(GO:0036502) |
| 0.0 | 1.9 | GO:0046658 | anchored component of plasma membrane(GO:0046658) |
| 0.0 | 0.2 | GO:0070826 | paraferritin complex(GO:0070826) |
| 0.0 | 0.2 | GO:0005967 | mitochondrial pyruvate dehydrogenase complex(GO:0005967) |
| 0.0 | 1.8 | GO:0033017 | sarcoplasmic reticulum membrane(GO:0033017) |
| 0.0 | 1.0 | GO:0031143 | pseudopodium(GO:0031143) |
| 0.0 | 0.1 | GO:0070081 | clathrin-sculpted monoamine transport vesicle(GO:0070081) clathrin-sculpted monoamine transport vesicle membrane(GO:0070083) |
| 0.0 | 5.6 | GO:0043202 | lysosomal lumen(GO:0043202) |
| 0.0 | 3.1 | GO:1904724 | tertiary granule lumen(GO:1904724) |
| 0.0 | 0.1 | GO:0034678 | integrin alpha8-beta1 complex(GO:0034678) |
| 0.0 | 1.5 | GO:0005790 | smooth endoplasmic reticulum(GO:0005790) |
| 0.0 | 1.8 | GO:0001533 | cornified envelope(GO:0001533) |
| 0.0 | 0.1 | GO:0005968 | Rab-protein geranylgeranyltransferase complex(GO:0005968) |
| 0.0 | 0.1 | GO:0038039 | G-protein coupled receptor heterodimeric complex(GO:0038039) |
| 0.0 | 0.4 | GO:0000506 | glycosylphosphatidylinositol-N-acetylglucosaminyltransferase (GPI-GnT) complex(GO:0000506) |
| 0.0 | 0.3 | GO:0060091 | kinocilium(GO:0060091) |
| 0.0 | 0.2 | GO:0016012 | sarcoglycan complex(GO:0016012) |
| 0.0 | 0.5 | GO:0033162 | melanosome membrane(GO:0033162) chitosome(GO:0045009) |
| 0.0 | 0.1 | GO:0097489 | multivesicular body, internal vesicle lumen(GO:0097489) |
| 0.0 | 0.1 | GO:0031515 | tRNA (m1A) methyltransferase complex(GO:0031515) |
| 0.0 | 0.2 | GO:0005955 | calcineurin complex(GO:0005955) |
| 0.0 | 0.8 | GO:0097381 | photoreceptor disc membrane(GO:0097381) |
| 0.0 | 1.3 | GO:0098857 | membrane raft(GO:0045121) membrane microdomain(GO:0098857) |
| 0.0 | 0.1 | GO:0090498 | extrinsic component of Golgi membrane(GO:0090498) |
| 0.0 | 0.1 | GO:0005602 | complement component C1 complex(GO:0005602) |
| 0.0 | 2.0 | GO:0005796 | Golgi lumen(GO:0005796) |
| 0.0 | 0.2 | GO:0036157 | outer dynein arm(GO:0036157) |
| 0.0 | 0.3 | GO:0016010 | dystrophin-associated glycoprotein complex(GO:0016010) glycoprotein complex(GO:0090665) |
| 0.0 | 0.1 | GO:0005879 | axonemal microtubule(GO:0005879) |
| 0.0 | 0.2 | GO:0032009 | early phagosome(GO:0032009) |
| 0.0 | 2.2 | GO:0070821 | tertiary granule membrane(GO:0070821) |
| 0.0 | 0.3 | GO:0097433 | dense body(GO:0097433) |
| 0.0 | 0.2 | GO:0031519 | PcG protein complex(GO:0031519) |
| 0.0 | 3.4 | GO:0001650 | fibrillar center(GO:0001650) |
| 0.0 | 1.0 | GO:0016324 | apical plasma membrane(GO:0016324) |
| 0.0 | 2.4 | GO:0101002 | ficolin-1-rich granule(GO:0101002) ficolin-1-rich granule lumen(GO:1904813) |
| 0.0 | 0.0 | GO:0001534 | radial spoke(GO:0001534) |
| 0.0 | 0.2 | GO:0097524 | sperm plasma membrane(GO:0097524) |
| 0.0 | 3.0 | GO:0005923 | bicellular tight junction(GO:0005923) |
| 0.0 | 0.0 | GO:0098855 | HCN channel complex(GO:0098855) |
| 0.0 | 0.1 | GO:0044530 | supraspliceosomal complex(GO:0044530) |
| 0.0 | 0.1 | GO:0031417 | NatC complex(GO:0031417) |
| 0.0 | 0.1 | GO:0070554 | synaptobrevin 2-SNAP-25-syntaxin-3-complexin complex(GO:0070554) |
| 0.0 | 0.3 | GO:0044295 | axonal growth cone(GO:0044295) |
| 0.0 | 1.4 | GO:0032580 | Golgi cisterna membrane(GO:0032580) |
| 0.0 | 0.4 | GO:0097228 | sperm principal piece(GO:0097228) |
| 0.0 | 0.2 | GO:0005694 | chromosome(GO:0005694) |
| 0.0 | 0.5 | GO:0030131 | clathrin adaptor complex(GO:0030131) |
| 0.0 | 0.1 | GO:0017053 | transcriptional repressor complex(GO:0017053) |
| 0.0 | 0.4 | GO:0045095 | keratin filament(GO:0045095) |
| 0.0 | 0.0 | GO:0016342 | catenin complex(GO:0016342) |
| 0.0 | 0.1 | GO:0043240 | Fanconi anaemia nuclear complex(GO:0043240) |
| 0.0 | 0.1 | GO:0005854 | nascent polypeptide-associated complex(GO:0005854) |
| 0.0 | 0.0 | GO:0000811 | GINS complex(GO:0000811) |
| 0.0 | 0.1 | GO:0002178 | palmitoyltransferase complex(GO:0002178) |
Gene overrepresentation in molecular_function category:
| Log-likelihood per target | Total log-likelihood | Term | Description |
|---|---|---|---|
| 0.5 | 2.5 | GO:0004910 | interleukin-1, Type II, blocking receptor activity(GO:0004910) |
| 0.5 | 8.3 | GO:0048185 | activin binding(GO:0048185) |
| 0.4 | 1.3 | GO:0070699 | type II activin receptor binding(GO:0070699) |
| 0.4 | 2.5 | GO:0042577 | lipid phosphatase activity(GO:0042577) |
| 0.4 | 1.5 | GO:0015375 | glycine:sodium symporter activity(GO:0015375) |
| 0.4 | 1.1 | GO:0008506 | sucrose:proton symporter activity(GO:0008506) sucrose transmembrane transporter activity(GO:0008515) disaccharide transmembrane transporter activity(GO:0015154) oligosaccharide transmembrane transporter activity(GO:0015157) |
| 0.4 | 1.1 | GO:0005298 | proline:sodium symporter activity(GO:0005298) |
| 0.3 | 1.0 | GO:0031896 | V2 vasopressin receptor binding(GO:0031896) |
| 0.3 | 1.6 | GO:0001641 | group II metabotropic glutamate receptor activity(GO:0001641) |
| 0.3 | 2.9 | GO:0003876 | AMP deaminase activity(GO:0003876) adenosine-phosphate deaminase activity(GO:0047623) |
| 0.3 | 1.3 | GO:0047006 | 17-alpha,20-alpha-dihydroxypregn-4-en-3-one dehydrogenase activity(GO:0047006) |
| 0.3 | 2.7 | GO:0008467 | [heparan sulfate]-glucosamine 3-sulfotransferase 1 activity(GO:0008467) |
| 0.3 | 1.4 | GO:0004992 | platelet activating factor receptor activity(GO:0004992) |
| 0.3 | 3.3 | GO:0038132 | neuregulin binding(GO:0038132) |
| 0.2 | 0.7 | GO:0019976 | interleukin-2 receptor activity(GO:0004911) interleukin-2 binding(GO:0019976) |
| 0.2 | 1.3 | GO:0044736 | acid-sensing ion channel activity(GO:0044736) |
| 0.2 | 0.6 | GO:0004464 | leukotriene-C4 synthase activity(GO:0004464) |
| 0.2 | 2.1 | GO:0003810 | protein-glutamine gamma-glutamyltransferase activity(GO:0003810) |
| 0.2 | 0.6 | GO:0016165 | linoleate 13S-lipoxygenase activity(GO:0016165) |
| 0.2 | 1.0 | GO:0015111 | iodide transmembrane transporter activity(GO:0015111) |
| 0.2 | 1.3 | GO:0038064 | collagen receptor activity(GO:0038064) |
| 0.2 | 0.7 | GO:0048763 | calcium-induced calcium release activity(GO:0048763) |
| 0.2 | 0.7 | GO:0050211 | procollagen galactosyltransferase activity(GO:0050211) |
| 0.2 | 0.5 | GO:0004366 | glycerol-3-phosphate O-acyltransferase activity(GO:0004366) |
| 0.2 | 1.1 | GO:0004111 | creatine kinase activity(GO:0004111) |
| 0.1 | 1.9 | GO:0008517 | folic acid transporter activity(GO:0008517) |
| 0.1 | 0.6 | GO:0050501 | hyaluronan synthase activity(GO:0050501) |
| 0.1 | 0.4 | GO:0036487 | nitric-oxide synthase inhibitor activity(GO:0036487) |
| 0.1 | 0.8 | GO:0043183 | vascular endothelial growth factor receptor 1 binding(GO:0043183) |
| 0.1 | 0.4 | GO:0098782 | mechanically-gated potassium channel activity(GO:0098782) |
| 0.1 | 0.4 | GO:0004052 | arachidonate 12-lipoxygenase activity(GO:0004052) |
| 0.1 | 0.4 | GO:0047888 | fatty acid peroxidase activity(GO:0047888) |
| 0.1 | 0.3 | GO:0035403 | histone kinase activity (H3-T6 specific)(GO:0035403) |
| 0.1 | 0.4 | GO:0008431 | vitamin E binding(GO:0008431) |
| 0.1 | 2.5 | GO:0005095 | GTPase inhibitor activity(GO:0005095) |
| 0.1 | 1.3 | GO:0070700 | BMP receptor binding(GO:0070700) |
| 0.1 | 1.3 | GO:0001087 | transcription factor activity, sequence-specific DNA binding, RNA polymerase recruiting(GO:0001011) transcription factor activity, TFIIB-class binding(GO:0001087) |
| 0.1 | 0.7 | GO:0005502 | 11-cis retinal binding(GO:0005502) |
| 0.1 | 1.0 | GO:0047498 | calcium-dependent phospholipase A2 activity(GO:0047498) |
| 0.1 | 0.9 | GO:0016015 | morphogen activity(GO:0016015) |
| 0.1 | 1.3 | GO:0031014 | troponin T binding(GO:0031014) |
| 0.1 | 0.3 | GO:0004731 | purine-nucleoside phosphorylase activity(GO:0004731) |
| 0.1 | 1.5 | GO:0038191 | neuropilin binding(GO:0038191) |
| 0.1 | 0.4 | GO:0004720 | protein-lysine 6-oxidase activity(GO:0004720) |
| 0.1 | 0.4 | GO:0060175 | brain-derived neurotrophic factor-activated receptor activity(GO:0060175) |
| 0.1 | 0.5 | GO:0034046 | poly(G) binding(GO:0034046) |
| 0.1 | 0.4 | GO:0005006 | epidermal growth factor-activated receptor activity(GO:0005006) |
| 0.1 | 2.0 | GO:0031435 | mitogen-activated protein kinase kinase kinase binding(GO:0031435) |
| 0.1 | 0.9 | GO:0016176 | superoxide-generating NADPH oxidase activator activity(GO:0016176) |
| 0.1 | 7.2 | GO:0004869 | cysteine-type endopeptidase inhibitor activity(GO:0004869) |
| 0.1 | 0.5 | GO:0052828 | phosphatidylinositol-3,4-bisphosphate 4-phosphatase activity(GO:0016316) inositol-1,3,4-trisphosphate 4-phosphatase activity(GO:0017161) inositol-3,4-bisphosphate 4-phosphatase activity(GO:0052828) |
| 0.1 | 0.2 | GO:0034189 | very-low-density lipoprotein particle binding(GO:0034189) |
| 0.1 | 1.0 | GO:0030215 | semaphorin receptor binding(GO:0030215) |
| 0.1 | 1.0 | GO:0008199 | ferric iron binding(GO:0008199) |
| 0.1 | 0.2 | GO:0050528 | acyloxyacyl hydrolase activity(GO:0050528) |
| 0.1 | 1.0 | GO:0001206 | transcriptional repressor activity, RNA polymerase II distal enhancer sequence-specific binding(GO:0001206) |
| 0.1 | 0.6 | GO:0008559 | xenobiotic-transporting ATPase activity(GO:0008559) |
| 0.1 | 5.8 | GO:0048365 | Rac GTPase binding(GO:0048365) |
| 0.1 | 1.2 | GO:0005225 | volume-sensitive anion channel activity(GO:0005225) |
| 0.1 | 0.2 | GO:0016503 | pheromone receptor activity(GO:0016503) |
| 0.1 | 0.7 | GO:0030274 | LIM domain binding(GO:0030274) |
| 0.1 | 1.4 | GO:0030547 | receptor inhibitor activity(GO:0030547) |
| 0.1 | 0.2 | GO:0051377 | mannose-ethanolamine phosphotransferase activity(GO:0051377) |
| 0.1 | 0.4 | GO:0005499 | vitamin D binding(GO:0005499) |
| 0.1 | 0.9 | GO:0051011 | microtubule minus-end binding(GO:0051011) |
| 0.1 | 5.0 | GO:0019003 | GDP binding(GO:0019003) |
| 0.1 | 1.5 | GO:0004653 | polypeptide N-acetylgalactosaminyltransferase activity(GO:0004653) |
| 0.1 | 1.7 | GO:0005388 | calcium-transporting ATPase activity(GO:0005388) |
| 0.1 | 0.8 | GO:0048273 | mitogen-activated protein kinase p38 binding(GO:0048273) |
| 0.1 | 0.8 | GO:0055056 | D-glucose transmembrane transporter activity(GO:0055056) |
| 0.1 | 1.0 | GO:0005328 | neurotransmitter:sodium symporter activity(GO:0005328) |
| 0.1 | 0.3 | GO:0042835 | BRE binding(GO:0042835) |
| 0.1 | 0.3 | GO:0005166 | neurotrophin p75 receptor binding(GO:0005166) |
| 0.0 | 0.2 | GO:0004692 | cGMP-dependent protein kinase activity(GO:0004692) |
| 0.0 | 0.1 | GO:0015222 | serotonin transmembrane transporter activity(GO:0015222) |
| 0.0 | 0.2 | GO:0008384 | IkappaB kinase activity(GO:0008384) |
| 0.0 | 0.1 | GO:0015173 | aromatic amino acid transmembrane transporter activity(GO:0015173) |
| 0.0 | 0.8 | GO:0022841 | potassium ion leak channel activity(GO:0022841) |
| 0.0 | 0.1 | GO:0003839 | gamma-glutamylcyclotransferase activity(GO:0003839) |
| 0.0 | 0.6 | GO:0015643 | toxic substance binding(GO:0015643) |
| 0.0 | 0.7 | GO:0017151 | DEAD/H-box RNA helicase binding(GO:0017151) |
| 0.0 | 0.7 | GO:0050998 | nitric-oxide synthase binding(GO:0050998) |
| 0.0 | 0.4 | GO:0047035 | testosterone dehydrogenase (NAD+) activity(GO:0047035) |
| 0.0 | 0.4 | GO:0043426 | MRF binding(GO:0043426) |
| 0.0 | 1.5 | GO:0004435 | phosphatidylinositol phospholipase C activity(GO:0004435) |
| 0.0 | 0.7 | GO:0048018 | receptor agonist activity(GO:0048018) |
| 0.0 | 0.6 | GO:0031702 | type 1 angiotensin receptor binding(GO:0031702) |
| 0.0 | 0.2 | GO:0015087 | cadmium ion transmembrane transporter activity(GO:0015086) cobalt ion transmembrane transporter activity(GO:0015087) lead ion transmembrane transporter activity(GO:0015094) ferrous iron uptake transmembrane transporter activity(GO:0015639) |
| 0.0 | 0.2 | GO:0004740 | pyruvate dehydrogenase (acetyl-transferring) kinase activity(GO:0004740) |
| 0.0 | 2.2 | GO:0019894 | kinesin binding(GO:0019894) |
| 0.0 | 0.1 | GO:0030107 | HLA-A specific inhibitory MHC class I receptor activity(GO:0030107) |
| 0.0 | 0.3 | GO:0004046 | aminoacylase activity(GO:0004046) |
| 0.0 | 0.4 | GO:0019534 | toxin transporter activity(GO:0019534) |
| 0.0 | 0.2 | GO:0050682 | AF-2 domain binding(GO:0050682) |
| 0.0 | 0.4 | GO:0001135 | transcription factor activity, RNA polymerase II transcription factor recruiting(GO:0001135) |
| 0.0 | 2.1 | GO:0042379 | chemokine receptor binding(GO:0042379) |
| 0.0 | 0.4 | GO:0030297 | transmembrane receptor protein tyrosine kinase activator activity(GO:0030297) |
| 0.0 | 0.1 | GO:0016429 | tRNA (adenine) methyltransferase activity(GO:0016426) tRNA (adenine-N1-)-methyltransferase activity(GO:0016429) |
| 0.0 | 0.1 | GO:0000822 | inositol hexakisphosphate binding(GO:0000822) inositol 1,4,5-trisphosphate-sensitive calcium-release channel activity(GO:0005220) |
| 0.0 | 0.8 | GO:0004012 | phospholipid-translocating ATPase activity(GO:0004012) |
| 0.0 | 1.0 | GO:0043015 | gamma-tubulin binding(GO:0043015) |
| 0.0 | 0.8 | GO:0008093 | cytoskeletal adaptor activity(GO:0008093) |
| 0.0 | 0.5 | GO:0008349 | MAP kinase kinase kinase kinase activity(GO:0008349) |
| 0.0 | 0.4 | GO:0017176 | phosphatidylinositol N-acetylglucosaminyltransferase activity(GO:0017176) |
| 0.0 | 0.1 | GO:0015018 | galactosylgalactosylxylosylprotein 3-beta-glucuronosyltransferase activity(GO:0015018) |
| 0.0 | 0.5 | GO:0003796 | lysozyme activity(GO:0003796) |
| 0.0 | 0.4 | GO:0004887 | thyroid hormone receptor activity(GO:0004887) |
| 0.0 | 0.1 | GO:0051916 | granulocyte colony-stimulating factor binding(GO:0051916) |
| 0.0 | 0.5 | GO:0030306 | ADP-ribosylation factor binding(GO:0030306) |
| 0.0 | 0.3 | GO:0008474 | palmitoyl-(protein) hydrolase activity(GO:0008474) palmitoyl hydrolase activity(GO:0098599) |
| 0.0 | 0.1 | GO:0004119 | cGMP-inhibited cyclic-nucleotide phosphodiesterase activity(GO:0004119) |
| 0.0 | 0.1 | GO:0070697 | activin receptor binding(GO:0070697) |
| 0.0 | 0.6 | GO:0005003 | ephrin receptor activity(GO:0005003) |
| 0.0 | 1.1 | GO:0008013 | beta-catenin binding(GO:0008013) |
| 0.0 | 0.1 | GO:0042954 | lipoprotein transporter activity(GO:0042954) |
| 0.0 | 1.8 | GO:0043621 | protein self-association(GO:0043621) |
| 0.0 | 0.0 | GO:0004698 | calcium-dependent protein kinase C activity(GO:0004698) |
| 0.0 | 0.3 | GO:0019784 | NEDD8-specific protease activity(GO:0019784) |
| 0.0 | 0.1 | GO:0004663 | Rab geranylgeranyltransferase activity(GO:0004663) |
| 0.0 | 0.1 | GO:0016422 | mRNA (2'-O-methyladenosine-N6-)-methyltransferase activity(GO:0016422) |
| 0.0 | 2.1 | GO:0005518 | collagen binding(GO:0005518) |
| 0.0 | 0.1 | GO:0004045 | aminoacyl-tRNA hydrolase activity(GO:0004045) |
| 0.0 | 0.2 | GO:0008048 | calcium sensitive guanylate cyclase activator activity(GO:0008048) |
| 0.0 | 0.1 | GO:0004965 | G-protein coupled GABA receptor activity(GO:0004965) |
| 0.0 | 0.6 | GO:0005001 | transmembrane receptor protein tyrosine phosphatase activity(GO:0005001) transmembrane receptor protein phosphatase activity(GO:0019198) |
| 0.0 | 0.1 | GO:0048101 | calcium- and calmodulin-regulated 3',5'-cyclic-GMP phosphodiesterase activity(GO:0048101) |
| 0.0 | 0.3 | GO:0047144 | 2-acylglycerol-3-phosphate O-acyltransferase activity(GO:0047144) |
| 0.0 | 0.1 | GO:0070095 | fructose-6-phosphate binding(GO:0070095) |
| 0.0 | 0.3 | GO:0019215 | intermediate filament binding(GO:0019215) |
| 0.0 | 0.2 | GO:0051864 | histone demethylase activity (H3-K36 specific)(GO:0051864) |
| 0.0 | 2.5 | GO:0004867 | serine-type endopeptidase inhibitor activity(GO:0004867) |
| 0.0 | 0.2 | GO:0033192 | calmodulin-dependent protein phosphatase activity(GO:0033192) |
| 0.0 | 0.6 | GO:0043425 | bHLH transcription factor binding(GO:0043425) |
| 0.0 | 0.2 | GO:0070679 | inositol 1,4,5 trisphosphate binding(GO:0070679) |
| 0.0 | 2.5 | GO:0005089 | Rho guanyl-nucleotide exchange factor activity(GO:0005089) |
| 0.0 | 0.3 | GO:0004185 | serine-type carboxypeptidase activity(GO:0004185) |
| 0.0 | 0.3 | GO:0004089 | carbonate dehydratase activity(GO:0004089) |
| 0.0 | 0.2 | GO:1990380 | Lys48-specific deubiquitinase activity(GO:1990380) |
| 0.0 | 0.1 | GO:0071253 | connexin binding(GO:0071253) |
| 0.0 | 0.3 | GO:0004707 | MAP kinase activity(GO:0004707) |
| 0.0 | 0.4 | GO:0008353 | RNA polymerase II carboxy-terminal domain kinase activity(GO:0008353) |
| 0.0 | 0.1 | GO:0035939 | microsatellite binding(GO:0035939) |
| 0.0 | 0.3 | GO:0030881 | beta-2-microglobulin binding(GO:0030881) |
| 0.0 | 0.1 | GO:0004126 | cytidine deaminase activity(GO:0004126) |
| 0.0 | 0.1 | GO:0008174 | mRNA methyltransferase activity(GO:0008174) |
| 0.0 | 0.3 | GO:0036374 | glutathione hydrolase activity(GO:0036374) |
| 0.0 | 0.1 | GO:0030369 | ICAM-3 receptor activity(GO:0030369) |
| 0.0 | 1.5 | GO:0005201 | extracellular matrix structural constituent(GO:0005201) |
| 0.0 | 0.1 | GO:0003726 | double-stranded RNA adenosine deaminase activity(GO:0003726) |
| 0.0 | 0.3 | GO:0017128 | phospholipid scramblase activity(GO:0017128) |
| 0.0 | 0.2 | GO:0016888 | endodeoxyribonuclease activity, producing 5'-phosphomonoesters(GO:0016888) |
| 0.0 | 0.1 | GO:0032051 | clathrin light chain binding(GO:0032051) |
| 0.0 | 0.1 | GO:0004102 | choline O-acetyltransferase activity(GO:0004102) |
| 0.0 | 0.2 | GO:0032794 | GTPase activating protein binding(GO:0032794) |
| 0.0 | 0.1 | GO:0004982 | N-formyl peptide receptor activity(GO:0004982) |
| 0.0 | 0.4 | GO:0019706 | protein-cysteine S-palmitoyltransferase activity(GO:0019706) protein-cysteine S-acyltransferase activity(GO:0019707) |
| 0.0 | 0.1 | GO:0004920 | interleukin-10 receptor activity(GO:0004920) |
| 0.0 | 0.1 | GO:0004427 | inorganic diphosphatase activity(GO:0004427) |
| 0.0 | 0.0 | GO:0005222 | intracellular cAMP activated cation channel activity(GO:0005222) |
| 0.0 | 0.3 | GO:0034237 | protein kinase A regulatory subunit binding(GO:0034237) |
| 0.0 | 0.2 | GO:1990381 | ubiquitin-specific protease binding(GO:1990381) |
| 0.0 | 0.0 | GO:0044715 | 8-oxo-dGDP phosphatase activity(GO:0044715) |
| 0.0 | 0.1 | GO:0003828 | alpha-N-acetylneuraminate alpha-2,8-sialyltransferase activity(GO:0003828) |
| 0.0 | 0.1 | GO:0004594 | pantothenate kinase activity(GO:0004594) |
| 0.0 | 0.2 | GO:0043236 | laminin binding(GO:0043236) |
| 0.0 | 0.1 | GO:0008503 | benzodiazepine receptor activity(GO:0008503) |
| 0.0 | 0.4 | GO:0015347 | sodium-independent organic anion transmembrane transporter activity(GO:0015347) |
Gene overrepresentation in C2:CP category:
| Log-likelihood per target | Total log-likelihood | Term | Description |
|---|---|---|---|
| 0.2 | 4.6 | PID INTEGRIN4 PATHWAY | Alpha6 beta4 integrin-ligand interactions |
| 0.1 | 10.4 | PID BMP PATHWAY | BMP receptor signaling |
| 0.1 | 2.1 | SA REG CASCADE OF CYCLIN EXPR | Expression of cyclins regulates progression through the cell cycle by activating cyclin-dependent kinases. |
| 0.1 | 3.4 | PID INTEGRIN A9B1 PATHWAY | Alpha9 beta1 integrin signaling events |
| 0.1 | 3.5 | PID SYNDECAN 4 PATHWAY | Syndecan-4-mediated signaling events |
| 0.1 | 4.5 | SIG REGULATION OF THE ACTIN CYTOSKELETON BY RHO GTPASES | Genes related to regulation of the actin cytoskeleton |
| 0.1 | 2.1 | PID WNT SIGNALING PATHWAY | Wnt signaling network |
| 0.0 | 2.1 | PID IL2 STAT5 PATHWAY | IL2 signaling events mediated by STAT5 |
| 0.0 | 1.4 | PID LYMPH ANGIOGENESIS PATHWAY | VEGFR3 signaling in lymphatic endothelium |
| 0.0 | 1.9 | ST TUMOR NECROSIS FACTOR PATHWAY | Tumor Necrosis Factor Pathway. |
| 0.0 | 3.2 | PID LKB1 PATHWAY | LKB1 signaling events |
| 0.0 | 0.6 | SIG IL4RECEPTOR IN B LYPHOCYTES | Genes related to IL4 rceptor signaling in B lymphocytes |
| 0.0 | 0.8 | PID S1P S1P1 PATHWAY | S1P1 pathway |
| 0.0 | 1.6 | ST G ALPHA I PATHWAY | G alpha i Pathway |
| 0.0 | 0.9 | PID ERBB NETWORK PATHWAY | ErbB receptor signaling network |
| 0.0 | 1.3 | PID THROMBIN PAR1 PATHWAY | PAR1-mediated thrombin signaling events |
| 0.0 | 0.8 | PID ALK1 PATHWAY | ALK1 signaling events |
| 0.0 | 2.7 | PID RHOA REG PATHWAY | Regulation of RhoA activity |
| 0.0 | 1.0 | PID ENDOTHELIN PATHWAY | Endothelins |
| 0.0 | 0.6 | ST WNT CA2 CYCLIC GMP PATHWAY | Wnt/Ca2+/cyclic GMP signaling. |
| 0.0 | 0.3 | PID SHP2 PATHWAY | SHP2 signaling |
| 0.0 | 1.1 | PID DELTA NP63 PATHWAY | Validated transcriptional targets of deltaNp63 isoforms |
| 0.0 | 0.5 | PID HEDGEHOG 2PATHWAY | Signaling events mediated by the Hedgehog family |
| 0.0 | 1.3 | PID TAP63 PATHWAY | Validated transcriptional targets of TAp63 isoforms |
| 0.0 | 0.2 | PID ECADHERIN KERATINOCYTE PATHWAY | E-cadherin signaling in keratinocytes |
| 0.0 | 1.0 | PID ECADHERIN STABILIZATION PATHWAY | Stabilization and expansion of the E-cadherin adherens junction |
| 0.0 | 0.4 | PID EPHB FWD PATHWAY | EPHB forward signaling |
| 0.0 | 0.6 | PID VEGFR1 2 PATHWAY | Signaling events mediated by VEGFR1 and VEGFR2 |
| 0.0 | 0.1 | PID NFKAPPAB ATYPICAL PATHWAY | Atypical NF-kappaB pathway |
| 0.0 | 0.4 | PID TNF PATHWAY | TNF receptor signaling pathway |
| 0.0 | 0.7 | PID NFAT TFPATHWAY | Calcineurin-regulated NFAT-dependent transcription in lymphocytes |
| 0.0 | 0.6 | PID HES HEY PATHWAY | Notch-mediated HES/HEY network |
| 0.0 | 0.2 | PID REELIN PATHWAY | Reelin signaling pathway |
| 0.0 | 0.3 | PID MAPK TRK PATHWAY | Trk receptor signaling mediated by the MAPK pathway |
| 0.0 | 0.4 | PID IL23 PATHWAY | IL23-mediated signaling events |
| 0.0 | 0.3 | PID CONE PATHWAY | Visual signal transduction: Cones |
Gene overrepresentation in C2:CP:REACTOME category:
| Log-likelihood per target | Total log-likelihood | Term | Description |
|---|---|---|---|
| 0.2 | 4.7 | REACTOME ACTIVATION OF RAC | Genes involved in Activation of Rac |
| 0.1 | 3.6 | REACTOME NA CL DEPENDENT NEUROTRANSMITTER TRANSPORTERS | Genes involved in Na+/Cl- dependent neurotransmitter transporters |
| 0.1 | 2.9 | REACTOME PURINE SALVAGE | Genes involved in Purine salvage |
| 0.1 | 0.1 | REACTOME REGULATION OF GLUCOKINASE BY GLUCOKINASE REGULATORY PROTEIN | Genes involved in Regulation of Glucokinase by Glucokinase Regulatory Protein |
| 0.1 | 3.4 | REACTOME DEGRADATION OF THE EXTRACELLULAR MATRIX | Genes involved in Degradation of the extracellular matrix |
| 0.1 | 2.2 | REACTOME CYCLIN A B1 ASSOCIATED EVENTS DURING G2 M TRANSITION | Genes involved in Cyclin A/B1 associated events during G2/M transition |
| 0.1 | 1.7 | REACTOME CLASS C 3 METABOTROPIC GLUTAMATE PHEROMONE RECEPTORS | Genes involved in Class C/3 (Metabotropic glutamate/pheromone receptors) |
| 0.1 | 1.3 | REACTOME PLATELET ADHESION TO EXPOSED COLLAGEN | Genes involved in Platelet Adhesion to exposed collagen |
| 0.1 | 1.2 | REACTOME TANDEM PORE DOMAIN POTASSIUM CHANNELS | Genes involved in Tandem pore domain potassium channels |
| 0.1 | 1.7 | REACTOME OTHER SEMAPHORIN INTERACTIONS | Genes involved in Other semaphorin interactions |
| 0.1 | 1.2 | REACTOME ACYL CHAIN REMODELLING OF PS | Genes involved in Acyl chain remodelling of PS |
| 0.1 | 2.3 | REACTOME KINESINS | Genes involved in Kinesins |
| 0.1 | 2.4 | REACTOME HS GAG BIOSYNTHESIS | Genes involved in HS-GAG biosynthesis |
| 0.1 | 0.6 | REACTOME ABACAVIR TRANSPORT AND METABOLISM | Genes involved in Abacavir transport and metabolism |
| 0.1 | 0.7 | REACTOME GLYCOPROTEIN HORMONES | Genes involved in Glycoprotein hormones |
| 0.0 | 0.7 | REACTOME OPSINS | Genes involved in Opsins |
| 0.0 | 2.8 | REACTOME NRAGE SIGNALS DEATH THROUGH JNK | Genes involved in NRAGE signals death through JNK |
| 0.0 | 0.8 | REACTOME VEGF LIGAND RECEPTOR INTERACTIONS | Genes involved in VEGF ligand-receptor interactions |
| 0.0 | 0.8 | REACTOME FACILITATIVE NA INDEPENDENT GLUCOSE TRANSPORTERS | Genes involved in Facilitative Na+-independent glucose transporters |
| 0.0 | 4.5 | REACTOME CELL JUNCTION ORGANIZATION | Genes involved in Cell junction organization |
| 0.0 | 1.0 | REACTOME DOWNREGULATION OF ERBB2 ERBB3 SIGNALING | Genes involved in Downregulation of ERBB2:ERBB3 signaling |
| 0.0 | 1.6 | REACTOME MYOGENESIS | Genes involved in Myogenesis |
| 0.0 | 1.4 | REACTOME NOD1 2 SIGNALING PATHWAY | Genes involved in NOD1/2 Signaling Pathway |
| 0.0 | 0.8 | REACTOME SIGNALING BY ROBO RECEPTOR | Genes involved in Signaling by Robo receptor |
| 0.0 | 0.2 | REACTOME REGULATION OF THE FANCONI ANEMIA PATHWAY | Genes involved in Regulation of the Fanconi anemia pathway |
| 0.0 | 0.4 | REACTOME TIE2 SIGNALING | Genes involved in Tie2 Signaling |
| 0.0 | 0.3 | REACTOME SIGNALING BY CONSTITUTIVELY ACTIVE EGFR | Genes involved in Signaling by constitutively active EGFR |
| 0.0 | 0.5 | REACTOME SYNTHESIS OF PIPS AT THE EARLY ENDOSOME MEMBRANE | Genes involved in Synthesis of PIPs at the early endosome membrane |
| 0.0 | 0.6 | REACTOME HYALURONAN METABOLISM | Genes involved in Hyaluronan metabolism |
| 0.0 | 2.1 | REACTOME GOLGI ASSOCIATED VESICLE BIOGENESIS | Genes involved in Golgi Associated Vesicle Biogenesis |
| 0.0 | 1.6 | REACTOME PLC BETA MEDIATED EVENTS | Genes involved in PLC beta mediated events |
| 0.0 | 0.6 | REACTOME ERK MAPK TARGETS | Genes involved in ERK/MAPK targets |
| 0.0 | 0.6 | REACTOME SYNTHESIS OF GLYCOSYLPHOSPHATIDYLINOSITOL GPI | Genes involved in Synthesis of glycosylphosphatidylinositol (GPI) |
| 0.0 | 2.2 | REACTOME INTERFERON GAMMA SIGNALING | Genes involved in Interferon gamma signaling |
| 0.0 | 0.5 | REACTOME TRANSPORT OF ORGANIC ANIONS | Genes involved in Transport of organic anions |
| 0.0 | 0.3 | REACTOME NOTCH HLH TRANSCRIPTION PATHWAY | Genes involved in Notch-HLH transcription pathway |
| 0.0 | 1.1 | REACTOME ION TRANSPORT BY P TYPE ATPASES | Genes involved in Ion transport by P-type ATPases |
| 0.0 | 0.2 | REACTOME PRE NOTCH TRANSCRIPTION AND TRANSLATION | Genes involved in Pre-NOTCH Transcription and Translation |
| 0.0 | 0.1 | REACTOME MRNA PROCESSING | Genes involved in mRNA Processing |
| 0.0 | 0.5 | REACTOME BETA DEFENSINS | Genes involved in Beta defensins |
| 0.0 | 0.7 | REACTOME SIGNALING BY BMP | Genes involved in Signaling by BMP |
| 0.0 | 0.3 | REACTOME ACTIVATION OF BH3 ONLY PROTEINS | Genes involved in Activation of BH3-only proteins |
| 0.0 | 0.8 | REACTOME G1 PHASE | Genes involved in G1 Phase |
| 0.0 | 0.1 | REACTOME PECAM1 INTERACTIONS | Genes involved in PECAM1 interactions |
| 0.0 | 1.0 | REACTOME O LINKED GLYCOSYLATION OF MUCINS | Genes involved in O-linked glycosylation of mucins |
| 0.0 | 0.2 | REACTOME SIGNALING BY FGFR3 MUTANTS | Genes involved in Signaling by FGFR3 mutants |
| 0.0 | 0.2 | REACTOME CIRCADIAN CLOCK | Genes involved in Circadian Clock |
| 0.0 | 0.2 | REACTOME THE ROLE OF NEF IN HIV1 REPLICATION AND DISEASE PATHOGENESIS | Genes involved in The role of Nef in HIV-1 replication and disease pathogenesis |
| 0.0 | 0.3 | REACTOME SYNTHESIS OF PA | Genes involved in Synthesis of PA |
| 0.0 | 0.1 | REACTOME ACYL CHAIN REMODELLING OF PI | Genes involved in Acyl chain remodelling of PI |
| 0.0 | 0.2 | REACTOME CTNNB1 PHOSPHORYLATION CASCADE | Genes involved in Beta-catenin phosphorylation cascade |
| 0.0 | 0.3 | REACTOME TRAFFICKING OF GLUR2 CONTAINING AMPA RECEPTORS | Genes involved in Trafficking of GluR2-containing AMPA receptors |
| 0.0 | 0.3 | REACTOME DOWNREGULATION OF SMAD2 3 SMAD4 TRANSCRIPTIONAL ACTIVITY | Genes involved in Downregulation of SMAD2/3:SMAD4 transcriptional activity |
| 0.0 | 0.9 | REACTOME METABOLISM OF VITAMINS AND COFACTORS | Genes involved in Metabolism of vitamins and cofactors |
| 0.0 | 0.4 | REACTOME IL1 SIGNALING | Genes involved in Interleukin-1 signaling |
| 0.0 | 0.3 | REACTOME METABOLISM OF POLYAMINES | Genes involved in Metabolism of polyamines |