Project
Epithelial-Mesenchymal Transition, human (Scheel, 2011)
Navigation
Downloads
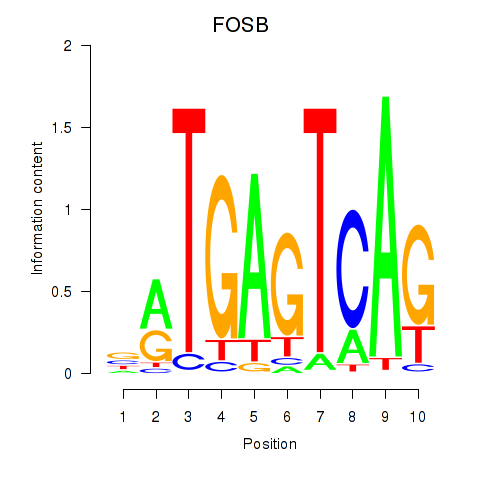
Results for FOSB
Z-value: 1.23
Motif logo
Transcription factors associated with FOSB
| Gene Symbol | Gene ID | Gene Info |
|---|---|---|
|
FOSB
|
ENSG00000125740.9 | FOSB |
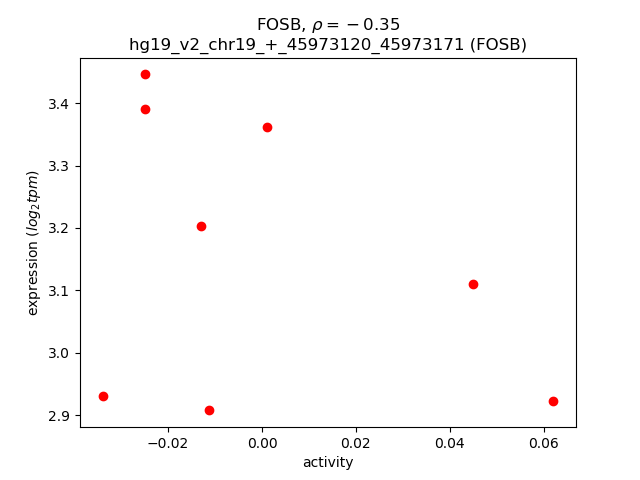
Activity-expression correlation:
| Gene | Promoter | Pearson corr. coef. | P-value | Plot |
|---|---|---|---|---|
| FOSB | hg19_v2_chr19_+_45973120_45973171 | -0.35 | 3.9e-01 | Click! |
Activity profile of FOSB motif
Sorted Z-values of FOSB motif
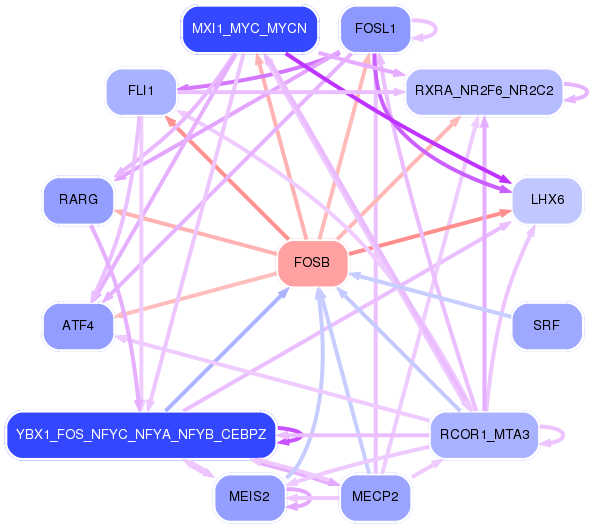
Network of associatons between targets according to the STRING database.

First level regulatory network of FOSB
| Promoter | Score | Transcript | Gene | Gene Info |
|---|---|---|---|---|
| chr18_+_21452964 | 7.29 |
ENST00000587184.1 |
LAMA3 |
laminin, alpha 3 |
| chr18_+_21452804 | 7.06 |
ENST00000269217.6 |
LAMA3 |
laminin, alpha 3 |
| chr19_-_36004543 | 2.42 |
ENST00000339686.3 ENST00000447113.2 ENST00000440396.1 |
DMKN |
dermokine |
| chr6_+_125540951 | 2.14 |
ENST00000524679.1 |
TPD52L1 |
tumor protein D52-like 1 |
| chr3_-_151034734 | 2.10 |
ENST00000260843.4 |
GPR87 |
G protein-coupled receptor 87 |
| chr11_-_102668879 | 1.90 |
ENST00000315274.6 |
MMP1 |
matrix metallopeptidase 1 (interstitial collagenase) |
| chr1_-_21059029 | 1.89 |
ENST00000444387.2 ENST00000375031.1 ENST00000518294.1 |
SH2D5 |
SH2 domain containing 5 |
| chr11_-_108408895 | 1.86 |
ENST00000443411.1 ENST00000533052.1 |
EXPH5 |
exophilin 5 |
| chr15_+_40531243 | 1.79 |
ENST00000558055.1 ENST00000455577.2 |
PAK6 |
p21 protein (Cdc42/Rac)-activated kinase 6 |
| chr18_+_61442629 | 1.75 |
ENST00000398019.2 ENST00000540675.1 |
SERPINB7 |
serpin peptidase inhibitor, clade B (ovalbumin), member 7 |
| chr15_+_40531621 | 1.72 |
ENST00000560346.1 |
PAK6 |
p21 protein (Cdc42/Rac)-activated kinase 6 |
| chr17_-_39769005 | 1.68 |
ENST00000301653.4 ENST00000593067.1 |
KRT16 |
keratin 16 |
| chr19_-_35992780 | 1.59 |
ENST00000593342.1 ENST00000601650.1 ENST00000408915.2 |
DMKN |
dermokine |
| chr17_-_8021710 | 1.58 |
ENST00000380149.1 ENST00000448843.2 |
ALOXE3 |
arachidonate lipoxygenase 3 |
| chr11_+_394196 | 1.50 |
ENST00000331563.2 ENST00000531857.1 |
PKP3 |
plakophilin 3 |
| chr2_+_102618428 | 1.46 |
ENST00000457817.1 |
IL1R2 |
interleukin 1 receptor, type II |
| chr16_+_30751953 | 1.28 |
ENST00000483578.1 |
RP11-2C24.4 |
RP11-2C24.4 |
| chr20_+_44637526 | 1.27 |
ENST00000372330.3 |
MMP9 |
matrix metallopeptidase 9 (gelatinase B, 92kDa gelatinase, 92kDa type IV collagenase) |
| chr4_-_36246060 | 1.26 |
ENST00000303965.4 |
ARAP2 |
ArfGAP with RhoGAP domain, ankyrin repeat and PH domain 2 |
| chr19_-_39264072 | 1.26 |
ENST00000599035.1 ENST00000378626.4 |
LGALS7 |
lectin, galactoside-binding, soluble, 7 |
| chr19_-_44174330 | 1.23 |
ENST00000340093.3 |
PLAUR |
plasminogen activator, urokinase receptor |
| chr14_-_94854926 | 1.23 |
ENST00000402629.1 ENST00000556091.1 ENST00000554720.1 |
SERPINA1 |
serpin peptidase inhibitor, clade A (alpha-1 antiproteinase, antitrypsin), member 1 |
| chr1_+_152881014 | 1.13 |
ENST00000368764.3 ENST00000392667.2 |
IVL |
involucrin |
| chr8_+_120220561 | 1.13 |
ENST00000276681.6 |
MAL2 |
mal, T-cell differentiation protein 2 (gene/pseudogene) |
| chr1_-_153029980 | 1.11 |
ENST00000392653.2 |
SPRR2A |
small proline-rich protein 2A |
| chr5_+_145316120 | 1.11 |
ENST00000359120.4 |
SH3RF2 |
SH3 domain containing ring finger 2 |
| chr19_-_44174305 | 1.08 |
ENST00000601723.1 ENST00000339082.3 |
PLAUR |
plasminogen activator, urokinase receptor |
| chr7_-_20256965 | 1.05 |
ENST00000400331.5 ENST00000332878.4 |
MACC1 |
metastasis associated in colon cancer 1 |
| chr5_+_145317356 | 1.01 |
ENST00000511217.1 |
SH3RF2 |
SH3 domain containing ring finger 2 |
| chr5_+_66124590 | 0.99 |
ENST00000490016.2 ENST00000403666.1 ENST00000450827.1 |
MAST4 |
microtubule associated serine/threonine kinase family member 4 |
| chr17_-_18908040 | 0.98 |
ENST00000388995.6 |
FAM83G |
family with sequence similarity 83, member G |
| chr4_+_84457250 | 0.98 |
ENST00000395226.2 |
AGPAT9 |
1-acylglycerol-3-phosphate O-acyltransferase 9 |
| chr1_+_26869597 | 0.98 |
ENST00000530003.1 |
RPS6KA1 |
ribosomal protein S6 kinase, 90kDa, polypeptide 1 |
| chr3_+_36421826 | 0.97 |
ENST00000273183.3 |
STAC |
SH3 and cysteine rich domain |
| chr4_+_84457529 | 0.96 |
ENST00000264409.4 |
AGPAT9 |
1-acylglycerol-3-phosphate O-acyltransferase 9 |
| chr17_+_30771279 | 0.95 |
ENST00000261712.3 ENST00000578213.1 ENST00000457654.2 ENST00000579451.1 |
PSMD11 |
proteasome (prosome, macropain) 26S subunit, non-ATPase, 11 |
| chr4_-_89080003 | 0.86 |
ENST00000237612.3 |
ABCG2 |
ATP-binding cassette, sub-family G (WHITE), member 2 |
| chr12_-_95510743 | 0.86 |
ENST00000551521.1 |
FGD6 |
FYVE, RhoGEF and PH domain containing 6 |
| chr17_-_39942940 | 0.85 |
ENST00000310706.5 ENST00000393931.3 ENST00000424457.1 ENST00000591690.1 |
JUP |
junction plakoglobin |
| chr16_+_57662138 | 0.84 |
ENST00000562414.1 ENST00000561969.1 ENST00000562631.1 ENST00000563445.1 ENST00000565338.1 ENST00000567702.1 |
GPR56 |
G protein-coupled receptor 56 |
| chr2_-_238499303 | 0.82 |
ENST00000409576.1 |
RAB17 |
RAB17, member RAS oncogene family |
| chr5_+_147582387 | 0.82 |
ENST00000325630.2 |
SPINK6 |
serine peptidase inhibitor, Kazal type 6 |
| chr2_-_238499337 | 0.77 |
ENST00000411462.1 ENST00000409822.1 |
RAB17 |
RAB17, member RAS oncogene family |
| chr9_-_124991124 | 0.76 |
ENST00000394319.4 ENST00000340587.3 |
LHX6 |
LIM homeobox 6 |
| chr15_-_44486632 | 0.75 |
ENST00000484674.1 |
FRMD5 |
FERM domain containing 5 |
| chr16_+_57662419 | 0.75 |
ENST00000388812.4 ENST00000538815.1 ENST00000456916.1 ENST00000567154.1 ENST00000388813.5 ENST00000562558.1 ENST00000566271.2 |
GPR56 |
G protein-coupled receptor 56 |
| chr17_+_73717407 | 0.74 |
ENST00000579662.1 |
ITGB4 |
integrin, beta 4 |
| chr2_-_238499131 | 0.72 |
ENST00000538644.1 |
RAB17 |
RAB17, member RAS oncogene family |
| chr11_+_128563652 | 0.71 |
ENST00000527786.2 |
FLI1 |
Fli-1 proto-oncogene, ETS transcription factor |
| chr17_+_73717551 | 0.69 |
ENST00000450894.3 |
ITGB4 |
integrin, beta 4 |
| chr18_-_74207146 | 0.68 |
ENST00000443185.2 |
ZNF516 |
zinc finger protein 516 |
| chr19_+_7953384 | 0.67 |
ENST00000306708.6 |
LRRC8E |
leucine rich repeat containing 8 family, member E |
| chr11_+_128563948 | 0.63 |
ENST00000534087.2 |
FLI1 |
Fli-1 proto-oncogene, ETS transcription factor |
| chr1_+_22333943 | 0.61 |
ENST00000400271.2 |
CELA3A |
chymotrypsin-like elastase family, member 3A |
| chr5_-_78809950 | 0.61 |
ENST00000334082.6 |
HOMER1 |
homer homolog 1 (Drosophila) |
| chr11_+_59522837 | 0.58 |
ENST00000437946.2 |
STX3 |
syntaxin 3 |
| chr1_-_153521597 | 0.58 |
ENST00000368712.1 |
S100A3 |
S100 calcium binding protein A3 |
| chr19_-_35981358 | 0.57 |
ENST00000484218.2 ENST00000338897.3 |
KRTDAP |
keratinocyte differentiation-associated protein |
| chr1_-_6662919 | 0.55 |
ENST00000377658.4 ENST00000377663.3 |
KLHL21 |
kelch-like family member 21 |
| chr1_-_153521714 | 0.54 |
ENST00000368713.3 |
S100A3 |
S100 calcium binding protein A3 |
| chr11_-_75201791 | 0.54 |
ENST00000529721.1 |
GDPD5 |
glycerophosphodiester phosphodiesterase domain containing 5 |
| chr17_+_7344057 | 0.53 |
ENST00000575398.1 ENST00000575082.1 |
FGF11 |
fibroblast growth factor 11 |
| chrX_-_154563889 | 0.51 |
ENST00000369449.2 ENST00000321926.4 |
CLIC2 |
chloride intracellular channel 2 |
| chr6_+_44194762 | 0.51 |
ENST00000371708.1 |
SLC29A1 |
solute carrier family 29 (equilibrative nucleoside transporter), member 1 |
| chr12_-_95009837 | 0.48 |
ENST00000551457.1 |
TMCC3 |
transmembrane and coiled-coil domain family 3 |
| chr17_+_73717516 | 0.48 |
ENST00000200181.3 ENST00000339591.3 |
ITGB4 |
integrin, beta 4 |
| chr8_-_125384927 | 0.47 |
ENST00000297632.6 |
TMEM65 |
transmembrane protein 65 |
| chr6_+_47624172 | 0.46 |
ENST00000507065.1 ENST00000296862.1 |
GPR111 |
G protein-coupled receptor 111 |
| chr6_+_151042224 | 0.46 |
ENST00000358517.2 |
PLEKHG1 |
pleckstrin homology domain containing, family G (with RhoGef domain) member 1 |
| chr6_-_35888905 | 0.44 |
ENST00000510290.1 ENST00000423325.2 ENST00000373822.1 |
SRPK1 |
SRSF protein kinase 1 |
| chr17_-_27503770 | 0.44 |
ENST00000533112.1 |
MYO18A |
myosin XVIIIA |
| chr5_+_135394840 | 0.44 |
ENST00000503087.1 |
TGFBI |
transforming growth factor, beta-induced, 68kDa |
| chr6_+_47666275 | 0.41 |
ENST00000327753.3 ENST00000283303.2 |
GPR115 |
G protein-coupled receptor 115 |
| chr6_+_32121218 | 0.40 |
ENST00000414204.1 ENST00000361568.2 ENST00000395523.1 |
PPT2 |
palmitoyl-protein thioesterase 2 |
| chr6_-_35888824 | 0.40 |
ENST00000361690.3 ENST00000512445.1 |
SRPK1 |
SRSF protein kinase 1 |
| chr15_+_77287426 | 0.40 |
ENST00000558012.1 ENST00000267939.5 ENST00000379595.3 |
PSTPIP1 |
proline-serine-threonine phosphatase interacting protein 1 |
| chr17_+_21191341 | 0.38 |
ENST00000526076.2 ENST00000361818.5 ENST00000316920.6 |
MAP2K3 |
mitogen-activated protein kinase kinase 3 |
| chr17_+_72426891 | 0.38 |
ENST00000392627.1 |
GPRC5C |
G protein-coupled receptor, family C, group 5, member C |
| chr3_-_98241760 | 0.38 |
ENST00000507874.1 ENST00000502299.1 ENST00000508659.1 ENST00000510545.1 ENST00000511667.1 ENST00000394185.2 ENST00000394181.2 ENST00000508902.1 ENST00000341181.6 ENST00000437922.1 ENST00000394180.2 |
CLDND1 |
claudin domain containing 1 |
| chr7_-_142120321 | 0.37 |
ENST00000390377.1 |
TRBV7-7 |
T cell receptor beta variable 7-7 |
| chr1_+_247579451 | 0.35 |
ENST00000391828.3 ENST00000366497.2 |
NLRP3 |
NLR family, pyrin domain containing 3 |
| chr4_+_76481258 | 0.35 |
ENST00000311623.4 ENST00000435974.2 |
C4orf26 |
chromosome 4 open reading frame 26 |
| chr11_-_123756334 | 0.35 |
ENST00000528595.1 ENST00000375026.2 |
TMEM225 |
transmembrane protein 225 |
| chr3_-_98241358 | 0.34 |
ENST00000503004.1 ENST00000506575.1 ENST00000513452.1 ENST00000515620.1 |
CLDND1 |
claudin domain containing 1 |
| chr2_+_103035102 | 0.32 |
ENST00000264260.2 |
IL18RAP |
interleukin 18 receptor accessory protein |
| chr12_-_53625958 | 0.32 |
ENST00000327550.3 ENST00000546717.1 ENST00000425354.2 ENST00000394426.1 |
RARG |
retinoic acid receptor, gamma |
| chr19_-_55881741 | 0.32 |
ENST00000264563.2 ENST00000590625.1 ENST00000585513.1 |
IL11 |
interleukin 11 |
| chr2_+_16080659 | 0.31 |
ENST00000281043.3 |
MYCN |
v-myc avian myelocytomatosis viral oncogene neuroblastoma derived homolog |
| chr17_+_74381343 | 0.31 |
ENST00000392496.3 |
SPHK1 |
sphingosine kinase 1 |
| chr6_+_33043703 | 0.31 |
ENST00000418931.2 ENST00000535465.1 |
HLA-DPB1 |
major histocompatibility complex, class II, DP beta 1 |
| chr7_+_55177416 | 0.30 |
ENST00000450046.1 ENST00000454757.2 |
EGFR |
epidermal growth factor receptor |
| chr4_+_166128735 | 0.30 |
ENST00000226725.6 |
KLHL2 |
kelch-like family member 2 |
| chr1_+_165796753 | 0.30 |
ENST00000367879.4 |
UCK2 |
uridine-cytidine kinase 2 |
| chr18_+_9885961 | 0.28 |
ENST00000306084.6 |
TXNDC2 |
thioredoxin domain containing 2 (spermatozoa) |
| chr1_+_27189631 | 0.28 |
ENST00000339276.4 |
SFN |
stratifin |
| chr17_+_35851570 | 0.28 |
ENST00000394386.1 |
DUSP14 |
dual specificity phosphatase 14 |
| chr22_-_32860427 | 0.27 |
ENST00000534972.1 ENST00000397450.1 ENST00000397452.1 |
BPIFC |
BPI fold containing family C |
| chr6_+_159290917 | 0.27 |
ENST00000367072.1 |
C6orf99 |
chromosome 6 open reading frame 99 |
| chr18_+_9885760 | 0.26 |
ENST00000536353.2 ENST00000584255.1 |
TXNDC2 |
thioredoxin domain containing 2 (spermatozoa) |
| chr11_-_47207390 | 0.24 |
ENST00000539589.1 ENST00000528462.1 |
PACSIN3 |
protein kinase C and casein kinase substrate in neurons 3 |
| chr9_+_137218362 | 0.24 |
ENST00000481739.1 |
RXRA |
retinoid X receptor, alpha |
| chr7_+_73624327 | 0.24 |
ENST00000361082.3 ENST00000275635.7 ENST00000470709.1 |
LAT2 |
linker for activation of T cells family, member 2 |
| chr1_+_27668505 | 0.24 |
ENST00000318074.5 |
SYTL1 |
synaptotagmin-like 1 |
| chr14_+_97925151 | 0.24 |
ENST00000554862.1 ENST00000554260.1 ENST00000499910.2 |
CTD-2506J14.1 |
CTD-2506J14.1 |
| chr11_-_2924720 | 0.24 |
ENST00000455942.2 |
SLC22A18AS |
solute carrier family 22 (organic cation transporter), member 18 antisense |
| chr5_-_175843524 | 0.23 |
ENST00000502877.1 |
CLTB |
clathrin, light chain B |
| chr19_-_36019123 | 0.23 |
ENST00000588674.1 ENST00000452271.2 ENST00000518157.1 |
SBSN |
suprabasin |
| chr13_-_36429763 | 0.23 |
ENST00000379893.1 |
DCLK1 |
doublecortin-like kinase 1 |
| chr11_-_2924970 | 0.23 |
ENST00000533594.1 |
SLC22A18AS |
solute carrier family 22 (organic cation transporter), member 18 antisense |
| chr16_-_72206034 | 0.23 |
ENST00000537465.1 ENST00000237353.10 |
PMFBP1 |
polyamine modulated factor 1 binding protein 1 |
| chr11_-_65667997 | 0.22 |
ENST00000312562.2 ENST00000534222.1 |
FOSL1 |
FOS-like antigen 1 |
| chr12_-_51402984 | 0.22 |
ENST00000545993.2 |
SLC11A2 |
solute carrier family 11 (proton-coupled divalent metal ion transporter), member 2 |
| chr11_-_5462744 | 0.22 |
ENST00000380211.1 |
OR51I1 |
olfactory receptor, family 51, subfamily I, member 1 |
| chr4_-_80329356 | 0.21 |
ENST00000358842.3 |
GK2 |
glycerol kinase 2 |
| chr1_-_24126023 | 0.21 |
ENST00000429356.1 |
GALE |
UDP-galactose-4-epimerase |
| chrX_+_65382433 | 0.21 |
ENST00000374727.3 |
HEPH |
hephaestin |
| chr3_-_52869205 | 0.21 |
ENST00000446157.2 |
MUSTN1 |
musculoskeletal, embryonic nuclear protein 1 |
| chr1_-_95007193 | 0.20 |
ENST00000370207.4 ENST00000334047.7 |
F3 |
coagulation factor III (thromboplastin, tissue factor) |
| chr16_+_71560154 | 0.20 |
ENST00000539698.3 |
CHST4 |
carbohydrate (N-acetylglucosamine 6-O) sulfotransferase 4 |
| chrX_-_153285251 | 0.20 |
ENST00000444230.1 ENST00000393682.1 ENST00000393687.2 ENST00000429936.2 ENST00000369974.2 |
IRAK1 |
interleukin-1 receptor-associated kinase 1 |
| chr17_-_48785216 | 0.20 |
ENST00000285243.6 |
ANKRD40 |
ankyrin repeat domain 40 |
| chr2_+_27237615 | 0.20 |
ENST00000458529.1 ENST00000402218.1 |
MAPRE3 |
microtubule-associated protein, RP/EB family, member 3 |
| chr16_+_71560023 | 0.20 |
ENST00000572450.1 |
CHST4 |
carbohydrate (N-acetylglucosamine 6-O) sulfotransferase 4 |
| chr1_-_24126051 | 0.19 |
ENST00000445705.1 |
GALE |
UDP-galactose-4-epimerase |
| chr4_+_108745711 | 0.19 |
ENST00000394684.4 |
SGMS2 |
sphingomyelin synthase 2 |
| chr12_-_118628350 | 0.19 |
ENST00000537952.1 ENST00000537822.1 |
TAOK3 |
TAO kinase 3 |
| chr6_+_159291090 | 0.19 |
ENST00000367073.4 ENST00000608817.1 |
C6orf99 |
chromosome 6 open reading frame 99 |
| chr5_-_158636512 | 0.19 |
ENST00000424310.2 |
RNF145 |
ring finger protein 145 |
| chr8_-_68658578 | 0.19 |
ENST00000518549.1 ENST00000297770.4 ENST00000297769.4 |
CPA6 |
carboxypeptidase A6 |
| chr6_-_127837739 | 0.19 |
ENST00000368268.2 |
SOGA3 |
SOGA family member 3 |
| chr3_-_141747950 | 0.19 |
ENST00000497579.1 |
TFDP2 |
transcription factor Dp-2 (E2F dimerization partner 2) |
| chr2_-_89459813 | 0.18 |
ENST00000390256.2 |
IGKV6-21 |
immunoglobulin kappa variable 6-21 (non-functional) |
| chr2_-_89521942 | 0.18 |
ENST00000482769.1 |
IGKV2-28 |
immunoglobulin kappa variable 2-28 |
| chr3_-_52868931 | 0.18 |
ENST00000486659.1 |
MUSTN1 |
musculoskeletal, embryonic nuclear protein 1 |
| chr8_+_26150628 | 0.18 |
ENST00000523925.1 ENST00000315985.7 |
PPP2R2A |
protein phosphatase 2, regulatory subunit B, alpha |
| chr1_+_44584522 | 0.18 |
ENST00000372299.3 |
KLF17 |
Kruppel-like factor 17 |
| chr11_-_65667884 | 0.18 |
ENST00000448083.2 ENST00000531493.1 ENST00000532401.1 |
FOSL1 |
FOS-like antigen 1 |
| chr17_+_79650962 | 0.18 |
ENST00000329138.4 |
HGS |
hepatocyte growth factor-regulated tyrosine kinase substrate |
| chr10_-_86001210 | 0.17 |
ENST00000372105.3 |
LRIT1 |
leucine-rich repeat, immunoglobulin-like and transmembrane domains 1 |
| chr22_+_39916558 | 0.17 |
ENST00000337304.2 ENST00000396680.1 |
ATF4 |
activating transcription factor 4 |
| chr5_-_137071756 | 0.17 |
ENST00000394937.3 ENST00000309755.4 |
KLHL3 |
kelch-like family member 3 |
| chr3_-_113465065 | 0.17 |
ENST00000497255.1 ENST00000478020.1 ENST00000240922.3 ENST00000493900.1 |
NAA50 |
N(alpha)-acetyltransferase 50, NatE catalytic subunit |
| chr16_-_30125177 | 0.17 |
ENST00000406256.3 |
GDPD3 |
glycerophosphodiester phosphodiesterase domain containing 3 |
| chr17_+_25799008 | 0.17 |
ENST00000583370.1 ENST00000398988.3 ENST00000268763.6 |
KSR1 |
kinase suppressor of ras 1 |
| chr20_-_634000 | 0.16 |
ENST00000381962.3 |
SRXN1 |
sulfiredoxin 1 |
| chr12_-_15114658 | 0.16 |
ENST00000542276.1 |
ARHGDIB |
Rho GDP dissociation inhibitor (GDI) beta |
| chr12_-_15114492 | 0.15 |
ENST00000541546.1 |
ARHGDIB |
Rho GDP dissociation inhibitor (GDI) beta |
| chr12_-_15114603 | 0.15 |
ENST00000228945.4 |
ARHGDIB |
Rho GDP dissociation inhibitor (GDI) beta |
| chr16_-_4665023 | 0.15 |
ENST00000591897.1 |
UBALD1 |
UBA-like domain containing 1 |
| chr15_-_76304731 | 0.15 |
ENST00000394907.3 |
NRG4 |
neuregulin 4 |
| chr17_-_39296739 | 0.15 |
ENST00000345847.4 |
KRTAP4-6 |
keratin associated protein 4-6 |
| chr1_-_207224307 | 0.14 |
ENST00000315927.4 |
YOD1 |
YOD1 deubiquitinase |
| chr17_-_27405875 | 0.14 |
ENST00000359450.6 |
TIAF1 |
TGFB1-induced anti-apoptotic factor 1 |
| chr7_+_39663061 | 0.14 |
ENST00000005257.2 |
RALA |
v-ral simian leukemia viral oncogene homolog A (ras related) |
| chr9_+_140135665 | 0.13 |
ENST00000340384.4 |
TUBB4B |
tubulin, beta 4B class IVb |
| chr7_-_135412925 | 0.13 |
ENST00000354042.4 |
SLC13A4 |
solute carrier family 13 (sodium/sulfate symporter), member 4 |
| chr2_+_69201705 | 0.13 |
ENST00000377938.2 |
GKN1 |
gastrokine 1 |
| chr4_-_146019693 | 0.13 |
ENST00000514390.1 |
ANAPC10 |
anaphase promoting complex subunit 10 |
| chr17_-_18161870 | 0.13 |
ENST00000579294.1 ENST00000545457.2 ENST00000379450.4 ENST00000578558.1 |
FLII |
flightless I homolog (Drosophila) |
| chr16_-_4664860 | 0.13 |
ENST00000587615.1 ENST00000587649.1 ENST00000590965.1 ENST00000591401.1 ENST00000283474.7 |
UBALD1 |
UBA-like domain containing 1 |
| chr4_-_100356844 | 0.13 |
ENST00000437033.2 |
ADH7 |
alcohol dehydrogenase 7 (class IV), mu or sigma polypeptide |
| chr17_-_29641104 | 0.12 |
ENST00000577894.1 ENST00000330927.4 |
EVI2B |
ecotropic viral integration site 2B |
| chr12_-_15114191 | 0.12 |
ENST00000541380.1 |
ARHGDIB |
Rho GDP dissociation inhibitor (GDI) beta |
| chr3_-_141747439 | 0.12 |
ENST00000467667.1 |
TFDP2 |
transcription factor Dp-2 (E2F dimerization partner 2) |
| chr11_-_94965667 | 0.12 |
ENST00000542176.1 ENST00000278499.2 |
SESN3 |
sestrin 3 |
| chr9_+_125376948 | 0.12 |
ENST00000297913.2 |
OR1Q1 |
olfactory receptor, family 1, subfamily Q, member 1 |
| chr2_-_97509749 | 0.11 |
ENST00000331001.2 ENST00000318357.4 |
ANKRD23 |
ankyrin repeat domain 23 |
| chr4_-_100356551 | 0.11 |
ENST00000209665.4 |
ADH7 |
alcohol dehydrogenase 7 (class IV), mu or sigma polypeptide |
| chrX_+_123094369 | 0.10 |
ENST00000455404.1 ENST00000218089.9 |
STAG2 |
stromal antigen 2 |
| chr22_+_23487513 | 0.10 |
ENST00000263116.2 ENST00000341989.4 |
RAB36 |
RAB36, member RAS oncogene family |
| chr17_-_39334460 | 0.09 |
ENST00000377726.2 |
KRTAP4-2 |
keratin associated protein 4-2 |
| chr2_+_89999259 | 0.09 |
ENST00000558026.1 |
IGKV2D-28 |
immunoglobulin kappa variable 2D-28 |
| chr17_-_38956205 | 0.09 |
ENST00000306658.7 |
KRT28 |
keratin 28 |
| chr20_-_17539456 | 0.09 |
ENST00000544874.1 ENST00000377868.2 |
BFSP1 |
beaded filament structural protein 1, filensin |
| chr8_+_99076750 | 0.09 |
ENST00000545282.1 |
C8orf47 |
chromosome 8 open reading frame 47 |
| chr3_-_196065248 | 0.09 |
ENST00000446879.1 ENST00000273695.3 |
TM4SF19 |
transmembrane 4 L six family member 19 |
| chr7_+_112063192 | 0.09 |
ENST00000005558.4 |
IFRD1 |
interferon-related developmental regulator 1 |
| chr18_+_21693306 | 0.08 |
ENST00000540918.2 |
TTC39C |
tetratricopeptide repeat domain 39C |
| chr10_+_121410882 | 0.08 |
ENST00000369085.3 |
BAG3 |
BCL2-associated athanogene 3 |
| chr22_-_39151947 | 0.08 |
ENST00000216064.4 |
SUN2 |
Sad1 and UNC84 domain containing 2 |
| chr18_+_9885934 | 0.08 |
ENST00000357775.5 |
TXNDC2 |
thioredoxin domain containing 2 (spermatozoa) |
| chr6_+_106959718 | 0.08 |
ENST00000369066.3 |
AIM1 |
absent in melanoma 1 |
| chr11_+_68671310 | 0.08 |
ENST00000255078.3 ENST00000539224.1 |
IGHMBP2 |
immunoglobulin mu binding protein 2 |
| chr11_-_47198380 | 0.08 |
ENST00000419701.2 ENST00000526342.1 ENST00000528444.1 ENST00000530596.1 ENST00000525398.1 ENST00000319543.6 ENST00000426335.2 ENST00000527927.1 ENST00000525314.1 |
ARFGAP2 |
ADP-ribosylation factor GTPase activating protein 2 |
| chr5_+_14664762 | 0.07 |
ENST00000284274.4 |
FAM105B |
family with sequence similarity 105, member B |
| chr13_-_52027134 | 0.07 |
ENST00000311234.4 ENST00000425000.1 ENST00000463928.1 ENST00000442263.3 ENST00000398119.2 |
INTS6 |
integrator complex subunit 6 |
| chr11_-_64013288 | 0.07 |
ENST00000542235.1 |
PPP1R14B |
protein phosphatase 1, regulatory (inhibitor) subunit 14B |
| chr12_-_49351303 | 0.07 |
ENST00000256682.4 |
ARF3 |
ADP-ribosylation factor 3 |
| chr17_-_73401567 | 0.07 |
ENST00000392562.1 |
GRB2 |
growth factor receptor-bound protein 2 |
| chr14_+_73525144 | 0.06 |
ENST00000261973.7 ENST00000540173.1 |
RBM25 |
RNA binding motif protein 25 |
| chr2_+_216974020 | 0.06 |
ENST00000392132.2 ENST00000417391.1 |
XRCC5 |
X-ray repair complementing defective repair in Chinese hamster cells 5 (double-strand-break rejoining) |
| chr9_-_139948468 | 0.06 |
ENST00000312665.5 |
ENTPD2 |
ectonucleoside triphosphate diphosphohydrolase 2 |
| chr17_-_28257080 | 0.06 |
ENST00000579954.1 ENST00000540801.1 ENST00000269033.3 ENST00000590153.1 ENST00000582084.1 |
SSH2 |
slingshot protein phosphatase 2 |
| chr6_-_31745085 | 0.06 |
ENST00000375686.3 ENST00000447450.1 |
VWA7 |
von Willebrand factor A domain containing 7 |
| chr2_-_169887827 | 0.06 |
ENST00000263817.6 |
ABCB11 |
ATP-binding cassette, sub-family B (MDR/TAP), member 11 |
| chr3_-_32022733 | 0.05 |
ENST00000438237.2 ENST00000396556.2 |
OSBPL10 |
oxysterol binding protein-like 10 |
| chr7_-_141673573 | 0.05 |
ENST00000547270.1 |
TAS2R38 |
taste receptor, type 2, member 38 |
| chr15_+_59903975 | 0.05 |
ENST00000560585.1 ENST00000396065.1 |
GCNT3 |
glucosaminyl (N-acetyl) transferase 3, mucin type |
| chr6_-_31745037 | 0.05 |
ENST00000375688.4 |
VWA7 |
von Willebrand factor A domain containing 7 |
| chr11_-_2193025 | 0.05 |
ENST00000333684.5 ENST00000381178.1 ENST00000381175.1 ENST00000352909.3 |
TH |
tyrosine hydroxylase |
Gene Ontology Analysis
Gene overrepresentation in biological_process category:
| Log-likelihood per target | Total log-likelihood | Term | Description |
|---|---|---|---|
| 0.7 | 4.0 | GO:1903575 | cornified envelope assembly(GO:1903575) |
| 0.6 | 16.3 | GO:0031581 | hemidesmosome assembly(GO:0031581) |
| 0.5 | 2.1 | GO:0038195 | urokinase plasminogen activator signaling pathway(GO:0038195) |
| 0.5 | 2.3 | GO:0002159 | desmosome assembly(GO:0002159) |
| 0.5 | 2.3 | GO:0002415 | immunoglobulin transcytosis in epithelial cells mediated by polymeric immunoglobulin receptor(GO:0002415) |
| 0.4 | 1.8 | GO:0090362 | positive regulation of platelet-derived growth factor production(GO:0090362) |
| 0.4 | 1.1 | GO:0018153 | isopeptide cross-linking via N6-(L-isoglutamyl)-L-lysine(GO:0018153) isopeptide cross-linking(GO:0018262) |
| 0.4 | 1.5 | GO:0050712 | negative regulation of interleukin-1 alpha production(GO:0032690) negative regulation of interleukin-1 alpha secretion(GO:0050712) |
| 0.3 | 0.3 | GO:0070301 | cellular response to hydrogen peroxide(GO:0070301) |
| 0.2 | 1.6 | GO:0051122 | hepoxilin metabolic process(GO:0051121) hepoxilin biosynthetic process(GO:0051122) |
| 0.2 | 1.3 | GO:2001268 | negative regulation of cysteine-type endopeptidase activity involved in apoptotic signaling pathway(GO:2001268) |
| 0.2 | 0.6 | GO:0007206 | phospholipase C-activating G-protein coupled glutamate receptor signaling pathway(GO:0007206) |
| 0.1 | 0.4 | GO:1903028 | positive regulation of opsonization(GO:1903028) |
| 0.1 | 1.0 | GO:2000491 | positive regulation of hepatic stellate cell activation(GO:2000491) |
| 0.1 | 0.3 | GO:0046521 | sphingoid catabolic process(GO:0046521) |
| 0.1 | 0.5 | GO:0015862 | uridine transport(GO:0015862) |
| 0.1 | 1.7 | GO:0051546 | keratinocyte migration(GO:0051546) |
| 0.1 | 2.1 | GO:0003334 | keratinocyte development(GO:0003334) |
| 0.1 | 2.1 | GO:0035589 | G-protein coupled purinergic nucleotide receptor signaling pathway(GO:0035589) |
| 0.1 | 1.1 | GO:0001766 | membrane raft polarization(GO:0001766) membrane raft distribution(GO:0031580) |
| 0.1 | 0.6 | GO:0071461 | cellular response to redox state(GO:0071461) |
| 0.1 | 0.6 | GO:0098881 | exocytic insertion of neurotransmitter receptor to plasma membrane(GO:0098881) exocytic insertion of neurotransmitter receptor to postsynaptic membrane(GO:0098967) |
| 0.1 | 0.2 | GO:0045994 | positive regulation of translational initiation by iron(GO:0045994) |
| 0.1 | 0.3 | GO:0043006 | activation of phospholipase A2 activity by calcium-mediated signaling(GO:0043006) |
| 0.1 | 0.3 | GO:0006238 | CMP salvage(GO:0006238) CMP biosynthetic process(GO:0009224) CMP metabolic process(GO:0046035) |
| 0.1 | 0.9 | GO:0042908 | xenobiotic transport(GO:0042908) |
| 0.1 | 0.2 | GO:0010430 | fatty acid omega-oxidation(GO:0010430) |
| 0.1 | 0.2 | GO:0046167 | glycerol-3-phosphate biosynthetic process(GO:0046167) |
| 0.1 | 0.2 | GO:0002541 | activation of plasma proteins involved in acute inflammatory response(GO:0002541) |
| 0.1 | 0.1 | GO:0051665 | membrane raft localization(GO:0051665) |
| 0.1 | 0.4 | GO:0007296 | vitellogenesis(GO:0007296) |
| 0.1 | 0.2 | GO:1903031 | regulation of microtubule plus-end binding(GO:1903031) positive regulation of microtubule plus-end binding(GO:1903033) |
| 0.1 | 0.3 | GO:0003430 | growth plate cartilage chondrocyte growth(GO:0003430) Harderian gland development(GO:0070384) |
| 0.1 | 0.8 | GO:0035092 | sperm chromatin condensation(GO:0035092) |
| 0.1 | 0.8 | GO:1904936 | cerebral cortex GABAergic interneuron migration(GO:0021853) interneuron migration(GO:1904936) |
| 0.1 | 0.2 | GO:0061394 | regulation of transcription from RNA polymerase II promoter in response to arsenic-containing substance(GO:0061394) response to manganese-induced endoplasmic reticulum stress(GO:1990737) |
| 0.1 | 0.9 | GO:0043248 | proteasome assembly(GO:0043248) |
| 0.1 | 0.4 | GO:0032621 | interleukin-18 production(GO:0032621) |
| 0.0 | 0.4 | GO:0035897 | proteolysis in other organism(GO:0035897) |
| 0.0 | 1.3 | GO:0035855 | megakaryocyte development(GO:0035855) |
| 0.0 | 0.3 | GO:1903659 | regulation of complement-dependent cytotoxicity(GO:1903659) |
| 0.0 | 0.2 | GO:0015692 | lead ion transport(GO:0015692) |
| 0.0 | 0.2 | GO:0072156 | distal tubule morphogenesis(GO:0072156) |
| 0.0 | 0.4 | GO:0098734 | macromolecule depalmitoylation(GO:0098734) |
| 0.0 | 0.4 | GO:0006477 | protein sulfation(GO:0006477) |
| 0.0 | 1.4 | GO:0032461 | positive regulation of protein oligomerization(GO:0032461) |
| 0.0 | 0.1 | GO:1990167 | protein K27-linked deubiquitination(GO:1990167) protein K33-linked deubiquitination(GO:1990168) |
| 0.0 | 0.6 | GO:0006662 | glycerol ether metabolic process(GO:0006662) |
| 0.0 | 0.4 | GO:0048505 | regulation of development, heterochronic(GO:0040034) regulation of timing of cell differentiation(GO:0048505) |
| 0.0 | 0.5 | GO:0060315 | negative regulation of ryanodine-sensitive calcium-release channel activity(GO:0060315) |
| 0.0 | 0.3 | GO:1903800 | positive regulation of production of miRNAs involved in gene silencing by miRNA(GO:1903800) |
| 0.0 | 0.1 | GO:0007518 | myoblast fate determination(GO:0007518) |
| 0.0 | 0.4 | GO:0019388 | galactose catabolic process(GO:0019388) |
| 0.0 | 2.4 | GO:0010923 | negative regulation of phosphatase activity(GO:0010923) |
| 0.0 | 0.9 | GO:1901385 | regulation of voltage-gated calcium channel activity(GO:1901385) |
| 0.0 | 0.2 | GO:0006686 | sphingomyelin biosynthetic process(GO:0006686) |
| 0.0 | 0.2 | GO:0051044 | positive regulation of membrane protein ectodomain proteolysis(GO:0051044) |
| 0.0 | 1.2 | GO:0007157 | heterophilic cell-cell adhesion via plasma membrane cell adhesion molecules(GO:0007157) |
| 0.0 | 1.2 | GO:0006953 | acute-phase response(GO:0006953) |
| 0.0 | 1.1 | GO:0018149 | peptide cross-linking(GO:0018149) |
| 0.0 | 0.0 | GO:0042214 | terpene metabolic process(GO:0042214) phytoalexin metabolic process(GO:0052314) |
| 0.0 | 0.0 | GO:1903697 | negative regulation of microvillus assembly(GO:1903697) |
| 0.0 | 0.6 | GO:0034629 | cellular protein complex localization(GO:0034629) |
| 0.0 | 0.4 | GO:0035988 | chondrocyte proliferation(GO:0035988) |
| 0.0 | 0.7 | GO:0050873 | brown fat cell differentiation(GO:0050873) |
| 0.0 | 0.1 | GO:0038203 | TORC2 signaling(GO:0038203) |
| 0.0 | 0.1 | GO:0015722 | canalicular bile acid transport(GO:0015722) |
| 0.0 | 0.2 | GO:0070601 | centromeric sister chromatid cohesion(GO:0070601) |
| 0.0 | 0.1 | GO:0031022 | nuclear migration along microfilament(GO:0031022) |
| 0.0 | 0.1 | GO:1904430 | cellular hyperosmotic salinity response(GO:0071475) negative regulation of t-circle formation(GO:1904430) |
| 0.0 | 5.6 | GO:0031098 | stress-activated protein kinase signaling cascade(GO:0031098) |
| 0.0 | 0.1 | GO:0051014 | actin filament severing(GO:0051014) |
| 0.0 | 0.9 | GO:0046847 | filopodium assembly(GO:0046847) |
| 0.0 | 0.2 | GO:0072583 | clathrin-mediated endocytosis(GO:0072583) |
| 0.0 | 0.2 | GO:1990748 | cellular oxidant detoxification(GO:0098869) cellular detoxification(GO:1990748) |
| 0.0 | 0.1 | GO:0009181 | purine nucleoside diphosphate catabolic process(GO:0009137) purine ribonucleoside diphosphate catabolic process(GO:0009181) |
Gene overrepresentation in cellular_component category:
| Log-likelihood per target | Total log-likelihood | Term | Description |
|---|---|---|---|
| 1.8 | 14.4 | GO:0005610 | laminin-5 complex(GO:0005610) |
| 0.2 | 2.3 | GO:0071438 | invadopodium membrane(GO:0071438) |
| 0.1 | 0.6 | GO:1990796 | photoreceptor cell terminal bouton(GO:1990796) |
| 0.1 | 2.8 | GO:0030056 | hemidesmosome(GO:0030056) |
| 0.1 | 0.3 | GO:0097489 | multivesicular body, internal vesicle lumen(GO:0097489) |
| 0.1 | 0.9 | GO:0008541 | proteasome regulatory particle, lid subcomplex(GO:0008541) |
| 0.1 | 1.5 | GO:1990124 | messenger ribonucleoprotein complex(GO:1990124) |
| 0.1 | 0.6 | GO:0005827 | polar microtubule(GO:0005827) |
| 0.1 | 0.2 | GO:0033565 | ESCRT-0 complex(GO:0033565) |
| 0.0 | 0.6 | GO:0001520 | outer dense fiber(GO:0001520) |
| 0.0 | 0.2 | GO:0070826 | paraferritin complex(GO:0070826) |
| 0.0 | 2.2 | GO:0001533 | cornified envelope(GO:0001533) |
| 0.0 | 0.2 | GO:0045323 | interleukin-1 receptor complex(GO:0045323) |
| 0.0 | 0.2 | GO:1990037 | Lewy body core(GO:1990037) |
| 0.0 | 0.6 | GO:0042599 | lamellar body(GO:0042599) |
| 0.0 | 0.4 | GO:0072559 | NLRP3 inflammasome complex(GO:0072559) |
| 0.0 | 0.2 | GO:0031415 | NatA complex(GO:0031415) |
| 0.0 | 0.1 | GO:0070436 | Grb2-EGFR complex(GO:0070436) |
| 0.0 | 3.5 | GO:0001650 | fibrillar center(GO:0001650) |
| 0.0 | 0.4 | GO:0001931 | uropod(GO:0001931) cell trailing edge(GO:0031254) |
| 0.0 | 0.1 | GO:0005577 | fibrinogen complex(GO:0005577) |
| 0.0 | 1.4 | GO:0055038 | recycling endosome membrane(GO:0055038) |
| 0.0 | 0.3 | GO:0042613 | MHC class II protein complex(GO:0042613) |
| 0.0 | 0.6 | GO:0043034 | costamere(GO:0043034) |
| 0.0 | 0.2 | GO:0030130 | clathrin coat of trans-Golgi network vesicle(GO:0030130) |
| 0.0 | 0.1 | GO:0043564 | Ku70:Ku80 complex(GO:0043564) |
| 0.0 | 0.8 | GO:0030315 | T-tubule(GO:0030315) |
Gene overrepresentation in molecular_function category:
| Log-likelihood per target | Total log-likelihood | Term | Description |
|---|---|---|---|
| 0.8 | 2.3 | GO:0030377 | urokinase plasminogen activator receptor activity(GO:0030377) |
| 0.4 | 1.6 | GO:0051120 | hepoxilin A3 synthase activity(GO:0051120) |
| 0.3 | 1.5 | GO:0004910 | interleukin-1, Type II, blocking receptor activity(GO:0004910) |
| 0.2 | 0.5 | GO:0047389 | glycerophosphocholine phosphodiesterase activity(GO:0047389) |
| 0.2 | 2.3 | GO:0045294 | alpha-catenin binding(GO:0045294) |
| 0.1 | 1.9 | GO:0038132 | neuregulin binding(GO:0038132) |
| 0.1 | 0.4 | GO:0003974 | UDP-N-acetylglucosamine 4-epimerase activity(GO:0003974) UDP-glucose 4-epimerase activity(GO:0003978) |
| 0.1 | 0.9 | GO:0008559 | xenobiotic-transporting ATPase activity(GO:0008559) |
| 0.1 | 2.1 | GO:0045028 | G-protein coupled nucleotide receptor activity(GO:0001608) G-protein coupled purinergic nucleotide receptor activity(GO:0045028) |
| 0.1 | 1.1 | GO:0019911 | structural constituent of myelin sheath(GO:0019911) |
| 0.1 | 0.2 | GO:0004370 | glycerol kinase activity(GO:0004370) |
| 0.1 | 0.3 | GO:0008426 | protein kinase C inhibitor activity(GO:0008426) |
| 0.1 | 0.2 | GO:0004886 | 9-cis retinoic acid receptor activity(GO:0004886) |
| 0.1 | 0.3 | GO:0005006 | epidermal growth factor-activated receptor activity(GO:0005006) |
| 0.1 | 2.1 | GO:0008157 | protein phosphatase 1 binding(GO:0008157) |
| 0.1 | 0.4 | GO:0001517 | N-acetylglucosamine 6-O-sulfotransferase activity(GO:0001517) |
| 0.1 | 0.2 | GO:0004031 | aldehyde oxidase activity(GO:0004031) |
| 0.1 | 0.6 | GO:0050544 | arachidonic acid binding(GO:0050544) |
| 0.1 | 0.3 | GO:0017050 | sphinganine kinase activity(GO:0008481) D-erythro-sphingosine kinase activity(GO:0017050) |
| 0.0 | 0.6 | GO:0005094 | Rho GDP-dissociation inhibitor activity(GO:0005094) |
| 0.0 | 0.1 | GO:1904455 | ubiquitin-specific protease activity involved in negative regulation of ERAD pathway(GO:1904455) |
| 0.0 | 0.6 | GO:0047134 | protein-disulfide reductase activity(GO:0047134) |
| 0.0 | 0.2 | GO:0015639 | cadmium ion transmembrane transporter activity(GO:0015086) cobalt ion transmembrane transporter activity(GO:0015087) lead ion transmembrane transporter activity(GO:0015094) ferrous iron uptake transmembrane transporter activity(GO:0015639) |
| 0.0 | 0.6 | GO:0035256 | G-protein coupled glutamate receptor binding(GO:0035256) |
| 0.0 | 3.3 | GO:0048365 | Rac GTPase binding(GO:0048365) |
| 0.0 | 0.4 | GO:0098599 | palmitoyl-(protein) hydrolase activity(GO:0008474) palmitoyl hydrolase activity(GO:0098599) |
| 0.0 | 0.2 | GO:0047493 | sphingomyelin synthase activity(GO:0033188) ceramide cholinephosphotransferase activity(GO:0047493) |
| 0.0 | 2.4 | GO:0019003 | GDP binding(GO:0019003) |
| 0.0 | 0.3 | GO:0004849 | uridine kinase activity(GO:0004849) |
| 0.0 | 0.4 | GO:0005225 | volume-sensitive anion channel activity(GO:0005225) |
| 0.0 | 0.4 | GO:0042834 | peptidoglycan binding(GO:0042834) |
| 0.0 | 0.3 | GO:0003708 | retinoic acid receptor activity(GO:0003708) |
| 0.0 | 0.2 | GO:0004704 | NF-kappaB-inducing kinase activity(GO:0004704) |
| 0.0 | 0.0 | GO:0071074 | eukaryotic initiation factor eIF2 binding(GO:0071074) |
| 0.0 | 1.0 | GO:0043027 | cysteine-type endopeptidase inhibitor activity involved in apoptotic process(GO:0043027) |
| 0.0 | 1.2 | GO:0005547 | phosphatidylinositol-3,4,5-trisphosphate binding(GO:0005547) |
| 0.0 | 0.2 | GO:0032050 | clathrin heavy chain binding(GO:0032050) |
| 0.0 | 0.2 | GO:0019855 | calcium channel inhibitor activity(GO:0019855) |
| 0.0 | 0.1 | GO:0003829 | beta-1,3-galactosyl-O-glycosyl-glycoprotein beta-1,6-N-acetylglucosaminyltransferase activity(GO:0003829) |
| 0.0 | 2.2 | GO:0004867 | serine-type endopeptidase inhibitor activity(GO:0004867) |
| 0.0 | 0.3 | GO:0017017 | MAP kinase tyrosine/serine/threonine phosphatase activity(GO:0017017) |
| 0.0 | 16.7 | GO:0005198 | structural molecule activity(GO:0005198) |
| 0.0 | 0.1 | GO:0043141 | ATP-dependent 5'-3' DNA helicase activity(GO:0043141) |
| 0.0 | 0.5 | GO:0005337 | nucleoside transmembrane transporter activity(GO:0005337) |
| 0.0 | 2.0 | GO:0004222 | metalloendopeptidase activity(GO:0004222) |
| 0.0 | 0.4 | GO:0004708 | MAP kinase kinase activity(GO:0004708) |
| 0.0 | 0.1 | GO:0004322 | ferroxidase activity(GO:0004322) oxidoreductase activity, oxidizing metal ions, oxygen as acceptor(GO:0016724) |
| 0.0 | 0.2 | GO:0048156 | tau protein binding(GO:0048156) |
| 0.0 | 0.4 | GO:0004602 | glutathione peroxidase activity(GO:0004602) |
| 0.0 | 0.2 | GO:0004596 | peptide alpha-N-acetyltransferase activity(GO:0004596) |
| 0.0 | 0.1 | GO:0031432 | titin binding(GO:0031432) |
| 0.0 | 0.2 | GO:0042043 | neurexin family protein binding(GO:0042043) |
| 0.0 | 1.3 | GO:0000980 | RNA polymerase II distal enhancer sequence-specific DNA binding(GO:0000980) |
| 0.0 | 0.1 | GO:0008271 | secondary active sulfate transmembrane transporter activity(GO:0008271) |
| 0.0 | 0.2 | GO:0043522 | leucine zipper domain binding(GO:0043522) |
Gene overrepresentation in C2:CP category:
| Log-likelihood per target | Total log-likelihood | Term | Description |
|---|---|---|---|
| 0.7 | 16.3 | PID INTEGRIN4 PATHWAY | Alpha6 beta4 integrin-ligand interactions |
| 0.1 | 7.0 | PID FRA PATHWAY | Validated transcriptional targets of AP1 family members Fra1 and Fra2 |
| 0.1 | 3.5 | SIG REGULATION OF THE ACTIN CYTOSKELETON BY RHO GTPASES | Genes related to regulation of the actin cytoskeleton |
| 0.0 | 1.1 | PID ECADHERIN KERATINOCYTE PATHWAY | E-cadherin signaling in keratinocytes |
| 0.0 | 1.6 | PID IL1 PATHWAY | IL1-mediated signaling events |
| 0.0 | 1.0 | SA B CELL RECEPTOR COMPLEXES | Antigen binding to B cell receptors activates protein tyrosine kinases, such as the Src family, which ultimate activate MAP kinases. |
| 0.0 | 0.4 | PID P38 GAMMA DELTA PATHWAY | Signaling mediated by p38-gamma and p38-delta |
| 0.0 | 1.1 | PID HIF2PATHWAY | HIF-2-alpha transcription factor network |
| 0.0 | 0.6 | PID RETINOIC ACID PATHWAY | Retinoic acid receptors-mediated signaling |
| 0.0 | 1.1 | PID HNF3A PATHWAY | FOXA1 transcription factor network |
| 0.0 | 0.3 | PID S1P S1P1 PATHWAY | S1P1 pathway |
Gene overrepresentation in C2:CP:REACTOME category:
| Log-likelihood per target | Total log-likelihood | Term | Description |
|---|---|---|---|
| 0.1 | 3.5 | REACTOME ACTIVATION OF RAC | Genes involved in Activation of Rac |
| 0.1 | 17.1 | REACTOME CELL JUNCTION ORGANIZATION | Genes involved in Cell junction organization |
| 0.1 | 1.9 | REACTOME REGULATION OF INSULIN LIKE GROWTH FACTOR IGF ACTIVITY BY INSULIN LIKE GROWTH FACTOR BINDING PROTEINS IGFBPS | Genes involved in Regulation of Insulin-like Growth Factor (IGF) Activity by Insulin-like Growth Factor Binding Proteins (IGFBPs) |
| 0.1 | 0.9 | REACTOME ABACAVIR TRANSPORT AND METABOLISM | Genes involved in Abacavir transport and metabolism |
| 0.1 | 2.3 | REACTOME POST TRANSLATIONAL MODIFICATION SYNTHESIS OF GPI ANCHORED PROTEINS | Genes involved in Post-translational modification: synthesis of GPI-anchored proteins |
| 0.1 | 1.9 | REACTOME SYNTHESIS OF PA | Genes involved in Synthesis of PA |
| 0.0 | 0.8 | REACTOME THE NLRP3 INFLAMMASOME | Genes involved in The NLRP3 inflammasome |
| 0.0 | 0.4 | REACTOME ACTIVATED TAK1 MEDIATES P38 MAPK ACTIVATION | Genes involved in activated TAK1 mediates p38 MAPK activation |
| 0.0 | 1.0 | REACTOME ERK MAPK TARGETS | Genes involved in ERK/MAPK targets |
| 0.0 | 1.7 | REACTOME IL1 SIGNALING | Genes involved in Interleukin-1 signaling |
| 0.0 | 0.2 | REACTOME GAP JUNCTION DEGRADATION | Genes involved in Gap junction degradation |
| 0.0 | 2.1 | REACTOME GOLGI ASSOCIATED VESICLE BIOGENESIS | Genes involved in Golgi Associated Vesicle Biogenesis |
| 0.0 | 0.6 | REACTOME PROTEOLYTIC CLEAVAGE OF SNARE COMPLEX PROTEINS | Genes involved in Proteolytic cleavage of SNARE complex proteins |
| 0.0 | 0.4 | REACTOME SHC1 EVENTS IN EGFR SIGNALING | Genes involved in SHC1 events in EGFR signaling |
| 0.0 | 0.6 | REACTOME DEGRADATION OF THE EXTRACELLULAR MATRIX | Genes involved in Degradation of the extracellular matrix |
| 0.0 | 0.2 | REACTOME ETHANOL OXIDATION | Genes involved in Ethanol oxidation |
| 0.0 | 0.9 | REACTOME CROSS PRESENTATION OF SOLUBLE EXOGENOUS ANTIGENS ENDOSOMES | Genes involved in Cross-presentation of soluble exogenous antigens (endosomes) |
| 0.0 | 0.2 | REACTOME ACTIVATION OF CHAPERONE GENES BY ATF6 ALPHA | Genes involved in Activation of Chaperone Genes by ATF6-alpha |
| 0.0 | 0.5 | REACTOME SPHINGOLIPID DE NOVO BIOSYNTHESIS | Genes involved in Sphingolipid de novo biosynthesis |
| 0.0 | 0.4 | REACTOME SIGNALING BY FGFR1 FUSION MUTANTS | Genes involved in Signaling by FGFR1 fusion mutants |