Project
Epithelial-Mesenchymal Transition, human (Scheel, 2011)
Navigation
Downloads
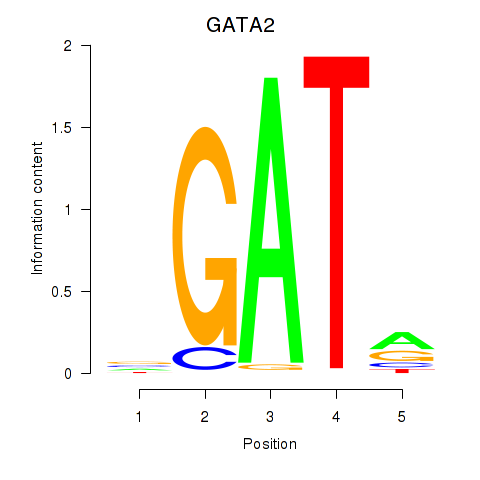
Results for GATA2
Z-value: 1.53
Motif logo
Transcription factors associated with GATA2
| Gene Symbol | Gene ID | Gene Info |
|---|---|---|
|
GATA2
|
ENSG00000179348.7 | GATA2 |
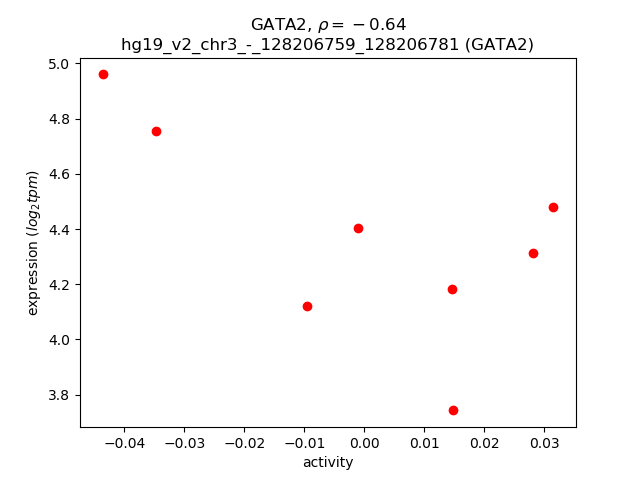
Activity-expression correlation:
| Gene | Promoter | Pearson corr. coef. | P-value | Plot |
|---|---|---|---|---|
| GATA2 | hg19_v2_chr3_-_128206759_128206781 | -0.64 | 8.9e-02 | Click! |
Activity profile of GATA2 motif
Sorted Z-values of GATA2 motif
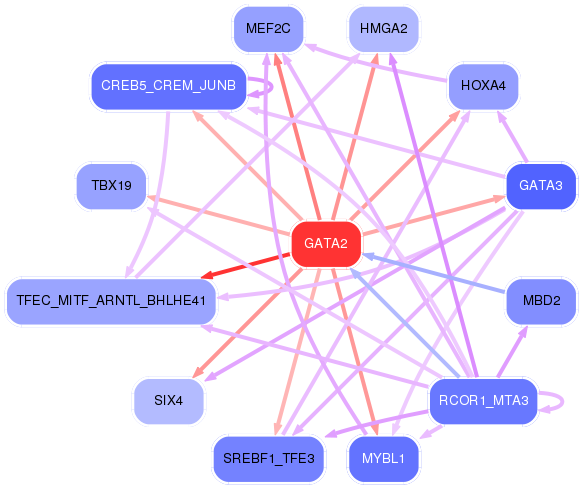
Network of associatons between targets according to the STRING database.

First level regulatory network of GATA2
| Promoter | Score | Transcript | Gene | Gene Info |
|---|---|---|---|---|
| chr12_-_91546926 | 3.67 |
ENST00000550758.1 |
DCN |
decorin |
| chr12_-_91573132 | 2.96 |
ENST00000550563.1 ENST00000546370.1 |
DCN |
decorin |
| chr1_+_78956651 | 2.44 |
ENST00000370757.3 ENST00000370756.3 |
PTGFR |
prostaglandin F receptor (FP) |
| chr13_+_102142296 | 2.38 |
ENST00000376162.3 |
ITGBL1 |
integrin, beta-like 1 (with EGF-like repeat domains) |
| chr2_-_202562774 | 1.96 |
ENST00000396886.3 ENST00000409143.1 |
MPP4 |
membrane protein, palmitoylated 4 (MAGUK p55 subfamily member 4) |
| chr1_+_114522049 | 1.78 |
ENST00000369551.1 ENST00000320334.4 |
OLFML3 |
olfactomedin-like 3 |
| chr5_-_20575959 | 1.70 |
ENST00000507958.1 |
CDH18 |
cadherin 18, type 2 |
| chr10_+_69865866 | 1.66 |
ENST00000354393.2 |
MYPN |
myopalladin |
| chr20_+_34802295 | 1.64 |
ENST00000432603.1 |
EPB41L1 |
erythrocyte membrane protein band 4.1-like 1 |
| chr12_-_91572278 | 1.57 |
ENST00000425043.1 ENST00000420120.2 ENST00000441303.2 ENST00000456569.2 |
DCN |
decorin |
| chr1_+_183774240 | 1.55 |
ENST00000360851.3 |
RGL1 |
ral guanine nucleotide dissociation stimulator-like 1 |
| chr1_+_180165672 | 1.34 |
ENST00000443059.1 |
QSOX1 |
quiescin Q6 sulfhydryl oxidase 1 |
| chr2_-_202562716 | 1.29 |
ENST00000428900.2 |
MPP4 |
membrane protein, palmitoylated 4 (MAGUK p55 subfamily member 4) |
| chr5_-_19988339 | 1.27 |
ENST00000382275.1 |
CDH18 |
cadherin 18, type 2 |
| chr13_+_76378357 | 1.25 |
ENST00000489941.2 ENST00000525373.1 |
LMO7 |
LIM domain 7 |
| chr4_-_70626314 | 1.24 |
ENST00000510821.1 |
SULT1B1 |
sulfotransferase family, cytosolic, 1B, member 1 |
| chr9_-_79307096 | 1.20 |
ENST00000376717.2 ENST00000223609.6 ENST00000443509.2 |
PRUNE2 |
prune homolog 2 (Drosophila) |
| chr16_+_55512742 | 1.20 |
ENST00000568715.1 ENST00000219070.4 |
MMP2 |
matrix metallopeptidase 2 (gelatinase A, 72kDa gelatinase, 72kDa type IV collagenase) |
| chr7_+_94023873 | 1.19 |
ENST00000297268.6 |
COL1A2 |
collagen, type I, alpha 2 |
| chr19_+_14551066 | 1.17 |
ENST00000342216.4 |
PKN1 |
protein kinase N1 |
| chr10_-_79397391 | 1.14 |
ENST00000286628.8 ENST00000406533.3 ENST00000354353.5 ENST00000404857.1 |
KCNMA1 |
potassium large conductance calcium-activated channel, subfamily M, alpha member 1 |
| chr5_+_71403061 | 1.13 |
ENST00000512974.1 ENST00000296755.7 |
MAP1B |
microtubule-associated protein 1B |
| chr5_-_75919253 | 1.13 |
ENST00000296641.4 |
F2RL2 |
coagulation factor II (thrombin) receptor-like 2 |
| chr17_-_48278983 | 1.03 |
ENST00000225964.5 |
COL1A1 |
collagen, type I, alpha 1 |
| chr5_-_75919217 | 0.94 |
ENST00000504899.1 |
F2RL2 |
coagulation factor II (thrombin) receptor-like 2 |
| chr2_-_158345462 | 0.93 |
ENST00000439355.1 ENST00000540637.1 |
CYTIP |
cytohesin 1 interacting protein |
| chr2_+_201450591 | 0.91 |
ENST00000374700.2 |
AOX1 |
aldehyde oxidase 1 |
| chr12_-_47219733 | 0.91 |
ENST00000547477.1 ENST00000447411.1 ENST00000266579.4 |
SLC38A4 |
solute carrier family 38, member 4 |
| chr10_-_79397316 | 0.91 |
ENST00000372421.5 ENST00000457953.1 |
KCNMA1 |
potassium large conductance calcium-activated channel, subfamily M, alpha member 1 |
| chr1_+_78383813 | 0.91 |
ENST00000342754.5 |
NEXN |
nexilin (F actin binding protein) |
| chr9_+_90112117 | 0.91 |
ENST00000358077.5 |
DAPK1 |
death-associated protein kinase 1 |
| chr3_+_69812701 | 0.87 |
ENST00000472437.1 |
MITF |
microphthalmia-associated transcription factor |
| chr13_-_33780133 | 0.87 |
ENST00000399365.3 |
STARD13 |
StAR-related lipid transfer (START) domain containing 13 |
| chr5_+_148521136 | 0.86 |
ENST00000506113.1 |
ABLIM3 |
actin binding LIM protein family, member 3 |
| chr12_-_91573249 | 0.85 |
ENST00000550099.1 ENST00000546391.1 ENST00000551354.1 |
DCN |
decorin |
| chr5_+_140772381 | 0.85 |
ENST00000398604.2 |
PCDHGA8 |
protocadherin gamma subfamily A, 8 |
| chr6_-_87804815 | 0.85 |
ENST00000369582.2 |
CGA |
glycoprotein hormones, alpha polypeptide |
| chr10_-_79397479 | 0.82 |
ENST00000404771.3 |
KCNMA1 |
potassium large conductance calcium-activated channel, subfamily M, alpha member 1 |
| chr4_+_126237554 | 0.80 |
ENST00000394329.3 |
FAT4 |
FAT atypical cadherin 4 |
| chr2_-_190044480 | 0.80 |
ENST00000374866.3 |
COL5A2 |
collagen, type V, alpha 2 |
| chr9_+_2029019 | 0.79 |
ENST00000382194.1 |
SMARCA2 |
SWI/SNF related, matrix associated, actin dependent regulator of chromatin, subfamily a, member 2 |
| chr13_+_32838801 | 0.77 |
ENST00000542859.1 |
FRY |
furry homolog (Drosophila) |
| chrX_+_149531524 | 0.76 |
ENST00000370401.2 |
MAMLD1 |
mastermind-like domain containing 1 |
| chr10_-_79397202 | 0.75 |
ENST00000372437.1 ENST00000372408.2 ENST00000372403.4 |
KCNMA1 |
potassium large conductance calcium-activated channel, subfamily M, alpha member 1 |
| chr16_+_15528332 | 0.74 |
ENST00000566490.1 |
C16orf45 |
chromosome 16 open reading frame 45 |
| chr5_-_147286065 | 0.73 |
ENST00000318315.4 ENST00000515291.1 |
C5orf46 |
chromosome 5 open reading frame 46 |
| chr3_+_141105235 | 0.72 |
ENST00000503809.1 |
ZBTB38 |
zinc finger and BTB domain containing 38 |
| chr3_-_8811288 | 0.72 |
ENST00000316793.3 ENST00000431493.1 |
OXTR |
oxytocin receptor |
| chr13_+_76378305 | 0.70 |
ENST00000526371.1 ENST00000526528.1 |
LMO7 |
LIM domain 7 |
| chr4_-_89619386 | 0.68 |
ENST00000323061.5 |
NAP1L5 |
nucleosome assembly protein 1-like 5 |
| chr5_-_172198190 | 0.67 |
ENST00000239223.3 |
DUSP1 |
dual specificity phosphatase 1 |
| chr4_-_57547454 | 0.66 |
ENST00000556376.2 |
HOPX |
HOP homeobox |
| chr3_+_141043050 | 0.65 |
ENST00000509842.1 |
ZBTB38 |
zinc finger and BTB domain containing 38 |
| chr11_-_59633951 | 0.65 |
ENST00000257264.3 |
TCN1 |
transcobalamin I (vitamin B12 binding protein, R binder family) |
| chr3_+_154797877 | 0.64 |
ENST00000462745.1 ENST00000493237.1 |
MME |
membrane metallo-endopeptidase |
| chr15_-_93616340 | 0.63 |
ENST00000557420.1 ENST00000542321.2 |
RGMA |
repulsive guidance molecule family member a |
| chr6_-_152639479 | 0.63 |
ENST00000356820.4 |
SYNE1 |
spectrin repeat containing, nuclear envelope 1 |
| chr20_+_12989596 | 0.63 |
ENST00000434210.1 ENST00000399002.2 |
SPTLC3 |
serine palmitoyltransferase, long chain base subunit 3 |
| chrX_-_77395186 | 0.61 |
ENST00000341864.5 |
TAF9B |
TAF9B RNA polymerase II, TATA box binding protein (TBP)-associated factor, 31kDa |
| chr12_+_75874460 | 0.60 |
ENST00000266659.3 |
GLIPR1 |
GLI pathogenesis-related 1 |
| chr5_+_148737562 | 0.60 |
ENST00000274569.4 |
PCYOX1L |
prenylcysteine oxidase 1 like |
| chr10_+_64133934 | 0.60 |
ENST00000395254.3 ENST00000395255.3 ENST00000410046.3 |
ZNF365 |
zinc finger protein 365 |
| chr1_-_232651312 | 0.60 |
ENST00000262861.4 |
SIPA1L2 |
signal-induced proliferation-associated 1 like 2 |
| chr22_+_42665742 | 0.60 |
ENST00000332965.3 ENST00000415205.1 ENST00000446578.1 |
Z83851.3 |
Z83851.3 |
| chr8_+_70404996 | 0.59 |
ENST00000402687.4 ENST00000419716.3 |
SULF1 |
sulfatase 1 |
| chr3_-_149095652 | 0.59 |
ENST00000305366.3 |
TM4SF1 |
transmembrane 4 L six family member 1 |
| chr1_-_150780757 | 0.59 |
ENST00000271651.3 |
CTSK |
cathepsin K |
| chr4_-_57547870 | 0.59 |
ENST00000381260.3 ENST00000420433.1 ENST00000554144.1 ENST00000557328.1 |
HOPX |
HOP homeobox |
| chr5_-_159797627 | 0.58 |
ENST00000393975.3 |
C1QTNF2 |
C1q and tumor necrosis factor related protein 2 |
| chr8_-_23712312 | 0.57 |
ENST00000290271.2 |
STC1 |
stanniocalcin 1 |
| chr6_-_46293378 | 0.56 |
ENST00000330430.6 |
RCAN2 |
regulator of calcineurin 2 |
| chr2_+_201994569 | 0.56 |
ENST00000457277.1 |
CFLAR |
CASP8 and FADD-like apoptosis regulator |
| chr5_+_140753444 | 0.56 |
ENST00000517434.1 |
PCDHGA6 |
protocadherin gamma subfamily A, 6 |
| chr11_-_96076334 | 0.56 |
ENST00000524717.1 |
MAML2 |
mastermind-like 2 (Drosophila) |
| chr1_-_182369751 | 0.55 |
ENST00000367565.1 |
TEDDM1 |
transmembrane epididymal protein 1 |
| chr7_-_38670957 | 0.54 |
ENST00000325590.5 ENST00000428293.2 |
AMPH |
amphiphysin |
| chr7_-_38671098 | 0.54 |
ENST00000356264.2 |
AMPH |
amphiphysin |
| chr3_-_178969403 | 0.53 |
ENST00000314235.5 ENST00000392685.2 |
KCNMB3 |
potassium large conductance calcium-activated channel, subfamily M beta member 3 |
| chr6_-_167276033 | 0.53 |
ENST00000503859.1 ENST00000506565.1 |
RPS6KA2 |
ribosomal protein S6 kinase, 90kDa, polypeptide 2 |
| chr2_-_207082748 | 0.53 |
ENST00000407325.2 ENST00000411719.1 |
GPR1 |
G protein-coupled receptor 1 |
| chr12_-_92539614 | 0.53 |
ENST00000256015.3 |
BTG1 |
B-cell translocation gene 1, anti-proliferative |
| chr6_-_24936170 | 0.53 |
ENST00000538035.1 |
FAM65B |
family with sequence similarity 65, member B |
| chr7_+_129932974 | 0.53 |
ENST00000445470.2 ENST00000222482.4 ENST00000492072.1 ENST00000473956.1 ENST00000493259.1 ENST00000486598.1 |
CPA4 |
carboxypeptidase A4 |
| chr1_+_201617264 | 0.53 |
ENST00000367296.4 |
NAV1 |
neuron navigator 1 |
| chr5_+_67588391 | 0.52 |
ENST00000523872.1 |
PIK3R1 |
phosphoinositide-3-kinase, regulatory subunit 1 (alpha) |
| chr12_+_75874580 | 0.52 |
ENST00000456650.3 |
GLIPR1 |
GLI pathogenesis-related 1 |
| chr2_-_85555385 | 0.52 |
ENST00000377386.3 |
TGOLN2 |
trans-golgi network protein 2 |
| chr17_-_15165854 | 0.51 |
ENST00000395936.1 ENST00000395938.2 |
PMP22 |
peripheral myelin protein 22 |
| chr17_-_8702667 | 0.49 |
ENST00000329805.4 |
MFSD6L |
major facilitator superfamily domain containing 6-like |
| chr8_-_93029520 | 0.49 |
ENST00000521553.1 |
RUNX1T1 |
runt-related transcription factor 1; translocated to, 1 (cyclin D-related) |
| chr14_-_90085458 | 0.49 |
ENST00000345097.4 ENST00000555855.1 ENST00000555353.1 |
FOXN3 |
forkhead box N3 |
| chr10_+_45495898 | 0.48 |
ENST00000298299.3 |
ZNF22 |
zinc finger protein 22 |
| chr5_-_180688105 | 0.48 |
ENST00000327767.4 |
TRIM52 |
tripartite motif containing 52 |
| chr3_-_49170405 | 0.48 |
ENST00000305544.4 ENST00000494831.1 |
LAMB2 |
laminin, beta 2 (laminin S) |
| chr19_-_9003586 | 0.47 |
ENST00000380951.5 |
MUC16 |
mucin 16, cell surface associated |
| chr19_+_41509851 | 0.47 |
ENST00000593831.1 ENST00000330446.5 |
CYP2B6 |
cytochrome P450, family 2, subfamily B, polypeptide 6 |
| chr8_-_27468945 | 0.47 |
ENST00000405140.3 |
CLU |
clusterin |
| chr3_-_178976996 | 0.46 |
ENST00000485523.1 |
KCNMB3 |
potassium large conductance calcium-activated channel, subfamily M beta member 3 |
| chr7_+_134430212 | 0.46 |
ENST00000436461.2 |
CALD1 |
caldesmon 1 |
| chr2_-_192711968 | 0.46 |
ENST00000304141.4 |
SDPR |
serum deprivation response |
| chr13_-_114843416 | 0.45 |
ENST00000389544.4 |
RASA3 |
RAS p21 protein activator 3 |
| chr12_+_60058458 | 0.45 |
ENST00000548610.1 |
SLC16A7 |
solute carrier family 16 (monocarboxylate transporter), member 7 |
| chr3_-_49170522 | 0.45 |
ENST00000418109.1 |
LAMB2 |
laminin, beta 2 (laminin S) |
| chr12_-_11002063 | 0.44 |
ENST00000544994.1 ENST00000228811.4 ENST00000540107.1 |
PRR4 |
proline rich 4 (lacrimal) |
| chr6_+_72922590 | 0.44 |
ENST00000523963.1 |
RIMS1 |
regulating synaptic membrane exocytosis 1 |
| chr7_+_134528635 | 0.44 |
ENST00000445569.2 |
CALD1 |
caldesmon 1 |
| chr12_-_124457257 | 0.44 |
ENST00000545891.1 |
CCDC92 |
coiled-coil domain containing 92 |
| chr3_-_48594248 | 0.43 |
ENST00000545984.1 ENST00000232375.3 ENST00000416568.1 ENST00000383734.2 ENST00000541519.1 ENST00000412035.1 |
PFKFB4 |
6-phosphofructo-2-kinase/fructose-2,6-biphosphatase 4 |
| chr5_-_88119580 | 0.43 |
ENST00000539796.1 |
MEF2C |
myocyte enhancer factor 2C |
| chr2_-_175711133 | 0.43 |
ENST00000409597.1 ENST00000413882.1 |
CHN1 |
chimerin 1 |
| chr2_+_210444142 | 0.43 |
ENST00000360351.4 ENST00000361559.4 |
MAP2 |
microtubule-associated protein 2 |
| chr11_+_117073850 | 0.42 |
ENST00000529622.1 |
TAGLN |
transgelin |
| chr22_+_21737663 | 0.42 |
ENST00000434111.1 |
RIMBP3B |
RIMS binding protein 3B |
| chr19_+_39786962 | 0.42 |
ENST00000333625.2 |
IFNL1 |
interferon, lambda 1 |
| chr3_+_148415571 | 0.42 |
ENST00000497524.1 ENST00000349243.3 ENST00000542281.1 ENST00000418473.2 ENST00000404754.2 |
AGTR1 |
angiotensin II receptor, type 1 |
| chr6_+_72922505 | 0.42 |
ENST00000401910.3 |
RIMS1 |
regulating synaptic membrane exocytosis 1 |
| chr1_-_84464780 | 0.42 |
ENST00000260505.8 |
TTLL7 |
tubulin tyrosine ligase-like family, member 7 |
| chr11_+_20044096 | 0.41 |
ENST00000533917.1 |
NAV2 |
neuron navigator 2 |
| chr17_+_4853442 | 0.41 |
ENST00000522301.1 |
ENO3 |
enolase 3 (beta, muscle) |
| chr20_-_39928705 | 0.41 |
ENST00000436099.2 ENST00000309060.3 ENST00000373261.1 ENST00000436440.2 ENST00000540170.1 ENST00000557816.1 ENST00000560361.1 |
ZHX3 |
zinc fingers and homeoboxes 3 |
| chr11_-_121986923 | 0.41 |
ENST00000560104.1 |
BLID |
BH3-like motif containing, cell death inducer |
| chr13_-_23949671 | 0.40 |
ENST00000402364.1 |
SACS |
spastic ataxia of Charlevoix-Saguenay (sacsin) |
| chr1_-_241799232 | 0.40 |
ENST00000366553.1 |
CHML |
choroideremia-like (Rab escort protein 2) |
| chr3_+_191046810 | 0.40 |
ENST00000392455.3 ENST00000392456.3 |
CCDC50 |
coiled-coil domain containing 50 |
| chr8_-_27468842 | 0.39 |
ENST00000523500.1 |
CLU |
clusterin |
| chr8_-_131399110 | 0.39 |
ENST00000521426.1 |
ASAP1 |
ArfGAP with SH3 domain, ankyrin repeat and PH domain 1 |
| chr15_-_63449663 | 0.39 |
ENST00000439025.1 |
RPS27L |
ribosomal protein S27-like |
| chr1_+_161136180 | 0.39 |
ENST00000352210.5 ENST00000367999.4 ENST00000544598.1 ENST00000535223.1 ENST00000432542.2 |
PPOX |
protoporphyrinogen oxidase |
| chr13_+_24144509 | 0.39 |
ENST00000248484.4 |
TNFRSF19 |
tumor necrosis factor receptor superfamily, member 19 |
| chr2_+_170683979 | 0.38 |
ENST00000418381.1 |
UBR3 |
ubiquitin protein ligase E3 component n-recognin 3 (putative) |
| chr7_-_8302207 | 0.37 |
ENST00000407906.1 |
ICA1 |
islet cell autoantigen 1, 69kDa |
| chr3_+_29322437 | 0.37 |
ENST00000434693.2 |
RBMS3 |
RNA binding motif, single stranded interacting protein 3 |
| chr11_-_8680383 | 0.37 |
ENST00000299550.6 |
TRIM66 |
tripartite motif containing 66 |
| chr9_-_21305312 | 0.37 |
ENST00000259555.4 |
IFNA5 |
interferon, alpha 5 |
| chr10_-_15413035 | 0.37 |
ENST00000378116.4 ENST00000455654.1 |
FAM171A1 |
family with sequence similarity 171, member A1 |
| chr2_-_169769787 | 0.37 |
ENST00000451987.1 |
SPC25 |
SPC25, NDC80 kinetochore complex component |
| chr20_-_3996036 | 0.36 |
ENST00000336095.6 |
RNF24 |
ring finger protein 24 |
| chr14_+_21156915 | 0.36 |
ENST00000397990.4 ENST00000555597.1 |
ANG RNASE4 |
angiogenin, ribonuclease, RNase A family, 5 ribonuclease, RNase A family, 4 |
| chr14_-_92198403 | 0.36 |
ENST00000553329.1 ENST00000256343.3 |
CATSPERB |
catsper channel auxiliary subunit beta |
| chr12_-_71533055 | 0.36 |
ENST00000552128.1 |
TSPAN8 |
tetraspanin 8 |
| chr3_-_197676740 | 0.36 |
ENST00000452735.1 ENST00000453254.1 ENST00000455191.1 |
IQCG |
IQ motif containing G |
| chr9_+_37667978 | 0.36 |
ENST00000539465.1 |
FRMPD1 |
FERM and PDZ domain containing 1 |
| chr2_+_201994042 | 0.36 |
ENST00000417748.1 |
CFLAR |
CASP8 and FADD-like apoptosis regulator |
| chr5_+_173316341 | 0.35 |
ENST00000520867.1 ENST00000334035.5 |
CPEB4 |
cytoplasmic polyadenylation element binding protein 4 |
| chr11_-_124670550 | 0.35 |
ENST00000239614.4 |
MSANTD2 |
Myb/SANT-like DNA-binding domain containing 2 |
| chr5_+_110559603 | 0.35 |
ENST00000512453.1 |
CAMK4 |
calcium/calmodulin-dependent protein kinase IV |
| chr11_-_82708519 | 0.35 |
ENST00000534301.1 |
RAB30 |
RAB30, member RAS oncogene family |
| chr19_-_55691377 | 0.35 |
ENST00000589172.1 |
SYT5 |
synaptotagmin V |
| chr3_-_66551397 | 0.35 |
ENST00000383703.3 |
LRIG1 |
leucine-rich repeats and immunoglobulin-like domains 1 |
| chr7_+_99717230 | 0.34 |
ENST00000262932.3 |
CNPY4 |
canopy FGF signaling regulator 4 |
| chr14_+_50999744 | 0.34 |
ENST00000441560.2 |
ATL1 |
atlastin GTPase 1 |
| chr12_+_52643077 | 0.34 |
ENST00000553310.2 ENST00000544024.1 |
KRT86 |
keratin 86 |
| chr1_-_79472365 | 0.34 |
ENST00000370742.3 |
ELTD1 |
EGF, latrophilin and seven transmembrane domain containing 1 |
| chr2_+_173940163 | 0.33 |
ENST00000539448.1 |
MLTK |
Mitogen-activated protein kinase kinase kinase MLT |
| chr9_+_2157655 | 0.33 |
ENST00000452193.1 |
SMARCA2 |
SWI/SNF related, matrix associated, actin dependent regulator of chromatin, subfamily a, member 2 |
| chr2_+_204192942 | 0.33 |
ENST00000295851.5 ENST00000261017.5 |
ABI2 |
abl-interactor 2 |
| chr2_+_62132800 | 0.33 |
ENST00000538736.1 |
COMMD1 |
copper metabolism (Murr1) domain containing 1 |
| chr6_-_41168920 | 0.33 |
ENST00000483722.1 |
TREML2 |
triggering receptor expressed on myeloid cells-like 2 |
| chr15_+_63481668 | 0.33 |
ENST00000321437.4 ENST00000559006.1 ENST00000448330.2 |
RAB8B |
RAB8B, member RAS oncogene family |
| chr6_-_154751629 | 0.33 |
ENST00000424998.1 |
CNKSR3 |
CNKSR family member 3 |
| chr6_+_30524663 | 0.32 |
ENST00000376560.3 |
PRR3 |
proline rich 3 |
| chrX_+_36065053 | 0.32 |
ENST00000313548.4 |
CHDC2 |
calponin homology domain containing 2 |
| chr12_+_66217911 | 0.32 |
ENST00000403681.2 |
HMGA2 |
high mobility group AT-hook 2 |
| chr5_-_159846399 | 0.32 |
ENST00000297151.4 |
SLU7 |
SLU7 splicing factor homolog (S. cerevisiae) |
| chr21_-_31869451 | 0.32 |
ENST00000334058.2 |
KRTAP19-4 |
keratin associated protein 19-4 |
| chr3_-_73673991 | 0.32 |
ENST00000308537.4 ENST00000263666.4 |
PDZRN3 |
PDZ domain containing ring finger 3 |
| chr15_-_95870310 | 0.32 |
ENST00000508732.2 |
CTD-2536I1.1 |
CTD-2536I1.1 |
| chr1_-_54405773 | 0.32 |
ENST00000371376.1 |
HSPB11 |
heat shock protein family B (small), member 11 |
| chr1_+_90098606 | 0.32 |
ENST00000370454.4 |
LRRC8C |
leucine rich repeat containing 8 family, member C |
| chr5_+_137774706 | 0.32 |
ENST00000378339.2 ENST00000254901.5 ENST00000506158.1 |
REEP2 |
receptor accessory protein 2 |
| chr14_+_88471468 | 0.31 |
ENST00000267549.3 |
GPR65 |
G protein-coupled receptor 65 |
| chr12_+_75874984 | 0.31 |
ENST00000550491.1 |
GLIPR1 |
GLI pathogenesis-related 1 |
| chr12_+_79439405 | 0.31 |
ENST00000552744.1 |
SYT1 |
synaptotagmin I |
| chr5_+_178986693 | 0.31 |
ENST00000437570.2 ENST00000393438.2 |
RUFY1 |
RUN and FYVE domain containing 1 |
| chr13_+_24144796 | 0.31 |
ENST00000403372.2 |
TNFRSF19 |
tumor necrosis factor receptor superfamily, member 19 |
| chr2_+_201997492 | 0.31 |
ENST00000494258.1 |
CFLAR |
CASP8 and FADD-like apoptosis regulator |
| chr14_-_61190754 | 0.31 |
ENST00000216513.4 |
SIX4 |
SIX homeobox 4 |
| chr12_+_71833550 | 0.31 |
ENST00000266674.5 |
LGR5 |
leucine-rich repeat containing G protein-coupled receptor 5 |
| chr6_+_72926145 | 0.31 |
ENST00000425662.2 ENST00000453976.2 |
RIMS1 |
regulating synaptic membrane exocytosis 1 |
| chr11_-_57283159 | 0.31 |
ENST00000533263.1 ENST00000278426.3 |
SLC43A1 |
solute carrier family 43 (amino acid system L transporter), member 1 |
| chr5_+_169780485 | 0.30 |
ENST00000377360.4 |
KCNIP1 |
Kv channel interacting protein 1 |
| chr20_-_39928756 | 0.30 |
ENST00000432768.2 |
ZHX3 |
zinc fingers and homeoboxes 3 |
| chr12_-_76817036 | 0.30 |
ENST00000546946.1 |
OSBPL8 |
oxysterol binding protein-like 8 |
| chr18_+_32455201 | 0.30 |
ENST00000590831.2 |
DTNA |
dystrobrevin, alpha |
| chr12_-_49582978 | 0.30 |
ENST00000301071.7 |
TUBA1A |
tubulin, alpha 1a |
| chrX_-_99665262 | 0.30 |
ENST00000373034.4 ENST00000255531.7 |
PCDH19 |
protocadherin 19 |
| chr2_+_170683942 | 0.30 |
ENST00000272793.5 |
UBR3 |
ubiquitin protein ligase E3 component n-recognin 3 (putative) |
| chr8_-_67525473 | 0.30 |
ENST00000522677.3 |
MYBL1 |
v-myb avian myeloblastosis viral oncogene homolog-like 1 |
| chr12_+_7023491 | 0.30 |
ENST00000541477.1 ENST00000229277.1 |
ENO2 |
enolase 2 (gamma, neuronal) |
| chr16_-_2260834 | 0.30 |
ENST00000562360.1 ENST00000566018.1 |
BRICD5 |
BRICHOS domain containing 5 |
| chr15_-_55700522 | 0.30 |
ENST00000564092.1 ENST00000310958.6 |
CCPG1 |
cell cycle progression 1 |
| chr12_-_10978957 | 0.29 |
ENST00000240619.2 |
TAS2R10 |
taste receptor, type 2, member 10 |
| chr17_-_39623681 | 0.29 |
ENST00000225899.3 |
KRT32 |
keratin 32 |
| chr10_-_90712520 | 0.29 |
ENST00000224784.6 |
ACTA2 |
actin, alpha 2, smooth muscle, aorta |
| chr1_+_178310581 | 0.29 |
ENST00000462775.1 |
RASAL2 |
RAS protein activator like 2 |
| chr3_-_128690173 | 0.29 |
ENST00000508239.1 |
RP11-723O4.6 |
Uncharacterized protein FLJ43738 |
| chr19_+_55795493 | 0.29 |
ENST00000309383.1 |
BRSK1 |
BR serine/threonine kinase 1 |
| chr11_+_124824000 | 0.29 |
ENST00000529051.1 ENST00000344762.5 |
CCDC15 |
coiled-coil domain containing 15 |
| chr7_+_73082152 | 0.29 |
ENST00000324941.4 ENST00000451519.1 |
VPS37D |
vacuolar protein sorting 37 homolog D (S. cerevisiae) |
| chr9_-_137809718 | 0.29 |
ENST00000371806.3 |
FCN1 |
ficolin (collagen/fibrinogen domain containing) 1 |
Gene Ontology Analysis
Gene overrepresentation in biological_process category:
| Log-likelihood per target | Total log-likelihood | Term | Description |
|---|---|---|---|
| 0.6 | 8.8 | GO:1900747 | negative regulation of vascular endothelial growth factor signaling pathway(GO:1900747) |
| 0.4 | 2.8 | GO:0036072 | intramembranous ossification(GO:0001957) direct ossification(GO:0036072) |
| 0.3 | 3.6 | GO:0034465 | response to carbon monoxide(GO:0034465) |
| 0.3 | 0.9 | GO:0046110 | xanthine metabolic process(GO:0046110) |
| 0.3 | 0.8 | GO:1903225 | negative regulation of endodermal cell differentiation(GO:1903225) |
| 0.3 | 2.4 | GO:0071798 | response to prostaglandin D(GO:0071798) cellular response to prostaglandin D stimulus(GO:0071799) |
| 0.2 | 0.7 | GO:0034059 | response to anoxia(GO:0034059) |
| 0.2 | 2.0 | GO:1903944 | regulation of hepatocyte apoptotic process(GO:1903943) negative regulation of hepatocyte apoptotic process(GO:1903944) |
| 0.2 | 0.6 | GO:0030327 | prenylated protein catabolic process(GO:0030327) |
| 0.2 | 0.8 | GO:0072137 | condensed mesenchymal cell proliferation(GO:0072137) |
| 0.2 | 1.2 | GO:0035407 | histone H3-T11 phosphorylation(GO:0035407) |
| 0.2 | 0.9 | GO:0072313 | metanephric glomerular epithelium development(GO:0072244) metanephric glomerular visceral epithelial cell differentiation(GO:0072248) metanephric glomerular visceral epithelial cell development(GO:0072249) metanephric glomerular epithelial cell differentiation(GO:0072312) metanephric glomerular epithelial cell development(GO:0072313) |
| 0.2 | 0.5 | GO:0098746 | fast, calcium ion-dependent exocytosis of neurotransmitter(GO:0098746) |
| 0.2 | 0.5 | GO:0006427 | histidyl-tRNA aminoacylation(GO:0006427) |
| 0.1 | 0.7 | GO:1903976 | negative regulation of glial cell migration(GO:1903976) |
| 0.1 | 0.9 | GO:0097498 | endothelial tube lumen extension(GO:0097498) |
| 0.1 | 0.9 | GO:0061517 | macrophage proliferation(GO:0061517) microglial cell proliferation(GO:0061518) regulation of neuronal signal transduction(GO:1902847) positive regulation of neurofibrillary tangle assembly(GO:1902998) |
| 0.1 | 0.6 | GO:0003185 | primary heart field specification(GO:0003138) sinoatrial valve development(GO:0003172) sinoatrial valve morphogenesis(GO:0003185) |
| 0.1 | 2.7 | GO:0048739 | cardiac muscle fiber development(GO:0048739) |
| 0.1 | 0.7 | GO:0071596 | ubiquitin-dependent protein catabolic process via the N-end rule pathway(GO:0071596) |
| 0.1 | 0.6 | GO:0046449 | creatinine metabolic process(GO:0046449) cellular response to UV-A(GO:0071492) |
| 0.1 | 0.6 | GO:0031103 | axon regeneration(GO:0031103) regulation of axon regeneration(GO:0048679) negative regulation of axon regeneration(GO:0048681) regulation of neuron projection regeneration(GO:0070570) negative regulation of neuron projection regeneration(GO:0070571) |
| 0.1 | 0.5 | GO:1904647 | response to rotenone(GO:1904647) |
| 0.1 | 0.3 | GO:1905244 | regulation of modification of synaptic structure(GO:1905244) |
| 0.1 | 0.4 | GO:0086097 | phospholipase C-activating angiotensin-activated signaling pathway(GO:0086097) |
| 0.1 | 0.3 | GO:0072095 | regulation of branch elongation involved in ureteric bud branching(GO:0072095) |
| 0.1 | 0.5 | GO:2001106 | regulation of Rho guanyl-nucleotide exchange factor activity(GO:2001106) |
| 0.1 | 0.6 | GO:0060686 | negative regulation of prostatic bud formation(GO:0060686) |
| 0.1 | 0.5 | GO:0050916 | sensory perception of sweet taste(GO:0050916) |
| 0.1 | 0.8 | GO:0090043 | regulation of tubulin deacetylation(GO:0090043) |
| 0.1 | 0.3 | GO:0002752 | cell surface pattern recognition receptor signaling pathway(GO:0002752) |
| 0.1 | 0.4 | GO:0018032 | protein amidation(GO:0018032) |
| 0.1 | 0.3 | GO:0046946 | hydroxylysine metabolic process(GO:0046946) hydroxylysine biosynthetic process(GO:0046947) |
| 0.1 | 0.5 | GO:2000683 | regulation of cellular response to X-ray(GO:2000683) |
| 0.1 | 0.3 | GO:0036058 | filtration diaphragm assembly(GO:0036058) slit diaphragm assembly(GO:0036060) |
| 0.1 | 0.2 | GO:0050720 | interleukin-1 beta biosynthetic process(GO:0050720) |
| 0.1 | 0.2 | GO:0006500 | N-terminal protein palmitoylation(GO:0006500) |
| 0.1 | 1.7 | GO:0070208 | protein heterotrimerization(GO:0070208) |
| 0.1 | 0.2 | GO:2001197 | regulation of basement membrane assembly involved in embryonic body morphogenesis(GO:1904259) positive regulation of basement membrane assembly involved in embryonic body morphogenesis(GO:1904261) basement membrane assembly involved in embryonic body morphogenesis(GO:2001197) |
| 0.1 | 0.1 | GO:0043396 | corticotropin-releasing hormone secretion(GO:0043396) regulation of corticotropin-releasing hormone secretion(GO:0043397) |
| 0.1 | 0.2 | GO:0038162 | erythropoietin-mediated signaling pathway(GO:0038162) |
| 0.1 | 0.3 | GO:0032474 | otolith morphogenesis(GO:0032474) |
| 0.1 | 0.3 | GO:0090034 | regulation of chaperone-mediated protein complex assembly(GO:0090034) positive regulation of chaperone-mediated protein complex assembly(GO:0090035) |
| 0.1 | 0.1 | GO:0006657 | CDP-choline pathway(GO:0006657) |
| 0.1 | 0.4 | GO:1903527 | positive regulation of membrane tubulation(GO:1903527) |
| 0.1 | 0.3 | GO:0034959 | substance P catabolic process(GO:0010814) calcitonin catabolic process(GO:0010816) endothelin maturation(GO:0034959) |
| 0.1 | 0.6 | GO:0001886 | endothelial cell morphogenesis(GO:0001886) |
| 0.1 | 0.5 | GO:0045669 | positive regulation of osteoblast differentiation(GO:0045669) |
| 0.1 | 1.1 | GO:0061162 | establishment of monopolar cell polarity(GO:0061162) establishment or maintenance of monopolar cell polarity(GO:0061339) |
| 0.1 | 0.6 | GO:0090292 | nuclear matrix anchoring at nuclear membrane(GO:0090292) |
| 0.1 | 0.6 | GO:0007221 | positive regulation of transcription of Notch receptor target(GO:0007221) |
| 0.1 | 0.4 | GO:0006651 | diacylglycerol biosynthetic process(GO:0006651) |
| 0.1 | 0.4 | GO:0007288 | sperm axoneme assembly(GO:0007288) |
| 0.1 | 0.3 | GO:0090131 | mesenchyme migration(GO:0090131) |
| 0.1 | 1.0 | GO:0005513 | detection of calcium ion(GO:0005513) |
| 0.1 | 0.5 | GO:0003025 | regulation of systemic arterial blood pressure by baroreceptor feedback(GO:0003025) |
| 0.1 | 0.2 | GO:1990502 | dense core granule maturation(GO:1990502) |
| 0.1 | 0.6 | GO:0015889 | cobalamin transport(GO:0015889) |
| 0.1 | 1.6 | GO:0051131 | chaperone-mediated protein complex assembly(GO:0051131) |
| 0.1 | 0.4 | GO:1901475 | pyruvate transport(GO:0006848) pyruvate transmembrane transport(GO:1901475) |
| 0.1 | 0.2 | GO:1900169 | regulation of glucocorticoid mediated signaling pathway(GO:1900169) |
| 0.1 | 0.2 | GO:0010982 | regulation of high-density lipoprotein particle clearance(GO:0010982) |
| 0.1 | 0.2 | GO:0070171 | negative regulation of tooth mineralization(GO:0070171) |
| 0.1 | 0.4 | GO:0032696 | negative regulation of interleukin-13 production(GO:0032696) |
| 0.1 | 0.4 | GO:0018344 | protein geranylgeranylation(GO:0018344) |
| 0.1 | 0.2 | GO:0003366 | cell-matrix adhesion involved in ameboidal cell migration(GO:0003366) |
| 0.1 | 0.2 | GO:0031587 | positive regulation of inositol 1,4,5-trisphosphate-sensitive calcium-release channel activity(GO:0031587) |
| 0.0 | 0.4 | GO:0097577 | intracellular sequestering of iron ion(GO:0006880) sequestering of iron ion(GO:0097577) |
| 0.0 | 0.1 | GO:1903367 | positive regulation of fear response(GO:1903367) positive regulation of behavioral fear response(GO:2000987) |
| 0.0 | 0.1 | GO:0052047 | interaction with other organism via secreted substance involved in symbiotic interaction(GO:0052047) |
| 0.0 | 0.5 | GO:0071313 | cellular response to caffeine(GO:0071313) |
| 0.0 | 0.3 | GO:0051461 | positive regulation of corticotropin secretion(GO:0051461) |
| 0.0 | 0.2 | GO:2001271 | negative regulation of cysteine-type endopeptidase activity involved in execution phase of apoptosis(GO:2001271) |
| 0.0 | 1.2 | GO:0006068 | ethanol catabolic process(GO:0006068) |
| 0.0 | 0.3 | GO:0000389 | mRNA 3'-splice site recognition(GO:0000389) |
| 0.0 | 1.8 | GO:0051482 | positive regulation of cytosolic calcium ion concentration involved in phospholipase C-activating G-protein coupled signaling pathway(GO:0051482) |
| 0.0 | 0.3 | GO:2001013 | epithelial cell proliferation involved in renal tubule morphogenesis(GO:2001013) |
| 0.0 | 0.0 | GO:0006532 | aspartate biosynthetic process(GO:0006532) |
| 0.0 | 0.3 | GO:0051012 | microtubule sliding(GO:0051012) |
| 0.0 | 0.3 | GO:0015911 | plasma membrane long-chain fatty acid transport(GO:0015911) |
| 0.0 | 0.7 | GO:0035970 | peptidyl-threonine dephosphorylation(GO:0035970) |
| 0.0 | 0.4 | GO:0018095 | protein polyglutamylation(GO:0018095) |
| 0.0 | 0.2 | GO:0070672 | response to interleukin-15(GO:0070672) |
| 0.0 | 2.1 | GO:0030866 | cortical actin cytoskeleton organization(GO:0030866) |
| 0.0 | 0.2 | GO:0072619 | interleukin-21 production(GO:0032625) interleukin-21 secretion(GO:0072619) |
| 0.0 | 0.4 | GO:0002371 | dendritic cell cytokine production(GO:0002371) |
| 0.0 | 0.3 | GO:2000035 | regulation of stem cell division(GO:2000035) |
| 0.0 | 0.1 | GO:1903031 | regulation of microtubule plus-end binding(GO:1903031) positive regulation of microtubule plus-end binding(GO:1903033) |
| 0.0 | 0.4 | GO:2000601 | positive regulation of Arp2/3 complex-mediated actin nucleation(GO:2000601) |
| 0.0 | 0.7 | GO:0007021 | tubulin complex assembly(GO:0007021) |
| 0.0 | 0.2 | GO:1990822 | L-cystine transport(GO:0015811) basic amino acid transmembrane transport(GO:1990822) |
| 0.0 | 0.2 | GO:0070141 | response to UV-A(GO:0070141) |
| 0.0 | 0.2 | GO:2000048 | negative regulation of cell-cell adhesion mediated by cadherin(GO:2000048) |
| 0.0 | 0.1 | GO:0060434 | bronchus morphogenesis(GO:0060434) |
| 0.0 | 0.3 | GO:0006013 | mannose metabolic process(GO:0006013) |
| 0.0 | 0.1 | GO:0003363 | lamellipodium assembly involved in ameboidal cell migration(GO:0003363) extension of a leading process involved in cell motility in cerebral cortex radial glia guided migration(GO:0021816) |
| 0.0 | 0.3 | GO:0006398 | mRNA 3'-end processing by stem-loop binding and cleavage(GO:0006398) |
| 0.0 | 0.1 | GO:0039019 | pronephric nephron development(GO:0039019) |
| 0.0 | 0.1 | GO:0014827 | intestine smooth muscle contraction(GO:0014827) |
| 0.0 | 0.1 | GO:1902766 | skeletal muscle satellite cell migration(GO:1902766) |
| 0.0 | 0.2 | GO:0070966 | nuclear-transcribed mRNA catabolic process, no-go decay(GO:0070966) |
| 0.0 | 0.7 | GO:0071447 | cellular response to hydroperoxide(GO:0071447) |
| 0.0 | 0.2 | GO:1904058 | positive regulation of sensory perception of pain(GO:1904058) |
| 0.0 | 0.2 | GO:0051289 | protein homotetramerization(GO:0051289) |
| 0.0 | 0.1 | GO:0061470 | T follicular helper cell differentiation(GO:0061470) |
| 0.0 | 0.1 | GO:0051562 | negative regulation of mitochondrial calcium ion concentration(GO:0051562) |
| 0.0 | 0.2 | GO:0055129 | L-proline biosynthetic process(GO:0055129) |
| 0.0 | 0.2 | GO:0070164 | negative regulation of adiponectin secretion(GO:0070164) |
| 0.0 | 0.2 | GO:0071896 | protein localization to adherens junction(GO:0071896) |
| 0.0 | 0.1 | GO:0050882 | voluntary musculoskeletal movement(GO:0050882) |
| 0.0 | 0.2 | GO:0045743 | positive regulation of fibroblast growth factor receptor signaling pathway(GO:0045743) |
| 0.0 | 0.1 | GO:0033615 | mitochondrial proton-transporting ATP synthase complex assembly(GO:0033615) |
| 0.0 | 0.1 | GO:0033128 | negative regulation of histone phosphorylation(GO:0033128) |
| 0.0 | 0.1 | GO:0043456 | regulation of pentose-phosphate shunt(GO:0043456) |
| 0.0 | 0.2 | GO:0048241 | epinephrine transport(GO:0048241) |
| 0.0 | 0.1 | GO:0033561 | regulation of water loss via skin(GO:0033561) establishment of skin barrier(GO:0061436) |
| 0.0 | 0.1 | GO:0045337 | geranyl diphosphate metabolic process(GO:0033383) geranyl diphosphate biosynthetic process(GO:0033384) farnesyl diphosphate biosynthetic process(GO:0045337) |
| 0.0 | 0.5 | GO:0051531 | NFAT protein import into nucleus(GO:0051531) |
| 0.0 | 0.4 | GO:0046520 | sphingoid biosynthetic process(GO:0046520) |
| 0.0 | 1.0 | GO:0016486 | peptide hormone processing(GO:0016486) |
| 0.0 | 0.5 | GO:0032060 | bleb assembly(GO:0032060) |
| 0.0 | 0.1 | GO:2000502 | negative regulation of natural killer cell chemotaxis(GO:2000502) |
| 0.0 | 0.4 | GO:2000766 | negative regulation of cytoplasmic translation(GO:2000766) |
| 0.0 | 0.3 | GO:0090204 | protein localization to nuclear pore(GO:0090204) |
| 0.0 | 0.1 | GO:0002322 | B cell proliferation involved in immune response(GO:0002322) |
| 0.0 | 0.1 | GO:0046121 | deoxyribonucleoside catabolic process(GO:0046121) |
| 0.0 | 0.1 | GO:0061734 | parkin-mediated mitophagy in response to mitochondrial depolarization(GO:0061734) |
| 0.0 | 0.1 | GO:2000870 | regulation of progesterone secretion(GO:2000870) |
| 0.0 | 0.1 | GO:0019276 | UDP-N-acetylgalactosamine metabolic process(GO:0019276) |
| 0.0 | 0.1 | GO:0046462 | monoacylglycerol metabolic process(GO:0046462) monoacylglycerol catabolic process(GO:0052651) |
| 0.0 | 0.2 | GO:2000389 | regulation of neutrophil extravasation(GO:2000389) |
| 0.0 | 0.2 | GO:0042373 | vitamin K metabolic process(GO:0042373) |
| 0.0 | 0.1 | GO:0090116 | C-5 methylation of cytosine(GO:0090116) |
| 0.0 | 0.5 | GO:0045663 | positive regulation of myoblast differentiation(GO:0045663) |
| 0.0 | 0.2 | GO:0000395 | mRNA 5'-splice site recognition(GO:0000395) |
| 0.0 | 0.1 | GO:0061143 | alveolar primary septum development(GO:0061143) |
| 0.0 | 0.3 | GO:0048227 | plasma membrane to endosome transport(GO:0048227) |
| 0.0 | 0.1 | GO:0018343 | protein farnesylation(GO:0018343) |
| 0.0 | 0.1 | GO:0006049 | UDP-N-acetylglucosamine catabolic process(GO:0006049) |
| 0.0 | 0.5 | GO:0097094 | craniofacial suture morphogenesis(GO:0097094) |
| 0.0 | 0.3 | GO:0051256 | mitotic spindle midzone assembly(GO:0051256) |
| 0.0 | 0.1 | GO:0086053 | AV node cell to bundle of His cell communication by electrical coupling(GO:0086053) |
| 0.0 | 0.1 | GO:1902534 | single-organism membrane invagination(GO:1902534) |
| 0.0 | 0.1 | GO:0015808 | L-alanine transport(GO:0015808) |
| 0.0 | 0.6 | GO:1902166 | negative regulation of intrinsic apoptotic signaling pathway in response to DNA damage by p53 class mediator(GO:1902166) |
| 0.0 | 0.1 | GO:0036388 | pre-replicative complex assembly involved in nuclear cell cycle DNA replication(GO:0006267) pre-replicative complex assembly(GO:0036388) pre-replicative complex assembly involved in cell cycle DNA replication(GO:1902299) |
| 0.0 | 0.1 | GO:0051013 | microtubule severing(GO:0051013) |
| 0.0 | 0.2 | GO:0055091 | phospholipid homeostasis(GO:0055091) |
| 0.0 | 0.4 | GO:0090084 | negative regulation of inclusion body assembly(GO:0090084) |
| 0.0 | 0.1 | GO:0035865 | cellular response to potassium ion(GO:0035865) |
| 0.0 | 0.1 | GO:0051138 | positive regulation of NK T cell differentiation(GO:0051138) |
| 0.0 | 0.1 | GO:0046452 | dihydrofolate metabolic process(GO:0046452) |
| 0.0 | 0.1 | GO:0019918 | peptidyl-arginine methylation, to symmetrical-dimethyl arginine(GO:0019918) |
| 0.0 | 0.5 | GO:0006895 | Golgi to endosome transport(GO:0006895) |
| 0.0 | 0.2 | GO:0006930 | substrate-dependent cell migration, cell extension(GO:0006930) |
| 0.0 | 0.1 | GO:0000066 | mitochondrial ornithine transport(GO:0000066) |
| 0.0 | 0.1 | GO:0048549 | positive regulation of pinocytosis(GO:0048549) |
| 0.0 | 0.1 | GO:0097460 | ferrous iron import into cell(GO:0097460) ferrous iron import across plasma membrane(GO:0098707) |
| 0.0 | 0.2 | GO:0042182 | ketone catabolic process(GO:0042182) |
| 0.0 | 0.6 | GO:0048240 | sperm capacitation(GO:0048240) |
| 0.0 | 0.0 | GO:0006109 | regulation of carbohydrate metabolic process(GO:0006109) |
| 0.0 | 0.1 | GO:0006420 | arginyl-tRNA aminoacylation(GO:0006420) |
| 0.0 | 0.0 | GO:0090317 | negative regulation of intracellular protein transport(GO:0090317) |
| 0.0 | 0.1 | GO:1900121 | negative regulation of receptor binding(GO:1900121) |
| 0.0 | 0.1 | GO:0021796 | cerebral cortex regionalization(GO:0021796) |
| 0.0 | 0.6 | GO:0016339 | calcium-dependent cell-cell adhesion via plasma membrane cell adhesion molecules(GO:0016339) |
| 0.0 | 0.0 | GO:1902938 | regulation of intracellular calcium activated chloride channel activity(GO:1902938) |
| 0.0 | 0.2 | GO:0006552 | leucine catabolic process(GO:0006552) |
| 0.0 | 0.2 | GO:1902969 | mitotic DNA replication(GO:1902969) |
| 0.0 | 0.1 | GO:0002836 | positive regulation of response to tumor cell(GO:0002836) positive regulation of immune response to tumor cell(GO:0002839) positive regulation of natural killer cell mediated immune response to tumor cell(GO:0002857) positive regulation of natural killer cell mediated cytotoxicity directed against tumor cell target(GO:0002860) |
| 0.0 | 0.2 | GO:0031119 | tRNA pseudouridine synthesis(GO:0031119) |
| 0.0 | 0.7 | GO:2000144 | positive regulation of DNA-templated transcription, initiation(GO:2000144) |
| 0.0 | 0.2 | GO:0060155 | platelet dense granule organization(GO:0060155) |
| 0.0 | 0.0 | GO:0051066 | dihydrobiopterin metabolic process(GO:0051066) |
| 0.0 | 0.0 | GO:2000824 | negative regulation of androgen receptor activity(GO:2000824) |
| 0.0 | 0.5 | GO:1900273 | positive regulation of long-term synaptic potentiation(GO:1900273) |
| 0.0 | 0.1 | GO:0006003 | fructose 2,6-bisphosphate metabolic process(GO:0006003) |
| 0.0 | 0.0 | GO:2000439 | monocyte extravasation(GO:0035696) regulation of eosinophil degranulation(GO:0043309) negative regulation of eosinophil activation(GO:1902567) regulation of monocyte extravasation(GO:2000437) positive regulation of monocyte extravasation(GO:2000439) |
| 0.0 | 0.2 | GO:0045747 | positive regulation of Notch signaling pathway(GO:0045747) |
| 0.0 | 0.2 | GO:0090286 | cytoskeletal anchoring at nuclear membrane(GO:0090286) |
| 0.0 | 0.0 | GO:0007343 | egg activation(GO:0007343) |
| 0.0 | 0.2 | GO:0032793 | positive regulation of CREB transcription factor activity(GO:0032793) |
| 0.0 | 0.4 | GO:0000028 | ribosomal small subunit assembly(GO:0000028) |
| 0.0 | 0.1 | GO:0061743 | motor learning(GO:0061743) |
| 0.0 | 0.2 | GO:0042904 | 9-cis-retinoic acid biosynthetic process(GO:0042904) 9-cis-retinoic acid metabolic process(GO:0042905) |
| 0.0 | 0.1 | GO:0034227 | tRNA thio-modification(GO:0034227) |
| 0.0 | 0.0 | GO:0016340 | calcium-dependent cell-matrix adhesion(GO:0016340) |
| 0.0 | 0.2 | GO:0033227 | dsRNA transport(GO:0033227) |
| 0.0 | 0.3 | GO:0042476 | odontogenesis(GO:0042476) |
| 0.0 | 0.2 | GO:0031584 | activation of phospholipase D activity(GO:0031584) |
| 0.0 | 0.1 | GO:0034141 | positive regulation of toll-like receptor 3 signaling pathway(GO:0034141) |
| 0.0 | 0.0 | GO:0010897 | negative regulation of triglyceride catabolic process(GO:0010897) |
| 0.0 | 0.2 | GO:0006107 | oxaloacetate metabolic process(GO:0006107) |
| 0.0 | 0.0 | GO:0014005 | microglia differentiation(GO:0014004) microglia development(GO:0014005) |
| 0.0 | 0.2 | GO:0042737 | drug catabolic process(GO:0042737) |
| 0.0 | 0.7 | GO:0006735 | NADH regeneration(GO:0006735) canonical glycolysis(GO:0061621) glucose catabolic process to pyruvate(GO:0061718) |
| 0.0 | 0.8 | GO:0000413 | protein peptidyl-prolyl isomerization(GO:0000413) |
| 0.0 | 0.1 | GO:2001135 | regulation of endocytic recycling(GO:2001135) |
| 0.0 | 0.0 | GO:0032899 | neurotrophin production(GO:0032898) regulation of neurotrophin production(GO:0032899) negative regulation of neurotrophin production(GO:0032900) negative regulation of circadian sleep/wake cycle, sleep(GO:0042321) negative regulation of circadian sleep/wake cycle, non-REM sleep(GO:0042323) negative regulation of mucus secretion(GO:0070256) |
| 0.0 | 0.1 | GO:2001252 | positive regulation of chromosome organization(GO:2001252) |
| 0.0 | 0.3 | GO:2000404 | regulation of T cell migration(GO:2000404) |
| 0.0 | 0.5 | GO:0001580 | detection of chemical stimulus involved in sensory perception of bitter taste(GO:0001580) |
| 0.0 | 0.1 | GO:0002725 | negative regulation of T cell cytokine production(GO:0002725) |
| 0.0 | 0.0 | GO:0031666 | positive regulation of lipopolysaccharide-mediated signaling pathway(GO:0031666) |
| 0.0 | 0.1 | GO:0098870 | neuronal action potential propagation(GO:0019227) action potential propagation(GO:0098870) |
| 0.0 | 0.2 | GO:1903204 | negative regulation of oxidative stress-induced neuron death(GO:1903204) |
| 0.0 | 0.6 | GO:0070884 | regulation of calcineurin-NFAT signaling cascade(GO:0070884) |
| 0.0 | 2.6 | GO:0034332 | adherens junction organization(GO:0034332) |
| 0.0 | 0.1 | GO:1902715 | positive regulation of interferon-gamma secretion(GO:1902715) |
| 0.0 | 0.3 | GO:0032012 | regulation of ARF protein signal transduction(GO:0032012) |
| 0.0 | 0.5 | GO:0036258 | multivesicular body assembly(GO:0036258) |
| 0.0 | 0.3 | GO:0007605 | sensory perception of sound(GO:0007605) sensory perception of mechanical stimulus(GO:0050954) |
| 0.0 | 0.1 | GO:0090119 | vesicle-mediated cholesterol transport(GO:0090119) |
| 0.0 | 0.6 | GO:0007274 | neuromuscular synaptic transmission(GO:0007274) |
| 0.0 | 0.4 | GO:0007158 | neuron cell-cell adhesion(GO:0007158) |
| 0.0 | 0.2 | GO:0045721 | negative regulation of gluconeogenesis(GO:0045721) |
| 0.0 | 0.1 | GO:0099590 | neurotransmitter receptor internalization(GO:0099590) |
| 0.0 | 0.1 | GO:0034116 | positive regulation of heterotypic cell-cell adhesion(GO:0034116) |
| 0.0 | 0.1 | GO:0019470 | 4-hydroxyproline catabolic process(GO:0019470) |
| 0.0 | 0.0 | GO:0033601 | positive regulation of mammary gland epithelial cell proliferation(GO:0033601) |
| 0.0 | 0.2 | GO:0070986 | left/right axis specification(GO:0070986) |
| 0.0 | 1.3 | GO:0045454 | cell redox homeostasis(GO:0045454) |
| 0.0 | 0.2 | GO:0006782 | protoporphyrinogen IX biosynthetic process(GO:0006782) |
| 0.0 | 0.0 | GO:1900226 | negative regulation of NLRP3 inflammasome complex assembly(GO:1900226) |
| 0.0 | 0.5 | GO:0045599 | negative regulation of fat cell differentiation(GO:0045599) |
| 0.0 | 0.0 | GO:0001555 | oocyte growth(GO:0001555) |
| 0.0 | 0.2 | GO:0007220 | Notch receptor processing(GO:0007220) |
| 0.0 | 0.1 | GO:0090050 | positive regulation of cell migration involved in sprouting angiogenesis(GO:0090050) |
| 0.0 | 0.2 | GO:0044241 | lipid digestion(GO:0044241) |
| 0.0 | 0.1 | GO:0006627 | protein processing involved in protein targeting to mitochondrion(GO:0006627) |
| 0.0 | 0.1 | GO:0030309 | poly-N-acetyllactosamine metabolic process(GO:0030309) |
| 0.0 | 0.1 | GO:0048859 | formation of anatomical boundary(GO:0048859) |
| 0.0 | 0.4 | GO:0043968 | histone H2A acetylation(GO:0043968) |
| 0.0 | 0.4 | GO:0030488 | tRNA methylation(GO:0030488) |
| 0.0 | 0.2 | GO:0006995 | cellular response to nitrogen starvation(GO:0006995) cellular response to nitrogen levels(GO:0043562) |
| 0.0 | 0.1 | GO:0031547 | brain-derived neurotrophic factor receptor signaling pathway(GO:0031547) |
| 0.0 | 0.1 | GO:0070935 | 3'-UTR-mediated mRNA stabilization(GO:0070935) |
| 0.0 | 0.4 | GO:1901661 | quinone metabolic process(GO:1901661) |
| 0.0 | 0.2 | GO:0021670 | lateral ventricle development(GO:0021670) |
| 0.0 | 0.1 | GO:0034128 | negative regulation of MyD88-independent toll-like receptor signaling pathway(GO:0034128) |
| 0.0 | 0.1 | GO:0034214 | protein hexamerization(GO:0034214) |
| 0.0 | 0.4 | GO:0007528 | neuromuscular junction development(GO:0007528) |
| 0.0 | 0.1 | GO:0032049 | cardiolipin biosynthetic process(GO:0032049) |
| 0.0 | 0.0 | GO:0072102 | glomerulus morphogenesis(GO:0072102) |
| 0.0 | 0.2 | GO:0010529 | regulation of transposition(GO:0010528) negative regulation of transposition(GO:0010529) |
| 0.0 | 0.2 | GO:1903817 | negative regulation of delayed rectifier potassium channel activity(GO:1902260) negative regulation of voltage-gated potassium channel activity(GO:1903817) |
| 0.0 | 0.7 | GO:0046580 | negative regulation of Ras protein signal transduction(GO:0046580) |
| 0.0 | 0.1 | GO:0017062 | respiratory chain complex III assembly(GO:0017062) mitochondrial respiratory chain complex III assembly(GO:0034551) mitochondrial respiratory chain complex III biogenesis(GO:0097033) |
Gene overrepresentation in cellular_component category:
| Log-likelihood per target | Total log-likelihood | Term | Description |
|---|---|---|---|
| 0.6 | 9.0 | GO:0005589 | collagen type VI trimer(GO:0005589) collagen beaded filament(GO:0098647) |
| 0.3 | 0.9 | GO:0005608 | laminin-3 complex(GO:0005608) |
| 0.3 | 0.8 | GO:0005588 | collagen type V trimer(GO:0005588) |
| 0.2 | 2.2 | GO:0005583 | fibrillar collagen trimer(GO:0005583) banded collagen fibril(GO:0098643) |
| 0.1 | 0.4 | GO:0032002 | interleukin-28 receptor complex(GO:0032002) |
| 0.1 | 0.5 | GO:1990578 | perinuclear endoplasmic reticulum membrane(GO:1990578) |
| 0.1 | 0.4 | GO:0097442 | CA3 pyramidal cell dendrite(GO:0097442) |
| 0.1 | 0.5 | GO:0060200 | clathrin-sculpted acetylcholine transport vesicle(GO:0060200) clathrin-sculpted acetylcholine transport vesicle membrane(GO:0060201) |
| 0.1 | 0.7 | GO:0000015 | phosphopyruvate hydratase complex(GO:0000015) |
| 0.1 | 0.4 | GO:0005968 | Rab-protein geranylgeranyltransferase complex(GO:0005968) |
| 0.1 | 2.0 | GO:0031265 | CD95 death-inducing signaling complex(GO:0031265) ripoptosome(GO:0097342) |
| 0.1 | 0.6 | GO:0036128 | CatSper complex(GO:0036128) |
| 0.1 | 0.6 | GO:0036021 | endolysosome lumen(GO:0036021) |
| 0.1 | 0.5 | GO:0031262 | Ndc80 complex(GO:0031262) |
| 0.1 | 0.4 | GO:0031515 | tRNA (m1A) methyltransferase complex(GO:0031515) |
| 0.1 | 0.5 | GO:1990769 | proximal neuron projection(GO:1990769) |
| 0.1 | 0.6 | GO:0017059 | serine C-palmitoyltransferase complex(GO:0017059) endoplasmic reticulum palmitoyltransferase complex(GO:0031211) |
| 0.1 | 0.5 | GO:0032777 | Piccolo NuA4 histone acetyltransferase complex(GO:0032777) |
| 0.1 | 0.3 | GO:0031302 | intrinsic component of endosome membrane(GO:0031302) |
| 0.1 | 0.2 | GO:0034665 | integrin alpha1-beta1 complex(GO:0034665) |
| 0.1 | 0.9 | GO:0042583 | chromaffin granule(GO:0042583) |
| 0.1 | 0.4 | GO:0032311 | angiogenin-PRI complex(GO:0032311) |
| 0.1 | 0.2 | GO:0005606 | laminin-1 complex(GO:0005606) laminin-2 complex(GO:0005607) |
| 0.1 | 0.9 | GO:0030478 | actin cap(GO:0030478) |
| 0.1 | 0.2 | GO:0033565 | ESCRT-0 complex(GO:0033565) |
| 0.1 | 0.2 | GO:0030934 | anchoring collagen complex(GO:0030934) |
| 0.1 | 1.5 | GO:0071565 | nBAF complex(GO:0071565) |
| 0.1 | 0.3 | GO:0098837 | postsynaptic recycling endosome(GO:0098837) |
| 0.1 | 0.5 | GO:0070852 | cell body fiber(GO:0070852) |
| 0.1 | 0.2 | GO:0034669 | integrin alpha4-beta7 complex(GO:0034669) |
| 0.1 | 0.4 | GO:0002177 | manchette(GO:0002177) |
| 0.0 | 0.8 | GO:0000124 | SAGA complex(GO:0000124) |
| 0.0 | 0.3 | GO:0030485 | smooth muscle contractile fiber(GO:0030485) |
| 0.0 | 0.6 | GO:0031462 | Cul2-RING ubiquitin ligase complex(GO:0031462) |
| 0.0 | 0.2 | GO:0035370 | UBC13-UEV1A complex(GO:0035370) |
| 0.0 | 0.3 | GO:0031232 | extrinsic component of external side of plasma membrane(GO:0031232) |
| 0.0 | 0.1 | GO:0038038 | G-protein coupled receptor homodimeric complex(GO:0038038) |
| 0.0 | 0.6 | GO:0034992 | microtubule organizing center attachment site(GO:0034992) LINC complex(GO:0034993) |
| 0.0 | 0.1 | GO:0008043 | intracellular ferritin complex(GO:0008043) ferritin complex(GO:0070288) |
| 0.0 | 0.6 | GO:0097512 | cardiac myofibril(GO:0097512) |
| 0.0 | 0.2 | GO:0089701 | U2AF(GO:0089701) |
| 0.0 | 0.5 | GO:0012510 | trans-Golgi network transport vesicle membrane(GO:0012510) |
| 0.0 | 0.2 | GO:1905202 | 3-methylcrotonyl-CoA carboxylase complex, mitochondrial(GO:0002169) methylcrotonoyl-CoA carboxylase complex(GO:1905202) |
| 0.0 | 0.2 | GO:0071458 | integral component of cytoplasmic side of endoplasmic reticulum membrane(GO:0071458) |
| 0.0 | 0.2 | GO:0016035 | zeta DNA polymerase complex(GO:0016035) |
| 0.0 | 0.3 | GO:0071204 | histone pre-mRNA 3'end processing complex(GO:0071204) |
| 0.0 | 1.0 | GO:0043218 | compact myelin(GO:0043218) |
| 0.0 | 0.3 | GO:1990111 | spermatoproteasome complex(GO:1990111) |
| 0.0 | 0.2 | GO:0071547 | piP-body(GO:0071547) |
| 0.0 | 0.3 | GO:0051286 | cell tip(GO:0051286) |
| 0.0 | 3.4 | GO:0005901 | caveola(GO:0005901) |
| 0.0 | 0.4 | GO:0031209 | SCAR complex(GO:0031209) |
| 0.0 | 0.1 | GO:0044354 | pinosome(GO:0044352) macropinosome(GO:0044354) |
| 0.0 | 0.3 | GO:0035985 | senescence-associated heterochromatin focus(GO:0035985) |
| 0.0 | 0.1 | GO:0042720 | mitochondrial inner membrane peptidase complex(GO:0042720) |
| 0.0 | 0.3 | GO:0000137 | Golgi cis cisterna(GO:0000137) |
| 0.0 | 0.6 | GO:0005614 | interstitial matrix(GO:0005614) |
| 0.0 | 2.2 | GO:1904724 | tertiary granule lumen(GO:1904724) |
| 0.0 | 0.5 | GO:0043194 | axon initial segment(GO:0043194) |
| 0.0 | 0.1 | GO:0001534 | radial spoke(GO:0001534) |
| 0.0 | 0.1 | GO:0032798 | Swi5-Sfr1 complex(GO:0032798) |
| 0.0 | 0.3 | GO:0044233 | ER-mitochondrion membrane contact site(GO:0044233) |
| 0.0 | 0.5 | GO:0005832 | chaperonin-containing T-complex(GO:0005832) |
| 0.0 | 0.4 | GO:0031526 | brush border membrane(GO:0031526) |
| 0.0 | 0.2 | GO:0070765 | gamma-secretase complex(GO:0070765) |
| 0.0 | 0.1 | GO:0044308 | axonal spine(GO:0044308) |
| 0.0 | 0.5 | GO:0030140 | trans-Golgi network transport vesicle(GO:0030140) |
| 0.0 | 0.1 | GO:0005656 | nuclear pre-replicative complex(GO:0005656) pre-replicative complex(GO:0036387) |
| 0.0 | 0.0 | GO:0098592 | cytoplasmic side of apical plasma membrane(GO:0098592) |
| 0.0 | 0.1 | GO:0030061 | mitochondrial crista(GO:0030061) |
| 0.0 | 0.3 | GO:0000813 | ESCRT I complex(GO:0000813) |
| 0.0 | 0.2 | GO:0033270 | paranode region of axon(GO:0033270) |
| 0.0 | 0.3 | GO:0005577 | fibrinogen complex(GO:0005577) |
| 0.0 | 0.2 | GO:0008091 | spectrin(GO:0008091) |
| 0.0 | 0.1 | GO:0030981 | cortical microtubule cytoskeleton(GO:0030981) |
| 0.0 | 0.2 | GO:0036157 | outer dynein arm(GO:0036157) |
| 0.0 | 0.1 | GO:0071012 | catalytic step 1 spliceosome(GO:0071012) |
| 0.0 | 0.3 | GO:0008385 | IkappaB kinase complex(GO:0008385) |
| 0.0 | 1.7 | GO:0097610 | cleavage furrow(GO:0032154) cell surface furrow(GO:0097610) |
| 0.0 | 0.6 | GO:0005903 | brush border(GO:0005903) |
| 0.0 | 0.1 | GO:0005947 | mitochondrial alpha-ketoglutarate dehydrogenase complex(GO:0005947) |
| 0.0 | 0.5 | GO:0031235 | intrinsic component of the cytoplasmic side of the plasma membrane(GO:0031235) |
| 0.0 | 0.1 | GO:0031314 | extrinsic component of mitochondrial inner membrane(GO:0031314) |
| 0.0 | 1.5 | GO:0035577 | azurophil granule membrane(GO:0035577) |
| 0.0 | 0.1 | GO:0045180 | basal cortex(GO:0045180) |
| 0.0 | 0.1 | GO:0097228 | sperm principal piece(GO:0097228) |
| 0.0 | 0.2 | GO:1990023 | mitotic spindle midzone(GO:1990023) |
| 0.0 | 0.4 | GO:0030992 | intraciliary transport particle B(GO:0030992) |
| 0.0 | 0.2 | GO:0033018 | sarcoplasmic reticulum lumen(GO:0033018) |
| 0.0 | 0.4 | GO:1990124 | messenger ribonucleoprotein complex(GO:1990124) |
| 0.0 | 0.1 | GO:0071986 | Ragulator complex(GO:0071986) |
| 0.0 | 0.1 | GO:0030991 | intraciliary transport particle A(GO:0030991) |
| 0.0 | 0.1 | GO:0033011 | perinuclear theca(GO:0033011) |
| 0.0 | 0.1 | GO:0042587 | glycogen granule(GO:0042587) |
| 0.0 | 0.8 | GO:1904115 | axon cytoplasm(GO:1904115) |
| 0.0 | 0.1 | GO:0046696 | lipopolysaccharide receptor complex(GO:0046696) |
| 0.0 | 0.1 | GO:0042105 | alpha-beta T cell receptor complex(GO:0042105) |
| 0.0 | 0.1 | GO:0072687 | meiotic spindle(GO:0072687) |
| 0.0 | 0.2 | GO:0097025 | MPP7-DLG1-LIN7 complex(GO:0097025) |
| 0.0 | 0.3 | GO:0005892 | acetylcholine-gated channel complex(GO:0005892) |
| 0.0 | 0.2 | GO:0097225 | sperm midpiece(GO:0097225) |
| 0.0 | 0.1 | GO:0030905 | retromer, tubulation complex(GO:0030905) |
| 0.0 | 2.2 | GO:0044309 | neuron spine(GO:0044309) |
| 0.0 | 0.1 | GO:0001739 | sex chromatin(GO:0001739) |
| 0.0 | 0.0 | GO:0005944 | phosphatidylinositol 3-kinase complex, class IB(GO:0005944) |
| 0.0 | 0.0 | GO:1990423 | RZZ complex(GO:1990423) |
| 0.0 | 0.1 | GO:1990316 | ATG1/ULK1 kinase complex(GO:1990316) |
| 0.0 | 0.2 | GO:0005833 | hemoglobin complex(GO:0005833) |
| 0.0 | 0.5 | GO:0042571 | immunoglobulin complex, circulating(GO:0042571) |
Gene overrepresentation in molecular_function category:
| Log-likelihood per target | Total log-likelihood | Term | Description |
|---|---|---|---|
| 0.8 | 2.4 | GO:0004958 | prostaglandin F receptor activity(GO:0004958) |
| 0.5 | 3.6 | GO:0060072 | large conductance calcium-activated potassium channel activity(GO:0060072) |
| 0.3 | 2.1 | GO:0015057 | thrombin receptor activity(GO:0015057) |
| 0.3 | 1.3 | GO:0016971 | flavin-linked sulfhydryl oxidase activity(GO:0016971) |
| 0.3 | 1.6 | GO:0008321 | Ral guanyl-nucleotide exchange factor activity(GO:0008321) |
| 0.2 | 0.7 | GO:0008330 | protein tyrosine/threonine phosphatase activity(GO:0008330) |
| 0.2 | 0.8 | GO:0004031 | aldehyde oxidase activity(GO:0004031) |
| 0.2 | 1.2 | GO:0035402 | histone kinase activity (H3-T11 specific)(GO:0035402) |
| 0.2 | 0.5 | GO:0004821 | histidine-tRNA ligase activity(GO:0004821) |
| 0.2 | 0.6 | GO:0016670 | oxidoreductase activity, acting on a sulfur group of donors, oxygen as acceptor(GO:0016670) |
| 0.1 | 2.2 | GO:0048407 | platelet-derived growth factor binding(GO:0048407) |
| 0.1 | 0.4 | GO:0001596 | angiotensin type I receptor activity(GO:0001596) |
| 0.1 | 0.6 | GO:0004758 | serine C-palmitoyltransferase activity(GO:0004758) C-palmitoyltransferase activity(GO:0016454) |
| 0.1 | 0.4 | GO:0005477 | pyruvate secondary active transmembrane transporter activity(GO:0005477) |
| 0.1 | 9.2 | GO:0050840 | extracellular matrix binding(GO:0050840) |
| 0.1 | 0.7 | GO:0004634 | phosphopyruvate hydratase activity(GO:0004634) |
| 0.1 | 0.4 | GO:0004504 | peptidylglycine monooxygenase activity(GO:0004504) peptidylamidoglycolate lyase activity(GO:0004598) |
| 0.1 | 0.6 | GO:0008597 | calcium-dependent protein serine/threonine phosphatase regulator activity(GO:0008597) |
| 0.1 | 0.3 | GO:0008475 | procollagen-lysine 5-dioxygenase activity(GO:0008475) procollagen glucosyltransferase activity(GO:0033823) |
| 0.1 | 0.5 | GO:0030348 | syntaxin-3 binding(GO:0030348) |
| 0.1 | 0.7 | GO:0005000 | vasopressin receptor activity(GO:0005000) |
| 0.1 | 0.3 | GO:0035501 | MH1 domain binding(GO:0035501) |
| 0.1 | 0.3 | GO:0000386 | second spliceosomal transesterification activity(GO:0000386) |
| 0.1 | 0.2 | GO:0017129 | triglyceride binding(GO:0017129) |
| 0.1 | 0.5 | GO:0099580 | ion antiporter activity involved in regulation of postsynaptic membrane potential(GO:0099580) |
| 0.1 | 0.3 | GO:0042903 | tubulin deacetylase activity(GO:0042903) |
| 0.1 | 0.3 | GO:0071209 | U7 snRNA binding(GO:0071209) |
| 0.1 | 0.2 | GO:0008798 | beta-aspartyl-peptidase activity(GO:0008798) |
| 0.1 | 0.5 | GO:0043559 | insulin binding(GO:0043559) |
| 0.1 | 0.2 | GO:0098639 | collagen binding involved in cell-matrix adhesion(GO:0098639) |
| 0.1 | 2.0 | GO:0097200 | cysteine-type endopeptidase activity involved in execution phase of apoptosis(GO:0097200) |
| 0.1 | 1.8 | GO:0051371 | muscle alpha-actinin binding(GO:0051371) |
| 0.1 | 0.5 | GO:0003960 | NADPH:quinone reductase activity(GO:0003960) |
| 0.1 | 0.2 | GO:0052836 | inositol 5-diphosphate pentakisphosphate 5-kinase activity(GO:0052836) inositol diphosphate tetrakisphosphate kinase activity(GO:0052839) |
| 0.1 | 1.3 | GO:0004062 | aryl sulfotransferase activity(GO:0004062) |
| 0.1 | 0.2 | GO:0008410 | CoA-transferase activity(GO:0008410) |
| 0.1 | 0.4 | GO:0070740 | tubulin-glutamic acid ligase activity(GO:0070740) |
| 0.1 | 0.4 | GO:0004522 | ribonuclease A activity(GO:0004522) |
| 0.0 | 0.3 | GO:0046912 | transferase activity, transferring acyl groups, acyl groups converted into alkyl on transfer(GO:0046912) |
| 0.0 | 0.1 | GO:0047783 | steroid 11-beta-monooxygenase activity(GO:0004507) corticosterone 18-monooxygenase activity(GO:0047783) |
| 0.0 | 0.9 | GO:0051787 | misfolded protein binding(GO:0051787) |
| 0.0 | 1.0 | GO:0015269 | calcium-activated potassium channel activity(GO:0015269) |
| 0.0 | 0.4 | GO:0017134 | fibroblast growth factor binding(GO:0017134) |
| 0.0 | 0.4 | GO:0016634 | oxidoreductase activity, acting on the CH-CH group of donors, oxygen as acceptor(GO:0016634) |
| 0.0 | 0.6 | GO:0003680 | AT DNA binding(GO:0003680) |
| 0.0 | 0.1 | GO:0003826 | alpha-ketoacid dehydrogenase activity(GO:0003826) 3-methyl-2-oxobutanoate dehydrogenase (2-methylpropanoyl-transferring) activity(GO:0003863) |
| 0.0 | 0.2 | GO:1901375 | acetylcholine transmembrane transporter activity(GO:0005277) secondary active organic cation transmembrane transporter activity(GO:0008513) acetate ester transmembrane transporter activity(GO:1901375) |
| 0.0 | 1.0 | GO:0070300 | phosphatidic acid binding(GO:0070300) |
| 0.0 | 0.2 | GO:0008526 | phosphatidylinositol transporter activity(GO:0008526) |
| 0.0 | 0.2 | GO:0015184 | L-cystine transmembrane transporter activity(GO:0015184) |
| 0.0 | 0.1 | GO:0003886 | DNA (cytosine-5-)-methyltransferase activity(GO:0003886) |
| 0.0 | 0.1 | GO:0031013 | troponin I binding(GO:0031013) |
| 0.0 | 0.3 | GO:0030911 | TPR domain binding(GO:0030911) |
| 0.0 | 0.2 | GO:0005134 | interleukin-2 receptor binding(GO:0005134) |
| 0.0 | 0.2 | GO:0042030 | ATPase inhibitor activity(GO:0042030) |
| 0.0 | 0.5 | GO:0008199 | ferric iron binding(GO:0008199) |
| 0.0 | 0.2 | GO:0016900 | oxidoreductase activity, acting on the CH-OH group of donors, disulfide as acceptor(GO:0016900) vitamin-K-epoxide reductase (warfarin-sensitive) activity(GO:0047057) |
| 0.0 | 0.9 | GO:0015171 | amino acid transmembrane transporter activity(GO:0015171) |
| 0.0 | 0.6 | GO:0001075 | transcription factor activity, RNA polymerase II core promoter sequence-specific binding involved in preinitiation complex assembly(GO:0001075) |
| 0.0 | 0.1 | GO:0030109 | HLA-B specific inhibitory MHC class I receptor activity(GO:0030109) inhibitory MHC class I receptor activity(GO:0032396) |
| 0.0 | 1.0 | GO:0017075 | syntaxin-1 binding(GO:0017075) |
| 0.0 | 0.2 | GO:0004735 | pyrroline-5-carboxylate reductase activity(GO:0004735) |
| 0.0 | 0.1 | GO:0044020 | histone methyltransferase activity (H4-R3 specific)(GO:0044020) |
| 0.0 | 0.1 | GO:0004139 | deoxyribose-phosphate aldolase activity(GO:0004139) |
| 0.0 | 0.2 | GO:0035252 | UDP-xylosyltransferase activity(GO:0035252) xylosyltransferase activity(GO:0042285) |
| 0.0 | 0.3 | GO:0030345 | extracellular matrix structural constituent conferring compression resistance(GO:0030021) structural constituent of tooth enamel(GO:0030345) |
| 0.0 | 0.1 | GO:0045518 | interleukin-22 receptor binding(GO:0045518) |
| 0.0 | 0.3 | GO:0005005 | transmembrane-ephrin receptor activity(GO:0005005) |
| 0.0 | 0.2 | GO:0030628 | pre-mRNA 3'-splice site binding(GO:0030628) |
| 0.0 | 0.2 | GO:0004485 | methylcrotonoyl-CoA carboxylase activity(GO:0004485) |
| 0.0 | 0.2 | GO:0051032 | nucleic acid transmembrane transporter activity(GO:0051032) RNA transmembrane transporter activity(GO:0051033) |
| 0.0 | 0.5 | GO:0016018 | cyclosporin A binding(GO:0016018) |
| 0.0 | 0.5 | GO:0070628 | proteasome binding(GO:0070628) |
| 0.0 | 0.1 | GO:0004998 | transferrin receptor activity(GO:0004998) |
| 0.0 | 0.1 | GO:0034584 | piRNA binding(GO:0034584) |
| 0.0 | 0.1 | GO:0042954 | lipoprotein transporter activity(GO:0042954) |
| 0.0 | 0.5 | GO:0031957 | very long-chain fatty acid-CoA ligase activity(GO:0031957) |
| 0.0 | 0.1 | GO:0004605 | phosphatidate cytidylyltransferase activity(GO:0004605) |
| 0.0 | 0.6 | GO:0001968 | fibronectin binding(GO:0001968) |
| 0.0 | 0.1 | GO:0031716 | calcitonin receptor binding(GO:0031716) |
| 0.0 | 1.1 | GO:0008327 | methyl-CpG binding(GO:0008327) |
| 0.0 | 0.1 | GO:0055077 | gap junction hemi-channel activity(GO:0055077) |
| 0.0 | 0.1 | GO:0008502 | melatonin receptor activity(GO:0008502) |
| 0.0 | 0.1 | GO:0004082 | bisphosphoglycerate mutase activity(GO:0004082) phosphoglycerate mutase activity(GO:0004619) 2,3-bisphosphoglycerate-dependent phosphoglycerate mutase activity(GO:0046538) |
| 0.0 | 0.3 | GO:0033691 | sialic acid binding(GO:0033691) |
| 0.0 | 0.1 | GO:0004337 | dimethylallyltranstransferase activity(GO:0004161) geranyltranstransferase activity(GO:0004337) |
| 0.0 | 0.3 | GO:0031419 | cobalamin binding(GO:0031419) |
| 0.0 | 0.1 | GO:0031728 | CCR3 chemokine receptor binding(GO:0031728) |
| 0.0 | 0.0 | GO:0070404 | NADH binding(GO:0070404) |
| 0.0 | 0.1 | GO:0047237 | glucuronylgalactosylproteoglycan 4-beta-N-acetylgalactosaminyltransferase activity(GO:0047237) |
| 0.0 | 0.2 | GO:0004630 | phospholipase D activity(GO:0004630) |
| 0.0 | 0.1 | GO:0008093 | cytoskeletal adaptor activity(GO:0008093) |
| 0.0 | 0.1 | GO:0001515 | opioid peptide activity(GO:0001515) |
| 0.0 | 0.7 | GO:0005521 | lamin binding(GO:0005521) |
| 0.0 | 0.3 | GO:1990459 | transferrin receptor binding(GO:1990459) |
| 0.0 | 0.4 | GO:0002162 | dystroglycan binding(GO:0002162) |
| 0.0 | 0.2 | GO:0097100 | supercoiled DNA binding(GO:0097100) |
| 0.0 | 0.1 | GO:0030760 | nicotinamide N-methyltransferase activity(GO:0008112) pyridine N-methyltransferase activity(GO:0030760) |
| 0.0 | 0.1 | GO:1990050 | phosphatidic acid transporter activity(GO:1990050) |
| 0.0 | 0.1 | GO:0003827 | alpha-1,3-mannosylglycoprotein 2-beta-N-acetylglucosaminyltransferase activity(GO:0003827) |
| 0.0 | 0.2 | GO:0099583 | neurotransmitter receptor activity involved in regulation of postsynaptic cytosolic calcium ion concentration(GO:0099583) |
| 0.0 | 0.1 | GO:0086077 | gap junction channel activity involved in AV node cell-bundle of His cell electrical coupling(GO:0086077) |
| 0.0 | 0.1 | GO:0015180 | L-alanine transmembrane transporter activity(GO:0015180) alanine transmembrane transporter activity(GO:0022858) |
| 0.0 | 0.2 | GO:0004022 | alcohol dehydrogenase (NAD) activity(GO:0004022) |
| 0.0 | 0.2 | GO:0042731 | PH domain binding(GO:0042731) |
| 0.0 | 0.2 | GO:0002039 | p53 binding(GO:0002039) |
| 0.0 | 0.1 | GO:0030292 | protein tyrosine kinase inhibitor activity(GO:0030292) |
| 0.0 | 0.3 | GO:0004303 | estradiol 17-beta-dehydrogenase activity(GO:0004303) |
| 0.0 | 0.5 | GO:0099604 | calcium-release channel activity(GO:0015278) ligand-gated calcium channel activity(GO:0099604) |
| 0.0 | 0.1 | GO:0000064 | L-ornithine transmembrane transporter activity(GO:0000064) |
| 0.0 | 0.4 | GO:0008494 | translation activator activity(GO:0008494) |
| 0.0 | 0.6 | GO:0005523 | tropomyosin binding(GO:0005523) |
| 0.0 | 0.8 | GO:0005035 | tumor necrosis factor-activated receptor activity(GO:0005031) death receptor activity(GO:0005035) |
| 0.0 | 0.1 | GO:0004004 | ATP-dependent RNA helicase activity(GO:0004004) RNA-dependent ATPase activity(GO:0008186) |
| 0.0 | 1.2 | GO:0001105 | RNA polymerase II transcription coactivator activity(GO:0001105) |
| 0.0 | 0.1 | GO:0050698 | proteoglycan sulfotransferase activity(GO:0050698) |
| 0.0 | 1.2 | GO:0008307 | structural constituent of muscle(GO:0008307) |
| 0.0 | 0.1 | GO:0008568 | microtubule-severing ATPase activity(GO:0008568) |
| 0.0 | 0.6 | GO:0070064 | proline-rich region binding(GO:0070064) |
| 0.0 | 0.1 | GO:0008172 | S-methyltransferase activity(GO:0008172) |
| 0.0 | 0.1 | GO:0004814 | arginine-tRNA ligase activity(GO:0004814) |
| 0.0 | 0.3 | GO:0004559 | alpha-mannosidase activity(GO:0004559) |
| 0.0 | 0.4 | GO:0009931 | calcium-dependent protein serine/threonine kinase activity(GO:0009931) |
| 0.0 | 0.3 | GO:0005225 | volume-sensitive anion channel activity(GO:0005225) |
| 0.0 | 0.2 | GO:0042975 | peroxisome proliferator activated receptor binding(GO:0042975) |
| 0.0 | 1.0 | GO:0001786 | phosphatidylserine binding(GO:0001786) |
| 0.0 | 0.2 | GO:0004931 | extracellular ATP-gated cation channel activity(GO:0004931) ATP-gated ion channel activity(GO:0035381) |
| 0.0 | 0.1 | GO:0003873 | 6-phosphofructo-2-kinase activity(GO:0003873) fructose-2,6-bisphosphate 2-phosphatase activity(GO:0004331) |
| 0.0 | 0.4 | GO:0030544 | Hsp70 protein binding(GO:0030544) |
| 0.0 | 0.1 | GO:0004743 | pyruvate kinase activity(GO:0004743) |
| 0.0 | 0.5 | GO:0005212 | structural constituent of eye lens(GO:0005212) |
| 0.0 | 0.0 | GO:0004069 | L-aspartate:2-oxoglutarate aminotransferase activity(GO:0004069) |
| 0.0 | 0.3 | GO:0050321 | tau-protein kinase activity(GO:0050321) |
| 0.0 | 0.2 | GO:0022820 | potassium:chloride symporter activity(GO:0015379) potassium ion symporter activity(GO:0022820) |
| 0.0 | 0.9 | GO:1990939 | ATP-dependent microtubule motor activity(GO:1990939) |
| 0.0 | 0.5 | GO:0004181 | metallocarboxypeptidase activity(GO:0004181) |
| 0.0 | 0.1 | GO:0051870 | methotrexate binding(GO:0051870) |
| 0.0 | 0.1 | GO:0051378 | amine binding(GO:0043176) serotonin binding(GO:0051378) |
| 0.0 | 0.1 | GO:0016681 | ubiquinol-cytochrome-c reductase activity(GO:0008121) oxidoreductase activity, acting on diphenols and related substances as donors, cytochrome as acceptor(GO:0016681) |
| 0.0 | 0.2 | GO:0033038 | bitter taste receptor activity(GO:0033038) |
| 0.0 | 0.3 | GO:0005041 | low-density lipoprotein receptor activity(GO:0005041) |
| 0.0 | 0.2 | GO:0050786 | RAGE receptor binding(GO:0050786) |
| 0.0 | 0.4 | GO:0005092 | GDP-dissociation inhibitor activity(GO:0005092) |
| 0.0 | 0.1 | GO:0036402 | proteasome-activating ATPase activity(GO:0036402) |
| 0.0 | 0.0 | GO:0031727 | CCR2 chemokine receptor binding(GO:0031727) |
| 0.0 | 0.2 | GO:0008391 | arachidonic acid monooxygenase activity(GO:0008391) arachidonic acid epoxygenase activity(GO:0008392) |
| 0.0 | 0.5 | GO:0046875 | ephrin receptor binding(GO:0046875) |
| 0.0 | 0.0 | GO:0052590 | sn-glycerol-3-phosphate:ubiquinone oxidoreductase activity(GO:0052590) sn-glycerol-3-phosphate:ubiquinone-8 oxidoreductase activity(GO:0052591) |
| 0.0 | 0.1 | GO:0102391 | decanoate--CoA ligase activity(GO:0102391) |
| 0.0 | 0.5 | GO:0044183 | protein binding involved in protein folding(GO:0044183) |
| 0.0 | 0.1 | GO:0004332 | fructose-bisphosphate aldolase activity(GO:0004332) |
| 0.0 | 0.2 | GO:0030306 | ADP-ribosylation factor binding(GO:0030306) |
| 0.0 | 1.4 | GO:0005179 | hormone activity(GO:0005179) |
| 0.0 | 1.8 | GO:0005178 | integrin binding(GO:0005178) |
| 0.0 | 0.1 | GO:0004839 | ubiquitin activating enzyme activity(GO:0004839) |
| 0.0 | 0.1 | GO:0017162 | aryl hydrocarbon receptor binding(GO:0017162) |
| 0.0 | 0.0 | GO:0019862 | IgA binding(GO:0019862) |
| 0.0 | 0.0 | GO:0090541 | MIT domain binding(GO:0090541) |
| 0.0 | 0.1 | GO:0047374 | methylumbelliferyl-acetate deacetylase activity(GO:0047374) |
| 0.0 | 0.1 | GO:0046527 | glucosyltransferase activity(GO:0046527) |
Gene overrepresentation in C2:CP category:
| Log-likelihood per target | Total log-likelihood | Term | Description |
|---|---|---|---|
| 0.2 | 11.5 | PID FRA PATHWAY | Validated transcriptional targets of AP1 family members Fra1 and Fra2 |
| 0.1 | 2.1 | PID THROMBIN PAR4 PATHWAY | PAR4-mediated thrombin signaling events |
| 0.1 | 1.1 | PID INTEGRIN4 PATHWAY | Alpha6 beta4 integrin-ligand interactions |
| 0.1 | 2.1 | SA FAS SIGNALING | The TNF-type receptor Fas induces apoptosis on ligand binding. |
| 0.0 | 0.4 | ST DIFFERENTIATION PATHWAY IN PC12 CELLS | Differentiation Pathway in PC12 Cells; this is a specific case of PAC1 Receptor Pathway. |
| 0.0 | 1.9 | PID THROMBIN PAR1 PATHWAY | PAR1-mediated thrombin signaling events |
| 0.0 | 1.9 | NABA COLLAGENS | Genes encoding collagen proteins |
| 0.0 | 2.0 | PID PI3K PLC TRK PATHWAY | Trk receptor signaling mediated by PI3K and PLC-gamma |
| 0.0 | 1.9 | PID NETRIN PATHWAY | Netrin-mediated signaling events |
| 0.0 | 1.3 | PID KIT PATHWAY | Signaling events mediated by Stem cell factor receptor (c-Kit) |
| 0.0 | 1.4 | PID ERBB1 INTERNALIZATION PATHWAY | Internalization of ErbB1 |
| 0.0 | 0.2 | PID TCR JNK PATHWAY | JNK signaling in the CD4+ TCR pathway |
| 0.0 | 0.5 | ST PHOSPHOINOSITIDE 3 KINASE PATHWAY | PI3K Pathway |
| 0.0 | 0.9 | PID HDAC CLASSII PATHWAY | Signaling events mediated by HDAC Class II |
| 0.0 | 1.7 | PID E2F PATHWAY | E2F transcription factor network |
| 0.0 | 0.3 | PID PRL SIGNALING EVENTS PATHWAY | Signaling events mediated by PRL |
| 0.0 | 0.5 | PID A6B1 A6B4 INTEGRIN PATHWAY | a6b1 and a6b4 Integrin signaling |
| 0.0 | 0.4 | PID ARF 3PATHWAY | Arf1 pathway |
| 0.0 | 0.6 | PID TCR CALCIUM PATHWAY | Calcium signaling in the CD4+ TCR pathway |
| 0.0 | 0.3 | PID INTEGRIN5 PATHWAY | Beta5 beta6 beta7 and beta8 integrin cell surface interactions |
| 0.0 | 0.1 | ST PAC1 RECEPTOR PATHWAY | PAC1 Receptor Pathway |
| 0.0 | 0.8 | PID ATF2 PATHWAY | ATF-2 transcription factor network |
| 0.0 | 0.2 | PID ARF6 DOWNSTREAM PATHWAY | Arf6 downstream pathway |
| 0.0 | 1.1 | PID MYC REPRESS PATHWAY | Validated targets of C-MYC transcriptional repression |
| 0.0 | 0.7 | PID LKB1 PATHWAY | LKB1 signaling events |
| 0.0 | 0.3 | PID NFKAPPAB CANONICAL PATHWAY | Canonical NF-kappaB pathway |
Gene overrepresentation in C2:CP:REACTOME category:
| Log-likelihood per target | Total log-likelihood | Term | Description |
|---|---|---|---|
| 0.3 | 8.9 | REACTOME CS DS DEGRADATION | Genes involved in CS/DS degradation |
| 0.2 | 2.4 | REACTOME PROSTANOID LIGAND RECEPTORS | Genes involved in Prostanoid ligand receptors |
| 0.1 | 2.0 | REACTOME PLATELET ADHESION TO EXPOSED COLLAGEN | Genes involved in Platelet Adhesion to exposed collagen |
| 0.1 | 1.7 | REACTOME DOPAMINE NEUROTRANSMITTER RELEASE CYCLE | Genes involved in Dopamine Neurotransmitter Release Cycle |
| 0.1 | 1.3 | REACTOME NOTCH HLH TRANSCRIPTION PATHWAY | Genes involved in Notch-HLH transcription pathway |
| 0.1 | 1.1 | REACTOME GLYCOPROTEIN HORMONES | Genes involved in Glycoprotein hormones |
| 0.1 | 2.0 | REACTOME EXTRINSIC PATHWAY FOR APOPTOSIS | Genes involved in Extrinsic Pathway for Apoptosis |
| 0.1 | 2.4 | REACTOME ADHERENS JUNCTIONS INTERACTIONS | Genes involved in Adherens junctions interactions |
| 0.1 | 0.9 | REACTOME ROLE OF DCC IN REGULATING APOPTOSIS | Genes involved in Role of DCC in regulating apoptosis |
| 0.1 | 1.3 | REACTOME REGULATION OF INSULIN LIKE GROWTH FACTOR IGF ACTIVITY BY INSULIN LIKE GROWTH FACTOR BINDING PROTEINS IGFBPS | Genes involved in Regulation of Insulin-like Growth Factor (IGF) Activity by Insulin-like Growth Factor Binding Proteins (IGFBPs) |
| 0.0 | 1.3 | REACTOME CYTOSOLIC SULFONATION OF SMALL MOLECULES | Genes involved in Cytosolic sulfonation of small molecules |
| 0.0 | 0.6 | REACTOME TRAFFICKING AND PROCESSING OF ENDOSOMAL TLR | Genes involved in Trafficking and processing of endosomal TLR |
| 0.0 | 2.1 | REACTOME THROMBIN SIGNALLING THROUGH PROTEINASE ACTIVATED RECEPTORS PARS | Genes involved in Thrombin signalling through proteinase activated receptors (PARs) |
| 0.0 | 0.3 | REACTOME SIGNALING BY EGFR IN CANCER | Genes involved in Signaling by EGFR in Cancer |
| 0.0 | 1.1 | REACTOME ERK MAPK TARGETS | Genes involved in ERK/MAPK targets |
| 0.0 | 0.3 | REACTOME IKK COMPLEX RECRUITMENT MEDIATED BY RIP1 | Genes involved in IKK complex recruitment mediated by RIP1 |
| 0.0 | 1.7 | REACTOME TRAFFICKING OF AMPA RECEPTORS | Genes involved in Trafficking of AMPA receptors |
| 0.0 | 0.5 | REACTOME IL 7 SIGNALING | Genes involved in Interleukin-7 signaling |
| 0.0 | 1.6 | REACTOME SMOOTH MUSCLE CONTRACTION | Genes involved in Smooth Muscle Contraction |
| 0.0 | 0.4 | REACTOME BILE SALT AND ORGANIC ANION SLC TRANSPORTERS | Genes involved in Bile salt and organic anion SLC transporters |
| 0.0 | 0.3 | REACTOME MEMBRANE BINDING AND TARGETTING OF GAG PROTEINS | Genes involved in Membrane binding and targetting of GAG proteins |
| 0.0 | 1.2 | REACTOME AMINO ACID TRANSPORT ACROSS THE PLASMA MEMBRANE | Genes involved in Amino acid transport across the plasma membrane |
| 0.0 | 0.2 | REACTOME APOBEC3G MEDIATED RESISTANCE TO HIV1 INFECTION | Genes involved in APOBEC3G mediated resistance to HIV-1 infection |
| 0.0 | 0.3 | REACTOME SYNTHESIS OF BILE ACIDS AND BILE SALTS VIA 24 HYDROXYCHOLESTEROL | Genes involved in Synthesis of bile acids and bile salts via 24-hydroxycholesterol |
| 0.0 | 1.0 | REACTOME CGMP EFFECTS | Genes involved in cGMP effects |
| 0.0 | 0.5 | REACTOME POST CHAPERONIN TUBULIN FOLDING PATHWAY | Genes involved in Post-chaperonin tubulin folding pathway |
| 0.0 | 0.8 | REACTOME GLYCOLYSIS | Genes involved in Glycolysis |
| 0.0 | 0.6 | REACTOME FATTY ACYL COA BIOSYNTHESIS | Genes involved in Fatty Acyl-CoA Biosynthesis |
| 0.0 | 0.3 | REACTOME PRE NOTCH TRANSCRIPTION AND TRANSLATION | Genes involved in Pre-NOTCH Transcription and Translation |
| 0.0 | 0.5 | REACTOME TERMINATION OF O GLYCAN BIOSYNTHESIS | Genes involved in Termination of O-glycan biosynthesis |
| 0.0 | 0.5 | REACTOME PLATELET CALCIUM HOMEOSTASIS | Genes involved in Platelet calcium homeostasis |
| 0.0 | 0.2 | REACTOME SIGNALING BY NOTCH2 | Genes involved in Signaling by NOTCH2 |
| 0.0 | 0.2 | REACTOME ABACAVIR TRANSPORT AND METABOLISM | Genes involved in Abacavir transport and metabolism |
| 0.0 | 0.1 | REACTOME SEROTONIN RECEPTORS | Genes involved in Serotonin receptors |
| 0.0 | 1.1 | REACTOME GOLGI ASSOCIATED VESICLE BIOGENESIS | Genes involved in Golgi Associated Vesicle Biogenesis |
| 0.0 | 0.3 | REACTOME EGFR DOWNREGULATION | Genes involved in EGFR downregulation |
| 0.0 | 0.2 | REACTOME XENOBIOTICS | Genes involved in Xenobiotics |
| 0.0 | 1.5 | REACTOME INTEGRIN CELL SURFACE INTERACTIONS | Genes involved in Integrin cell surface interactions |
| 0.0 | 0.4 | REACTOME POST NMDA RECEPTOR ACTIVATION EVENTS | Genes involved in Post NMDA receptor activation events |
| 0.0 | 0.3 | REACTOME G0 AND EARLY G1 | Genes involved in G0 and Early G1 |
| 0.0 | 0.2 | REACTOME PRESYNAPTIC NICOTINIC ACETYLCHOLINE RECEPTORS | Genes involved in Presynaptic nicotinic acetylcholine receptors |