Project
Epithelial-Mesenchymal Transition, human (Scheel, 2011)
Navigation
Downloads
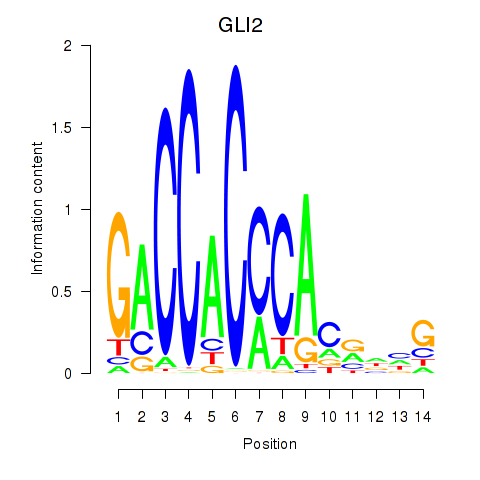
Results for GLI2
Z-value: 1.41
Motif logo
Transcription factors associated with GLI2
| Gene Symbol | Gene ID | Gene Info |
|---|---|---|
|
GLI2
|
ENSG00000074047.16 | GLI2 |
Activity profile of GLI2 motif
Sorted Z-values of GLI2 motif
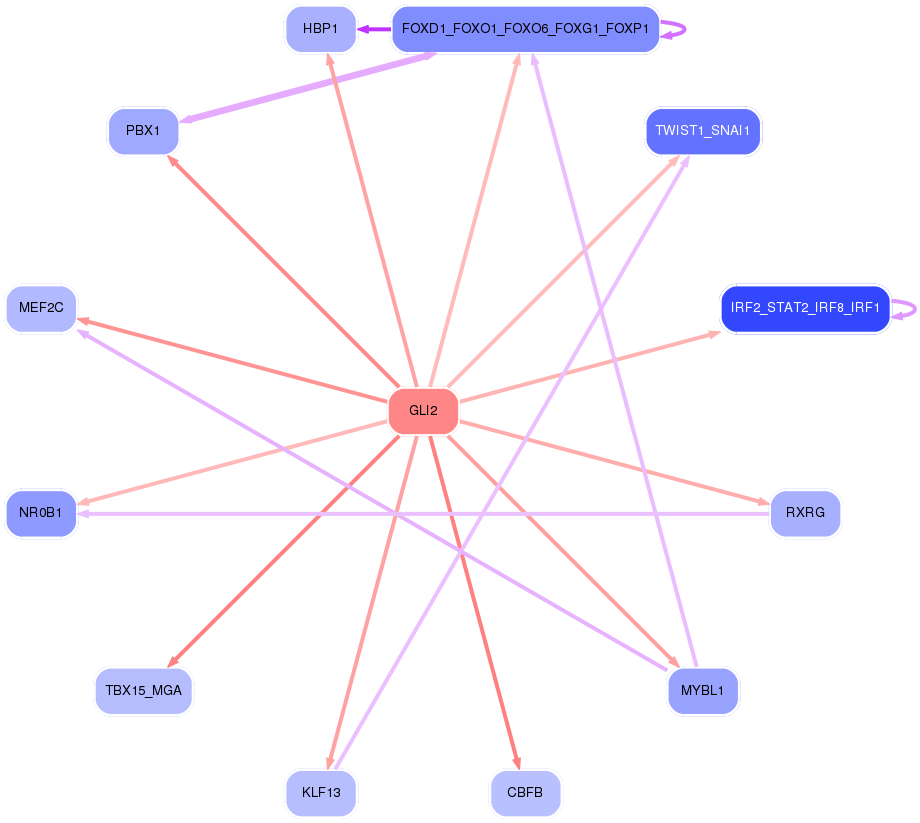
Network of associatons between targets according to the STRING database.

First level regulatory network of GLI2
| Promoter | Score | Transcript | Gene | Gene Info |
|---|---|---|---|---|
| chr11_-_118550346 | 2.91 |
ENST00000530256.1 |
TREH |
trehalase (brush-border membrane glycoprotein) |
| chr11_-_118550375 | 2.55 |
ENST00000525958.1 ENST00000264029.4 ENST00000397925.1 ENST00000529101.1 |
TREH |
trehalase (brush-border membrane glycoprotein) |
| chr3_+_45067659 | 2.15 |
ENST00000296130.4 |
CLEC3B |
C-type lectin domain family 3, member B |
| chr5_-_9546180 | 1.89 |
ENST00000382496.5 |
SEMA5A |
sema domain, seven thrombospondin repeats (type 1 and type 1-like), transmembrane domain (TM) and short cytoplasmic domain, (semaphorin) 5A |
| chr9_+_90112767 | 1.56 |
ENST00000408954.3 |
DAPK1 |
death-associated protein kinase 1 |
| chr21_-_45079341 | 1.55 |
ENST00000443485.1 ENST00000291560.2 |
HSF2BP |
heat shock transcription factor 2 binding protein |
| chr9_+_90112741 | 1.44 |
ENST00000469640.2 |
DAPK1 |
death-associated protein kinase 1 |
| chr4_-_57524061 | 1.42 |
ENST00000508121.1 |
HOPX |
HOP homeobox |
| chrX_-_51812268 | 1.40 |
ENST00000486010.1 ENST00000497164.1 ENST00000360134.6 ENST00000485287.1 ENST00000335504.5 ENST00000431659.1 |
MAGED4B |
melanoma antigen family D, 4B |
| chr12_-_56101647 | 1.39 |
ENST00000347027.6 ENST00000257879.6 ENST00000257880.7 ENST00000394230.2 ENST00000394229.2 |
ITGA7 |
integrin, alpha 7 |
| chrX_-_107019181 | 1.31 |
ENST00000315660.4 ENST00000372384.2 ENST00000502650.1 ENST00000506724.1 |
TSC22D3 |
TSC22 domain family, member 3 |
| chr16_+_2880157 | 1.30 |
ENST00000382280.3 |
ZG16B |
zymogen granule protein 16B |
| chr16_+_2880369 | 1.17 |
ENST00000572863.1 |
ZG16B |
zymogen granule protein 16B |
| chr14_-_52535712 | 1.14 |
ENST00000216286.5 ENST00000541773.1 |
NID2 |
nidogen 2 (osteonidogen) |
| chrX_+_51927919 | 1.12 |
ENST00000416960.1 |
MAGED4 |
melanoma antigen family D, 4 |
| chrX_+_51928002 | 1.08 |
ENST00000375626.3 |
MAGED4 |
melanoma antigen family D, 4 |
| chr9_+_4490394 | 1.07 |
ENST00000262352.3 |
SLC1A1 |
solute carrier family 1 (neuronal/epithelial high affinity glutamate transporter, system Xag), member 1 |
| chr2_+_201450591 | 1.04 |
ENST00000374700.2 |
AOX1 |
aldehyde oxidase 1 |
| chr16_+_2880254 | 1.01 |
ENST00000570670.1 |
ZG16B |
zymogen granule protein 16B |
| chr22_-_24622080 | 1.00 |
ENST00000425408.1 |
GGT5 |
gamma-glutamyltransferase 5 |
| chr16_+_2880296 | 0.98 |
ENST00000571723.1 |
ZG16B |
zymogen granule protein 16B |
| chr2_+_128175997 | 0.98 |
ENST00000234071.3 ENST00000429925.1 ENST00000442644.1 ENST00000453608.2 |
PROC |
protein C (inactivator of coagulation factors Va and VIIIa) |
| chr2_+_128180842 | 0.94 |
ENST00000402125.2 |
PROC |
protein C (inactivator of coagulation factors Va and VIIIa) |
| chr6_+_72596604 | 0.91 |
ENST00000348717.5 ENST00000517960.1 ENST00000518273.1 ENST00000522291.1 ENST00000521978.1 ENST00000520567.1 ENST00000264839.7 |
RIMS1 |
regulating synaptic membrane exocytosis 1 |
| chr6_+_72596406 | 0.82 |
ENST00000491071.2 |
RIMS1 |
regulating synaptic membrane exocytosis 1 |
| chr16_+_88493879 | 0.81 |
ENST00000565624.1 ENST00000437464.1 |
ZNF469 |
zinc finger protein 469 |
| chr10_-_49701686 | 0.80 |
ENST00000417247.2 |
ARHGAP22 |
Rho GTPase activating protein 22 |
| chr17_-_73761222 | 0.78 |
ENST00000437911.1 ENST00000225614.2 |
GALK1 |
galactokinase 1 |
| chr22_-_32651326 | 0.77 |
ENST00000266086.4 |
SLC5A4 |
solute carrier family 5 (glucose activated ion channel), member 4 |
| chr5_-_178054014 | 0.77 |
ENST00000520957.1 |
CLK4 |
CDC-like kinase 4 |
| chr2_-_175869936 | 0.77 |
ENST00000409900.3 |
CHN1 |
chimerin 1 |
| chr4_+_62067860 | 0.77 |
ENST00000514591.1 |
LPHN3 |
latrophilin 3 |
| chr17_+_41158742 | 0.74 |
ENST00000415816.2 ENST00000438323.2 |
IFI35 |
interferon-induced protein 35 |
| chr17_+_81037473 | 0.74 |
ENST00000320095.7 |
METRNL |
meteorin, glial cell differentiation regulator-like |
| chr11_+_124609823 | 0.74 |
ENST00000412681.2 |
NRGN |
neurogranin (protein kinase C substrate, RC3) |
| chr7_-_47579188 | 0.72 |
ENST00000398879.1 ENST00000355730.3 ENST00000442536.2 ENST00000458317.2 |
TNS3 |
tensin 3 |
| chr10_-_38265517 | 0.72 |
ENST00000302609.7 |
ZNF25 |
zinc finger protein 25 |
| chr5_+_140718396 | 0.72 |
ENST00000394576.2 |
PCDHGA2 |
protocadherin gamma subfamily A, 2 |
| chr19_+_18208603 | 0.71 |
ENST00000262811.6 |
MAST3 |
microtubule associated serine/threonine kinase 3 |
| chr20_-_30310656 | 0.70 |
ENST00000376055.4 |
BCL2L1 |
BCL2-like 1 |
| chr22_+_20008595 | 0.69 |
ENST00000398042.2 ENST00000450664.1 ENST00000327374.4 ENST00000432883.1 |
TANGO2 |
transport and golgi organization 2 homolog (Drosophila) |
| chr20_-_30310693 | 0.69 |
ENST00000307677.4 ENST00000420653.1 |
BCL2L1 |
BCL2-like 1 |
| chr7_-_131241361 | 0.69 |
ENST00000378555.3 ENST00000322985.9 ENST00000541194.1 ENST00000537928.1 |
PODXL |
podocalyxin-like |
| chr9_-_113800341 | 0.67 |
ENST00000358883.4 |
LPAR1 |
lysophosphatidic acid receptor 1 |
| chrX_-_106960285 | 0.64 |
ENST00000503515.1 ENST00000372397.2 |
TSC22D3 |
TSC22 domain family, member 3 |
| chr12_+_4671352 | 0.61 |
ENST00000542744.1 |
DYRK4 |
dual-specificity tyrosine-(Y)-phosphorylation regulated kinase 4 |
| chr2_+_11295624 | 0.61 |
ENST00000402361.1 ENST00000428481.1 |
PQLC3 |
PQ loop repeat containing 3 |
| chr16_+_67063262 | 0.60 |
ENST00000565389.1 |
CBFB |
core-binding factor, beta subunit |
| chr5_-_176924562 | 0.60 |
ENST00000359895.2 ENST00000355572.2 ENST00000355841.2 ENST00000393551.1 ENST00000505074.1 ENST00000356618.4 ENST00000393546.4 |
PDLIM7 |
PDZ and LIM domain 7 (enigma) |
| chr3_+_54157480 | 0.60 |
ENST00000490478.1 |
CACNA2D3 |
calcium channel, voltage-dependent, alpha 2/delta subunit 3 |
| chr9_-_113800317 | 0.59 |
ENST00000374431.3 |
LPAR1 |
lysophosphatidic acid receptor 1 |
| chr11_-_74109422 | 0.59 |
ENST00000298198.4 |
PGM2L1 |
phosphoglucomutase 2-like 1 |
| chr15_+_41913690 | 0.59 |
ENST00000563576.1 |
MGA |
MGA, MAX dimerization protein |
| chr10_+_104503727 | 0.58 |
ENST00000448841.1 |
WBP1L |
WW domain binding protein 1-like |
| chr15_-_93616892 | 0.58 |
ENST00000556658.1 ENST00000538818.1 ENST00000425933.2 |
RGMA |
repulsive guidance molecule family member a |
| chr19_+_41117770 | 0.58 |
ENST00000601032.1 |
LTBP4 |
latent transforming growth factor beta binding protein 4 |
| chr3_+_49449636 | 0.57 |
ENST00000273590.3 |
TCTA |
T-cell leukemia translocation altered |
| chr9_-_139658965 | 0.57 |
ENST00000316144.5 |
LCN15 |
lipocalin 15 |
| chr19_+_41107249 | 0.55 |
ENST00000396819.3 |
LTBP4 |
latent transforming growth factor beta binding protein 4 |
| chr19_-_53757941 | 0.55 |
ENST00000594517.1 ENST00000601413.1 ENST00000594681.1 |
ZNF677 |
zinc finger protein 677 |
| chr1_-_38471156 | 0.55 |
ENST00000373016.3 |
FHL3 |
four and a half LIM domains 3 |
| chr22_+_20193905 | 0.54 |
ENST00000609602.1 |
LINC00896 |
long intergenic non-protein coding RNA 896 |
| chr22_+_39378346 | 0.54 |
ENST00000407298.3 |
APOBEC3B |
apolipoprotein B mRNA editing enzyme, catalytic polypeptide-like 3B |
| chr11_-_64527425 | 0.53 |
ENST00000377432.3 |
PYGM |
phosphorylase, glycogen, muscle |
| chr5_+_154238149 | 0.53 |
ENST00000519430.1 ENST00000520671.1 ENST00000521583.1 ENST00000518028.1 ENST00000519404.1 ENST00000519394.1 ENST00000518775.1 |
CNOT8 |
CCR4-NOT transcription complex, subunit 8 |
| chr22_+_37447771 | 0.52 |
ENST00000402077.3 ENST00000403888.3 ENST00000456470.1 |
KCTD17 |
potassium channel tetramerization domain containing 17 |
| chr19_+_56159362 | 0.52 |
ENST00000593069.1 ENST00000308964.3 |
CCDC106 |
coiled-coil domain containing 106 |
| chr5_-_177659761 | 0.52 |
ENST00000308158.5 |
PHYKPL |
5-phosphohydroxy-L-lysine phospho-lyase |
| chr14_+_21467414 | 0.52 |
ENST00000554422.1 ENST00000298681.4 |
SLC39A2 |
solute carrier family 39 (zinc transporter), member 2 |
| chr1_+_164528866 | 0.51 |
ENST00000420696.2 |
PBX1 |
pre-B-cell leukemia homeobox 1 |
| chr6_+_89790459 | 0.51 |
ENST00000369472.1 |
PNRC1 |
proline-rich nuclear receptor coactivator 1 |
| chr6_-_53530474 | 0.50 |
ENST00000370905.3 |
KLHL31 |
kelch-like family member 31 |
| chrX_+_51636629 | 0.50 |
ENST00000375722.1 ENST00000326587.7 ENST00000375695.2 |
MAGED1 |
melanoma antigen family D, 1 |
| chr5_-_178054105 | 0.50 |
ENST00000316308.4 |
CLK4 |
CDC-like kinase 4 |
| chr2_-_224702201 | 0.49 |
ENST00000446015.2 |
AP1S3 |
adaptor-related protein complex 1, sigma 3 subunit |
| chr5_-_132112921 | 0.49 |
ENST00000378721.4 ENST00000378701.1 |
SEPT8 |
septin 8 |
| chr3_-_179169330 | 0.49 |
ENST00000232564.3 |
GNB4 |
guanine nucleotide binding protein (G protein), beta polypeptide 4 |
| chr1_-_241520525 | 0.49 |
ENST00000366565.1 |
RGS7 |
regulator of G-protein signaling 7 |
| chr17_-_30185946 | 0.49 |
ENST00000579741.1 |
COPRS |
coordinator of PRMT5, differentiation stimulator |
| chr17_+_80332153 | 0.49 |
ENST00000313135.2 |
UTS2R |
urotensin 2 receptor |
| chr15_-_78526855 | 0.47 |
ENST00000541759.1 ENST00000558130.1 |
ACSBG1 |
acyl-CoA synthetase bubblegum family member 1 |
| chr8_+_27183033 | 0.47 |
ENST00000420218.2 |
PTK2B |
protein tyrosine kinase 2 beta |
| chr1_+_171060018 | 0.47 |
ENST00000367755.4 ENST00000392085.2 ENST00000542847.1 ENST00000538429.1 ENST00000479749.1 |
FMO3 |
flavin containing monooxygenase 3 |
| chr21_+_37507210 | 0.47 |
ENST00000290354.5 |
CBR3 |
carbonyl reductase 3 |
| chr22_+_39378375 | 0.46 |
ENST00000402182.3 ENST00000333467.3 |
APOBEC3B |
apolipoprotein B mRNA editing enzyme, catalytic polypeptide-like 3B |
| chr19_-_40791211 | 0.46 |
ENST00000579047.1 |
AKT2 |
v-akt murine thymoma viral oncogene homolog 2 |
| chr12_+_50355647 | 0.46 |
ENST00000293599.6 |
AQP5 |
aquaporin 5 |
| chr5_+_149340282 | 0.46 |
ENST00000286298.4 |
SLC26A2 |
solute carrier family 26 (anion exchanger), member 2 |
| chrX_+_153448107 | 0.45 |
ENST00000369935.5 |
OPN1MW |
opsin 1 (cone pigments), medium-wave-sensitive |
| chr1_-_241520385 | 0.45 |
ENST00000366564.1 |
RGS7 |
regulator of G-protein signaling 7 |
| chr1_-_36185073 | 0.45 |
ENST00000270815.4 |
C1orf216 |
chromosome 1 open reading frame 216 |
| chr5_+_150157860 | 0.45 |
ENST00000600109.1 |
AC010441.1 |
AC010441.1 |
| chr18_-_60987220 | 0.45 |
ENST00000398117.1 |
BCL2 |
B-cell CLL/lymphoma 2 |
| chr5_-_88119580 | 0.44 |
ENST00000539796.1 |
MEF2C |
myocyte enhancer factor 2C |
| chr3_-_88108192 | 0.44 |
ENST00000309534.6 |
CGGBP1 |
CGG triplet repeat binding protein 1 |
| chr3_+_133118839 | 0.44 |
ENST00000302334.2 |
BFSP2 |
beaded filament structural protein 2, phakinin |
| chr3_+_88108381 | 0.44 |
ENST00000473136.1 |
RP11-159G9.5 |
Uncharacterized protein |
| chr19_+_56159509 | 0.44 |
ENST00000586790.1 ENST00000591578.1 ENST00000588740.1 |
CCDC106 |
coiled-coil domain containing 106 |
| chr19_-_10450328 | 0.44 |
ENST00000160262.5 |
ICAM3 |
intercellular adhesion molecule 3 |
| chr4_-_5894777 | 0.43 |
ENST00000324989.7 |
CRMP1 |
collapsin response mediator protein 1 |
| chr1_+_47799542 | 0.43 |
ENST00000471289.2 ENST00000450808.2 |
CMPK1 |
cytidine monophosphate (UMP-CMP) kinase 1, cytosolic |
| chr9_+_15553000 | 0.43 |
ENST00000297641.3 |
CCDC171 |
coiled-coil domain containing 171 |
| chr9_+_139247484 | 0.43 |
ENST00000429455.1 |
GPSM1 |
G-protein signaling modulator 1 |
| chr2_+_131369054 | 0.43 |
ENST00000409602.1 |
POTEJ |
POTE ankyrin domain family, member J |
| chrX_+_153409678 | 0.42 |
ENST00000369951.4 |
OPN1LW |
opsin 1 (cone pigments), long-wave-sensitive |
| chr5_+_150157444 | 0.42 |
ENST00000526627.1 |
SMIM3 |
small integral membrane protein 3 |
| chr2_-_224702257 | 0.42 |
ENST00000409375.1 |
AP1S3 |
adaptor-related protein complex 1, sigma 3 subunit |
| chr11_-_63439013 | 0.42 |
ENST00000398868.3 |
ATL3 |
atlastin GTPase 3 |
| chr19_+_4304585 | 0.42 |
ENST00000221856.6 |
FSD1 |
fibronectin type III and SPRY domain containing 1 |
| chr15_-_63449663 | 0.42 |
ENST00000439025.1 |
RPS27L |
ribosomal protein S27-like |
| chr10_+_70320413 | 0.42 |
ENST00000373644.4 |
TET1 |
tet methylcytosine dioxygenase 1 |
| chr11_+_67776012 | 0.42 |
ENST00000539229.1 |
ALDH3B1 |
aldehyde dehydrogenase 3 family, member B1 |
| chr4_-_39529049 | 0.42 |
ENST00000501493.2 ENST00000509391.1 ENST00000507089.1 |
UGDH |
UDP-glucose 6-dehydrogenase |
| chr6_+_24495067 | 0.42 |
ENST00000357578.3 ENST00000546278.1 ENST00000491546.1 |
ALDH5A1 |
aldehyde dehydrogenase 5 family, member A1 |
| chr12_-_90024360 | 0.42 |
ENST00000393164.2 |
ATP2B1 |
ATPase, Ca++ transporting, plasma membrane 1 |
| chr11_+_66045634 | 0.41 |
ENST00000528852.1 ENST00000311445.6 |
CNIH2 |
cornichon family AMPA receptor auxiliary protein 2 |
| chr5_-_132113036 | 0.41 |
ENST00000378706.1 |
SEPT8 |
septin 8 |
| chr5_-_176923803 | 0.41 |
ENST00000506161.1 |
PDLIM7 |
PDZ and LIM domain 7 (enigma) |
| chr9_-_115818951 | 0.41 |
ENST00000553380.1 ENST00000374227.3 |
ZFP37 |
ZFP37 zinc finger protein |
| chr11_+_124609742 | 0.41 |
ENST00000284292.6 |
NRGN |
neurogranin (protein kinase C substrate, RC3) |
| chr14_+_24605389 | 0.41 |
ENST00000382708.3 ENST00000561435.1 |
PSME1 |
proteasome (prosome, macropain) activator subunit 1 (PA28 alpha) |
| chr20_-_2821271 | 0.40 |
ENST00000448755.1 ENST00000360652.2 |
PCED1A |
PC-esterase domain containing 1A |
| chr4_-_107237374 | 0.40 |
ENST00000361687.4 ENST00000507696.1 ENST00000394708.2 ENST00000509532.1 |
TBCK |
TBC1 domain containing kinase |
| chr17_-_30185971 | 0.40 |
ENST00000378634.2 |
COPRS |
coordinator of PRMT5, differentiation stimulator |
| chr5_-_176923846 | 0.40 |
ENST00000506537.1 |
PDLIM7 |
PDZ and LIM domain 7 (enigma) |
| chr20_-_2821756 | 0.40 |
ENST00000356872.3 ENST00000439542.1 |
PCED1A |
PC-esterase domain containing 1A |
| chr5_+_154238042 | 0.40 |
ENST00000519211.1 ENST00000522458.1 ENST00000519903.1 ENST00000521450.1 ENST00000403027.2 |
CNOT8 |
CCR4-NOT transcription complex, subunit 8 |
| chr19_+_39904168 | 0.39 |
ENST00000438123.1 ENST00000409797.2 ENST00000451354.2 |
PLEKHG2 |
pleckstrin homology domain containing, family G (with RhoGef domain) member 2 |
| chr8_+_1922024 | 0.39 |
ENST00000320248.3 |
KBTBD11 |
kelch repeat and BTB (POZ) domain containing 11 |
| chr3_+_54156664 | 0.39 |
ENST00000474759.1 ENST00000288197.5 |
CACNA2D3 |
calcium channel, voltage-dependent, alpha 2/delta subunit 3 |
| chrX_+_55744166 | 0.39 |
ENST00000374941.4 ENST00000414239.1 |
RRAGB |
Ras-related GTP binding B |
| chr2_+_242811874 | 0.39 |
ENST00000343216.3 |
CXXC11 |
CXXC finger protein 11 |
| chr1_+_202431859 | 0.39 |
ENST00000391959.3 ENST00000367270.4 |
PPP1R12B |
protein phosphatase 1, regulatory subunit 12B |
| chr8_+_22428457 | 0.38 |
ENST00000517962.1 |
SORBS3 |
sorbin and SH3 domain containing 3 |
| chr4_-_107237340 | 0.38 |
ENST00000394706.3 |
TBCK |
TBC1 domain containing kinase |
| chr12_+_77158021 | 0.38 |
ENST00000550876.1 |
ZDHHC17 |
zinc finger, DHHC-type containing 17 |
| chr22_+_50528459 | 0.38 |
ENST00000395858.3 ENST00000395843.1 |
MOV10L1 |
Mov10l1, Moloney leukemia virus 10-like 1, homolog (mouse) |
| chr19_+_47105309 | 0.37 |
ENST00000599839.1 ENST00000596362.1 |
CALM3 |
calmodulin 3 (phosphorylase kinase, delta) |
| chr3_-_88108212 | 0.37 |
ENST00000482016.1 |
CGGBP1 |
CGG triplet repeat binding protein 1 |
| chr1_+_150522222 | 0.37 |
ENST00000369039.5 |
ADAMTSL4 |
ADAMTS-like 4 |
| chr19_-_53758094 | 0.37 |
ENST00000601828.1 ENST00000598513.1 ENST00000599012.1 ENST00000333952.4 ENST00000598806.1 |
ZNF677 |
zinc finger protein 677 |
| chr11_+_76777979 | 0.37 |
ENST00000531028.1 ENST00000278559.3 ENST00000527066.1 ENST00000529629.1 |
CAPN5 |
calpain 5 |
| chr3_+_54156570 | 0.37 |
ENST00000415676.2 |
CACNA2D3 |
calcium channel, voltage-dependent, alpha 2/delta subunit 3 |
| chr5_-_132113063 | 0.37 |
ENST00000378719.2 |
SEPT8 |
septin 8 |
| chr19_+_49617581 | 0.37 |
ENST00000391864.3 |
LIN7B |
lin-7 homolog B (C. elegans) |
| chr1_-_26232951 | 0.37 |
ENST00000426559.2 ENST00000455785.2 |
STMN1 |
stathmin 1 |
| chr22_+_32149927 | 0.36 |
ENST00000437411.1 ENST00000535622.1 ENST00000536766.1 ENST00000400242.3 ENST00000266091.3 ENST00000400249.2 ENST00000400246.1 ENST00000382105.2 |
DEPDC5 |
DEP domain containing 5 |
| chr6_+_89790490 | 0.36 |
ENST00000336032.3 |
PNRC1 |
proline-rich nuclear receptor coactivator 1 |
| chr12_+_3000073 | 0.36 |
ENST00000397132.2 |
TULP3 |
tubby like protein 3 |
| chr11_-_414948 | 0.36 |
ENST00000530494.1 ENST00000528209.1 ENST00000431843.2 ENST00000528058.1 |
SIGIRR |
single immunoglobulin and toll-interleukin 1 receptor (TIR) domain |
| chr5_-_132112907 | 0.36 |
ENST00000458488.2 |
SEPT8 |
septin 8 |
| chr9_-_115819039 | 0.36 |
ENST00000555206.1 |
ZFP37 |
ZFP37 zinc finger protein |
| chr20_-_2781222 | 0.36 |
ENST00000380605.2 |
CPXM1 |
carboxypeptidase X (M14 family), member 1 |
| chr5_-_132113559 | 0.35 |
ENST00000448933.1 |
SEPT8 |
septin 8 |
| chr16_+_68573640 | 0.35 |
ENST00000398253.2 ENST00000573161.1 |
ZFP90 |
ZFP90 zinc finger protein |
| chr10_-_104474128 | 0.35 |
ENST00000260746.5 |
ARL3 |
ADP-ribosylation factor-like 3 |
| chr7_-_150974494 | 0.35 |
ENST00000392811.2 |
SMARCD3 |
SWI/SNF related, matrix associated, actin dependent regulator of chromatin, subfamily d, member 3 |
| chr8_-_67525473 | 0.35 |
ENST00000522677.3 |
MYBL1 |
v-myb avian myeloblastosis viral oncogene homolog-like 1 |
| chr22_-_30867973 | 0.35 |
ENST00000402286.1 ENST00000401751.1 ENST00000539629.1 ENST00000403066.1 ENST00000215812.4 |
SEC14L3 |
SEC14-like 3 (S. cerevisiae) |
| chr18_-_59274139 | 0.35 |
ENST00000586949.1 |
RP11-879F14.2 |
RP11-879F14.2 |
| chr17_+_7483761 | 0.34 |
ENST00000584180.1 |
CD68 |
CD68 molecule |
| chr17_+_58677539 | 0.34 |
ENST00000305921.3 |
PPM1D |
protein phosphatase, Mg2+/Mn2+ dependent, 1D |
| chr1_+_6845578 | 0.34 |
ENST00000467404.2 ENST00000439411.2 |
CAMTA1 |
calmodulin binding transcription activator 1 |
| chr1_-_153599426 | 0.34 |
ENST00000392622.1 |
S100A13 |
S100 calcium binding protein A13 |
| chr5_+_9546306 | 0.34 |
ENST00000508179.1 |
SNHG18 |
small nucleolar RNA host gene 18 (non-protein coding) |
| chr5_+_154237778 | 0.34 |
ENST00000523698.1 ENST00000517876.1 ENST00000520472.1 |
CNOT8 |
CCR4-NOT transcription complex, subunit 8 |
| chr8_-_42065187 | 0.34 |
ENST00000270189.6 ENST00000352041.3 ENST00000220809.4 |
PLAT |
plasminogen activator, tissue |
| chr12_+_53689309 | 0.34 |
ENST00000351500.3 ENST00000550846.1 ENST00000334478.4 ENST00000549759.1 |
PFDN5 |
prefoldin subunit 5 |
| chr5_+_154238096 | 0.33 |
ENST00000517568.1 ENST00000524105.1 ENST00000285896.6 |
CNOT8 |
CCR4-NOT transcription complex, subunit 8 |
| chr2_-_224702740 | 0.33 |
ENST00000444408.1 |
AP1S3 |
adaptor-related protein complex 1, sigma 3 subunit |
| chr15_+_31658349 | 0.33 |
ENST00000558844.1 |
KLF13 |
Kruppel-like factor 13 |
| chrX_+_55744228 | 0.33 |
ENST00000262850.7 |
RRAGB |
Ras-related GTP binding B |
| chr17_+_55333876 | 0.33 |
ENST00000284073.2 |
MSI2 |
musashi RNA-binding protein 2 |
| chr1_+_109102652 | 0.33 |
ENST00000370035.3 ENST00000405454.1 |
FAM102B |
family with sequence similarity 102, member B |
| chr1_-_153522562 | 0.32 |
ENST00000368714.1 |
S100A4 |
S100 calcium binding protein A4 |
| chr5_+_176237478 | 0.32 |
ENST00000329542.4 |
UNC5A |
unc-5 homolog A (C. elegans) |
| chr5_-_43412418 | 0.32 |
ENST00000537013.1 ENST00000361115.4 |
CCL28 |
chemokine (C-C motif) ligand 28 |
| chr7_+_106809406 | 0.32 |
ENST00000468410.1 ENST00000478930.1 ENST00000464009.1 ENST00000222574.4 |
HBP1 |
HMG-box transcription factor 1 |
| chr5_-_64920115 | 0.32 |
ENST00000381018.3 ENST00000274327.7 |
TRIM23 |
tripartite motif containing 23 |
| chr17_-_79995553 | 0.32 |
ENST00000581584.1 ENST00000577712.1 ENST00000582900.1 ENST00000579155.1 ENST00000306869.2 |
DCXR |
dicarbonyl/L-xylulose reductase |
| chr1_-_26233423 | 0.32 |
ENST00000357865.2 |
STMN1 |
stathmin 1 |
| chr17_+_42923686 | 0.32 |
ENST00000591513.1 |
HIGD1B |
HIG1 hypoxia inducible domain family, member 1B |
| chr1_+_104198377 | 0.31 |
ENST00000370083.4 |
AMY1A |
amylase, alpha 1A (salivary) |
| chr12_+_3000037 | 0.31 |
ENST00000544943.1 ENST00000448120.2 |
TULP3 |
tubby like protein 3 |
| chr14_+_100531615 | 0.31 |
ENST00000392920.3 |
EVL |
Enah/Vasp-like |
| chr2_+_95537170 | 0.31 |
ENST00000295201.4 |
TEKT4 |
tektin 4 |
| chr3_+_156008809 | 0.31 |
ENST00000302490.8 |
KCNAB1 |
potassium voltage-gated channel, shaker-related subfamily, beta member 1 |
| chr19_+_56915668 | 0.31 |
ENST00000333201.9 ENST00000391778.3 |
ZNF583 |
zinc finger protein 583 |
| chr2_+_10560147 | 0.31 |
ENST00000422133.1 |
HPCAL1 |
hippocalcin-like 1 |
| chr12_+_55248289 | 0.30 |
ENST00000308796.6 |
MUCL1 |
mucin-like 1 |
| chr11_-_34937858 | 0.30 |
ENST00000278359.5 |
APIP |
APAF1 interacting protein |
| chr17_-_30186328 | 0.30 |
ENST00000302362.6 |
COPRS |
coordinator of PRMT5, differentiation stimulator |
| chr1_-_54411255 | 0.30 |
ENST00000371377.3 |
HSPB11 |
heat shock protein family B (small), member 11 |
| chr17_+_26698677 | 0.30 |
ENST00000457710.3 |
SARM1 |
sterile alpha and TIR motif containing 1 |
| chr15_+_27112948 | 0.30 |
ENST00000555060.1 |
GABRA5 |
gamma-aminobutyric acid (GABA) A receptor, alpha 5 |
| chr22_-_50708781 | 0.30 |
ENST00000449719.2 ENST00000330651.6 |
MAPK11 |
mitogen-activated protein kinase 11 |
| chr1_-_153599732 | 0.30 |
ENST00000392623.1 |
S100A13 |
S100 calcium binding protein A13 |
| chr3_+_11196206 | 0.29 |
ENST00000431010.2 |
HRH1 |
histamine receptor H1 |
| chr11_-_66103932 | 0.29 |
ENST00000311320.4 |
RIN1 |
Ras and Rab interactor 1 |
| chr14_-_39572279 | 0.29 |
ENST00000536508.1 |
SEC23A |
Sec23 homolog A (S. cerevisiae) |
Gene Ontology Analysis
Gene overrepresentation in biological_process category:
| Log-likelihood per target | Total log-likelihood | Term | Description |
|---|---|---|---|
| 0.6 | 1.9 | GO:0044537 | regulation of circulating fibrinogen levels(GO:0044537) |
| 0.4 | 5.5 | GO:0005984 | disaccharide metabolic process(GO:0005984) |
| 0.3 | 1.3 | GO:1904566 | response to 1-oleoyl-sn-glycerol 3-phosphate(GO:1904565) cellular response to 1-oleoyl-sn-glycerol 3-phosphate(GO:1904566) |
| 0.3 | 2.2 | GO:0010756 | positive regulation of plasminogen activation(GO:0010756) |
| 0.3 | 1.0 | GO:0046110 | xanthine metabolic process(GO:0046110) |
| 0.3 | 0.8 | GO:0006059 | hexitol metabolic process(GO:0006059) |
| 0.2 | 0.5 | GO:0009450 | gamma-aminobutyric acid catabolic process(GO:0009450) |
| 0.2 | 1.8 | GO:0070236 | negative regulation of activation-induced cell death of T cells(GO:0070236) |
| 0.2 | 0.8 | GO:0010900 | negative regulation of phosphatidylcholine catabolic process(GO:0010900) |
| 0.2 | 1.4 | GO:0060154 | cellular process regulating host cell cycle in response to virus(GO:0060154) |
| 0.2 | 0.7 | GO:0033634 | positive regulation of cell-cell adhesion mediated by integrin(GO:0033634) |
| 0.2 | 0.7 | GO:0060434 | bronchus morphogenesis(GO:0060434) |
| 0.2 | 0.5 | GO:0046005 | positive regulation of circadian sleep/wake cycle, REM sleep(GO:0046005) |
| 0.2 | 0.5 | GO:0006550 | isoleucine catabolic process(GO:0006550) |
| 0.1 | 0.3 | GO:2001184 | positive regulation of interleukin-12 secretion(GO:2001184) |
| 0.1 | 0.6 | GO:0048864 | stem cell development(GO:0048864) |
| 0.1 | 0.4 | GO:1903722 | regulation of centriole elongation(GO:1903722) |
| 0.1 | 1.9 | GO:0048843 | negative regulation of axon extension involved in axon guidance(GO:0048843) |
| 0.1 | 0.4 | GO:1904530 | negative regulation of actin filament binding(GO:1904530) negative regulation of actin binding(GO:1904617) |
| 0.1 | 0.7 | GO:1905098 | negative regulation of guanyl-nucleotide exchange factor activity(GO:1905098) |
| 0.1 | 0.4 | GO:0090310 | negative regulation of methylation-dependent chromatin silencing(GO:0090310) |
| 0.1 | 0.4 | GO:1902683 | regulation of receptor localization to synapse(GO:1902683) |
| 0.1 | 1.1 | GO:0070779 | D-aspartate transport(GO:0070777) D-aspartate import(GO:0070779) |
| 0.1 | 0.6 | GO:0010746 | regulation of plasma membrane long-chain fatty acid transport(GO:0010746) negative regulation of plasma membrane long-chain fatty acid transport(GO:0010748) |
| 0.1 | 3.0 | GO:0071447 | cellular response to hydroperoxide(GO:0071447) |
| 0.1 | 0.5 | GO:0032848 | negative regulation of cellular pH reduction(GO:0032848) CD8-positive, alpha-beta T cell lineage commitment(GO:0043375) negative regulation of retinal cell programmed cell death(GO:0046671) |
| 0.1 | 0.5 | GO:2000537 | regulation of cGMP-mediated signaling(GO:0010752) regulation of B cell chemotaxis(GO:2000537) positive regulation of B cell chemotaxis(GO:2000538) |
| 0.1 | 0.4 | GO:0003185 | primary heart field specification(GO:0003138) sinoatrial valve development(GO:0003172) sinoatrial valve morphogenesis(GO:0003185) |
| 0.1 | 0.3 | GO:0042732 | D-xylose metabolic process(GO:0042732) |
| 0.1 | 0.3 | GO:1904346 | positive regulation of growth rate(GO:0040010) regulation of gastric mucosal blood circulation(GO:1904344) positive regulation of gastric mucosal blood circulation(GO:1904346) gastric mucosal blood circulation(GO:1990768) |
| 0.1 | 1.7 | GO:0098828 | positive regulation of inhibitory postsynaptic potential(GO:0097151) modulation of inhibitory postsynaptic potential(GO:0098828) |
| 0.1 | 0.6 | GO:0072674 | multinuclear osteoclast differentiation(GO:0072674) osteoclast fusion(GO:0072675) |
| 0.1 | 1.0 | GO:0043985 | histone H4-R3 methylation(GO:0043985) |
| 0.1 | 0.5 | GO:0015670 | carbon dioxide transport(GO:0015670) |
| 0.1 | 0.9 | GO:0031087 | deadenylation-independent decapping of nuclear-transcribed mRNA(GO:0031087) |
| 0.1 | 0.3 | GO:0010621 | negative regulation of transcription by transcription factor localization(GO:0010621) gall bladder development(GO:0061010) |
| 0.1 | 0.7 | GO:1990253 | cellular response to leucine starvation(GO:1990253) |
| 0.1 | 0.6 | GO:0019856 | 'de novo' pyrimidine nucleobase biosynthetic process(GO:0006207) pyrimidine nucleobase biosynthetic process(GO:0019856) |
| 0.1 | 1.0 | GO:2000680 | rubidium ion transport(GO:0035826) regulation of rubidium ion transport(GO:2000680) |
| 0.1 | 1.2 | GO:0010529 | regulation of transposition(GO:0010528) negative regulation of transposition(GO:0010529) |
| 0.1 | 0.2 | GO:0045085 | negative regulation of interleukin-2 biosynthetic process(GO:0045085) |
| 0.1 | 0.4 | GO:0070682 | proteasome regulatory particle assembly(GO:0070682) |
| 0.1 | 0.5 | GO:1990539 | fructose transport(GO:0015755) fructose import(GO:0032445) carbohydrate import into cell(GO:0097319) carbohydrate import across plasma membrane(GO:0098704) fructose import across plasma membrane(GO:1990539) |
| 0.1 | 1.1 | GO:1900273 | positive regulation of long-term synaptic potentiation(GO:1900273) |
| 0.1 | 0.4 | GO:0006065 | UDP-glucuronate biosynthetic process(GO:0006065) |
| 0.1 | 0.3 | GO:0003219 | cardiac right ventricle formation(GO:0003219) |
| 0.1 | 0.6 | GO:0070269 | pyroptosis(GO:0070269) |
| 0.1 | 0.5 | GO:0045079 | negative regulation of chemokine biosynthetic process(GO:0045079) |
| 0.1 | 0.3 | GO:0010816 | substance P catabolic process(GO:0010814) calcitonin catabolic process(GO:0010816) endothelin maturation(GO:0034959) |
| 0.1 | 0.5 | GO:0033590 | response to cobalamin(GO:0033590) |
| 0.1 | 0.6 | GO:1903361 | protein localization to basolateral plasma membrane(GO:1903361) |
| 0.1 | 0.2 | GO:0016999 | antibiotic metabolic process(GO:0016999) |
| 0.1 | 0.2 | GO:0071418 | cellular response to amine stimulus(GO:0071418) |
| 0.1 | 0.3 | GO:1902613 | regulation of anti-Mullerian hormone signaling pathway(GO:1902612) negative regulation of anti-Mullerian hormone signaling pathway(GO:1902613) anti-Mullerian hormone signaling pathway(GO:1990262) |
| 0.1 | 0.1 | GO:0060265 | positive regulation of respiratory burst involved in inflammatory response(GO:0060265) |
| 0.1 | 0.2 | GO:2000564 | CD8-positive, alpha-beta T cell proliferation(GO:0035740) regulation of CD8-positive, alpha-beta T cell proliferation(GO:2000564) |
| 0.1 | 0.3 | GO:0051490 | negative regulation of filopodium assembly(GO:0051490) |
| 0.1 | 0.3 | GO:0048808 | male genitalia morphogenesis(GO:0048808) male anatomical structure morphogenesis(GO:0090598) |
| 0.1 | 0.2 | GO:0035720 | intraciliary anterograde transport(GO:0035720) ciliary receptor clustering involved in smoothened signaling pathway(GO:0060830) |
| 0.1 | 0.6 | GO:0050703 | interleukin-1 alpha secretion(GO:0050703) |
| 0.1 | 0.5 | GO:0050428 | purine ribonucleoside bisphosphate biosynthetic process(GO:0034036) 3'-phosphoadenosine 5'-phosphosulfate biosynthetic process(GO:0050428) |
| 0.1 | 0.7 | GO:0090336 | positive regulation of brown fat cell differentiation(GO:0090336) |
| 0.1 | 1.4 | GO:0001829 | trophectodermal cell differentiation(GO:0001829) |
| 0.1 | 1.0 | GO:1901750 | leukotriene D4 metabolic process(GO:1901748) leukotriene D4 biosynthetic process(GO:1901750) |
| 0.1 | 0.3 | GO:0043553 | negative regulation of phosphatidylinositol 3-kinase activity(GO:0043553) |
| 0.1 | 0.3 | GO:1903237 | negative regulation of leukocyte tethering or rolling(GO:1903237) |
| 0.1 | 0.2 | GO:0071301 | cellular response to vitamin B1(GO:0071301) response to formaldehyde(GO:1904404) |
| 0.1 | 0.4 | GO:1990034 | cellular response to corticosterone stimulus(GO:0071386) calcium ion export from cell(GO:1990034) |
| 0.1 | 0.3 | GO:0008065 | establishment of blood-nerve barrier(GO:0008065) |
| 0.1 | 4.8 | GO:0001895 | retina homeostasis(GO:0001895) |
| 0.1 | 0.2 | GO:0021849 | neuroblast division in subventricular zone(GO:0021849) |
| 0.0 | 0.6 | GO:0036066 | protein O-linked fucosylation(GO:0036066) |
| 0.0 | 0.4 | GO:0010890 | positive regulation of sequestering of triglyceride(GO:0010890) |
| 0.0 | 0.1 | GO:1990868 | response to chemokine(GO:1990868) cellular response to chemokine(GO:1990869) |
| 0.0 | 0.2 | GO:0010793 | regulation of mRNA export from nucleus(GO:0010793) |
| 0.0 | 0.3 | GO:0033564 | anterior/posterior axon guidance(GO:0033564) |
| 0.0 | 0.4 | GO:2000825 | positive regulation of androgen receptor activity(GO:2000825) |
| 0.0 | 0.2 | GO:0010643 | cell communication by chemical coupling(GO:0010643) |
| 0.0 | 0.3 | GO:0035965 | cardiolipin acyl-chain remodeling(GO:0035965) |
| 0.0 | 0.7 | GO:0018298 | protein-chromophore linkage(GO:0018298) |
| 0.0 | 0.1 | GO:0002337 | B-1a B cell differentiation(GO:0002337) |
| 0.0 | 0.2 | GO:0043323 | regulation of natural killer cell degranulation(GO:0043321) positive regulation of natural killer cell degranulation(GO:0043323) |
| 0.0 | 0.2 | GO:0033591 | response to L-ascorbic acid(GO:0033591) |
| 0.0 | 0.6 | GO:0019388 | galactose catabolic process(GO:0019388) |
| 0.0 | 0.3 | GO:0031914 | negative regulation of synaptic plasticity(GO:0031914) |
| 0.0 | 0.3 | GO:0045647 | negative regulation of erythrocyte differentiation(GO:0045647) |
| 0.0 | 0.2 | GO:0010847 | regulation of chromatin assembly(GO:0010847) negative regulation of protein import into nucleus, translocation(GO:0033159) protein auto-ADP-ribosylation(GO:0070213) |
| 0.0 | 0.2 | GO:0032474 | otolith morphogenesis(GO:0032474) |
| 0.0 | 0.3 | GO:0035234 | ectopic germ cell programmed cell death(GO:0035234) |
| 0.0 | 0.1 | GO:0032289 | central nervous system myelin formation(GO:0032289) |
| 0.0 | 0.4 | GO:1903608 | protein localization to cytoplasmic stress granule(GO:1903608) |
| 0.0 | 0.2 | GO:0046984 | regulation of translational initiation by iron(GO:0006447) regulation of hemoglobin biosynthetic process(GO:0046984) |
| 0.0 | 1.5 | GO:0061014 | positive regulation of mRNA catabolic process(GO:0061014) |
| 0.0 | 0.2 | GO:0035726 | common myeloid progenitor cell proliferation(GO:0035726) |
| 0.0 | 1.3 | GO:2000810 | regulation of bicellular tight junction assembly(GO:2000810) |
| 0.0 | 0.1 | GO:0046338 | phosphatidylethanolamine catabolic process(GO:0046338) |
| 0.0 | 0.3 | GO:0032962 | regulation of inositol trisphosphate biosynthetic process(GO:0032960) positive regulation of inositol trisphosphate biosynthetic process(GO:0032962) |
| 0.0 | 0.3 | GO:0046836 | glycolipid transport(GO:0046836) |
| 0.0 | 0.1 | GO:0006419 | alanyl-tRNA aminoacylation(GO:0006419) |
| 0.0 | 0.4 | GO:0007144 | female meiosis I(GO:0007144) |
| 0.0 | 0.2 | GO:1903300 | negative regulation of glucokinase activity(GO:0033132) negative regulation of hexokinase activity(GO:1903300) |
| 0.0 | 0.1 | GO:0006404 | RNA import into nucleus(GO:0006404) |
| 0.0 | 0.2 | GO:0006842 | tricarboxylic acid transport(GO:0006842) citrate transport(GO:0015746) |
| 0.0 | 0.3 | GO:0034128 | negative regulation of MyD88-independent toll-like receptor signaling pathway(GO:0034128) |
| 0.0 | 0.4 | GO:0035646 | endosome to melanosome transport(GO:0035646) endosome to pigment granule transport(GO:0043485) pigment granule maturation(GO:0048757) |
| 0.0 | 0.1 | GO:0017186 | peptidyl-pyroglutamic acid biosynthetic process, using glutaminyl-peptide cyclotransferase(GO:0017186) |
| 0.0 | 1.0 | GO:0008045 | motor neuron axon guidance(GO:0008045) |
| 0.0 | 0.1 | GO:0072061 | inner medullary collecting duct development(GO:0072061) |
| 0.0 | 0.4 | GO:1904262 | negative regulation of TORC1 signaling(GO:1904262) |
| 0.0 | 0.6 | GO:0006554 | lysine catabolic process(GO:0006554) |
| 0.0 | 0.2 | GO:2000048 | negative regulation of cell-cell adhesion mediated by cadherin(GO:2000048) |
| 0.0 | 0.2 | GO:0072734 | response to staurosporine(GO:0072733) cellular response to staurosporine(GO:0072734) |
| 0.0 | 0.3 | GO:0032510 | endosome to lysosome transport via multivesicular body sorting pathway(GO:0032510) |
| 0.0 | 0.1 | GO:2000502 | negative regulation of natural killer cell chemotaxis(GO:2000502) |
| 0.0 | 0.1 | GO:1902268 | negative regulation of polyamine transmembrane transport(GO:1902268) |
| 0.0 | 0.2 | GO:0008218 | bioluminescence(GO:0008218) |
| 0.0 | 0.1 | GO:0035511 | oxidative DNA demethylation(GO:0035511) |
| 0.0 | 0.1 | GO:0022007 | neural plate elongation(GO:0014022) convergent extension involved in neural plate elongation(GO:0022007) |
| 0.0 | 0.1 | GO:0006627 | protein processing involved in protein targeting to mitochondrion(GO:0006627) |
| 0.0 | 0.2 | GO:0070671 | interleukin-12-mediated signaling pathway(GO:0035722) response to interleukin-12(GO:0070671) cellular response to interleukin-12(GO:0071349) |
| 0.0 | 0.4 | GO:0046185 | aldehyde catabolic process(GO:0046185) |
| 0.0 | 0.3 | GO:0072383 | plus-end-directed vesicle transport along microtubule(GO:0072383) |
| 0.0 | 0.4 | GO:0070307 | lens fiber cell development(GO:0070307) |
| 0.0 | 0.3 | GO:1900028 | negative regulation of ruffle assembly(GO:1900028) |
| 0.0 | 0.2 | GO:0003056 | regulation of vascular smooth muscle contraction(GO:0003056) |
| 0.0 | 0.1 | GO:0010902 | positive regulation of very-low-density lipoprotein particle remodeling(GO:0010902) |
| 0.0 | 0.1 | GO:2000397 | regulation of ubiquitin-dependent endocytosis(GO:2000395) positive regulation of ubiquitin-dependent endocytosis(GO:2000397) |
| 0.0 | 0.5 | GO:0090110 | cargo loading into COPII-coated vesicle(GO:0090110) |
| 0.0 | 0.3 | GO:0015747 | urate transport(GO:0015747) |
| 0.0 | 0.4 | GO:0034587 | piRNA metabolic process(GO:0034587) |
| 0.0 | 0.1 | GO:0061767 | negative regulation of lung blood pressure(GO:0061767) |
| 0.0 | 0.4 | GO:0090129 | positive regulation of synapse maturation(GO:0090129) |
| 0.0 | 0.4 | GO:0071420 | cellular response to histamine(GO:0071420) |
| 0.0 | 0.1 | GO:0006015 | 5-phosphoribose 1-diphosphate biosynthetic process(GO:0006015) 5-phosphoribose 1-diphosphate metabolic process(GO:0046391) |
| 0.0 | 0.1 | GO:1902534 | single-organism membrane invagination(GO:1902534) |
| 0.0 | 0.1 | GO:0007418 | ventral midline development(GO:0007418) smoothened signaling pathway involved in regulation of cerebellar granule cell precursor cell proliferation(GO:0021938) |
| 0.0 | 0.3 | GO:0006054 | N-acetylneuraminate metabolic process(GO:0006054) |
| 0.0 | 0.1 | GO:1903377 | negative regulation of oxidative stress-induced neuron intrinsic apoptotic signaling pathway(GO:1903377) |
| 0.0 | 0.1 | GO:0033594 | response to hydroxyisoflavone(GO:0033594) |
| 0.0 | 0.5 | GO:0007220 | Notch receptor processing(GO:0007220) |
| 0.0 | 0.2 | GO:0016081 | synaptic vesicle docking(GO:0016081) |
| 0.0 | 0.3 | GO:0045008 | depyrimidination(GO:0045008) |
| 0.0 | 0.1 | GO:0043297 | apical junction assembly(GO:0043297) bicellular tight junction assembly(GO:0070830) |
| 0.0 | 0.1 | GO:0045829 | negative regulation of isotype switching(GO:0045829) |
| 0.0 | 0.2 | GO:0048703 | embryonic viscerocranium morphogenesis(GO:0048703) |
| 0.0 | 0.5 | GO:0006488 | dolichol-linked oligosaccharide biosynthetic process(GO:0006488) |
| 0.0 | 0.1 | GO:0031860 | telomeric 3' overhang formation(GO:0031860) |
| 0.0 | 0.1 | GO:0000710 | meiotic mismatch repair(GO:0000710) |
| 0.0 | 0.3 | GO:0070070 | proton-transporting V-type ATPase complex assembly(GO:0070070) vacuolar proton-transporting V-type ATPase complex assembly(GO:0070072) |
| 0.0 | 0.2 | GO:0046549 | retinal cone cell differentiation(GO:0042670) retinal cone cell development(GO:0046549) |
| 0.0 | 0.0 | GO:0061386 | closure of optic fissure(GO:0061386) |
| 0.0 | 0.3 | GO:1903817 | negative regulation of delayed rectifier potassium channel activity(GO:1902260) negative regulation of voltage-gated potassium channel activity(GO:1903817) |
| 0.0 | 0.1 | GO:0051697 | protein delipidation(GO:0051697) |
| 0.0 | 0.2 | GO:0048102 | autophagic cell death(GO:0048102) |
| 0.0 | 0.2 | GO:1902659 | regulation of glucose mediated signaling pathway(GO:1902659) |
| 0.0 | 0.1 | GO:0008628 | hormone-mediated apoptotic signaling pathway(GO:0008628) somatostatin receptor signaling pathway(GO:0038169) somatostatin signaling pathway(GO:0038170) |
| 0.0 | 0.3 | GO:0070986 | left/right axis specification(GO:0070986) |
| 0.0 | 0.1 | GO:1902527 | positive regulation of protein monoubiquitination(GO:1902527) |
| 0.0 | 0.1 | GO:0040032 | post-embryonic body morphogenesis(GO:0040032) |
| 0.0 | 0.2 | GO:0008635 | activation of cysteine-type endopeptidase activity involved in apoptotic process by cytochrome c(GO:0008635) |
| 0.0 | 0.5 | GO:0009251 | glycogen catabolic process(GO:0005980) glucan catabolic process(GO:0009251) cellular polysaccharide catabolic process(GO:0044247) |
| 0.0 | 0.4 | GO:0000028 | ribosomal small subunit assembly(GO:0000028) |
| 0.0 | 0.1 | GO:0033567 | DNA replication, Okazaki fragment processing(GO:0033567) |
| 0.0 | 0.8 | GO:0050690 | regulation of defense response to virus by virus(GO:0050690) |
| 0.0 | 0.3 | GO:0031639 | plasminogen activation(GO:0031639) |
| 0.0 | 0.2 | GO:0071550 | death-inducing signaling complex assembly(GO:0071550) |
| 0.0 | 0.2 | GO:0010265 | SCF complex assembly(GO:0010265) |
| 0.0 | 0.1 | GO:1902746 | regulation of lens fiber cell differentiation(GO:1902746) |
| 0.0 | 0.5 | GO:0009954 | proximal/distal pattern formation(GO:0009954) |
| 0.0 | 0.2 | GO:0045023 | G0 to G1 transition(GO:0045023) |
| 0.0 | 0.3 | GO:0044872 | lipoprotein transport(GO:0042953) lipoprotein localization(GO:0044872) |
| 0.0 | 0.3 | GO:0042552 | myelination(GO:0042552) |
| 0.0 | 0.1 | GO:0035021 | negative regulation of Rac protein signal transduction(GO:0035021) |
| 0.0 | 0.3 | GO:0033617 | mitochondrial respiratory chain complex IV assembly(GO:0033617) mitochondrial respiratory chain complex IV biogenesis(GO:0097034) |
| 0.0 | 0.8 | GO:0070979 | protein K11-linked ubiquitination(GO:0070979) |
| 0.0 | 0.2 | GO:0046069 | cGMP catabolic process(GO:0046069) |
| 0.0 | 0.1 | GO:0006012 | galactose metabolic process(GO:0006012) |
| 0.0 | 0.0 | GO:0060011 | Sertoli cell proliferation(GO:0060011) |
| 0.0 | 0.5 | GO:0035338 | long-chain fatty-acyl-CoA biosynthetic process(GO:0035338) |
| 0.0 | 0.2 | GO:0035729 | cellular response to hepatocyte growth factor stimulus(GO:0035729) |
| 0.0 | 1.3 | GO:0045669 | positive regulation of osteoblast differentiation(GO:0045669) |
| 0.0 | 0.1 | GO:0051725 | protein de-ADP-ribosylation(GO:0051725) |
| 0.0 | 0.4 | GO:0035428 | hexose transmembrane transport(GO:0035428) glucose transmembrane transport(GO:1904659) |
| 0.0 | 0.0 | GO:0061181 | regulation of chondrocyte development(GO:0061181) |
| 0.0 | 0.2 | GO:0019852 | L-ascorbic acid metabolic process(GO:0019852) |
| 0.0 | 0.5 | GO:0071711 | basement membrane organization(GO:0071711) |
| 0.0 | 0.1 | GO:0051970 | negative regulation of transmission of nerve impulse(GO:0051970) |
| 0.0 | 0.1 | GO:1901796 | regulation of signal transduction by p53 class mediator(GO:1901796) |
| 0.0 | 0.2 | GO:0033327 | Leydig cell differentiation(GO:0033327) |
| 0.0 | 0.1 | GO:2000860 | positive regulation of mineralocorticoid secretion(GO:2000857) positive regulation of aldosterone secretion(GO:2000860) |
| 0.0 | 1.0 | GO:0034113 | heterotypic cell-cell adhesion(GO:0034113) |
| 0.0 | 0.4 | GO:1901685 | glutathione derivative metabolic process(GO:1901685) glutathione derivative biosynthetic process(GO:1901687) |
| 0.0 | 0.1 | GO:0015939 | pantothenate metabolic process(GO:0015939) |
| 0.0 | 0.3 | GO:0008356 | asymmetric cell division(GO:0008356) |
| 0.0 | 0.6 | GO:0050885 | neuromuscular process controlling balance(GO:0050885) |
| 0.0 | 0.1 | GO:0033615 | mitochondrial proton-transporting ATP synthase complex assembly(GO:0033615) |
| 0.0 | 0.6 | GO:0048286 | lung alveolus development(GO:0048286) |
| 0.0 | 0.1 | GO:0048280 | vesicle fusion with Golgi apparatus(GO:0048280) |
| 0.0 | 0.2 | GO:0033687 | osteoblast proliferation(GO:0033687) |
| 0.0 | 0.4 | GO:0030252 | growth hormone secretion(GO:0030252) |
| 0.0 | 0.5 | GO:0007517 | muscle organ development(GO:0007517) |
| 0.0 | 0.1 | GO:0051592 | response to calcium ion(GO:0051592) |
| 0.0 | 0.1 | GO:0045907 | positive regulation of vasoconstriction(GO:0045907) |
| 0.0 | 0.3 | GO:0034243 | regulation of transcription elongation from RNA polymerase II promoter(GO:0034243) |
| 0.0 | 0.1 | GO:0070233 | negative regulation of T cell apoptotic process(GO:0070233) |
| 0.0 | 0.4 | GO:0045724 | positive regulation of cilium assembly(GO:0045724) |
| 0.0 | 0.2 | GO:0006020 | inositol metabolic process(GO:0006020) |
| 0.0 | 0.1 | GO:0072592 | oxygen metabolic process(GO:0072592) |
Gene overrepresentation in cellular_component category:
| Log-likelihood per target | Total log-likelihood | Term | Description |
|---|---|---|---|
| 0.4 | 2.2 | GO:0001652 | granular component(GO:0001652) |
| 0.2 | 1.6 | GO:0030015 | CCR4-NOT core complex(GO:0030015) |
| 0.1 | 0.9 | GO:0008537 | proteasome activator complex(GO:0008537) |
| 0.1 | 0.7 | GO:1990131 | Gtr1-Gtr2 GTPase complex(GO:1990131) |
| 0.1 | 1.4 | GO:0097136 | Bcl-2 family protein complex(GO:0097136) |
| 0.1 | 4.7 | GO:0046658 | anchored component of plasma membrane(GO:0046658) |
| 0.1 | 0.9 | GO:0030991 | intraciliary transport particle A(GO:0030991) |
| 0.1 | 1.2 | GO:0097487 | multivesicular body, internal vesicle(GO:0097487) |
| 0.1 | 0.3 | GO:0043291 | RAVE complex(GO:0043291) |
| 0.1 | 0.7 | GO:0036056 | filtration diaphragm(GO:0036056) slit diaphragm(GO:0036057) |
| 0.1 | 0.3 | GO:0031302 | intrinsic component of endosome membrane(GO:0031302) |
| 0.1 | 1.2 | GO:0012510 | trans-Golgi network transport vesicle membrane(GO:0012510) |
| 0.1 | 0.2 | GO:0035189 | Rb-E2F complex(GO:0035189) |
| 0.1 | 0.4 | GO:1990130 | Iml1 complex(GO:1990130) |
| 0.1 | 0.5 | GO:0097425 | smooth endoplasmic reticulum membrane(GO:0030868) smooth endoplasmic reticulum part(GO:0097425) |
| 0.1 | 0.4 | GO:0097165 | nuclear stress granule(GO:0097165) |
| 0.0 | 0.4 | GO:0043196 | varicosity(GO:0043196) |
| 0.0 | 0.2 | GO:0031501 | mannosyltransferase complex(GO:0031501) |
| 0.0 | 0.4 | GO:0071546 | pi-body(GO:0071546) |
| 0.0 | 0.3 | GO:1990635 | proximal dendrite(GO:1990635) |
| 0.0 | 0.6 | GO:0097025 | MPP7-DLG1-LIN7 complex(GO:0097025) |
| 0.0 | 0.3 | GO:0016272 | prefoldin complex(GO:0016272) |
| 0.0 | 1.1 | GO:0042627 | chylomicron(GO:0042627) |
| 0.0 | 0.5 | GO:0070765 | gamma-secretase complex(GO:0070765) |
| 0.0 | 0.7 | GO:0097539 | ciliary transition fiber(GO:0097539) |
| 0.0 | 0.1 | GO:0032301 | MutSalpha complex(GO:0032301) |
| 0.0 | 0.2 | GO:0000408 | EKC/KEOPS complex(GO:0000408) |
| 0.0 | 0.3 | GO:0071203 | WASH complex(GO:0071203) |
| 0.0 | 0.5 | GO:0000815 | ESCRT III complex(GO:0000815) |
| 0.0 | 0.2 | GO:0016035 | zeta DNA polymerase complex(GO:0016035) |
| 0.0 | 0.7 | GO:0005614 | interstitial matrix(GO:0005614) |
| 0.0 | 0.1 | GO:0071159 | NF-kappaB complex(GO:0071159) |
| 0.0 | 0.5 | GO:0017146 | NMDA selective glutamate receptor complex(GO:0017146) |
| 0.0 | 0.2 | GO:0033165 | interphotoreceptor matrix(GO:0033165) |
| 0.0 | 0.1 | GO:0002189 | ribose phosphate diphosphokinase complex(GO:0002189) |
| 0.0 | 0.2 | GO:0097129 | cyclin D2-CDK4 complex(GO:0097129) |
| 0.0 | 0.2 | GO:0005638 | lamin filament(GO:0005638) |
| 0.0 | 1.4 | GO:0048786 | presynaptic active zone(GO:0048786) |
| 0.0 | 0.3 | GO:0033269 | internode region of axon(GO:0033269) |
| 0.0 | 0.1 | GO:0016600 | flotillin complex(GO:0016600) |
| 0.0 | 0.2 | GO:0034385 | very-low-density lipoprotein particle(GO:0034361) triglyceride-rich lipoprotein particle(GO:0034385) |
| 0.0 | 0.2 | GO:0070847 | core mediator complex(GO:0070847) |
| 0.0 | 0.7 | GO:0097381 | photoreceptor disc membrane(GO:0097381) |
| 0.0 | 0.3 | GO:0035686 | sperm fibrous sheath(GO:0035686) |
| 0.0 | 0.7 | GO:1902711 | GABA-A receptor complex(GO:1902711) |
| 0.0 | 0.5 | GO:0046930 | pore complex(GO:0046930) |
| 0.0 | 0.8 | GO:0005680 | anaphase-promoting complex(GO:0005680) |
| 0.0 | 1.6 | GO:0030669 | clathrin-coated endocytic vesicle membrane(GO:0030669) |
| 0.0 | 0.1 | GO:0030906 | retromer, cargo-selective complex(GO:0030906) |
| 0.0 | 0.3 | GO:0030897 | HOPS complex(GO:0030897) |
| 0.0 | 0.7 | GO:0042629 | mast cell granule(GO:0042629) |
| 0.0 | 0.4 | GO:0008540 | proteasome regulatory particle, base subcomplex(GO:0008540) |
| 0.0 | 1.2 | GO:0043198 | dendritic shaft(GO:0043198) |
| 0.0 | 0.4 | GO:0032591 | dendritic spine membrane(GO:0032591) |
| 0.0 | 0.2 | GO:0031467 | Cul7-RING ubiquitin ligase complex(GO:0031467) |
| 0.0 | 1.1 | GO:0008305 | integrin complex(GO:0008305) |
| 0.0 | 0.1 | GO:0098636 | protein complex involved in cell adhesion(GO:0098636) |
| 0.0 | 0.5 | GO:0035327 | transcriptionally active chromatin(GO:0035327) |
| 0.0 | 2.5 | GO:0005796 | Golgi lumen(GO:0005796) |
| 0.0 | 0.3 | GO:0033270 | paranode region of axon(GO:0033270) |
| 0.0 | 0.2 | GO:0005853 | eukaryotic translation elongation factor 1 complex(GO:0005853) |
| 0.0 | 0.3 | GO:0000800 | lateral element(GO:0000800) |
| 0.0 | 0.1 | GO:0031262 | Ndc80 complex(GO:0031262) |
| 0.0 | 0.2 | GO:0042788 | polysomal ribosome(GO:0042788) |
| 0.0 | 0.1 | GO:0071144 | SMAD2-SMAD3 protein complex(GO:0071144) |
| 0.0 | 0.1 | GO:0042719 | mitochondrial intermembrane space protein transporter complex(GO:0042719) |
| 0.0 | 0.0 | GO:0031838 | haptoglobin-hemoglobin complex(GO:0031838) |
| 0.0 | 0.4 | GO:0071782 | endoplasmic reticulum tubular network(GO:0071782) |
| 0.0 | 0.1 | GO:1990604 | IRE1-TRAF2-ASK1 complex(GO:1990604) |
| 0.0 | 0.1 | GO:0071817 | MMXD complex(GO:0071817) |
| 0.0 | 0.3 | GO:0071565 | nBAF complex(GO:0071565) |
| 0.0 | 0.1 | GO:0000445 | THO complex(GO:0000347) THO complex part of transcription export complex(GO:0000445) |
| 0.0 | 0.6 | GO:0071339 | MLL1/2 complex(GO:0044665) MLL1 complex(GO:0071339) |
| 0.0 | 0.7 | GO:0005844 | polysome(GO:0005844) |
| 0.0 | 0.5 | GO:0009925 | basal plasma membrane(GO:0009925) |
| 0.0 | 0.1 | GO:0031464 | Cul4A-RING E3 ubiquitin ligase complex(GO:0031464) |
| 0.0 | 0.3 | GO:0030992 | intraciliary transport particle B(GO:0030992) |
| 0.0 | 0.3 | GO:0032391 | photoreceptor connecting cilium(GO:0032391) |
| 0.0 | 0.3 | GO:0080008 | Cul4-RING E3 ubiquitin ligase complex(GO:0080008) |
Gene overrepresentation in molecular_function category:
| Log-likelihood per target | Total log-likelihood | Term | Description |
|---|---|---|---|
| 0.5 | 1.9 | GO:0035373 | chondroitin sulfate proteoglycan binding(GO:0035373) |
| 0.3 | 1.0 | GO:0004031 | aldehyde oxidase activity(GO:0004031) |
| 0.2 | 0.9 | GO:0004335 | galactokinase activity(GO:0004335) |
| 0.2 | 2.0 | GO:0043426 | MRF binding(GO:0043426) |
| 0.2 | 1.0 | GO:0047844 | deoxycytidine deaminase activity(GO:0047844) |
| 0.2 | 1.9 | GO:0051434 | BH3 domain binding(GO:0051434) |
| 0.2 | 0.5 | GO:0043423 | 3-phosphoinositide-dependent protein kinase binding(GO:0043423) |
| 0.2 | 0.5 | GO:0000253 | 3-keto sterol reductase activity(GO:0000253) |
| 0.2 | 1.1 | GO:0015501 | glutamate:sodium symporter activity(GO:0015501) |
| 0.1 | 0.4 | GO:0070579 | methylcytosine dioxygenase activity(GO:0070579) |
| 0.1 | 0.6 | GO:0009041 | uridylate kinase activity(GO:0009041) |
| 0.1 | 0.5 | GO:0008184 | glycogen phosphorylase activity(GO:0008184) |
| 0.1 | 1.3 | GO:0035727 | lysophosphatidic acid binding(GO:0035727) |
| 0.1 | 0.6 | GO:0008453 | alanine-glyoxylate transaminase activity(GO:0008453) |
| 0.1 | 0.6 | GO:0047179 | platelet-activating factor acetyltransferase activity(GO:0047179) |
| 0.1 | 0.9 | GO:0061133 | endopeptidase activator activity(GO:0061133) |
| 0.1 | 0.3 | GO:0031768 | ghrelin receptor binding(GO:0031768) |
| 0.1 | 0.3 | GO:0008969 | phosphohistidine phosphatase activity(GO:0008969) |
| 0.1 | 0.3 | GO:0036313 | phosphatidylinositol 3-kinase catalytic subunit binding(GO:0036313) |
| 0.1 | 0.9 | GO:0060228 | phosphatidylcholine-sterol O-acyltransferase activator activity(GO:0060228) |
| 0.1 | 3.2 | GO:0017075 | syntaxin-1 binding(GO:0017075) |
| 0.1 | 0.8 | GO:0005412 | glucose:sodium symporter activity(GO:0005412) |
| 0.1 | 0.6 | GO:0004614 | phosphoglucomutase activity(GO:0004614) |
| 0.1 | 0.3 | GO:0051500 | D-aminoacyl-tRNA deacylase activity(GO:0051499) D-tyrosyl-tRNA(Tyr) deacylase activity(GO:0051500) |
| 0.1 | 0.3 | GO:0016160 | amylase activity(GO:0016160) |
| 0.1 | 0.5 | GO:0052656 | branched-chain-amino-acid transaminase activity(GO:0004084) L-leucine transaminase activity(GO:0052654) L-valine transaminase activity(GO:0052655) L-isoleucine transaminase activity(GO:0052656) |
| 0.1 | 0.5 | GO:0005353 | fructose transmembrane transporter activity(GO:0005353) |
| 0.1 | 0.3 | GO:0017089 | glycolipid transporter activity(GO:0017089) |
| 0.1 | 1.6 | GO:0004535 | poly(A)-specific ribonuclease activity(GO:0004535) |
| 0.1 | 0.3 | GO:0004616 | phosphogluconate dehydrogenase (decarboxylating) activity(GO:0004616) |
| 0.1 | 0.2 | GO:0004852 | uroporphyrinogen-III synthase activity(GO:0004852) |
| 0.1 | 0.9 | GO:0031681 | G-protein beta-subunit binding(GO:0031681) |
| 0.1 | 0.2 | GO:0004886 | 9-cis retinoic acid receptor activity(GO:0004886) |
| 0.1 | 0.5 | GO:0004499 | N,N-dimethylaniline monooxygenase activity(GO:0004499) |
| 0.1 | 0.2 | GO:0070052 | collagen V binding(GO:0070052) |
| 0.1 | 0.6 | GO:0097016 | L27 domain binding(GO:0097016) |
| 0.1 | 1.0 | GO:0036374 | glutathione hydrolase activity(GO:0036374) |
| 0.1 | 0.7 | GO:0008020 | G-protein coupled photoreceptor activity(GO:0008020) |
| 0.1 | 0.2 | GO:0061663 | NEDD8 ligase activity(GO:0061663) |
| 0.1 | 0.3 | GO:0016509 | long-chain-3-hydroxyacyl-CoA dehydrogenase activity(GO:0016509) |
| 0.1 | 0.2 | GO:0102007 | lactonohydrolase activity(GO:0046573) acyl-L-homoserine-lactone lactonohydrolase activity(GO:0102007) |
| 0.0 | 1.3 | GO:0070300 | phosphatidic acid binding(GO:0070300) |
| 0.0 | 1.1 | GO:0005024 | transforming growth factor beta-activated receptor activity(GO:0005024) |
| 0.0 | 0.2 | GO:0004376 | glycolipid mannosyltransferase activity(GO:0004376) |
| 0.0 | 0.1 | GO:0050659 | N-acetylgalactosamine 4-sulfate 6-O-sulfotransferase activity(GO:0050659) |
| 0.0 | 0.2 | GO:0042289 | MHC class II protein binding(GO:0042289) |
| 0.0 | 0.3 | GO:0050815 | phosphoserine binding(GO:0050815) |
| 0.0 | 0.5 | GO:0019531 | oxalate transmembrane transporter activity(GO:0019531) |
| 0.0 | 0.1 | GO:0008502 | melatonin receptor activity(GO:0008502) |
| 0.0 | 0.2 | GO:0004694 | eukaryotic translation initiation factor 2alpha kinase activity(GO:0004694) |
| 0.0 | 0.2 | GO:1902444 | riboflavin binding(GO:1902444) |
| 0.0 | 0.1 | GO:0004813 | alanine-tRNA ligase activity(GO:0004813) |
| 0.0 | 0.1 | GO:0004667 | prostaglandin-D synthase activity(GO:0004667) |
| 0.0 | 0.1 | GO:0035514 | DNA demethylase activity(GO:0035514) DNA-N1-methyladenine dioxygenase activity(GO:0043734) |
| 0.0 | 0.2 | GO:0004096 | catalase activity(GO:0004096) |
| 0.0 | 4.6 | GO:0004553 | hydrolase activity, hydrolyzing O-glycosyl compounds(GO:0004553) |
| 0.0 | 0.7 | GO:0102391 | decanoate--CoA ligase activity(GO:0102391) |
| 0.0 | 0.2 | GO:0033857 | diphosphoinositol-pentakisphosphate kinase activity(GO:0033857) |
| 0.0 | 0.1 | GO:0032143 | single thymine insertion binding(GO:0032143) |
| 0.0 | 0.6 | GO:0015250 | water channel activity(GO:0015250) |
| 0.0 | 0.2 | GO:0048101 | calcium- and calmodulin-regulated 3',5'-cyclic-GMP phosphodiesterase activity(GO:0048101) |
| 0.0 | 0.2 | GO:0015142 | citrate transmembrane transporter activity(GO:0015137) tricarboxylic acid transmembrane transporter activity(GO:0015142) |
| 0.0 | 0.1 | GO:0016603 | glutaminyl-peptide cyclotransferase activity(GO:0016603) |
| 0.0 | 0.5 | GO:1990459 | transferrin receptor binding(GO:1990459) |
| 0.0 | 0.2 | GO:0004800 | thyroxine 5'-deiodinase activity(GO:0004800) |
| 0.0 | 0.2 | GO:0001165 | RNA polymerase I upstream control element sequence-specific DNA binding(GO:0001165) |
| 0.0 | 0.4 | GO:0004028 | 3-chloroallyl aldehyde dehydrogenase activity(GO:0004028) |
| 0.0 | 0.7 | GO:0097602 | cullin family protein binding(GO:0097602) |
| 0.0 | 0.5 | GO:0005522 | profilin binding(GO:0005522) |
| 0.0 | 0.2 | GO:0070573 | metallodipeptidase activity(GO:0070573) |
| 0.0 | 0.1 | GO:0008073 | ornithine decarboxylase inhibitor activity(GO:0008073) |
| 0.0 | 0.7 | GO:0071837 | HMG box domain binding(GO:0071837) |
| 0.0 | 0.3 | GO:0004969 | histamine receptor activity(GO:0004969) |
| 0.0 | 0.2 | GO:0003998 | acylphosphatase activity(GO:0003998) |
| 0.0 | 0.4 | GO:0097109 | neuroligin family protein binding(GO:0097109) |
| 0.0 | 0.2 | GO:0070513 | death domain binding(GO:0070513) |
| 0.0 | 0.1 | GO:0003875 | ADP-ribosylarginine hydrolase activity(GO:0003875) |
| 0.0 | 0.1 | GO:0017159 | pantetheine hydrolase activity(GO:0017159) |
| 0.0 | 0.1 | GO:0004727 | prenylated protein tyrosine phosphatase activity(GO:0004727) |
| 0.0 | 0.1 | GO:0051021 | GDP-dissociation inhibitor binding(GO:0051021) Rho GDP-dissociation inhibitor binding(GO:0051022) |
| 0.0 | 0.4 | GO:0004185 | serine-type carboxypeptidase activity(GO:0004185) |
| 0.0 | 0.3 | GO:0001135 | transcription factor activity, RNA polymerase II transcription factor recruiting(GO:0001135) |
| 0.0 | 0.5 | GO:0031005 | filamin binding(GO:0031005) |
| 0.0 | 0.1 | GO:0031962 | mineralocorticoid receptor binding(GO:0031962) |
| 0.0 | 0.2 | GO:0003960 | NADPH:quinone reductase activity(GO:0003960) |
| 0.0 | 0.7 | GO:0005092 | GDP-dissociation inhibitor activity(GO:0005092) |
| 0.0 | 0.3 | GO:0015143 | urate transmembrane transporter activity(GO:0015143) salt transmembrane transporter activity(GO:1901702) |
| 0.0 | 0.5 | GO:0031210 | phosphatidylcholine binding(GO:0031210) |
| 0.0 | 0.1 | GO:0019788 | NEDD8 transferase activity(GO:0019788) |
| 0.0 | 0.1 | GO:0019961 | interferon binding(GO:0019961) |
| 0.0 | 0.3 | GO:0003836 | beta-galactoside (CMP) alpha-2,3-sialyltransferase activity(GO:0003836) |
| 0.0 | 0.4 | GO:0008494 | translation activator activity(GO:0008494) |
| 0.0 | 0.2 | GO:0099529 | neurotransmitter receptor activity involved in regulation of postsynaptic membrane potential(GO:0099529) transmitter-gated ion channel activity involved in regulation of postsynaptic membrane potential(GO:1904315) |
| 0.0 | 0.2 | GO:0000990 | transcription factor activity, core RNA polymerase binding(GO:0000990) |
| 0.0 | 7.1 | GO:0030246 | carbohydrate binding(GO:0030246) |
| 0.0 | 0.1 | GO:0016401 | palmitoyl-CoA oxidase activity(GO:0016401) |
| 0.0 | 0.1 | GO:0036033 | mediator complex binding(GO:0036033) |
| 0.0 | 0.5 | GO:0017166 | vinculin binding(GO:0017166) |
| 0.0 | 0.5 | GO:0008266 | poly(U) RNA binding(GO:0008266) |
| 0.0 | 0.2 | GO:0035381 | extracellular ATP-gated cation channel activity(GO:0004931) ATP-gated ion channel activity(GO:0035381) |
| 0.0 | 0.3 | GO:0019870 | potassium channel inhibitor activity(GO:0019870) |
| 0.0 | 0.1 | GO:0050119 | N-acetylglucosamine deacetylase activity(GO:0050119) |
| 0.0 | 0.1 | GO:0004994 | somatostatin receptor activity(GO:0004994) |
| 0.0 | 0.6 | GO:0004890 | GABA-A receptor activity(GO:0004890) |
| 0.0 | 0.2 | GO:0052650 | NADP-retinol dehydrogenase activity(GO:0052650) |
| 0.0 | 0.2 | GO:0042975 | peroxisome proliferator activated receptor binding(GO:0042975) |
| 0.0 | 0.3 | GO:0003906 | DNA-(apurinic or apyrimidinic site) lyase activity(GO:0003906) |
| 0.0 | 0.2 | GO:0043274 | phospholipase binding(GO:0043274) |
| 0.0 | 0.1 | GO:0070891 | lipoteichoic acid binding(GO:0070891) |
| 0.0 | 0.3 | GO:0004033 | aldo-keto reductase (NADP) activity(GO:0004033) |
| 0.0 | 0.8 | GO:0005085 | guanyl-nucleotide exchange factor activity(GO:0005085) |
| 0.0 | 0.3 | GO:0050786 | RAGE receptor binding(GO:0050786) |
| 0.0 | 0.5 | GO:0097200 | cysteine-type endopeptidase activity involved in execution phase of apoptosis(GO:0097200) |
| 0.0 | 0.6 | GO:0004198 | calcium-dependent cysteine-type endopeptidase activity(GO:0004198) |
| 0.0 | 0.5 | GO:0071889 | 14-3-3 protein binding(GO:0071889) |
| 0.0 | 2.2 | GO:0008565 | protein transporter activity(GO:0008565) |
| 0.0 | 0.3 | GO:0004222 | metalloendopeptidase activity(GO:0004222) |
| 0.0 | 0.6 | GO:0017091 | AU-rich element binding(GO:0017091) |
| 0.0 | 0.4 | GO:0005212 | structural constituent of eye lens(GO:0005212) |
| 0.0 | 0.1 | GO:0004095 | carnitine O-palmitoyltransferase activity(GO:0004095) |
| 0.0 | 0.4 | GO:0004602 | glutathione peroxidase activity(GO:0004602) |
| 0.0 | 0.7 | GO:0046875 | ephrin receptor binding(GO:0046875) |
| 0.0 | 0.1 | GO:0004471 | malate dehydrogenase (decarboxylating) (NAD+) activity(GO:0004471) malate dehydrogenase (decarboxylating) (NADP+) activity(GO:0004473) |
| 0.0 | 0.2 | GO:0004707 | MAP kinase activity(GO:0004707) |
| 0.0 | 0.5 | GO:0032266 | phosphatidylinositol-3-phosphate binding(GO:0032266) |
| 0.0 | 0.2 | GO:0004128 | cytochrome-b5 reductase activity, acting on NAD(P)H(GO:0004128) |
| 0.0 | 0.3 | GO:0043295 | glutathione binding(GO:0043295) |
| 0.0 | 0.3 | GO:0004861 | cyclin-dependent protein serine/threonine kinase inhibitor activity(GO:0004861) |
| 0.0 | 0.1 | GO:0047499 | calcium-independent phospholipase A2 activity(GO:0047499) |
| 0.0 | 0.1 | GO:0051430 | corticotropin-releasing hormone receptor 1 binding(GO:0051430) |
| 0.0 | 0.1 | GO:0043139 | 5'-3' DNA helicase activity(GO:0043139) |
| 0.0 | 0.0 | GO:0004980 | melanocyte-stimulating hormone receptor activity(GO:0004980) |
| 0.0 | 0.1 | GO:0005314 | high-affinity glutamate transmembrane transporter activity(GO:0005314) |
| 0.0 | 0.2 | GO:0043996 | histone acetyltransferase activity (H4-K5 specific)(GO:0043995) histone acetyltransferase activity (H4-K8 specific)(GO:0043996) histone acetyltransferase activity (H4-K16 specific)(GO:0046972) |
| 0.0 | 0.0 | GO:0008240 | tripeptidyl-peptidase activity(GO:0008240) |
| 0.0 | 0.1 | GO:0008607 | phosphorylase kinase regulator activity(GO:0008607) |
| 0.0 | 0.1 | GO:0004839 | ubiquitin activating enzyme activity(GO:0004839) |
| 0.0 | 0.1 | GO:0005131 | growth hormone receptor binding(GO:0005131) |
| 0.0 | 0.3 | GO:0050699 | WW domain binding(GO:0050699) |
Gene overrepresentation in C2:CP category:
| Log-likelihood per target | Total log-likelihood | Term | Description |
|---|---|---|---|
| 0.1 | 1.9 | SA PROGRAMMED CELL DEATH | Programmed cell death, or apoptosis, eliminates damaged or unneeded cells. |
| 0.0 | 3.2 | PID IFNG PATHWAY | IFN-gamma pathway |
| 0.0 | 2.2 | PID INTEGRIN2 PATHWAY | Beta2 integrin cell surface interactions |
| 0.0 | 1.3 | PID INTEGRIN CS PATHWAY | Integrin family cell surface interactions |
| 0.0 | 0.7 | PID P38 GAMMA DELTA PATHWAY | Signaling mediated by p38-gamma and p38-delta |
| 0.0 | 0.2 | PID RANBP2 PATHWAY | Sumoylation by RanBP2 regulates transcriptional repression |
| 0.0 | 0.8 | SA PTEN PATHWAY | PTEN is a tumor suppressor that dephosphorylates the lipid messenger phosphatidylinositol triphosphate. |
| 0.0 | 0.4 | SA G2 AND M PHASES | Cdc25 activates the cdc2/cyclin B complex to induce the G2/M transition. |
| 0.0 | 1.8 | PID RET PATHWAY | Signaling events regulated by Ret tyrosine kinase |
| 0.0 | 0.2 | ST TYPE I INTERFERON PATHWAY | Type I Interferon (alpha/beta IFN) Pathway |
| 0.0 | 0.8 | PID CD40 PATHWAY | CD40/CD40L signaling |
| 0.0 | 1.2 | PID ATF2 PATHWAY | ATF-2 transcription factor network |
| 0.0 | 0.5 | PID SYNDECAN 3 PATHWAY | Syndecan-3-mediated signaling events |
| 0.0 | 0.8 | PID HDAC CLASSII PATHWAY | Signaling events mediated by HDAC Class II |
| 0.0 | 0.6 | PID LIS1 PATHWAY | Lissencephaly gene (LIS1) in neuronal migration and development |
| 0.0 | 0.6 | PID HIV NEF PATHWAY | HIV-1 Nef: Negative effector of Fas and TNF-alpha |
| 0.0 | 0.4 | ST DIFFERENTIATION PATHWAY IN PC12 CELLS | Differentiation Pathway in PC12 Cells; this is a specific case of PAC1 Receptor Pathway. |
| 0.0 | 2.8 | NABA ECM AFFILIATED | Genes encoding proteins affiliated structurally or functionally to extracellular matrix proteins |
| 0.0 | 0.2 | PID ERB GENOMIC PATHWAY | Validated nuclear estrogen receptor beta network |
| 0.0 | 0.2 | PID RETINOIC ACID PATHWAY | Retinoic acid receptors-mediated signaling |
| 0.0 | 0.3 | SIG INSULIN RECEPTOR PATHWAY IN CARDIAC MYOCYTES | Genes related to the insulin receptor pathway |
Gene overrepresentation in C2:CP:REACTOME category:
| Log-likelihood per target | Total log-likelihood | Term | Description |
|---|---|---|---|
| 0.5 | 5.8 | REACTOME DIGESTION OF DIETARY CARBOHYDRATE | Genes involved in Digestion of dietary carbohydrate |
| 0.3 | 3.8 | REACTOME ROLE OF DCC IN REGULATING APOPTOSIS | Genes involved in Role of DCC in regulating apoptosis |
| 0.1 | 2.0 | REACTOME GAMMA CARBOXYLATION TRANSPORT AND AMINO TERMINAL CLEAVAGE OF PROTEINS | Genes involved in Gamma-carboxylation, transport, and amino-terminal cleavage of proteins |
| 0.1 | 2.9 | REACTOME GLUTAMATE NEUROTRANSMITTER RELEASE CYCLE | Genes involved in Glutamate Neurotransmitter Release Cycle |
| 0.1 | 0.6 | REACTOME NEGATIVE REGULATION OF THE PI3K AKT NETWORK | Genes involved in Negative regulation of the PI3K/AKT network |
| 0.1 | 1.9 | REACTOME INFLAMMASOMES | Genes involved in Inflammasomes |
| 0.1 | 0.7 | REACTOME OPSINS | Genes involved in Opsins |
| 0.0 | 0.6 | REACTOME PASSIVE TRANSPORT BY AQUAPORINS | Genes involved in Passive Transport by Aquaporins |
| 0.0 | 1.4 | REACTOME DEADENYLATION OF MRNA | Genes involved in Deadenylation of mRNA |
| 0.0 | 0.9 | REACTOME OTHER SEMAPHORIN INTERACTIONS | Genes involved in Other semaphorin interactions |
| 0.0 | 0.5 | REACTOME REGULATED PROTEOLYSIS OF P75NTR | Genes involved in Regulated proteolysis of p75NTR |
| 0.0 | 0.9 | REACTOME GLYCOGEN BREAKDOWN GLYCOGENOLYSIS | Genes involved in Glycogen breakdown (glycogenolysis) |
| 0.0 | 0.4 | REACTOME SIGNAL REGULATORY PROTEIN SIRP FAMILY INTERACTIONS | Genes involved in Signal regulatory protein (SIRP) family interactions |
| 0.0 | 0.2 | REACTOME PEPTIDE CHAIN ELONGATION | Genes involved in Peptide chain elongation |
| 0.0 | 0.8 | REACTOME PHOSPHORYLATION OF THE APC C | Genes involved in Phosphorylation of the APC/C |
| 0.0 | 0.3 | REACTOME RAF MAP KINASE CASCADE | Genes involved in RAF/MAP kinase cascade |
| 0.0 | 0.5 | REACTOME MITOCHONDRIAL FATTY ACID BETA OXIDATION | Genes involved in Mitochondrial Fatty Acid Beta-Oxidation |
| 0.0 | 1.0 | REACTOME GLUTATHIONE CONJUGATION | Genes involved in Glutathione conjugation |
| 0.0 | 0.5 | REACTOME GABA SYNTHESIS RELEASE REUPTAKE AND DEGRADATION | Genes involved in GABA synthesis, release, reuptake and degradation |
| 0.0 | 0.7 | REACTOME G BETA GAMMA SIGNALLING THROUGH PI3KGAMMA | Genes involved in G beta:gamma signalling through PI3Kgamma |
| 0.0 | 0.7 | REACTOME SYNTHESIS AND INTERCONVERSION OF NUCLEOTIDE DI AND TRIPHOSPHATES | Genes involved in Synthesis and interconversion of nucleotide di- and triphosphates |
| 0.0 | 0.3 | REACTOME ACTIVATION OF THE AP1 FAMILY OF TRANSCRIPTION FACTORS | Genes involved in Activation of the AP-1 family of transcription factors |
| 0.0 | 0.4 | REACTOME CYCLIN A B1 ASSOCIATED EVENTS DURING G2 M TRANSITION | Genes involved in Cyclin A/B1 associated events during G2/M transition |
| 0.0 | 0.3 | REACTOME NEF MEDIATED DOWNREGULATION OF MHC CLASS I COMPLEX CELL SURFACE EXPRESSION | Genes involved in Nef mediated downregulation of MHC class I complex cell surface expression |
| 0.0 | 0.4 | REACTOME GLUCURONIDATION | Genes involved in Glucuronidation |
| 0.0 | 1.3 | REACTOME REGULATION OF ORNITHINE DECARBOXYLASE ODC | Genes involved in Regulation of ornithine decarboxylase (ODC) |
| 0.0 | 0.5 | REACTOME METABOLISM OF POLYAMINES | Genes involved in Metabolism of polyamines |
| 0.0 | 0.2 | REACTOME ELEVATION OF CYTOSOLIC CA2 LEVELS | Genes involved in Elevation of cytosolic Ca2+ levels |
| 0.0 | 0.5 | REACTOME BRANCHED CHAIN AMINO ACID CATABOLISM | Genes involved in Branched-chain amino acid catabolism |
| 0.0 | 0.4 | REACTOME CRMPS IN SEMA3A SIGNALING | Genes involved in CRMPs in Sema3A signaling |
| 0.0 | 0.1 | REACTOME PROSTACYCLIN SIGNALLING THROUGH PROSTACYCLIN RECEPTOR | Genes involved in Prostacyclin signalling through prostacyclin receptor |
| 0.0 | 0.5 | REACTOME ANTIGEN PRESENTATION FOLDING ASSEMBLY AND PEPTIDE LOADING OF CLASS I MHC | Genes involved in Antigen Presentation: Folding, assembly and peptide loading of class I MHC |
| 0.0 | 0.4 | REACTOME GABA A RECEPTOR ACTIVATION | Genes involved in GABA A receptor activation |
| 0.0 | 0.2 | REACTOME PURINE CATABOLISM | Genes involved in Purine catabolism |
| 0.0 | 0.2 | REACTOME SCF BETA TRCP MEDIATED DEGRADATION OF EMI1 | Genes involved in SCF-beta-TrCP mediated degradation of Emi1 |
| 0.0 | 0.3 | REACTOME ASSOCIATION OF TRIC CCT WITH TARGET PROTEINS DURING BIOSYNTHESIS | Genes involved in Association of TriC/CCT with target proteins during biosynthesis |
| 0.0 | 0.4 | REACTOME ENDOSOMAL SORTING COMPLEX REQUIRED FOR TRANSPORT ESCRT | Genes involved in Endosomal Sorting Complex Required For Transport (ESCRT) |
| 0.0 | 0.3 | REACTOME TGF BETA RECEPTOR SIGNALING IN EMT EPITHELIAL TO MESENCHYMAL TRANSITION | Genes involved in TGF-beta receptor signaling in EMT (epithelial to mesenchymal transition) |
| 0.0 | 0.0 | REACTOME IRAK1 RECRUITS IKK COMPLEX | Genes involved in IRAK1 recruits IKK complex |
| 0.0 | 0.2 | REACTOME P53 DEPENDENT G1 DNA DAMAGE RESPONSE | Genes involved in p53-Dependent G1 DNA Damage Response |
| 0.0 | 0.3 | REACTOME CIRCADIAN REPRESSION OF EXPRESSION BY REV ERBA | Genes involved in Circadian Repression of Expression by REV-ERBA |
| 0.0 | 0.4 | REACTOME PREFOLDIN MEDIATED TRANSFER OF SUBSTRATE TO CCT TRIC | Genes involved in Prefoldin mediated transfer of substrate to CCT/TriC |
| 0.0 | 0.6 | REACTOME RNA POL I PROMOTER OPENING | Genes involved in RNA Polymerase I Promoter Opening |
| 0.0 | 0.4 | REACTOME INTRINSIC PATHWAY FOR APOPTOSIS | Genes involved in Intrinsic Pathway for Apoptosis |