Project
Epithelial-Mesenchymal Transition, human (Scheel, 2011)
Navigation
Downloads
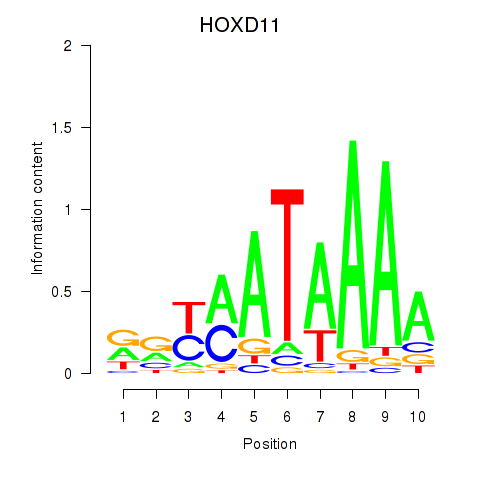
Results for HOXD11_HOXA11
Z-value: 0.62
Motif logo

Transcription factors associated with HOXD11_HOXA11
| Gene Symbol | Gene ID | Gene Info |
|---|---|---|
|
HOXD11
|
ENSG00000128713.11 | HOXD11 |
|
HOXA11
|
ENSG00000005073.5 | HOXA11 |
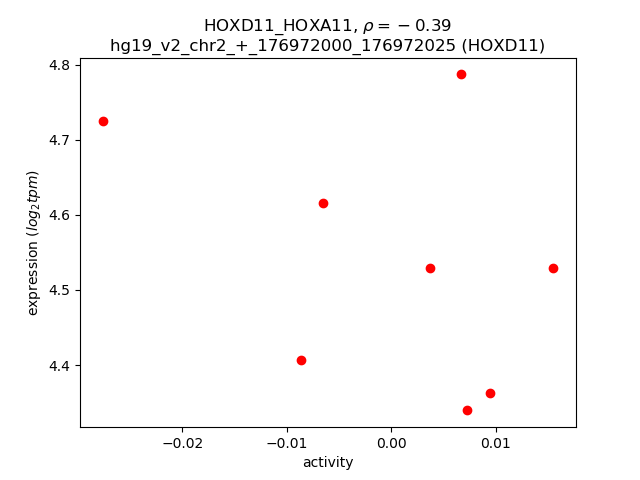
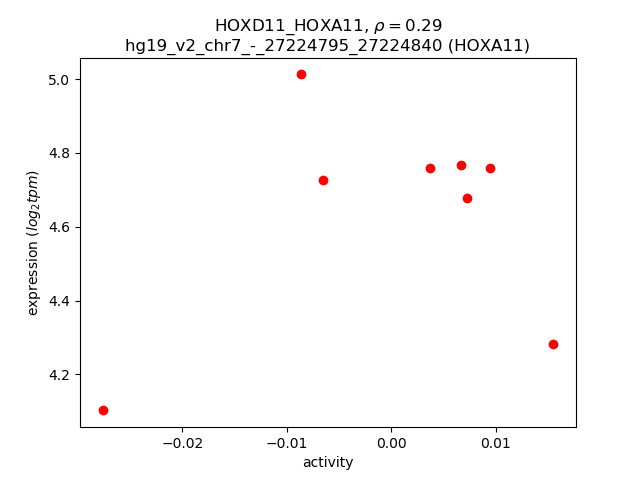
Activity-expression correlation:
| Gene | Promoter | Pearson corr. coef. | P-value | Plot |
|---|---|---|---|---|
| HOXD11 | hg19_v2_chr2_+_176972000_176972025 | -0.39 | 3.4e-01 | Click! |
| HOXA11 | hg19_v2_chr7_-_27224795_27224840, hg19_v2_chr7_-_27224842_27224872 | 0.29 | 4.9e-01 | Click! |
Activity profile of HOXD11_HOXA11 motif
Sorted Z-values of HOXD11_HOXA11 motif
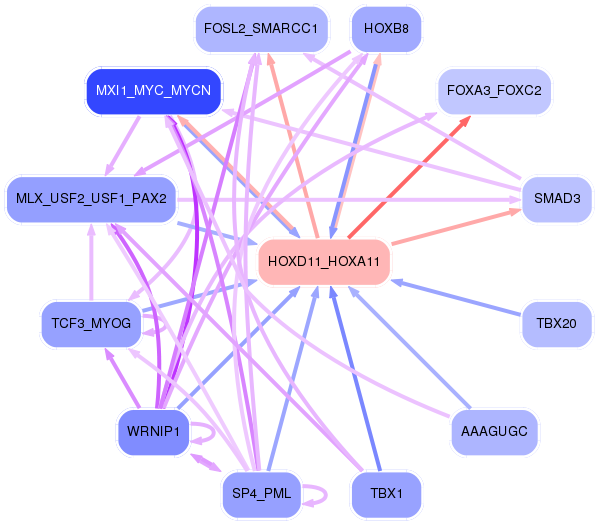
Network of associatons between targets according to the STRING database.

First level regulatory network of HOXD11_HOXA11
| Promoter | Score | Transcript | Gene | Gene Info |
|---|---|---|---|---|
| chr1_+_183774240 | 0.74 |
ENST00000360851.3 |
RGL1 |
ral guanine nucleotide dissociation stimulator-like 1 |
| chr8_+_97597148 | 0.60 |
ENST00000521590.1 |
SDC2 |
syndecan 2 |
| chr5_+_148521381 | 0.52 |
ENST00000504238.1 |
ABLIM3 |
actin binding LIM protein family, member 3 |
| chr3_-_18480260 | 0.49 |
ENST00000454909.2 |
SATB1 |
SATB homeobox 1 |
| chr1_+_244515930 | 0.48 |
ENST00000366537.1 ENST00000308105.4 |
C1orf100 |
chromosome 1 open reading frame 100 |
| chr5_-_111093167 | 0.47 |
ENST00000446294.2 ENST00000419114.2 |
NREP |
neuronal regeneration related protein |
| chr5_-_20575959 | 0.45 |
ENST00000507958.1 |
CDH18 |
cadherin 18, type 2 |
| chr6_+_32812568 | 0.42 |
ENST00000414474.1 |
PSMB9 |
proteasome (prosome, macropain) subunit, beta type, 9 |
| chr12_-_91546926 | 0.37 |
ENST00000550758.1 |
DCN |
decorin |
| chr19_+_46367518 | 0.37 |
ENST00000302177.2 |
FOXA3 |
forkhead box A3 |
| chr1_+_52682052 | 0.35 |
ENST00000371591.1 |
ZFYVE9 |
zinc finger, FYVE domain containing 9 |
| chr14_-_51027838 | 0.35 |
ENST00000555216.1 |
MAP4K5 |
mitogen-activated protein kinase kinase kinase kinase 5 |
| chr8_+_107738343 | 0.34 |
ENST00000521592.1 |
OXR1 |
oxidation resistance 1 |
| chr8_-_116504448 | 0.32 |
ENST00000518018.1 |
TRPS1 |
trichorhinophalangeal syndrome I |
| chr17_-_53800217 | 0.32 |
ENST00000424486.2 |
TMEM100 |
transmembrane protein 100 |
| chr1_-_72566613 | 0.30 |
ENST00000306821.3 |
NEGR1 |
neuronal growth regulator 1 |
| chr19_-_10446449 | 0.28 |
ENST00000592439.1 |
ICAM3 |
intercellular adhesion molecule 3 |
| chr17_-_66951474 | 0.28 |
ENST00000269080.2 |
ABCA8 |
ATP-binding cassette, sub-family A (ABC1), member 8 |
| chr12_-_47219733 | 0.27 |
ENST00000547477.1 ENST00000447411.1 ENST00000266579.4 |
SLC38A4 |
solute carrier family 38, member 4 |
| chr5_-_111093759 | 0.27 |
ENST00000509979.1 ENST00000513100.1 ENST00000508161.1 ENST00000455559.2 |
NREP |
neuronal regeneration related protein |
| chr3_+_157154578 | 0.26 |
ENST00000295927.3 |
PTX3 |
pentraxin 3, long |
| chr1_+_79086088 | 0.26 |
ENST00000370751.5 ENST00000342282.3 |
IFI44L |
interferon-induced protein 44-like |
| chr1_+_78769549 | 0.25 |
ENST00000370758.1 |
PTGFR |
prostaglandin F receptor (FP) |
| chr5_+_67586465 | 0.25 |
ENST00000336483.5 |
PIK3R1 |
phosphoinositide-3-kinase, regulatory subunit 1 (alpha) |
| chr6_-_52859046 | 0.25 |
ENST00000457564.1 ENST00000541324.1 ENST00000370960.1 |
GSTA4 |
glutathione S-transferase alpha 4 |
| chr8_-_93029865 | 0.25 |
ENST00000422361.2 |
RUNX1T1 |
runt-related transcription factor 1; translocated to, 1 (cyclin D-related) |
| chr18_-_12656715 | 0.25 |
ENST00000462226.1 ENST00000497844.2 ENST00000309836.5 ENST00000453447.2 |
SPIRE1 |
spire-type actin nucleation factor 1 |
| chr1_-_160231451 | 0.24 |
ENST00000495887.1 |
DCAF8 |
DDB1 and CUL4 associated factor 8 |
| chr7_+_138915102 | 0.24 |
ENST00000486663.1 |
UBN2 |
ubinuclein 2 |
| chr3_-_156534754 | 0.24 |
ENST00000472943.1 ENST00000473352.1 |
LINC00886 |
long intergenic non-protein coding RNA 886 |
| chr4_+_146539415 | 0.23 |
ENST00000281317.5 |
MMAA |
methylmalonic aciduria (cobalamin deficiency) cblA type |
| chr12_-_91573132 | 0.23 |
ENST00000550563.1 ENST00000546370.1 |
DCN |
decorin |
| chr12_-_6579833 | 0.23 |
ENST00000396308.3 |
VAMP1 |
vesicle-associated membrane protein 1 (synaptobrevin 1) |
| chr4_+_41258786 | 0.22 |
ENST00000503431.1 ENST00000284440.4 ENST00000508768.1 ENST00000512788.1 |
UCHL1 |
ubiquitin carboxyl-terminal esterase L1 (ubiquitin thiolesterase) |
| chr1_-_167059830 | 0.22 |
ENST00000367868.3 |
GPA33 |
glycoprotein A33 (transmembrane) |
| chr12_-_6580094 | 0.22 |
ENST00000361716.3 |
VAMP1 |
vesicle-associated membrane protein 1 (synaptobrevin 1) |
| chr8_-_38326119 | 0.21 |
ENST00000356207.5 ENST00000326324.6 |
FGFR1 |
fibroblast growth factor receptor 1 |
| chr10_+_85933494 | 0.21 |
ENST00000372126.3 |
C10orf99 |
chromosome 10 open reading frame 99 |
| chr8_-_38326139 | 0.20 |
ENST00000335922.5 ENST00000532791.1 ENST00000397091.5 |
FGFR1 |
fibroblast growth factor receptor 1 |
| chr10_-_90712520 | 0.20 |
ENST00000224784.6 |
ACTA2 |
actin, alpha 2, smooth muscle, aorta |
| chr1_+_151735431 | 0.20 |
ENST00000321531.5 ENST00000315067.8 |
OAZ3 |
ornithine decarboxylase antizyme 3 |
| chr12_-_10573149 | 0.20 |
ENST00000381904.2 ENST00000381903.2 ENST00000396439.2 |
KLRC3 |
killer cell lectin-like receptor subfamily C, member 3 |
| chr2_+_109204743 | 0.19 |
ENST00000332345.6 |
LIMS1 |
LIM and senescent cell antigen-like domains 1 |
| chr14_-_60097297 | 0.19 |
ENST00000395090.1 |
RTN1 |
reticulon 1 |
| chr2_+_33359646 | 0.19 |
ENST00000390003.4 ENST00000418533.2 |
LTBP1 |
latent transforming growth factor beta binding protein 1 |
| chr12_-_56236734 | 0.19 |
ENST00000548629.1 |
MMP19 |
matrix metallopeptidase 19 |
| chr12_-_76879852 | 0.19 |
ENST00000548341.1 |
OSBPL8 |
oxysterol binding protein-like 8 |
| chr3_-_100712352 | 0.18 |
ENST00000471714.1 ENST00000284322.5 |
ABI3BP |
ABI family, member 3 (NESH) binding protein |
| chr20_+_12989596 | 0.18 |
ENST00000434210.1 ENST00000399002.2 |
SPTLC3 |
serine palmitoyltransferase, long chain base subunit 3 |
| chr7_+_141811539 | 0.18 |
ENST00000550469.2 ENST00000477922.3 |
RP11-1220K2.2 |
Putative inactive maltase-glucoamylase-like protein LOC93432 |
| chr17_+_66521936 | 0.18 |
ENST00000592800.1 |
PRKAR1A |
protein kinase, cAMP-dependent, regulatory, type I, alpha |
| chr9_-_95244781 | 0.18 |
ENST00000375544.3 ENST00000375543.1 ENST00000395538.3 ENST00000450139.2 |
ASPN |
asporin |
| chr2_+_33359687 | 0.18 |
ENST00000402934.1 ENST00000404525.1 ENST00000407925.1 |
LTBP1 |
latent transforming growth factor beta binding protein 1 |
| chr1_+_192127578 | 0.18 |
ENST00000367460.3 |
RGS18 |
regulator of G-protein signaling 18 |
| chr15_-_99789736 | 0.17 |
ENST00000560235.1 ENST00000394132.2 ENST00000560860.1 ENST00000558078.1 ENST00000394136.1 ENST00000262074.4 ENST00000558613.1 ENST00000394130.1 ENST00000560772.1 |
TTC23 |
tetratricopeptide repeat domain 23 |
| chr12_-_6579808 | 0.17 |
ENST00000535180.1 ENST00000400911.3 |
VAMP1 |
vesicle-associated membrane protein 1 (synaptobrevin 1) |
| chr2_+_201450591 | 0.17 |
ENST00000374700.2 |
AOX1 |
aldehyde oxidase 1 |
| chr7_+_150065278 | 0.17 |
ENST00000519397.1 ENST00000479668.1 ENST00000540729.1 |
REPIN1 |
replication initiator 1 |
| chr9_-_130829588 | 0.17 |
ENST00000373078.4 |
NAIF1 |
nuclear apoptosis inducing factor 1 |
| chr9_-_21305312 | 0.17 |
ENST00000259555.4 |
IFNA5 |
interferon, alpha 5 |
| chr12_+_6833437 | 0.17 |
ENST00000534947.1 ENST00000541866.1 ENST00000534877.1 ENST00000538753.1 |
COPS7A |
COP9 signalosome subunit 7A |
| chr12_+_6833237 | 0.17 |
ENST00000229251.3 ENST00000539735.1 ENST00000538410.1 |
COPS7A |
COP9 signalosome subunit 7A |
| chr14_-_60097524 | 0.17 |
ENST00000342503.4 |
RTN1 |
reticulon 1 |
| chr11_+_64001962 | 0.17 |
ENST00000309422.2 |
VEGFB |
vascular endothelial growth factor B |
| chr3_+_151531810 | 0.17 |
ENST00000232892.7 |
AADAC |
arylacetamide deacetylase |
| chr9_-_123812542 | 0.16 |
ENST00000223642.1 |
C5 |
complement component 5 |
| chr12_-_49418407 | 0.16 |
ENST00000526209.1 |
KMT2D |
lysine (K)-specific methyltransferase 2D |
| chr10_-_90751038 | 0.16 |
ENST00000458159.1 ENST00000415557.1 ENST00000458208.1 |
ACTA2 |
actin, alpha 2, smooth muscle, aorta |
| chr6_-_26189304 | 0.16 |
ENST00000340756.2 |
HIST1H4D |
histone cluster 1, H4d |
| chr9_+_101705893 | 0.16 |
ENST00000375001.3 |
COL15A1 |
collagen, type XV, alpha 1 |
| chr22_-_39190116 | 0.16 |
ENST00000406622.1 ENST00000216068.4 ENST00000406199.3 |
SUN2 DNAL4 |
Sad1 and UNC84 domain containing 2 dynein, axonemal, light chain 4 |
| chr11_-_26593677 | 0.16 |
ENST00000527569.1 |
MUC15 |
mucin 15, cell surface associated |
| chr4_+_70894130 | 0.16 |
ENST00000526767.1 ENST00000530128.1 ENST00000381057.3 |
HTN3 |
histatin 3 |
| chrX_+_73164167 | 0.16 |
ENST00000414209.1 ENST00000602895.1 ENST00000453317.1 ENST00000602546.1 ENST00000602985.1 ENST00000415215.1 |
JPX |
JPX transcript, XIST activator (non-protein coding) |
| chrX_+_16668278 | 0.15 |
ENST00000380200.3 |
S100G |
S100 calcium binding protein G |
| chr9_+_2029019 | 0.15 |
ENST00000382194.1 |
SMARCA2 |
SWI/SNF related, matrix associated, actin dependent regulator of chromatin, subfamily a, member 2 |
| chr10_-_28571015 | 0.15 |
ENST00000375719.3 ENST00000375732.1 |
MPP7 |
membrane protein, palmitoylated 7 (MAGUK p55 subfamily member 7) |
| chr8_+_16884740 | 0.15 |
ENST00000318063.5 |
MICU3 |
mitochondrial calcium uptake family, member 3 |
| chr19_-_54618650 | 0.15 |
ENST00000391757.1 |
TFPT |
TCF3 (E2A) fusion partner (in childhood Leukemia) |
| chr1_+_65730385 | 0.15 |
ENST00000263441.7 ENST00000395325.3 |
DNAJC6 |
DnaJ (Hsp40) homolog, subfamily C, member 6 |
| chr11_-_26593779 | 0.15 |
ENST00000529533.1 |
MUC15 |
mucin 15, cell surface associated |
| chr19_+_56152262 | 0.15 |
ENST00000325333.5 ENST00000590190.1 |
ZNF580 |
zinc finger protein 580 |
| chr9_+_125133315 | 0.15 |
ENST00000223423.4 ENST00000362012.2 |
PTGS1 |
prostaglandin-endoperoxide synthase 1 (prostaglandin G/H synthase and cyclooxygenase) |
| chr1_+_151739131 | 0.15 |
ENST00000400999.1 |
OAZ3 |
ornithine decarboxylase antizyme 3 |
| chr2_-_190044480 | 0.15 |
ENST00000374866.3 |
COL5A2 |
collagen, type V, alpha 2 |
| chr15_+_67841330 | 0.14 |
ENST00000354498.5 |
MAP2K5 |
mitogen-activated protein kinase kinase 5 |
| chr6_+_132873832 | 0.14 |
ENST00000275200.1 |
TAAR8 |
trace amine associated receptor 8 |
| chr4_+_120056939 | 0.14 |
ENST00000307128.5 |
MYOZ2 |
myozenin 2 |
| chr6_+_72922590 | 0.14 |
ENST00000523963.1 |
RIMS1 |
regulating synaptic membrane exocytosis 1 |
| chr6_+_72922505 | 0.14 |
ENST00000401910.3 |
RIMS1 |
regulating synaptic membrane exocytosis 1 |
| chr19_+_49468558 | 0.14 |
ENST00000331825.6 |
FTL |
ferritin, light polypeptide |
| chr2_+_158114051 | 0.14 |
ENST00000259056.4 |
GALNT5 |
UDP-N-acetyl-alpha-D-galactosamine:polypeptide N-acetylgalactosaminyltransferase 5 (GalNAc-T5) |
| chr2_-_3504587 | 0.14 |
ENST00000415131.1 |
ADI1 |
acireductone dioxygenase 1 |
| chr17_-_67138015 | 0.13 |
ENST00000284425.2 ENST00000590645.1 |
ABCA6 |
ATP-binding cassette, sub-family A (ABC1), member 6 |
| chr14_-_20774092 | 0.13 |
ENST00000423949.2 ENST00000553828.1 ENST00000258821.3 |
TTC5 |
tetratricopeptide repeat domain 5 |
| chr21_+_17792672 | 0.13 |
ENST00000602620.1 |
LINC00478 |
long intergenic non-protein coding RNA 478 |
| chr2_+_28618532 | 0.13 |
ENST00000545753.1 |
FOSL2 |
FOS-like antigen 2 |
| chr3_-_112356944 | 0.13 |
ENST00000461431.1 |
CCDC80 |
coiled-coil domain containing 80 |
| chr4_+_71458012 | 0.13 |
ENST00000449493.2 |
AMBN |
ameloblastin (enamel matrix protein) |
| chr3_-_99569821 | 0.13 |
ENST00000487087.1 |
FILIP1L |
filamin A interacting protein 1-like |
| chr21_+_35736302 | 0.13 |
ENST00000290310.3 |
KCNE2 |
potassium voltage-gated channel, Isk-related family, member 2 |
| chr19_-_54619006 | 0.13 |
ENST00000391759.1 |
TFPT |
TCF3 (E2A) fusion partner (in childhood Leukemia) |
| chr15_+_67418047 | 0.13 |
ENST00000540846.2 |
SMAD3 |
SMAD family member 3 |
| chr1_+_229440129 | 0.12 |
ENST00000366688.3 |
SPHAR |
S-phase response (cyclin related) |
| chr3_-_67705006 | 0.12 |
ENST00000492795.1 ENST00000493112.1 ENST00000307227.5 |
SUCLG2 |
succinate-CoA ligase, GDP-forming, beta subunit |
| chr6_-_87804815 | 0.12 |
ENST00000369582.2 |
CGA |
glycoprotein hormones, alpha polypeptide |
| chrX_+_135251835 | 0.12 |
ENST00000456445.1 |
FHL1 |
four and a half LIM domains 1 |
| chr19_-_36233332 | 0.12 |
ENST00000592537.1 ENST00000246532.1 ENST00000344990.3 ENST00000588992.1 |
IGFLR1 |
IGF-like family receptor 1 |
| chr9_-_73029540 | 0.12 |
ENST00000377126.2 |
KLF9 |
Kruppel-like factor 9 |
| chr19_+_19626531 | 0.12 |
ENST00000507754.4 |
NDUFA13 |
NADH dehydrogenase (ubiquinone) 1 alpha subcomplex, 13 |
| chr6_-_32157947 | 0.12 |
ENST00000375050.4 |
PBX2 |
pre-B-cell leukemia homeobox 2 |
| chr3_-_123710199 | 0.11 |
ENST00000184183.4 |
ROPN1 |
rhophilin associated tail protein 1 |
| chr8_+_77593448 | 0.11 |
ENST00000521891.2 |
ZFHX4 |
zinc finger homeobox 4 |
| chr6_-_25042231 | 0.11 |
ENST00000510784.2 |
FAM65B |
family with sequence similarity 65, member B |
| chrX_+_36246735 | 0.11 |
ENST00000378653.3 |
CXorf30 |
chromosome X open reading frame 30 |
| chr1_+_70876926 | 0.11 |
ENST00000370938.3 ENST00000346806.2 |
CTH |
cystathionase (cystathionine gamma-lyase) |
| chr12_+_70219052 | 0.11 |
ENST00000552032.2 ENST00000547771.2 |
MYRFL |
myelin regulatory factor-like |
| chr11_+_19798964 | 0.11 |
ENST00000527559.2 |
NAV2 |
neuron navigator 2 |
| chr6_-_52859968 | 0.11 |
ENST00000370959.1 |
GSTA4 |
glutathione S-transferase alpha 4 |
| chr14_+_57671888 | 0.11 |
ENST00000391612.1 |
AL391152.1 |
AL391152.1 |
| chr19_-_45982076 | 0.11 |
ENST00000423698.2 |
ERCC1 |
excision repair cross-complementing rodent repair deficiency, complementation group 1 (includes overlapping antisense sequence) |
| chr3_-_141747950 | 0.11 |
ENST00000497579.1 |
TFDP2 |
transcription factor Dp-2 (E2F dimerization partner 2) |
| chr4_+_39046615 | 0.11 |
ENST00000261425.3 ENST00000508137.2 |
KLHL5 |
kelch-like family member 5 |
| chr2_-_136288113 | 0.11 |
ENST00000401392.1 |
ZRANB3 |
zinc finger, RAN-binding domain containing 3 |
| chr19_-_10420459 | 0.11 |
ENST00000403352.1 ENST00000403903.3 |
ZGLP1 |
zinc finger, GATA-like protein 1 |
| chr7_-_75401513 | 0.11 |
ENST00000005180.4 |
CCL26 |
chemokine (C-C motif) ligand 26 |
| chrX_-_154493791 | 0.11 |
ENST00000369454.3 |
RAB39B |
RAB39B, member RAS oncogene family |
| chr10_+_72194585 | 0.11 |
ENST00000420338.2 |
AC022532.1 |
Uncharacterized protein |
| chr1_-_204135450 | 0.11 |
ENST00000272190.8 ENST00000367195.2 |
REN |
renin |
| chr6_-_15548591 | 0.11 |
ENST00000509674.1 |
DTNBP1 |
dystrobrevin binding protein 1 |
| chr10_-_115904361 | 0.10 |
ENST00000428953.1 ENST00000543782.1 |
C10orf118 |
chromosome 10 open reading frame 118 |
| chr19_-_45926739 | 0.10 |
ENST00000589381.1 ENST00000591636.1 ENST00000013807.5 ENST00000592023.1 |
ERCC1 |
excision repair cross-complementing rodent repair deficiency, complementation group 1 (includes overlapping antisense sequence) |
| chr1_-_94586651 | 0.10 |
ENST00000535735.1 ENST00000370225.3 |
ABCA4 |
ATP-binding cassette, sub-family A (ABC1), member 4 |
| chr3_-_197686847 | 0.10 |
ENST00000265239.6 |
IQCG |
IQ motif containing G |
| chr1_+_120254510 | 0.10 |
ENST00000369409.4 |
PHGDH |
phosphoglycerate dehydrogenase |
| chr3_-_185270342 | 0.10 |
ENST00000424591.2 |
LIPH |
lipase, member H |
| chr6_+_27775899 | 0.10 |
ENST00000358739.3 |
HIST1H2AI |
histone cluster 1, H2ai |
| chr10_+_111967345 | 0.10 |
ENST00000332674.5 ENST00000453116.1 |
MXI1 |
MAX interactor 1, dimerization protein |
| chr9_-_28026318 | 0.10 |
ENST00000308675.3 |
LINGO2 |
leucine rich repeat and Ig domain containing 2 |
| chr16_-_3350614 | 0.10 |
ENST00000268674.2 |
TIGD7 |
tigger transposable element derived 7 |
| chr13_+_103459704 | 0.10 |
ENST00000602836.1 |
BIVM-ERCC5 |
BIVM-ERCC5 readthrough |
| chr5_+_135496675 | 0.10 |
ENST00000507637.1 |
SMAD5 |
SMAD family member 5 |
| chrX_+_55744166 | 0.10 |
ENST00000374941.4 ENST00000414239.1 |
RRAGB |
Ras-related GTP binding B |
| chr9_+_82187630 | 0.10 |
ENST00000265284.6 |
TLE4 |
transducin-like enhancer of split 4 (E(sp1) homolog, Drosophila) |
| chr6_+_73076432 | 0.10 |
ENST00000414192.2 |
RIMS1 |
regulating synaptic membrane exocytosis 1 |
| chr6_+_26156551 | 0.10 |
ENST00000304218.3 |
HIST1H1E |
histone cluster 1, H1e |
| chr19_-_45927622 | 0.10 |
ENST00000300853.3 ENST00000589165.1 |
ERCC1 |
excision repair cross-complementing rodent repair deficiency, complementation group 1 (includes overlapping antisense sequence) |
| chr12_-_95945246 | 0.10 |
ENST00000258499.3 |
USP44 |
ubiquitin specific peptidase 44 |
| chr9_-_124976185 | 0.10 |
ENST00000464484.2 |
LHX6 |
LIM homeobox 6 |
| chr1_-_155880672 | 0.09 |
ENST00000609492.1 ENST00000368322.3 |
RIT1 |
Ras-like without CAAX 1 |
| chr10_+_60759378 | 0.09 |
ENST00000432535.1 |
LINC00844 |
long intergenic non-protein coding RNA 844 |
| chrX_+_135252050 | 0.09 |
ENST00000449474.1 ENST00000345434.3 |
FHL1 |
four and a half LIM domains 1 |
| chr6_+_111408698 | 0.09 |
ENST00000368851.5 |
SLC16A10 |
solute carrier family 16 (aromatic amino acid transporter), member 10 |
| chr2_+_109271481 | 0.09 |
ENST00000542845.1 ENST00000393314.2 |
LIMS1 |
LIM and senescent cell antigen-like domains 1 |
| chr20_-_39928756 | 0.09 |
ENST00000432768.2 |
ZHX3 |
zinc fingers and homeoboxes 3 |
| chr9_+_82187487 | 0.09 |
ENST00000435650.1 ENST00000414465.1 ENST00000376537.4 ENST00000376534.4 |
TLE4 |
transducin-like enhancer of split 4 (E(sp1) homolog, Drosophila) |
| chr9_-_124976154 | 0.09 |
ENST00000482062.1 |
LHX6 |
LIM homeobox 6 |
| chr12_+_12878829 | 0.09 |
ENST00000326765.6 |
APOLD1 |
apolipoprotein L domain containing 1 |
| chr11_-_625163 | 0.09 |
ENST00000349570.7 |
CDHR5 |
cadherin-related family member 5 |
| chr12_-_95941987 | 0.09 |
ENST00000537435.2 |
USP44 |
ubiquitin specific peptidase 44 |
| chrX_+_135251783 | 0.09 |
ENST00000394153.2 |
FHL1 |
four and a half LIM domains 1 |
| chr4_+_170581213 | 0.09 |
ENST00000507875.1 |
CLCN3 |
chloride channel, voltage-sensitive 3 |
| chr5_-_139937895 | 0.09 |
ENST00000336283.6 |
SRA1 |
steroid receptor RNA activator 1 |
| chr14_+_22554680 | 0.09 |
ENST00000390451.2 |
TRAV23DV6 |
T cell receptor alpha variable 23/delta variable 6 |
| chr2_+_220143989 | 0.09 |
ENST00000336576.5 |
DNAJB2 |
DnaJ (Hsp40) homolog, subfamily B, member 2 |
| chr5_-_36301984 | 0.09 |
ENST00000502994.1 ENST00000515759.1 ENST00000296604.3 |
RANBP3L |
RAN binding protein 3-like |
| chrX_-_15332665 | 0.09 |
ENST00000537676.1 ENST00000344384.4 |
ASB11 |
ankyrin repeat and SOCS box containing 11 |
| chr7_-_38394118 | 0.09 |
ENST00000390345.2 |
TRGV4 |
T cell receptor gamma variable 4 |
| chr7_-_105517021 | 0.09 |
ENST00000318724.4 ENST00000419735.3 |
ATXN7L1 |
ataxin 7-like 1 |
| chrX_+_135570046 | 0.09 |
ENST00000370648.3 |
BRS3 |
bombesin-like receptor 3 |
| chr9_+_82188077 | 0.09 |
ENST00000425506.1 |
TLE4 |
transducin-like enhancer of split 4 (E(sp1) homolog, Drosophila) |
| chr15_+_41549105 | 0.08 |
ENST00000560965.1 |
CHP1 |
calcineurin-like EF-hand protein 1 |
| chr3_+_157827841 | 0.08 |
ENST00000295930.3 ENST00000471994.1 ENST00000464171.1 ENST00000312179.6 ENST00000475278.2 |
RSRC1 |
arginine/serine-rich coiled-coil 1 |
| chr7_-_14942944 | 0.08 |
ENST00000403951.2 |
DGKB |
diacylglycerol kinase, beta 90kDa |
| chrX_+_78200829 | 0.08 |
ENST00000544091.1 |
P2RY10 |
purinergic receptor P2Y, G-protein coupled, 10 |
| chr21_-_35016231 | 0.08 |
ENST00000438788.1 |
CRYZL1 |
crystallin, zeta (quinone reductase)-like 1 |
| chr3_-_164796269 | 0.08 |
ENST00000264382.3 |
SI |
sucrase-isomaltase (alpha-glucosidase) |
| chr6_-_27782548 | 0.08 |
ENST00000333151.3 |
HIST1H2AJ |
histone cluster 1, H2aj |
| chr1_-_95391315 | 0.08 |
ENST00000545882.1 ENST00000415017.1 |
CNN3 |
calponin 3, acidic |
| chr10_+_135160844 | 0.08 |
ENST00000423766.1 ENST00000458230.1 |
PRAP1 |
proline-rich acidic protein 1 |
| chr6_+_88032299 | 0.08 |
ENST00000608353.1 ENST00000392863.1 ENST00000229570.5 ENST00000608525.1 ENST00000608868.1 |
SMIM8 |
small integral membrane protein 8 |
| chr3_-_57326704 | 0.08 |
ENST00000487349.1 ENST00000389601.3 |
ASB14 |
ankyrin repeat and SOCS box containing 14 |
| chr8_+_107738240 | 0.08 |
ENST00000449762.2 ENST00000297447.6 |
OXR1 |
oxidation resistance 1 |
| chr10_+_52152766 | 0.08 |
ENST00000596442.1 |
AC069547.2 |
Uncharacterized protein |
| chr1_-_154909329 | 0.08 |
ENST00000368467.3 |
PMVK |
phosphomevalonate kinase |
| chr1_+_6640108 | 0.08 |
ENST00000377674.4 ENST00000488936.1 |
ZBTB48 |
zinc finger and BTB domain containing 48 |
| chr8_+_26247878 | 0.08 |
ENST00000518611.1 |
BNIP3L |
BCL2/adenovirus E1B 19kDa interacting protein 3-like |
| chr9_-_134145880 | 0.08 |
ENST00000372269.3 ENST00000464831.1 |
FAM78A |
family with sequence similarity 78, member A |
| chr20_+_61569463 | 0.08 |
ENST00000266069.3 |
GID8 |
GID complex subunit 8 |
| chr16_+_86612112 | 0.08 |
ENST00000320241.3 |
FOXL1 |
forkhead box L1 |
| chr7_+_134464376 | 0.08 |
ENST00000454108.1 ENST00000361675.2 |
CALD1 |
caldesmon 1 |
| chr8_-_7220490 | 0.08 |
ENST00000400078.2 |
ZNF705G |
zinc finger protein 705G |
| chr8_+_52730143 | 0.08 |
ENST00000415643.1 |
AC090186.1 |
Uncharacterized protein |
| chrX_+_55744228 | 0.08 |
ENST00000262850.7 |
RRAGB |
Ras-related GTP binding B |
| chr11_-_796197 | 0.08 |
ENST00000530360.1 ENST00000528606.1 ENST00000320230.5 |
SLC25A22 |
solute carrier family 25 (mitochondrial carrier: glutamate), member 22 |
| chr2_-_68052694 | 0.08 |
ENST00000457448.1 |
AC010987.6 |
AC010987.6 |
| chr4_-_156787425 | 0.08 |
ENST00000537611.2 |
ASIC5 |
acid-sensing (proton-gated) ion channel family member 5 |
| chr18_+_32556892 | 0.08 |
ENST00000591734.1 ENST00000413393.1 ENST00000589180.1 ENST00000587359.1 |
MAPRE2 |
microtubule-associated protein, RP/EB family, member 2 |
| chr7_+_40174565 | 0.08 |
ENST00000309930.5 ENST00000401647.2 ENST00000335693.4 ENST00000413931.1 ENST00000416370.1 ENST00000540834.1 |
C7orf10 |
succinylCoA:glutarate-CoA transferase |
| chr2_+_220144052 | 0.07 |
ENST00000425450.1 ENST00000392086.4 ENST00000421532.1 |
DNAJB2 |
DnaJ (Hsp40) homolog, subfamily B, member 2 |
Gene Ontology Analysis
Gene overrepresentation in biological_process category:
| Log-likelihood per target | Total log-likelihood | Term | Description |
|---|---|---|---|
| 0.1 | 0.4 | GO:0007037 | vacuolar phosphate transport(GO:0007037) positive regulation of mitotic cell cycle DNA replication(GO:1903465) positive regulation of parathyroid hormone secretion(GO:2000830) |
| 0.1 | 0.6 | GO:0008218 | bioluminescence(GO:0008218) |
| 0.1 | 0.2 | GO:0007412 | axon target recognition(GO:0007412) |
| 0.1 | 0.3 | GO:1902268 | negative regulation of polyamine transmembrane transport(GO:1902268) |
| 0.1 | 0.4 | GO:0090131 | mesenchyme migration(GO:0090131) |
| 0.1 | 0.2 | GO:0009236 | cobalamin biosynthetic process(GO:0009236) |
| 0.1 | 0.3 | GO:0000720 | pyrimidine dimer repair by nucleotide-excision repair(GO:0000720) |
| 0.0 | 0.2 | GO:2000342 | negative regulation of chemokine (C-X-C motif) ligand 2 production(GO:2000342) |
| 0.0 | 0.1 | GO:1903225 | negative regulation of endodermal cell differentiation(GO:1903225) |
| 0.0 | 0.2 | GO:0070171 | negative regulation of tooth mineralization(GO:0070171) |
| 0.0 | 0.3 | GO:0052199 | negative regulation of catalytic activity in other organism involved in symbiotic interaction(GO:0052199) |
| 0.0 | 0.2 | GO:0046110 | xanthine metabolic process(GO:0046110) |
| 0.0 | 0.2 | GO:1903644 | regulation of chaperone-mediated protein folding(GO:1903644) |
| 0.0 | 0.1 | GO:0090675 | intermicrovillar adhesion(GO:0090675) |
| 0.0 | 0.6 | GO:1900747 | negative regulation of vascular endothelial growth factor signaling pathway(GO:1900747) |
| 0.0 | 0.2 | GO:0061767 | negative regulation of lung blood pressure(GO:0061767) |
| 0.0 | 0.1 | GO:0051414 | response to cortisol(GO:0051414) |
| 0.0 | 0.4 | GO:0035583 | sequestering of TGFbeta in extracellular matrix(GO:0035583) |
| 0.0 | 0.3 | GO:0060842 | arterial endothelial cell differentiation(GO:0060842) |
| 0.0 | 0.2 | GO:0040038 | polar body extrusion after meiotic divisions(GO:0040038) formin-nucleated actin cable assembly(GO:0070649) |
| 0.0 | 0.1 | GO:0006566 | threonine metabolic process(GO:0006566) |
| 0.0 | 0.2 | GO:0010760 | negative regulation of macrophage chemotaxis(GO:0010760) |
| 0.0 | 0.2 | GO:0001555 | oocyte growth(GO:0001555) |
| 0.0 | 0.1 | GO:1901979 | regulation of inward rectifier potassium channel activity(GO:1901979) |
| 0.0 | 0.1 | GO:0014827 | intestine smooth muscle contraction(GO:0014827) |
| 0.0 | 0.3 | GO:0071798 | response to prostaglandin D(GO:0071798) cellular response to prostaglandin D stimulus(GO:0071799) |
| 0.0 | 0.1 | GO:0018352 | protein-pyridoxal-5-phosphate linkage(GO:0018352) |
| 0.0 | 0.1 | GO:0036292 | DNA rewinding(GO:0036292) |
| 0.0 | 0.5 | GO:0043374 | CD8-positive, alpha-beta T cell differentiation(GO:0043374) |
| 0.0 | 0.1 | GO:0019287 | isopentenyl diphosphate biosynthetic process, mevalonate pathway(GO:0019287) |
| 0.0 | 0.2 | GO:0031022 | nuclear migration along microfilament(GO:0031022) |
| 0.0 | 0.6 | GO:0035493 | SNARE complex assembly(GO:0035493) |
| 0.0 | 0.1 | GO:0097156 | fasciculation of motor neuron axon(GO:0097156) |
| 0.0 | 0.1 | GO:0044691 | tooth eruption(GO:0044691) |
| 0.0 | 0.1 | GO:0031548 | regulation of brain-derived neurotrophic factor receptor signaling pathway(GO:0031548) |
| 0.0 | 0.3 | GO:0042908 | xenobiotic transport(GO:0042908) |
| 0.0 | 0.4 | GO:0000338 | protein deneddylation(GO:0000338) |
| 0.0 | 0.1 | GO:1900158 | positive regulation of osteoclast proliferation(GO:0090290) negative regulation of bone mineralization involved in bone maturation(GO:1900158) |
| 0.0 | 0.1 | GO:0098923 | retrograde trans-synaptic signaling by soluble gas(GO:0098923) trans-synaptic signaling by soluble gas(GO:0099543) trans-synaptic signaling by trans-synaptic complex(GO:0099545) |
| 0.0 | 0.4 | GO:0098828 | positive regulation of inhibitory postsynaptic potential(GO:0097151) modulation of inhibitory postsynaptic potential(GO:0098828) |
| 0.0 | 0.2 | GO:0001554 | luteolysis(GO:0001554) |
| 0.0 | 0.1 | GO:0021986 | epithalamus development(GO:0021538) habenula development(GO:0021986) |
| 0.0 | 0.1 | GO:0014016 | neuroblast differentiation(GO:0014016) |
| 0.0 | 0.5 | GO:0071447 | cellular response to hydroperoxide(GO:0071447) |
| 0.0 | 0.1 | GO:0061300 | cerebellum vasculature development(GO:0061300) |
| 0.0 | 0.2 | GO:0060754 | positive regulation of mast cell chemotaxis(GO:0060754) |
| 0.0 | 0.1 | GO:0006171 | cAMP biosynthetic process(GO:0006171) |
| 0.0 | 0.1 | GO:0002018 | renin-angiotensin regulation of aldosterone production(GO:0002018) |
| 0.0 | 0.1 | GO:0097577 | intracellular sequestering of iron ion(GO:0006880) sequestering of iron ion(GO:0097577) |
| 0.0 | 0.2 | GO:0071896 | protein localization to adherens junction(GO:0071896) |
| 0.0 | 0.2 | GO:0003025 | regulation of systemic arterial blood pressure by baroreceptor feedback(GO:0003025) |
| 0.0 | 0.2 | GO:0016191 | synaptic vesicle uncoating(GO:0016191) |
| 0.0 | 0.1 | GO:0001880 | Mullerian duct regression(GO:0001880) |
| 0.0 | 0.1 | GO:1990253 | cellular response to leucine starvation(GO:1990253) |
| 0.0 | 0.2 | GO:0010898 | positive regulation of triglyceride catabolic process(GO:0010898) |
| 0.0 | 0.2 | GO:0010891 | negative regulation of sequestering of triglyceride(GO:0010891) protein localization to nuclear pore(GO:0090204) |
| 0.0 | 0.1 | GO:0061146 | Peyer's patch morphogenesis(GO:0061146) |
| 0.0 | 0.1 | GO:0006104 | succinyl-CoA metabolic process(GO:0006104) |
| 0.0 | 0.1 | GO:0048388 | endosomal lumen acidification(GO:0048388) |
| 0.0 | 0.1 | GO:0001970 | positive regulation of activation of membrane attack complex(GO:0001970) |
| 0.0 | 0.2 | GO:1904936 | cerebral cortex GABAergic interneuron migration(GO:0021853) interneuron migration(GO:1904936) |
| 0.0 | 0.0 | GO:0002636 | positive regulation of germinal center formation(GO:0002636) |
| 0.0 | 0.1 | GO:0019509 | L-methionine biosynthetic process from methylthioadenosine(GO:0019509) |
| 0.0 | 0.1 | GO:0007525 | somatic muscle development(GO:0007525) |
| 0.0 | 0.1 | GO:0031860 | telomeric 3' overhang formation(GO:0031860) |
| 0.0 | 0.1 | GO:0010833 | telomere maintenance via telomere lengthening(GO:0010833) |
| 0.0 | 0.1 | GO:0018283 | metal incorporation into metallo-sulfur cluster(GO:0018282) iron incorporation into metallo-sulfur cluster(GO:0018283) |
| 0.0 | 0.1 | GO:0071400 | cellular response to oleic acid(GO:0071400) |
| 0.0 | 0.1 | GO:0045039 | protein import into mitochondrial inner membrane(GO:0045039) |
| 0.0 | 0.0 | GO:0031455 | glycine betaine biosynthetic process from choline(GO:0019285) glycine betaine metabolic process(GO:0031455) glycine betaine biosynthetic process(GO:0031456) |
| 0.0 | 0.4 | GO:0007183 | SMAD protein complex assembly(GO:0007183) |
| 0.0 | 0.0 | GO:0009441 | glycolate metabolic process(GO:0009441) |
| 0.0 | 0.0 | GO:0098746 | fast, calcium ion-dependent exocytosis of neurotransmitter(GO:0098746) |
| 0.0 | 0.1 | GO:0019255 | glucose 1-phosphate metabolic process(GO:0019255) |
| 0.0 | 0.1 | GO:0015742 | alpha-ketoglutarate transport(GO:0015742) |
| 0.0 | 0.1 | GO:0006627 | protein processing involved in protein targeting to mitochondrion(GO:0006627) |
| 0.0 | 0.0 | GO:0002125 | maternal aggressive behavior(GO:0002125) positive regulation of norepinephrine secretion(GO:0010701) positive regulation of female receptivity(GO:0045925) |
| 0.0 | 0.3 | GO:1900103 | positive regulation of endoplasmic reticulum unfolded protein response(GO:1900103) |
| 0.0 | 0.1 | GO:0035694 | mitochondrial protein catabolic process(GO:0035694) |
| 0.0 | 0.2 | GO:0019371 | cyclooxygenase pathway(GO:0019371) |
| 0.0 | 0.1 | GO:0009082 | branched-chain amino acid biosynthetic process(GO:0009082) leucine biosynthetic process(GO:0009098) valine biosynthetic process(GO:0009099) |
| 0.0 | 0.1 | GO:0046604 | positive regulation of mitotic centrosome separation(GO:0046604) |
| 0.0 | 0.1 | GO:0098532 | histone H3-K27 trimethylation(GO:0098532) |
| 0.0 | 0.1 | GO:0070885 | positive regulation of sodium:proton antiporter activity(GO:0032417) negative regulation of calcineurin-NFAT signaling cascade(GO:0070885) |
| 0.0 | 0.1 | GO:1901655 | cellular response to ketone(GO:1901655) |
| 0.0 | 0.1 | GO:0007288 | sperm axoneme assembly(GO:0007288) |
| 0.0 | 0.0 | GO:0002384 | hepatic immune response(GO:0002384) |
| 0.0 | 0.0 | GO:0045229 | cell envelope organization(GO:0043163) external encapsulating structure organization(GO:0045229) |
| 0.0 | 0.4 | GO:1901685 | glutathione derivative metabolic process(GO:1901685) glutathione derivative biosynthetic process(GO:1901687) |
| 0.0 | 0.0 | GO:0006540 | glutamate decarboxylation to succinate(GO:0006540) |
Gene overrepresentation in cellular_component category:
| Log-likelihood per target | Total log-likelihood | Term | Description |
|---|---|---|---|
| 0.1 | 0.3 | GO:1990578 | perinuclear endoplasmic reticulum membrane(GO:1990578) |
| 0.1 | 0.4 | GO:0030485 | smooth muscle contractile fiber(GO:0030485) |
| 0.0 | 0.1 | GO:0005588 | collagen type V trimer(GO:0005588) |
| 0.0 | 0.4 | GO:1990111 | spermatoproteasome complex(GO:1990111) |
| 0.0 | 0.3 | GO:0000110 | nucleotide-excision repair factor 1 complex(GO:0000110) |
| 0.0 | 0.6 | GO:0005589 | collagen type VI trimer(GO:0005589) collagen beaded filament(GO:0098647) |
| 0.0 | 0.1 | GO:0042720 | mitochondrial inner membrane peptidase complex(GO:0042720) |
| 0.0 | 0.1 | GO:0008043 | intracellular ferritin complex(GO:0008043) ferritin complex(GO:0070288) |
| 0.0 | 0.2 | GO:1990131 | Gtr1-Gtr2 GTPase complex(GO:1990131) |
| 0.0 | 0.2 | GO:0071144 | SMAD2-SMAD3 protein complex(GO:0071144) |
| 0.0 | 0.2 | GO:0005579 | membrane attack complex(GO:0005579) |
| 0.0 | 0.1 | GO:0089717 | spanning component of plasma membrane(GO:0044214) spanning component of membrane(GO:0089717) |
| 0.0 | 0.2 | GO:0017059 | serine C-palmitoyltransferase complex(GO:0017059) endoplasmic reticulum palmitoyltransferase complex(GO:0031211) |
| 0.0 | 0.2 | GO:0030062 | mitochondrial tricarboxylic acid cycle enzyme complex(GO:0030062) |
| 0.0 | 0.4 | GO:0005614 | interstitial matrix(GO:0005614) |
| 0.0 | 0.1 | GO:0097629 | extrinsic component of omegasome membrane(GO:0097629) |
| 0.0 | 0.2 | GO:0098651 | basement membrane collagen trimer(GO:0098651) |
| 0.0 | 0.1 | GO:0002177 | manchette(GO:0002177) |
| 0.0 | 0.4 | GO:0043205 | microfibril(GO:0001527) fibril(GO:0043205) |
| 0.0 | 0.2 | GO:0044666 | MLL3/4 complex(GO:0044666) |
| 0.0 | 0.2 | GO:0005664 | origin recognition complex(GO:0000808) nuclear origin of replication recognition complex(GO:0005664) |
| 0.0 | 0.2 | GO:0097025 | MPP7-DLG1-LIN7 complex(GO:0097025) |
| 0.0 | 0.6 | GO:0005720 | nuclear heterochromatin(GO:0005720) |
| 0.0 | 0.2 | GO:0030478 | actin cap(GO:0030478) |
| 0.0 | 0.1 | GO:0044298 | neuronal cell body membrane(GO:0032809) cell body membrane(GO:0044298) |
| 0.0 | 0.1 | GO:0072558 | NLRP1 inflammasome complex(GO:0072558) protease inhibitor complex(GO:0097179) |
| 0.0 | 0.0 | GO:0005863 | striated muscle myosin thick filament(GO:0005863) |
Gene overrepresentation in molecular_function category:
| Log-likelihood per target | Total log-likelihood | Term | Description |
|---|---|---|---|
| 0.1 | 0.7 | GO:0008321 | Ral guanyl-nucleotide exchange factor activity(GO:0008321) |
| 0.1 | 0.3 | GO:0004958 | prostaglandin F receptor activity(GO:0004958) |
| 0.1 | 0.4 | GO:0050436 | microfibril binding(GO:0050436) |
| 0.1 | 0.3 | GO:0008073 | ornithine decarboxylase inhibitor activity(GO:0008073) |
| 0.1 | 0.2 | GO:0031694 | alpha-2A adrenergic receptor binding(GO:0031694) |
| 0.0 | 0.2 | GO:0004666 | prostaglandin-endoperoxide synthase activity(GO:0004666) |
| 0.0 | 0.3 | GO:0001594 | trace-amine receptor activity(GO:0001594) |
| 0.0 | 0.1 | GO:0010309 | acireductone dioxygenase [iron(II)-requiring] activity(GO:0010309) |
| 0.0 | 0.3 | GO:1990599 | 3' overhang single-stranded DNA endodeoxyribonuclease activity(GO:1990599) |
| 0.0 | 0.2 | GO:0031962 | mineralocorticoid receptor binding(GO:0031962) |
| 0.0 | 0.2 | GO:0016454 | serine C-palmitoyltransferase activity(GO:0004758) C-palmitoyltransferase activity(GO:0016454) |
| 0.0 | 0.1 | GO:0004031 | aldehyde oxidase activity(GO:0004031) |
| 0.0 | 0.4 | GO:0005007 | fibroblast growth factor-activated receptor activity(GO:0005007) |
| 0.0 | 0.3 | GO:0043559 | insulin binding(GO:0043559) |
| 0.0 | 0.1 | GO:0004774 | succinate-CoA ligase activity(GO:0004774) |
| 0.0 | 0.1 | GO:0015173 | aromatic amino acid transmembrane transporter activity(GO:0015173) |
| 0.0 | 0.3 | GO:0008559 | xenobiotic-transporting ATPase activity(GO:0008559) |
| 0.0 | 0.3 | GO:0001849 | complement component C1q binding(GO:0001849) |
| 0.0 | 0.1 | GO:0047708 | biotinidase activity(GO:0047708) |
| 0.0 | 0.2 | GO:0043183 | vascular endothelial growth factor receptor 1 binding(GO:0043183) |
| 0.0 | 0.1 | GO:0004574 | oligo-1,6-glucosidase activity(GO:0004574) |
| 0.0 | 0.1 | GO:0050528 | acyloxyacyl hydrolase activity(GO:0050528) |
| 0.0 | 0.1 | GO:0051373 | FATZ binding(GO:0051373) |
| 0.0 | 0.1 | GO:0005169 | neurotrophin TRKB receptor binding(GO:0005169) |
| 0.0 | 0.1 | GO:0031780 | corticotropin hormone receptor binding(GO:0031780) type 5 melanocortin receptor binding(GO:0031783) |
| 0.0 | 0.1 | GO:0031728 | CCR3 chemokine receptor binding(GO:0031728) |
| 0.0 | 0.1 | GO:0004874 | aryl hydrocarbon receptor activity(GO:0004874) |
| 0.0 | 0.1 | GO:0030021 | extracellular matrix structural constituent conferring compression resistance(GO:0030021) structural constituent of tooth enamel(GO:0030345) |
| 0.0 | 0.1 | GO:0003826 | alpha-ketoacid dehydrogenase activity(GO:0003826) 3-methyl-2-oxobutanoate dehydrogenase (2-methylpropanoyl-transferring) activity(GO:0003863) |
| 0.0 | 0.1 | GO:0031071 | cysteine desulfurase activity(GO:0031071) |
| 0.0 | 0.1 | GO:0004087 | carbamoyl-phosphate synthase (ammonia) activity(GO:0004087) carbamoyl-phosphate synthase (glutamine-hydrolyzing) activity(GO:0004088) |
| 0.0 | 0.1 | GO:0071209 | U7 snRNA binding(GO:0071209) |
| 0.0 | 0.1 | GO:0005280 | hydrogen:amino acid symporter activity(GO:0005280) |
| 0.0 | 0.1 | GO:0072320 | volume-sensitive chloride channel activity(GO:0072320) |
| 0.0 | 0.1 | GO:0033265 | acetylcholinesterase activity(GO:0003990) choline binding(GO:0033265) |
| 0.0 | 0.5 | GO:0005545 | 1-phosphatidylinositol binding(GO:0005545) |
| 0.0 | 0.1 | GO:0030060 | L-malate dehydrogenase activity(GO:0030060) |
| 0.0 | 0.0 | GO:0016503 | pheromone receptor activity(GO:0016503) |
| 0.0 | 0.1 | GO:0015140 | malate transmembrane transporter activity(GO:0015140) |
| 0.0 | 0.1 | GO:0032558 | adenyl deoxyribonucleotide binding(GO:0032558) dATP binding(GO:0032564) |
| 0.0 | 0.1 | GO:0016846 | carbon-sulfur lyase activity(GO:0016846) |
| 0.0 | 0.0 | GO:0004937 | alpha1-adrenergic receptor activity(GO:0004937) |
| 0.0 | 0.4 | GO:0004298 | threonine-type endopeptidase activity(GO:0004298) threonine-type peptidase activity(GO:0070003) |
| 0.0 | 0.0 | GO:0019166 | trans-2-enoyl-CoA reductase (NADPH) activity(GO:0019166) |
| 0.0 | 0.0 | GO:0051748 | UTP:glucose-1-phosphate uridylyltransferase activity(GO:0003983) UTP-monosaccharide-1-phosphate uridylyltransferase activity(GO:0051748) |
| 0.0 | 0.3 | GO:0008349 | MAP kinase kinase kinase kinase activity(GO:0008349) |
| 0.0 | 0.7 | GO:0005484 | SNAP receptor activity(GO:0005484) |
| 0.0 | 0.1 | GO:0044736 | acid-sensing ion channel activity(GO:0044736) |
| 0.0 | 0.0 | GO:0016623 | oxidoreductase activity, acting on the aldehyde or oxo group of donors, oxygen as acceptor(GO:0016623) |
| 0.0 | 0.2 | GO:0005132 | type I interferon receptor binding(GO:0005132) |
| 0.0 | 0.1 | GO:0001515 | opioid peptide activity(GO:0001515) |
| 0.0 | 0.0 | GO:0033858 | N-acetylgalactosamine kinase activity(GO:0033858) |
| 0.0 | 0.1 | GO:0070139 | ubiquitin-like protein-specific endopeptidase activity(GO:0070137) SUMO-specific endopeptidase activity(GO:0070139) |
| 0.0 | 0.1 | GO:0052654 | branched-chain-amino-acid transaminase activity(GO:0004084) L-leucine transaminase activity(GO:0052654) L-valine transaminase activity(GO:0052655) L-isoleucine transaminase activity(GO:0052656) |
| 0.0 | 0.1 | GO:0036402 | proteasome-activating ATPase activity(GO:0036402) |
| 0.0 | 0.1 | GO:0030618 | transforming growth factor beta receptor, pathway-specific cytoplasmic mediator activity(GO:0030618) |
| 0.0 | 0.0 | GO:0004967 | glucagon receptor activity(GO:0004967) |
| 0.0 | 0.1 | GO:0017060 | 3-galactosyl-N-acetylglucosaminide 4-alpha-L-fucosyltransferase activity(GO:0017060) |
| 0.0 | 0.0 | GO:0045145 | single-stranded DNA 5'-3' exodeoxyribonuclease activity(GO:0045145) |
| 0.0 | 0.0 | GO:0019981 | interleukin-6 receptor activity(GO:0004915) interleukin-6 binding(GO:0019981) |
Gene overrepresentation in C2:CP category:
| Log-likelihood per target | Total log-likelihood | Term | Description |
|---|---|---|---|
| 0.0 | 1.2 | PID FGF PATHWAY | FGF signaling pathway |
Gene overrepresentation in C2:CP:REACTOME category:
| Log-likelihood per target | Total log-likelihood | Term | Description |
|---|---|---|---|
| 0.0 | 0.4 | REACTOME NOREPINEPHRINE NEUROTRANSMITTER RELEASE CYCLE | Genes involved in Norepinephrine Neurotransmitter Release Cycle |
| 0.0 | 1.2 | REACTOME A TETRASACCHARIDE LINKER SEQUENCE IS REQUIRED FOR GAG SYNTHESIS | Genes involved in A tetrasaccharide linker sequence is required for GAG synthesis |
| 0.0 | 0.4 | REACTOME SIGNALING BY ACTIVATED POINT MUTANTS OF FGFR1 | Genes involved in Signaling by activated point mutants of FGFR1 |
| 0.0 | 0.3 | REACTOME PROSTANOID LIGAND RECEPTORS | Genes involved in Prostanoid ligand receptors |
| 0.0 | 0.6 | REACTOME PROTEOLYTIC CLEAVAGE OF SNARE COMPLEX PROTEINS | Genes involved in Proteolytic cleavage of SNARE complex proteins |
| 0.0 | 0.4 | REACTOME TERMINATION OF O GLYCAN BIOSYNTHESIS | Genes involved in Termination of O-glycan biosynthesis |
| 0.0 | 0.4 | REACTOME CELL EXTRACELLULAR MATRIX INTERACTIONS | Genes involved in Cell-extracellular matrix interactions |
| 0.0 | 0.6 | REACTOME DOWNREGULATION OF TGF BETA RECEPTOR SIGNALING | Genes involved in Downregulation of TGF-beta receptor signaling |
| 0.0 | 0.4 | REACTOME ADHERENS JUNCTIONS INTERACTIONS | Genes involved in Adherens junctions interactions |
| 0.0 | 0.3 | REACTOME IL 7 SIGNALING | Genes involved in Interleukin-7 signaling |
| 0.0 | 0.5 | REACTOME ABC FAMILY PROTEINS MEDIATED TRANSPORT | Genes involved in ABC-family proteins mediated transport |
| 0.0 | 0.9 | REACTOME REGULATION OF ORNITHINE DECARBOXYLASE ODC | Genes involved in Regulation of ornithine decarboxylase (ODC) |
| 0.0 | 0.3 | REACTOME FORMATION OF INCISION COMPLEX IN GG NER | Genes involved in Formation of incision complex in GG-NER |
| 0.0 | 0.3 | REACTOME REGULATION OF GENE EXPRESSION IN BETA CELLS | Genes involved in Regulation of gene expression in beta cells |
| 0.0 | 0.3 | REACTOME DCC MEDIATED ATTRACTIVE SIGNALING | Genes involved in DCC mediated attractive signaling |