Project
Epithelial-Mesenchymal Transition, human (Scheel, 2011)
Navigation
Downloads
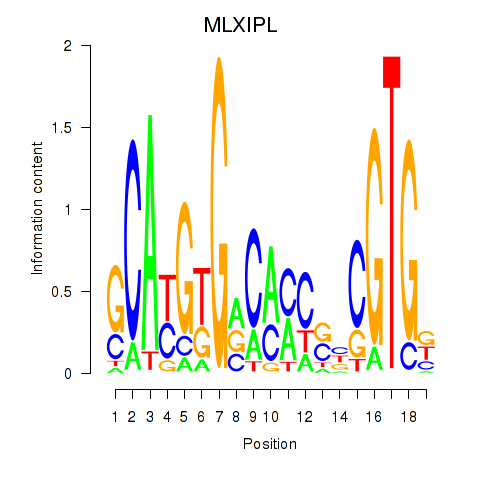
Results for MLXIPL
Z-value: 0.86
Motif logo
Transcription factors associated with MLXIPL
| Gene Symbol | Gene ID | Gene Info |
|---|---|---|
|
MLXIPL
|
ENSG00000009950.11 | MLXIPL |
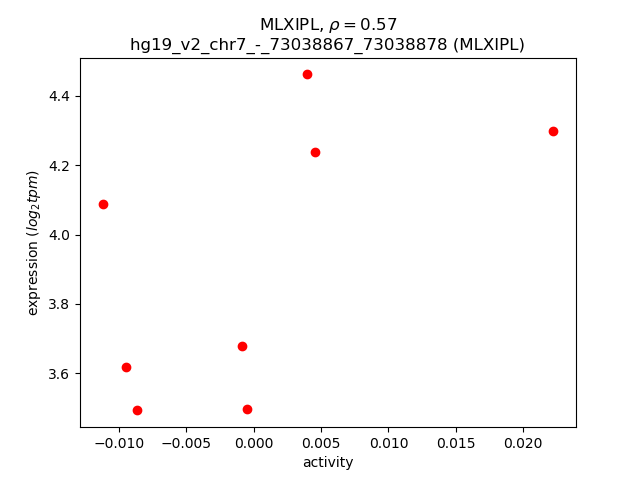
Activity-expression correlation:
| Gene | Promoter | Pearson corr. coef. | P-value | Plot |
|---|---|---|---|---|
| MLXIPL | hg19_v2_chr7_-_73038867_73038878, hg19_v2_chr7_-_73038822_73038862 | 0.57 | 1.4e-01 | Click! |
Activity profile of MLXIPL motif
Sorted Z-values of MLXIPL motif
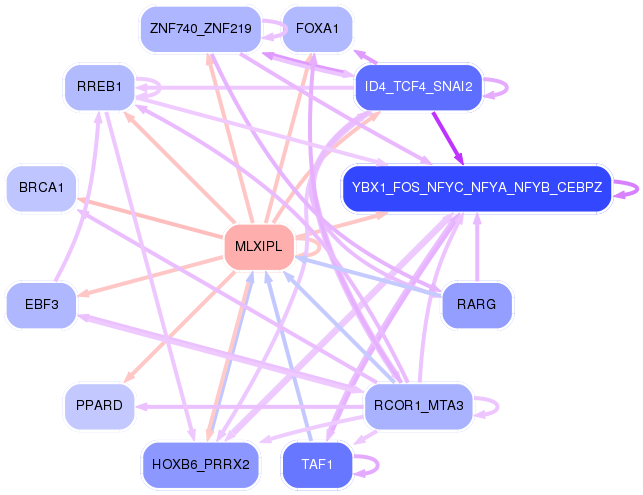
Network of associatons between targets according to the STRING database.

First level regulatory network of MLXIPL
| Promoter | Score | Transcript | Gene | Gene Info |
|---|---|---|---|---|
| chr18_+_21452804 | 1.39 |
ENST00000269217.6 |
LAMA3 |
laminin, alpha 3 |
| chr1_+_44401479 | 1.08 |
ENST00000438616.3 |
ARTN |
artemin |
| chr16_+_68679193 | 1.01 |
ENST00000581171.1 |
CDH3 |
cadherin 3, type 1, P-cadherin (placental) |
| chr19_-_36004543 | 0.93 |
ENST00000339686.3 ENST00000447113.2 ENST00000440396.1 |
DMKN |
dermokine |
| chr18_+_21452964 | 0.87 |
ENST00000587184.1 |
LAMA3 |
laminin, alpha 3 |
| chr17_-_3599492 | 0.82 |
ENST00000435558.1 ENST00000345901.3 |
P2RX5 |
purinergic receptor P2X, ligand-gated ion channel, 5 |
| chr22_-_20255212 | 0.82 |
ENST00000416372.1 |
RTN4R |
reticulon 4 receptor |
| chr18_-_28681950 | 0.74 |
ENST00000251081.6 |
DSC2 |
desmocollin 2 |
| chr18_+_21529811 | 0.72 |
ENST00000588004.1 |
LAMA3 |
laminin, alpha 3 |
| chr16_+_66914264 | 0.68 |
ENST00000311765.2 ENST00000568869.1 ENST00000561704.1 ENST00000568398.1 ENST00000566776.1 |
PDP2 |
pyruvate dehyrogenase phosphatase catalytic subunit 2 |
| chr1_+_209602156 | 0.66 |
ENST00000429156.1 ENST00000366437.3 ENST00000603283.1 ENST00000431096.1 |
MIR205HG |
MIR205 host gene (non-protein coding) |
| chr19_+_45281118 | 0.65 |
ENST00000270279.3 ENST00000341505.4 |
CBLC |
Cbl proto-oncogene C, E3 ubiquitin protein ligase |
| chr18_-_47376197 | 0.65 |
ENST00000592688.1 |
MYO5B |
myosin VB |
| chr4_-_153601136 | 0.63 |
ENST00000504064.1 ENST00000304385.3 |
TMEM154 |
transmembrane protein 154 |
| chr11_-_118134997 | 0.60 |
ENST00000278937.2 |
MPZL2 |
myelin protein zero-like 2 |
| chr19_+_46732988 | 0.58 |
ENST00000437936.1 |
IGFL1 |
IGF-like family member 1 |
| chr4_+_75311019 | 0.58 |
ENST00000502307.1 |
AREG |
amphiregulin |
| chr12_-_51785182 | 0.57 |
ENST00000356317.3 ENST00000603188.1 ENST00000604847.1 ENST00000604506.1 |
GALNT6 |
UDP-N-acetyl-alpha-D-galactosamine:polypeptide N-acetylgalactosaminyltransferase 6 (GalNAc-T6) |
| chr4_+_75310851 | 0.57 |
ENST00000395748.3 ENST00000264487.2 |
AREG |
amphiregulin |
| chr8_-_57232656 | 0.57 |
ENST00000396721.2 |
SDR16C5 |
short chain dehydrogenase/reductase family 16C, member 5 |
| chr2_+_47596287 | 0.55 |
ENST00000263735.4 |
EPCAM |
epithelial cell adhesion molecule |
| chr22_+_29279552 | 0.54 |
ENST00000544604.2 |
ZNRF3 |
zinc and ring finger 3 |
| chr16_+_68678892 | 0.54 |
ENST00000429102.2 |
CDH3 |
cadherin 3, type 1, P-cadherin (placental) |
| chr10_+_118187379 | 0.53 |
ENST00000369230.3 |
PNLIPRP3 |
pancreatic lipase-related protein 3 |
| chr8_+_86376081 | 0.53 |
ENST00000285379.5 |
CA2 |
carbonic anhydrase II |
| chr2_-_113594279 | 0.52 |
ENST00000416750.1 ENST00000418817.1 ENST00000263341.2 |
IL1B |
interleukin 1, beta |
| chr4_-_10023095 | 0.52 |
ENST00000264784.3 |
SLC2A9 |
solute carrier family 2 (facilitated glucose transporter), member 9 |
| chr11_-_118135160 | 0.51 |
ENST00000438295.2 |
MPZL2 |
myelin protein zero-like 2 |
| chr9_-_132515302 | 0.51 |
ENST00000340607.4 |
PTGES |
prostaglandin E synthase |
| chr4_-_187644930 | 0.51 |
ENST00000441802.2 |
FAT1 |
FAT atypical cadherin 1 |
| chr19_-_15090488 | 0.50 |
ENST00000594383.1 ENST00000598504.1 ENST00000597262.1 |
SLC1A6 |
solute carrier family 1 (high affinity aspartate/glutamate transporter), member 6 |
| chr14_-_105635090 | 0.49 |
ENST00000331782.3 ENST00000347004.2 |
JAG2 |
jagged 2 |
| chr18_+_21269404 | 0.48 |
ENST00000313654.9 |
LAMA3 |
laminin, alpha 3 |
| chr10_-_105845674 | 0.47 |
ENST00000353479.5 ENST00000369733.3 |
COL17A1 |
collagen, type XVII, alpha 1 |
| chr12_-_28123206 | 0.47 |
ENST00000542963.1 ENST00000535992.1 |
PTHLH |
parathyroid hormone-like hormone |
| chr1_-_85462762 | 0.46 |
ENST00000284027.5 |
MCOLN2 |
mucolipin 2 |
| chr16_+_68678739 | 0.45 |
ENST00000264012.4 |
CDH3 |
cadherin 3, type 1, P-cadherin (placental) |
| chr10_-_118928543 | 0.45 |
ENST00000419373.2 |
RP11-501J20.2 |
RP11-501J20.2 |
| chr10_-_135090360 | 0.44 |
ENST00000486609.1 ENST00000445355.3 ENST00000485491.2 |
ADAM8 |
ADAM metallopeptidase domain 8 |
| chr17_+_3539998 | 0.44 |
ENST00000452111.1 ENST00000574776.1 ENST00000441220.2 ENST00000414524.2 |
CTNS |
cystinosin, lysosomal cystine transporter |
| chr18_+_59992527 | 0.44 |
ENST00000586569.1 |
TNFRSF11A |
tumor necrosis factor receptor superfamily, member 11a, NFKB activator |
| chr7_+_26191809 | 0.43 |
ENST00000056233.3 |
NFE2L3 |
nuclear factor, erythroid 2-like 3 |
| chr5_-_172036436 | 0.42 |
ENST00000601856.1 |
AC027309.1 |
AC027309.1 |
| chr11_+_18287721 | 0.42 |
ENST00000356524.4 |
SAA1 |
serum amyloid A1 |
| chr1_-_85462623 | 0.41 |
ENST00000370608.3 |
MCOLN2 |
mucolipin 2 |
| chr17_-_17109579 | 0.41 |
ENST00000321560.3 |
PLD6 |
phospholipase D family, member 6 |
| chr17_+_54671047 | 0.40 |
ENST00000332822.4 |
NOG |
noggin |
| chr18_+_34124507 | 0.40 |
ENST00000591635.1 |
FHOD3 |
formin homology 2 domain containing 3 |
| chr11_+_18287801 | 0.40 |
ENST00000532858.1 ENST00000405158.2 |
SAA1 |
serum amyloid A1 |
| chr6_+_130686856 | 0.39 |
ENST00000296978.3 |
TMEM200A |
transmembrane protein 200A |
| chr18_-_28682374 | 0.39 |
ENST00000280904.6 |
DSC2 |
desmocollin 2 |
| chr17_+_7942335 | 0.39 |
ENST00000380183.4 ENST00000572022.1 ENST00000380173.2 |
ALOX15B |
arachidonate 15-lipoxygenase, type B |
| chr10_+_81466084 | 0.39 |
ENST00000342531.2 |
NUTM2B |
NUT family member 2B |
| chr1_+_15479054 | 0.39 |
ENST00000376014.3 ENST00000451326.2 |
TMEM51 |
transmembrane protein 51 |
| chr1_+_60280458 | 0.39 |
ENST00000455990.1 ENST00000371208.3 |
HOOK1 |
hook microtubule-tethering protein 1 |
| chr17_-_3599327 | 0.38 |
ENST00000551178.1 ENST00000552276.1 ENST00000547178.1 |
P2RX5 |
purinergic receptor P2X, ligand-gated ion channel, 5 |
| chr19_+_35739280 | 0.37 |
ENST00000602122.1 |
LSR |
lipolysis stimulated lipoprotein receptor |
| chr20_+_1875942 | 0.37 |
ENST00000358771.4 |
SIRPA |
signal-regulatory protein alpha |
| chr2_+_196521845 | 0.37 |
ENST00000359634.5 ENST00000412905.1 |
SLC39A10 |
solute carrier family 39 (zinc transporter), member 10 |
| chr11_-_18270182 | 0.37 |
ENST00000528349.1 ENST00000526900.1 ENST00000529528.1 ENST00000414546.2 ENST00000256733.4 |
SAA2 |
serum amyloid A2 |
| chr19_-_16045665 | 0.36 |
ENST00000248041.8 |
CYP4F11 |
cytochrome P450, family 4, subfamily F, polypeptide 11 |
| chr1_-_1051736 | 0.36 |
ENST00000448924.1 ENST00000294576.5 ENST00000437760.1 ENST00000462097.1 ENST00000475119.1 |
C1orf159 |
chromosome 1 open reading frame 159 |
| chr11_+_394196 | 0.36 |
ENST00000331563.2 ENST00000531857.1 |
PKP3 |
plakophilin 3 |
| chr10_+_5726764 | 0.36 |
ENST00000328090.5 ENST00000496681.1 |
FAM208B |
family with sequence similarity 208, member B |
| chr19_-_51456344 | 0.36 |
ENST00000336334.3 ENST00000593428.1 |
KLK5 |
kallikrein-related peptidase 5 |
| chr4_+_85504075 | 0.36 |
ENST00000295887.5 |
CDS1 |
CDP-diacylglycerol synthase (phosphatidate cytidylyltransferase) 1 |
| chr19_-_35992780 | 0.35 |
ENST00000593342.1 ENST00000601650.1 ENST00000408915.2 |
DMKN |
dermokine |
| chr16_+_67465016 | 0.35 |
ENST00000326152.5 |
HSD11B2 |
hydroxysteroid (11-beta) dehydrogenase 2 |
| chr10_+_82168240 | 0.35 |
ENST00000372187.5 ENST00000372185.1 |
FAM213A |
family with sequence similarity 213, member A |
| chr1_+_65613217 | 0.35 |
ENST00000545314.1 |
AK4 |
adenylate kinase 4 |
| chr1_-_205290865 | 0.35 |
ENST00000367157.3 |
NUAK2 |
NUAK family, SNF1-like kinase, 2 |
| chr1_-_153363452 | 0.34 |
ENST00000368732.1 ENST00000368733.3 |
S100A8 |
S100 calcium binding protein A8 |
| chr19_+_10216899 | 0.34 |
ENST00000428358.1 ENST00000393796.4 ENST00000253107.7 ENST00000556468.1 ENST00000393793.1 |
PPAN-P2RY11 PPAN |
PPAN-P2RY11 readthrough peter pan homolog (Drosophila) |
| chr3_-_57113314 | 0.34 |
ENST00000338458.4 ENST00000468727.1 |
ARHGEF3 |
Rho guanine nucleotide exchange factor (GEF) 3 |
| chr1_+_152956549 | 0.34 |
ENST00000307122.2 |
SPRR1A |
small proline-rich protein 1A |
| chr19_-_16045619 | 0.34 |
ENST00000402119.4 |
CYP4F11 |
cytochrome P450, family 4, subfamily F, polypeptide 11 |
| chr12_-_71031220 | 0.33 |
ENST00000334414.6 |
PTPRB |
protein tyrosine phosphatase, receptor type, B |
| chr20_+_6748311 | 0.33 |
ENST00000378827.4 |
BMP2 |
bone morphogenetic protein 2 |
| chr5_-_150948414 | 0.33 |
ENST00000261800.5 |
FAT2 |
FAT atypical cadherin 2 |
| chr19_-_51472222 | 0.33 |
ENST00000376851.3 |
KLK6 |
kallikrein-related peptidase 6 |
| chr6_+_31465892 | 0.32 |
ENST00000252229.6 ENST00000427115.1 |
MICB |
MHC class I polypeptide-related sequence B |
| chr11_-_17035943 | 0.32 |
ENST00000355661.3 ENST00000532079.1 ENST00000448080.2 ENST00000531066.1 |
PLEKHA7 |
pleckstrin homology domain containing, family A member 7 |
| chr12_-_85306594 | 0.32 |
ENST00000266682.5 |
SLC6A15 |
solute carrier family 6 (neutral amino acid transporter), member 15 |
| chr17_-_7164410 | 0.32 |
ENST00000574070.1 |
CLDN7 |
claudin 7 |
| chr12_-_71031185 | 0.32 |
ENST00000548122.1 ENST00000551525.1 ENST00000550358.1 |
PTPRB |
protein tyrosine phosphatase, receptor type, B |
| chr6_+_31465849 | 0.32 |
ENST00000399150.3 |
MICB |
MHC class I polypeptide-related sequence B |
| chr13_+_113622757 | 0.32 |
ENST00000375604.2 |
MCF2L |
MCF.2 cell line derived transforming sequence-like |
| chr11_+_33563821 | 0.31 |
ENST00000321505.4 ENST00000265654.5 ENST00000389726.3 |
KIAA1549L |
KIAA1549-like |
| chr1_+_3388181 | 0.31 |
ENST00000418137.1 ENST00000413250.2 |
ARHGEF16 |
Rho guanine nucleotide exchange factor (GEF) 16 |
| chr19_-_51472823 | 0.31 |
ENST00000310157.2 |
KLK6 |
kallikrein-related peptidase 6 |
| chr20_+_61273797 | 0.31 |
ENST00000217159.1 |
SLCO4A1 |
solute carrier organic anion transporter family, member 4A1 |
| chr17_+_74381343 | 0.31 |
ENST00000392496.3 |
SPHK1 |
sphingosine kinase 1 |
| chr9_-_99801592 | 0.31 |
ENST00000259470.5 |
CTSV |
cathepsin V |
| chr8_+_32405785 | 0.31 |
ENST00000287842.3 |
NRG1 |
neuregulin 1 |
| chr19_-_291133 | 0.30 |
ENST00000327790.3 |
PPAP2C |
phosphatidic acid phosphatase type 2C |
| chr19_-_54804173 | 0.30 |
ENST00000391744.3 ENST00000251390.3 |
LILRA3 |
leukocyte immunoglobulin-like receptor, subfamily A (without TM domain), member 3 |
| chr20_-_46415341 | 0.30 |
ENST00000484875.1 ENST00000361612.4 |
SULF2 |
sulfatase 2 |
| chr1_+_31885963 | 0.30 |
ENST00000373709.3 |
SERINC2 |
serine incorporator 2 |
| chr15_+_41136216 | 0.30 |
ENST00000562057.1 ENST00000344051.4 |
SPINT1 |
serine peptidase inhibitor, Kunitz type 1 |
| chr4_-_84255935 | 0.30 |
ENST00000513463.1 |
HPSE |
heparanase |
| chr17_-_17480779 | 0.29 |
ENST00000395782.1 |
PEMT |
phosphatidylethanolamine N-methyltransferase |
| chr19_+_38755042 | 0.29 |
ENST00000301244.7 |
SPINT2 |
serine peptidase inhibitor, Kunitz type, 2 |
| chr4_-_84256024 | 0.29 |
ENST00000311412.5 |
HPSE |
heparanase |
| chr17_-_41277317 | 0.29 |
ENST00000497488.1 ENST00000489037.1 ENST00000470026.1 ENST00000586385.1 ENST00000591534.1 ENST00000591849.1 |
BRCA1 |
breast cancer 1, early onset |
| chr20_-_46415297 | 0.29 |
ENST00000467815.1 ENST00000359930.4 |
SULF2 |
sulfatase 2 |
| chr8_+_32405728 | 0.29 |
ENST00000523079.1 ENST00000338921.4 ENST00000356819.4 ENST00000287845.5 ENST00000341377.5 |
NRG1 |
neuregulin 1 |
| chr11_-_88070920 | 0.29 |
ENST00000524463.1 ENST00000227266.5 |
CTSC |
cathepsin C |
| chr20_+_43935474 | 0.29 |
ENST00000372743.1 ENST00000372741.3 ENST00000343694.3 |
RBPJL |
recombination signal binding protein for immunoglobulin kappa J region-like |
| chr1_-_6479963 | 0.28 |
ENST00000377836.4 ENST00000487437.1 ENST00000489730.1 ENST00000377834.4 |
HES2 |
hes family bHLH transcription factor 2 |
| chr20_+_61287711 | 0.28 |
ENST00000370507.1 |
SLCO4A1 |
solute carrier organic anion transporter family, member 4A1 |
| chr1_+_2004901 | 0.28 |
ENST00000400921.2 |
PRKCZ |
protein kinase C, zeta |
| chr8_+_145597713 | 0.28 |
ENST00000308860.6 ENST00000532190.1 |
ADCK5 |
aarF domain containing kinase 5 |
| chr11_-_1036706 | 0.28 |
ENST00000421673.2 |
MUC6 |
mucin 6, oligomeric mucus/gel-forming |
| chr8_-_124428569 | 0.28 |
ENST00000521903.1 |
ATAD2 |
ATPase family, AAA domain containing 2 |
| chr22_+_45072925 | 0.28 |
ENST00000006251.7 |
PRR5 |
proline rich 5 (renal) |
| chr22_+_31477296 | 0.28 |
ENST00000426927.1 ENST00000440425.1 ENST00000358743.1 ENST00000347557.2 ENST00000333137.7 |
SMTN |
smoothelin |
| chr22_+_45072958 | 0.28 |
ENST00000403581.1 |
PRR5 |
proline rich 5 (renal) |
| chr1_-_175161890 | 0.28 |
ENST00000545251.2 ENST00000423313.1 |
KIAA0040 |
KIAA0040 |
| chr19_-_51472031 | 0.28 |
ENST00000391808.1 |
KLK6 |
kallikrein-related peptidase 6 |
| chr1_+_65613340 | 0.28 |
ENST00000546702.1 |
AK4 |
adenylate kinase 4 |
| chr13_+_37005967 | 0.28 |
ENST00000440264.1 ENST00000449823.1 |
CCNA1 |
cyclin A1 |
| chr16_-_3030283 | 0.27 |
ENST00000572619.1 ENST00000574415.1 ENST00000440027.2 ENST00000572059.1 |
PKMYT1 |
protein kinase, membrane associated tyrosine/threonine 1 |
| chrX_+_37545012 | 0.27 |
ENST00000378616.3 |
XK |
X-linked Kx blood group (McLeod syndrome) |
| chr2_+_220491973 | 0.27 |
ENST00000358055.3 |
SLC4A3 |
solute carrier family 4 (anion exchanger), member 3 |
| chr17_-_41277370 | 0.27 |
ENST00000476777.1 ENST00000491747.2 ENST00000478531.1 ENST00000477152.1 ENST00000357654.3 ENST00000493795.1 ENST00000493919.1 |
BRCA1 |
breast cancer 1, early onset |
| chr3_-_49941042 | 0.27 |
ENST00000344206.4 ENST00000296474.3 |
MST1R |
macrophage stimulating 1 receptor (c-met-related tyrosine kinase) |
| chr3_+_145782358 | 0.27 |
ENST00000422482.1 |
AC107021.1 |
HCG1786590; PRO2533; Uncharacterized protein |
| chr18_+_12254318 | 0.27 |
ENST00000320477.9 |
CIDEA |
cell death-inducing DFFA-like effector a |
| chr10_-_70231639 | 0.27 |
ENST00000551118.2 ENST00000358410.3 ENST00000399180.2 ENST00000399179.2 |
DNA2 |
DNA replication helicase/nuclease 2 |
| chr11_-_67374177 | 0.27 |
ENST00000333139.3 |
C11orf72 |
chromosome 11 open reading frame 72 |
| chr9_-_117111222 | 0.27 |
ENST00000374079.4 |
AKNA |
AT-hook transcription factor |
| chr9_+_72002837 | 0.26 |
ENST00000377216.3 |
FAM189A2 |
family with sequence similarity 189, member A2 |
| chr6_-_163148700 | 0.26 |
ENST00000366894.1 ENST00000338468.3 |
PARK2 |
parkin RBR E3 ubiquitin protein ligase |
| chr20_+_62327996 | 0.26 |
ENST00000369996.1 |
TNFRSF6B |
tumor necrosis factor receptor superfamily, member 6b, decoy |
| chr1_-_212588157 | 0.26 |
ENST00000261455.4 ENST00000535273.1 |
TMEM206 |
transmembrane protein 206 |
| chr12_-_95611149 | 0.26 |
ENST00000549499.1 ENST00000343958.4 ENST00000546711.1 |
FGD6 |
FYVE, RhoGEF and PH domain containing 6 |
| chr19_-_49565254 | 0.26 |
ENST00000593537.1 |
NTF4 |
neurotrophin 4 |
| chr19_-_291365 | 0.26 |
ENST00000591572.1 ENST00000269812.3 ENST00000434325.2 |
PPAP2C |
phosphatidic acid phosphatase type 2C |
| chr12_-_85306562 | 0.26 |
ENST00000551612.1 ENST00000450363.3 ENST00000552192.1 |
SLC6A15 |
solute carrier family 6 (neutral amino acid transporter), member 15 |
| chr11_+_62623621 | 0.26 |
ENST00000535296.1 |
SLC3A2 |
solute carrier family 3 (amino acid transporter heavy chain), member 2 |
| chr19_-_55658687 | 0.26 |
ENST00000593046.1 |
TNNT1 |
troponin T type 1 (skeletal, slow) |
| chr1_+_15256230 | 0.26 |
ENST00000376028.4 ENST00000400798.2 |
KAZN |
kazrin, periplakin interacting protein |
| chr12_+_113376157 | 0.26 |
ENST00000228928.7 |
OAS3 |
2'-5'-oligoadenylate synthetase 3, 100kDa |
| chr5_-_16617162 | 0.26 |
ENST00000306320.9 |
FAM134B |
family with sequence similarity 134, member B |
| chr6_-_13486369 | 0.26 |
ENST00000558378.1 |
AL583828.1 |
AL583828.1 |
| chr2_-_73511559 | 0.26 |
ENST00000521871.1 |
FBXO41 |
F-box protein 41 |
| chr1_+_15480197 | 0.26 |
ENST00000400796.3 ENST00000434578.2 ENST00000376008.2 |
TMEM51 |
transmembrane protein 51 |
| chr22_+_40390930 | 0.25 |
ENST00000333407.6 |
FAM83F |
family with sequence similarity 83, member F |
| chr17_-_80023401 | 0.25 |
ENST00000354321.7 ENST00000306796.5 |
DUS1L |
dihydrouridine synthase 1-like (S. cerevisiae) |
| chr2_+_182321925 | 0.25 |
ENST00000339307.4 ENST00000397033.2 |
ITGA4 |
integrin, alpha 4 (antigen CD49D, alpha 4 subunit of VLA-4 receptor) |
| chr15_+_69591235 | 0.25 |
ENST00000395407.2 ENST00000558684.1 |
PAQR5 |
progestin and adipoQ receptor family member V |
| chr1_+_45965725 | 0.25 |
ENST00000401061.4 |
MMACHC |
methylmalonic aciduria (cobalamin deficiency) cblC type, with homocystinuria |
| chr15_-_68497657 | 0.25 |
ENST00000448060.2 ENST00000467889.1 |
CALML4 |
calmodulin-like 4 |
| chr11_-_11747257 | 0.25 |
ENST00000601641.1 |
AC131935.1 |
AC131935.1 |
| chr6_+_31865552 | 0.25 |
ENST00000469372.1 ENST00000497706.1 |
C2 |
complement component 2 |
| chr17_+_16120512 | 0.25 |
ENST00000581006.1 ENST00000584797.1 ENST00000498772.2 ENST00000225609.5 ENST00000395844.4 ENST00000477745.1 |
PIGL |
phosphatidylinositol glycan anchor biosynthesis, class L |
| chr7_-_93519471 | 0.25 |
ENST00000451238.1 |
TFPI2 |
tissue factor pathway inhibitor 2 |
| chrX_-_71458802 | 0.25 |
ENST00000373657.1 ENST00000334463.3 |
ERCC6L |
excision repair cross-complementing rodent repair deficiency, complementation group 6-like |
| chr10_-_123274693 | 0.25 |
ENST00000429361.1 |
FGFR2 |
fibroblast growth factor receptor 2 |
| chr6_-_32821599 | 0.25 |
ENST00000354258.4 |
TAP1 |
transporter 1, ATP-binding cassette, sub-family B (MDR/TAP) |
| chr3_+_182511266 | 0.25 |
ENST00000323116.5 ENST00000493826.1 |
ATP11B |
ATPase, class VI, type 11B |
| chr1_+_44440575 | 0.25 |
ENST00000532642.1 ENST00000236067.4 ENST00000471859.2 |
ATP6V0B |
ATPase, H+ transporting, lysosomal 21kDa, V0 subunit b |
| chr4_+_48018781 | 0.25 |
ENST00000295461.5 |
NIPAL1 |
NIPA-like domain containing 1 |
| chr13_+_113633620 | 0.25 |
ENST00000421756.1 ENST00000375601.3 |
MCF2L |
MCF.2 cell line derived transforming sequence-like |
| chr6_+_29691198 | 0.24 |
ENST00000440587.2 ENST00000434407.2 |
HLA-F |
major histocompatibility complex, class I, F |
| chr4_-_103266355 | 0.24 |
ENST00000424970.2 |
SLC39A8 |
solute carrier family 39 (zinc transporter), member 8 |
| chr11_+_35211511 | 0.24 |
ENST00000524922.1 |
CD44 |
CD44 molecule (Indian blood group) |
| chr9_+_131102925 | 0.24 |
ENST00000372870.1 ENST00000300456.4 |
SLC27A4 |
solute carrier family 27 (fatty acid transporter), member 4 |
| chr19_+_45147313 | 0.24 |
ENST00000406449.4 |
PVR |
poliovirus receptor |
| chr19_-_54761148 | 0.24 |
ENST00000316219.5 |
LILRB5 |
leukocyte immunoglobulin-like receptor, subfamily B (with TM and ITIM domains), member 5 |
| chr17_+_74380683 | 0.24 |
ENST00000592299.1 ENST00000590959.1 ENST00000323374.4 |
SPHK1 |
sphingosine kinase 1 |
| chr8_+_24772455 | 0.24 |
ENST00000433454.2 |
NEFM |
neurofilament, medium polypeptide |
| chr1_+_95582881 | 0.24 |
ENST00000370203.4 ENST00000456991.1 |
TMEM56 |
transmembrane protein 56 |
| chr1_+_233463507 | 0.24 |
ENST00000366623.3 ENST00000366624.3 |
MLK4 |
Mitogen-activated protein kinase kinase kinase MLK4 |
| chr12_+_122356488 | 0.24 |
ENST00000397454.2 |
WDR66 |
WD repeat domain 66 |
| chr19_-_23941680 | 0.24 |
ENST00000402377.3 |
ZNF681 |
zinc finger protein 681 |
| chr17_-_4458616 | 0.24 |
ENST00000381556.2 |
MYBBP1A |
MYB binding protein (P160) 1a |
| chr7_-_100860851 | 0.23 |
ENST00000223127.3 |
PLOD3 |
procollagen-lysine, 2-oxoglutarate 5-dioxygenase 3 |
| chr2_-_103353277 | 0.23 |
ENST00000258436.5 |
MFSD9 |
major facilitator superfamily domain containing 9 |
| chr11_+_1860682 | 0.23 |
ENST00000381906.1 |
TNNI2 |
troponin I type 2 (skeletal, fast) |
| chr4_-_156298087 | 0.23 |
ENST00000311277.4 |
MAP9 |
microtubule-associated protein 9 |
| chr1_-_24513737 | 0.23 |
ENST00000374421.3 ENST00000374418.3 ENST00000327535.1 ENST00000327575.2 |
IFNLR1 |
interferon, lambda receptor 1 |
| chr2_+_220492287 | 0.23 |
ENST00000273063.6 ENST00000373762.3 |
SLC4A3 |
solute carrier family 4 (anion exchanger), member 3 |
| chr8_-_131028660 | 0.23 |
ENST00000401979.2 ENST00000517654.1 ENST00000522361.1 ENST00000518167.1 |
FAM49B |
family with sequence similarity 49, member B |
| chr12_+_113376249 | 0.23 |
ENST00000551007.1 ENST00000548514.1 |
OAS3 |
2'-5'-oligoadenylate synthetase 3, 100kDa |
| chr12_+_9102632 | 0.23 |
ENST00000539240.1 |
KLRG1 |
killer cell lectin-like receptor subfamily G, member 1 |
| chr6_+_44191507 | 0.23 |
ENST00000371724.1 ENST00000371713.1 |
SLC29A1 |
solute carrier family 29 (equilibrative nucleoside transporter), member 1 |
| chr17_-_2614927 | 0.23 |
ENST00000435359.1 |
CLUH |
clustered mitochondria (cluA/CLU1) homolog |
| chr11_+_62623544 | 0.23 |
ENST00000377890.2 ENST00000377891.2 ENST00000377889.2 |
SLC3A2 |
solute carrier family 3 (amino acid transporter heavy chain), member 2 |
| chr6_-_133119668 | 0.23 |
ENST00000275227.4 ENST00000538764.1 |
SLC18B1 |
solute carrier family 18, subfamily B, member 1 |
| chr12_+_122459757 | 0.22 |
ENST00000261822.4 |
BCL7A |
B-cell CLL/lymphoma 7A |
| chr17_-_46507537 | 0.22 |
ENST00000336915.6 |
SKAP1 |
src kinase associated phosphoprotein 1 |
| chr1_-_24469602 | 0.22 |
ENST00000270800.1 |
IL22RA1 |
interleukin 22 receptor, alpha 1 |
| chr6_-_138428613 | 0.22 |
ENST00000421351.3 |
PERP |
PERP, TP53 apoptosis effector |
| chr7_+_48128816 | 0.22 |
ENST00000395564.4 |
UPP1 |
uridine phosphorylase 1 |
| chr12_-_120763739 | 0.22 |
ENST00000549767.1 |
PLA2G1B |
phospholipase A2, group IB (pancreas) |
| chr6_+_31371337 | 0.22 |
ENST00000449934.2 ENST00000421350.1 |
MICA |
MHC class I polypeptide-related sequence A |
| chr1_-_153521714 | 0.22 |
ENST00000368713.3 |
S100A3 |
S100 calcium binding protein A3 |
| chr19_-_54676846 | 0.22 |
ENST00000301187.4 |
TMC4 |
transmembrane channel-like 4 |
| chr11_+_62623512 | 0.22 |
ENST00000377892.1 |
SLC3A2 |
solute carrier family 3 (amino acid transporter heavy chain), member 2 |
Gene Ontology Analysis
Gene overrepresentation in biological_process category:
| Log-likelihood per target | Total log-likelihood | Term | Description |
|---|---|---|---|
| 0.7 | 2.0 | GO:0060901 | regulation of monophenol monooxygenase activity(GO:0032771) positive regulation of monophenol monooxygenase activity(GO:0032773) negative regulation of catagen(GO:0051796) regulation of hair cycle by canonical Wnt signaling pathway(GO:0060901) positive regulation of melanosome transport(GO:1902910) |
| 0.3 | 0.8 | GO:0070510 | regulation of histone H4-K20 methylation(GO:0070510) positive regulation of histone H4-K20 methylation(GO:0070512) |
| 0.2 | 1.1 | GO:0097021 | lymphocyte migration into lymphoid organs(GO:0097021) |
| 0.2 | 0.4 | GO:2000309 | positive regulation of tumor necrosis factor (ligand) superfamily member 11 production(GO:2000309) |
| 0.2 | 1.3 | GO:1903575 | cornified envelope assembly(GO:1903575) |
| 0.2 | 0.6 | GO:0071848 | circadian temperature homeostasis(GO:0060086) regulation of fever generation by regulation of prostaglandin secretion(GO:0071810) positive regulation of fever generation by positive regulation of prostaglandin secretion(GO:0071812) positive regulation of ERK1 and ERK2 cascade via TNFSF11-mediated signaling(GO:0071848) regulation of fever generation by prostaglandin secretion(GO:0100009) |
| 0.2 | 0.6 | GO:0042938 | dipeptide transport(GO:0042938) |
| 0.2 | 0.5 | GO:0046521 | sphingoid catabolic process(GO:0046521) |
| 0.2 | 0.4 | GO:0002159 | desmosome assembly(GO:0002159) |
| 0.2 | 0.7 | GO:0042377 | menaquinone catabolic process(GO:0042361) vitamin K catabolic process(GO:0042377) |
| 0.2 | 0.5 | GO:0060557 | positive regulation of vitamin metabolic process(GO:0046136) positive regulation of vitamin D biosynthetic process(GO:0060557) positive regulation of calcidiol 1-monooxygenase activity(GO:0060559) |
| 0.2 | 1.3 | GO:0015820 | leucine transport(GO:0015820) |
| 0.2 | 0.5 | GO:1904808 | regulation of protein oxidation(GO:1904806) positive regulation of protein oxidation(GO:1904808) |
| 0.2 | 4.4 | GO:0031581 | hemidesmosome assembly(GO:0031581) |
| 0.1 | 0.6 | GO:0014846 | esophagus smooth muscle contraction(GO:0014846) |
| 0.1 | 1.2 | GO:0060744 | thelarche(GO:0042695) mammary gland branching involved in thelarche(GO:0060744) |
| 0.1 | 1.1 | GO:0086073 | bundle of His cell-Purkinje myocyte adhesion involved in cell communication(GO:0086073) |
| 0.1 | 0.5 | GO:0043006 | activation of phospholipase A2 activity by calcium-mediated signaling(GO:0043006) |
| 0.1 | 0.3 | GO:0060129 | thyroid-stimulating hormone-secreting cell differentiation(GO:0060129) |
| 0.1 | 0.1 | GO:0015803 | branched-chain amino acid transport(GO:0015803) |
| 0.1 | 0.5 | GO:2000051 | Wnt receptor catabolic process(GO:0038018) negative regulation of non-canonical Wnt signaling pathway(GO:2000051) |
| 0.1 | 0.6 | GO:0015811 | L-cystine transport(GO:0015811) |
| 0.1 | 0.3 | GO:0097359 | UDP-glucosylation(GO:0097359) |
| 0.1 | 0.2 | GO:0035408 | histone H3-T6 phosphorylation(GO:0035408) |
| 0.1 | 0.6 | GO:2000568 | memory T cell activation(GO:0035709) regulation of memory T cell activation(GO:2000567) positive regulation of memory T cell activation(GO:2000568) |
| 0.1 | 0.5 | GO:0030200 | heparan sulfate proteoglycan catabolic process(GO:0030200) |
| 0.1 | 0.7 | GO:0051121 | hepoxilin metabolic process(GO:0051121) hepoxilin biosynthetic process(GO:0051122) |
| 0.1 | 0.3 | GO:0006624 | vacuolar protein processing(GO:0006624) |
| 0.1 | 0.4 | GO:0006218 | uridine catabolic process(GO:0006218) |
| 0.1 | 0.3 | GO:0031133 | regulation of axon diameter(GO:0031133) |
| 0.1 | 0.3 | GO:0043137 | DNA replication, removal of RNA primer(GO:0043137) |
| 0.1 | 0.8 | GO:1902412 | regulation of mitotic cytokinesis(GO:1902412) |
| 0.1 | 0.3 | GO:1903691 | positive regulation of wound healing, spreading of epidermal cells(GO:1903691) |
| 0.1 | 0.4 | GO:0006438 | valyl-tRNA aminoacylation(GO:0006438) |
| 0.1 | 0.3 | GO:0046947 | hydroxylysine metabolic process(GO:0046946) hydroxylysine biosynthetic process(GO:0046947) |
| 0.1 | 0.3 | GO:1990569 | UDP-N-acetylglucosamine transport(GO:0015788) UDP-N-acetylglucosamine transmembrane transport(GO:1990569) |
| 0.1 | 0.6 | GO:0021840 | directional guidance of interneurons involved in migration from the subpallium to the cortex(GO:0021840) chemorepulsion involved in interneuron migration from the subpallium to the cortex(GO:0021842) |
| 0.1 | 0.5 | GO:2000048 | negative regulation of cell-cell adhesion mediated by cadherin(GO:2000048) |
| 0.1 | 0.5 | GO:0070778 | L-aspartate transport(GO:0070778) L-aspartate transmembrane transport(GO:0089712) |
| 0.1 | 0.2 | GO:0035603 | fibroblast growth factor receptor signaling pathway involved in negative regulation of apoptotic process in bone marrow(GO:0035602) fibroblast growth factor receptor signaling pathway involved in hemopoiesis(GO:0035603) fibroblast growth factor receptor signaling pathway involved in positive regulation of cell proliferation in bone marrow(GO:0035604) |
| 0.1 | 0.5 | GO:0002803 | positive regulation of antimicrobial peptide production(GO:0002225) positive regulation of antimicrobial humoral response(GO:0002760) positive regulation of antibacterial peptide production(GO:0002803) |
| 0.1 | 0.7 | GO:0032439 | endosome localization(GO:0032439) |
| 0.1 | 0.2 | GO:0060370 | susceptibility to T cell mediated cytotoxicity(GO:0060370) |
| 0.1 | 0.6 | GO:0050689 | negative regulation of defense response to virus by host(GO:0050689) |
| 0.1 | 0.4 | GO:2000313 | fibroblast growth factor receptor signaling pathway involved in neural plate anterior/posterior pattern formation(GO:0060825) regulation of fibroblast growth factor receptor signaling pathway involved in neural plate anterior/posterior pattern formation(GO:2000313) |
| 0.1 | 0.2 | GO:0033693 | neurofilament bundle assembly(GO:0033693) |
| 0.1 | 0.1 | GO:1904933 | regulation of cell proliferation in midbrain(GO:1904933) |
| 0.1 | 0.5 | GO:0045218 | zonula adherens maintenance(GO:0045218) |
| 0.1 | 0.4 | GO:1904274 | tricellular tight junction assembly(GO:1904274) |
| 0.1 | 0.1 | GO:0060995 | cell-cell signaling involved in kidney development(GO:0060995) Wnt signaling pathway involved in kidney development(GO:0061289) canonical Wnt signaling pathway involved in metanephric kidney development(GO:0061290) cell-cell signaling involved in metanephros development(GO:0072204) |
| 0.1 | 0.2 | GO:0008355 | olfactory learning(GO:0008355) |
| 0.1 | 0.7 | GO:0031444 | slow-twitch skeletal muscle fiber contraction(GO:0031444) |
| 0.1 | 0.2 | GO:1901301 | regulation of cargo loading into COPII-coated vesicle(GO:1901301) |
| 0.1 | 0.2 | GO:0009786 | regulation of asymmetric cell division(GO:0009786) |
| 0.1 | 0.2 | GO:0070837 | lactose metabolic process(GO:0005988) lactose biosynthetic process(GO:0005989) dehydroascorbic acid transport(GO:0070837) |
| 0.1 | 0.2 | GO:1903423 | positive regulation of synaptic vesicle endocytosis(GO:1900244) positive regulation of synaptic vesicle recycling(GO:1903423) |
| 0.1 | 0.2 | GO:0015728 | mevalonate transport(GO:0015728) behavioral response to nutrient(GO:0051780) |
| 0.1 | 0.2 | GO:0021966 | cerebral cortex tangential migration using cell-cell interactions(GO:0021823) postnatal olfactory bulb interneuron migration(GO:0021827) chemorepulsion involved in postnatal olfactory bulb interneuron migration(GO:0021836) corticospinal neuron axon guidance(GO:0021966) negative regulation of mononuclear cell migration(GO:0071676) |
| 0.1 | 0.2 | GO:0098838 | reduced folate transmembrane transport(GO:0098838) |
| 0.1 | 0.3 | GO:0086021 | SA node cell to atrial cardiac muscle cell communication by electrical coupling(GO:0086021) |
| 0.1 | 0.4 | GO:0060120 | auditory receptor cell fate commitment(GO:0009912) inner ear receptor cell fate commitment(GO:0060120) |
| 0.1 | 0.3 | GO:0036228 | protein targeting to nuclear inner membrane(GO:0036228) |
| 0.1 | 0.3 | GO:0007402 | ganglion mother cell fate determination(GO:0007402) |
| 0.1 | 0.3 | GO:0003366 | cell-matrix adhesion involved in ameboidal cell migration(GO:0003366) |
| 0.1 | 0.2 | GO:0044210 | 'de novo' CTP biosynthetic process(GO:0044210) |
| 0.1 | 0.1 | GO:0043542 | endothelial cell migration(GO:0043542) |
| 0.1 | 1.2 | GO:0071578 | zinc II ion transmembrane import(GO:0071578) |
| 0.1 | 0.2 | GO:0044205 | 'de novo' UMP biosynthetic process(GO:0044205) |
| 0.1 | 0.2 | GO:0070631 | spindle pole body duplication(GO:0030474) spindle pole body organization(GO:0051300) spindle pole body localization(GO:0070631) establishment of spindle pole body localization(GO:0070632) spindle pole body localization to nuclear envelope(GO:0071789) establishment of spindle pole body localization to nuclear envelope(GO:0071790) |
| 0.1 | 0.3 | GO:0009236 | cobalamin biosynthetic process(GO:0009236) |
| 0.1 | 0.2 | GO:0033341 | regulation of collagen binding(GO:0033341) |
| 0.1 | 0.2 | GO:0046967 | cytosol to ER transport(GO:0046967) |
| 0.1 | 0.2 | GO:0015917 | aminophospholipid transport(GO:0015917) |
| 0.1 | 0.3 | GO:1990834 | response to odorant(GO:1990834) |
| 0.1 | 0.2 | GO:0060723 | spongiotrophoblast cell proliferation(GO:0060720) regulation of spongiotrophoblast cell proliferation(GO:0060721) cell proliferation involved in embryonic placenta development(GO:0060722) regulation of cell proliferation involved in embryonic placenta development(GO:0060723) |
| 0.1 | 0.2 | GO:0048170 | positive regulation of long-term neuronal synaptic plasticity(GO:0048170) |
| 0.1 | 0.3 | GO:1904222 | regulation of CDP-diacylglycerol-serine O-phosphatidyltransferase activity(GO:1904217) positive regulation of CDP-diacylglycerol-serine O-phosphatidyltransferase activity(GO:1904219) positive regulation of serine C-palmitoyltransferase activity(GO:1904222) |
| 0.1 | 0.4 | GO:2000348 | regulation of CD40 signaling pathway(GO:2000348) |
| 0.1 | 0.3 | GO:0060671 | epithelial cell differentiation involved in embryonic placenta development(GO:0060671) epithelial cell morphogenesis involved in placental branching(GO:0060672) |
| 0.1 | 0.1 | GO:1901187 | regulation of ephrin receptor signaling pathway(GO:1901187) |
| 0.1 | 0.3 | GO:0003011 | involuntary skeletal muscle contraction(GO:0003011) |
| 0.1 | 0.2 | GO:0032431 | activation of phospholipase A2 activity(GO:0032431) |
| 0.1 | 0.2 | GO:0007518 | myoblast fate determination(GO:0007518) |
| 0.1 | 0.2 | GO:0000103 | sulfate assimilation(GO:0000103) |
| 0.1 | 0.2 | GO:1990641 | response to iron ion starvation(GO:1990641) |
| 0.1 | 0.2 | GO:0048633 | negative regulation of auditory receptor cell differentiation(GO:0045608) positive regulation of skeletal muscle tissue growth(GO:0048633) |
| 0.1 | 0.2 | GO:0007538 | primary sex determination(GO:0007538) |
| 0.1 | 0.4 | GO:1900623 | regulation of monocyte aggregation(GO:1900623) positive regulation of monocyte aggregation(GO:1900625) |
| 0.1 | 0.5 | GO:0002480 | antigen processing and presentation of exogenous peptide antigen via MHC class I, TAP-independent(GO:0002480) |
| 0.1 | 0.2 | GO:0003095 | pressure natriuresis(GO:0003095) |
| 0.1 | 0.2 | GO:0042109 | lymphotoxin A production(GO:0032641) lymphotoxin A biosynthetic process(GO:0042109) |
| 0.1 | 0.2 | GO:0060374 | mast cell differentiation(GO:0060374) |
| 0.1 | 0.2 | GO:0031938 | pre-replicative complex assembly involved in nuclear cell cycle DNA replication(GO:0006267) regulation of chromatin silencing at telomere(GO:0031938) pre-replicative complex assembly(GO:0036388) pre-replicative complex assembly involved in cell cycle DNA replication(GO:1902299) |
| 0.1 | 0.2 | GO:0033861 | negative regulation of NAD(P)H oxidase activity(GO:0033861) |
| 0.1 | 0.6 | GO:0006657 | CDP-choline pathway(GO:0006657) |
| 0.1 | 0.2 | GO:0090118 | receptor-mediated endocytosis of low-density lipoprotein particle involved in cholesterol transport(GO:0090118) positive regulation of lysosomal protein catabolic process(GO:1905167) |
| 0.1 | 0.1 | GO:0014889 | muscle atrophy(GO:0014889) |
| 0.1 | 0.3 | GO:0050917 | sensory perception of umami taste(GO:0050917) |
| 0.1 | 0.2 | GO:2001037 | tongue muscle cell differentiation(GO:0035981) positive regulation of skeletal muscle fiber differentiation(GO:1902811) regulation of tongue muscle cell differentiation(GO:2001035) positive regulation of tongue muscle cell differentiation(GO:2001037) |
| 0.1 | 0.1 | GO:0045200 | establishment or maintenance of neuroblast polarity(GO:0045196) establishment of neuroblast polarity(GO:0045200) |
| 0.1 | 1.1 | GO:0016540 | protein autoprocessing(GO:0016540) |
| 0.0 | 0.5 | GO:0060700 | regulation of ribonuclease activity(GO:0060700) |
| 0.0 | 0.2 | GO:0000957 | mitochondrial RNA catabolic process(GO:0000957) regulation of mitochondrial RNA catabolic process(GO:0000960) |
| 0.0 | 0.4 | GO:2000664 | positive regulation of interleukin-5 secretion(GO:2000664) |
| 0.0 | 0.0 | GO:2001170 | negative regulation of ATP biosynthetic process(GO:2001170) |
| 0.0 | 0.2 | GO:1902938 | regulation of intracellular calcium activated chloride channel activity(GO:1902938) |
| 0.0 | 0.2 | GO:0018171 | peptidyl-cysteine oxidation(GO:0018171) |
| 0.0 | 0.1 | GO:0035879 | plasma membrane lactate transport(GO:0035879) |
| 0.0 | 0.1 | GO:0006428 | isoleucyl-tRNA aminoacylation(GO:0006428) |
| 0.0 | 0.1 | GO:0035526 | retrograde transport, plasma membrane to Golgi(GO:0035526) |
| 0.0 | 0.2 | GO:0015862 | uridine transport(GO:0015862) |
| 0.0 | 0.0 | GO:1902174 | positive regulation of keratinocyte apoptotic process(GO:1902174) |
| 0.0 | 0.4 | GO:0010635 | regulation of mitochondrial fusion(GO:0010635) |
| 0.0 | 0.2 | GO:0002934 | desmosome organization(GO:0002934) |
| 0.0 | 0.2 | GO:0032929 | negative regulation of superoxide anion generation(GO:0032929) |
| 0.0 | 0.3 | GO:0060125 | negative regulation of growth hormone secretion(GO:0060125) |
| 0.0 | 1.7 | GO:0035590 | purinergic nucleotide receptor signaling pathway(GO:0035590) |
| 0.0 | 0.6 | GO:0070327 | thyroid hormone transport(GO:0070327) |
| 0.0 | 0.4 | GO:0046940 | nucleoside monophosphate phosphorylation(GO:0046940) |
| 0.0 | 0.2 | GO:1900106 | hyaluranon cable assembly(GO:0036118) regulation of hyaluranon cable assembly(GO:1900104) positive regulation of hyaluranon cable assembly(GO:1900106) |
| 0.0 | 0.1 | GO:0060738 | epithelial-mesenchymal signaling involved in prostate gland development(GO:0060738) |
| 0.0 | 0.2 | GO:0033490 | cholesterol biosynthetic process via desmosterol(GO:0033489) cholesterol biosynthetic process via lathosterol(GO:0033490) |
| 0.0 | 0.3 | GO:0033183 | negative regulation of histone ubiquitination(GO:0033183) regulation of histone H2A K63-linked ubiquitination(GO:1901314) negative regulation of histone H2A K63-linked ubiquitination(GO:1901315) |
| 0.0 | 0.1 | GO:0042360 | vitamin E metabolic process(GO:0042360) |
| 0.0 | 1.0 | GO:0002544 | chronic inflammatory response(GO:0002544) |
| 0.0 | 0.7 | GO:0010510 | regulation of acetyl-CoA biosynthetic process from pyruvate(GO:0010510) |
| 0.0 | 0.2 | GO:1904845 | response to L-glutamine(GO:1904844) cellular response to L-glutamine(GO:1904845) |
| 0.0 | 0.1 | GO:0000706 | meiotic DNA double-strand break processing(GO:0000706) |
| 0.0 | 0.1 | GO:2000418 | positive regulation of eosinophil migration(GO:2000418) |
| 0.0 | 0.2 | GO:1905073 | occluding junction disassembly(GO:1905071) regulation of occluding junction disassembly(GO:1905073) positive regulation of occluding junction disassembly(GO:1905075) |
| 0.0 | 0.1 | GO:1905224 | clathrin-coated pit assembly(GO:1905224) |
| 0.0 | 0.1 | GO:0018057 | peptidyl-lysine oxidation(GO:0018057) |
| 0.0 | 0.1 | GO:0002143 | tRNA wobble position uridine thiolation(GO:0002143) |
| 0.0 | 0.0 | GO:0000963 | mitochondrial RNA processing(GO:0000963) |
| 0.0 | 0.1 | GO:0046707 | IDP metabolic process(GO:0046707) IDP catabolic process(GO:0046709) |
| 0.0 | 0.4 | GO:0006686 | sphingomyelin biosynthetic process(GO:0006686) |
| 0.0 | 0.3 | GO:2000491 | positive regulation of hepatic stellate cell activation(GO:2000491) |
| 0.0 | 0.3 | GO:0002943 | tRNA dihydrouridine synthesis(GO:0002943) |
| 0.0 | 0.1 | GO:0072603 | interleukin-5 secretion(GO:0072603) regulation of interleukin-5 secretion(GO:2000662) |
| 0.0 | 0.5 | GO:0035269 | protein O-linked mannosylation(GO:0035269) |
| 0.0 | 0.1 | GO:0038098 | sequestering of BMP from receptor via BMP binding(GO:0038098) |
| 0.0 | 0.1 | GO:0032484 | Ral protein signal transduction(GO:0032484) regulation of Ral protein signal transduction(GO:0032485) |
| 0.0 | 0.2 | GO:0060480 | lung goblet cell differentiation(GO:0060480) |
| 0.0 | 0.1 | GO:0051754 | meiotic sister chromatid cohesion, centromeric(GO:0051754) |
| 0.0 | 0.1 | GO:0071030 | nuclear mRNA surveillance of spliceosomal pre-mRNA splicing(GO:0071030) nuclear retention of unspliced pre-mRNA at the site of transcription(GO:0071048) |
| 0.0 | 0.1 | GO:1903298 | regulation of hypoxia-induced intrinsic apoptotic signaling pathway(GO:1903297) negative regulation of hypoxia-induced intrinsic apoptotic signaling pathway(GO:1903298) intrinsic apoptotic signaling pathway in response to hypoxia(GO:1990144) |
| 0.0 | 0.1 | GO:2000275 | cellular amide catabolic process(GO:0043605) regulation of oxidative phosphorylation uncoupler activity(GO:2000275) |
| 0.0 | 0.1 | GO:2001162 | regulation of histone H3-K79 methylation(GO:2001160) positive regulation of histone H3-K79 methylation(GO:2001162) |
| 0.0 | 0.2 | GO:1990592 | protein polyufmylation(GO:1990564) protein K69-linked ufmylation(GO:1990592) |
| 0.0 | 0.0 | GO:0051037 | regulation of transcription involved in meiotic cell cycle(GO:0051037) |
| 0.0 | 0.1 | GO:0060084 | synaptic transmission involved in micturition(GO:0060084) |
| 0.0 | 0.2 | GO:1900262 | regulation of DNA-directed DNA polymerase activity(GO:1900262) positive regulation of DNA-directed DNA polymerase activity(GO:1900264) |
| 0.0 | 0.2 | GO:1904764 | clathrin coat disassembly(GO:0072318) negative regulation of fibril organization(GO:1902904) chaperone-mediated autophagy translocation complex disassembly(GO:1904764) |
| 0.0 | 0.1 | GO:0098935 | dendritic transport(GO:0098935) anterograde dendritic transport(GO:0098937) |
| 0.0 | 0.3 | GO:0010890 | positive regulation of sequestering of triglyceride(GO:0010890) |
| 0.0 | 0.2 | GO:0015824 | proline transport(GO:0015824) |
| 0.0 | 0.1 | GO:0010730 | negative regulation of hydrogen peroxide biosynthetic process(GO:0010730) |
| 0.0 | 0.1 | GO:0001188 | RNA polymerase I transcriptional preinitiation complex assembly(GO:0001188) RNA polymerase I transcriptional preinitiation complex assembly at the promoter for the nuclear large rRNA transcript(GO:0001189) |
| 0.0 | 0.1 | GO:1900195 | spindle assembly involved in female meiosis I(GO:0007057) positive regulation of oocyte maturation(GO:1900195) |
| 0.0 | 0.2 | GO:0001575 | globoside metabolic process(GO:0001575) |
| 0.0 | 0.1 | GO:0071163 | DNA replication preinitiation complex assembly(GO:0071163) |
| 0.0 | 1.0 | GO:0022038 | corpus callosum development(GO:0022038) |
| 0.0 | 1.0 | GO:1904659 | hexose transmembrane transport(GO:0035428) glucose transmembrane transport(GO:1904659) |
| 0.0 | 0.1 | GO:0045648 | positive regulation of erythrocyte differentiation(GO:0045648) |
| 0.0 | 0.1 | GO:1901079 | positive regulation of relaxation of muscle(GO:1901079) positive regulation of relaxation of cardiac muscle(GO:1901899) regulation of calcium ion import into sarcoplasmic reticulum(GO:1902080) negative regulation of calcium ion import into sarcoplasmic reticulum(GO:1902081) |
| 0.0 | 0.1 | GO:0098968 | neurotransmitter receptor transport postsynaptic membrane to endosome(GO:0098968) |
| 0.0 | 0.2 | GO:0006196 | AMP catabolic process(GO:0006196) |
| 0.0 | 0.4 | GO:0033314 | mitotic DNA replication checkpoint(GO:0033314) |
| 0.0 | 0.2 | GO:0042760 | very long-chain fatty acid catabolic process(GO:0042760) |
| 0.0 | 0.0 | GO:0070914 | UV-damage excision repair(GO:0070914) |
| 0.0 | 0.1 | GO:0010286 | heat acclimation(GO:0010286) cellular heat acclimation(GO:0070370) |
| 0.0 | 0.1 | GO:1990927 | calcium ion regulated lysosome exocytosis(GO:1990927) |
| 0.0 | 0.1 | GO:0006382 | adenosine to inosine editing(GO:0006382) motor behavior(GO:0061744) |
| 0.0 | 0.2 | GO:0014050 | negative regulation of glutamate secretion(GO:0014050) |
| 0.0 | 0.1 | GO:0051149 | positive regulation of muscle cell differentiation(GO:0051149) |
| 0.0 | 0.0 | GO:0036466 | synaptic vesicle recycling via endosome(GO:0036466) |
| 0.0 | 0.1 | GO:1904744 | positive regulation of telomeric DNA binding(GO:1904744) |
| 0.0 | 0.2 | GO:0035795 | negative regulation of mitochondrial membrane permeability(GO:0035795) |
| 0.0 | 0.3 | GO:0006189 | 'de novo' IMP biosynthetic process(GO:0006189) |
| 0.0 | 0.1 | GO:0006433 | glutamyl-tRNA aminoacylation(GO:0006424) prolyl-tRNA aminoacylation(GO:0006433) |
| 0.0 | 0.2 | GO:0016078 | tRNA catabolic process(GO:0016078) |
| 0.0 | 0.2 | GO:0006614 | SRP-dependent cotranslational protein targeting to membrane(GO:0006614) |
| 0.0 | 0.1 | GO:0015860 | purine nucleoside transmembrane transport(GO:0015860) |
| 0.0 | 0.2 | GO:0035093 | spermatogenesis, exchange of chromosomal proteins(GO:0035093) |
| 0.0 | 0.1 | GO:2000683 | mesodermal-endodermal cell signaling(GO:0003131) programmed DNA elimination(GO:0031049) chromosome breakage(GO:0031052) histone H2A-S139 phosphorylation(GO:0035978) regulation of cellular response to X-ray(GO:2000683) positive regulation of cellular response to X-ray(GO:2000685) |
| 0.0 | 0.1 | GO:0036506 | maintenance of unfolded protein(GO:0036506) maintenance of unfolded protein involved in ERAD pathway(GO:1904378) |
| 0.0 | 0.2 | GO:0010792 | DNA double-strand break processing involved in repair via single-strand annealing(GO:0010792) |
| 0.0 | 0.0 | GO:0060664 | epithelial cell proliferation involved in salivary gland morphogenesis(GO:0060664) |
| 0.0 | 0.1 | GO:0002669 | positive regulation of T cell anergy(GO:0002669) positive regulation of lymphocyte anergy(GO:0002913) |
| 0.0 | 0.5 | GO:1903830 | magnesium ion transmembrane transport(GO:1903830) |
| 0.0 | 0.1 | GO:0002188 | formation of cytoplasmic translation initiation complex(GO:0001732) translation reinitiation(GO:0002188) |
| 0.0 | 0.0 | GO:0031860 | telomeric 3' overhang formation(GO:0031860) |
| 0.0 | 0.6 | GO:0031065 | positive regulation of histone deacetylation(GO:0031065) |
| 0.0 | 0.1 | GO:0034343 | type III interferon production(GO:0034343) regulation of type III interferon production(GO:0034344) |
| 0.0 | 0.1 | GO:0042986 | positive regulation of amyloid precursor protein biosynthetic process(GO:0042986) |
| 0.0 | 0.3 | GO:0060670 | branching involved in labyrinthine layer morphogenesis(GO:0060670) |
| 0.0 | 0.1 | GO:0014878 | response to electrical stimulus involved in regulation of muscle adaptation(GO:0014878) |
| 0.0 | 0.4 | GO:0038003 | opioid receptor signaling pathway(GO:0038003) |
| 0.0 | 0.0 | GO:1902626 | assembly of large subunit precursor of preribosome(GO:1902626) |
| 0.0 | 0.3 | GO:0031936 | negative regulation of chromatin silencing(GO:0031936) |
| 0.0 | 0.2 | GO:0048539 | bone marrow development(GO:0048539) |
| 0.0 | 0.1 | GO:0006421 | asparaginyl-tRNA aminoacylation(GO:0006421) |
| 0.0 | 0.1 | GO:2000687 | negative regulation of rubidium ion transport(GO:2000681) negative regulation of rubidium ion transmembrane transporter activity(GO:2000687) |
| 0.0 | 0.1 | GO:0071105 | response to interleukin-11(GO:0071105) |
| 0.0 | 0.1 | GO:2000969 | positive regulation of alpha-amino-3-hydroxy-5-methyl-4-isoxazole propionate selective glutamate receptor activity(GO:2000969) |
| 0.0 | 0.4 | GO:0051639 | actin filament network formation(GO:0051639) |
| 0.0 | 0.1 | GO:0052314 | phytoalexin metabolic process(GO:0052314) |
| 0.0 | 0.2 | GO:0043415 | positive regulation of skeletal muscle tissue regeneration(GO:0043415) |
| 0.0 | 0.2 | GO:1900029 | positive regulation of ruffle assembly(GO:1900029) |
| 0.0 | 0.3 | GO:0031848 | protection from non-homologous end joining at telomere(GO:0031848) |
| 0.0 | 0.0 | GO:0000478 | endonucleolytic cleavage involved in rRNA processing(GO:0000478) endonucleolytic cleavage of tricistronic rRNA transcript (SSU-rRNA, 5.8S rRNA, LSU-rRNA)(GO:0000479) |
| 0.0 | 0.1 | GO:1903751 | regulation of intrinsic apoptotic signaling pathway in response to hydrogen peroxide(GO:1903750) negative regulation of intrinsic apoptotic signaling pathway in response to hydrogen peroxide(GO:1903751) |
| 0.0 | 0.2 | GO:0051182 | coenzyme transport(GO:0051182) |
| 0.0 | 0.3 | GO:0038203 | TORC2 signaling(GO:0038203) |
| 0.0 | 0.1 | GO:1902775 | mitochondrial large ribosomal subunit assembly(GO:1902775) |
| 0.0 | 0.1 | GO:0001661 | conditioned taste aversion(GO:0001661) |
| 0.0 | 0.1 | GO:0043335 | protein unfolding(GO:0043335) |
| 0.0 | 0.1 | GO:0017186 | peptidyl-pyroglutamic acid biosynthetic process, using glutaminyl-peptide cyclotransferase(GO:0017186) |
| 0.0 | 0.1 | GO:0006738 | nicotinamide riboside catabolic process(GO:0006738) nicotinamide riboside metabolic process(GO:0046495) pyridine nucleoside metabolic process(GO:0070637) pyridine nucleoside catabolic process(GO:0070638) |
| 0.0 | 0.1 | GO:2000563 | positive regulation of CD4-positive, alpha-beta T cell proliferation(GO:2000563) |
| 0.0 | 0.0 | GO:0006578 | amino-acid betaine biosynthetic process(GO:0006578) glycine betaine biosynthetic process from choline(GO:0019285) glycine betaine metabolic process(GO:0031455) glycine betaine biosynthetic process(GO:0031456) |
| 0.0 | 0.0 | GO:0090312 | positive regulation of protein deacetylation(GO:0090312) |
| 0.0 | 0.1 | GO:1905154 | negative regulation of MyD88-dependent toll-like receptor signaling pathway(GO:0034125) negative regulation of eosinophil activation(GO:1902567) negative regulation of membrane invagination(GO:1905154) |
| 0.0 | 0.2 | GO:1903826 | arginine transmembrane transport(GO:1903826) |
| 0.0 | 0.1 | GO:0097360 | chorionic trophoblast cell proliferation(GO:0097360) regulation of chorionic trophoblast cell proliferation(GO:1901382) |
| 0.0 | 0.0 | GO:0071043 | CUT catabolic process(GO:0071034) CUT metabolic process(GO:0071043) |
| 0.0 | 0.0 | GO:0002042 | cell migration involved in sprouting angiogenesis(GO:0002042) |
| 0.0 | 0.1 | GO:0000965 | mitochondrial RNA 3'-end processing(GO:0000965) mitochondrial tRNA 3'-end processing(GO:1990180) |
| 0.0 | 0.1 | GO:0039019 | pronephric nephron development(GO:0039019) |
| 0.0 | 0.1 | GO:0043314 | negative regulation of neutrophil degranulation(GO:0043314) |
| 0.0 | 0.2 | GO:0038145 | macrophage colony-stimulating factor signaling pathway(GO:0038145) |
| 0.0 | 0.1 | GO:1901350 | cell-cell signaling involved in cell-cell junction organization(GO:1901350) |
| 0.0 | 0.4 | GO:0001977 | renal system process involved in regulation of blood volume(GO:0001977) |
| 0.0 | 0.1 | GO:0036510 | trimming of terminal mannose on C branch(GO:0036510) |
| 0.0 | 0.0 | GO:0060160 | negative regulation of dopamine receptor signaling pathway(GO:0060160) |
| 0.0 | 0.1 | GO:0006272 | leading strand elongation(GO:0006272) |
| 0.0 | 0.1 | GO:0006679 | glucosylceramide biosynthetic process(GO:0006679) |
| 0.0 | 0.1 | GO:0048075 | positive regulation of eye pigmentation(GO:0048075) |
| 0.0 | 0.1 | GO:0036022 | limb joint morphogenesis(GO:0036022) embryonic skeletal limb joint morphogenesis(GO:0036023) |
| 0.0 | 0.1 | GO:0060492 | foregut regionalization(GO:0060423) lung field specification(GO:0060424) lung induction(GO:0060492) |
| 0.0 | 0.8 | GO:0050716 | positive regulation of interleukin-1 secretion(GO:0050716) |
| 0.0 | 0.1 | GO:0070352 | positive regulation of white fat cell proliferation(GO:0070352) |
| 0.0 | 0.1 | GO:0043247 | telomere maintenance in response to DNA damage(GO:0043247) |
| 0.0 | 0.0 | GO:2001038 | regulation of cellular response to drug(GO:2001038) |
| 0.0 | 0.1 | GO:0052026 | modulation by virus of host transcription(GO:0019056) positive regulation of sprouting of injured axon(GO:0048687) positive regulation of axon extension involved in regeneration(GO:0048691) modulation by symbiont of host transcription(GO:0052026) |
| 0.0 | 0.1 | GO:0015842 | aminergic neurotransmitter loading into synaptic vesicle(GO:0015842) |
| 0.0 | 0.4 | GO:0007084 | mitotic nuclear envelope reassembly(GO:0007084) |
| 0.0 | 0.1 | GO:0071393 | cellular response to progesterone stimulus(GO:0071393) |
| 0.0 | 0.3 | GO:0035247 | peptidyl-arginine omega-N-methylation(GO:0035247) |
| 0.0 | 0.4 | GO:1904816 | positive regulation of protein localization to chromosome, telomeric region(GO:1904816) |
| 0.0 | 0.2 | GO:0034219 | carbohydrate transmembrane transport(GO:0034219) |
| 0.0 | 0.1 | GO:0006613 | cotranslational protein targeting to membrane(GO:0006613) |
| 0.0 | 0.2 | GO:0070973 | protein localization to endoplasmic reticulum exit site(GO:0070973) |
| 0.0 | 0.2 | GO:0060689 | cell differentiation involved in salivary gland development(GO:0060689) |
| 0.0 | 0.2 | GO:0010032 | meiotic chromosome condensation(GO:0010032) |
| 0.0 | 0.3 | GO:0001766 | membrane raft polarization(GO:0001766) membrane raft distribution(GO:0031580) |
| 0.0 | 0.1 | GO:2001206 | positive regulation of osteoclast development(GO:2001206) |
| 0.0 | 0.0 | GO:0043101 | purine-containing compound salvage(GO:0043101) |
| 0.0 | 0.5 | GO:0007141 | male meiosis I(GO:0007141) |
| 0.0 | 0.1 | GO:0048611 | ectodermal digestive tract development(GO:0007439) embryonic ectodermal digestive tract development(GO:0048611) |
| 0.0 | 0.1 | GO:0060267 | positive regulation of respiratory burst(GO:0060267) |
| 0.0 | 0.1 | GO:0032808 | lacrimal gland development(GO:0032808) |
| 0.0 | 0.1 | GO:0006114 | glycerol biosynthetic process(GO:0006114) |
| 0.0 | 0.2 | GO:0015014 | heparan sulfate proteoglycan biosynthetic process, polysaccharide chain biosynthetic process(GO:0015014) |
| 0.0 | 0.1 | GO:0061502 | early endosome to recycling endosome transport(GO:0061502) |
| 0.0 | 0.1 | GO:0038026 | reelin-mediated signaling pathway(GO:0038026) |
| 0.0 | 0.1 | GO:0070858 | negative regulation of bile acid biosynthetic process(GO:0070858) negative regulation of bile acid metabolic process(GO:1904252) |
| 0.0 | 0.1 | GO:0090520 | sphingosine-1-phosphate signaling pathway(GO:0003376) sphingolipid mediated signaling pathway(GO:0090520) |
| 0.0 | 0.2 | GO:0007000 | nucleolus organization(GO:0007000) |
| 0.0 | 0.4 | GO:0097502 | mannosylation(GO:0097502) |
| 0.0 | 0.1 | GO:0006432 | phenylalanyl-tRNA aminoacylation(GO:0006432) |
| 0.0 | 0.0 | GO:0040031 | snRNA modification(GO:0040031) |
| 0.0 | 0.1 | GO:1990928 | response to amino acid starvation(GO:1990928) |
| 0.0 | 0.0 | GO:0014063 | negative regulation of serotonin secretion(GO:0014063) |
| 0.0 | 0.1 | GO:0002276 | basophil activation involved in immune response(GO:0002276) |
| 0.0 | 0.2 | GO:0015884 | folic acid transport(GO:0015884) |
| 0.0 | 0.2 | GO:0032790 | ribosome disassembly(GO:0032790) |
| 0.0 | 0.2 | GO:0055089 | fatty acid homeostasis(GO:0055089) |
| 0.0 | 0.1 | GO:0033277 | abortive mitotic cell cycle(GO:0033277) |
| 0.0 | 0.1 | GO:0009213 | pyrimidine nucleoside triphosphate catabolic process(GO:0009149) pyrimidine deoxyribonucleoside triphosphate catabolic process(GO:0009213) |
| 0.0 | 0.1 | GO:0030037 | actin filament reorganization involved in cell cycle(GO:0030037) |
| 0.0 | 0.2 | GO:0070900 | mitochondrial tRNA modification(GO:0070900) mitochondrial RNA modification(GO:1900864) |
| 0.0 | 0.1 | GO:0001880 | Mullerian duct regression(GO:0001880) |
| 0.0 | 0.1 | GO:0000354 | cis assembly of pre-catalytic spliceosome(GO:0000354) |
| 0.0 | 0.1 | GO:0048630 | skeletal muscle tissue growth(GO:0048630) |
| 0.0 | 0.1 | GO:0035745 | T-helper 2 cell cytokine production(GO:0035745) |
| 0.0 | 0.1 | GO:0031118 | rRNA pseudouridine synthesis(GO:0031118) |
| 0.0 | 0.0 | GO:0048850 | hypophysis morphogenesis(GO:0048850) |
| 0.0 | 0.0 | GO:0060510 | Type II pneumocyte differentiation(GO:0060510) |
| 0.0 | 0.1 | GO:0035469 | determination of pancreatic left/right asymmetry(GO:0035469) |
| 0.0 | 0.3 | GO:0060297 | regulation of sarcomere organization(GO:0060297) |
| 0.0 | 0.0 | GO:0033590 | response to cobalamin(GO:0033590) |
| 0.0 | 0.1 | GO:0080009 | mRNA methylation(GO:0080009) |
| 0.0 | 0.1 | GO:0097577 | intracellular sequestering of iron ion(GO:0006880) sequestering of iron ion(GO:0097577) |
| 0.0 | 0.1 | GO:0051574 | positive regulation of histone H3-K9 methylation(GO:0051574) |
| 0.0 | 0.0 | GO:0046338 | phosphatidylethanolamine catabolic process(GO:0046338) |
| 0.0 | 0.5 | GO:0002076 | osteoblast development(GO:0002076) |
| 0.0 | 0.1 | GO:0007042 | lysosomal lumen acidification(GO:0007042) |
| 0.0 | 0.1 | GO:0048538 | thymus development(GO:0048538) |
| 0.0 | 0.1 | GO:0050883 | negative regulation of sodium:proton antiporter activity(GO:0032416) musculoskeletal movement, spinal reflex action(GO:0050883) |
| 0.0 | 0.0 | GO:0016080 | synaptic vesicle targeting(GO:0016080) |
| 0.0 | 0.3 | GO:0046629 | gamma-delta T cell activation(GO:0046629) |
| 0.0 | 0.0 | GO:0000183 | chromatin silencing at rDNA(GO:0000183) |
| 0.0 | 0.1 | GO:0019064 | fusion of virus membrane with host plasma membrane(GO:0019064) membrane fusion involved in viral entry into host cell(GO:0039663) multi-organism membrane fusion(GO:0044800) |
| 0.0 | 0.1 | GO:0016098 | monoterpenoid metabolic process(GO:0016098) |
| 0.0 | 0.1 | GO:0000389 | mRNA 3'-splice site recognition(GO:0000389) |
| 0.0 | 0.1 | GO:0002933 | lipid hydroxylation(GO:0002933) |
| 0.0 | 0.1 | GO:0003335 | corneocyte development(GO:0003335) |
| 0.0 | 0.1 | GO:0033211 | adiponectin-activated signaling pathway(GO:0033211) |
| 0.0 | 0.0 | GO:1903925 | signal transduction involved in intra-S DNA damage checkpoint(GO:0072428) negative regulation of mitotic cell cycle DNA replication(GO:1903464) response to bisphenol A(GO:1903925) cellular response to bisphenol A(GO:1903926) |
| 0.0 | 0.1 | GO:0051085 | chaperone mediated protein folding requiring cofactor(GO:0051085) |
| 0.0 | 0.0 | GO:0006097 | glyoxylate cycle(GO:0006097) |
| 0.0 | 0.1 | GO:0031663 | lipopolysaccharide-mediated signaling pathway(GO:0031663) |
| 0.0 | 0.1 | GO:0035616 | histone H2B conserved C-terminal lysine deubiquitination(GO:0035616) |
| 0.0 | 0.4 | GO:0007250 | activation of NF-kappaB-inducing kinase activity(GO:0007250) |
| 0.0 | 0.0 | GO:0007089 | traversing start control point of mitotic cell cycle(GO:0007089) |
| 0.0 | 0.0 | GO:0001916 | positive regulation of T cell mediated cytotoxicity(GO:0001916) |
| 0.0 | 0.1 | GO:1902750 | negative regulation of cell cycle G2/M phase transition(GO:1902750) |
| 0.0 | 0.0 | GO:1901739 | regulation of myoblast fusion(GO:1901739) |
| 0.0 | 0.0 | GO:0007210 | serotonin receptor signaling pathway(GO:0007210) |
| 0.0 | 0.3 | GO:0051290 | protein heterotetramerization(GO:0051290) |
| 0.0 | 0.0 | GO:0006667 | sphinganine metabolic process(GO:0006667) |
| 0.0 | 0.0 | GO:1902714 | nuclear-transcribed mRNA catabolic process, endonucleolytic cleavage-dependent decay(GO:0000294) negative regulation of interferon-gamma secretion(GO:1902714) response to sodium arsenite(GO:1903935) cellular response to sodium arsenite(GO:1903936) |
| 0.0 | 0.1 | GO:0002024 | diet induced thermogenesis(GO:0002024) |
| 0.0 | 0.2 | GO:0010990 | regulation of SMAD protein complex assembly(GO:0010990) |
| 0.0 | 0.0 | GO:0015791 | polyol transport(GO:0015791) glycerol transport(GO:0015793) |
| 0.0 | 0.1 | GO:0002862 | negative regulation of inflammatory response to antigenic stimulus(GO:0002862) |
| 0.0 | 0.1 | GO:2000255 | negative regulation of male germ cell proliferation(GO:2000255) |
| 0.0 | 0.1 | GO:0007019 | microtubule depolymerization(GO:0007019) |
| 0.0 | 0.0 | GO:0035552 | oxidative single-stranded DNA demethylation(GO:0035552) |
| 0.0 | 0.0 | GO:0006789 | bilirubin conjugation(GO:0006789) |
| 0.0 | 0.0 | GO:0045957 | regulation of complement activation, alternative pathway(GO:0030451) negative regulation of complement activation, alternative pathway(GO:0045957) |
| 0.0 | 0.2 | GO:0043297 | apical junction assembly(GO:0043297) bicellular tight junction assembly(GO:0070830) |
| 0.0 | 0.1 | GO:0061303 | cornea development in camera-type eye(GO:0061303) |
| 0.0 | 0.0 | GO:0032571 | response to vitamin K(GO:0032571) |
| 0.0 | 0.3 | GO:0007175 | negative regulation of epidermal growth factor-activated receptor activity(GO:0007175) |
| 0.0 | 0.1 | GO:0033216 | ferric iron import(GO:0033216) ferric iron import into cell(GO:0097461) ferric iron import across plasma membrane(GO:0098706) |
| 0.0 | 0.0 | GO:0007198 | adenylate cyclase-inhibiting serotonin receptor signaling pathway(GO:0007198) |
| 0.0 | 0.0 | GO:0036071 | N-glycan fucosylation(GO:0036071) |
| 0.0 | 0.1 | GO:1990822 | basic amino acid transmembrane transport(GO:1990822) |
| 0.0 | 0.1 | GO:0048312 | intracellular distribution of mitochondria(GO:0048312) |
| 0.0 | 0.3 | GO:0031290 | retinal ganglion cell axon guidance(GO:0031290) |
| 0.0 | 0.3 | GO:0006939 | smooth muscle contraction(GO:0006939) |
| 0.0 | 0.1 | GO:2000609 | regulation of thyroid hormone generation(GO:2000609) |
| 0.0 | 0.4 | GO:0016338 | calcium-independent cell-cell adhesion via plasma membrane cell-adhesion molecules(GO:0016338) |
| 0.0 | 0.1 | GO:2000691 | negative regulation of cardioblast differentiation(GO:0051892) regulation of cardiac muscle cell myoblast differentiation(GO:2000690) negative regulation of cardiac muscle cell myoblast differentiation(GO:2000691) |
| 0.0 | 0.2 | GO:0002523 | leukocyte migration involved in inflammatory response(GO:0002523) |
| 0.0 | 0.2 | GO:0051599 | response to hydrostatic pressure(GO:0051599) |
| 0.0 | 0.1 | GO:0043382 | positive regulation of memory T cell differentiation(GO:0043382) |
| 0.0 | 0.1 | GO:0090521 | glomerular visceral epithelial cell migration(GO:0090521) |
| 0.0 | 0.0 | GO:0035672 | oligopeptide transmembrane transport(GO:0035672) |
| 0.0 | 0.0 | GO:0097187 | dentinogenesis(GO:0097187) |
| 0.0 | 0.1 | GO:0006659 | phosphatidylserine biosynthetic process(GO:0006659) |
| 0.0 | 0.0 | GO:0030327 | prenylated protein catabolic process(GO:0030327) |
| 0.0 | 0.1 | GO:0003373 | dynamin polymerization involved in membrane fission(GO:0003373) dynamin polymerization involved in mitochondrial fission(GO:0003374) |
| 0.0 | 0.1 | GO:0030951 | establishment or maintenance of microtubule cytoskeleton polarity(GO:0030951) |
| 0.0 | 0.1 | GO:0099551 | synaptic signaling via neuropeptide(GO:0099538) trans-synaptic signaling by neuropeptide(GO:0099540) trans-synaptic signaling by neuropeptide, modulating synaptic transmission(GO:0099551) |
| 0.0 | 0.3 | GO:0016254 | preassembly of GPI anchor in ER membrane(GO:0016254) |
| 0.0 | 0.1 | GO:0072312 | metanephric glomerular epithelium development(GO:0072244) metanephric glomerular visceral epithelial cell differentiation(GO:0072248) metanephric glomerular visceral epithelial cell development(GO:0072249) metanephric glomerular epithelial cell differentiation(GO:0072312) metanephric glomerular epithelial cell development(GO:0072313) |
| 0.0 | 0.5 | GO:1901998 | toxin transport(GO:1901998) |
| 0.0 | 0.1 | GO:0031585 | regulation of inositol 1,4,5-trisphosphate-sensitive calcium-release channel activity(GO:0031585) |
| 0.0 | 0.1 | GO:0002710 | negative regulation of T cell mediated immunity(GO:0002710) |
| 0.0 | 0.0 | GO:0097195 | pilomotor reflex(GO:0097195) |
| 0.0 | 0.1 | GO:0009968 | negative regulation of signal transduction(GO:0009968) |
| 0.0 | 0.3 | GO:0050691 | regulation of defense response to virus by host(GO:0050691) |
| 0.0 | 0.2 | GO:1990416 | cellular response to brain-derived neurotrophic factor stimulus(GO:1990416) |
| 0.0 | 0.1 | GO:0035358 | regulation of peroxisome proliferator activated receptor signaling pathway(GO:0035358) positive regulation of peroxisome proliferator activated receptor signaling pathway(GO:0035360) |
| 0.0 | 0.2 | GO:0051601 | exocyst localization(GO:0051601) |
| 0.0 | 0.2 | GO:0090140 | regulation of mitochondrial fission(GO:0090140) |
| 0.0 | 0.3 | GO:0060117 | auditory receptor cell development(GO:0060117) |
| 0.0 | 0.0 | GO:0045732 | positive regulation of protein catabolic process(GO:0045732) |
| 0.0 | 0.5 | GO:0071431 | tRNA export from nucleus(GO:0006409) tRNA-containing ribonucleoprotein complex export from nucleus(GO:0071431) |
| 0.0 | 0.2 | GO:0001682 | tRNA 5'-leader removal(GO:0001682) |
| 0.0 | 0.2 | GO:0007191 | adenylate cyclase-activating dopamine receptor signaling pathway(GO:0007191) |
| 0.0 | 0.0 | GO:0072709 | cellular response to sorbitol(GO:0072709) |
| 0.0 | 0.0 | GO:0006423 | cysteinyl-tRNA aminoacylation(GO:0006423) |
| 0.0 | 0.1 | GO:0032688 | negative regulation of interferon-beta production(GO:0032688) |
| 0.0 | 0.1 | GO:0015705 | iodide transport(GO:0015705) |
| 0.0 | 0.9 | GO:0016266 | O-glycan processing(GO:0016266) |
| 0.0 | 0.1 | GO:0002638 | negative regulation of immunoglobulin production(GO:0002638) |
| 0.0 | 0.2 | GO:0044144 | modulation of growth of symbiont involved in interaction with host(GO:0044144) |
| 0.0 | 0.3 | GO:0046716 | muscle cell cellular homeostasis(GO:0046716) |
| 0.0 | 0.2 | GO:0036342 | post-anal tail morphogenesis(GO:0036342) |
| 0.0 | 0.0 | GO:0090073 | positive regulation of protein homodimerization activity(GO:0090073) |
| 0.0 | 0.1 | GO:2000304 | positive regulation of sphingolipid biosynthetic process(GO:0090154) positive regulation of ceramide biosynthetic process(GO:2000304) |
| 0.0 | 0.0 | GO:0000055 | ribosomal large subunit export from nucleus(GO:0000055) |
| 0.0 | 0.0 | GO:0061101 | neuroendocrine cell differentiation(GO:0061101) |
| 0.0 | 0.0 | GO:0071139 | resolution of recombination intermediates(GO:0071139) resolution of mitotic recombination intermediates(GO:0071140) |
| 0.0 | 0.3 | GO:0019800 | peptide cross-linking via chondroitin 4-sulfate glycosaminoglycan(GO:0019800) |
| 0.0 | 0.1 | GO:0071421 | manganese ion transmembrane transport(GO:0071421) |
| 0.0 | 0.0 | GO:0030423 | targeting of mRNA for destruction involved in RNA interference(GO:0030423) |
| 0.0 | 0.0 | GO:0014038 | regulation of Schwann cell differentiation(GO:0014038) |
| 0.0 | 0.2 | GO:0030322 | stabilization of membrane potential(GO:0030322) |
| 0.0 | 0.1 | GO:0006032 | chitin metabolic process(GO:0006030) chitin catabolic process(GO:0006032) |
| 0.0 | 0.0 | GO:1903070 | negative regulation of ER-associated ubiquitin-dependent protein catabolic process(GO:1903070) |
| 0.0 | 0.0 | GO:0035246 | peptidyl-arginine N-methylation(GO:0035246) |
| 0.0 | 0.1 | GO:1900745 | positive regulation of p38MAPK cascade(GO:1900745) |
| 0.0 | 0.2 | GO:0007157 | heterophilic cell-cell adhesion via plasma membrane cell adhesion molecules(GO:0007157) |
| 0.0 | 0.0 | GO:0061198 | fungiform papilla formation(GO:0061198) |
| 0.0 | 0.1 | GO:0015781 | pyrimidine nucleotide-sugar transport(GO:0015781) |
| 0.0 | 0.1 | GO:0006346 | methylation-dependent chromatin silencing(GO:0006346) |
| 0.0 | 0.1 | GO:0071502 | cellular response to temperature stimulus(GO:0071502) |
| 0.0 | 0.0 | GO:0036091 | positive regulation of transcription from RNA polymerase II promoter in response to oxidative stress(GO:0036091) |
| 0.0 | 0.0 | GO:0032053 | ciliary basal body organization(GO:0032053) |
| 0.0 | 0.1 | GO:0098789 | pre-mRNA cleavage required for polyadenylation(GO:0098789) |
| 0.0 | 0.3 | GO:0070584 | mitochondrion morphogenesis(GO:0070584) |
| 0.0 | 0.1 | GO:0009414 | response to water deprivation(GO:0009414) |
| 0.0 | 0.0 | GO:0035425 | autocrine signaling(GO:0035425) |
| 0.0 | 0.3 | GO:0000460 | maturation of 5.8S rRNA(GO:0000460) |
| 0.0 | 0.0 | GO:0009138 | pyrimidine nucleoside diphosphate metabolic process(GO:0009138) |
| 0.0 | 0.2 | GO:0030214 | hyaluronan catabolic process(GO:0030214) |
Gene overrepresentation in cellular_component category:
| Log-likelihood per target | Total log-likelihood | Term | Description |
|---|---|---|---|
| 0.5 | 3.7 | GO:0005610 | laminin-5 complex(GO:0005610) |
| 0.2 | 0.8 | GO:0031436 | BRCA1-BARD1 complex(GO:0031436) |
| 0.2 | 0.5 | GO:0097489 | multivesicular body, internal vesicle lumen(GO:0097489) |
| 0.1 | 0.4 | GO:0071065 | dense core granule membrane(GO:0032127) alpha9-beta1 integrin-vascular cell adhesion molecule-1 complex(GO:0071065) |
| 0.1 | 0.3 | GO:1990666 | PCSK9-LDLR complex(GO:1990666) |
| 0.1 | 0.1 | GO:0031227 | intrinsic component of endoplasmic reticulum membrane(GO:0031227) |
| 0.1 | 0.3 | GO:0032002 | interleukin-28 receptor complex(GO:0032002) |
| 0.1 | 1.1 | GO:0045179 | apical cortex(GO:0045179) |
| 0.1 | 0.2 | GO:0001534 | radial spoke(GO:0001534) |
| 0.1 | 0.2 | GO:1990851 | Wnt-Frizzled-LRP5/6 complex(GO:1990851) |
| 0.1 | 0.7 | GO:0000235 | astral microtubule(GO:0000235) aster(GO:0005818) |
| 0.1 | 0.3 | GO:0044611 | nuclear pore inner ring(GO:0044611) |
| 0.1 | 0.3 | GO:0034669 | integrin alpha4-beta7 complex(GO:0034669) |
| 0.1 | 0.2 | GO:0070762 | nuclear pore transmembrane ring(GO:0070762) |
| 0.1 | 0.4 | GO:0035692 | macrophage migration inhibitory factor receptor complex(GO:0035692) |
| 0.1 | 2.0 | GO:0030057 | desmosome(GO:0030057) |
| 0.1 | 0.3 | GO:0034991 | nuclear meiotic cohesin complex(GO:0034991) |
| 0.1 | 0.4 | GO:0036021 | endolysosome lumen(GO:0036021) |
| 0.1 | 0.3 | GO:0097123 | cyclin A1-CDK2 complex(GO:0097123) |
| 0.1 | 0.2 | GO:0005656 | nuclear pre-replicative complex(GO:0005656) pre-replicative complex(GO:0036387) |
| 0.1 | 0.3 | GO:0097513 | myosin II filament(GO:0097513) |
| 0.1 | 0.3 | GO:0036449 | microtubule minus-end(GO:0036449) |
| 0.1 | 0.4 | GO:0097209 | epidermal lamellar body(GO:0097209) |
| 0.0 | 0.5 | GO:0042612 | MHC class I protein complex(GO:0042612) |
| 0.0 | 0.3 | GO:0070695 | FHF complex(GO:0070695) |
| 0.0 | 1.2 | GO:0031229 | integral component of nuclear inner membrane(GO:0005639) intrinsic component of nuclear inner membrane(GO:0031229) |
| 0.0 | 0.2 | GO:0031074 | nucleocytoplasmic shuttling complex(GO:0031074) |
| 0.0 | 0.0 | GO:0000939 | condensed chromosome inner kinetochore(GO:0000939) |
| 0.0 | 0.4 | GO:0061689 | tricellular tight junction(GO:0061689) |
| 0.0 | 0.4 | GO:0000220 | vacuolar proton-transporting V-type ATPase, V0 domain(GO:0000220) |
| 0.0 | 0.1 | GO:0030689 | Noc complex(GO:0030689) |
| 0.0 | 0.5 | GO:0005915 | zonula adherens(GO:0005915) |
| 0.0 | 0.1 | GO:0071748 | IgA immunoglobulin complex(GO:0071745) IgA immunoglobulin complex, circulating(GO:0071746) monomeric IgA immunoglobulin complex(GO:0071748) polymeric IgA immunoglobulin complex(GO:0071749) secretory IgA immunoglobulin complex(GO:0071751) |
| 0.0 | 0.8 | GO:0030056 | hemidesmosome(GO:0030056) |
| 0.0 | 0.9 | GO:0005861 | troponin complex(GO:0005861) |
| 0.0 | 0.8 | GO:0031362 | anchored component of external side of plasma membrane(GO:0031362) |
| 0.0 | 0.1 | GO:0032937 | SREBP-SCAP-Insig complex(GO:0032937) |
| 0.0 | 0.4 | GO:0016013 | syntrophin complex(GO:0016013) |
| 0.0 | 0.2 | GO:0042825 | TAP complex(GO:0042825) |
| 0.0 | 0.2 | GO:0032449 | CBM complex(GO:0032449) |
| 0.0 | 0.5 | GO:0005641 | nuclear envelope lumen(GO:0005641) |
| 0.0 | 0.3 | GO:0005655 | nucleolar ribonuclease P complex(GO:0005655) |
| 0.0 | 0.1 | GO:0042585 | germinal vesicle(GO:0042585) |
| 0.0 | 0.2 | GO:0005971 | ribonucleoside-diphosphate reductase complex(GO:0005971) |
| 0.0 | 0.1 | GO:0005668 | RNA polymerase transcription factor SL1 complex(GO:0005668) |
| 0.0 | 0.2 | GO:0098536 | deuterosome(GO:0098536) |
| 0.0 | 0.2 | GO:0034688 | integrin alphaM-beta2 complex(GO:0034688) |
| 0.0 | 0.3 | GO:0001939 | female pronucleus(GO:0001939) |
| 0.0 | 0.3 | GO:1990023 | mitotic spindle midzone(GO:1990023) |
| 0.0 | 0.1 | GO:0072379 | BAT3 complex(GO:0071818) ER membrane insertion complex(GO:0072379) |
| 0.0 | 0.2 | GO:0043541 | UDP-N-acetylglucosamine transferase complex(GO:0043541) |
| 0.0 | 0.1 | GO:0000799 | nuclear condensin complex(GO:0000799) |
| 0.0 | 0.4 | GO:0070419 | nonhomologous end joining complex(GO:0070419) |
| 0.0 | 0.2 | GO:0031390 | Ctf18 RFC-like complex(GO:0031390) |
| 0.0 | 0.3 | GO:0046581 | intercellular canaliculus(GO:0046581) |
| 0.0 | 0.1 | GO:0009328 | phenylalanine-tRNA ligase complex(GO:0009328) |
| 0.0 | 0.1 | GO:0033597 | mitotic checkpoint complex(GO:0033597) bub1-bub3 complex(GO:1990298) |
| 0.0 | 0.2 | GO:0098575 | lumenal side of lysosomal membrane(GO:0098575) |
| 0.0 | 0.1 | GO:0005602 | complement component C1 complex(GO:0005602) |
| 0.0 | 0.1 | GO:0001405 | presequence translocase-associated import motor(GO:0001405) |
| 0.0 | 0.1 | GO:1990075 | periciliary membrane compartment(GO:1990075) |
| 0.0 | 0.1 | GO:0048179 | activin receptor complex(GO:0048179) |
| 0.0 | 0.9 | GO:0030673 | axolemma(GO:0030673) |
| 0.0 | 1.9 | GO:0033116 | endoplasmic reticulum-Golgi intermediate compartment membrane(GO:0033116) |
| 0.0 | 0.2 | GO:0070022 | transforming growth factor beta receptor homodimeric complex(GO:0070022) |
| 0.0 | 0.1 | GO:0000221 | vacuolar proton-transporting V-type ATPase, V1 domain(GO:0000221) |
| 0.0 | 0.3 | GO:0005883 | neurofilament(GO:0005883) |
| 0.0 | 0.0 | GO:0097125 | cyclin B1-CDK1 complex(GO:0097125) |
| 0.0 | 0.5 | GO:0031932 | TORC2 complex(GO:0031932) |
| 0.0 | 0.1 | GO:0034750 | Scrib-APC-beta-catenin complex(GO:0034750) |
| 0.0 | 0.6 | GO:0034706 | sodium channel complex(GO:0034706) |
| 0.0 | 0.1 | GO:0032279 | asymmetric synapse(GO:0032279) |
| 0.0 | 0.1 | GO:0097452 | GAIT complex(GO:0097452) |
| 0.0 | 0.4 | GO:0008250 | oligosaccharyltransferase complex(GO:0008250) |
| 0.0 | 0.1 | GO:0002079 | inner acrosomal membrane(GO:0002079) |
| 0.0 | 0.6 | GO:0031093 | platelet alpha granule lumen(GO:0031093) |
| 0.0 | 0.1 | GO:0031933 | telomeric heterochromatin(GO:0031933) |
| 0.0 | 0.1 | GO:0005658 | alpha DNA polymerase:primase complex(GO:0005658) |
| 0.0 | 0.0 | GO:0098576 | lumenal side of membrane(GO:0098576) |
| 0.0 | 0.1 | GO:0005850 | eukaryotic translation initiation factor 2 complex(GO:0005850) |
| 0.0 | 0.7 | GO:0005640 | nuclear outer membrane(GO:0005640) |
| 0.0 | 2.0 | GO:0070821 | tertiary granule membrane(GO:0070821) |
| 0.0 | 0.2 | GO:0008541 | proteasome regulatory particle, lid subcomplex(GO:0008541) |
| 0.0 | 0.4 | GO:0071682 | endocytic vesicle lumen(GO:0071682) |
| 0.0 | 0.3 | GO:0000780 | condensed nuclear chromosome, centromeric region(GO:0000780) |
| 0.0 | 0.1 | GO:0031085 | BLOC-3 complex(GO:0031085) |
| 0.0 | 0.5 | GO:0030687 | preribosome, large subunit precursor(GO:0030687) |
| 0.0 | 0.5 | GO:0031092 | platelet alpha granule membrane(GO:0031092) |
| 0.0 | 0.1 | GO:0031417 | NatC complex(GO:0031417) |
| 0.0 | 0.0 | GO:0000126 | transcription factor TFIIIB complex(GO:0000126) |
| 0.0 | 0.1 | GO:0036454 | insulin-like growth factor binding protein complex(GO:0016942) growth factor complex(GO:0036454) |
| 0.0 | 0.4 | GO:0016327 | apicolateral plasma membrane(GO:0016327) |
| 0.0 | 0.1 | GO:0036128 | CatSper complex(GO:0036128) |
| 0.0 | 0.3 | GO:0031045 | dense core granule(GO:0031045) |
| 0.0 | 1.5 | GO:0005913 | cell-cell adherens junction(GO:0005913) |
| 0.0 | 0.1 | GO:0031905 | early endosome lumen(GO:0031905) |
| 0.0 | 0.1 | GO:0034457 | Mpp10 complex(GO:0034457) |
| 0.0 | 0.1 | GO:0000137 | Golgi cis cisterna(GO:0000137) |
| 0.0 | 0.4 | GO:0005865 | striated muscle thin filament(GO:0005865) |
| 0.0 | 0.1 | GO:0042406 | extrinsic component of endoplasmic reticulum membrane(GO:0042406) |
| 0.0 | 0.2 | GO:0072546 | ER membrane protein complex(GO:0072546) |
| 0.0 | 0.2 | GO:0002199 | zona pellucida receptor complex(GO:0002199) |
| 0.0 | 0.2 | GO:0000176 | nuclear exosome (RNase complex)(GO:0000176) |
| 0.0 | 0.0 | GO:1990745 | EARP complex(GO:1990745) |
| 0.0 | 0.3 | GO:0005922 | connexon complex(GO:0005922) |
| 0.0 | 0.0 | GO:0034045 | pre-autophagosomal structure membrane(GO:0034045) |
| 0.0 | 0.1 | GO:0032010 | phagolysosome(GO:0032010) |
| 0.0 | 0.1 | GO:0061700 | GATOR2 complex(GO:0061700) |
| 0.0 | 1.2 | GO:0005902 | microvillus(GO:0005902) |
| 0.0 | 0.1 | GO:0017102 | methionyl glutamyl tRNA synthetase complex(GO:0017102) |
| 0.0 | 0.1 | GO:0036056 | filtration diaphragm(GO:0036056) slit diaphragm(GO:0036057) |
| 0.0 | 0.1 | GO:0034388 | Pwp2p-containing subcomplex of 90S preribosome(GO:0034388) |
| 0.0 | 0.2 | GO:0042575 | DNA polymerase complex(GO:0042575) |
| 0.0 | 0.0 | GO:0036398 | TCR signalosome(GO:0036398) |
| 0.0 | 0.1 | GO:0005790 | smooth endoplasmic reticulum(GO:0005790) |
| 0.0 | 0.1 | GO:0032541 | cortical endoplasmic reticulum(GO:0032541) |
| 0.0 | 0.2 | GO:0005736 | DNA-directed RNA polymerase I complex(GO:0005736) |
| 0.0 | 0.2 | GO:0030686 | 90S preribosome(GO:0030686) |
| 0.0 | 0.3 | GO:0042629 | mast cell granule(GO:0042629) |
| 0.0 | 0.1 | GO:0032593 | insulin-responsive compartment(GO:0032593) |
| 0.0 | 0.1 | GO:0070083 | clathrin-sculpted monoamine transport vesicle(GO:0070081) clathrin-sculpted monoamine transport vesicle membrane(GO:0070083) |
Gene overrepresentation in molecular_function category:
| Log-likelihood per target | Total log-likelihood | Term | Description |
|---|---|---|---|
| 0.3 | 1.0 | GO:0038131 | neuregulin receptor activity(GO:0038131) |
| 0.2 | 0.6 | GO:0005298 | proline:sodium symporter activity(GO:0005298) |
| 0.2 | 0.5 | GO:0016165 | linoleate 13S-lipoxygenase activity(GO:0016165) |
| 0.2 | 0.6 | GO:0004142 | diacylglycerol cholinephosphotransferase activity(GO:0004142) |
| 0.2 | 0.8 | GO:0046899 | nucleoside triphosphate adenylate kinase activity(GO:0046899) |
| 0.1 | 0.6 | GO:0030305 | heparanase activity(GO:0030305) |
| 0.1 | 0.5 | GO:0050220 | prostaglandin-E synthase activity(GO:0050220) |
| 0.1 | 1.1 | GO:0086083 | cell adhesive protein binding involved in bundle of His cell-Purkinje myocyte communication(GO:0086083) |
| 0.1 | 0.4 | GO:0003845 | 11-beta-hydroxysteroid dehydrogenase [NAD(P)] activity(GO:0003845) |
| 0.1 | 0.7 | GO:0004741 | [pyruvate dehydrogenase (lipoamide)] phosphatase activity(GO:0004741) |
| 0.1 | 1.2 | GO:0004931 | extracellular ATP-gated cation channel activity(GO:0004931) ATP-gated ion channel activity(GO:0035381) |
| 0.1 | 0.6 | GO:0015184 | L-cystine transmembrane transporter activity(GO:0015184) |
| 0.1 | 0.3 | GO:0003980 | UDP-glucose:glycoprotein glucosyltransferase activity(GO:0003980) |
| 0.1 | 0.3 | GO:0030984 | kininogen binding(GO:0030984) |
| 0.1 | 0.6 | GO:0023025 | MHC class Ib protein complex binding(GO:0023025) MHC class Ib protein binding, via antigen binding groove(GO:0023030) |
| 0.1 | 0.6 | GO:0008449 | N-acetylglucosamine-6-sulfatase activity(GO:0008449) |
| 0.1 | 0.3 | GO:0004608 | phosphatidyl-N-methylethanolamine N-methyltransferase activity(GO:0000773) phosphatidylethanolamine N-methyltransferase activity(GO:0004608) phosphatidyl-N-dimethylethanolamine N-methyltransferase activity(GO:0080101) |
| 0.1 | 0.7 | GO:0046979 | TAP2 binding(GO:0046979) |
| 0.1 | 0.5 | GO:0017050 | sphinganine kinase activity(GO:0008481) D-erythro-sphingosine kinase activity(GO:0017050) |
| 0.1 | 0.5 | GO:0005006 | epidermal growth factor-activated receptor activity(GO:0005006) |
| 0.1 | 0.3 | GO:0034189 | very-low-density lipoprotein particle binding(GO:0034189) |
| 0.1 | 0.6 | GO:0015183 | L-aspartate transmembrane transporter activity(GO:0015183) |
| 0.1 | 0.4 | GO:0004832 | valine-tRNA ligase activity(GO:0004832) |
| 0.1 | 0.3 | GO:0008475 | procollagen-lysine 5-dioxygenase activity(GO:0008475) procollagen glucosyltransferase activity(GO:0033823) |
| 0.1 | 0.3 | GO:0072345 | NAADP-sensitive calcium-release channel activity(GO:0072345) |
| 0.1 | 0.3 | GO:0005462 | UDP-N-acetylglucosamine transmembrane transporter activity(GO:0005462) |
| 0.1 | 0.4 | GO:0004850 | uridine phosphorylase activity(GO:0004850) |
| 0.1 | 0.3 | GO:0097363 | protein O-GlcNAc transferase activity(GO:0097363) |
| 0.1 | 0.3 | GO:0008508 | bile acid:sodium symporter activity(GO:0008508) |
| 0.1 | 0.9 | GO:0046703 | natural killer cell lectin-like receptor binding(GO:0046703) |
| 0.1 | 0.2 | GO:0033300 | dehydroascorbic acid transporter activity(GO:0033300) |
| 0.1 | 0.2 | GO:0015130 | mevalonate transmembrane transporter activity(GO:0015130) |
| 0.1 | 0.2 | GO:0035403 | histone kinase activity (H3-T6 specific)(GO:0035403) |
| 0.1 | 0.2 | GO:0008518 | reduced folate carrier activity(GO:0008518) |
| 0.1 | 0.5 | GO:0004064 | arylesterase activity(GO:0004064) |
| 0.1 | 0.3 | GO:0086020 | gap junction channel activity involved in SA node cell-atrial cardiac muscle cell electrical coupling(GO:0086020) |
| 0.1 | 0.6 | GO:0015349 | thyroid hormone transmembrane transporter activity(GO:0015349) |
| 0.1 | 0.2 | GO:0003883 | CTP synthase activity(GO:0003883) |
| 0.1 | 0.2 | GO:0051120 | hepoxilin A3 synthase activity(GO:0051120) |
| 0.1 | 0.9 | GO:0031014 | troponin T binding(GO:0031014) |
| 0.1 | 0.6 | GO:0005176 | ErbB-2 class receptor binding(GO:0005176) |
| 0.1 | 0.6 | GO:0001730 | 2'-5'-oligoadenylate synthetase activity(GO:0001730) |
| 0.1 | 0.2 | GO:0000822 | inositol hexakisphosphate binding(GO:0000822) inositol 1,4,5-trisphosphate-sensitive calcium-release channel activity(GO:0005220) |
| 0.1 | 0.3 | GO:0017108 | 5'-flap endonuclease activity(GO:0017108) |
| 0.1 | 0.9 | GO:0005351 | sugar:proton symporter activity(GO:0005351) cation:sugar symporter activity(GO:0005402) |
| 0.0 | 0.3 | GO:0035662 | Toll-like receptor 4 binding(GO:0035662) |
| 0.0 | 0.1 | GO:0030350 | iron-responsive element binding(GO:0030350) |
| 0.0 | 0.2 | GO:0050509 | N-acetylglucosaminyl-proteoglycan 4-beta-glucuronosyltransferase activity(GO:0050509) |
| 0.0 | 0.3 | GO:1990405 | protein antigen binding(GO:1990405) |
| 0.0 | 0.1 | GO:0004822 | isoleucine-tRNA ligase activity(GO:0004822) |
| 0.0 | 0.3 | GO:0042015 | interleukin-20 binding(GO:0042015) |
| 0.0 | 0.7 | GO:0005432 | calcium:sodium antiporter activity(GO:0005432) |
| 0.0 | 0.1 | GO:0031862 | prostanoid receptor binding(GO:0031862) |
| 0.0 | 0.3 | GO:0005166 | neurotrophin p75 receptor binding(GO:0005166) |
| 0.0 | 0.2 | GO:0004809 | tRNA (guanine-N2-)-methyltransferase activity(GO:0004809) |
| 0.0 | 0.3 | GO:0050294 | steroid sulfotransferase activity(GO:0050294) |
| 0.0 | 0.3 | GO:0070097 | delta-catenin binding(GO:0070097) |
| 0.0 | 0.2 | GO:0030229 | very-low-density lipoprotein particle receptor activity(GO:0030229) |
| 0.0 | 0.2 | GO:0050501 | hyaluronan synthase activity(GO:0050501) |
| 0.0 | 0.2 | GO:0004906 | interferon-gamma receptor activity(GO:0004906) |
| 0.0 | 0.1 | GO:0004574 | oligo-1,6-glucosidase activity(GO:0004574) |
| 0.0 | 0.2 | GO:0018685 | alkane 1-monooxygenase activity(GO:0018685) |
| 0.0 | 0.6 | GO:0000014 | single-stranded DNA endodeoxyribonuclease activity(GO:0000014) |
| 0.0 | 0.1 | GO:0032093 | SAM domain binding(GO:0032093) |
| 0.0 | 0.6 | GO:0015280 | ligand-gated sodium channel activity(GO:0015280) |
| 0.0 | 0.1 | GO:0000035 | acyl binding(GO:0000035) |
| 0.0 | 0.2 | GO:0004720 | protein-lysine 6-oxidase activity(GO:0004720) |
| 0.0 | 0.5 | GO:0008199 | ferric iron binding(GO:0008199) |
| 0.0 | 0.4 | GO:0005007 | fibroblast growth factor-activated receptor activity(GO:0005007) |
| 0.0 | 0.2 | GO:0008401 | retinoic acid 4-hydroxylase activity(GO:0008401) |
| 0.0 | 0.2 | GO:0016972 | thiol oxidase activity(GO:0016972) |
| 0.0 | 0.3 | GO:0017150 | tRNA dihydrouridine synthase activity(GO:0017150) |
| 0.0 | 0.5 | GO:0070700 | BMP receptor binding(GO:0070700) |
| 0.0 | 0.4 | GO:0004579 | dolichyl-diphosphooligosaccharide-protein glycotransferase activity(GO:0004579) |
| 0.0 | 0.4 | GO:0045294 | alpha-catenin binding(GO:0045294) |
| 0.0 | 0.1 | GO:0016361 | activin receptor activity, type I(GO:0016361) |
| 0.0 | 1.2 | GO:0005385 | zinc ion transmembrane transporter activity(GO:0005385) |
| 0.0 | 0.1 | GO:0002094 | polyprenyltransferase activity(GO:0002094) |
| 0.0 | 0.3 | GO:0010997 | anaphase-promoting complex binding(GO:0010997) |
| 0.0 | 0.2 | GO:0051185 | coenzyme transporter activity(GO:0051185) |
| 0.0 | 0.7 | GO:0008510 | sodium:bicarbonate symporter activity(GO:0008510) |
| 0.0 | 1.3 | GO:0000146 | microfilament motor activity(GO:0000146) |
| 0.0 | 0.5 | GO:0030280 | structural constituent of epidermis(GO:0030280) |
| 0.0 | 0.1 | GO:0000033 | alpha-1,3-mannosyltransferase activity(GO:0000033) |
| 0.0 | 0.1 | GO:0089720 | caspase binding(GO:0089720) |
| 0.0 | 0.1 | GO:0004991 | parathyroid hormone receptor activity(GO:0004991) |
| 0.0 | 0.1 | GO:0003726 | double-stranded RNA adenosine deaminase activity(GO:0003726) |
| 0.0 | 0.1 | GO:0004376 | glycolipid mannosyltransferase activity(GO:0004376) |
| 0.0 | 0.4 | GO:0016723 | oxidoreductase activity, oxidizing metal ions, NAD or NADP as acceptor(GO:0016723) |
| 0.0 | 0.4 | GO:0030976 | thiamine pyrophosphate binding(GO:0030976) |
| 0.0 | 0.1 | GO:0004827 | glutamate-tRNA ligase activity(GO:0004818) proline-tRNA ligase activity(GO:0004827) |
| 0.0 | 0.9 | GO:0005540 | hyaluronic acid binding(GO:0005540) |
| 0.0 | 1.6 | GO:0005154 | epidermal growth factor receptor binding(GO:0005154) |
| 0.0 | 1.2 | GO:0042056 | chemoattractant activity(GO:0042056) |
| 0.0 | 0.1 | GO:0035501 | MH1 domain binding(GO:0035501) |
| 0.0 | 0.1 | GO:0070052 | collagen V binding(GO:0070052) |
| 0.0 | 0.5 | GO:0015095 | magnesium ion transmembrane transporter activity(GO:0015095) |
| 0.0 | 0.3 | GO:0015926 | glucosidase activity(GO:0015926) |
| 0.0 | 0.1 | GO:0003918 | DNA topoisomerase type II (ATP-hydrolyzing) activity(GO:0003918) DNA topoisomerase II activity(GO:0061505) |
| 0.0 | 0.8 | GO:0016505 | peptidase activator activity involved in apoptotic process(GO:0016505) |
| 0.0 | 0.1 | GO:0004677 | DNA-dependent protein kinase activity(GO:0004677) |
| 0.0 | 0.1 | GO:0016635 | oxidoreductase activity, acting on the CH-CH group of donors, quinone or related compound as acceptor(GO:0016635) |
| 0.0 | 0.2 | GO:0022850 | serotonin-gated cation channel activity(GO:0022850) |
| 0.0 | 0.7 | GO:0005001 | transmembrane receptor protein tyrosine phosphatase activity(GO:0005001) transmembrane receptor protein phosphatase activity(GO:0019198) |
| 0.0 | 0.3 | GO:0015194 | L-serine transmembrane transporter activity(GO:0015194) serine transmembrane transporter activity(GO:0022889) |
| 0.0 | 0.0 | GO:0098519 | nucleotide phosphatase activity, acting on free nucleotides(GO:0098519) |
| 0.0 | 0.3 | GO:0010851 | cyclase regulator activity(GO:0010851) |
| 0.0 | 0.1 | GO:0016603 | glutaminyl-peptide cyclotransferase activity(GO:0016603) |
| 0.0 | 0.1 | GO:0004731 | purine-nucleoside phosphorylase activity(GO:0004731) |
| 0.0 | 0.2 | GO:0047623 | AMP deaminase activity(GO:0003876) adenosine-phosphate deaminase activity(GO:0047623) |
| 0.0 | 0.2 | GO:0043237 | laminin-1 binding(GO:0043237) |
| 0.0 | 0.1 | GO:0010348 | lithium:proton antiporter activity(GO:0010348) |
| 0.0 | 0.7 | GO:0098641 | cadherin binding involved in cell-cell adhesion(GO:0098641) |
| 0.0 | 0.1 | GO:0004366 | glycerol-3-phosphate O-acyltransferase activity(GO:0004366) |
| 0.0 | 0.2 | GO:0016717 | oxidoreductase activity, acting on paired donors, with oxidation of a pair of donors resulting in the reduction of molecular oxygen to two molecules of water(GO:0016717) |
| 0.0 | 0.9 | GO:0005031 | tumor necrosis factor-activated receptor activity(GO:0005031) death receptor activity(GO:0005035) |
| 0.0 | 0.1 | GO:0015361 | low-affinity sodium:dicarboxylate symporter activity(GO:0015361) |
| 0.0 | 0.3 | GO:0004985 | opioid receptor activity(GO:0004985) |
| 0.0 | 0.7 | GO:0005109 | frizzled binding(GO:0005109) |
| 0.0 | 0.2 | GO:0004396 | glucokinase activity(GO:0004340) hexokinase activity(GO:0004396) fructokinase activity(GO:0008865) mannokinase activity(GO:0019158) |
| 0.0 | 0.2 | GO:0005025 | transforming growth factor beta receptor activity, type I(GO:0005025) |
| 0.0 | 0.2 | GO:0033170 | DNA clamp loader activity(GO:0003689) protein-DNA loading ATPase activity(GO:0033170) |
| 0.0 | 0.3 | GO:0001087 | transcription factor activity, sequence-specific DNA binding, RNA polymerase recruiting(GO:0001011) transcription factor activity, TFIIB-class binding(GO:0001087) |
| 0.0 | 0.3 | GO:0004526 | ribonuclease P activity(GO:0004526) |
| 0.0 | 0.1 | GO:0035243 | protein-arginine omega-N symmetric methyltransferase activity(GO:0035243) |
| 0.0 | 0.1 | GO:0051731 | polynucleotide 5'-hydroxyl-kinase activity(GO:0051731) |
| 0.0 | 0.1 | GO:0047322 | [hydroxymethylglutaryl-CoA reductase (NADPH)] kinase activity(GO:0047322) [acetyl-CoA carboxylase] kinase activity(GO:0050405) |
| 0.0 | 0.2 | GO:0070053 | thrombospondin receptor activity(GO:0070053) |
| 0.0 | 0.5 | GO:0005112 | Notch binding(GO:0005112) |
| 0.0 | 0.1 | GO:0035614 | snRNA stem-loop binding(GO:0035614) |
| 0.0 | 0.2 | GO:0001851 | complement component C3b binding(GO:0001851) |
| 0.0 | 0.1 | GO:0071987 | WD40-repeat domain binding(GO:0071987) |
| 0.0 | 0.1 | GO:0015222 | serotonin transmembrane transporter activity(GO:0015222) |
| 0.0 | 0.7 | GO:0017147 | Wnt-protein binding(GO:0017147) |
| 0.0 | 0.2 | GO:0015181 | arginine transmembrane transporter activity(GO:0015181) |
| 0.0 | 0.1 | GO:0052798 | beta-galactoside alpha-2,3-sialyltransferase activity(GO:0052798) |
| 0.0 | 0.2 | GO:0035242 | protein-arginine omega-N asymmetric methyltransferase activity(GO:0035242) |
| 0.0 | 0.6 | GO:0030676 | Rac guanyl-nucleotide exchange factor activity(GO:0030676) |
| 0.0 | 0.5 | GO:0004653 | polypeptide N-acetylgalactosaminyltransferase activity(GO:0004653) |
| 0.0 | 0.5 | GO:0004745 | retinol dehydrogenase activity(GO:0004745) |
| 0.0 | 0.1 | GO:0030197 | extracellular matrix constituent, lubricant activity(GO:0030197) |
| 0.0 | 0.1 | GO:0034584 | piRNA binding(GO:0034584) |
| 0.0 | 0.2 | GO:0022832 | voltage-gated ion channel activity(GO:0005244) voltage-gated channel activity(GO:0022832) |
| 0.0 | 0.1 | GO:0043262 | adenosine-diphosphatase activity(GO:0043262) |
| 0.0 | 0.1 | GO:0046624 | sphingolipid transporter activity(GO:0046624) |
| 0.0 | 0.1 | GO:0004826 | phenylalanine-tRNA ligase activity(GO:0004826) |
| 0.0 | 0.1 | GO:0030144 | alpha-1,6-mannosylglycoprotein 6-beta-N-acetylglucosaminyltransferase activity(GO:0030144) |
| 0.0 | 0.2 | GO:0047498 | calcium-dependent phospholipase A2 activity(GO:0047498) |
| 0.0 | 0.3 | GO:0015643 | toxic substance binding(GO:0015643) |
| 0.0 | 0.3 | GO:0031432 | titin binding(GO:0031432) |
| 0.0 | 0.5 | GO:0017056 | structural constituent of nuclear pore(GO:0017056) |
| 0.0 | 1.9 | GO:0005089 | Rho guanyl-nucleotide exchange factor activity(GO:0005089) |
| 0.0 | 0.1 | GO:0035174 | histone serine kinase activity(GO:0035174) |
| 0.0 | 0.1 | GO:0039706 | co-receptor binding(GO:0039706) |
| 0.0 | 0.4 | GO:0001614 | purinergic nucleotide receptor activity(GO:0001614) nucleotide receptor activity(GO:0016502) |
| 0.0 | 0.4 | GO:0005247 | voltage-gated chloride channel activity(GO:0005247) |
| 0.0 | 0.1 | GO:0055056 | D-glucose transmembrane transporter activity(GO:0055056) |
| 0.0 | 0.1 | GO:0047757 | chondroitin-glucuronate 5-epimerase activity(GO:0047757) |
| 0.0 | 0.3 | GO:0002162 | dystroglycan binding(GO:0002162) |
| 0.0 | 0.1 | GO:0043208 | glycosphingolipid binding(GO:0043208) |
| 0.0 | 0.2 | GO:0031995 | insulin-like growth factor II binding(GO:0031995) |
| 0.0 | 0.0 | GO:0004769 | steroid delta-isomerase activity(GO:0004769) |
| 0.0 | 0.1 | GO:0032051 | clathrin light chain binding(GO:0032051) |
| 0.0 | 0.2 | GO:0000774 | adenyl-nucleotide exchange factor activity(GO:0000774) |
| 0.0 | 0.1 | GO:0001665 | alpha-N-acetylgalactosaminide alpha-2,6-sialyltransferase activity(GO:0001665) |
| 0.0 | 0.0 | GO:0016749 | 5-aminolevulinate synthase activity(GO:0003870) N-succinyltransferase activity(GO:0016749) |
| 0.0 | 0.1 | GO:0048027 | mRNA 5'-UTR binding(GO:0048027) |
| 0.0 | 0.1 | GO:0042954 | lipoprotein transporter activity(GO:0042954) |
| 0.0 | 0.5 | GO:0051428 | peptide hormone receptor binding(GO:0051428) |
| 0.0 | 0.1 | GO:0017159 | pantetheine hydrolase activity(GO:0017159) |
| 0.0 | 0.0 | GO:0001026 | TFIIIB-type transcription factor activity(GO:0001026) |
| 0.0 | 0.1 | GO:0008431 | vitamin E binding(GO:0008431) |
| 0.0 | 0.1 | GO:0010521 | telomerase inhibitor activity(GO:0010521) |
| 0.0 | 0.1 | GO:0047493 | sphingomyelin synthase activity(GO:0033188) ceramide cholinephosphotransferase activity(GO:0047493) |
| 0.0 | 0.0 | GO:0017002 | activin-activated receptor activity(GO:0017002) |
| 0.0 | 0.0 | GO:0005152 | interleukin-1 receptor antagonist activity(GO:0005152) |
| 0.0 | 0.0 | GO:0004450 | isocitrate dehydrogenase (NADP+) activity(GO:0004450) (R)-2-hydroxyglutarate dehydrogenase activity(GO:0051990) |
| 0.0 | 0.1 | GO:0005041 | low-density lipoprotein receptor activity(GO:0005041) |
| 0.0 | 0.1 | GO:0001849 | complement component C1q binding(GO:0001849) |
| 0.0 | 0.1 | GO:0015252 | hydrogen ion channel activity(GO:0015252) |
| 0.0 | 0.1 | GO:0008174 | mRNA methyltransferase activity(GO:0008174) |
| 0.0 | 0.3 | GO:0004697 | protein kinase C activity(GO:0004697) |
| 0.0 | 0.0 | GO:0043734 | DNA demethylase activity(GO:0035514) DNA-N1-methyladenine dioxygenase activity(GO:0043734) |
| 0.0 | 0.0 | GO:0045322 | unmethylated CpG binding(GO:0045322) |
| 0.0 | 0.1 | GO:0022820 | potassium:chloride symporter activity(GO:0015379) potassium ion symporter activity(GO:0022820) |
| 0.0 | 0.0 | GO:0008413 | 8-oxo-7,8-dihydroguanosine triphosphate pyrophosphatase activity(GO:0008413) 8-oxo-7,8-dihydrodeoxyguanosine triphosphate pyrophosphatase activity(GO:0035539) |
| 0.0 | 0.1 | GO:0043023 | ribosomal large subunit binding(GO:0043023) |
| 0.0 | 0.4 | GO:0004012 | phospholipid-translocating ATPase activity(GO:0004012) |
| 0.0 | 0.0 | GO:0008424 | glycoprotein 6-alpha-L-fucosyltransferase activity(GO:0008424) alpha-(1->6)-fucosyltransferase activity(GO:0046921) |
| 0.0 | 0.1 | GO:0001602 | pancreatic polypeptide receptor activity(GO:0001602) |
| 0.0 | 0.1 | GO:0015174 | basic amino acid transmembrane transporter activity(GO:0015174) |
| 0.0 | 0.2 | GO:0004000 | adenosine deaminase activity(GO:0004000) |
| 0.0 | 0.1 | GO:0004771 | sterol esterase activity(GO:0004771) |
| 0.0 | 0.2 | GO:0005094 | Rho GDP-dissociation inhibitor activity(GO:0005094) |
| 0.0 | 0.4 | GO:0004806 | triglyceride lipase activity(GO:0004806) |
| 0.0 | 0.0 | GO:0035673 | cobalamin transporter activity(GO:0015235) oligopeptide transmembrane transporter activity(GO:0035673) |
| 0.0 | 0.2 | GO:0004716 | receptor signaling protein tyrosine kinase activity(GO:0004716) |
| 0.0 | 0.0 | GO:0016670 | oxidoreductase activity, acting on a sulfur group of donors, oxygen as acceptor(GO:0016670) |
| 0.0 | 0.1 | GO:0060175 | brain-derived neurotrophic factor-activated receptor activity(GO:0060175) |
| 0.0 | 0.6 | GO:0005504 | fatty acid binding(GO:0005504) |
| 0.0 | 0.4 | GO:0005337 | nucleoside transmembrane transporter activity(GO:0005337) |
| 0.0 | 0.0 | GO:0003858 | 3-hydroxybutyrate dehydrogenase activity(GO:0003858) |
| 0.0 | 0.0 | GO:0071207 | histone pre-mRNA stem-loop binding(GO:0071207) |
| 0.0 | 0.2 | GO:0004568 | chitinase activity(GO:0004568) |
| 0.0 | 0.1 | GO:0005030 | neurotrophin receptor activity(GO:0005030) |
| 0.0 | 0.2 | GO:0008494 | translation activator activity(GO:0008494) |
| 0.0 | 0.1 | GO:0019238 | cyclohydrolase activity(GO:0019238) |
| 0.0 | 0.1 | GO:0030552 | cAMP binding(GO:0030552) |
| 0.0 | 0.0 | GO:0004140 | dephospho-CoA kinase activity(GO:0004140) |
| 0.0 | 0.2 | GO:0003688 | DNA replication origin binding(GO:0003688) |
| 0.0 | 0.2 | GO:0034450 | ubiquitin-ubiquitin ligase activity(GO:0034450) |
| 0.0 | 0.0 | GO:0004920 | interleukin-10 receptor activity(GO:0004920) |
| 0.0 | 0.2 | GO:0005229 | intracellular calcium activated chloride channel activity(GO:0005229) |
| 0.0 | 0.2 | GO:0004185 | serine-type carboxypeptidase activity(GO:0004185) |
| 0.0 | 0.3 | GO:0030506 | ankyrin binding(GO:0030506) |
| 0.0 | 0.0 | GO:0003963 | RNA-3'-phosphate cyclase activity(GO:0003963) |
| 0.0 | 0.0 | GO:0004817 | cysteine-tRNA ligase activity(GO:0004817) |
| 0.0 | 0.0 | GO:0036033 | mediator complex binding(GO:0036033) |
| 0.0 | 0.0 | GO:0004307 | ethanolaminephosphotransferase activity(GO:0004307) |
| 0.0 | 0.5 | GO:0042169 | SH2 domain binding(GO:0042169) |
| 0.0 | 0.4 | GO:0003887 | DNA-directed DNA polymerase activity(GO:0003887) |
| 0.0 | 0.1 | GO:0016176 | superoxide-generating NADPH oxidase activator activity(GO:0016176) |
| 0.0 | 0.1 | GO:0047179 | platelet-activating factor acetyltransferase activity(GO:0047179) |
| 0.0 | 0.2 | GO:0001054 | RNA polymerase I activity(GO:0001054) |
| 0.0 | 0.0 | GO:0008426 | protein kinase C inhibitor activity(GO:0008426) |
| 0.0 | 0.1 | GO:0070891 | lipoteichoic acid binding(GO:0070891) |
| 0.0 | 0.0 | GO:0017099 | very-long-chain-acyl-CoA dehydrogenase activity(GO:0017099) |
| 0.0 | 0.0 | GO:0050510 | N-acetylgalactosaminyl-proteoglycan 3-beta-glucuronosyltransferase activity(GO:0050510) |
| 0.0 | 0.1 | GO:0030368 | interleukin-17 receptor activity(GO:0030368) |
| 0.0 | 0.1 | GO:0005384 | manganese ion transmembrane transporter activity(GO:0005384) |
| 0.0 | 0.0 | GO:0008192 | RNA guanylyltransferase activity(GO:0008192) |
| 0.0 | 0.0 | GO:0016273 | arginine N-methyltransferase activity(GO:0016273) protein-arginine N-methyltransferase activity(GO:0016274) |
| 0.0 | 0.1 | GO:0030160 | GKAP/Homer scaffold activity(GO:0030160) |
| 0.0 | 0.1 | GO:0005412 | glucose:sodium symporter activity(GO:0005412) |
| 0.0 | 0.0 | GO:0004663 | Rab geranylgeranyltransferase activity(GO:0004663) |
| 0.0 | 0.2 | GO:0017017 | MAP kinase tyrosine/serine/threonine phosphatase activity(GO:0017017) |
| 0.0 | 0.1 | GO:0004521 | endoribonuclease activity(GO:0004521) |
| 0.0 | 0.0 | GO:1990404 | protein ADP-ribosylase activity(GO:1990404) |
Gene overrepresentation in C2:CP category:
| Log-likelihood per target | Total log-likelihood | Term | Description |
|---|---|---|---|
| 0.2 | 3.7 | PID INTEGRIN4 PATHWAY | Alpha6 beta4 integrin-ligand interactions |
| 0.1 | 2.2 | PID ERBB NETWORK PATHWAY | ErbB receptor signaling network |
| 0.0 | 1.0 | SA MMP CYTOKINE CONNECTION | Cytokines can induce activation of matrix metalloproteinases, which degrade extracellular matrix. |
| 0.0 | 0.1 | ST PHOSPHOINOSITIDE 3 KINASE PATHWAY | PI3K Pathway |
| 0.0 | 1.0 | PID TOLL ENDOGENOUS PATHWAY | Endogenous TLR signaling |
| 0.0 | 0.2 | SA REG CASCADE OF CYCLIN EXPR | Expression of cyclins regulates progression through the cell cycle by activating cyclin-dependent kinases. |
| 0.0 | 1.3 | PID BARD1 PATHWAY | BARD1 signaling events |
| 0.0 | 0.5 | PID S1P S1P1 PATHWAY | S1P1 pathway |
| 0.0 | 0.3 | PID TCR RAS PATHWAY | Ras signaling in the CD4+ TCR pathway |
| 0.0 | 0.4 | PID ANTHRAX PATHWAY | Cellular roles of Anthrax toxin |
| 0.0 | 0.4 | PID DNA PK PATHWAY | DNA-PK pathway in nonhomologous end joining |
| 0.0 | 0.1 | PID SYNDECAN 1 PATHWAY | Syndecan-1-mediated signaling events |
| 0.0 | 0.5 | PID INTEGRIN5 PATHWAY | Beta5 beta6 beta7 and beta8 integrin cell surface interactions |
| 0.0 | 1.0 | PID ALPHA SYNUCLEIN PATHWAY | Alpha-synuclein signaling |
| 0.0 | 0.4 | PID A6B1 A6B4 INTEGRIN PATHWAY | a6b1 and a6b4 Integrin signaling |
| 0.0 | 0.1 | PID NEPHRIN NEPH1 PATHWAY | Nephrin/Neph1 signaling in the kidney podocyte |
| 0.0 | 0.2 | SA TRKA RECEPTOR | The TrkA receptor binds nerve growth factor to activate MAP kinase pathways and promote cell growth. |
| 0.0 | 0.0 | PID TRAIL PATHWAY | TRAIL signaling pathway |
| 0.0 | 0.1 | ST JAK STAT PATHWAY | Jak-STAT Pathway |
| 0.0 | 1.3 | PID RHOA REG PATHWAY | Regulation of RhoA activity |
| 0.0 | 0.2 | PID IL3 PATHWAY | IL3-mediated signaling events |
| 0.0 | 0.5 | PID INSULIN GLUCOSE PATHWAY | Insulin-mediated glucose transport |
| 0.0 | 0.2 | ST INTERFERON GAMMA PATHWAY | Interferon gamma pathway. |
| 0.0 | 0.1 | PID ERBB2 ERBB3 PATHWAY | ErbB2/ErbB3 signaling events |
| 0.0 | 0.3 | PID LPA4 PATHWAY | LPA4-mediated signaling events |
| 0.0 | 0.2 | SA G2 AND M PHASES | Cdc25 activates the cdc2/cyclin B complex to induce the G2/M transition. |
| 0.0 | 0.9 | PID FGF PATHWAY | FGF signaling pathway |
| 0.0 | 0.1 | PID IL2 PI3K PATHWAY | IL2 signaling events mediated by PI3K |
| 0.0 | 0.4 | PID INTEGRIN A9B1 PATHWAY | Alpha9 beta1 integrin signaling events |
| 0.0 | 0.1 | ST IL 13 PATHWAY | Interleukin 13 (IL-13) Pathway |
Gene overrepresentation in C2:CP:REACTOME category:
| Log-likelihood per target | Total log-likelihood | Term | Description |
|---|---|---|---|
| 0.1 | 2.4 | REACTOME ADHERENS JUNCTIONS INTERACTIONS | Genes involved in Adherens junctions interactions |
| 0.1 | 0.5 | REACTOME ENDOSOMAL VACUOLAR PATHWAY | Genes involved in Endosomal/Vacuolar pathway |
| 0.1 | 1.1 | REACTOME FACILITATIVE NA INDEPENDENT GLUCOSE TRANSPORTERS | Genes involved in Facilitative Na+-independent glucose transporters |
| 0.0 | 4.7 | REACTOME CELL JUNCTION ORGANIZATION | Genes involved in Cell junction organization |
| 0.0 | 0.6 | REACTOME RECEPTOR LIGAND BINDING INITIATES THE SECOND PROTEOLYTIC CLEAVAGE OF NOTCH RECEPTOR | Genes involved in Receptor-ligand binding initiates the second proteolytic cleavage of Notch receptor |
| 0.0 | 1.2 | REACTOME ZINC TRANSPORTERS | Genes involved in Zinc transporters |
| 0.0 | 0.8 | REACTOME HYALURONAN UPTAKE AND DEGRADATION | Genes involved in Hyaluronan uptake and degradation |
| 0.0 | 0.7 | REACTOME REGULATION OF PYRUVATE DEHYDROGENASE PDH COMPLEX | Genes involved in Regulation of pyruvate dehydrogenase (PDH) complex |
| 0.0 | 1.1 | REACTOME FANCONI ANEMIA PATHWAY | Genes involved in Fanconi Anemia pathway |
| 0.0 | 0.6 | REACTOME E2F ENABLED INHIBITION OF PRE REPLICATION COMPLEX FORMATION | Genes involved in E2F-enabled inhibition of pre-replication complex formation |
| 0.0 | 0.1 | REACTOME APC C CDH1 MEDIATED DEGRADATION OF CDC20 AND OTHER APC C CDH1 TARGETED PROTEINS IN LATE MITOSIS EARLY G1 | Genes involved in APC/C:Cdh1 mediated degradation of Cdc20 and other APC/C:Cdh1 targeted proteins in late mitosis/early G1 |
| 0.0 | 0.7 | REACTOME TRANSPORT OF ORGANIC ANIONS | Genes involved in Transport of organic anions |
| 0.0 | 0.4 | REACTOME TRAFFICKING AND PROCESSING OF ENDOSOMAL TLR | Genes involved in Trafficking and processing of endosomal TLR |
| 0.0 | 1.5 | REACTOME AMINO ACID TRANSPORT ACROSS THE PLASMA MEMBRANE | Genes involved in Amino acid transport across the plasma membrane |
| 0.0 | 0.9 | REACTOME TRANSPORT OF VITAMINS NUCLEOSIDES AND RELATED MOLECULES | Genes involved in Transport of vitamins, nucleosides, and related molecules |
| 0.0 | 0.5 | REACTOME REVERSIBLE HYDRATION OF CARBON DIOXIDE | Genes involved in Reversible Hydration of Carbon Dioxide |
| 0.0 | 1.1 | REACTOME GRB2 EVENTS IN ERBB2 SIGNALING | Genes involved in GRB2 events in ERBB2 signaling |
| 0.0 | 1.2 | REACTOME SPHINGOLIPID DE NOVO BIOSYNTHESIS | Genes involved in Sphingolipid de novo biosynthesis |
| 0.0 | 0.4 | REACTOME ADENYLATE CYCLASE ACTIVATING PATHWAY | Genes involved in Adenylate cyclase activating pathway |
| 0.0 | 0.8 | REACTOME ADVANCED GLYCOSYLATION ENDPRODUCT RECEPTOR SIGNALING | Genes involved in Advanced glycosylation endproduct receptor signaling |
| 0.0 | 0.5 | REACTOME N GLYCAN TRIMMING IN THE ER AND CALNEXIN CALRETICULIN CYCLE | Genes involved in N-glycan trimming in the ER and Calnexin/Calreticulin cycle |
| 0.0 | 0.1 | REACTOME FORMATION OF THE HIV1 EARLY ELONGATION COMPLEX | Genes involved in Formation of the HIV-1 Early Elongation Complex |
| 0.0 | 0.3 | REACTOME PYRUVATE METABOLISM | Genes involved in Pyruvate metabolism |
| 0.0 | 0.2 | REACTOME ELEVATION OF CYTOSOLIC CA2 LEVELS | Genes involved in Elevation of cytosolic Ca2+ levels |
| 0.0 | 0.4 | REACTOME PROCESSIVE SYNTHESIS ON THE LAGGING STRAND | Genes involved in Processive synthesis on the lagging strand |
| 0.0 | 0.6 | REACTOME MITOCHONDRIAL TRNA AMINOACYLATION | Genes involved in Mitochondrial tRNA aminoacylation |
| 0.0 | 0.5 | REACTOME AMINO ACID AND OLIGOPEPTIDE SLC TRANSPORTERS | Genes involved in Amino acid and oligopeptide SLC transporters |
| 0.0 | 0.3 | REACTOME PYRIMIDINE CATABOLISM | Genes involved in Pyrimidine catabolism |
| 0.0 | 1.2 | REACTOME STRIATED MUSCLE CONTRACTION | Genes involved in Striated Muscle Contraction |
| 0.0 | 0.1 | REACTOME ASSOCIATION OF LICENSING FACTORS WITH THE PRE REPLICATIVE COMPLEX | Genes involved in Association of licensing factors with the pre-replicative complex |
| 0.0 | 0.6 | REACTOME SIGNALING BY BMP | Genes involved in Signaling by BMP |
| 0.0 | 0.5 | REACTOME SYNTHESIS OF PC | Genes involved in Synthesis of PC |
| 0.0 | 0.3 | REACTOME CYCLIN A B1 ASSOCIATED EVENTS DURING G2 M TRANSITION | Genes involved in Cyclin A/B1 associated events during G2/M transition |
| 0.0 | 0.3 | REACTOME TGF BETA RECEPTOR SIGNALING IN EMT EPITHELIAL TO MESENCHYMAL TRANSITION | Genes involved in TGF-beta receptor signaling in EMT (epithelial to mesenchymal transition) |
| 0.0 | 0.4 | REACTOME SYNTHESIS OF GLYCOSYLPHOSPHATIDYLINOSITOL GPI | Genes involved in Synthesis of glycosylphosphatidylinositol (GPI) |
| 0.0 | 0.5 | REACTOME FGFR LIGAND BINDING AND ACTIVATION | Genes involved in FGFR ligand binding and activation |
| 0.0 | 0.6 | REACTOME NEP NS2 INTERACTS WITH THE CELLULAR EXPORT MACHINERY | Genes involved in NEP/NS2 Interacts with the Cellular Export Machinery |
| 0.0 | 0.4 | REACTOME HS GAG DEGRADATION | Genes involved in HS-GAG degradation |
| 0.0 | 0.2 | REACTOME PRESYNAPTIC NICOTINIC ACETYLCHOLINE RECEPTORS | Genes involved in Presynaptic nicotinic acetylcholine receptors |
| 0.0 | 0.4 | REACTOME REGULATION OF COMPLEMENT CASCADE | Genes involved in Regulation of Complement cascade |
| 0.0 | 0.3 | REACTOME PURINE RIBONUCLEOSIDE MONOPHOSPHATE BIOSYNTHESIS | Genes involved in Purine ribonucleoside monophosphate biosynthesis |
| 0.0 | 0.4 | REACTOME TERMINATION OF O GLYCAN BIOSYNTHESIS | Genes involved in Termination of O-glycan biosynthesis |
| 0.0 | 0.1 | REACTOME HYALURONAN METABOLISM | Genes involved in Hyaluronan metabolism |
| 0.0 | 0.5 | REACTOME O LINKED GLYCOSYLATION OF MUCINS | Genes involved in O-linked glycosylation of mucins |
| 0.0 | 0.1 | REACTOME P75NTR RECRUITS SIGNALLING COMPLEXES | Genes involved in p75NTR recruits signalling complexes |
| 0.0 | 0.3 | REACTOME GAP JUNCTION ASSEMBLY | Genes involved in Gap junction assembly |
| 0.0 | 0.1 | REACTOME SHC RELATED EVENTS | Genes involved in SHC-related events |
| 0.0 | 0.2 | REACTOME ACYL CHAIN REMODELLING OF PG | Genes involved in Acyl chain remodelling of PG |
| 0.0 | 0.9 | REACTOME NRAGE SIGNALS DEATH THROUGH JNK | Genes involved in NRAGE signals death through JNK |
| 0.0 | 0.1 | REACTOME NEF MEDIATES DOWN MODULATION OF CELL SURFACE RECEPTORS BY RECRUITING THEM TO CLATHRIN ADAPTERS | Genes involved in Nef-mediates down modulation of cell surface receptors by recruiting them to clathrin adapters |
| 0.0 | 0.4 | REACTOME SIGNAL REGULATORY PROTEIN SIRP FAMILY INTERACTIONS | Genes involved in Signal regulatory protein (SIRP) family interactions |
| 0.0 | 0.4 | REACTOME REGULATION OF WATER BALANCE BY RENAL AQUAPORINS | Genes involved in Regulation of Water Balance by Renal Aquaporins |
| 0.0 | 0.1 | REACTOME DSCAM INTERACTIONS | Genes involved in DSCAM interactions |
| 0.0 | 0.2 | REACTOME ACTIVATION OF RAC | Genes involved in Activation of Rac |
| 0.0 | 0.2 | REACTOME ANTIGEN PRESENTATION FOLDING ASSEMBLY AND PEPTIDE LOADING OF CLASS I MHC | Genes involved in Antigen Presentation: Folding, assembly and peptide loading of class I MHC |
| 0.0 | 0.2 | REACTOME ACTIVATION OF THE PRE REPLICATIVE COMPLEX | Genes involved in Activation of the pre-replicative complex |
| 0.0 | 0.4 | REACTOME CYTOSOLIC TRNA AMINOACYLATION | Genes involved in Cytosolic tRNA aminoacylation |
| 0.0 | 0.3 | REACTOME HS GAG BIOSYNTHESIS | Genes involved in HS-GAG biosynthesis |
| 0.0 | 0.7 | REACTOME CYTOCHROME P450 ARRANGED BY SUBSTRATE TYPE | Genes involved in Cytochrome P450 - arranged by substrate type |
| 0.0 | 0.1 | REACTOME CREATION OF C4 AND C2 ACTIVATORS | Genes involved in Creation of C4 and C2 activators |