Project
Epithelial-Mesenchymal Transition, human (Scheel, 2011)
Navigation
Downloads
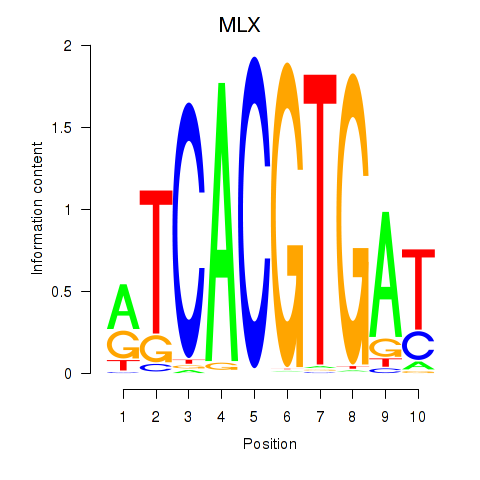
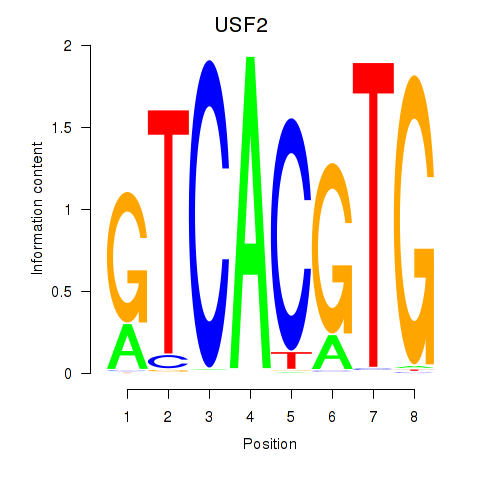
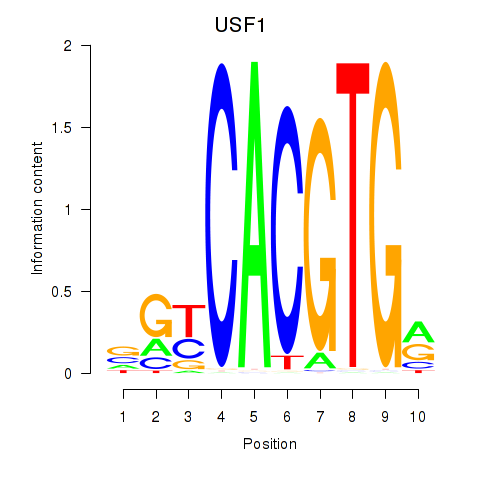
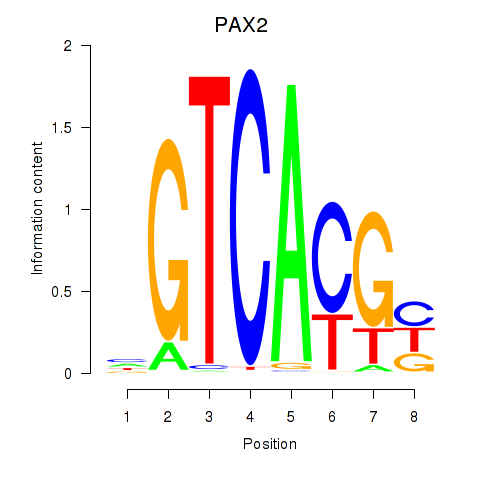
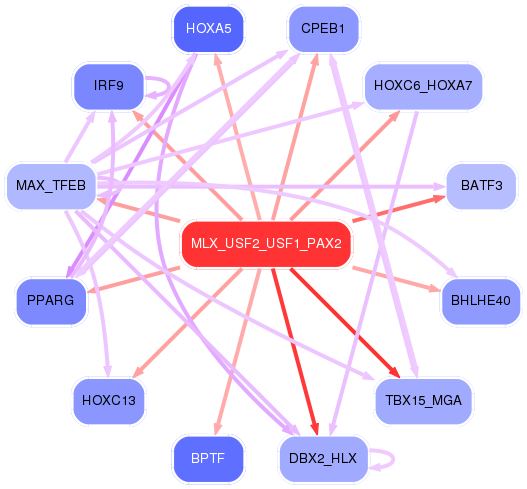
Results for MLX_USF2_USF1_PAX2
Z-value: 1.57
Motif logo
Transcription factors associated with MLX_USF2_USF1_PAX2
| Gene Symbol | Gene ID | Gene Info |
|---|---|---|
|
MLX
|
ENSG00000108788.7 | MLX |
|
USF2
|
ENSG00000105698.11 | USF2 |
|
USF1
|
ENSG00000158773.10 | USF1 |
|
PAX2
|
ENSG00000075891.17 | PAX2 |
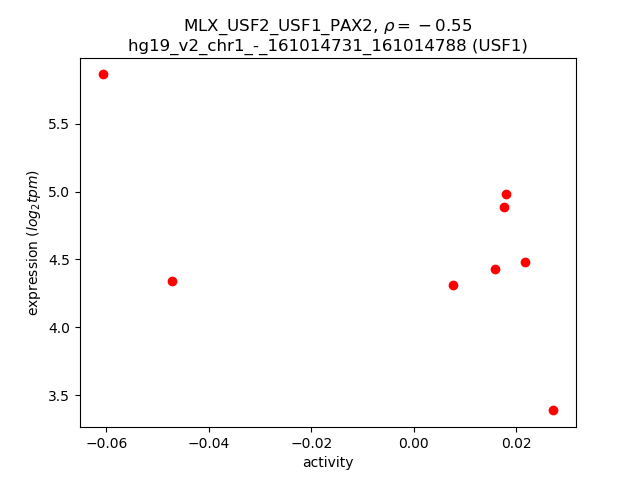
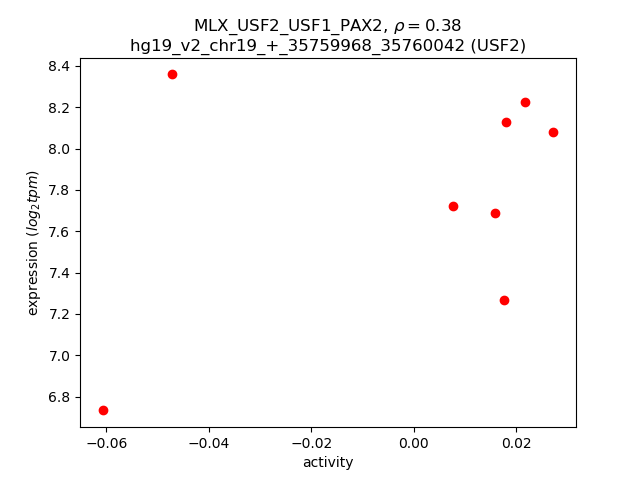
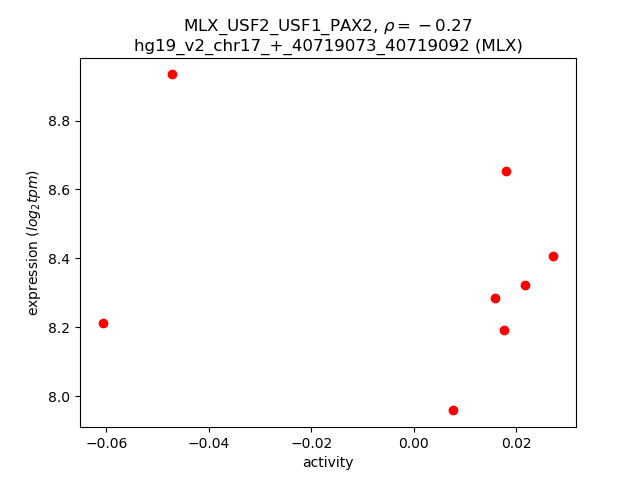
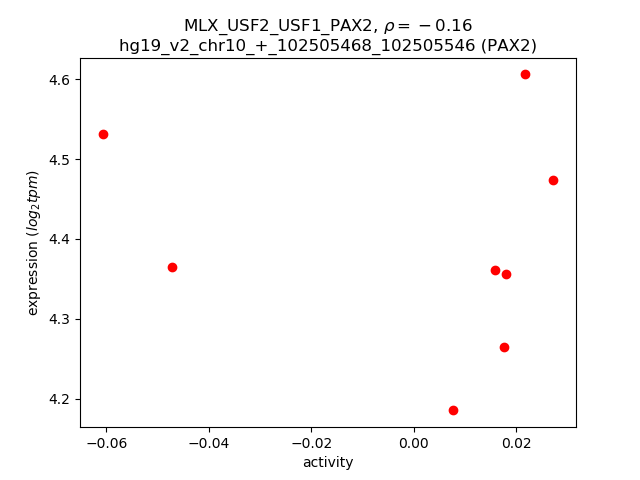
Activity-expression correlation:
| Gene | Promoter | Pearson corr. coef. | P-value | Plot |
|---|---|---|---|---|
| USF1 | hg19_v2_chr1_-_161014731_161014788, hg19_v2_chr1_-_161015752_161015778 | -0.55 | 1.5e-01 | Click! |
| USF2 | hg19_v2_chr19_+_35759968_35760042 | 0.38 | 3.6e-01 | Click! |
| MLX | hg19_v2_chr17_+_40719073_40719092 | -0.27 | 5.1e-01 | Click! |
| PAX2 | hg19_v2_chr10_+_102505468_102505546 | -0.16 | 7.0e-01 | Click! |
Activity profile of MLX_USF2_USF1_PAX2 motif
Sorted Z-values of MLX_USF2_USF1_PAX2 motif
Network of associatons between targets according to the STRING database.
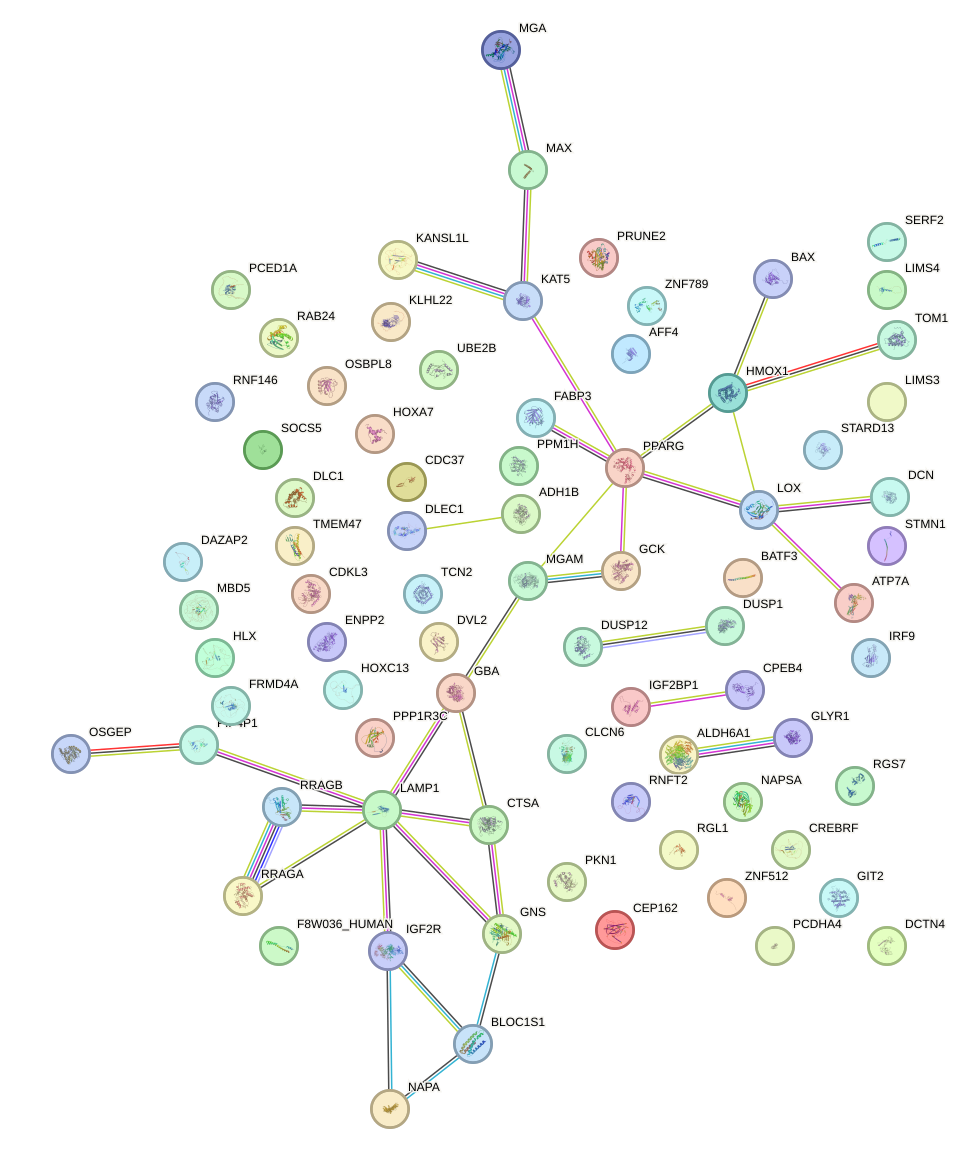
First level regulatory network of MLX_USF2_USF1_PAX2
| Promoter | Score | Transcript | Gene | Gene Info |
|---|---|---|---|---|
| chr1_+_183605200 | 3.85 |
ENST00000304685.4 |
RGL1 |
ral guanine nucleotide dissociation stimulator-like 1 |
| chr19_+_49458107 | 3.45 |
ENST00000539787.1 ENST00000345358.7 ENST00000391871.3 ENST00000415969.2 ENST00000354470.3 ENST00000506183.1 ENST00000293288.8 |
BAX |
BCL2-associated X protein |
| chr15_+_41913690 | 3.12 |
ENST00000563576.1 |
MGA |
MGA, MAX dimerization protein |
| chr9_-_79307096 | 2.99 |
ENST00000376717.2 ENST00000223609.6 ENST00000443509.2 |
PRUNE2 |
prune homolog 2 (Drosophila) |
| chr1_+_221051699 | 2.98 |
ENST00000366903.6 |
HLX |
H2.0-like homeobox |
| chr15_+_33022885 | 2.74 |
ENST00000322805.4 |
GREM1 |
gremlin 1, DAN family BMP antagonist |
| chr5_-_172198190 | 2.64 |
ENST00000239223.3 |
DUSP1 |
dual specificity phosphatase 1 |
| chr12_-_63328817 | 2.60 |
ENST00000228705.6 |
PPM1H |
protein phosphatase, Mg2+/Mn2+ dependent, 1H |
| chr1_-_241520525 | 2.45 |
ENST00000366565.1 |
RGS7 |
regulator of G-protein signaling 7 |
| chr12_+_90102729 | 2.40 |
ENST00000605386.1 |
LINC00936 |
long intergenic non-protein coding RNA 936 |
| chr1_-_241520385 | 2.39 |
ENST00000366564.1 |
RGS7 |
regulator of G-protein signaling 7 |
| chr19_+_14544099 | 2.38 |
ENST00000242783.6 ENST00000586557.1 ENST00000590097.1 |
PKN1 |
protein kinase N1 |
| chr17_-_66951474 | 2.36 |
ENST00000269080.2 |
ABCA8 |
ATP-binding cassette, sub-family A (ABC1), member 8 |
| chr2_+_148778570 | 2.33 |
ENST00000407073.1 |
MBD5 |
methyl-CpG binding domain protein 5 |
| chr10_-_93392811 | 2.32 |
ENST00000238994.5 |
PPP1R3C |
protein phosphatase 1, regulatory subunit 3C |
| chr1_+_11866207 | 2.30 |
ENST00000312413.6 ENST00000346436.6 |
CLCN6 |
chloride channel, voltage-sensitive 6 |
| chr22_+_35776828 | 2.30 |
ENST00000216117.8 |
HMOX1 |
heme oxygenase (decycling) 1 |
| chr22_-_36903101 | 2.29 |
ENST00000397224.4 |
FOXRED2 |
FAD-dependent oxidoreductase domain containing 2 |
| chr8_-_13134045 | 2.28 |
ENST00000512044.2 |
DLC1 |
deleted in liver cancer 1 |
| chr11_+_67776012 | 2.24 |
ENST00000539229.1 |
ALDH3B1 |
aldehyde dehydrogenase 3 family, member B1 |
| chr12_+_56109810 | 2.18 |
ENST00000550412.1 ENST00000257899.2 ENST00000548925.1 ENST00000549147.1 |
RP11-644F5.10 BLOC1S1 |
Uncharacterized protein biogenesis of lysosomal organelles complex-1, subunit 1 |
| chr13_-_33859819 | 2.10 |
ENST00000336934.5 |
STARD13 |
StAR-related lipid transfer (START) domain containing 13 |
| chr22_-_36903069 | 2.10 |
ENST00000216187.6 ENST00000423980.1 |
FOXRED2 |
FAD-dependent oxidoreductase domain containing 2 |
| chr15_+_44084040 | 2.07 |
ENST00000249786.4 |
SERF2 |
small EDRK-rich factor 2 |
| chr16_-_4897266 | 2.06 |
ENST00000591451.1 ENST00000436648.5 ENST00000381983.3 ENST00000588297.1 ENST00000321919.9 |
GLYR1 |
glyoxylate reductase 1 homolog (Arabidopsis) |
| chr6_-_33385902 | 2.03 |
ENST00000374500.5 |
CUTA |
cutA divalent cation tolerance homolog (E. coli) |
| chrX_+_30671476 | 1.98 |
ENST00000378946.3 ENST00000378943.3 ENST00000378945.3 ENST00000427190.1 ENST00000378941.3 |
GK |
glycerol kinase |
| chr12_-_76953453 | 1.97 |
ENST00000549570.1 |
OSBPL8 |
oxysterol binding protein-like 8 |
| chr1_-_212873267 | 1.94 |
ENST00000243440.1 |
BATF3 |
basic leucine zipper transcription factor, ATF-like 3 |
| chr6_-_33385870 | 1.88 |
ENST00000488034.1 |
CUTA |
cutA divalent cation tolerance homolog (E. coli) |
| chr6_-_33385854 | 1.87 |
ENST00000488478.1 |
CUTA |
cutA divalent cation tolerance homolog (E. coli) |
| chr6_-_33385823 | 1.87 |
ENST00000494751.1 ENST00000374496.3 |
CUTA |
cutA divalent cation tolerance homolog (E. coli) |
| chr22_+_31003133 | 1.83 |
ENST00000405742.3 |
TCN2 |
transcobalamin II |
| chr12_-_91539918 | 1.77 |
ENST00000548218.1 |
DCN |
decorin |
| chr6_-_33385655 | 1.75 |
ENST00000440279.3 ENST00000607266.1 |
CUTA |
cutA divalent cation tolerance homolog (E. coli) |
| chr22_+_31002779 | 1.72 |
ENST00000215838.3 |
TCN2 |
transcobalamin II |
| chr15_+_44084503 | 1.64 |
ENST00000409960.2 ENST00000409646.1 ENST00000594896.1 ENST00000339624.5 ENST00000409291.1 ENST00000402131.1 ENST00000403425.1 ENST00000430901.1 |
SERF2 |
small EDRK-rich factor 2 |
| chr2_+_46926048 | 1.63 |
ENST00000306503.5 |
SOCS5 |
suppressor of cytokine signaling 5 |
| chr12_+_117176090 | 1.61 |
ENST00000257575.4 ENST00000407967.3 ENST00000392549.2 |
RNFT2 |
ring finger protein, transmembrane 2 |
| chr12_+_56110247 | 1.60 |
ENST00000551926.1 |
BLOC1S1 |
biogenesis of lysosomal organelles complex-1, subunit 1 |
| chrX_+_102883887 | 1.59 |
ENST00000372625.3 ENST00000372624.3 |
TCEAL1 |
transcription elongation factor A (SII)-like 1 |
| chrX_+_55744166 | 1.58 |
ENST00000374941.4 ENST00000414239.1 |
RRAGB |
Ras-related GTP binding B |
| chr12_+_56109926 | 1.56 |
ENST00000547076.1 |
BLOC1S1 |
biogenesis of lysosomal organelles complex-1, subunit 1 |
| chr19_-_48018203 | 1.51 |
ENST00000595227.1 ENST00000593761.1 ENST00000263354.3 |
NAPA |
N-ethylmaleimide-sensitive factor attachment protein, alpha |
| chr22_+_31003190 | 1.50 |
ENST00000407817.3 |
TCN2 |
transcobalamin II |
| chr14_-_74551096 | 1.50 |
ENST00000350259.4 |
ALDH6A1 |
aldehyde dehydrogenase 6 family, member A1 |
| chr6_+_160390102 | 1.48 |
ENST00000356956.1 |
IGF2R |
insulin-like growth factor 2 receptor |
| chrX_+_102883620 | 1.47 |
ENST00000372626.3 |
TCEAL1 |
transcription elongation factor A (SII)-like 1 |
| chr14_-_20929624 | 1.46 |
ENST00000398020.4 ENST00000250489.4 |
TMEM55B |
transmembrane protein 55B |
| chr5_-_121413974 | 1.44 |
ENST00000231004.4 |
LOX |
lysyl oxidase |
| chr5_+_133706865 | 1.40 |
ENST00000265339.2 |
UBE2B |
ubiquitin-conjugating enzyme E2B |
| chrX_+_55744228 | 1.39 |
ENST00000262850.7 |
RRAGB |
Ras-related GTP binding B |
| chr2_+_109204743 | 1.36 |
ENST00000332345.6 |
LIMS1 |
LIM and senescent cell antigen-like domains 1 |
| chr2_+_46926326 | 1.33 |
ENST00000394861.2 |
SOCS5 |
suppressor of cytokine signaling 5 |
| chr13_+_113951607 | 1.31 |
ENST00000397181.3 |
LAMP1 |
lysosomal-associated membrane protein 1 |
| chr5_+_172483347 | 1.31 |
ENST00000522692.1 ENST00000296953.2 ENST00000540014.1 ENST00000520420.1 |
CREBRF |
CREB3 regulatory factor |
| chr5_-_132299290 | 1.29 |
ENST00000378595.3 |
AFF4 |
AF4/FMR2 family, member 4 |
| chr6_+_151646800 | 1.26 |
ENST00000354675.6 |
AKAP12 |
A kinase (PRKA) anchor protein 12 |
| chr7_+_99070527 | 1.25 |
ENST00000379724.3 |
ZNF789 |
zinc finger protein 789 |
| chrX_-_34675391 | 1.25 |
ENST00000275954.3 |
TMEM47 |
transmembrane protein 47 |
| chrX_-_106960285 | 1.25 |
ENST00000503515.1 ENST00000372397.2 |
TSC22D3 |
TSC22 domain family, member 3 |
| chr12_+_117176113 | 1.23 |
ENST00000319176.7 |
RNFT2 |
ring finger protein, transmembrane 2 |
| chr22_-_20850128 | 1.22 |
ENST00000328879.4 |
KLHL22 |
kelch-like family member 22 |
| chr17_-_7137582 | 1.22 |
ENST00000575756.1 ENST00000575458.1 |
DVL2 |
dishevelled segment polarity protein 2 |
| chr1_-_31845914 | 1.21 |
ENST00000373713.2 |
FABP3 |
fatty acid binding protein 3, muscle and heart (mammary-derived growth inhibitor) |
| chr5_+_173315283 | 1.20 |
ENST00000265085.5 |
CPEB4 |
cytoplasmic polyadenylation element binding protein 4 |
| chr22_-_36902522 | 1.18 |
ENST00000397223.4 |
FOXRED2 |
FAD-dependent oxidoreductase domain containing 2 |
| chr8_-_120685608 | 1.17 |
ENST00000427067.2 |
ENPP2 |
ectonucleotide pyrophosphatase/phosphodiesterase 2 |
| chr6_-_88875654 | 1.17 |
ENST00000535130.1 |
CNR1 |
cannabinoid receptor 1 (brain) |
| chr5_-_176730676 | 1.11 |
ENST00000393611.2 ENST00000303251.6 ENST00000303270.6 |
RAB24 |
RAB24, member RAS oncogene family |
| chr6_-_88876058 | 1.11 |
ENST00000369501.2 |
CNR1 |
cannabinoid receptor 1 (brain) |
| chr20_-_2821271 | 1.08 |
ENST00000448755.1 ENST00000360652.2 |
PCED1A |
PC-esterase domain containing 1A |
| chr4_-_100242549 | 1.07 |
ENST00000305046.8 ENST00000394887.3 |
ADH1B |
alcohol dehydrogenase 1B (class I), beta polypeptide |
| chr12_-_76953513 | 1.07 |
ENST00000547540.1 |
OSBPL8 |
oxysterol binding protein-like 8 |
| chr7_-_27196267 | 1.06 |
ENST00000242159.3 |
HOXA7 |
homeobox A7 |
| chr14_-_74551172 | 1.06 |
ENST00000553458.1 |
ALDH6A1 |
aldehyde dehydrogenase 6 family, member A1 |
| chr14_-_20923195 | 1.05 |
ENST00000206542.4 |
OSGEP |
O-sialoglycoprotein endopeptidase |
| chr1_-_26232951 | 1.04 |
ENST00000426559.2 ENST00000455785.2 |
STMN1 |
stathmin 1 |
| chr10_-_14050522 | 1.02 |
ENST00000342409.2 |
FRMD4A |
FERM domain containing 4A |
| chr1_+_145611010 | 1.01 |
ENST00000369291.5 |
RNF115 |
ring finger protein 115 |
| chr12_-_65153175 | 1.00 |
ENST00000543646.1 ENST00000542058.1 ENST00000258145.3 |
GNS |
glucosamine (N-acetyl)-6-sulfatase |
| chr22_+_35695793 | 1.00 |
ENST00000456128.1 ENST00000449058.2 ENST00000411850.1 ENST00000425375.1 ENST00000436462.2 ENST00000382034.5 |
TOM1 |
target of myb1 (chicken) |
| chr16_+_85061367 | 0.97 |
ENST00000538274.1 ENST00000258180.3 |
KIAA0513 |
KIAA0513 |
| chr5_-_133706695 | 0.95 |
ENST00000521755.1 ENST00000523054.1 ENST00000435240.2 ENST00000609654.1 ENST00000536186.1 ENST00000609383.1 |
CDKL3 |
cyclin-dependent kinase-like 3 |
| chr14_+_24630465 | 0.94 |
ENST00000557894.1 ENST00000559284.1 ENST00000560275.1 |
IRF9 |
interferon regulatory factor 9 |
| chr3_+_12329358 | 0.93 |
ENST00000309576.6 |
PPARG |
peroxisome proliferator-activated receptor gamma |
| chr14_-_65569057 | 0.93 |
ENST00000555419.1 ENST00000341653.2 |
MAX |
MYC associated factor X |
| chr13_+_49684445 | 0.92 |
ENST00000398316.3 |
FNDC3A |
fibronectin type III domain containing 3A |
| chr17_+_47075023 | 0.91 |
ENST00000431824.2 |
IGF2BP1 |
insulin-like growth factor 2 mRNA binding protein 1 |
| chr12_-_110434183 | 0.90 |
ENST00000360185.4 ENST00000354574.4 ENST00000338373.5 ENST00000343646.5 ENST00000356259.4 ENST00000553118.1 |
GIT2 |
G protein-coupled receptor kinase interacting ArfGAP 2 |
| chr17_-_7137857 | 0.89 |
ENST00000005340.5 |
DVL2 |
dishevelled segment polarity protein 2 |
| chr2_-_175499294 | 0.89 |
ENST00000392547.2 |
WIPF1 |
WAS/WASL interacting protein family, member 1 |
| chrX_+_77166172 | 0.89 |
ENST00000343533.5 ENST00000350425.4 ENST00000341514.6 |
ATP7A |
ATPase, Cu++ transporting, alpha polypeptide |
| chr12_+_51632638 | 0.89 |
ENST00000549732.2 |
DAZAP2 |
DAZ associated protein 2 |
| chr12_+_51633061 | 0.89 |
ENST00000551313.1 |
DAZAP2 |
DAZ associated protein 2 |
| chr2_-_211036051 | 0.89 |
ENST00000418791.1 ENST00000452086.1 ENST00000281772.9 |
KANSL1L |
KAT8 regulatory NSL complex subunit 1-like |
| chr15_-_50978965 | 0.88 |
ENST00000560955.1 ENST00000313478.7 |
TRPM7 |
transient receptor potential cation channel, subfamily M, member 7 |
| chr5_-_150138551 | 0.88 |
ENST00000446090.2 ENST00000447998.2 |
DCTN4 |
dynactin 4 (p62) |
| chr20_-_2821756 | 0.88 |
ENST00000356872.3 ENST00000439542.1 |
PCED1A |
PC-esterase domain containing 1A |
| chr6_+_127588020 | 0.88 |
ENST00000309649.3 ENST00000610162.1 ENST00000610153.1 ENST00000608991.1 ENST00000480444.1 |
RNF146 |
ring finger protein 146 |
| chr1_-_155211017 | 0.88 |
ENST00000536770.1 ENST00000368373.3 |
GBA |
glucosidase, beta, acid |
| chr8_-_95908902 | 0.88 |
ENST00000520509.1 |
CCNE2 |
cyclin E2 |
| chr17_+_47074758 | 0.87 |
ENST00000290341.3 |
IGF2BP1 |
insulin-like growth factor 2 mRNA binding protein 1 |
| chr12_+_54332535 | 0.87 |
ENST00000243056.3 |
HOXC13 |
homeobox C13 |
| chr21_+_38445539 | 0.87 |
ENST00000418766.1 ENST00000450533.1 ENST00000438055.1 ENST00000355666.1 ENST00000540756.1 ENST00000399010.1 |
TTC3 |
tetratricopeptide repeat domain 3 |
| chr15_-_83316087 | 0.86 |
ENST00000568757.1 |
CPEB1 |
cytoplasmic polyadenylation element binding protein 1 |
| chr6_-_84937314 | 0.86 |
ENST00000257766.4 ENST00000403245.3 |
KIAA1009 |
KIAA1009 |
| chr2_+_27805880 | 0.85 |
ENST00000379717.1 ENST00000355467.4 ENST00000556601.1 ENST00000416005.2 |
ZNF512 |
zinc finger protein 512 |
| chr20_+_44519948 | 0.85 |
ENST00000354880.5 ENST00000191018.5 |
CTSA |
cathepsin A |
| chr11_+_65479702 | 0.85 |
ENST00000530446.1 ENST00000534104.1 ENST00000530605.1 ENST00000528198.1 ENST00000531880.1 ENST00000534650.1 |
KAT5 |
K(lysine) acetyltransferase 5 |
| chrX_+_102862834 | 0.85 |
ENST00000372627.5 ENST00000243286.3 |
TCEAL3 |
transcription elongation factor A (SII)-like 3 |
| chrX_-_100872911 | 0.84 |
ENST00000361910.4 ENST00000539247.1 ENST00000538627.1 |
ARMCX6 |
armadillo repeat containing, X-linked 6 |
| chr9_+_120466610 | 0.84 |
ENST00000394487.4 |
TLR4 |
toll-like receptor 4 |
| chr6_+_127587755 | 0.83 |
ENST00000368314.1 ENST00000476956.1 ENST00000609447.1 ENST00000356799.2 ENST00000477776.1 ENST00000609944.1 |
RNF146 |
ring finger protein 146 |
| chr5_+_149340282 | 0.83 |
ENST00000286298.4 |
SLC26A2 |
solute carrier family 26 (anion exchanger), member 2 |
| chr5_-_131132614 | 0.82 |
ENST00000307968.7 ENST00000307954.8 |
FNIP1 |
folliculin interacting protein 1 |
| chr5_-_132299313 | 0.82 |
ENST00000265343.5 |
AFF4 |
AF4/FMR2 family, member 4 |
| chr16_-_15736953 | 0.82 |
ENST00000548025.1 ENST00000551742.1 ENST00000602337.1 ENST00000344181.3 ENST00000396368.3 |
KIAA0430 |
KIAA0430 |
| chr16_-_67185117 | 0.81 |
ENST00000449549.3 |
B3GNT9 |
UDP-GlcNAc:betaGal beta-1,3-N-acetylglucosaminyltransferase 9 |
| chr1_-_155211065 | 0.81 |
ENST00000427500.3 |
GBA |
glucosidase, beta, acid |
| chr7_+_100464760 | 0.81 |
ENST00000200457.4 |
TRIP6 |
thyroid hormone receptor interactor 6 |
| chrX_+_102631248 | 0.79 |
ENST00000361298.4 ENST00000372645.3 ENST00000372635.1 |
NGFRAP1 |
nerve growth factor receptor (TNFRSF16) associated protein 1 |
| chr14_-_54955721 | 0.79 |
ENST00000554908.1 |
GMFB |
glia maturation factor, beta |
| chr19_-_5340730 | 0.79 |
ENST00000372412.4 ENST00000357368.4 ENST00000262963.6 ENST00000348075.2 ENST00000353284.2 |
PTPRS |
protein tyrosine phosphatase, receptor type, S |
| chr20_-_45985464 | 0.78 |
ENST00000458360.2 ENST00000262975.4 |
ZMYND8 |
zinc finger, MYND-type containing 8 |
| chr20_-_45985414 | 0.78 |
ENST00000461685.1 ENST00000372023.3 ENST00000540497.1 ENST00000435836.1 ENST00000471951.2 ENST00000352431.2 ENST00000396281.4 ENST00000355972.4 ENST00000360911.3 |
ZMYND8 |
zinc finger, MYND-type containing 8 |
| chr11_+_65479462 | 0.78 |
ENST00000377046.3 ENST00000352980.4 ENST00000341318.4 |
KAT5 |
K(lysine) acetyltransferase 5 |
| chrX_+_102631844 | 0.77 |
ENST00000372634.1 ENST00000299872.7 |
NGFRAP1 |
nerve growth factor receptor (TNFRSF16) associated protein 1 |
| chrX_-_102510126 | 0.77 |
ENST00000372685.3 |
TCEAL8 |
transcription elongation factor A (SII)-like 8 |
| chr12_-_90102594 | 0.77 |
ENST00000428670.3 |
ATP2B1 |
ATPase, Ca++ transporting, plasma membrane 1 |
| chr2_+_33172012 | 0.77 |
ENST00000404816.2 |
LTBP1 |
latent transforming growth factor beta binding protein 1 |
| chr19_+_39903185 | 0.76 |
ENST00000409794.3 |
PLEKHG2 |
pleckstrin homology domain containing, family G (with RhoGef domain) member 2 |
| chr9_+_120466650 | 0.76 |
ENST00000355622.6 |
TLR4 |
toll-like receptor 4 |
| chr12_-_110434021 | 0.76 |
ENST00000355312.3 ENST00000551209.1 ENST00000550186.1 |
GIT2 |
G protein-coupled receptor kinase interacting ArfGAP 2 |
| chr20_-_45985172 | 0.76 |
ENST00000536340.1 |
ZMYND8 |
zinc finger, MYND-type containing 8 |
| chrX_-_102510045 | 0.75 |
ENST00000360000.4 |
TCEAL8 |
transcription elongation factor A (SII)-like 8 |
| chr3_+_148847371 | 0.75 |
ENST00000296051.2 ENST00000460120.1 |
HPS3 |
Hermansky-Pudlak syndrome 3 |
| chr2_+_33172221 | 0.74 |
ENST00000354476.3 |
LTBP1 |
latent transforming growth factor beta binding protein 1 |
| chr3_-_112280709 | 0.74 |
ENST00000402314.2 ENST00000283290.5 ENST00000492886.1 |
ATG3 |
autophagy related 3 |
| chrX_+_102840408 | 0.74 |
ENST00000468024.1 ENST00000472484.1 ENST00000415568.2 ENST00000490644.1 ENST00000459722.1 ENST00000472745.1 ENST00000494801.1 ENST00000434216.2 ENST00000425011.1 |
TCEAL4 |
transcription elongation factor A (SII)-like 4 |
| chr6_-_36953833 | 0.73 |
ENST00000538808.1 ENST00000460219.1 ENST00000373616.5 ENST00000373627.5 |
MTCH1 |
mitochondrial carrier 1 |
| chr3_+_5020801 | 0.73 |
ENST00000256495.3 |
BHLHE40 |
basic helix-loop-helix family, member e40 |
| chr11_-_57283159 | 0.73 |
ENST00000533263.1 ENST00000278426.3 |
SLC43A1 |
solute carrier family 43 (amino acid system L transporter), member 1 |
| chr5_+_156712372 | 0.73 |
ENST00000541131.1 |
CYFIP2 |
cytoplasmic FMR1 interacting protein 2 |
| chr17_-_66453562 | 0.72 |
ENST00000262139.5 ENST00000546360.1 |
WIPI1 |
WD repeat domain, phosphoinositide interacting 1 |
| chr3_+_51976338 | 0.72 |
ENST00000417220.2 ENST00000431474.1 ENST00000398755.3 |
PARP3 |
poly (ADP-ribose) polymerase family, member 3 |
| chr7_+_149571045 | 0.72 |
ENST00000479613.1 ENST00000606024.1 ENST00000464662.1 ENST00000425642.2 |
ATP6V0E2 |
ATPase, H+ transporting V0 subunit e2 |
| chr12_+_113796347 | 0.72 |
ENST00000545182.2 ENST00000280800.3 |
PLBD2 |
phospholipase B domain containing 2 |
| chrX_+_118108601 | 0.71 |
ENST00000371628.3 |
LONRF3 |
LON peptidase N-terminal domain and ring finger 3 |
| chr7_+_150065879 | 0.71 |
ENST00000397281.2 ENST00000444957.1 ENST00000466559.1 ENST00000489432.2 ENST00000475514.1 ENST00000482680.1 ENST00000488943.1 ENST00000518514.1 ENST00000478789.1 |
REPIN1 ZNF775 |
replication initiator 1 zinc finger protein 775 |
| chr1_-_26233423 | 0.71 |
ENST00000357865.2 |
STMN1 |
stathmin 1 |
| chr1_-_26232522 | 0.71 |
ENST00000399728.1 |
STMN1 |
stathmin 1 |
| chr7_-_2354099 | 0.70 |
ENST00000222990.3 |
SNX8 |
sorting nexin 8 |
| chr20_+_37590942 | 0.70 |
ENST00000373325.2 ENST00000252011.3 ENST00000373323.4 |
DHX35 |
DEAH (Asp-Glu-Ala-His) box polypeptide 35 |
| chr1_-_202896310 | 0.70 |
ENST00000367261.3 |
KLHL12 |
kelch-like family member 12 |
| chr1_+_52521957 | 0.69 |
ENST00000472944.2 ENST00000484036.1 |
BTF3L4 |
basic transcription factor 3-like 4 |
| chr9_-_19127474 | 0.69 |
ENST00000380465.3 ENST00000380464.3 ENST00000411567.1 ENST00000276914.2 |
PLIN2 |
perilipin 2 |
| chr5_+_126112794 | 0.69 |
ENST00000261366.5 ENST00000395354.1 |
LMNB1 |
lamin B1 |
| chr12_-_76953573 | 0.69 |
ENST00000549646.1 ENST00000550628.1 ENST00000553139.1 ENST00000261183.3 ENST00000393250.4 |
OSBPL8 |
oxysterol binding protein-like 8 |
| chr5_-_150537279 | 0.68 |
ENST00000517486.1 ENST00000377751.5 ENST00000356496.5 ENST00000521512.1 ENST00000517757.1 ENST00000354546.5 |
ANXA6 |
annexin A6 |
| chrX_+_118108571 | 0.68 |
ENST00000304778.7 |
LONRF3 |
LON peptidase N-terminal domain and ring finger 3 |
| chr11_-_58611957 | 0.68 |
ENST00000532258.1 |
GLYATL2 |
glycine-N-acyltransferase-like 2 |
| chr17_+_65821636 | 0.67 |
ENST00000544778.2 |
BPTF |
bromodomain PHD finger transcription factor |
| chr17_+_57408994 | 0.67 |
ENST00000312655.4 |
YPEL2 |
yippee-like 2 (Drosophila) |
| chr6_+_160221293 | 0.67 |
ENST00000610273.1 ENST00000392167.3 |
PNLDC1 |
poly(A)-specific ribonuclease (PARN)-like domain containing 1 |
| chr2_+_109204909 | 0.67 |
ENST00000393310.1 |
LIMS1 |
LIM and senescent cell antigen-like domains 1 |
| chr8_-_95961578 | 0.67 |
ENST00000448464.2 ENST00000342697.4 |
TP53INP1 |
tumor protein p53 inducible nuclear protein 1 |
| chr14_+_96505659 | 0.67 |
ENST00000555004.1 |
C14orf132 |
chromosome 14 open reading frame 132 |
| chr19_-_12833361 | 0.66 |
ENST00000592287.1 |
TNPO2 |
transportin 2 |
| chr20_+_44520009 | 0.66 |
ENST00000607482.1 ENST00000372459.2 |
CTSA |
cathepsin A |
| chrX_+_100878079 | 0.66 |
ENST00000471229.2 |
ARMCX3 |
armadillo repeat containing, X-linked 3 |
| chr1_+_52521797 | 0.66 |
ENST00000313334.8 |
BTF3L4 |
basic transcription factor 3-like 4 |
| chr15_-_83316254 | 0.66 |
ENST00000567678.1 ENST00000450751.2 |
CPEB1 |
cytoplasmic polyadenylation element binding protein 1 |
| chr11_+_126081662 | 0.65 |
ENST00000528985.1 ENST00000529731.1 ENST00000360194.4 ENST00000530043.1 |
FAM118B |
family with sequence similarity 118, member B |
| chr12_+_50355647 | 0.65 |
ENST00000293599.6 |
AQP5 |
aquaporin 5 |
| chr12_-_56122761 | 0.65 |
ENST00000552164.1 ENST00000420846.3 ENST00000257857.4 |
CD63 |
CD63 molecule |
| chr14_-_65569244 | 0.65 |
ENST00000557277.1 ENST00000556892.1 |
MAX |
MYC associated factor X |
| chr15_-_40213080 | 0.65 |
ENST00000561100.1 |
GPR176 |
G protein-coupled receptor 176 |
| chr11_+_64781575 | 0.64 |
ENST00000246747.4 ENST00000529384.1 |
ARL2 |
ADP-ribosylation factor-like 2 |
| chr3_+_44903361 | 0.64 |
ENST00000302392.4 |
TMEM42 |
transmembrane protein 42 |
| chr7_-_23510086 | 0.64 |
ENST00000258729.3 |
IGF2BP3 |
insulin-like growth factor 2 mRNA binding protein 3 |
| chr2_-_158300556 | 0.63 |
ENST00000264192.3 |
CYTIP |
cytohesin 1 interacting protein |
| chr20_-_30458019 | 0.62 |
ENST00000486996.1 ENST00000398084.2 |
DUSP15 |
dual specificity phosphatase 15 |
| chr2_-_227664474 | 0.62 |
ENST00000305123.5 |
IRS1 |
insulin receptor substrate 1 |
| chr17_-_21156578 | 0.62 |
ENST00000399011.2 ENST00000468196.1 |
C17orf103 |
chromosome 17 open reading frame 103 |
| chr1_-_51425902 | 0.62 |
ENST00000396153.2 |
FAF1 |
Fas (TNFRSF6) associated factor 1 |
| chr18_-_70535177 | 0.62 |
ENST00000327305.6 |
NETO1 |
neuropilin (NRP) and tolloid (TLL)-like 1 |
| chr6_+_87865262 | 0.62 |
ENST00000369577.3 ENST00000518845.1 ENST00000339907.4 ENST00000496806.2 |
ZNF292 |
zinc finger protein 292 |
| chrX_+_10124977 | 0.62 |
ENST00000380833.4 |
CLCN4 |
chloride channel, voltage-sensitive 4 |
| chr22_-_50700140 | 0.62 |
ENST00000215659.8 |
MAPK12 |
mitogen-activated protein kinase 12 |
| chr5_-_159797627 | 0.61 |
ENST00000393975.3 |
C1QTNF2 |
C1q and tumor necrosis factor related protein 2 |
| chr7_-_27183263 | 0.61 |
ENST00000222726.3 |
HOXA5 |
homeobox A5 |
| chr2_+_27309605 | 0.61 |
ENST00000260599.6 ENST00000260598.5 ENST00000429697.1 |
KHK |
ketohexokinase (fructokinase) |
| chr11_-_85779971 | 0.60 |
ENST00000393346.3 |
PICALM |
phosphatidylinositol binding clathrin assembly protein |
| chr12_+_51632600 | 0.60 |
ENST00000549555.1 ENST00000439799.2 ENST00000425012.2 |
DAZAP2 |
DAZ associated protein 2 |
| chr16_+_4897632 | 0.60 |
ENST00000262376.6 |
UBN1 |
ubinuclein 1 |
| chr9_+_92219919 | 0.60 |
ENST00000252506.6 ENST00000375769.1 |
GADD45G |
growth arrest and DNA-damage-inducible, gamma |
| chr12_+_104359641 | 0.60 |
ENST00000537100.1 |
TDG |
thymine-DNA glycosylase |
| chr6_+_151561085 | 0.60 |
ENST00000402676.2 |
AKAP12 |
A kinase (PRKA) anchor protein 12 |
| chr17_+_1627834 | 0.60 |
ENST00000419248.1 ENST00000418841.1 |
WDR81 |
WD repeat domain 81 |
Gene Ontology Analysis
Gene overrepresentation in biological_process category:
| Log-likelihood per target | Total log-likelihood | Term | Description |
|---|---|---|---|
| 1.2 | 4.8 | GO:0002904 | positive regulation of B cell apoptotic process(GO:0002904) |
| 1.0 | 5.9 | GO:0045629 | negative regulation of T-helper 2 cell differentiation(GO:0045629) |
| 0.9 | 2.7 | GO:1900158 | negative regulation of bone mineralization involved in bone maturation(GO:1900158) |
| 0.8 | 2.3 | GO:0006788 | heme oxidation(GO:0006788) smooth muscle hyperplasia(GO:0014806) negative regulation of mast cell cytokine production(GO:0032764) |
| 0.7 | 2.2 | GO:0046167 | glycerol-3-phosphate biosynthetic process(GO:0046167) |
| 0.6 | 2.6 | GO:0006210 | pyrimidine nucleobase catabolic process(GO:0006208) thymine catabolic process(GO:0006210) thymine metabolic process(GO:0019859) |
| 0.6 | 1.7 | GO:0010845 | positive regulation of reciprocal meiotic recombination(GO:0010845) |
| 0.6 | 2.3 | GO:0099553 | trans-synaptic signaling by lipid, modulating synaptic transmission(GO:0099552) trans-synaptic signaling by endocannabinoid, modulating synaptic transmission(GO:0099553) |
| 0.5 | 1.6 | GO:0032707 | negative regulation of interleukin-23 production(GO:0032707) |
| 0.5 | 2.1 | GO:0022007 | neural plate elongation(GO:0014022) convergent extension involved in neural plate elongation(GO:0022007) |
| 0.5 | 5.2 | GO:0015889 | cobalamin transport(GO:0015889) |
| 0.5 | 1.5 | GO:0035494 | SNARE complex disassembly(GO:0035494) |
| 0.5 | 2.5 | GO:1905098 | negative regulation of guanyl-nucleotide exchange factor activity(GO:1905098) |
| 0.5 | 6.2 | GO:0060155 | platelet dense granule organization(GO:0060155) |
| 0.5 | 1.8 | GO:0043323 | regulation of natural killer cell degranulation(GO:0043321) positive regulation of natural killer cell degranulation(GO:0043323) |
| 0.4 | 1.3 | GO:1900169 | regulation of glucocorticoid mediated signaling pathway(GO:1900169) |
| 0.4 | 2.5 | GO:1903758 | regulation of transcription from RNA polymerase II promoter by histone modification(GO:1903756) negative regulation of transcription from RNA polymerase II promoter by histone modification(GO:1903758) |
| 0.4 | 1.7 | GO:1901804 | beta-glucoside metabolic process(GO:1901804) beta-glucoside catabolic process(GO:1901805) positive regulation of neuronal action potential(GO:1904457) |
| 0.4 | 1.2 | GO:2001245 | regulation of phosphatidylcholine biosynthetic process(GO:2001245) |
| 0.4 | 2.4 | GO:0035407 | histone H3-T11 phosphorylation(GO:0035407) |
| 0.4 | 5.5 | GO:0010891 | negative regulation of sequestering of triglyceride(GO:0010891) |
| 0.4 | 2.3 | GO:0060399 | positive regulation of growth hormone receptor signaling pathway(GO:0060399) |
| 0.4 | 1.1 | GO:1900073 | regulation of neuromuscular synaptic transmission(GO:1900073) positive regulation of neuromuscular synaptic transmission(GO:1900075) |
| 0.3 | 2.1 | GO:0097498 | endothelial tube lumen extension(GO:0097498) |
| 0.3 | 1.0 | GO:0002949 | tRNA threonylcarbamoyladenosine modification(GO:0002949) |
| 0.3 | 2.9 | GO:1990253 | cellular response to leucine starvation(GO:1990253) |
| 0.3 | 0.9 | GO:0071284 | cellular response to lead ion(GO:0071284) |
| 0.3 | 0.9 | GO:0016340 | calcium-dependent cell-matrix adhesion(GO:0016340) |
| 0.3 | 1.1 | GO:1902544 | regulation of DNA N-glycosylase activity(GO:1902544) |
| 0.3 | 0.5 | GO:0051097 | negative regulation of helicase activity(GO:0051097) |
| 0.3 | 0.8 | GO:0036353 | histone H2A-K119 monoubiquitination(GO:0036353) |
| 0.2 | 0.7 | GO:0048203 | vesicle targeting, trans-Golgi to endosome(GO:0048203) |
| 0.2 | 2.0 | GO:0070934 | CRD-mediated mRNA stabilization(GO:0070934) |
| 0.2 | 0.7 | GO:0036446 | myofibroblast differentiation(GO:0036446) regulation of myofibroblast differentiation(GO:1904760) |
| 0.2 | 2.4 | GO:0042908 | xenobiotic transport(GO:0042908) |
| 0.2 | 1.0 | GO:0006740 | NADPH regeneration(GO:0006740) |
| 0.2 | 0.6 | GO:0060435 | bronchiole development(GO:0060435) |
| 0.2 | 1.0 | GO:2000312 | regulation of kainate selective glutamate receptor activity(GO:2000312) |
| 0.2 | 0.6 | GO:0000415 | negative regulation of histone H3-K36 methylation(GO:0000415) |
| 0.2 | 0.6 | GO:0035284 | rhombomere 3 development(GO:0021569) central nervous system segmentation(GO:0035283) brain segmentation(GO:0035284) |
| 0.2 | 0.8 | GO:0032687 | negative regulation of interferon-alpha production(GO:0032687) |
| 0.2 | 2.7 | GO:1900119 | positive regulation of execution phase of apoptosis(GO:1900119) |
| 0.2 | 0.5 | GO:0006286 | base-excision repair, base-free sugar-phosphate removal(GO:0006286) |
| 0.2 | 0.8 | GO:0009609 | response to symbiont(GO:0009608) response to symbiotic bacterium(GO:0009609) |
| 0.2 | 0.2 | GO:0035359 | negative regulation of peroxisome proliferator activated receptor signaling pathway(GO:0035359) |
| 0.2 | 1.1 | GO:0098535 | de novo centriole assembly(GO:0098535) |
| 0.2 | 0.8 | GO:0008588 | release of cytoplasmic sequestered NF-kappaB(GO:0008588) |
| 0.2 | 2.2 | GO:2000766 | negative regulation of cytoplasmic translation(GO:2000766) |
| 0.2 | 0.5 | GO:0043311 | positive regulation of eosinophil degranulation(GO:0043311) positive regulation of eosinophil activation(GO:1902568) |
| 0.2 | 2.6 | GO:0071850 | mitotic cell cycle arrest(GO:0071850) |
| 0.2 | 0.6 | GO:0061624 | fructose catabolic process(GO:0006001) fructose catabolic process to hydroxyacetone phosphate and glyceraldehyde-3-phosphate(GO:0061624) |
| 0.2 | 1.5 | GO:0035583 | sequestering of TGFbeta in extracellular matrix(GO:0035583) |
| 0.1 | 0.6 | GO:0060729 | intestinal epithelial structure maintenance(GO:0060729) |
| 0.1 | 2.3 | GO:0046185 | aldehyde catabolic process(GO:0046185) |
| 0.1 | 0.7 | GO:0051610 | negative regulation of neurotransmitter uptake(GO:0051581) serotonin uptake(GO:0051610) regulation of serotonin uptake(GO:0051611) negative regulation of serotonin uptake(GO:0051612) |
| 0.1 | 1.3 | GO:1904715 | negative regulation of chaperone-mediated autophagy(GO:1904715) |
| 0.1 | 1.2 | GO:0070236 | negative regulation of activation-induced cell death of T cells(GO:0070236) |
| 0.1 | 0.9 | GO:0070936 | protein K48-linked ubiquitination(GO:0070936) |
| 0.1 | 0.4 | GO:1903031 | regulation of microtubule plus-end binding(GO:1903031) positive regulation of microtubule plus-end binding(GO:1903033) |
| 0.1 | 0.4 | GO:0035606 | peptidyl-cysteine S-trans-nitrosylation(GO:0035606) |
| 0.1 | 0.4 | GO:1904482 | response to tetrahydrofolate(GO:1904481) cellular response to tetrahydrofolate(GO:1904482) |
| 0.1 | 1.8 | GO:0010739 | positive regulation of protein kinase A signaling(GO:0010739) |
| 0.1 | 1.4 | GO:0048251 | elastic fiber assembly(GO:0048251) |
| 0.1 | 1.8 | GO:1900747 | negative regulation of vascular endothelial growth factor signaling pathway(GO:1900747) |
| 0.1 | 0.1 | GO:0014740 | negative regulation of muscle hyperplasia(GO:0014740) |
| 0.1 | 0.4 | GO:0060574 | intestinal epithelial cell maturation(GO:0060574) |
| 0.1 | 1.4 | GO:0046321 | positive regulation of fatty acid oxidation(GO:0046321) |
| 0.1 | 0.8 | GO:0034316 | negative regulation of Arp2/3 complex-mediated actin nucleation(GO:0034316) |
| 0.1 | 0.3 | GO:1902724 | positive regulation of skeletal muscle satellite cell proliferation(GO:1902724) positive regulation of growth factor dependent skeletal muscle satellite cell proliferation(GO:1902728) |
| 0.1 | 0.5 | GO:0060800 | regulation of cell differentiation involved in embryonic placenta development(GO:0060800) |
| 0.1 | 1.0 | GO:0061470 | T follicular helper cell differentiation(GO:0061470) |
| 0.1 | 0.4 | GO:0051491 | positive regulation of filopodium assembly(GO:0051491) |
| 0.1 | 0.6 | GO:0044339 | canonical Wnt signaling pathway involved in osteoblast differentiation(GO:0044339) |
| 0.1 | 0.8 | GO:0036444 | calcium ion transmembrane import into mitochondrion(GO:0036444) |
| 0.1 | 0.2 | GO:1900126 | negative regulation of hyaluronan biosynthetic process(GO:1900126) |
| 0.1 | 0.4 | GO:0046726 | positive regulation by virus of viral protein levels in host cell(GO:0046726) |
| 0.1 | 0.5 | GO:0015670 | carbon dioxide transport(GO:0015670) |
| 0.1 | 0.5 | GO:1904636 | response to ionomycin(GO:1904636) cellular response to ionomycin(GO:1904637) |
| 0.1 | 0.8 | GO:1990034 | cellular response to corticosterone stimulus(GO:0071386) calcium ion export from cell(GO:1990034) |
| 0.1 | 0.6 | GO:0036111 | very long-chain fatty-acyl-CoA metabolic process(GO:0036111) |
| 0.1 | 0.3 | GO:0090149 | mitochondrial membrane fission(GO:0090149) |
| 0.1 | 0.1 | GO:0045347 | regulation of MHC class II biosynthetic process(GO:0045346) negative regulation of MHC class II biosynthetic process(GO:0045347) |
| 0.1 | 1.2 | GO:2000680 | rubidium ion transport(GO:0035826) regulation of rubidium ion transport(GO:2000680) |
| 0.1 | 0.4 | GO:0070318 | positive regulation of G0 to G1 transition(GO:0070318) |
| 0.1 | 0.4 | GO:0005986 | sucrose biosynthetic process(GO:0005986) |
| 0.1 | 0.6 | GO:2000286 | receptor internalization involved in canonical Wnt signaling pathway(GO:2000286) |
| 0.1 | 0.7 | GO:1904885 | beta-catenin destruction complex assembly(GO:1904885) |
| 0.1 | 0.7 | GO:0051106 | positive regulation of DNA ligation(GO:0051106) |
| 0.1 | 1.0 | GO:0019532 | oxalate transport(GO:0019532) |
| 0.1 | 0.4 | GO:0010040 | response to iron(II) ion(GO:0010040) |
| 0.1 | 1.1 | GO:0045617 | negative regulation of keratinocyte differentiation(GO:0045617) |
| 0.1 | 0.1 | GO:0021539 | subthalamus development(GO:0021539) |
| 0.1 | 0.3 | GO:1903347 | negative regulation of bicellular tight junction assembly(GO:1903347) |
| 0.1 | 1.4 | GO:0034498 | early endosome to Golgi transport(GO:0034498) |
| 0.1 | 0.3 | GO:0060830 | ciliary receptor clustering involved in smoothened signaling pathway(GO:0060830) |
| 0.1 | 0.2 | GO:0090310 | negative regulation of methylation-dependent chromatin silencing(GO:0090310) |
| 0.1 | 0.3 | GO:0060265 | positive regulation of respiratory burst involved in inflammatory response(GO:0060265) |
| 0.1 | 0.2 | GO:0002384 | hepatic immune response(GO:0002384) |
| 0.1 | 0.3 | GO:1904379 | protein localization to cytosolic proteasome complex(GO:1904327) protein localization to cytosolic proteasome complex involved in ERAD pathway(GO:1904379) |
| 0.1 | 0.1 | GO:0019046 | release from viral latency(GO:0019046) |
| 0.1 | 0.3 | GO:0035752 | lysosomal lumen pH elevation(GO:0035752) |
| 0.1 | 1.1 | GO:0006069 | ethanol oxidation(GO:0006069) |
| 0.1 | 0.3 | GO:0010767 | regulation of transcription from RNA polymerase II promoter in response to UV-induced DNA damage(GO:0010767) |
| 0.1 | 0.2 | GO:0006290 | pyrimidine dimer repair(GO:0006290) |
| 0.1 | 1.0 | GO:0006975 | DNA damage induced protein phosphorylation(GO:0006975) |
| 0.1 | 1.2 | GO:0030043 | actin filament fragmentation(GO:0030043) |
| 0.1 | 0.9 | GO:0043653 | mitochondrial fragmentation involved in apoptotic process(GO:0043653) |
| 0.1 | 0.4 | GO:0060620 | regulation of cholesterol import(GO:0060620) regulation of sterol import(GO:2000909) |
| 0.1 | 0.5 | GO:0043932 | ossification involved in bone remodeling(GO:0043932) |
| 0.1 | 0.4 | GO:1902998 | macrophage proliferation(GO:0061517) microglial cell proliferation(GO:0061518) regulation of neuronal signal transduction(GO:1902847) positive regulation of neurofibrillary tangle assembly(GO:1902998) |
| 0.1 | 1.2 | GO:0034638 | phosphatidylcholine catabolic process(GO:0034638) |
| 0.1 | 0.8 | GO:0046324 | regulation of glucose import(GO:0046324) |
| 0.1 | 0.1 | GO:0031860 | telomeric 3' overhang formation(GO:0031860) |
| 0.1 | 0.1 | GO:0090427 | activation of meiosis(GO:0090427) |
| 0.1 | 0.1 | GO:1903553 | positive regulation of extracellular exosome assembly(GO:1903553) |
| 0.1 | 0.2 | GO:0019417 | sulfur oxidation(GO:0019417) |
| 0.1 | 1.9 | GO:0006978 | DNA damage response, signal transduction by p53 class mediator resulting in transcription of p21 class mediator(GO:0006978) |
| 0.1 | 0.5 | GO:0006620 | posttranslational protein targeting to membrane(GO:0006620) |
| 0.1 | 0.3 | GO:1903715 | regulation of aerobic respiration(GO:1903715) |
| 0.1 | 0.8 | GO:0043985 | histone H4-R3 methylation(GO:0043985) |
| 0.1 | 0.4 | GO:0060754 | positive regulation of mast cell chemotaxis(GO:0060754) |
| 0.1 | 0.7 | GO:0007253 | cytoplasmic sequestering of NF-kappaB(GO:0007253) |
| 0.1 | 0.1 | GO:0045948 | positive regulation of translational initiation(GO:0045948) |
| 0.1 | 0.2 | GO:0015684 | ferrous iron transport(GO:0015684) ferrous iron transmembrane transport(GO:1903874) |
| 0.1 | 0.3 | GO:0016240 | autophagosome docking(GO:0016240) |
| 0.1 | 1.2 | GO:0007021 | tubulin complex assembly(GO:0007021) |
| 0.1 | 1.1 | GO:0007097 | nuclear migration(GO:0007097) |
| 0.1 | 0.3 | GO:0061762 | CAMKK-AMPK signaling cascade(GO:0061762) |
| 0.1 | 0.8 | GO:0035542 | regulation of SNARE complex assembly(GO:0035542) |
| 0.1 | 0.6 | GO:1901525 | negative regulation of macromitophagy(GO:1901525) |
| 0.1 | 0.2 | GO:0036371 | protein localization to T-tubule(GO:0036371) |
| 0.1 | 1.0 | GO:0006451 | selenocysteine incorporation(GO:0001514) translational readthrough(GO:0006451) |
| 0.1 | 0.9 | GO:0035878 | nail development(GO:0035878) |
| 0.1 | 0.2 | GO:0002572 | pro-T cell differentiation(GO:0002572) |
| 0.1 | 2.2 | GO:0051894 | positive regulation of focal adhesion assembly(GO:0051894) |
| 0.1 | 0.4 | GO:0006651 | diacylglycerol biosynthetic process(GO:0006651) |
| 0.1 | 0.5 | GO:0022027 | interkinetic nuclear migration(GO:0022027) |
| 0.1 | 0.2 | GO:1904529 | regulation of actin filament binding(GO:1904529) negative regulation of actin filament binding(GO:1904530) regulation of actin binding(GO:1904616) negative regulation of actin binding(GO:1904617) |
| 0.1 | 0.2 | GO:0071409 | cellular response to cycloheximide(GO:0071409) |
| 0.1 | 0.2 | GO:0033364 | mast cell secretory granule organization(GO:0033364) |
| 0.1 | 0.9 | GO:0060009 | Sertoli cell development(GO:0060009) |
| 0.1 | 0.2 | GO:0021524 | visceral motor neuron differentiation(GO:0021524) |
| 0.1 | 0.2 | GO:0044314 | protein K27-linked ubiquitination(GO:0044314) |
| 0.1 | 0.3 | GO:0071500 | cellular response to nitrosative stress(GO:0071500) |
| 0.1 | 1.1 | GO:1900745 | positive regulation of p38MAPK cascade(GO:1900745) |
| 0.1 | 0.5 | GO:0051013 | microtubule severing(GO:0051013) |
| 0.1 | 0.2 | GO:1902949 | positive regulation of tau-protein kinase activity(GO:1902949) |
| 0.1 | 0.2 | GO:1902725 | negative regulation of satellite cell differentiation(GO:1902725) |
| 0.1 | 0.1 | GO:0045214 | sarcomere organization(GO:0045214) |
| 0.1 | 0.4 | GO:0040032 | post-embryonic body morphogenesis(GO:0040032) |
| 0.1 | 0.2 | GO:0043474 | eye pigment biosynthetic process(GO:0006726) eye pigment metabolic process(GO:0042441) pigment metabolic process involved in developmental pigmentation(GO:0043324) pigment metabolic process involved in pigmentation(GO:0043474) |
| 0.1 | 0.3 | GO:2000323 | negative regulation of glucocorticoid receptor signaling pathway(GO:2000323) |
| 0.1 | 5.3 | GO:0030433 | ER-associated ubiquitin-dependent protein catabolic process(GO:0030433) |
| 0.1 | 0.3 | GO:0006041 | glucosamine metabolic process(GO:0006041) |
| 0.0 | 0.1 | GO:0032223 | negative regulation of synaptic transmission, cholinergic(GO:0032223) neurotransmitter receptor biosynthetic process(GO:0045212) |
| 0.0 | 0.1 | GO:0008343 | adult feeding behavior(GO:0008343) |
| 0.0 | 3.1 | GO:0051865 | protein autoubiquitination(GO:0051865) |
| 0.0 | 0.2 | GO:0048696 | regulation of collateral sprouting in absence of injury(GO:0048696) negative regulation of collateral sprouting in absence of injury(GO:0048698) |
| 0.0 | 0.2 | GO:1901857 | positive regulation of cellular respiration(GO:1901857) |
| 0.0 | 0.3 | GO:0044375 | regulation of peroxisome size(GO:0044375) |
| 0.0 | 1.6 | GO:0006884 | cell volume homeostasis(GO:0006884) |
| 0.0 | 0.5 | GO:1902004 | positive regulation of beta-amyloid formation(GO:1902004) |
| 0.0 | 0.1 | GO:0070837 | dehydroascorbic acid transport(GO:0070837) |
| 0.0 | 0.3 | GO:1903232 | melanosome assembly(GO:1903232) |
| 0.0 | 0.3 | GO:0002759 | regulation of antimicrobial humoral response(GO:0002759) |
| 0.0 | 0.1 | GO:0061357 | positive regulation of Wnt protein secretion(GO:0061357) |
| 0.0 | 0.6 | GO:0001731 | formation of translation preinitiation complex(GO:0001731) |
| 0.0 | 0.3 | GO:0007288 | sperm axoneme assembly(GO:0007288) |
| 0.0 | 0.1 | GO:0010157 | response to chlorate(GO:0010157) |
| 0.0 | 0.4 | GO:1904354 | negative regulation of telomere capping(GO:1904354) |
| 0.0 | 0.2 | GO:0060332 | positive regulation of response to interferon-gamma(GO:0060332) positive regulation of interferon-gamma-mediated signaling pathway(GO:0060335) |
| 0.0 | 0.2 | GO:0014053 | negative regulation of gamma-aminobutyric acid secretion(GO:0014053) aspartate secretion(GO:0061528) regulation of aspartate secretion(GO:1904448) positive regulation of aspartate secretion(GO:1904450) |
| 0.0 | 0.2 | GO:0010499 | proteasomal ubiquitin-independent protein catabolic process(GO:0010499) |
| 0.0 | 0.7 | GO:0000338 | protein deneddylation(GO:0000338) |
| 0.0 | 0.7 | GO:0043982 | histone H4-K5 acetylation(GO:0043981) histone H4-K8 acetylation(GO:0043982) |
| 0.0 | 0.7 | GO:0051560 | mitochondrial calcium ion homeostasis(GO:0051560) |
| 0.0 | 0.2 | GO:0016480 | negative regulation of transcription from RNA polymerase III promoter(GO:0016480) |
| 0.0 | 0.2 | GO:0046462 | monoacylglycerol metabolic process(GO:0046462) monoacylglycerol catabolic process(GO:0052651) |
| 0.0 | 0.1 | GO:0043686 | co-translational protein modification(GO:0043686) |
| 0.0 | 1.6 | GO:0007094 | mitotic spindle assembly checkpoint(GO:0007094) spindle assembly checkpoint(GO:0071173) |
| 0.0 | 0.6 | GO:0043508 | negative regulation of JUN kinase activity(GO:0043508) |
| 0.0 | 0.7 | GO:0030575 | nuclear body organization(GO:0030575) |
| 0.0 | 0.4 | GO:0016926 | protein desumoylation(GO:0016926) |
| 0.0 | 0.2 | GO:0060267 | positive regulation of respiratory burst(GO:0060267) |
| 0.0 | 0.5 | GO:0002315 | marginal zone B cell differentiation(GO:0002315) |
| 0.0 | 0.1 | GO:0061743 | motor learning(GO:0061743) |
| 0.0 | 0.2 | GO:0090116 | C-5 methylation of cytosine(GO:0090116) |
| 0.0 | 0.8 | GO:0032012 | regulation of ARF protein signal transduction(GO:0032012) |
| 0.0 | 0.0 | GO:0070602 | regulation of centromeric sister chromatid cohesion(GO:0070602) |
| 0.0 | 0.4 | GO:2000643 | positive regulation of early endosome to late endosome transport(GO:2000643) |
| 0.0 | 0.1 | GO:0032286 | central nervous system myelin maintenance(GO:0032286) |
| 0.0 | 0.2 | GO:1903300 | negative regulation of glucokinase activity(GO:0033132) negative regulation of hexokinase activity(GO:1903300) |
| 0.0 | 0.1 | GO:0061113 | pancreas morphogenesis(GO:0061113) |
| 0.0 | 0.2 | GO:0031016 | pancreas development(GO:0031016) |
| 0.0 | 0.2 | GO:0015798 | myo-inositol transport(GO:0015798) |
| 0.0 | 0.5 | GO:2000427 | positive regulation of apoptotic cell clearance(GO:2000427) |
| 0.0 | 0.3 | GO:0031087 | deadenylation-independent decapping of nuclear-transcribed mRNA(GO:0031087) |
| 0.0 | 0.7 | GO:0045161 | neuronal ion channel clustering(GO:0045161) |
| 0.0 | 1.6 | GO:0070911 | global genome nucleotide-excision repair(GO:0070911) |
| 0.0 | 0.2 | GO:0015015 | heparan sulfate proteoglycan biosynthetic process, enzymatic modification(GO:0015015) |
| 0.0 | 0.1 | GO:0006434 | seryl-tRNA aminoacylation(GO:0006434) selenocysteinyl-tRNA(Sec) biosynthetic process(GO:0097056) |
| 0.0 | 0.2 | GO:0048757 | endosome to melanosome transport(GO:0035646) endosome to pigment granule transport(GO:0043485) pigment granule maturation(GO:0048757) |
| 0.0 | 0.3 | GO:0014877 | response to muscle inactivity involved in regulation of muscle adaptation(GO:0014877) response to denervation involved in regulation of muscle adaptation(GO:0014894) |
| 0.0 | 1.3 | GO:0097352 | autophagosome maturation(GO:0097352) |
| 0.0 | 0.2 | GO:0006311 | meiotic gene conversion(GO:0006311) |
| 0.0 | 0.1 | GO:0001507 | acetylcholine catabolic process in synaptic cleft(GO:0001507) acetylcholine catabolic process(GO:0006581) |
| 0.0 | 0.1 | GO:0002276 | basophil activation involved in immune response(GO:0002276) |
| 0.0 | 0.2 | GO:1903435 | positive regulation of constitutive secretory pathway(GO:1903435) |
| 0.0 | 0.5 | GO:0006610 | ribosomal protein import into nucleus(GO:0006610) |
| 0.0 | 1.5 | GO:0050775 | positive regulation of dendrite morphogenesis(GO:0050775) |
| 0.0 | 0.9 | GO:0046856 | phosphatidylinositol dephosphorylation(GO:0046856) |
| 0.0 | 0.2 | GO:0006880 | intracellular sequestering of iron ion(GO:0006880) sequestering of iron ion(GO:0097577) |
| 0.0 | 0.4 | GO:2000574 | regulation of microtubule motor activity(GO:2000574) |
| 0.0 | 1.7 | GO:0005978 | glycogen biosynthetic process(GO:0005978) glucan biosynthetic process(GO:0009250) |
| 0.0 | 0.4 | GO:0045835 | negative regulation of meiotic nuclear division(GO:0045835) |
| 0.0 | 0.8 | GO:0046329 | negative regulation of JNK cascade(GO:0046329) |
| 0.0 | 0.1 | GO:0046452 | dihydrofolate metabolic process(GO:0046452) |
| 0.0 | 0.1 | GO:0001828 | inner cell mass cell fate commitment(GO:0001827) inner cell mass cellular morphogenesis(GO:0001828) |
| 0.0 | 0.4 | GO:0045974 | miRNA mediated inhibition of translation(GO:0035278) negative regulation of translation, ncRNA-mediated(GO:0040033) regulation of translation, ncRNA-mediated(GO:0045974) |
| 0.0 | 0.3 | GO:0060074 | synapse maturation(GO:0060074) |
| 0.0 | 0.5 | GO:0007095 | mitotic G2 DNA damage checkpoint(GO:0007095) |
| 0.0 | 0.2 | GO:0015886 | heme transport(GO:0015886) |
| 0.0 | 0.2 | GO:0034128 | negative regulation of MyD88-independent toll-like receptor signaling pathway(GO:0034128) |
| 0.0 | 1.1 | GO:0061621 | NADH regeneration(GO:0006735) canonical glycolysis(GO:0061621) glucose catabolic process to pyruvate(GO:0061718) |
| 0.0 | 0.5 | GO:0042340 | keratan sulfate catabolic process(GO:0042340) |
| 0.0 | 0.3 | GO:2000042 | negative regulation of double-strand break repair via homologous recombination(GO:2000042) |
| 0.0 | 0.1 | GO:0031296 | B cell costimulation(GO:0031296) |
| 0.0 | 0.4 | GO:0070884 | regulation of calcineurin-NFAT signaling cascade(GO:0070884) |
| 0.0 | 0.1 | GO:0043308 | eosinophil activation involved in immune response(GO:0002278) eosinophil mediated immunity(GO:0002447) eosinophil degranulation(GO:0043308) |
| 0.0 | 0.1 | GO:0090187 | regulation of high-density lipoprotein particle assembly(GO:0090107) positive regulation of pancreatic juice secretion(GO:0090187) |
| 0.0 | 0.1 | GO:0032055 | negative regulation of translation in response to stress(GO:0032055) negative regulation of translational initiation in response to stress(GO:0032057) |
| 0.0 | 0.3 | GO:0016446 | somatic hypermutation of immunoglobulin genes(GO:0016446) |
| 0.0 | 0.5 | GO:0006957 | complement activation, alternative pathway(GO:0006957) |
| 0.0 | 0.1 | GO:0033387 | putrescine biosynthetic process from ornithine(GO:0033387) |
| 0.0 | 0.3 | GO:0048096 | chromatin-mediated maintenance of transcription(GO:0048096) |
| 0.0 | 0.3 | GO:0001833 | inner cell mass cell proliferation(GO:0001833) |
| 0.0 | 0.4 | GO:0070307 | lens fiber cell development(GO:0070307) |
| 0.0 | 0.0 | GO:0051946 | regulation of amino acid uptake involved in synaptic transmission(GO:0051941) regulation of glutamate uptake involved in transmission of nerve impulse(GO:0051946) regulation of L-glutamate import(GO:1900920) |
| 0.0 | 0.1 | GO:0046103 | adenosine catabolic process(GO:0006154) inosine biosynthetic process(GO:0046103) |
| 0.0 | 0.2 | GO:0000066 | mitochondrial ornithine transport(GO:0000066) |
| 0.0 | 0.0 | GO:1904562 | phosphatidylinositol 5-phosphate metabolic process(GO:1904562) |
| 0.0 | 0.4 | GO:0070987 | error-free translesion synthesis(GO:0070987) |
| 0.0 | 0.0 | GO:1904933 | regulation of cell proliferation in midbrain(GO:1904933) |
| 0.0 | 0.4 | GO:0043153 | entrainment of circadian clock by photoperiod(GO:0043153) |
| 0.0 | 0.3 | GO:0048843 | trigeminal nerve morphogenesis(GO:0021636) trigeminal nerve structural organization(GO:0021637) negative regulation of axon extension involved in axon guidance(GO:0048843) semaphorin-plexin signaling pathway involved in axon guidance(GO:1902287) |
| 0.0 | 0.1 | GO:0045113 | regulation of integrin biosynthetic process(GO:0045113) |
| 0.0 | 0.1 | GO:1903676 | regulation of cap-dependent translational initiation(GO:1903674) positive regulation of cap-dependent translational initiation(GO:1903676) |
| 0.0 | 0.1 | GO:0060023 | soft palate development(GO:0060023) |
| 0.0 | 0.0 | GO:0090230 | regulation of centromere complex assembly(GO:0090230) |
| 0.0 | 0.2 | GO:0015846 | polyamine transport(GO:0015846) |
| 0.0 | 0.1 | GO:1903336 | negative regulation of vacuolar transport(GO:1903336) |
| 0.0 | 0.0 | GO:0061525 | hindgut morphogenesis(GO:0007442) embryonic hindgut morphogenesis(GO:0048619) hindgut development(GO:0061525) |
| 0.0 | 0.1 | GO:0018094 | protein polyglycylation(GO:0018094) |
| 0.0 | 0.6 | GO:1903831 | acetylcholine receptor signaling pathway(GO:0095500) postsynaptic signal transduction(GO:0098926) signal transduction involved in cellular response to ammonium ion(GO:1903831) response to acetylcholine(GO:1905144) cellular response to acetylcholine(GO:1905145) |
| 0.0 | 0.2 | GO:0021520 | spinal cord motor neuron cell fate specification(GO:0021520) |
| 0.0 | 0.2 | GO:0038060 | nitric oxide-cGMP-mediated signaling pathway(GO:0038060) |
| 0.0 | 0.1 | GO:0097646 | calcitonin family receptor signaling pathway(GO:0097646) amylin receptor signaling pathway(GO:0097647) |
| 0.0 | 0.4 | GO:0033539 | fatty acid beta-oxidation using acyl-CoA dehydrogenase(GO:0033539) |
| 0.0 | 0.1 | GO:1903566 | ciliary basal body organization(GO:0032053) positive regulation of protein localization to cilium(GO:1903566) |
| 0.0 | 0.2 | GO:0014827 | intestine smooth muscle contraction(GO:0014827) |
| 0.0 | 0.4 | GO:0032836 | glomerular basement membrane development(GO:0032836) |
| 0.0 | 0.4 | GO:0030011 | maintenance of cell polarity(GO:0030011) |
| 0.0 | 0.3 | GO:0006782 | protoporphyrinogen IX biosynthetic process(GO:0006782) |
| 0.0 | 0.2 | GO:0032291 | central nervous system myelination(GO:0022010) axon ensheathment in central nervous system(GO:0032291) |
| 0.0 | 0.1 | GO:0099612 | protein localization to axon(GO:0099612) |
| 0.0 | 0.1 | GO:0060748 | tertiary branching involved in mammary gland duct morphogenesis(GO:0060748) |
| 0.0 | 0.1 | GO:0035553 | oxidative RNA demethylation(GO:0035513) oxidative single-stranded RNA demethylation(GO:0035553) |
| 0.0 | 0.1 | GO:0051344 | regulation of cyclic-nucleotide phosphodiesterase activity(GO:0051342) negative regulation of cyclic-nucleotide phosphodiesterase activity(GO:0051344) |
| 0.0 | 0.1 | GO:0006072 | glycerol-3-phosphate metabolic process(GO:0006072) |
| 0.0 | 0.1 | GO:0006893 | Golgi to plasma membrane transport(GO:0006893) |
| 0.0 | 0.2 | GO:0009414 | response to water deprivation(GO:0009414) |
| 0.0 | 0.1 | GO:0043504 | mitochondrial DNA repair(GO:0043504) |
| 0.0 | 1.0 | GO:0034724 | DNA replication-independent nucleosome assembly(GO:0006336) DNA replication-independent nucleosome organization(GO:0034724) |
| 0.0 | 0.1 | GO:1900224 | positive regulation of nodal signaling pathway involved in determination of lateral mesoderm left/right asymmetry(GO:1900224) |
| 0.0 | 1.5 | GO:0048678 | response to axon injury(GO:0048678) |
| 0.0 | 0.9 | GO:0031670 | cellular response to nutrient(GO:0031670) |
| 0.0 | 0.2 | GO:0018206 | peptidyl-methionine modification(GO:0018206) |
| 0.0 | 0.7 | GO:2000144 | positive regulation of DNA-templated transcription, initiation(GO:2000144) |
| 0.0 | 0.2 | GO:0051823 | regulation of synapse structural plasticity(GO:0051823) |
| 0.0 | 0.1 | GO:0016554 | cytidine to uridine editing(GO:0016554) |
| 0.0 | 0.6 | GO:0072661 | protein targeting to plasma membrane(GO:0072661) |
| 0.0 | 0.5 | GO:0043011 | myeloid dendritic cell differentiation(GO:0043011) |
| 0.0 | 0.2 | GO:0000290 | deadenylation-dependent decapping of nuclear-transcribed mRNA(GO:0000290) |
| 0.0 | 0.1 | GO:0048250 | mitochondrial iron ion transport(GO:0048250) |
| 0.0 | 0.1 | GO:0033512 | L-lysine catabolic process to acetyl-CoA via saccharopine(GO:0033512) |
| 0.0 | 0.2 | GO:0090150 | establishment of protein localization to membrane(GO:0090150) |
| 0.0 | 0.1 | GO:0072023 | thick ascending limb development(GO:0072023) metanephric thick ascending limb development(GO:0072233) |
| 0.0 | 0.1 | GO:1901301 | regulation of cargo loading into COPII-coated vesicle(GO:1901301) |
| 0.0 | 0.4 | GO:0048026 | positive regulation of mRNA splicing, via spliceosome(GO:0048026) |
| 0.0 | 0.3 | GO:0007276 | gamete generation(GO:0007276) |
| 0.0 | 0.3 | GO:0007501 | mesodermal cell fate specification(GO:0007501) |
| 0.0 | 1.1 | GO:0006120 | mitochondrial electron transport, NADH to ubiquinone(GO:0006120) |
| 0.0 | 0.2 | GO:0007625 | grooming behavior(GO:0007625) |
| 0.0 | 0.2 | GO:0046951 | ketone body biosynthetic process(GO:0046951) |
| 0.0 | 0.1 | GO:0032287 | peripheral nervous system myelin maintenance(GO:0032287) |
| 0.0 | 0.0 | GO:0070459 | prolactin secretion(GO:0070459) |
| 0.0 | 0.1 | GO:0035694 | mitochondrial protein catabolic process(GO:0035694) |
| 0.0 | 0.1 | GO:0051151 | negative regulation of smooth muscle cell differentiation(GO:0051151) |
| 0.0 | 0.2 | GO:0031958 | corticosteroid receptor signaling pathway(GO:0031958) glucocorticoid receptor signaling pathway(GO:0042921) |
| 0.0 | 0.7 | GO:0007622 | rhythmic behavior(GO:0007622) circadian behavior(GO:0048512) |
| 0.0 | 0.1 | GO:0034244 | negative regulation of transcription elongation from RNA polymerase II promoter(GO:0034244) |
| 0.0 | 0.1 | GO:1903421 | regulation of synaptic vesicle recycling(GO:1903421) |
| 0.0 | 0.1 | GO:2000641 | regulation of early endosome to late endosome transport(GO:2000641) |
| 0.0 | 0.3 | GO:0006388 | tRNA splicing, via endonucleolytic cleavage and ligation(GO:0006388) |
| 0.0 | 0.1 | GO:0032510 | endosome to lysosome transport via multivesicular body sorting pathway(GO:0032510) |
| 0.0 | 0.1 | GO:0006556 | S-adenosylmethionine biosynthetic process(GO:0006556) |
| 0.0 | 0.0 | GO:0072137 | condensed mesenchymal cell proliferation(GO:0072137) |
| 0.0 | 0.3 | GO:0051156 | glucose 6-phosphate metabolic process(GO:0051156) |
| 0.0 | 0.2 | GO:0051152 | positive regulation of smooth muscle cell differentiation(GO:0051152) |
| 0.0 | 0.2 | GO:0035414 | negative regulation of catenin import into nucleus(GO:0035414) |
| 0.0 | 0.2 | GO:0006265 | DNA topological change(GO:0006265) |
| 0.0 | 0.0 | GO:0006367 | transcription initiation from RNA polymerase II promoter(GO:0006367) |
| 0.0 | 0.0 | GO:0061055 | myotome development(GO:0061055) |
| 0.0 | 0.2 | GO:0002115 | store-operated calcium entry(GO:0002115) |
| 0.0 | 0.1 | GO:0032377 | regulation of intracellular lipid transport(GO:0032377) regulation of intracellular sterol transport(GO:0032380) regulation of intracellular cholesterol transport(GO:0032383) |
| 0.0 | 1.2 | GO:0031100 | organ regeneration(GO:0031100) |
| 0.0 | 0.5 | GO:0042776 | mitochondrial ATP synthesis coupled proton transport(GO:0042776) |
| 0.0 | 0.2 | GO:0061298 | retina vasculature development in camera-type eye(GO:0061298) |
| 0.0 | 0.1 | GO:0006121 | mitochondrial electron transport, succinate to ubiquinone(GO:0006121) |
| 0.0 | 0.8 | GO:0006513 | protein monoubiquitination(GO:0006513) |
| 0.0 | 1.2 | GO:0032436 | positive regulation of proteasomal ubiquitin-dependent protein catabolic process(GO:0032436) |
| 0.0 | 0.0 | GO:0045359 | interferon-beta biosynthetic process(GO:0045350) regulation of interferon-beta biosynthetic process(GO:0045357) positive regulation of interferon-beta biosynthetic process(GO:0045359) |
| 0.0 | 0.0 | GO:1903568 | negative regulation of protein localization to cilium(GO:1903565) regulation of protein localization to ciliary membrane(GO:1903567) negative regulation of protein localization to ciliary membrane(GO:1903568) |
| 0.0 | 0.1 | GO:0032264 | IMP salvage(GO:0032264) |
| 0.0 | 0.1 | GO:0032241 | positive regulation of nucleobase-containing compound transport(GO:0032241) positive regulation of RNA export from nucleus(GO:0046833) |
| 0.0 | 0.1 | GO:0072553 | terminal button organization(GO:0072553) |
| 0.0 | 0.5 | GO:0001580 | detection of chemical stimulus involved in sensory perception of bitter taste(GO:0001580) |
| 0.0 | 0.3 | GO:0090162 | establishment of epithelial cell polarity(GO:0090162) |
| 0.0 | 0.1 | GO:0046604 | positive regulation of mitotic centrosome separation(GO:0046604) |
| 0.0 | 0.1 | GO:0019556 | histidine catabolic process to glutamate and formamide(GO:0019556) histidine catabolic process to glutamate and formate(GO:0019557) formamide metabolic process(GO:0043606) |
| 0.0 | 0.2 | GO:0018202 | peptidyl-histidine modification(GO:0018202) |
| 0.0 | 0.1 | GO:0070131 | positive regulation of mitochondrial translation(GO:0070131) |
| 0.0 | 1.5 | GO:0035335 | peptidyl-tyrosine dephosphorylation(GO:0035335) |
| 0.0 | 0.1 | GO:1903817 | negative regulation of delayed rectifier potassium channel activity(GO:1902260) negative regulation of voltage-gated potassium channel activity(GO:1903817) |
| 0.0 | 0.0 | GO:0007343 | egg activation(GO:0007343) |
| 0.0 | 0.1 | GO:0061684 | chaperone-mediated autophagy(GO:0061684) |
| 0.0 | 0.7 | GO:0033762 | response to glucagon(GO:0033762) |
| 0.0 | 0.1 | GO:0036295 | cellular response to increased oxygen levels(GO:0036295) |
| 0.0 | 0.1 | GO:1900028 | negative regulation of ruffle assembly(GO:1900028) |
| 0.0 | 0.1 | GO:0018344 | protein geranylgeranylation(GO:0018344) |
| 0.0 | 0.0 | GO:0048478 | replication fork protection(GO:0048478) |
| 0.0 | 0.4 | GO:0046676 | negative regulation of insulin secretion(GO:0046676) |
| 0.0 | 0.1 | GO:0006681 | galactosylceramide metabolic process(GO:0006681) galactolipid metabolic process(GO:0019374) |
| 0.0 | 0.3 | GO:0033209 | tumor necrosis factor-mediated signaling pathway(GO:0033209) |
| 0.0 | 0.2 | GO:1900115 | extracellular regulation of signal transduction(GO:1900115) extracellular negative regulation of signal transduction(GO:1900116) |
| 0.0 | 0.4 | GO:0070979 | protein K11-linked ubiquitination(GO:0070979) |
| 0.0 | 0.6 | GO:0042073 | intraciliary transport(GO:0042073) |
| 0.0 | 0.2 | GO:0043162 | ubiquitin-dependent protein catabolic process via the multivesicular body sorting pathway(GO:0043162) |
| 0.0 | 0.1 | GO:1904893 | negative regulation of JAK-STAT cascade(GO:0046426) negative regulation of STAT cascade(GO:1904893) |
| 0.0 | 0.1 | GO:0035437 | protein retention in ER lumen(GO:0006621) maintenance of protein localization in endoplasmic reticulum(GO:0035437) |
| 0.0 | 0.6 | GO:0071230 | cellular response to amino acid stimulus(GO:0071230) |
| 0.0 | 0.1 | GO:0032474 | otolith morphogenesis(GO:0032474) |
| 0.0 | 0.3 | GO:0022400 | regulation of rhodopsin mediated signaling pathway(GO:0022400) |
| 0.0 | 0.3 | GO:0043968 | histone H2A acetylation(GO:0043968) |
| 0.0 | 0.0 | GO:0071394 | cellular response to testosterone stimulus(GO:0071394) |
| 0.0 | 0.6 | GO:0051439 | negative regulation of ubiquitin-protein ligase activity involved in mitotic cell cycle(GO:0051436) regulation of ubiquitin-protein ligase activity involved in mitotic cell cycle(GO:0051439) |
| 0.0 | 0.0 | GO:0002566 | somatic diversification of immune receptors via somatic mutation(GO:0002566) |
| 0.0 | 0.1 | GO:0048069 | eye pigmentation(GO:0048069) |
| 0.0 | 0.4 | GO:1904837 | beta-catenin-TCF complex assembly(GO:1904837) |
| 0.0 | 0.3 | GO:0010257 | NADH dehydrogenase complex assembly(GO:0010257) mitochondrial respiratory chain complex I assembly(GO:0032981) mitochondrial respiratory chain complex I biogenesis(GO:0097031) |
| 0.0 | 0.6 | GO:0021762 | substantia nigra development(GO:0021762) |
| 0.0 | 0.1 | GO:0010165 | response to X-ray(GO:0010165) |
| 0.0 | 0.3 | GO:0051123 | RNA polymerase II transcriptional preinitiation complex assembly(GO:0051123) |
| 0.0 | 1.1 | GO:0008277 | regulation of G-protein coupled receptor protein signaling pathway(GO:0008277) |
| 0.0 | 0.2 | GO:0031293 | membrane protein intracellular domain proteolysis(GO:0031293) |
| 0.0 | 0.1 | GO:0086053 | AV node cell to bundle of His cell communication by electrical coupling(GO:0086053) |
| 0.0 | 0.8 | GO:0016266 | O-glycan processing(GO:0016266) |
Gene overrepresentation in cellular_component category:
| Log-likelihood per target | Total log-likelihood | Term | Description |
|---|---|---|---|
| 0.5 | 3.3 | GO:1990131 | Gtr1-Gtr2 GTPase complex(GO:1990131) |
| 0.4 | 1.6 | GO:0070044 | synaptobrevin 2-SNAP-25-syntaxin-1a complex(GO:0070044) |
| 0.4 | 1.2 | GO:0031084 | BLOC-2 complex(GO:0031084) |
| 0.3 | 1.7 | GO:0046696 | lipopolysaccharide receptor complex(GO:0046696) |
| 0.2 | 1.7 | GO:0033503 | HULC complex(GO:0033503) |
| 0.2 | 3.5 | GO:0097136 | Bcl-2 family protein complex(GO:0097136) |
| 0.2 | 6.5 | GO:0031083 | BLOC-1 complex(GO:0031083) |
| 0.2 | 1.6 | GO:0032777 | Piccolo NuA4 histone acetyltransferase complex(GO:0032777) |
| 0.2 | 1.8 | GO:0032010 | phagolysosome(GO:0032010) |
| 0.2 | 0.9 | GO:0097135 | cyclin E2-CDK2 complex(GO:0097135) |
| 0.2 | 1.5 | GO:0098575 | lumenal side of lysosomal membrane(GO:0098575) |
| 0.2 | 0.8 | GO:0033596 | TSC1-TSC2 complex(GO:0033596) |
| 0.2 | 2.0 | GO:0070937 | CRD-mediated mRNA stability complex(GO:0070937) |
| 0.2 | 0.8 | GO:1990246 | uniplex complex(GO:1990246) |
| 0.2 | 0.8 | GO:0097452 | GAIT complex(GO:0097452) |
| 0.1 | 1.3 | GO:0005827 | polar microtubule(GO:0005827) |
| 0.1 | 1.0 | GO:0000408 | EKC/KEOPS complex(GO:0000408) |
| 0.1 | 1.0 | GO:0000015 | phosphopyruvate hydratase complex(GO:0000015) |
| 0.1 | 2.1 | GO:0099634 | postsynaptic specialization membrane(GO:0099634) |
| 0.1 | 0.8 | GO:0045323 | interleukin-1 receptor complex(GO:0045323) |
| 0.1 | 0.8 | GO:0097129 | cyclin D2-CDK4 complex(GO:0097129) |
| 0.1 | 1.8 | GO:0098647 | collagen type VI trimer(GO:0005589) collagen beaded filament(GO:0098647) |
| 0.1 | 5.9 | GO:0071339 | MLL1/2 complex(GO:0044665) MLL1 complex(GO:0071339) |
| 0.1 | 0.8 | GO:0000138 | Golgi trans cisterna(GO:0000138) |
| 0.1 | 0.5 | GO:0031510 | SUMO activating enzyme complex(GO:0031510) |
| 0.1 | 0.6 | GO:0005899 | insulin receptor complex(GO:0005899) |
| 0.1 | 1.2 | GO:0010009 | cytoplasmic side of endosome membrane(GO:0010009) |
| 0.1 | 0.9 | GO:0016589 | NURF complex(GO:0016589) |
| 0.1 | 2.4 | GO:1990124 | messenger ribonucleoprotein complex(GO:1990124) |
| 0.1 | 1.6 | GO:0030897 | HOPS complex(GO:0030897) |
| 0.1 | 0.4 | GO:0055087 | Ski complex(GO:0055087) |
| 0.1 | 0.8 | GO:0071986 | Ragulator complex(GO:0071986) |
| 0.1 | 1.2 | GO:0097487 | multivesicular body, internal vesicle(GO:0097487) |
| 0.1 | 0.7 | GO:0030905 | retromer, tubulation complex(GO:0030905) |
| 0.1 | 0.4 | GO:0000333 | telomerase catalytic core complex(GO:0000333) |
| 0.1 | 5.2 | GO:0005834 | heterotrimeric G-protein complex(GO:0005834) |
| 0.1 | 0.3 | GO:0005967 | mitochondrial pyruvate dehydrogenase complex(GO:0005967) |
| 0.1 | 2.2 | GO:0035327 | transcriptionally active chromatin(GO:0035327) |
| 0.1 | 2.0 | GO:0010369 | chromocenter(GO:0010369) |
| 0.1 | 0.2 | GO:0000813 | ESCRT I complex(GO:0000813) |
| 0.1 | 1.1 | GO:0005869 | dynactin complex(GO:0005869) |
| 0.1 | 0.6 | GO:1990111 | spermatoproteasome complex(GO:1990111) |
| 0.1 | 0.4 | GO:0033553 | rDNA heterochromatin(GO:0033553) |
| 0.1 | 0.3 | GO:0002177 | manchette(GO:0002177) |
| 0.1 | 0.4 | GO:0030981 | cortical microtubule cytoskeleton(GO:0030981) |
| 0.1 | 0.4 | GO:0070381 | endosome to plasma membrane transport vesicle(GO:0070381) |
| 0.1 | 0.7 | GO:0000439 | core TFIIH complex(GO:0000439) |
| 0.1 | 0.6 | GO:0005638 | lamin filament(GO:0005638) |
| 0.1 | 1.5 | GO:0001527 | microfibril(GO:0001527) fibril(GO:0043205) |
| 0.1 | 0.2 | GO:0005896 | interleukin-6 receptor complex(GO:0005896) |
| 0.1 | 0.7 | GO:1990909 | catenin complex(GO:0016342) Wnt signalosome(GO:1990909) |
| 0.1 | 0.2 | GO:0008043 | intracellular ferritin complex(GO:0008043) ferritin complex(GO:0070288) |
| 0.1 | 2.4 | GO:0030140 | trans-Golgi network transport vesicle(GO:0030140) |
| 0.1 | 0.2 | GO:0009330 | DNA topoisomerase complex (ATP-hydrolyzing)(GO:0009330) |
| 0.1 | 0.8 | GO:0034098 | VCP-NPL4-UFD1 AAA ATPase complex(GO:0034098) |
| 0.1 | 0.3 | GO:0034991 | nuclear meiotic cohesin complex(GO:0034991) |
| 0.1 | 0.1 | GO:0097504 | Gemini of coiled bodies(GO:0097504) |
| 0.1 | 0.8 | GO:0000153 | cytoplasmic ubiquitin ligase complex(GO:0000153) |
| 0.1 | 0.3 | GO:0020016 | ciliary pocket(GO:0020016) ciliary pocket membrane(GO:0020018) |
| 0.0 | 0.6 | GO:0031616 | spindle pole centrosome(GO:0031616) |
| 0.0 | 0.3 | GO:0034274 | Atg12-Atg5-Atg16 complex(GO:0034274) |
| 0.0 | 0.6 | GO:0030914 | STAGA complex(GO:0030914) |
| 0.0 | 0.8 | GO:0034045 | pre-autophagosomal structure membrane(GO:0034045) |
| 0.0 | 0.5 | GO:0000322 | storage vacuole(GO:0000322) |
| 0.0 | 0.8 | GO:0030904 | retromer complex(GO:0030904) |
| 0.0 | 0.4 | GO:0044754 | autolysosome(GO:0044754) |
| 0.0 | 0.6 | GO:0042622 | photoreceptor outer segment membrane(GO:0042622) |
| 0.0 | 0.2 | GO:0032144 | 4-aminobutyrate transaminase complex(GO:0032144) |
| 0.0 | 2.9 | GO:0016235 | aggresome(GO:0016235) |
| 0.0 | 0.2 | GO:0032279 | axonemal microtubule(GO:0005879) asymmetric synapse(GO:0032279) |
| 0.0 | 0.0 | GO:0000152 | nuclear ubiquitin ligase complex(GO:0000152) |
| 0.0 | 0.8 | GO:0032591 | dendritic spine membrane(GO:0032591) |
| 0.0 | 2.5 | GO:0043198 | dendritic shaft(GO:0043198) |
| 0.0 | 0.3 | GO:0032389 | MutLalpha complex(GO:0032389) |
| 0.0 | 0.3 | GO:1990635 | proximal dendrite(GO:1990635) |
| 0.0 | 0.3 | GO:0097413 | Lewy body(GO:0097413) |
| 0.0 | 3.9 | GO:0005901 | caveola(GO:0005901) |
| 0.0 | 1.0 | GO:0031307 | integral component of mitochondrial outer membrane(GO:0031307) |
| 0.0 | 0.9 | GO:0030285 | integral component of synaptic vesicle membrane(GO:0030285) intrinsic component of synaptic vesicle membrane(GO:0098563) |
| 0.0 | 2.0 | GO:0000786 | nucleosome(GO:0000786) |
| 0.0 | 0.3 | GO:0001739 | sex chromatin(GO:0001739) |
| 0.0 | 3.0 | GO:0032154 | cleavage furrow(GO:0032154) cell surface furrow(GO:0097610) |
| 0.0 | 4.5 | GO:0043202 | lysosomal lumen(GO:0043202) |
| 0.0 | 0.4 | GO:0042583 | chromaffin granule(GO:0042583) |
| 0.0 | 0.4 | GO:0000783 | telomere cap complex(GO:0000782) nuclear telomere cap complex(GO:0000783) |
| 0.0 | 0.6 | GO:0005847 | mRNA cleavage and polyadenylation specificity factor complex(GO:0005847) |
| 0.0 | 0.3 | GO:0030991 | intraciliary transport particle A(GO:0030991) |
| 0.0 | 0.3 | GO:0072669 | tRNA-splicing ligase complex(GO:0072669) |
| 0.0 | 0.5 | GO:0000815 | ESCRT III complex(GO:0000815) |
| 0.0 | 1.2 | GO:0035861 | site of double-strand break(GO:0035861) |
| 0.0 | 0.2 | GO:0070765 | gamma-secretase complex(GO:0070765) |
| 0.0 | 0.2 | GO:0005785 | signal recognition particle receptor complex(GO:0005785) |
| 0.0 | 0.1 | GO:0005968 | Rab-protein geranylgeranyltransferase complex(GO:0005968) |
| 0.0 | 0.5 | GO:0000276 | mitochondrial proton-transporting ATP synthase complex, coupling factor F(o)(GO:0000276) |
| 0.0 | 0.6 | GO:0030127 | COPII vesicle coat(GO:0030127) |
| 0.0 | 0.4 | GO:0005664 | origin recognition complex(GO:0000808) nuclear origin of replication recognition complex(GO:0005664) |
| 0.0 | 0.5 | GO:0008250 | oligosaccharyltransferase complex(GO:0008250) |
| 0.0 | 0.5 | GO:0005885 | Arp2/3 protein complex(GO:0005885) |
| 0.0 | 0.1 | GO:0097362 | MCM8-MCM9 complex(GO:0097362) |
| 0.0 | 0.0 | GO:0019034 | viral replication complex(GO:0019034) |
| 0.0 | 0.3 | GO:0035631 | CD40 receptor complex(GO:0035631) |
| 0.0 | 0.1 | GO:1990769 | proximal neuron projection(GO:1990769) |
| 0.0 | 2.6 | GO:0005581 | collagen trimer(GO:0005581) |
| 0.0 | 0.1 | GO:0034751 | aryl hydrocarbon receptor complex(GO:0034751) |
| 0.0 | 0.1 | GO:0030870 | Mre11 complex(GO:0030870) |
| 0.0 | 1.8 | GO:0005811 | lipid particle(GO:0005811) |
| 0.0 | 2.7 | GO:0031902 | late endosome membrane(GO:0031902) |
| 0.0 | 0.5 | GO:0031588 | nucleotide-activated protein kinase complex(GO:0031588) |
| 0.0 | 0.1 | GO:0033263 | CORVET complex(GO:0033263) |
| 0.0 | 0.3 | GO:0030126 | COPI vesicle coat(GO:0030126) |
| 0.0 | 0.1 | GO:0048269 | methionine adenosyltransferase complex(GO:0048269) |
| 0.0 | 0.3 | GO:0002116 | semaphorin receptor complex(GO:0002116) |
| 0.0 | 2.3 | GO:0005746 | mitochondrial respiratory chain(GO:0005746) |
| 0.0 | 0.8 | GO:0090544 | BAF-type complex(GO:0090544) |
| 0.0 | 1.7 | GO:0005758 | mitochondrial intermembrane space(GO:0005758) |
| 0.0 | 0.6 | GO:0016327 | apicolateral plasma membrane(GO:0016327) |
| 0.0 | 0.1 | GO:1903440 | calcitonin family receptor complex(GO:1903439) amylin receptor complex(GO:1903440) |
| 0.0 | 0.8 | GO:0030119 | AP-type membrane coat adaptor complex(GO:0030119) |
| 0.0 | 0.1 | GO:0031143 | pseudopodium(GO:0031143) |
| 0.0 | 0.3 | GO:0030008 | TRAPP complex(GO:0030008) |
| 0.0 | 0.1 | GO:0035838 | growing cell tip(GO:0035838) new growing cell tip(GO:0035841) |
| 0.0 | 0.6 | GO:0015030 | Cajal body(GO:0015030) |
| 0.0 | 0.2 | GO:0005662 | DNA replication factor A complex(GO:0005662) |
| 0.0 | 0.2 | GO:0001741 | XY body(GO:0001741) |
| 0.0 | 0.1 | GO:0031466 | Cul5-RING ubiquitin ligase complex(GO:0031466) |
| 0.0 | 0.1 | GO:0043083 | synaptic cleft(GO:0043083) |
| 0.0 | 0.5 | GO:0032391 | photoreceptor connecting cilium(GO:0032391) |
| 0.0 | 0.4 | GO:0035145 | exon-exon junction complex(GO:0035145) |
| 0.0 | 0.4 | GO:0034451 | centriolar satellite(GO:0034451) |
| 0.0 | 1.8 | GO:0016605 | PML body(GO:0016605) |
| 0.0 | 0.3 | GO:0032590 | dendrite membrane(GO:0032590) |
| 0.0 | 0.7 | GO:0009925 | basal plasma membrane(GO:0009925) |
| 0.0 | 0.8 | GO:0008180 | COP9 signalosome(GO:0008180) |
| 0.0 | 0.3 | GO:0097381 | photoreceptor disc membrane(GO:0097381) |
| 0.0 | 0.2 | GO:0042405 | nuclear inclusion body(GO:0042405) |
| 0.0 | 0.9 | GO:0005782 | peroxisomal matrix(GO:0005782) microbody lumen(GO:0031907) |
| 0.0 | 0.3 | GO:0031231 | integral component of peroxisomal membrane(GO:0005779) intrinsic component of peroxisomal membrane(GO:0031231) |
| 0.0 | 0.1 | GO:0031515 | tRNA (m1A) methyltransferase complex(GO:0031515) |
| 0.0 | 0.0 | GO:0051286 | cell tip(GO:0051286) |
| 0.0 | 0.2 | GO:0090543 | Flemming body(GO:0090543) |
| 0.0 | 2.3 | GO:1904813 | ficolin-1-rich granule(GO:0101002) ficolin-1-rich granule lumen(GO:1904813) |
| 0.0 | 0.1 | GO:0008091 | spectrin(GO:0008091) |
| 0.0 | 0.1 | GO:0009331 | glycerol-3-phosphate dehydrogenase complex(GO:0009331) |
| 0.0 | 0.3 | GO:0000930 | gamma-tubulin complex(GO:0000930) |
| 0.0 | 0.1 | GO:0032937 | SREBP-SCAP-Insig complex(GO:0032937) |
| 0.0 | 0.1 | GO:0071012 | catalytic step 1 spliceosome(GO:0071012) |
| 0.0 | 0.1 | GO:0005851 | eukaryotic translation initiation factor 2B complex(GO:0005851) |
| 0.0 | 0.0 | GO:0090498 | extrinsic component of Golgi membrane(GO:0090498) |
| 0.0 | 0.1 | GO:0071144 | SMAD2-SMAD3 protein complex(GO:0071144) |
| 0.0 | 0.3 | GO:0005689 | U12-type spliceosomal complex(GO:0005689) |
| 0.0 | 1.4 | GO:0005814 | centriole(GO:0005814) |
| 0.0 | 0.2 | GO:0031105 | septin complex(GO:0031105) |
| 0.0 | 0.3 | GO:0005666 | DNA-directed RNA polymerase III complex(GO:0005666) |
| 0.0 | 0.1 | GO:0071203 | WASH complex(GO:0071203) |
| 0.0 | 0.1 | GO:0043190 | ATP-binding cassette (ABC) transporter complex(GO:0043190) |
| 0.0 | 0.2 | GO:0070821 | tertiary granule membrane(GO:0070821) |
| 0.0 | 1.1 | GO:0005777 | peroxisome(GO:0005777) microbody(GO:0042579) |
| 0.0 | 0.2 | GO:0035371 | microtubule plus-end(GO:0035371) |
| 0.0 | 0.4 | GO:0005680 | anaphase-promoting complex(GO:0005680) |
| 0.0 | 0.2 | GO:0031235 | intrinsic component of the cytoplasmic side of the plasma membrane(GO:0031235) |
| 0.0 | 0.1 | GO:0070847 | core mediator complex(GO:0070847) |
| 0.0 | 0.5 | GO:0071013 | catalytic step 2 spliceosome(GO:0071013) |
| 0.0 | 0.1 | GO:0033179 | proton-transporting V-type ATPase, V0 domain(GO:0033179) |
Gene overrepresentation in molecular_function category:
| Log-likelihood per target | Total log-likelihood | Term | Description |
|---|---|---|---|
| 0.8 | 2.5 | GO:0008330 | protein tyrosine/threonine phosphatase activity(GO:0008330) |
| 0.8 | 2.3 | GO:0004392 | heme oxygenase (decyclizing) activity(GO:0004392) |
| 0.7 | 2.2 | GO:0004370 | glycerol kinase activity(GO:0004370) |
| 0.6 | 3.9 | GO:0008321 | Ral guanyl-nucleotide exchange factor activity(GO:0008321) |
| 0.5 | 2.1 | GO:0004616 | phosphogluconate dehydrogenase (decarboxylating) activity(GO:0004616) |
| 0.5 | 1.5 | GO:0005483 | soluble NSF attachment protein activity(GO:0005483) |
| 0.5 | 5.1 | GO:0031419 | cobalamin binding(GO:0031419) |
| 0.5 | 2.3 | GO:0004949 | cannabinoid receptor activity(GO:0004949) |
| 0.4 | 1.2 | GO:0070538 | oleic acid binding(GO:0070538) |
| 0.4 | 2.4 | GO:0035402 | histone kinase activity (H3-T11 specific)(GO:0035402) |
| 0.4 | 1.1 | GO:0043739 | G/U mismatch-specific uracil-DNA glycosylase activity(GO:0043739) |
| 0.3 | 1.0 | GO:0016652 | NAD(P)+ transhydrogenase activity(GO:0008746) oxidoreductase activity, acting on NAD(P)H, NAD(P) as acceptor(GO:0016652) |
| 0.3 | 1.7 | GO:0004348 | glucosylceramidase activity(GO:0004348) |
| 0.3 | 4.8 | GO:0031681 | G-protein beta-subunit binding(GO:0031681) |
| 0.3 | 3.5 | GO:0051434 | BH3 domain binding(GO:0051434) |
| 0.3 | 1.5 | GO:0050436 | microfibril binding(GO:0050436) |
| 0.3 | 0.9 | GO:0032767 | copper-dependent protein binding(GO:0032767) |
| 0.3 | 1.2 | GO:0047391 | alkylglycerophosphoethanolamine phosphodiesterase activity(GO:0047391) |
| 0.3 | 2.7 | GO:0016015 | morphogen activity(GO:0016015) |
| 0.3 | 2.4 | GO:0008559 | xenobiotic-transporting ATPase activity(GO:0008559) |
| 0.2 | 1.1 | GO:0004720 | protein-lysine 6-oxidase activity(GO:0004720) |
| 0.2 | 2.0 | GO:0043426 | MRF binding(GO:0043426) |
| 0.2 | 1.3 | GO:0042030 | ATPase inhibitor activity(GO:0042030) |
| 0.2 | 0.6 | GO:0052810 | 1-phosphatidylinositol-5-kinase activity(GO:0052810) |
| 0.2 | 1.7 | GO:0001875 | lipopolysaccharide receptor activity(GO:0001875) |
| 0.2 | 1.5 | GO:0034597 | phosphatidylinositol-4,5-bisphosphate 4-phosphatase activity(GO:0034597) |
| 0.2 | 0.5 | GO:0030550 | acetylcholine receptor inhibitor activity(GO:0030550) |
| 0.2 | 1.1 | GO:0004024 | alcohol dehydrogenase activity, zinc-dependent(GO:0004024) |
| 0.2 | 1.0 | GO:0004800 | thyroxine 5'-deiodinase activity(GO:0004800) |
| 0.2 | 2.2 | GO:0004030 | aldehyde dehydrogenase [NAD(P)+] activity(GO:0004030) |
| 0.2 | 1.0 | GO:0019776 | Atg8 ligase activity(GO:0019776) |
| 0.2 | 1.5 | GO:0016997 | exo-alpha-sialidase activity(GO:0004308) alpha-sialidase activity(GO:0016997) |
| 0.2 | 1.0 | GO:0008449 | N-acetylglucosamine-6-sulfatase activity(GO:0008449) |
| 0.2 | 0.5 | GO:0008309 | double-stranded DNA exodeoxyribonuclease activity(GO:0008309) |
| 0.2 | 8.6 | GO:0050699 | WW domain binding(GO:0050699) |
| 0.1 | 0.6 | GO:0016230 | sphingomyelin phosphodiesterase activator activity(GO:0016230) |
| 0.1 | 1.0 | GO:0004634 | phosphopyruvate hydratase activity(GO:0004634) |
| 0.1 | 0.7 | GO:1990460 | leptin receptor binding(GO:1990460) |
| 0.1 | 0.7 | GO:0047961 | glycine N-acyltransferase activity(GO:0047961) |
| 0.1 | 1.5 | GO:0031995 | insulin-like growth factor II binding(GO:0031995) |
| 0.1 | 0.4 | GO:0043891 | glyceraldehyde-3-phosphate dehydrogenase (NAD+) (phosphorylating) activity(GO:0004365) glyceraldehyde-3-phosphate dehydrogenase (NAD(P)+) (phosphorylating) activity(GO:0043891) |
| 0.1 | 0.5 | GO:0043398 | HLH domain binding(GO:0043398) |
| 0.1 | 0.4 | GO:0004853 | uroporphyrinogen decarboxylase activity(GO:0004853) |
| 0.1 | 0.5 | GO:0061628 | H3K27me3 modified histone binding(GO:0061628) |
| 0.1 | 0.5 | GO:0044388 | small protein activating enzyme binding(GO:0044388) |
| 0.1 | 0.5 | GO:0050309 | glucose-6-phosphatase activity(GO:0004346) sugar-terminal-phosphatase activity(GO:0050309) |
| 0.1 | 4.1 | GO:0070273 | phosphatidylinositol-4-phosphate binding(GO:0070273) |
| 0.1 | 3.6 | GO:0000900 | translation repressor activity, nucleic acid binding(GO:0000900) |
| 0.1 | 0.7 | GO:0003998 | acylphosphatase activity(GO:0003998) |
| 0.1 | 9.1 | GO:0005507 | copper ion binding(GO:0005507) |
| 0.1 | 0.9 | GO:0050692 | DBD domain binding(GO:0050692) |
| 0.1 | 0.6 | GO:0016822 | hydrolase activity, acting on acid carbon-carbon bonds(GO:0016822) hydrolase activity, acting on acid carbon-carbon bonds, in ketonic substances(GO:0016823) |
| 0.1 | 1.7 | GO:0008179 | adenylate cyclase binding(GO:0008179) |
| 0.1 | 2.7 | GO:0000062 | fatty-acyl-CoA binding(GO:0000062) |
| 0.1 | 0.3 | GO:0008466 | glycogenin glucosyltransferase activity(GO:0008466) |
| 0.1 | 0.6 | GO:0033989 | 3alpha,7alpha,12alpha-trihydroxy-5beta-cholest-24-enoyl-CoA hydratase activity(GO:0033989) 17-beta-hydroxysteroid dehydrogenase (NAD+) activity(GO:0044594) |
| 0.1 | 2.0 | GO:0005095 | GTPase inhibitor activity(GO:0005095) |
| 0.1 | 0.4 | GO:0042132 | fructose 1,6-bisphosphate 1-phosphatase activity(GO:0042132) |
| 0.1 | 0.3 | GO:0070579 | methylcytosine dioxygenase activity(GO:0070579) |
| 0.1 | 1.0 | GO:0019531 | oxalate transmembrane transporter activity(GO:0019531) |
| 0.1 | 0.8 | GO:0071933 | Arp2/3 complex binding(GO:0071933) |
| 0.1 | 0.3 | GO:0004740 | pyruvate dehydrogenase (acetyl-transferring) kinase activity(GO:0004740) |
| 0.1 | 0.8 | GO:0031386 | protein tag(GO:0031386) |
| 0.1 | 0.2 | GO:0015439 | heme-transporting ATPase activity(GO:0015439) |
| 0.1 | 0.2 | GO:0004915 | interleukin-6 receptor activity(GO:0004915) interleukin-6 binding(GO:0019981) |
| 0.1 | 0.2 | GO:0004416 | hydroxyacylglutathione hydrolase activity(GO:0004416) |
| 0.1 | 0.2 | GO:0001223 | transcription coactivator binding(GO:0001223) |
| 0.1 | 0.1 | GO:0000104 | succinate dehydrogenase activity(GO:0000104) |
| 0.1 | 0.3 | GO:0036033 | mediator complex binding(GO:0036033) |
| 0.1 | 0.2 | GO:0033867 | Fas-activated serine/threonine kinase activity(GO:0033867) |
| 0.1 | 0.4 | GO:0043183 | vascular endothelial growth factor receptor 1 binding(GO:0043183) |
| 0.1 | 0.3 | GO:0008384 | IkappaB kinase activity(GO:0008384) |
| 0.1 | 0.8 | GO:0035374 | chondroitin sulfate binding(GO:0035374) |
| 0.1 | 1.1 | GO:0005522 | profilin binding(GO:0005522) |
| 0.1 | 0.3 | GO:0016796 | exonuclease activity, active with either ribo- or deoxyribonucleic acids and producing 5'-phosphomonoesters(GO:0016796) |
| 0.1 | 0.4 | GO:0008597 | calcium-dependent protein serine/threonine phosphatase regulator activity(GO:0008597) |
| 0.1 | 3.6 | GO:0042169 | SH2 domain binding(GO:0042169) |
| 0.1 | 0.5 | GO:0019763 | immunoglobulin receptor activity(GO:0019763) |
| 0.1 | 0.7 | GO:0031852 | mu-type opioid receptor binding(GO:0031852) |
| 0.1 | 2.0 | GO:0070577 | lysine-acetylated histone binding(GO:0070577) |
| 0.1 | 2.3 | GO:0005109 | frizzled binding(GO:0005109) |
| 0.1 | 0.2 | GO:0019789 | SUMO transferase activity(GO:0019789) |
| 0.1 | 0.8 | GO:0046972 | histone acetyltransferase activity (H4-K5 specific)(GO:0043995) histone acetyltransferase activity (H4-K8 specific)(GO:0043996) histone acetyltransferase activity (H4-K16 specific)(GO:0046972) |
| 0.1 | 0.4 | GO:0003997 | acyl-CoA oxidase activity(GO:0003997) |
| 0.0 | 3.0 | GO:0070888 | E-box binding(GO:0070888) |
| 0.0 | 0.5 | GO:0003910 | DNA ligase (ATP) activity(GO:0003910) |
| 0.0 | 0.3 | GO:0061649 | ubiquitinated histone binding(GO:0061649) |
| 0.0 | 1.1 | GO:0043495 | protein anchor(GO:0043495) |
| 0.0 | 1.4 | GO:0048027 | mRNA 5'-UTR binding(GO:0048027) |
| 0.0 | 2.2 | GO:0016538 | cyclin-dependent protein serine/threonine kinase regulator activity(GO:0016538) |
| 0.0 | 0.2 | GO:0004727 | prenylated protein tyrosine phosphatase activity(GO:0004727) |
| 0.0 | 0.2 | GO:1990189 | peptide-serine-N-acetyltransferase activity(GO:1990189) |
| 0.0 | 0.3 | GO:0032138 | single base insertion or deletion binding(GO:0032138) |
| 0.0 | 1.8 | GO:0046966 | thyroid hormone receptor binding(GO:0046966) |
| 0.0 | 0.1 | GO:0005314 | high-affinity glutamate transmembrane transporter activity(GO:0005314) |
| 0.0 | 0.2 | GO:0047298 | 4-aminobutyrate transaminase activity(GO:0003867) succinate-semialdehyde dehydrogenase binding(GO:0032145) (S)-3-amino-2-methylpropionate transaminase activity(GO:0047298) |
| 0.0 | 0.2 | GO:0015166 | polyol transmembrane transporter activity(GO:0015166) |
| 0.0 | 0.2 | GO:0070087 | chromo shadow domain binding(GO:0070087) |
| 0.0 | 0.2 | GO:0004594 | pantothenate kinase activity(GO:0004594) |
| 0.0 | 0.3 | GO:0070740 | tubulin-glutamic acid ligase activity(GO:0070740) |
| 0.0 | 1.1 | GO:0051010 | microtubule plus-end binding(GO:0051010) |
| 0.0 | 1.0 | GO:0005247 | voltage-gated chloride channel activity(GO:0005247) |
| 0.0 | 0.2 | GO:0001010 | transcription factor activity, sequence-specific DNA binding transcription factor recruiting(GO:0001010) |
| 0.0 | 0.2 | GO:0034057 | RNA strand-exchange activity(GO:0034057) |
| 0.0 | 0.4 | GO:0019784 | SUMO-specific protease activity(GO:0016929) NEDD8-specific protease activity(GO:0019784) |
| 0.0 | 0.2 | GO:1990050 | phosphatidic acid transporter activity(GO:1990050) |
| 0.0 | 2.2 | GO:0004402 | histone acetyltransferase activity(GO:0004402) |
| 0.0 | 1.9 | GO:0061631 | ubiquitin conjugating enzyme activity(GO:0061631) ubiquitin-like protein conjugating enzyme activity(GO:0061650) |
| 0.0 | 0.2 | GO:0051032 | nucleic acid transmembrane transporter activity(GO:0051032) RNA transmembrane transporter activity(GO:0051033) |
| 0.0 | 0.1 | GO:0003990 | acetylcholinesterase activity(GO:0003990) |
| 0.0 | 0.7 | GO:0015250 | water channel activity(GO:0015250) |
| 0.0 | 0.2 | GO:0003886 | DNA (cytosine-5-)-methyltransferase activity(GO:0003886) |
| 0.0 | 3.9 | GO:0050660 | flavin adenine dinucleotide binding(GO:0050660) |
| 0.0 | 0.5 | GO:0019870 | potassium channel inhibitor activity(GO:0019870) |
| 0.0 | 0.3 | GO:0031730 | CCR5 chemokine receptor binding(GO:0031730) |
| 0.0 | 4.3 | GO:0004860 | protein kinase inhibitor activity(GO:0004860) |
| 0.0 | 0.1 | GO:0008603 | cAMP-dependent protein kinase regulator activity(GO:0008603) |
| 0.0 | 0.1 | GO:0004828 | serine-tRNA ligase activity(GO:0004828) |
| 0.0 | 1.6 | GO:0031624 | ubiquitin conjugating enzyme binding(GO:0031624) |
| 0.0 | 0.3 | GO:0004565 | beta-galactosidase activity(GO:0004565) |
| 0.0 | 0.1 | GO:0035651 | AP-3 adaptor complex binding(GO:0035651) |
| 0.0 | 3.2 | GO:0004722 | protein serine/threonine phosphatase activity(GO:0004722) |
| 0.0 | 1.0 | GO:0050750 | low-density lipoprotein particle receptor binding(GO:0050750) |
| 0.0 | 0.7 | GO:0004535 | poly(A)-specific ribonuclease activity(GO:0004535) |
| 0.0 | 0.5 | GO:0000979 | RNA polymerase II core promoter sequence-specific DNA binding(GO:0000979) |
| 0.0 | 0.5 | GO:0032794 | GTPase activating protein binding(GO:0032794) |
| 0.0 | 0.1 | GO:0033300 | L-ascorbate:sodium symporter activity(GO:0008520) L-ascorbic acid transporter activity(GO:0015229) dehydroascorbic acid transporter activity(GO:0033300) sodium-dependent L-ascorbate transmembrane transporter activity(GO:0070890) |
| 0.0 | 0.1 | GO:0050510 | N-acetylgalactosaminyl-proteoglycan 3-beta-glucuronosyltransferase activity(GO:0050510) |
| 0.0 | 0.2 | GO:0048039 | ubiquinone binding(GO:0048039) |
| 0.0 | 0.8 | GO:0005086 | ARF guanyl-nucleotide exchange factor activity(GO:0005086) |
| 0.0 | 1.6 | GO:0008138 | protein tyrosine/serine/threonine phosphatase activity(GO:0008138) |
| 0.0 | 0.2 | GO:0038052 | RNA polymerase II transcription factor activity, estrogen-activated sequence-specific DNA binding(GO:0038052) |
| 0.0 | 0.1 | GO:0001160 | transcription termination site sequence-specific DNA binding(GO:0001147) transcription termination site DNA binding(GO:0001160) |
| 0.0 | 0.6 | GO:0080025 | phosphatidylinositol-3,5-bisphosphate binding(GO:0080025) |
| 0.0 | 0.8 | GO:0005388 | calcium-transporting ATPase activity(GO:0005388) |
| 0.0 | 0.2 | GO:0003917 | DNA topoisomerase type I activity(GO:0003917) |
| 0.0 | 0.3 | GO:0004791 | thioredoxin-disulfide reductase activity(GO:0004791) |
| 0.0 | 0.4 | GO:0008429 | phosphatidylethanolamine binding(GO:0008429) |
| 0.0 | 0.2 | GO:0000064 | L-ornithine transmembrane transporter activity(GO:0000064) |
| 0.0 | 0.1 | GO:0031871 | proteinase activated receptor binding(GO:0031871) |
| 0.0 | 0.3 | GO:0003857 | 3-hydroxyacyl-CoA dehydrogenase activity(GO:0003857) |
| 0.0 | 0.8 | GO:0004602 | glutathione peroxidase activity(GO:0004602) |
| 0.0 | 0.8 | GO:0005089 | Rho guanyl-nucleotide exchange factor activity(GO:0005089) |
| 0.0 | 0.1 | GO:0008386 | cholesterol monooxygenase (side-chain-cleaving) activity(GO:0008386) |
| 0.0 | 0.2 | GO:0008568 | microtubule-severing ATPase activity(GO:0008568) |
| 0.0 | 0.4 | GO:0008353 | RNA polymerase II carboxy-terminal domain kinase activity(GO:0008353) |
| 0.0 | 0.2 | GO:0048018 | receptor agonist activity(GO:0048018) |
| 0.0 | 0.1 | GO:0070735 | protein-glycine ligase activity(GO:0070735) |
| 0.0 | 0.2 | GO:0004677 | DNA-dependent protein kinase activity(GO:0004677) |
| 0.0 | 0.1 | GO:0004663 | Rab geranylgeranyltransferase activity(GO:0004663) |
| 0.0 | 0.1 | GO:0070404 | NADH binding(GO:0070404) |
| 0.0 | 0.5 | GO:0004707 | MAP kinase activity(GO:0004707) |
| 0.0 | 0.1 | GO:0000253 | 3-keto sterol reductase activity(GO:0000253) |
| 0.0 | 0.1 | GO:0005119 | smoothened binding(GO:0005119) |
| 0.0 | 0.1 | GO:0031728 | CCR3 chemokine receptor binding(GO:0031728) |
| 0.0 | 0.2 | GO:0035612 | AP-2 adaptor complex binding(GO:0035612) |
| 0.0 | 0.1 | GO:0008240 | tripeptidyl-peptidase activity(GO:0008240) |
| 0.0 | 0.1 | GO:0035515 | oxidative RNA demethylase activity(GO:0035515) |
| 0.0 | 0.1 | GO:0047275 | glucosaminylgalactosylglucosylceramide beta-galactosyltransferase activity(GO:0047275) |
| 0.0 | 0.1 | GO:0047783 | steroid 11-beta-monooxygenase activity(GO:0004507) corticosterone 18-monooxygenase activity(GO:0047783) |
| 0.0 | 0.1 | GO:0097643 | amylin receptor activity(GO:0097643) |
| 0.0 | 0.2 | GO:0008467 | [heparan sulfate]-glucosamine 3-sulfotransferase 1 activity(GO:0008467) |
| 0.0 | 1.1 | GO:0050136 | NADH dehydrogenase (ubiquinone) activity(GO:0008137) NADH dehydrogenase (quinone) activity(GO:0050136) |
| 0.0 | 0.3 | GO:0015467 | G-protein activated inward rectifier potassium channel activity(GO:0015467) |
| 0.0 | 0.2 | GO:0008379 | thioredoxin peroxidase activity(GO:0008379) |
| 0.0 | 2.3 | GO:0008565 | protein transporter activity(GO:0008565) |
| 0.0 | 0.2 | GO:0015279 | store-operated calcium channel activity(GO:0015279) |
| 0.0 | 1.6 | GO:0030276 | clathrin binding(GO:0030276) |
| 0.0 | 0.2 | GO:0004332 | fructose-bisphosphate aldolase activity(GO:0004332) |
| 0.0 | 0.5 | GO:0004298 | threonine-type endopeptidase activity(GO:0004298) threonine-type peptidase activity(GO:0070003) |
| 0.0 | 0.3 | GO:0017154 | semaphorin receptor activity(GO:0017154) |
| 0.0 | 0.4 | GO:0016805 | dipeptidase activity(GO:0016805) |
| 0.0 | 0.1 | GO:0072345 | NAADP-sensitive calcium-release channel activity(GO:0072345) |
| 0.0 | 0.1 | GO:0004322 | ferroxidase activity(GO:0004322) oxidoreductase activity, oxidizing metal ions, oxygen as acceptor(GO:0016724) |
| 0.0 | 0.1 | GO:0001784 | phosphotyrosine binding(GO:0001784) |
| 0.0 | 0.1 | GO:0097677 | STAT family protein binding(GO:0097677) |
| 0.0 | 0.1 | GO:0047623 | AMP deaminase activity(GO:0003876) adenosine-phosphate deaminase activity(GO:0047623) |
| 0.0 | 0.2 | GO:0051378 | amine binding(GO:0043176) serotonin binding(GO:0051378) |
| 0.0 | 0.7 | GO:0015485 | cholesterol binding(GO:0015485) |
| 0.0 | 0.5 | GO:0008378 | galactosyltransferase activity(GO:0008378) |
| 0.0 | 0.2 | GO:0016861 | intramolecular oxidoreductase activity, interconverting aldoses and ketoses(GO:0016861) |
| 0.0 | 0.1 | GO:0046976 | histone methyltransferase activity (H3-K27 specific)(GO:0046976) |
| 0.0 | 0.2 | GO:0070530 | K63-linked polyubiquitin binding(GO:0070530) |
| 0.0 | 0.4 | GO:0005212 | structural constituent of eye lens(GO:0005212) |
| 0.0 | 0.2 | GO:0016922 | ligand-dependent nuclear receptor binding(GO:0016922) |
| 0.0 | 0.7 | GO:0042162 | telomeric DNA binding(GO:0042162) |
| 0.0 | 0.1 | GO:0010997 | anaphase-promoting complex binding(GO:0010997) |
| 0.0 | 0.2 | GO:0003836 | beta-galactoside (CMP) alpha-2,3-sialyltransferase activity(GO:0003836) |
| 0.0 | 0.9 | GO:0043130 | ubiquitin binding(GO:0043130) |
| 0.0 | 0.3 | GO:0001056 | RNA polymerase III activity(GO:0001056) |
| 0.0 | 0.1 | GO:0016681 | ubiquinol-cytochrome-c reductase activity(GO:0008121) oxidoreductase activity, acting on diphenols and related substances as donors, cytochrome as acceptor(GO:0016681) |
| 0.0 | 0.3 | GO:0008510 | sodium:bicarbonate symporter activity(GO:0008510) |
| 0.0 | 0.2 | GO:0071837 | HMG box domain binding(GO:0071837) |
| 0.0 | 0.0 | GO:0000285 | 1-phosphatidylinositol-3-phosphate 5-kinase activity(GO:0000285) |
| 0.0 | 0.1 | GO:0044729 | hemi-methylated DNA-binding(GO:0044729) |
| 0.0 | 0.3 | GO:0003746 | translation elongation factor activity(GO:0003746) |
| 0.0 | 0.1 | GO:0042974 | retinoic acid receptor binding(GO:0042974) |
| 0.0 | 0.0 | GO:0016812 | hydrolase activity, acting on carbon-nitrogen (but not peptide) bonds, in cyclic amides(GO:0016812) |
| 0.0 | 0.4 | GO:0047555 | 3',5'-cyclic-GMP phosphodiesterase activity(GO:0047555) |
| 0.0 | 0.0 | GO:0061676 | importin-alpha family protein binding(GO:0061676) |
| 0.0 | 2.2 | GO:0001078 | transcriptional repressor activity, RNA polymerase II core promoter proximal region sequence-specific binding(GO:0001078) |
| 0.0 | 0.0 | GO:0071535 | RING-like zinc finger domain binding(GO:0071535) |
| 0.0 | 0.1 | GO:1990247 | N6-methyladenosine-containing RNA binding(GO:1990247) |
| 0.0 | 0.4 | GO:0043539 | protein serine/threonine kinase activator activity(GO:0043539) |
| 0.0 | 0.0 | GO:0008422 | beta-glucosidase activity(GO:0008422) |
| 0.0 | 0.9 | GO:0008094 | DNA-dependent ATPase activity(GO:0008094) |
| 0.0 | 0.1 | GO:0086077 | gap junction channel activity involved in AV node cell-bundle of His cell electrical coupling(GO:0086077) |
Gene overrepresentation in C2:CP category:
| Log-likelihood per target | Total log-likelihood | Term | Description |
|---|---|---|---|
| 0.3 | 5.4 | PID P38 GAMMA DELTA PATHWAY | Signaling mediated by p38-gamma and p38-delta |
| 0.1 | 3.5 | SA PROGRAMMED CELL DEATH | Programmed cell death, or apoptosis, eliminates damaged or unneeded cells. |
| 0.1 | 3.4 | PID WNT CANONICAL PATHWAY | Canonical Wnt signaling pathway |
| 0.1 | 1.7 | SA REG CASCADE OF CYCLIN EXPR | Expression of cyclins regulates progression through the cell cycle by activating cyclin-dependent kinases. |
| 0.1 | 4.0 | PID MYC PATHWAY | C-MYC pathway |
| 0.1 | 0.6 | ST STAT3 PATHWAY | STAT3 Pathway |
| 0.1 | 0.9 | ST TYPE I INTERFERON PATHWAY | Type I Interferon (alpha/beta IFN) Pathway |
| 0.1 | 1.9 | PID TOLL ENDOGENOUS PATHWAY | Endogenous TLR signaling |
| 0.0 | 2.6 | PID NCADHERIN PATHWAY | N-cadherin signaling events |
| 0.0 | 4.6 | PID IL4 2PATHWAY | IL4-mediated signaling events |
| 0.0 | 2.5 | PID P38 ALPHA BETA PATHWAY | Regulation of p38-alpha and p38-beta |
| 0.0 | 1.2 | PID P38 MKK3 6PATHWAY | p38 MAPK signaling pathway |
| 0.0 | 0.6 | PID ECADHERIN KERATINOCYTE PATHWAY | E-cadherin signaling in keratinocytes |
| 0.0 | 1.7 | PID AURORA A PATHWAY | Aurora A signaling |
| 0.0 | 0.4 | ST INTERLEUKIN 4 PATHWAY | Interleukin 4 (IL-4) Pathway |
| 0.0 | 2.6 | PID ILK PATHWAY | Integrin-linked kinase signaling |
| 0.0 | 3.8 | PID HIF1 TFPATHWAY | HIF-1-alpha transcription factor network |
| 0.0 | 0.7 | PID ATM PATHWAY | ATM pathway |
| 0.0 | 0.4 | ST PHOSPHOINOSITIDE 3 KINASE PATHWAY | PI3K Pathway |
| 0.0 | 1.6 | PID RET PATHWAY | Signaling events regulated by Ret tyrosine kinase |
| 0.0 | 1.5 | PID ECADHERIN STABILIZATION PATHWAY | Stabilization and expansion of the E-cadherin adherens junction |
| 0.0 | 1.7 | NABA PROTEOGLYCANS | Genes encoding proteoglycans |
| 0.0 | 0.2 | PID PI3KCI PATHWAY | Class I PI3K signaling events |
| 0.0 | 2.5 | PID MTOR 4PATHWAY | mTOR signaling pathway |
| 0.0 | 2.2 | PID RB 1PATHWAY | Regulation of retinoblastoma protein |
| 0.0 | 0.4 | PID PTP1B PATHWAY | Signaling events mediated by PTP1B |
| 0.0 | 0.4 | PID VEGF VEGFR PATHWAY | VEGF and VEGFR signaling network |
| 0.0 | 1.6 | PID CMYB PATHWAY | C-MYB transcription factor network |
| 0.0 | 0.4 | PID ERB GENOMIC PATHWAY | Validated nuclear estrogen receptor beta network |
| 0.0 | 0.2 | PID FAS PATHWAY | FAS (CD95) signaling pathway |
| 0.0 | 1.9 | PID CASPASE PATHWAY | Caspase cascade in apoptosis |
| 0.0 | 0.4 | PID RAS PATHWAY | Regulation of Ras family activation |
| 0.0 | 0.5 | ST ERK1 ERK2 MAPK PATHWAY | ERK1/ERK2 MAPK Pathway |
| 0.0 | 4.7 | NABA ECM AFFILIATED | Genes encoding proteins affiliated structurally or functionally to extracellular matrix proteins |
| 0.0 | 0.7 | PID THROMBIN PAR1 PATHWAY | PAR1-mediated thrombin signaling events |
| 0.0 | 0.4 | PID HIF2PATHWAY | HIF-2-alpha transcription factor network |
| 0.0 | 0.6 | PID IL8 CXCR1 PATHWAY | IL8- and CXCR1-mediated signaling events |
| 0.0 | 0.3 | ST G ALPHA S PATHWAY | G alpha s Pathway |
| 0.0 | 0.6 | PID WNT SIGNALING PATHWAY | Wnt signaling network |
| 0.0 | 0.7 | PID LYSOPHOSPHOLIPID PATHWAY | LPA receptor mediated events |
| 0.0 | 0.4 | PID PRL SIGNALING EVENTS PATHWAY | Signaling events mediated by PRL |
| 0.0 | 0.0 | PID S1P S1P2 PATHWAY | S1P2 pathway |
| 0.0 | 0.7 | PID HDAC CLASSII PATHWAY | Signaling events mediated by HDAC Class II |
| 0.0 | 0.7 | PID INTEGRIN A4B1 PATHWAY | Alpha4 beta1 integrin signaling events |
| 0.0 | 0.7 | PID RAC1 PATHWAY | RAC1 signaling pathway |
| 0.0 | 1.3 | PID MYC REPRESS PATHWAY | Validated targets of C-MYC transcriptional repression |
| 0.0 | 0.2 | PID RHOA PATHWAY | RhoA signaling pathway |
| 0.0 | 0.6 | PID HNF3B PATHWAY | FOXA2 and FOXA3 transcription factor networks |
| 0.0 | 0.4 | ST WNT CA2 CYCLIC GMP PATHWAY | Wnt/Ca2+/cyclic GMP signaling. |
| 0.0 | 0.2 | PID PS1 PATHWAY | Presenilin action in Notch and Wnt signaling |
| 0.0 | 0.3 | PID TRKR PATHWAY | Neurotrophic factor-mediated Trk receptor signaling |
| 0.0 | 0.7 | PID IL12 2PATHWAY | IL12-mediated signaling events |
| 0.0 | 0.5 | PID CDC42 REG PATHWAY | Regulation of CDC42 activity |
| 0.0 | 0.1 | PID INSULIN GLUCOSE PATHWAY | Insulin-mediated glucose transport |
Gene overrepresentation in C2:CP:REACTOME category:
| Log-likelihood per target | Total log-likelihood | Term | Description |
|---|---|---|---|
| 0.2 | 7.6 | REACTOME LYSOSOME VESICLE BIOGENESIS | Genes involved in Lysosome Vesicle Biogenesis |
| 0.1 | 1.9 | REACTOME IKK COMPLEX RECRUITMENT MEDIATED BY RIP1 | Genes involved in IKK complex recruitment mediated by RIP1 |
| 0.1 | 2.7 | REACTOME SIGNALING BY HIPPO | Genes involved in Signaling by Hippo |
| 0.1 | 2.2 | REACTOME METABOLISM OF PORPHYRINS | Genes involved in Metabolism of porphyrins |
| 0.1 | 2.2 | REACTOME BRANCHED CHAIN AMINO ACID CATABOLISM | Genes involved in Branched-chain amino acid catabolism |
| 0.1 | 1.1 | REACTOME ETHANOL OXIDATION | Genes involved in Ethanol oxidation |
| 0.1 | 1.3 | REACTOME BASE FREE SUGAR PHOSPHATE REMOVAL VIA THE SINGLE NUCLEOTIDE REPLACEMENT PATHWAY | Genes involved in Base-free sugar-phosphate removal via the single-nucleotide replacement pathway |
| 0.1 | 1.5 | REACTOME SIGNAL ATTENUATION | Genes involved in Signal attenuation |
| 0.1 | 0.9 | REACTOME PURINE CATABOLISM | Genes involved in Purine catabolism |
| 0.1 | 3.4 | REACTOME INTRINSIC PATHWAY FOR APOPTOSIS | Genes involved in Intrinsic Pathway for Apoptosis |
| 0.1 | 2.5 | REACTOME ABC FAMILY PROTEINS MEDIATED TRANSPORT | Genes involved in ABC-family proteins mediated transport |
| 0.1 | 1.5 | REACTOME CELL EXTRACELLULAR MATRIX INTERACTIONS | Genes involved in Cell-extracellular matrix interactions |
| 0.1 | 1.8 | REACTOME CHONDROITIN SULFATE BIOSYNTHESIS | Genes involved in Chondroitin sulfate biosynthesis |
| 0.0 | 0.7 | REACTOME PASSIVE TRANSPORT BY AQUAPORINS | Genes involved in Passive Transport by Aquaporins |
| 0.0 | 1.0 | REACTOME AMINE DERIVED HORMONES | Genes involved in Amine-derived hormones |
| 0.0 | 0.8 | REACTOME ALPHA LINOLENIC ACID ALA METABOLISM | Genes involved in alpha-linolenic acid (ALA) metabolism |
| 0.0 | 0.6 | REACTOME AKT PHOSPHORYLATES TARGETS IN THE CYTOSOL | Genes involved in AKT phosphorylates targets in the cytosol |
| 0.0 | 0.1 | REACTOME SIGNALLING TO P38 VIA RIT AND RIN | Genes involved in Signalling to p38 via RIT and RIN |
| 0.0 | 1.1 | REACTOME PROSTACYCLIN SIGNALLING THROUGH PROSTACYCLIN RECEPTOR | Genes involved in Prostacyclin signalling through prostacyclin receptor |
| 0.0 | 0.8 | REACTOME FORMATION OF INCISION COMPLEX IN GG NER | Genes involved in Formation of incision complex in GG-NER |
| 0.0 | 3.4 | REACTOME CYCLIN E ASSOCIATED EVENTS DURING G1 S TRANSITION | Genes involved in Cyclin E associated events during G1/S transition |
| 0.0 | 0.6 | REACTOME MITOCHONDRIAL FATTY ACID BETA OXIDATION | Genes involved in Mitochondrial Fatty Acid Beta-Oxidation |
| 0.0 | 1.1 | REACTOME G1 PHASE | Genes involved in G1 Phase |
| 0.0 | 0.6 | REACTOME IL 6 SIGNALING | Genes involved in Interleukin-6 signaling |
| 0.0 | 7.0 | REACTOME G ALPHA I SIGNALLING EVENTS | Genes involved in G alpha (i) signalling events |
| 0.0 | 0.7 | REACTOME CTNNB1 PHOSPHORYLATION CASCADE | Genes involved in Beta-catenin phosphorylation cascade |
| 0.0 | 0.3 | REACTOME COPI MEDIATED TRANSPORT | Genes involved in COPI Mediated Transport |
| 0.0 | 2.9 | REACTOME LOSS OF NLP FROM MITOTIC CENTROSOMES | Genes involved in Loss of Nlp from mitotic centrosomes |
| 0.0 | 0.7 | REACTOME CITRIC ACID CYCLE TCA CYCLE | Genes involved in Citric acid cycle (TCA cycle) |
| 0.0 | 0.8 | REACTOME TERMINATION OF O GLYCAN BIOSYNTHESIS | Genes involved in Termination of O-glycan biosynthesis |
| 0.0 | 0.7 | REACTOME REGULATION OF GENE EXPRESSION IN BETA CELLS | Genes involved in Regulation of gene expression in beta cells |
| 0.0 | 0.5 | REACTOME DSCAM INTERACTIONS | Genes involved in DSCAM interactions |
| 0.0 | 1.1 | REACTOME GLYCOLYSIS | Genes involved in Glycolysis |
| 0.0 | 0.9 | REACTOME O LINKED GLYCOSYLATION OF MUCINS | Genes involved in O-linked glycosylation of mucins |
| 0.0 | 0.4 | REACTOME GLUCAGON SIGNALING IN METABOLIC REGULATION | Genes involved in Glucagon signaling in metabolic regulation |
| 0.0 | 0.5 | REACTOME HOMOLOGOUS RECOMBINATION REPAIR OF REPLICATION INDEPENDENT DOUBLE STRAND BREAKS | Genes involved in Homologous recombination repair of replication-independent double-strand breaks |
| 0.0 | 0.5 | REACTOME FORMATION OF ATP BY CHEMIOSMOTIC COUPLING | Genes involved in Formation of ATP by chemiosmotic coupling |
| 0.0 | 0.3 | REACTOME SEMA3A PLEXIN REPULSION SIGNALING BY INHIBITING INTEGRIN ADHESION | Genes involved in SEMA3A-Plexin repulsion signaling by inhibiting Integrin adhesion |
| 0.0 | 0.2 | REACTOME RAS ACTIVATION UOPN CA2 INFUX THROUGH NMDA RECEPTOR | Genes involved in Ras activation uopn Ca2+ infux through NMDA receptor |
| 0.0 | 0.2 | REACTOME G0 AND EARLY G1 | Genes involved in G0 and Early G1 |
| 0.0 | 2.3 | REACTOME MHC CLASS II ANTIGEN PRESENTATION | Genes involved in MHC class II antigen presentation |
| 0.0 | 0.4 | REACTOME VEGF LIGAND RECEPTOR INTERACTIONS | Genes involved in VEGF ligand-receptor interactions |
| 0.0 | 0.1 | REACTOME G BETA GAMMA SIGNALLING THROUGH PLC BETA | Genes involved in G beta:gamma signalling through PLC beta |
| 0.0 | 0.3 | REACTOME INHIBITION OF VOLTAGE GATED CA2 CHANNELS VIA GBETA GAMMA SUBUNITS | Genes involved in Inhibition of voltage gated Ca2+ channels via Gbeta/gamma subunits |
| 0.0 | 1.1 | REACTOME TRIGLYCERIDE BIOSYNTHESIS | Genes involved in Triglyceride Biosynthesis |
| 0.0 | 0.1 | REACTOME REGULATION OF BETA CELL DEVELOPMENT | Genes involved in Regulation of beta-cell development |
| 0.0 | 0.3 | REACTOME RNA POL I TRANSCRIPTION INITIATION | Genes involved in RNA Polymerase I Transcription Initiation |
| 0.0 | 0.7 | REACTOME CIRCADIAN CLOCK | Genes involved in Circadian Clock |
| 0.0 | 0.2 | REACTOME PHOSPHORYLATION OF CD3 AND TCR ZETA CHAINS | Genes involved in Phosphorylation of CD3 and TCR zeta chains |
| 0.0 | 0.5 | REACTOME ENDOSOMAL SORTING COMPLEX REQUIRED FOR TRANSPORT ESCRT | Genes involved in Endosomal Sorting Complex Required For Transport (ESCRT) |
| 0.0 | 1.2 | REACTOME RESPIRATORY ELECTRON TRANSPORT | Genes involved in Respiratory electron transport |
| 0.0 | 0.4 | REACTOME PRE NOTCH TRANSCRIPTION AND TRANSLATION | Genes involved in Pre-NOTCH Transcription and Translation |
| 0.0 | 0.2 | REACTOME REGULATED PROTEOLYSIS OF P75NTR | Genes involved in Regulated proteolysis of p75NTR |
| 0.0 | 3.2 | REACTOME ANTIGEN PROCESSING UBIQUITINATION PROTEASOME DEGRADATION | Genes involved in Antigen processing: Ubiquitination & Proteasome degradation |
| 0.0 | 0.2 | REACTOME SIGNALING BY CONSTITUTIVELY ACTIVE EGFR | Genes involved in Signaling by constitutively active EGFR |
| 0.0 | 0.2 | REACTOME G1 S SPECIFIC TRANSCRIPTION | Genes involved in G1/S-Specific Transcription |
| 0.0 | 1.3 | REACTOME TRANSCRIPTIONAL REGULATION OF WHITE ADIPOCYTE DIFFERENTIATION | Genes involved in Transcriptional Regulation of White Adipocyte Differentiation |
| 0.0 | 0.4 | REACTOME METABOLISM OF CARBOHYDRATES | Genes involved in Metabolism of carbohydrates |
| 0.0 | 0.3 | REACTOME RNA POL III CHAIN ELONGATION | Genes involved in RNA Polymerase III Chain Elongation |
| 0.0 | 0.3 | REACTOME INITIAL TRIGGERING OF COMPLEMENT | Genes involved in Initial triggering of complement |
| 0.0 | 0.7 | REACTOME ION TRANSPORT BY P TYPE ATPASES | Genes involved in Ion transport by P-type ATPases |
| 0.0 | 0.2 | REACTOME CRMPS IN SEMA3A SIGNALING | Genes involved in CRMPs in Sema3A signaling |
| 0.0 | 0.1 | REACTOME LATE PHASE OF HIV LIFE CYCLE | Genes involved in Late Phase of HIV Life Cycle |
| 0.0 | 0.3 | REACTOME GENERATION OF SECOND MESSENGER MOLECULES | Genes involved in Generation of second messenger molecules |
| 0.0 | 0.2 | REACTOME REGULATION OF RHEB GTPASE ACTIVITY BY AMPK | Genes involved in Regulation of Rheb GTPase activity by AMPK |
| 0.0 | 0.3 | REACTOME DOWNREGULATION OF SMAD2 3 SMAD4 TRANSCRIPTIONAL ACTIVITY | Genes involved in Downregulation of SMAD2/3:SMAD4 transcriptional activity |