Project
Epithelial-Mesenchymal Transition, human (Scheel, 2011)
Navigation
Downloads
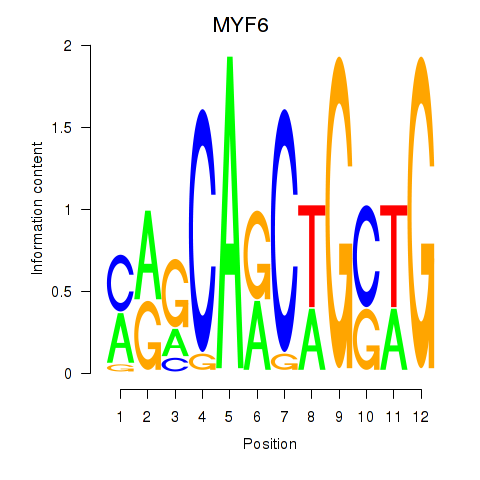
Results for MYF6
Z-value: 0.90
Motif logo
Transcription factors associated with MYF6
| Gene Symbol | Gene ID | Gene Info |
|---|---|---|
|
MYF6
|
ENSG00000111046.3 | MYF6 |
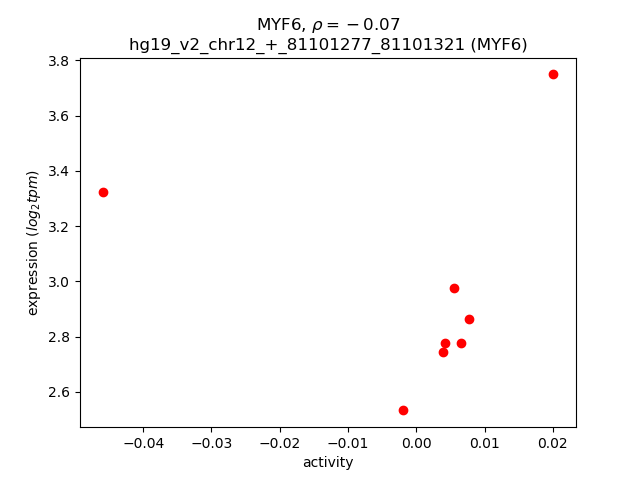
Activity-expression correlation:
| Gene | Promoter | Pearson corr. coef. | P-value | Plot |
|---|---|---|---|---|
| MYF6 | hg19_v2_chr12_+_81101277_81101321 | -0.07 | 8.8e-01 | Click! |
Activity profile of MYF6 motif
Sorted Z-values of MYF6 motif
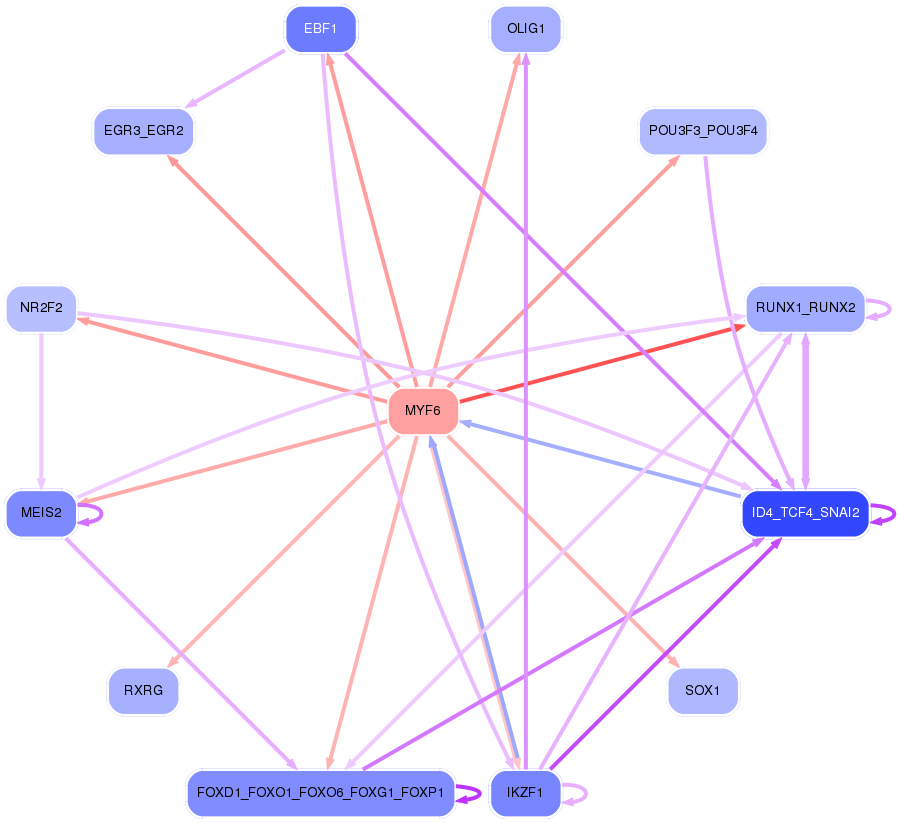
Network of associatons between targets according to the STRING database.

First level regulatory network of MYF6
| Promoter | Score | Transcript | Gene | Gene Info |
|---|---|---|---|---|
| chr1_-_57045228 | 1.77 |
ENST00000371250.3 |
PPAP2B |
phosphatidic acid phosphatase type 2B |
| chr16_+_53133070 | 1.29 |
ENST00000565832.1 |
CHD9 |
chromodomain helicase DNA binding protein 9 |
| chr8_-_23712312 | 1.12 |
ENST00000290271.2 |
STC1 |
stanniocalcin 1 |
| chr7_+_100199800 | 1.02 |
ENST00000223061.5 |
PCOLCE |
procollagen C-endopeptidase enhancer |
| chr2_+_148778570 | 0.96 |
ENST00000407073.1 |
MBD5 |
methyl-CpG binding domain protein 5 |
| chr3_+_110790590 | 0.95 |
ENST00000485303.1 |
PVRL3 |
poliovirus receptor-related 3 |
| chr2_+_11295624 | 0.81 |
ENST00000402361.1 ENST00000428481.1 |
PQLC3 |
PQ loop repeat containing 3 |
| chr17_-_39306054 | 0.79 |
ENST00000343246.4 |
KRTAP4-5 |
keratin associated protein 4-5 |
| chr1_-_236228417 | 0.76 |
ENST00000264187.6 |
NID1 |
nidogen 1 |
| chr1_-_236228403 | 0.74 |
ENST00000366595.3 |
NID1 |
nidogen 1 |
| chr3_+_37284824 | 0.68 |
ENST00000431105.1 |
GOLGA4 |
golgin A4 |
| chr12_+_56075330 | 0.65 |
ENST00000394252.3 |
METTL7B |
methyltransferase like 7B |
| chr17_-_39538550 | 0.65 |
ENST00000394001.1 |
KRT34 |
keratin 34 |
| chr10_-_79397740 | 0.63 |
ENST00000372440.1 ENST00000480683.1 |
KCNMA1 |
potassium large conductance calcium-activated channel, subfamily M, alpha member 1 |
| chr22_-_21905120 | 0.62 |
ENST00000331505.5 |
RIMBP3C |
RIMS binding protein 3C |
| chr2_-_230579185 | 0.61 |
ENST00000341772.4 |
DNER |
delta/notch-like EGF repeat containing |
| chr10_-_79398250 | 0.61 |
ENST00000286627.5 |
KCNMA1 |
potassium large conductance calcium-activated channel, subfamily M, alpha member 1 |
| chr1_-_72748417 | 0.60 |
ENST00000357731.5 |
NEGR1 |
neuronal growth regulator 1 |
| chr1_-_92351769 | 0.60 |
ENST00000212355.4 |
TGFBR3 |
transforming growth factor, beta receptor III |
| chr17_-_39324424 | 0.58 |
ENST00000391356.2 |
KRTAP4-3 |
keratin associated protein 4-3 |
| chr14_-_92414055 | 0.57 |
ENST00000342058.4 |
FBLN5 |
fibulin 5 |
| chr6_+_45390222 | 0.57 |
ENST00000359524.5 |
RUNX2 |
runt-related transcription factor 2 |
| chr10_+_64133934 | 0.56 |
ENST00000395254.3 ENST00000395255.3 ENST00000410046.3 |
ZNF365 |
zinc finger protein 365 |
| chrX_+_86772787 | 0.56 |
ENST00000373114.4 |
KLHL4 |
kelch-like family member 4 |
| chr10_-_90967063 | 0.56 |
ENST00000371852.2 |
CH25H |
cholesterol 25-hydroxylase |
| chr3_+_45067659 | 0.55 |
ENST00000296130.4 |
CLEC3B |
C-type lectin domain family 3, member B |
| chr8_+_104383728 | 0.54 |
ENST00000330295.5 |
CTHRC1 |
collagen triple helix repeat containing 1 |
| chrX_+_86772707 | 0.54 |
ENST00000373119.4 |
KLHL4 |
kelch-like family member 4 |
| chr1_-_231114542 | 0.53 |
ENST00000522821.1 ENST00000366661.4 ENST00000366662.4 ENST00000414259.1 ENST00000522399.1 |
TTC13 |
tetratricopeptide repeat domain 13 |
| chr20_+_3451732 | 0.51 |
ENST00000446916.2 |
ATRN |
attractin |
| chr1_+_89990431 | 0.50 |
ENST00000330947.2 ENST00000358200.4 |
LRRC8B |
leucine rich repeat containing 8 family, member B |
| chr4_+_74735102 | 0.50 |
ENST00000395761.3 |
CXCL1 |
chemokine (C-X-C motif) ligand 1 (melanoma growth stimulating activity, alpha) |
| chrX_-_19140575 | 0.47 |
ENST00000357991.3 ENST00000356606.4 |
GPR64 |
G protein-coupled receptor 64 |
| chr13_+_76362974 | 0.47 |
ENST00000497947.2 |
LMO7 |
LIM domain 7 |
| chr2_-_160919112 | 0.46 |
ENST00000283243.7 ENST00000392771.1 |
PLA2R1 |
phospholipase A2 receptor 1, 180kDa |
| chr14_-_60337684 | 0.45 |
ENST00000267484.5 |
RTN1 |
reticulon 1 |
| chr3_+_32280159 | 0.43 |
ENST00000458535.2 ENST00000307526.3 |
CMTM8 |
CKLF-like MARVEL transmembrane domain containing 8 |
| chrX_+_73641286 | 0.42 |
ENST00000587091.1 |
SLC16A2 |
solute carrier family 16, member 2 (thyroid hormone transporter) |
| chr13_-_24007815 | 0.41 |
ENST00000382298.3 |
SACS |
spastic ataxia of Charlevoix-Saguenay (sacsin) |
| chr17_-_19648683 | 0.41 |
ENST00000573368.1 ENST00000457500.2 |
ALDH3A1 |
aldehyde dehydrogenase 3 family, member A1 |
| chr9_-_120177342 | 0.41 |
ENST00000361209.2 |
ASTN2 |
astrotactin 2 |
| chr7_+_94023873 | 0.40 |
ENST00000297268.6 |
COL1A2 |
collagen, type I, alpha 2 |
| chr17_-_39191107 | 0.38 |
ENST00000344363.5 |
KRTAP1-3 |
keratin associated protein 1-3 |
| chrX_-_19140677 | 0.38 |
ENST00000357544.3 ENST00000379869.3 ENST00000360279.4 ENST00000379873.2 ENST00000379878.3 ENST00000354791.3 ENST00000379876.1 |
GPR64 |
G protein-coupled receptor 64 |
| chrX_-_92928557 | 0.37 |
ENST00000373079.3 ENST00000475430.2 |
NAP1L3 |
nucleosome assembly protein 1-like 3 |
| chr10_-_79397391 | 0.37 |
ENST00000286628.8 ENST00000406533.3 ENST00000354353.5 ENST00000404857.1 |
KCNMA1 |
potassium large conductance calcium-activated channel, subfamily M, alpha member 1 |
| chr6_-_31514333 | 0.37 |
ENST00000376151.4 |
ATP6V1G2 |
ATPase, H+ transporting, lysosomal 13kDa, V1 subunit G2 |
| chr10_-_79398127 | 0.36 |
ENST00000372443.1 |
KCNMA1 |
potassium large conductance calcium-activated channel, subfamily M, alpha member 1 |
| chr9_-_104357277 | 0.36 |
ENST00000374806.1 |
PPP3R2 |
protein phosphatase 3, regulatory subunit B, beta |
| chr12_-_71003568 | 0.36 |
ENST00000547715.1 ENST00000451516.2 ENST00000538708.1 ENST00000550857.1 ENST00000261266.5 |
PTPRB |
protein tyrosine phosphatase, receptor type, B |
| chr1_+_78354297 | 0.36 |
ENST00000334785.7 |
NEXN |
nexilin (F actin binding protein) |
| chr1_+_23037323 | 0.36 |
ENST00000544305.1 ENST00000374630.3 ENST00000400191.3 ENST00000374632.3 |
EPHB2 |
EPH receptor B2 |
| chr12_-_56122426 | 0.35 |
ENST00000551173.1 |
CD63 |
CD63 molecule |
| chr10_-_79397479 | 0.35 |
ENST00000404771.3 |
KCNMA1 |
potassium large conductance calcium-activated channel, subfamily M, alpha member 1 |
| chr11_+_22688150 | 0.35 |
ENST00000454584.2 |
GAS2 |
growth arrest-specific 2 |
| chr13_-_44361025 | 0.35 |
ENST00000261488.6 |
ENOX1 |
ecto-NOX disulfide-thiol exchanger 1 |
| chr6_-_31514516 | 0.35 |
ENST00000303892.5 ENST00000483251.1 |
ATP6V1G2 |
ATPase, H+ transporting, lysosomal 13kDa, V1 subunit G2 |
| chr6_+_72596604 | 0.35 |
ENST00000348717.5 ENST00000517960.1 ENST00000518273.1 ENST00000522291.1 ENST00000521978.1 ENST00000520567.1 ENST00000264839.7 |
RIMS1 |
regulating synaptic membrane exocytosis 1 |
| chr13_-_26625169 | 0.34 |
ENST00000319420.3 |
SHISA2 |
shisa family member 2 |
| chr5_+_140864649 | 0.34 |
ENST00000306593.1 |
PCDHGC4 |
protocadherin gamma subfamily C, 4 |
| chr11_-_9113093 | 0.34 |
ENST00000450649.2 |
SCUBE2 |
signal peptide, CUB domain, EGF-like 2 |
| chr6_+_72596406 | 0.34 |
ENST00000491071.2 |
RIMS1 |
regulating synaptic membrane exocytosis 1 |
| chrX_+_23685563 | 0.34 |
ENST00000379341.4 |
PRDX4 |
peroxiredoxin 4 |
| chr1_-_177134024 | 0.33 |
ENST00000367654.3 |
ASTN1 |
astrotactin 1 |
| chr4_-_129208940 | 0.33 |
ENST00000296425.5 |
PGRMC2 |
progesterone receptor membrane component 2 |
| chr3_-_124774802 | 0.32 |
ENST00000311127.4 |
HEG1 |
heart development protein with EGF-like domains 1 |
| chr3_-_167813132 | 0.32 |
ENST00000309027.4 |
GOLIM4 |
golgi integral membrane protein 4 |
| chr21_+_47401650 | 0.32 |
ENST00000361866.3 |
COL6A1 |
collagen, type VI, alpha 1 |
| chrX_-_135849484 | 0.31 |
ENST00000370620.1 ENST00000535227.1 |
ARHGEF6 |
Rac/Cdc42 guanine nucleotide exchange factor (GEF) 6 |
| chr17_-_39216344 | 0.31 |
ENST00000391418.2 |
KRTAP2-3 |
keratin associated protein 2-3 |
| chr9_+_37650945 | 0.31 |
ENST00000377765.3 |
FRMPD1 |
FERM and PDZ domain containing 1 |
| chr10_-_133109947 | 0.31 |
ENST00000368642.4 |
TCERG1L |
transcription elongation regulator 1-like |
| chr3_-_145878954 | 0.31 |
ENST00000282903.5 ENST00000360060.3 |
PLOD2 |
procollagen-lysine, 2-oxoglutarate 5-dioxygenase 2 |
| chrX_+_100333709 | 0.31 |
ENST00000372930.4 |
TMEM35 |
transmembrane protein 35 |
| chr20_+_13202418 | 0.31 |
ENST00000262487.4 |
ISM1 |
isthmin 1, angiogenesis inhibitor |
| chrX_+_21392553 | 0.31 |
ENST00000279451.4 |
CNKSR2 |
connector enhancer of kinase suppressor of Ras 2 |
| chr2_-_47168850 | 0.31 |
ENST00000409207.1 |
MCFD2 |
multiple coagulation factor deficiency 2 |
| chr14_+_52327109 | 0.30 |
ENST00000335281.4 |
GNG2 |
guanine nucleotide binding protein (G protein), gamma 2 |
| chr9_-_128003606 | 0.30 |
ENST00000324460.6 |
HSPA5 |
heat shock 70kDa protein 5 (glucose-regulated protein, 78kDa) |
| chr20_+_44519948 | 0.30 |
ENST00000354880.5 ENST00000191018.5 |
CTSA |
cathepsin A |
| chr13_+_36050881 | 0.30 |
ENST00000537702.1 |
NBEA |
neurobeachin |
| chr10_-_48438974 | 0.30 |
ENST00000224605.2 |
GDF10 |
growth differentiation factor 10 |
| chr20_+_61448376 | 0.30 |
ENST00000343916.3 |
COL9A3 |
collagen, type IX, alpha 3 |
| chr21_+_37507210 | 0.29 |
ENST00000290354.5 |
CBR3 |
carbonyl reductase 3 |
| chr3_+_63898275 | 0.29 |
ENST00000538065.1 |
ATXN7 |
ataxin 7 |
| chr22_-_50312052 | 0.29 |
ENST00000330817.6 |
ALG12 |
ALG12, alpha-1,6-mannosyltransferase |
| chr20_+_44520009 | 0.29 |
ENST00000607482.1 ENST00000372459.2 |
CTSA |
cathepsin A |
| chr2_+_220408724 | 0.28 |
ENST00000421791.1 ENST00000373883.3 ENST00000451952.1 |
TMEM198 |
transmembrane protein 198 |
| chr4_+_15004165 | 0.28 |
ENST00000538197.1 ENST00000541112.1 ENST00000442003.2 |
CPEB2 |
cytoplasmic polyadenylation element binding protein 2 |
| chr12_-_56122761 | 0.28 |
ENST00000552164.1 ENST00000420846.3 ENST00000257857.4 |
CD63 |
CD63 molecule |
| chr1_+_78354175 | 0.28 |
ENST00000401035.3 ENST00000457030.1 ENST00000330010.8 |
NEXN |
nexilin (F actin binding protein) |
| chr8_-_27472198 | 0.28 |
ENST00000519472.1 ENST00000523589.1 ENST00000522413.1 ENST00000523396.1 ENST00000560366.1 |
CLU |
clusterin |
| chr12_-_92539614 | 0.28 |
ENST00000256015.3 |
BTG1 |
B-cell translocation gene 1, anti-proliferative |
| chr3_-_73673991 | 0.28 |
ENST00000308537.4 ENST00000263666.4 |
PDZRN3 |
PDZ domain containing ring finger 3 |
| chr1_-_9129598 | 0.28 |
ENST00000535586.1 |
SLC2A5 |
solute carrier family 2 (facilitated glucose/fructose transporter), member 5 |
| chr6_-_139695757 | 0.27 |
ENST00000367651.2 |
CITED2 |
Cbp/p300-interacting transactivator, with Glu/Asp-rich carboxy-terminal domain, 2 |
| chr6_-_111804393 | 0.27 |
ENST00000368802.3 ENST00000368805.1 |
REV3L |
REV3-like, polymerase (DNA directed), zeta, catalytic subunit |
| chr11_-_66336060 | 0.27 |
ENST00000310325.5 |
CTSF |
cathepsin F |
| chr4_-_52904425 | 0.27 |
ENST00000535450.1 |
SGCB |
sarcoglycan, beta (43kDa dystrophin-associated glycoprotein) |
| chr1_+_213123915 | 0.27 |
ENST00000366968.4 ENST00000490792.1 |
VASH2 |
vasohibin 2 |
| chr9_-_20622478 | 0.26 |
ENST00000355930.6 ENST00000380338.4 |
MLLT3 |
myeloid/lymphoid or mixed-lineage leukemia (trithorax homolog, Drosophila); translocated to, 3 |
| chr2_-_216300784 | 0.26 |
ENST00000421182.1 ENST00000432072.2 ENST00000323926.6 ENST00000336916.4 ENST00000357867.4 ENST00000359671.1 ENST00000346544.3 ENST00000345488.5 ENST00000357009.2 ENST00000446046.1 ENST00000356005.4 ENST00000443816.1 ENST00000426059.1 ENST00000354785.4 |
FN1 |
fibronectin 1 |
| chr16_+_2880254 | 0.26 |
ENST00000570670.1 |
ZG16B |
zymogen granule protein 16B |
| chr7_+_100547156 | 0.26 |
ENST00000379458.4 |
MUC3A |
Protein LOC100131514 |
| chr7_+_75028199 | 0.26 |
ENST00000437796.1 |
TRIM73 |
tripartite motif containing 73 |
| chrX_-_38080077 | 0.26 |
ENST00000378533.3 ENST00000544439.1 ENST00000432886.2 ENST00000538295.1 |
SRPX |
sushi-repeat containing protein, X-linked |
| chr2_-_227664474 | 0.26 |
ENST00000305123.5 |
IRS1 |
insulin receptor substrate 1 |
| chr19_+_35521572 | 0.26 |
ENST00000262631.5 |
SCN1B |
sodium channel, voltage-gated, type I, beta subunit |
| chr21_+_47531328 | 0.25 |
ENST00000409416.1 ENST00000397763.1 |
COL6A2 |
collagen, type VI, alpha 2 |
| chr16_+_2880296 | 0.25 |
ENST00000571723.1 |
ZG16B |
zymogen granule protein 16B |
| chrX_+_51486481 | 0.25 |
ENST00000340438.4 |
GSPT2 |
G1 to S phase transition 2 |
| chr20_-_52790512 | 0.25 |
ENST00000216862.3 |
CYP24A1 |
cytochrome P450, family 24, subfamily A, polypeptide 1 |
| chr2_+_217498105 | 0.25 |
ENST00000233809.4 |
IGFBP2 |
insulin-like growth factor binding protein 2, 36kDa |
| chr10_-_64576105 | 0.25 |
ENST00000242480.3 ENST00000411732.1 |
EGR2 |
early growth response 2 |
| chr12_-_103352144 | 0.24 |
ENST00000551337.1 |
PAH |
phenylalanine hydroxylase |
| chr3_-_87040233 | 0.24 |
ENST00000398399.2 |
VGLL3 |
vestigial like 3 (Drosophila) |
| chr4_+_56262115 | 0.24 |
ENST00000506198.1 ENST00000381334.5 ENST00000542052.1 |
TMEM165 |
transmembrane protein 165 |
| chr20_-_60942361 | 0.24 |
ENST00000252999.3 |
LAMA5 |
laminin, alpha 5 |
| chr16_+_2880369 | 0.24 |
ENST00000572863.1 |
ZG16B |
zymogen granule protein 16B |
| chr22_+_30792846 | 0.24 |
ENST00000312932.9 ENST00000428195.1 |
SEC14L2 |
SEC14-like 2 (S. cerevisiae) |
| chr12_+_71833756 | 0.24 |
ENST00000536515.1 ENST00000540815.2 |
LGR5 |
leucine-rich repeat containing G protein-coupled receptor 5 |
| chr6_+_147525541 | 0.24 |
ENST00000367481.3 ENST00000546097.1 |
STXBP5 |
syntaxin binding protein 5 (tomosyn) |
| chr7_-_107880508 | 0.24 |
ENST00000425651.2 |
NRCAM |
neuronal cell adhesion molecule |
| chr9_+_134165063 | 0.24 |
ENST00000372264.3 |
PPAPDC3 |
phosphatidic acid phosphatase type 2 domain containing 3 |
| chr19_-_19774473 | 0.24 |
ENST00000357324.6 |
ATP13A1 |
ATPase type 13A1 |
| chrX_-_107975917 | 0.24 |
ENST00000563887.1 |
RP6-24A23.6 |
Uncharacterized protein |
| chr12_-_56122220 | 0.24 |
ENST00000552692.1 |
CD63 |
CD63 molecule |
| chr1_-_24194771 | 0.24 |
ENST00000374479.3 |
FUCA1 |
fucosidase, alpha-L- 1, tissue |
| chr19_+_51630287 | 0.24 |
ENST00000599948.1 |
SIGLEC9 |
sialic acid binding Ig-like lectin 9 |
| chr6_+_160390102 | 0.24 |
ENST00000356956.1 |
IGF2R |
insulin-like growth factor 2 receptor |
| chr16_+_335680 | 0.24 |
ENST00000435833.1 |
PDIA2 |
protein disulfide isomerase family A, member 2 |
| chr21_+_46117087 | 0.24 |
ENST00000400365.3 |
KRTAP10-12 |
keratin associated protein 10-12 |
| chr17_-_7216939 | 0.23 |
ENST00000573684.1 |
GPS2 |
G protein pathway suppressor 2 |
| chr11_-_124670273 | 0.23 |
ENST00000524950.1 ENST00000374979.3 |
MSANTD2 |
Myb/SANT-like DNA-binding domain containing 2 |
| chr20_-_57582296 | 0.23 |
ENST00000217131.5 |
CTSZ |
cathepsin Z |
| chr5_+_126626498 | 0.23 |
ENST00000503335.2 ENST00000508365.1 ENST00000418761.2 ENST00000274473.6 |
MEGF10 |
multiple EGF-like-domains 10 |
| chr8_+_37654424 | 0.23 |
ENST00000315215.7 |
GPR124 |
G protein-coupled receptor 124 |
| chr12_+_71833550 | 0.23 |
ENST00000266674.5 |
LGR5 |
leucine-rich repeat containing G protein-coupled receptor 5 |
| chr4_+_15005391 | 0.23 |
ENST00000507071.1 ENST00000345451.3 ENST00000259997.5 ENST00000382395.3 ENST00000382401.3 |
CPEB2 |
cytoplasmic polyadenylation element binding protein 2 |
| chr2_+_232135245 | 0.23 |
ENST00000446447.1 |
ARMC9 |
armadillo repeat containing 9 |
| chr17_+_26369865 | 0.23 |
ENST00000582037.1 |
NLK |
nemo-like kinase |
| chr17_+_79859985 | 0.23 |
ENST00000333383.7 |
NPB |
neuropeptide B |
| chr5_-_176936844 | 0.23 |
ENST00000510380.1 ENST00000510898.1 ENST00000357198.4 |
DOK3 |
docking protein 3 |
| chr10_+_89419370 | 0.23 |
ENST00000361175.4 ENST00000456849.1 |
PAPSS2 |
3'-phosphoadenosine 5'-phosphosulfate synthase 2 |
| chr6_+_26458152 | 0.23 |
ENST00000312541.5 |
BTN2A1 |
butyrophilin, subfamily 2, member A1 |
| chr12_-_118406777 | 0.23 |
ENST00000339824.5 |
KSR2 |
kinase suppressor of ras 2 |
| chr16_-_74640986 | 0.23 |
ENST00000422840.2 ENST00000565260.1 ENST00000447066.2 ENST00000205061.5 |
GLG1 |
golgi glycoprotein 1 |
| chr9_+_4985228 | 0.23 |
ENST00000381652.3 |
JAK2 |
Janus kinase 2 |
| chr15_+_96873921 | 0.22 |
ENST00000394166.3 |
NR2F2 |
nuclear receptor subfamily 2, group F, member 2 |
| chr12_+_122241928 | 0.22 |
ENST00000604567.1 ENST00000542440.1 |
SETD1B |
SET domain containing 1B |
| chr3_-_194991876 | 0.22 |
ENST00000310380.6 |
XXYLT1 |
xyloside xylosyltransferase 1 |
| chr2_+_191745535 | 0.22 |
ENST00000320717.3 |
GLS |
glutaminase |
| chr9_-_120177216 | 0.22 |
ENST00000373996.3 ENST00000313400.4 ENST00000361477.3 |
ASTN2 |
astrotactin 2 |
| chr12_-_122241812 | 0.22 |
ENST00000538335.1 |
AC084018.1 |
AC084018.1 |
| chr2_-_11810284 | 0.22 |
ENST00000306928.5 |
NTSR2 |
neurotensin receptor 2 |
| chr17_-_39623681 | 0.22 |
ENST00000225899.3 |
KRT32 |
keratin 32 |
| chr2_-_220083076 | 0.22 |
ENST00000295750.4 |
ABCB6 |
ATP-binding cassette, sub-family B (MDR/TAP), member 6 |
| chr5_-_158526693 | 0.22 |
ENST00000380654.4 |
EBF1 |
early B-cell factor 1 |
| chr6_+_136172820 | 0.22 |
ENST00000308191.6 |
PDE7B |
phosphodiesterase 7B |
| chrX_+_23685653 | 0.21 |
ENST00000379331.3 |
PRDX4 |
peroxiredoxin 4 |
| chr3_-_69062764 | 0.21 |
ENST00000295571.5 |
EOGT |
EGF domain-specific O-linked N-acetylglucosamine (GlcNAc) transferase |
| chr7_-_102789629 | 0.21 |
ENST00000417955.1 ENST00000341533.4 ENST00000425379.1 |
NAPEPLD |
N-acyl phosphatidylethanolamine phospholipase D |
| chr12_+_79258444 | 0.21 |
ENST00000261205.4 |
SYT1 |
synaptotagmin I |
| chr11_-_414948 | 0.21 |
ENST00000530494.1 ENST00000528209.1 ENST00000431843.2 ENST00000528058.1 |
SIGIRR |
single immunoglobulin and toll-interleukin 1 receptor (TIR) domain |
| chr4_+_2043689 | 0.21 |
ENST00000382878.3 ENST00000409248.4 |
C4orf48 |
chromosome 4 open reading frame 48 |
| chr2_+_105471969 | 0.21 |
ENST00000361360.2 |
POU3F3 |
POU class 3 homeobox 3 |
| chr1_-_58716197 | 0.21 |
ENST00000371234.4 |
DAB1 |
Dab, reelin signal transducer, homolog 1 (Drosophila) |
| chr3_-_50378343 | 0.21 |
ENST00000359365.4 |
RASSF1 |
Ras association (RalGDS/AF-6) domain family member 1 |
| chr12_-_108733078 | 0.21 |
ENST00000552995.1 ENST00000312143.7 ENST00000397688.2 ENST00000550402.1 |
CMKLR1 |
chemokine-like receptor 1 |
| chr10_+_51748078 | 0.21 |
ENST00000374056.4 |
AGAP6 |
ArfGAP with GTPase domain, ankyrin repeat and PH domain 6 |
| chr12_-_12503156 | 0.21 |
ENST00000543314.1 ENST00000396349.3 |
MANSC1 |
MANSC domain containing 1 |
| chrX_-_19905703 | 0.21 |
ENST00000397821.3 |
SH3KBP1 |
SH3-domain kinase binding protein 1 |
| chr12_-_40499661 | 0.21 |
ENST00000280871.4 |
SLC2A13 |
solute carrier family 2 (facilitated glucose transporter), member 13 |
| chr12_-_118541743 | 0.20 |
ENST00000359236.5 |
VSIG10 |
V-set and immunoglobulin domain containing 10 |
| chr4_+_6576895 | 0.20 |
ENST00000285599.3 ENST00000504248.1 ENST00000505907.1 |
MAN2B2 |
mannosidase, alpha, class 2B, member 2 |
| chr5_-_146258205 | 0.20 |
ENST00000394413.3 |
PPP2R2B |
protein phosphatase 2, regulatory subunit B, beta |
| chr9_+_132815985 | 0.20 |
ENST00000372410.3 |
GPR107 |
G protein-coupled receptor 107 |
| chr4_+_2043777 | 0.20 |
ENST00000409860.1 |
C4orf48 |
chromosome 4 open reading frame 48 |
| chr7_+_2559399 | 0.20 |
ENST00000222725.5 ENST00000359574.3 |
LFNG |
LFNG O-fucosylpeptide 3-beta-N-acetylglucosaminyltransferase |
| chr12_+_53645870 | 0.20 |
ENST00000329548.4 |
MFSD5 |
major facilitator superfamily domain containing 5 |
| chr15_-_49338624 | 0.20 |
ENST00000261847.3 ENST00000380927.2 ENST00000559424.1 |
SECISBP2L |
SECIS binding protein 2-like |
| chr11_-_627143 | 0.20 |
ENST00000176195.3 |
SCT |
secretin |
| chr4_-_46391931 | 0.20 |
ENST00000381620.4 |
GABRA2 |
gamma-aminobutyric acid (GABA) A receptor, alpha 2 |
| chr15_-_44010458 | 0.20 |
ENST00000541030.1 |
STRC |
stereocilin |
| chr4_+_154387480 | 0.20 |
ENST00000409663.3 ENST00000440693.1 ENST00000409959.3 |
KIAA0922 |
KIAA0922 |
| chr11_-_9113137 | 0.20 |
ENST00000520467.1 ENST00000309263.3 ENST00000457346.2 |
SCUBE2 |
signal peptide, CUB domain, EGF-like 2 |
| chr5_-_178772424 | 0.20 |
ENST00000251582.7 ENST00000274609.5 |
ADAMTS2 |
ADAM metallopeptidase with thrombospondin type 1 motif, 2 |
| chr9_+_114393581 | 0.20 |
ENST00000313525.3 |
DNAJC25 |
DnaJ (Hsp40) homolog, subfamily C , member 25 |
| chr1_+_213123976 | 0.20 |
ENST00000366965.2 ENST00000366967.2 |
VASH2 |
vasohibin 2 |
| chr12_-_90102594 | 0.20 |
ENST00000428670.3 |
ATP2B1 |
ATPase, Ca++ transporting, plasma membrane 1 |
| chr11_-_47270341 | 0.20 |
ENST00000529444.1 ENST00000530453.1 ENST00000537863.1 ENST00000529788.1 ENST00000444355.2 ENST00000527256.1 ENST00000529663.1 ENST00000256997.3 |
ACP2 |
acid phosphatase 2, lysosomal |
| chr7_-_102789503 | 0.20 |
ENST00000465647.1 ENST00000418294.1 |
NAPEPLD |
N-acyl phosphatidylethanolamine phospholipase D |
| chr1_+_144989309 | 0.20 |
ENST00000596396.1 |
AL590452.1 |
Uncharacterized protein |
| chr11_+_1718425 | 0.19 |
ENST00000382160.1 |
KRTAP5-6 |
keratin associated protein 5-6 |
| chr11_-_10829851 | 0.19 |
ENST00000532082.1 |
EIF4G2 |
eukaryotic translation initiation factor 4 gamma, 2 |
| chr1_-_145076186 | 0.19 |
ENST00000369348.3 |
PDE4DIP |
phosphodiesterase 4D interacting protein |
| chr16_+_5121814 | 0.19 |
ENST00000262374.5 ENST00000586840.1 |
ALG1 |
ALG1, chitobiosyldiphosphodolichol beta-mannosyltransferase |
| chr1_+_231114795 | 0.19 |
ENST00000310256.2 ENST00000366658.2 ENST00000450711.1 ENST00000435927.1 |
ARV1 |
ARV1 homolog (S. cerevisiae) |
| chr17_-_45899126 | 0.19 |
ENST00000007414.3 ENST00000392507.3 |
OSBPL7 |
oxysterol binding protein-like 7 |
| chr4_-_46391805 | 0.19 |
ENST00000540012.1 |
GABRA2 |
gamma-aminobutyric acid (GABA) A receptor, alpha 2 |
Gene Ontology Analysis
Gene overrepresentation in biological_process category:
| Log-likelihood per target | Total log-likelihood | Term | Description |
|---|---|---|---|
| 0.3 | 0.3 | GO:0035801 | adrenal cortex development(GO:0035801) adrenal cortex formation(GO:0035802) |
| 0.2 | 2.3 | GO:0034465 | response to carbon monoxide(GO:0034465) |
| 0.2 | 1.2 | GO:0060399 | positive regulation of growth hormone receptor signaling pathway(GO:0060399) |
| 0.2 | 0.5 | GO:0021589 | hindbrain structural organization(GO:0021577) cerebellum structural organization(GO:0021589) |
| 0.2 | 0.5 | GO:0046947 | hydroxylysine metabolic process(GO:0046946) hydroxylysine biosynthetic process(GO:0046947) |
| 0.2 | 0.5 | GO:0032304 | negative regulation of icosanoid secretion(GO:0032304) |
| 0.1 | 0.6 | GO:0007181 | transforming growth factor beta receptor complex assembly(GO:0007181) response to luteinizing hormone(GO:0034699) |
| 0.1 | 0.4 | GO:0021966 | corticospinal neuron axon guidance(GO:0021966) |
| 0.1 | 0.1 | GO:2000860 | positive regulation of mineralocorticoid secretion(GO:2000857) positive regulation of aldosterone secretion(GO:2000860) |
| 0.1 | 1.4 | GO:0001886 | endothelial cell morphogenesis(GO:0001886) |
| 0.1 | 1.7 | GO:0035826 | rubidium ion transport(GO:0035826) regulation of rubidium ion transport(GO:2000680) |
| 0.1 | 0.5 | GO:1900248 | cytoplasmic translational elongation(GO:0002182) regulation of cytoplasmic translational elongation(GO:1900247) negative regulation of cytoplasmic translational elongation(GO:1900248) |
| 0.1 | 0.4 | GO:0098746 | fast, calcium ion-dependent exocytosis of neurotransmitter(GO:0098746) |
| 0.1 | 0.3 | GO:0017186 | peptidyl-pyroglutamic acid biosynthetic process, using glutaminyl-peptide cyclotransferase(GO:0017186) |
| 0.1 | 0.5 | GO:2000255 | negative regulation of male germ cell proliferation(GO:2000255) |
| 0.1 | 0.4 | GO:1903998 | regulation of eating behavior(GO:1903998) |
| 0.1 | 0.3 | GO:1904395 | positive regulation of skeletal muscle acetylcholine-gated channel clustering(GO:1904395) |
| 0.1 | 0.1 | GO:0090076 | relaxation of skeletal muscle(GO:0090076) |
| 0.1 | 0.3 | GO:0052047 | interaction with other organism via secreted substance involved in symbiotic interaction(GO:0052047) |
| 0.1 | 0.3 | GO:0009956 | radial pattern formation(GO:0009956) |
| 0.1 | 1.5 | GO:0032836 | glomerular basement membrane development(GO:0032836) |
| 0.1 | 0.2 | GO:0002184 | cytoplasmic translational termination(GO:0002184) |
| 0.1 | 0.2 | GO:0021569 | rhombomere 3 development(GO:0021569) rhombomere 5 development(GO:0021571) central nervous system segmentation(GO:0035283) brain segmentation(GO:0035284) |
| 0.1 | 0.5 | GO:0010756 | positive regulation of plasminogen activation(GO:0010756) |
| 0.1 | 0.5 | GO:0043932 | ossification involved in bone remodeling(GO:0043932) |
| 0.1 | 0.3 | GO:1905167 | positive regulation of lysosomal protein catabolic process(GO:1905167) |
| 0.1 | 0.2 | GO:0021849 | neuroblast division in subventricular zone(GO:0021849) |
| 0.1 | 0.3 | GO:1901662 | phylloquinone metabolic process(GO:0042374) phylloquinone catabolic process(GO:0042376) quinone catabolic process(GO:1901662) |
| 0.1 | 0.1 | GO:0071314 | cellular response to cocaine(GO:0071314) |
| 0.1 | 0.2 | GO:0090187 | positive regulation of pancreatic juice secretion(GO:0090187) |
| 0.1 | 0.6 | GO:1904715 | negative regulation of chaperone-mediated autophagy(GO:1904715) |
| 0.1 | 0.5 | GO:0048104 | establishment of body hair or bristle planar orientation(GO:0048104) establishment of body hair planar orientation(GO:0048105) |
| 0.1 | 0.3 | GO:0042264 | peptidyl-aspartic acid hydroxylation(GO:0042264) |
| 0.1 | 0.4 | GO:0032445 | fructose transport(GO:0015755) fructose import(GO:0032445) carbohydrate import into cell(GO:0097319) carbohydrate import across plasma membrane(GO:0098704) fructose import across plasma membrane(GO:1990539) |
| 0.1 | 0.6 | GO:0035754 | B cell chemotaxis(GO:0035754) |
| 0.1 | 1.4 | GO:0006488 | dolichol-linked oligosaccharide biosynthetic process(GO:0006488) |
| 0.1 | 0.6 | GO:0002051 | osteoblast fate commitment(GO:0002051) |
| 0.1 | 0.2 | GO:0000103 | sulfate assimilation(GO:0000103) |
| 0.1 | 0.1 | GO:0035359 | negative regulation of peroxisome proliferator activated receptor signaling pathway(GO:0035359) |
| 0.1 | 0.2 | GO:0072240 | DCT cell differentiation(GO:0072069) metanephric DCT cell differentiation(GO:0072240) |
| 0.1 | 0.1 | GO:0097374 | sensory neuron axon guidance(GO:0097374) |
| 0.1 | 0.2 | GO:1904425 | negative regulation of GTP binding(GO:1904425) |
| 0.1 | 0.2 | GO:0031443 | fast-twitch skeletal muscle fiber contraction(GO:0031443) |
| 0.0 | 0.1 | GO:1990737 | regulation of endoplasmic reticulum stress-induced eIF2 alpha phosphorylation(GO:0060734) response to manganese-induced endoplasmic reticulum stress(GO:1990737) |
| 0.0 | 0.1 | GO:0042369 | vitamin D catabolic process(GO:0042369) |
| 0.0 | 0.3 | GO:1902998 | macrophage proliferation(GO:0061517) microglial cell proliferation(GO:0061518) regulation of neuronal signal transduction(GO:1902847) positive regulation of neurofibrillary tangle assembly(GO:1902998) |
| 0.0 | 0.2 | GO:0019566 | arabinose metabolic process(GO:0019566) L-arabinose metabolic process(GO:0046373) |
| 0.0 | 0.2 | GO:0000255 | allantoin metabolic process(GO:0000255) |
| 0.0 | 0.2 | GO:0021650 | vestibulocochlear nerve formation(GO:0021650) |
| 0.0 | 0.2 | GO:0097368 | establishment of Sertoli cell barrier(GO:0097368) |
| 0.0 | 0.6 | GO:0048251 | elastic fiber assembly(GO:0048251) |
| 0.0 | 0.1 | GO:0045925 | positive regulation of female receptivity(GO:0045925) |
| 0.0 | 0.1 | GO:2000566 | positive regulation of CD8-positive, alpha-beta T cell proliferation(GO:2000566) |
| 0.0 | 0.1 | GO:0050720 | interleukin-1 beta biosynthetic process(GO:0050720) |
| 0.0 | 0.2 | GO:0009183 | ADP biosynthetic process(GO:0006172) purine deoxyribonucleoside diphosphate biosynthetic process(GO:0009183) |
| 0.0 | 0.2 | GO:0038195 | urokinase plasminogen activator signaling pathway(GO:0038195) |
| 0.0 | 0.2 | GO:0006663 | platelet activating factor biosynthetic process(GO:0006663) |
| 0.0 | 0.3 | GO:1904783 | positive regulation of NMDA glutamate receptor activity(GO:1904783) |
| 0.0 | 0.3 | GO:0043654 | recognition of apoptotic cell(GO:0043654) |
| 0.0 | 0.1 | GO:0060364 | embryonic nail plate morphogenesis(GO:0035880) frontal suture morphogenesis(GO:0060364) |
| 0.0 | 0.9 | GO:0070208 | protein heterotrimerization(GO:0070208) |
| 0.0 | 0.1 | GO:0070105 | positive regulation of interleukin-6-mediated signaling pathway(GO:0070105) |
| 0.0 | 0.6 | GO:0060088 | auditory receptor cell stereocilium organization(GO:0060088) |
| 0.0 | 0.7 | GO:0097151 | positive regulation of inhibitory postsynaptic potential(GO:0097151) modulation of inhibitory postsynaptic potential(GO:0098828) |
| 0.0 | 0.4 | GO:0032000 | positive regulation of fatty acid beta-oxidation(GO:0032000) |
| 0.0 | 0.2 | GO:0038169 | somatostatin receptor signaling pathway(GO:0038169) somatostatin signaling pathway(GO:0038170) |
| 0.0 | 0.1 | GO:1902462 | regulation of mesenchymal stem cell proliferation(GO:1902460) positive regulation of mesenchymal stem cell proliferation(GO:1902462) |
| 0.0 | 0.1 | GO:0032826 | natural killer cell differentiation involved in immune response(GO:0002325) negative regulation of natural killer cell differentiation(GO:0032824) regulation of natural killer cell differentiation involved in immune response(GO:0032826) negative regulation of natural killer cell differentiation involved in immune response(GO:0032827) positive regulation of cytolysis in other organism(GO:0051714) |
| 0.0 | 0.1 | GO:0000415 | negative regulation of histone H3-K36 methylation(GO:0000415) |
| 0.0 | 0.2 | GO:0032472 | Golgi calcium ion transport(GO:0032472) |
| 0.0 | 0.2 | GO:1900454 | positive regulation of long term synaptic depression(GO:1900454) |
| 0.0 | 0.2 | GO:0015798 | myo-inositol transport(GO:0015798) |
| 0.0 | 0.1 | GO:0043456 | regulation of pentose-phosphate shunt(GO:0043456) |
| 0.0 | 0.4 | GO:0006621 | protein retention in ER lumen(GO:0006621) maintenance of protein localization in endoplasmic reticulum(GO:0035437) |
| 0.0 | 0.2 | GO:1900244 | positive regulation of synaptic vesicle endocytosis(GO:1900244) positive regulation of synaptic vesicle transport(GO:1902805) positive regulation of synaptic vesicle recycling(GO:1903423) |
| 0.0 | 0.3 | GO:0060244 | negative regulation of cell proliferation involved in contact inhibition(GO:0060244) |
| 0.0 | 0.2 | GO:0010755 | regulation of plasminogen activation(GO:0010755) |
| 0.0 | 0.2 | GO:0032383 | regulation of intracellular lipid transport(GO:0032377) regulation of intracellular sterol transport(GO:0032380) regulation of intracellular cholesterol transport(GO:0032383) |
| 0.0 | 0.2 | GO:0050916 | sensory perception of sweet taste(GO:0050916) |
| 0.0 | 0.3 | GO:0043401 | steroid hormone mediated signaling pathway(GO:0043401) |
| 0.0 | 0.1 | GO:2000705 | dense core granule biogenesis(GO:0061110) regulation of dense core granule biogenesis(GO:2000705) |
| 0.0 | 0.1 | GO:2000676 | positive regulation of type B pancreatic cell apoptotic process(GO:2000676) |
| 0.0 | 0.2 | GO:0006543 | glutamine catabolic process(GO:0006543) |
| 0.0 | 0.2 | GO:1904781 | positive regulation of protein localization to centrosome(GO:1904781) |
| 0.0 | 0.3 | GO:2001013 | epithelial cell proliferation involved in renal tubule morphogenesis(GO:2001013) |
| 0.0 | 0.3 | GO:0071386 | cellular response to corticosterone stimulus(GO:0071386) |
| 0.0 | 0.1 | GO:0035494 | SNARE complex disassembly(GO:0035494) |
| 0.0 | 0.1 | GO:0003335 | corneocyte development(GO:0003335) |
| 0.0 | 0.2 | GO:0045079 | negative regulation of chemokine biosynthetic process(GO:0045079) |
| 0.0 | 0.4 | GO:0070327 | thyroid hormone transport(GO:0070327) |
| 0.0 | 0.3 | GO:0097084 | vascular smooth muscle cell development(GO:0097084) |
| 0.0 | 0.1 | GO:0061300 | cerebellum vasculature development(GO:0061300) |
| 0.0 | 0.1 | GO:0045914 | cellular response to phosphate starvation(GO:0016036) positive regulation of sulfur amino acid metabolic process(GO:0031337) negative regulation of catecholamine metabolic process(GO:0045914) negative regulation of dopamine metabolic process(GO:0045963) positive regulation of homocysteine metabolic process(GO:0050668) |
| 0.0 | 0.2 | GO:0007386 | compartment pattern specification(GO:0007386) |
| 0.0 | 0.1 | GO:0072268 | pattern specification involved in metanephros development(GO:0072268) |
| 0.0 | 0.1 | GO:1903413 | cellular response to bile acid(GO:1903413) |
| 0.0 | 0.3 | GO:0071787 | endoplasmic reticulum tubular network assembly(GO:0071787) |
| 0.0 | 0.1 | GO:0009133 | nucleoside diphosphate biosynthetic process(GO:0009133) deoxyribonucleoside diphosphate biosynthetic process(GO:0009189) |
| 0.0 | 0.3 | GO:0016139 | glycoside catabolic process(GO:0016139) |
| 0.0 | 0.5 | GO:0048739 | cardiac muscle fiber development(GO:0048739) |
| 0.0 | 0.1 | GO:1903566 | positive regulation of protein localization to cilium(GO:1903566) |
| 0.0 | 0.1 | GO:0060363 | cranial suture morphogenesis(GO:0060363) |
| 0.0 | 0.1 | GO:0015691 | cadmium ion transport(GO:0015691) cadmium ion transmembrane transport(GO:0070574) |
| 0.0 | 0.1 | GO:1905123 | regulation of endosome organization(GO:1904978) regulation of glucosylceramidase activity(GO:1905123) |
| 0.0 | 0.2 | GO:0019227 | neuronal action potential propagation(GO:0019227) action potential propagation(GO:0098870) |
| 0.0 | 0.0 | GO:1900151 | regulation of nuclear-transcribed mRNA catabolic process, deadenylation-dependent decay(GO:1900151) positive regulation of nuclear-transcribed mRNA catabolic process, deadenylation-dependent decay(GO:1900153) |
| 0.0 | 0.3 | GO:0043569 | negative regulation of insulin-like growth factor receptor signaling pathway(GO:0043569) |
| 0.0 | 0.2 | GO:0006013 | mannose metabolic process(GO:0006013) |
| 0.0 | 0.2 | GO:0038026 | reelin-mediated signaling pathway(GO:0038026) |
| 0.0 | 0.6 | GO:0060716 | labyrinthine layer blood vessel development(GO:0060716) |
| 0.0 | 0.1 | GO:0048388 | endosomal lumen acidification(GO:0048388) |
| 0.0 | 0.1 | GO:0033685 | negative regulation of luteinizing hormone secretion(GO:0033685) |
| 0.0 | 0.2 | GO:0050915 | sensory perception of sour taste(GO:0050915) |
| 0.0 | 0.1 | GO:0002317 | plasma cell differentiation(GO:0002317) response to isolation stress(GO:0035900) |
| 0.0 | 0.1 | GO:1990168 | protein K33-linked deubiquitination(GO:1990168) |
| 0.0 | 0.2 | GO:0071421 | manganese ion transmembrane transport(GO:0071421) |
| 0.0 | 0.1 | GO:0007518 | myoblast fate determination(GO:0007518) |
| 0.0 | 0.2 | GO:0003383 | apical constriction(GO:0003383) |
| 0.0 | 0.2 | GO:0035095 | behavioral response to nicotine(GO:0035095) |
| 0.0 | 0.8 | GO:0000042 | protein targeting to Golgi(GO:0000042) |
| 0.0 | 0.1 | GO:0050717 | positive regulation of interleukin-1 alpha secretion(GO:0050717) |
| 0.0 | 0.3 | GO:0040037 | negative regulation of fibroblast growth factor receptor signaling pathway(GO:0040037) |
| 0.0 | 0.0 | GO:0003150 | muscular septum morphogenesis(GO:0003150) |
| 0.0 | 0.4 | GO:0090084 | negative regulation of inclusion body assembly(GO:0090084) |
| 0.0 | 0.9 | GO:0090383 | phagosome acidification(GO:0090383) |
| 0.0 | 0.4 | GO:0007021 | tubulin complex assembly(GO:0007021) |
| 0.0 | 0.3 | GO:0008212 | mineralocorticoid biosynthetic process(GO:0006705) mineralocorticoid metabolic process(GO:0008212) |
| 0.0 | 0.6 | GO:0090023 | positive regulation of neutrophil chemotaxis(GO:0090023) |
| 0.0 | 0.2 | GO:0014012 | peripheral nervous system axon regeneration(GO:0014012) |
| 0.0 | 0.2 | GO:0060666 | dichotomous subdivision of terminal units involved in salivary gland branching(GO:0060666) |
| 0.0 | 0.1 | GO:0038193 | thromboxane A2 signaling pathway(GO:0038193) |
| 0.0 | 0.3 | GO:0001514 | selenocysteine incorporation(GO:0001514) translational readthrough(GO:0006451) |
| 0.0 | 0.0 | GO:0090136 | epithelial cell-cell adhesion(GO:0090136) |
| 0.0 | 0.3 | GO:2000096 | positive regulation of Wnt signaling pathway, planar cell polarity pathway(GO:2000096) |
| 0.0 | 0.4 | GO:0007220 | Notch receptor processing(GO:0007220) |
| 0.0 | 0.1 | GO:0019236 | response to pheromone(GO:0019236) |
| 0.0 | 0.3 | GO:2000271 | positive regulation of fibroblast apoptotic process(GO:2000271) |
| 0.0 | 0.0 | GO:0035811 | negative regulation of urine volume(GO:0035811) |
| 0.0 | 0.1 | GO:0016080 | synaptic vesicle targeting(GO:0016080) |
| 0.0 | 0.0 | GO:0036146 | cellular response to mycotoxin(GO:0036146) |
| 0.0 | 0.1 | GO:0000414 | regulation of histone H3-K36 methylation(GO:0000414) |
| 0.0 | 0.3 | GO:0002091 | negative regulation of receptor internalization(GO:0002091) |
| 0.0 | 0.0 | GO:1990418 | response to insulin-like growth factor stimulus(GO:1990418) |
| 0.0 | 0.1 | GO:0070164 | negative regulation of adiponectin secretion(GO:0070164) |
| 0.0 | 0.3 | GO:0019722 | calcium-mediated signaling(GO:0019722) |
| 0.0 | 0.1 | GO:0002322 | B cell proliferation involved in immune response(GO:0002322) |
| 0.0 | 0.1 | GO:0030311 | poly-N-acetyllactosamine biosynthetic process(GO:0030311) |
| 0.0 | 0.1 | GO:0006990 | positive regulation of transcription from RNA polymerase II promoter involved in unfolded protein response(GO:0006990) |
| 0.0 | 0.1 | GO:0044861 | protein transport into plasma membrane raft(GO:0044861) positive regulation of calcium:sodium antiporter activity(GO:1903281) positive regulation of potassium ion import(GO:1903288) |
| 0.0 | 0.0 | GO:0035989 | tendon development(GO:0035989) |
| 0.0 | 0.1 | GO:2000683 | mesodermal-endodermal cell signaling(GO:0003131) programmed DNA elimination(GO:0031049) chromosome breakage(GO:0031052) histone H2A-S139 phosphorylation(GO:0035978) regulation of cellular response to X-ray(GO:2000683) positive regulation of cellular response to X-ray(GO:2000685) |
| 0.0 | 0.2 | GO:0006558 | L-phenylalanine metabolic process(GO:0006558) L-phenylalanine catabolic process(GO:0006559) erythrose 4-phosphate/phosphoenolpyruvate family amino acid metabolic process(GO:1902221) erythrose 4-phosphate/phosphoenolpyruvate family amino acid catabolic process(GO:1902222) |
| 0.0 | 0.2 | GO:0060539 | diaphragm development(GO:0060539) |
| 0.0 | 0.1 | GO:0050893 | sensory processing(GO:0050893) |
| 0.0 | 0.2 | GO:0015886 | heme transport(GO:0015886) |
| 0.0 | 0.1 | GO:0005986 | sucrose biosynthetic process(GO:0005986) |
| 0.0 | 0.1 | GO:0006689 | ganglioside catabolic process(GO:0006689) |
| 0.0 | 0.1 | GO:0060573 | ventral spinal cord interneuron specification(GO:0021521) cell fate specification involved in pattern specification(GO:0060573) |
| 0.0 | 0.3 | GO:0035246 | peptidyl-arginine N-methylation(GO:0035246) |
| 0.0 | 0.2 | GO:0031580 | membrane raft polarization(GO:0001766) membrane raft distribution(GO:0031580) |
| 0.0 | 0.3 | GO:0046007 | negative regulation of activated T cell proliferation(GO:0046007) |
| 0.0 | 0.1 | GO:0042426 | choline catabolic process(GO:0042426) |
| 0.0 | 0.0 | GO:1900369 | transcription, RNA-templated(GO:0001172) negative regulation of RNA interference(GO:1900369) |
| 0.0 | 0.0 | GO:0061299 | retina vasculature development in camera-type eye(GO:0061298) retina vasculature morphogenesis in camera-type eye(GO:0061299) |
| 0.0 | 0.6 | GO:0007214 | gamma-aminobutyric acid signaling pathway(GO:0007214) |
| 0.0 | 0.1 | GO:0007221 | positive regulation of transcription of Notch receptor target(GO:0007221) |
| 0.0 | 0.1 | GO:2000821 | regulation of grooming behavior(GO:2000821) |
| 0.0 | 0.1 | GO:0003096 | renal sodium ion transport(GO:0003096) renal sodium ion absorption(GO:0070294) |
| 0.0 | 0.0 | GO:0010841 | positive regulation of circadian sleep/wake cycle, wakefulness(GO:0010841) |
| 0.0 | 0.1 | GO:0097676 | cell migration involved in vasculogenesis(GO:0035441) histone H3-K36 dimethylation(GO:0097676) |
| 0.0 | 0.0 | GO:1900042 | positive regulation of interleukin-2 secretion(GO:1900042) |
| 0.0 | 0.1 | GO:0070309 | lens fiber cell morphogenesis(GO:0070309) |
| 0.0 | 0.2 | GO:0048387 | negative regulation of retinoic acid receptor signaling pathway(GO:0048387) |
| 0.0 | 0.4 | GO:0070262 | peptidyl-serine dephosphorylation(GO:0070262) |
| 0.0 | 0.1 | GO:0044821 | meiotic telomere tethering at nuclear periphery(GO:0044821) meiotic attachment of telomere to nuclear envelope(GO:0070197) chromosome attachment to the nuclear envelope(GO:0097240) |
| 0.0 | 0.3 | GO:0071380 | cellular response to prostaglandin E stimulus(GO:0071380) |
| 0.0 | 0.1 | GO:0060125 | negative regulation of growth hormone secretion(GO:0060125) |
| 0.0 | 1.0 | GO:0018279 | peptidyl-asparagine modification(GO:0018196) protein N-linked glycosylation via asparagine(GO:0018279) |
| 0.0 | 0.2 | GO:0035630 | bone mineralization involved in bone maturation(GO:0035630) |
| 0.0 | 0.0 | GO:0070295 | renal water absorption(GO:0070295) |
| 0.0 | 0.5 | GO:0048009 | insulin-like growth factor receptor signaling pathway(GO:0048009) |
| 0.0 | 0.1 | GO:0060296 | regulation of cilium movement involved in cell motility(GO:0060295) regulation of cilium beat frequency involved in ciliary motility(GO:0060296) regulation of cilium-dependent cell motility(GO:1902019) |
| 0.0 | 0.1 | GO:2000768 | glomerular parietal epithelial cell differentiation(GO:0072139) positive regulation of epithelial cell differentiation involved in kidney development(GO:2000698) positive regulation of nephron tubule epithelial cell differentiation(GO:2000768) |
| 0.0 | 0.1 | GO:0035407 | histone H3-T11 phosphorylation(GO:0035407) |
| 0.0 | 0.2 | GO:0009143 | nucleoside triphosphate catabolic process(GO:0009143) |
| 0.0 | 0.1 | GO:0035105 | sterol regulatory element binding protein import into nucleus(GO:0035105) |
| 0.0 | 0.1 | GO:0015864 | pyrimidine nucleoside transport(GO:0015864) |
| 0.0 | 0.2 | GO:0019388 | galactose catabolic process(GO:0019388) |
| 0.0 | 0.2 | GO:1902083 | negative regulation of peptidyl-cysteine S-nitrosylation(GO:1902083) |
| 0.0 | 0.0 | GO:0060040 | retinal bipolar neuron differentiation(GO:0060040) |
| 0.0 | 0.4 | GO:0007158 | neuron cell-cell adhesion(GO:0007158) |
| 0.0 | 0.2 | GO:0006884 | cell volume homeostasis(GO:0006884) |
| 0.0 | 0.0 | GO:0006667 | sphinganine metabolic process(GO:0006667) |
| 0.0 | 0.2 | GO:0005513 | detection of calcium ion(GO:0005513) |
| 0.0 | 0.2 | GO:0010759 | positive regulation of macrophage chemotaxis(GO:0010759) |
| 0.0 | 0.1 | GO:0030223 | neutrophil differentiation(GO:0030223) |
| 0.0 | 0.1 | GO:0033631 | cell-cell adhesion mediated by integrin(GO:0033631) |
| 0.0 | 0.1 | GO:0033227 | dsRNA transport(GO:0033227) |
| 0.0 | 0.3 | GO:0035493 | SNARE complex assembly(GO:0035493) |
| 0.0 | 0.2 | GO:0071397 | cellular response to cholesterol(GO:0071397) |
| 0.0 | 0.8 | GO:0001895 | retina homeostasis(GO:0001895) |
| 0.0 | 0.1 | GO:0016486 | peptide hormone processing(GO:0016486) |
Gene overrepresentation in cellular_component category:
| Log-likelihood per target | Total log-likelihood | Term | Description |
|---|---|---|---|
| 0.2 | 0.6 | GO:0060187 | cell pole(GO:0060187) |
| 0.1 | 0.6 | GO:0034673 | inhibin-betaglycan-ActRII complex(GO:0034673) |
| 0.1 | 1.7 | GO:0097487 | multivesicular body, internal vesicle(GO:0097487) |
| 0.1 | 0.6 | GO:0001652 | granular component(GO:0001652) |
| 0.1 | 0.6 | GO:0098575 | lumenal side of lysosomal membrane(GO:0098575) |
| 0.1 | 0.2 | GO:0018444 | translation release factor complex(GO:0018444) |
| 0.1 | 0.4 | GO:0060200 | clathrin-sculpted acetylcholine transport vesicle(GO:0060200) clathrin-sculpted acetylcholine transport vesicle membrane(GO:0060201) |
| 0.1 | 0.8 | GO:0071953 | elastic fiber(GO:0071953) |
| 0.1 | 0.2 | GO:0043260 | laminin-10 complex(GO:0043259) laminin-11 complex(GO:0043260) |
| 0.1 | 0.5 | GO:0016012 | sarcoglycan complex(GO:0016012) |
| 0.1 | 0.2 | GO:0070195 | growth hormone receptor complex(GO:0070195) |
| 0.1 | 0.4 | GO:0032541 | cortical endoplasmic reticulum(GO:0032541) |
| 0.1 | 0.1 | GO:0034680 | integrin alpha10-beta1 complex(GO:0034680) |
| 0.1 | 0.3 | GO:0005899 | insulin receptor complex(GO:0005899) |
| 0.1 | 0.2 | GO:0060053 | neurofilament cytoskeleton(GO:0060053) |
| 0.0 | 0.2 | GO:0097224 | sperm connecting piece(GO:0097224) |
| 0.0 | 0.3 | GO:0016035 | zeta DNA polymerase complex(GO:0016035) |
| 0.0 | 0.3 | GO:0070545 | PeBoW complex(GO:0070545) |
| 0.0 | 0.4 | GO:0070852 | cell body fiber(GO:0070852) |
| 0.0 | 1.4 | GO:0005605 | basal lamina(GO:0005605) |
| 0.0 | 0.6 | GO:0042622 | photoreceptor outer segment membrane(GO:0042622) |
| 0.0 | 0.1 | GO:0071062 | alphav-beta3 integrin-vitronectin complex(GO:0071062) |
| 0.0 | 0.4 | GO:0060091 | kinocilium(GO:0060091) |
| 0.0 | 1.0 | GO:0010369 | chromocenter(GO:0010369) |
| 0.0 | 0.3 | GO:0030868 | smooth endoplasmic reticulum membrane(GO:0030868) smooth endoplasmic reticulum part(GO:0097425) |
| 0.0 | 0.2 | GO:0065010 | extracellular membrane-bounded organelle(GO:0065010) |
| 0.0 | 0.4 | GO:0005583 | fibrillar collagen trimer(GO:0005583) banded collagen fibril(GO:0098643) |
| 0.0 | 0.2 | GO:0042406 | extrinsic component of endoplasmic reticulum membrane(GO:0042406) |
| 0.0 | 0.1 | GO:0032937 | SREBP-SCAP-Insig complex(GO:0032937) |
| 0.0 | 0.5 | GO:0008250 | oligosaccharyltransferase complex(GO:0008250) |
| 0.0 | 0.7 | GO:0016471 | vacuolar proton-transporting V-type ATPase complex(GO:0016471) |
| 0.0 | 0.2 | GO:1990635 | proximal dendrite(GO:1990635) |
| 0.0 | 0.5 | GO:0097512 | cardiac myofibril(GO:0097512) |
| 0.0 | 0.3 | GO:0042583 | chromaffin granule(GO:0042583) |
| 0.0 | 0.4 | GO:0001518 | voltage-gated sodium channel complex(GO:0001518) |
| 0.0 | 0.2 | GO:0032437 | cuticular plate(GO:0032437) |
| 0.0 | 0.2 | GO:0016342 | catenin complex(GO:0016342) |
| 0.0 | 0.2 | GO:0031594 | neuromuscular junction(GO:0031594) |
| 0.0 | 0.3 | GO:0005589 | collagen type VI trimer(GO:0005589) collagen beaded filament(GO:0098647) |
| 0.0 | 0.5 | GO:0098563 | integral component of synaptic vesicle membrane(GO:0030285) intrinsic component of synaptic vesicle membrane(GO:0098563) |
| 0.0 | 0.6 | GO:0005892 | acetylcholine-gated channel complex(GO:0005892) |
| 0.0 | 0.1 | GO:0034667 | integrin alpha3-beta1 complex(GO:0034667) |
| 0.0 | 1.0 | GO:0005790 | smooth endoplasmic reticulum(GO:0005790) |
| 0.0 | 0.1 | GO:0005797 | Golgi medial cisterna(GO:0005797) |
| 0.0 | 0.2 | GO:0005641 | nuclear envelope lumen(GO:0005641) |
| 0.0 | 0.2 | GO:0042719 | mitochondrial intermembrane space protein transporter complex(GO:0042719) |
| 0.0 | 2.2 | GO:0005901 | caveola(GO:0005901) |
| 0.0 | 0.4 | GO:1990124 | messenger ribonucleoprotein complex(GO:1990124) |
| 0.0 | 0.1 | GO:0071438 | invadopodium membrane(GO:0071438) |
| 0.0 | 0.1 | GO:0043196 | varicosity(GO:0043196) |
| 0.0 | 0.1 | GO:0044666 | MLL3/4 complex(GO:0044666) |
| 0.0 | 0.3 | GO:0048188 | Set1C/COMPASS complex(GO:0048188) |
| 0.0 | 0.1 | GO:0031313 | extrinsic component of endosome membrane(GO:0031313) |
| 0.0 | 1.5 | GO:0035580 | specific granule lumen(GO:0035580) |
| 0.0 | 0.5 | GO:0030867 | rough endoplasmic reticulum membrane(GO:0030867) |
| 0.0 | 0.0 | GO:0033565 | ESCRT-0 complex(GO:0033565) |
| 0.0 | 0.0 | GO:0031379 | RNA-directed RNA polymerase complex(GO:0031379) |
| 0.0 | 0.3 | GO:0071782 | endoplasmic reticulum tubular network(GO:0071782) |
| 0.0 | 0.3 | GO:0016281 | eukaryotic translation initiation factor 4F complex(GO:0016281) |
| 0.0 | 0.7 | GO:0048786 | presynaptic active zone(GO:0048786) |
| 0.0 | 0.3 | GO:0043194 | axon initial segment(GO:0043194) |
| 0.0 | 0.0 | GO:0002945 | cyclin K-CDK13 complex(GO:0002945) |
| 0.0 | 0.2 | GO:0043190 | ATP-binding cassette (ABC) transporter complex(GO:0043190) |
| 0.0 | 0.0 | GO:0034455 | t-UTP complex(GO:0034455) |
| 0.0 | 0.8 | GO:0005801 | cis-Golgi network(GO:0005801) |
| 0.0 | 0.1 | GO:0097208 | alveolar lamellar body(GO:0097208) |
| 0.0 | 0.1 | GO:0036128 | CatSper complex(GO:0036128) |
| 0.0 | 0.1 | GO:0071008 | U2-type post-mRNA release spliceosomal complex(GO:0071008) |
| 0.0 | 0.1 | GO:0005971 | ribonucleoside-diphosphate reductase complex(GO:0005971) |
| 0.0 | 0.1 | GO:0005658 | alpha DNA polymerase:primase complex(GO:0005658) |
| 0.0 | 0.3 | GO:0030140 | trans-Golgi network transport vesicle(GO:0030140) |
| 0.0 | 0.3 | GO:0043204 | perikaryon(GO:0043204) |
| 0.0 | 0.0 | GO:0043231 | intracellular membrane-bounded organelle(GO:0043231) |
| 0.0 | 1.1 | GO:0031463 | Cul3-RING ubiquitin ligase complex(GO:0031463) |
| 0.0 | 0.2 | GO:0097038 | perinuclear endoplasmic reticulum(GO:0097038) |
| 0.0 | 0.4 | GO:0000159 | protein phosphatase type 2A complex(GO:0000159) |
| 0.0 | 0.2 | GO:0001891 | phagocytic cup(GO:0001891) |
Gene overrepresentation in molecular_function category:
| Log-likelihood per target | Total log-likelihood | Term | Description |
|---|---|---|---|
| 0.3 | 2.3 | GO:0060072 | large conductance calcium-activated potassium channel activity(GO:0060072) |
| 0.2 | 1.5 | GO:0043237 | laminin-1 binding(GO:0043237) |
| 0.2 | 0.5 | GO:0008475 | procollagen-lysine 5-dioxygenase activity(GO:0008475) procollagen glucosyltransferase activity(GO:0033823) |
| 0.1 | 0.4 | GO:0086062 | voltage-gated sodium channel activity involved in Purkinje myocyte action potential(GO:0086062) |
| 0.1 | 0.3 | GO:0016603 | glutaminyl-peptide cyclotransferase activity(GO:0016603) |
| 0.1 | 0.6 | GO:0018479 | benzaldehyde dehydrogenase (NAD+) activity(GO:0018479) |
| 0.1 | 0.3 | GO:0015928 | alpha-L-fucosidase activity(GO:0004560) fucosidase activity(GO:0015928) |
| 0.1 | 0.3 | GO:0000253 | 3-keto sterol reductase activity(GO:0000253) |
| 0.1 | 0.3 | GO:0008431 | vitamin E binding(GO:0008431) |
| 0.1 | 0.3 | GO:0070051 | fibrinogen binding(GO:0070051) |
| 0.1 | 0.3 | GO:0004597 | peptide-aspartate beta-dioxygenase activity(GO:0004597) |
| 0.1 | 0.7 | GO:0004308 | exo-alpha-sialidase activity(GO:0004308) alpha-sialidase activity(GO:0016997) |
| 0.1 | 0.3 | GO:0016262 | protein N-acetylglucosaminyltransferase activity(GO:0016262) |
| 0.1 | 0.2 | GO:0004779 | adenylylsulfate kinase activity(GO:0004020) sulfate adenylyltransferase activity(GO:0004779) sulfate adenylyltransferase (ATP) activity(GO:0004781) |
| 0.1 | 0.2 | GO:0050429 | calcium-dependent phospholipase C activity(GO:0050429) |
| 0.1 | 0.2 | GO:0015439 | heme-transporting ATPase activity(GO:0015439) |
| 0.1 | 0.3 | GO:0032038 | myosin II heavy chain binding(GO:0032038) |
| 0.1 | 0.3 | GO:0035373 | chondroitin sulfate proteoglycan binding(GO:0035373) |
| 0.1 | 0.6 | GO:0043533 | inositol 1,3,4,5 tetrakisphosphate binding(GO:0043533) |
| 0.1 | 0.1 | GO:0035403 | histone kinase activity (H3-T6 specific)(GO:0035403) |
| 0.1 | 0.4 | GO:0005353 | fructose transmembrane transporter activity(GO:0005353) |
| 0.1 | 0.3 | GO:0042954 | lipoprotein transporter activity(GO:0042954) |
| 0.1 | 0.5 | GO:0008379 | thioredoxin peroxidase activity(GO:0008379) |
| 0.1 | 0.6 | GO:0005114 | type II transforming growth factor beta receptor binding(GO:0005114) |
| 0.1 | 0.1 | GO:0070325 | lipoprotein particle receptor binding(GO:0070325) |
| 0.1 | 0.5 | GO:0043023 | ribosomal large subunit binding(GO:0043023) |
| 0.1 | 0.2 | GO:0047192 | 1-alkylglycerophosphocholine O-acetyltransferase activity(GO:0047192) |
| 0.1 | 0.8 | GO:0048407 | platelet-derived growth factor binding(GO:0048407) |
| 0.0 | 0.2 | GO:0038025 | reelin receptor activity(GO:0038025) |
| 0.0 | 0.3 | GO:0072320 | volume-sensitive chloride channel activity(GO:0072320) |
| 0.0 | 0.2 | GO:0004505 | phenylalanine 4-monooxygenase activity(GO:0004505) |
| 0.0 | 0.6 | GO:0022851 | GABA-gated chloride ion channel activity(GO:0022851) |
| 0.0 | 0.3 | GO:0035368 | selenocysteine insertion sequence binding(GO:0035368) |
| 0.0 | 0.1 | GO:0030377 | urokinase plasminogen activator receptor activity(GO:0030377) |
| 0.0 | 0.4 | GO:0070290 | N-acylphosphatidylethanolamine-specific phospholipase D activity(GO:0070290) |
| 0.0 | 0.4 | GO:0015349 | thyroid hormone transmembrane transporter activity(GO:0015349) |
| 0.0 | 0.2 | GO:0046556 | alpha-L-arabinofuranosidase activity(GO:0046556) |
| 0.0 | 0.5 | GO:0031995 | insulin-like growth factor II binding(GO:0031995) |
| 0.0 | 0.3 | GO:0030197 | extracellular matrix constituent, lubricant activity(GO:0030197) |
| 0.0 | 0.5 | GO:0005225 | volume-sensitive anion channel activity(GO:0005225) |
| 0.0 | 0.1 | GO:0042799 | histone methyltransferase activity (H4-K20 specific)(GO:0042799) |
| 0.0 | 0.2 | GO:0035252 | UDP-xylosyltransferase activity(GO:0035252) xylosyltransferase activity(GO:0042285) |
| 0.0 | 0.1 | GO:0070506 | high-density lipoprotein particle receptor activity(GO:0070506) |
| 0.0 | 0.1 | GO:0004694 | eukaryotic translation initiation factor 2alpha kinase activity(GO:0004694) |
| 0.0 | 0.2 | GO:0004994 | somatostatin receptor activity(GO:0004994) |
| 0.0 | 0.2 | GO:0070006 | metalloaminopeptidase activity(GO:0070006) |
| 0.0 | 0.5 | GO:0004579 | dolichyl-diphosphooligosaccharide-protein glycotransferase activity(GO:0004579) |
| 0.0 | 0.1 | GO:0046538 | bisphosphoglycerate mutase activity(GO:0004082) phosphoglycerate mutase activity(GO:0004619) 2,3-bisphosphoglycerate-dependent phosphoglycerate mutase activity(GO:0046538) |
| 0.0 | 0.3 | GO:0001849 | complement component C1q binding(GO:0001849) |
| 0.0 | 0.1 | GO:0050254 | rhodopsin kinase activity(GO:0050254) |
| 0.0 | 0.2 | GO:0016971 | flavin-linked sulfhydryl oxidase activity(GO:0016971) |
| 0.0 | 0.2 | GO:0004359 | glutaminase activity(GO:0004359) |
| 0.0 | 0.7 | GO:0051787 | misfolded protein binding(GO:0051787) |
| 0.0 | 0.5 | GO:0045236 | CXCR chemokine receptor binding(GO:0045236) |
| 0.0 | 0.1 | GO:0033829 | O-fucosylpeptide 3-beta-N-acetylglucosaminyltransferase activity(GO:0033829) |
| 0.0 | 0.1 | GO:0008969 | phosphohistidine phosphatase activity(GO:0008969) |
| 0.0 | 0.2 | GO:0030348 | syntaxin-3 binding(GO:0030348) |
| 0.0 | 0.2 | GO:0001076 | transcription factor activity, RNA polymerase II transcription factor binding(GO:0001076) |
| 0.0 | 0.1 | GO:0030395 | lactose binding(GO:0030395) |
| 0.0 | 0.1 | GO:0046975 | histone methyltransferase activity (H3-K36 specific)(GO:0046975) |
| 0.0 | 0.1 | GO:0070576 | vitamin D 24-hydroxylase activity(GO:0070576) |
| 0.0 | 0.1 | GO:0004886 | 9-cis retinoic acid receptor activity(GO:0004886) |
| 0.0 | 0.1 | GO:0008745 | N-acetylmuramoyl-L-alanine amidase activity(GO:0008745) |
| 0.0 | 0.2 | GO:0004614 | phosphoglucomutase activity(GO:0004614) |
| 0.0 | 0.2 | GO:0005384 | manganese ion transmembrane transporter activity(GO:0005384) |
| 0.0 | 0.2 | GO:0052650 | NADP-retinol dehydrogenase activity(GO:0052650) |
| 0.0 | 0.1 | GO:0008798 | beta-aspartyl-peptidase activity(GO:0008798) |
| 0.0 | 0.3 | GO:0031681 | G-protein beta-subunit binding(GO:0031681) |
| 0.0 | 0.3 | GO:0050693 | LBD domain binding(GO:0050693) |
| 0.0 | 0.1 | GO:0051033 | nucleic acid transmembrane transporter activity(GO:0051032) RNA transmembrane transporter activity(GO:0051033) |
| 0.0 | 0.5 | GO:0016864 | protein disulfide isomerase activity(GO:0003756) intramolecular oxidoreductase activity, transposing S-S bonds(GO:0016864) |
| 0.0 | 0.4 | GO:0070628 | proteasome binding(GO:0070628) |
| 0.0 | 0.2 | GO:1901612 | cardiolipin binding(GO:1901612) |
| 0.0 | 0.1 | GO:0000033 | alpha-1,3-mannosyltransferase activity(GO:0000033) |
| 0.0 | 0.1 | GO:0004727 | prenylated protein tyrosine phosphatase activity(GO:0004727) |
| 0.0 | 0.1 | GO:0004960 | thromboxane receptor activity(GO:0004960) thromboxane A2 receptor activity(GO:0004961) |
| 0.0 | 0.5 | GO:0000030 | mannosyltransferase activity(GO:0000030) |
| 0.0 | 0.5 | GO:0043274 | phospholipase binding(GO:0043274) |
| 0.0 | 0.6 | GO:0005001 | transmembrane receptor protein tyrosine phosphatase activity(GO:0005001) transmembrane receptor protein phosphatase activity(GO:0019198) |
| 0.0 | 0.2 | GO:0046923 | ER retention sequence binding(GO:0046923) |
| 0.0 | 0.2 | GO:0043560 | insulin receptor substrate binding(GO:0043560) |
| 0.0 | 0.4 | GO:0005068 | transmembrane receptor protein tyrosine kinase adaptor activity(GO:0005068) |
| 0.0 | 0.5 | GO:0042800 | histone methyltransferase activity (H3-K4 specific)(GO:0042800) |
| 0.0 | 0.1 | GO:0017095 | heparan sulfate 6-O-sulfotransferase activity(GO:0017095) |
| 0.0 | 0.2 | GO:0015220 | choline transmembrane transporter activity(GO:0015220) |
| 0.0 | 0.7 | GO:0008395 | steroid hydroxylase activity(GO:0008395) |
| 0.0 | 0.1 | GO:0055077 | gap junction hemi-channel activity(GO:0055077) |
| 0.0 | 0.1 | GO:0035501 | MH1 domain binding(GO:0035501) |
| 0.0 | 0.1 | GO:0019976 | interleukin-2 receptor activity(GO:0004911) interleukin-2 binding(GO:0019976) |
| 0.0 | 0.1 | GO:0042132 | fructose 1,6-bisphosphate 1-phosphatase activity(GO:0042132) |
| 0.0 | 0.3 | GO:0016273 | arginine N-methyltransferase activity(GO:0016273) protein-arginine N-methyltransferase activity(GO:0016274) |
| 0.0 | 0.1 | GO:0004118 | cGMP-stimulated cyclic-nucleotide phosphodiesterase activity(GO:0004118) |
| 0.0 | 0.2 | GO:0003993 | acid phosphatase activity(GO:0003993) |
| 0.0 | 0.2 | GO:0042975 | peroxisome proliferator activated receptor binding(GO:0042975) |
| 0.0 | 0.1 | GO:0016206 | catechol O-methyltransferase activity(GO:0016206) |
| 0.0 | 0.2 | GO:0032027 | myosin light chain binding(GO:0032027) |
| 0.0 | 0.0 | GO:0003968 | RNA-directed RNA polymerase activity(GO:0003968) |
| 0.0 | 0.1 | GO:0004771 | sterol esterase activity(GO:0004771) |
| 0.0 | 0.4 | GO:0005112 | Notch binding(GO:0005112) |
| 0.0 | 0.5 | GO:0005212 | structural constituent of eye lens(GO:0005212) |
| 0.0 | 0.1 | GO:0017049 | GTP-Rho binding(GO:0017049) |
| 0.0 | 0.1 | GO:0009041 | uridylate kinase activity(GO:0009041) |
| 0.0 | 0.2 | GO:0019911 | structural constituent of myelin sheath(GO:0019911) |
| 0.0 | 0.8 | GO:0016504 | peptidase activator activity(GO:0016504) |
| 0.0 | 0.3 | GO:0022848 | acetylcholine-gated cation channel activity(GO:0022848) |
| 0.0 | 0.1 | GO:0032050 | clathrin heavy chain binding(GO:0032050) |
| 0.0 | 0.1 | GO:0016728 | ribonucleoside-diphosphate reductase activity, thioredoxin disulfide as acceptor(GO:0004748) oxidoreductase activity, acting on CH or CH2 groups, disulfide as acceptor(GO:0016728) ribonucleoside-diphosphate reductase activity(GO:0061731) |
| 0.0 | 0.1 | GO:0035402 | histone kinase activity (H3-T11 specific)(GO:0035402) |
| 0.0 | 0.2 | GO:0004559 | alpha-mannosidase activity(GO:0004559) |
| 0.0 | 0.2 | GO:0086080 | protein binding involved in heterotypic cell-cell adhesion(GO:0086080) |
| 0.0 | 0.1 | GO:0043184 | vascular endothelial growth factor receptor 2 binding(GO:0043184) |
| 0.0 | 0.5 | GO:0005109 | frizzled binding(GO:0005109) |
| 0.0 | 0.3 | GO:0043548 | phosphatidylinositol 3-kinase binding(GO:0043548) |
| 0.0 | 0.4 | GO:0001671 | ATPase activator activity(GO:0001671) |
| 0.0 | 0.0 | GO:0050135 | NAD(P)+ nucleosidase activity(GO:0050135) |
| 0.0 | 0.2 | GO:0005247 | voltage-gated chloride channel activity(GO:0005247) |
| 0.0 | 0.2 | GO:0005351 | sugar:proton symporter activity(GO:0005351) cation:sugar symporter activity(GO:0005402) |
| 0.0 | 0.0 | GO:0033906 | protein tyrosine kinase inhibitor activity(GO:0030292) hyaluronoglucuronidase activity(GO:0033906) |
| 0.0 | 0.1 | GO:0045545 | syndecan binding(GO:0045545) |
Gene overrepresentation in C2:CP category:
| Log-likelihood per target | Total log-likelihood | Term | Description |
|---|---|---|---|
| 0.0 | 2.2 | NABA BASEMENT MEMBRANES | Genes encoding structural components of basement membranes |
| 0.0 | 0.2 | ST IL 13 PATHWAY | Interleukin 13 (IL-13) Pathway |
| 0.0 | 4.4 | NABA ECM GLYCOPROTEINS | Genes encoding structural ECM glycoproteins |
| 0.0 | 0.3 | PID S1P S1P2 PATHWAY | S1P2 pathway |
| 0.0 | 0.9 | PID HES HEY PATHWAY | Notch-mediated HES/HEY network |
| 0.0 | 0.5 | ST MYOCYTE AD PATHWAY | Myocyte Adrenergic Pathway is a specific case of the generalized Adrenergic Pathway. |
| 0.0 | 0.3 | PID THROMBIN PAR4 PATHWAY | PAR4-mediated thrombin signaling events |
| 0.0 | 0.4 | PID ARF6 DOWNSTREAM PATHWAY | Arf6 downstream pathway |
| 0.0 | 0.5 | PID LYMPH ANGIOGENESIS PATHWAY | VEGFR3 signaling in lymphatic endothelium |
| 0.0 | 0.1 | PID HDAC CLASSII PATHWAY | Signaling events mediated by HDAC Class II |
| 0.0 | 0.4 | PID LIS1 PATHWAY | Lissencephaly gene (LIS1) in neuronal migration and development |
Gene overrepresentation in C2:CP:REACTOME category:
| Log-likelihood per target | Total log-likelihood | Term | Description |
|---|---|---|---|
| 0.1 | 0.2 | REACTOME PHOSPHORYLATION OF CD3 AND TCR ZETA CHAINS | Genes involved in Phosphorylation of CD3 and TCR zeta chains |
| 0.1 | 1.1 | REACTOME NOREPINEPHRINE NEUROTRANSMITTER RELEASE CYCLE | Genes involved in Norepinephrine Neurotransmitter Release Cycle |
| 0.0 | 1.7 | REACTOME SPHINGOLIPID DE NOVO BIOSYNTHESIS | Genes involved in Sphingolipid de novo biosynthesis |
| 0.0 | 2.3 | REACTOME COLLAGEN FORMATION | Genes involved in Collagen formation |
| 0.0 | 0.9 | REACTOME INSULIN RECEPTOR RECYCLING | Genes involved in Insulin receptor recycling |
| 0.0 | 0.3 | REACTOME ACTIVATION OF CHAPERONE GENES BY ATF6 ALPHA | Genes involved in Activation of Chaperone Genes by ATF6-alpha |
| 0.0 | 0.6 | REACTOME GABA A RECEPTOR ACTIVATION | Genes involved in GABA A receptor activation |
| 0.0 | 0.4 | REACTOME FACILITATIVE NA INDEPENDENT GLUCOSE TRANSPORTERS | Genes involved in Facilitative Na+-independent glucose transporters |
| 0.0 | 0.6 | REACTOME BIOSYNTHESIS OF THE N GLYCAN PRECURSOR DOLICHOL LIPID LINKED OLIGOSACCHARIDE LLO AND TRANSFER TO A NASCENT PROTEIN | Genes involved in Biosynthesis of the N-glycan precursor (dolichol lipid-linked oligosaccharide, LLO) and transfer to a nascent protein |
| 0.0 | 0.0 | REACTOME NEP NS2 INTERACTS WITH THE CELLULAR EXPORT MACHINERY | Genes involved in NEP/NS2 Interacts with the Cellular Export Machinery |
| 0.0 | 0.2 | REACTOME PLATELET SENSITIZATION BY LDL | Genes involved in Platelet sensitization by LDL |
| 0.0 | 0.5 | REACTOME G BETA GAMMA SIGNALLING THROUGH PLC BETA | Genes involved in G beta:gamma signalling through PLC beta |
| 0.0 | 0.3 | REACTOME SIGNAL ATTENUATION | Genes involved in Signal attenuation |
| 0.0 | 0.7 | REACTOME YAP1 AND WWTR1 TAZ STIMULATED GENE EXPRESSION | Genes involved in YAP1- and WWTR1 (TAZ)-stimulated gene expression |
| 0.0 | 0.6 | REACTOME INTERACTION BETWEEN L1 AND ANKYRINS | Genes involved in Interaction between L1 and Ankyrins |
| 0.0 | 0.4 | REACTOME GRB2 SOS PROVIDES LINKAGE TO MAPK SIGNALING FOR INTERGRINS | Genes involved in GRB2:SOS provides linkage to MAPK signaling for Intergrins |
| 0.0 | 0.4 | REACTOME PROLACTIN RECEPTOR SIGNALING | Genes involved in Prolactin receptor signaling |
| 0.0 | 0.0 | REACTOME ACETYLCHOLINE NEUROTRANSMITTER RELEASE CYCLE | Genes involved in Acetylcholine Neurotransmitter Release Cycle |
| 0.0 | 0.5 | REACTOME ADHERENS JUNCTIONS INTERACTIONS | Genes involved in Adherens junctions interactions |
| 0.0 | 0.3 | REACTOME ENDOGENOUS STEROLS | Genes involved in Endogenous sterols |
| 0.0 | 0.3 | REACTOME SYNTHESIS OF BILE ACIDS AND BILE SALTS | Genes involved in Synthesis of bile acids and bile salts |
| 0.0 | 0.2 | REACTOME GLUTAMATE NEUROTRANSMITTER RELEASE CYCLE | Genes involved in Glutamate Neurotransmitter Release Cycle |
| 0.0 | 0.3 | REACTOME ORGANIC CATION ANION ZWITTERION TRANSPORT | Genes involved in Organic cation/anion/zwitterion transport |
| 0.0 | 0.7 | REACTOME SPHINGOLIPID METABOLISM | Genes involved in Sphingolipid metabolism |
| 0.0 | 0.4 | REACTOME SYNTHESIS OF PC | Genes involved in Synthesis of PC |
| 0.0 | 0.2 | REACTOME HIGHLY CALCIUM PERMEABLE POSTSYNAPTIC NICOTINIC ACETYLCHOLINE RECEPTORS | Genes involved in Highly calcium permeable postsynaptic nicotinic acetylcholine receptors |
| 0.0 | 0.3 | REACTOME CELL EXTRACELLULAR MATRIX INTERACTIONS | Genes involved in Cell-extracellular matrix interactions |