Project
Epithelial-Mesenchymal Transition, human (Scheel, 2011)
Navigation
Downloads
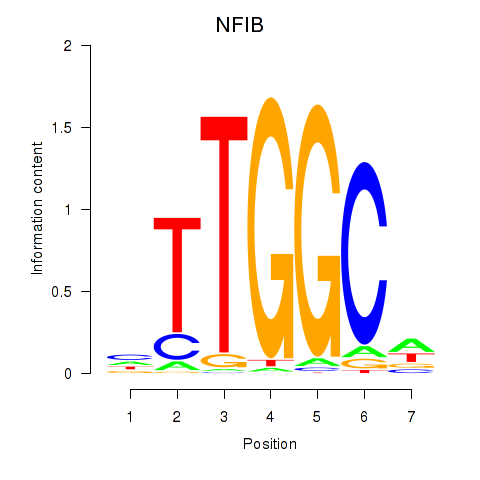
Results for NFIX_NFIB
Z-value: 1.80
Motif logo

Transcription factors associated with NFIX_NFIB
| Gene Symbol | Gene ID | Gene Info |
|---|---|---|
|
NFIX
|
ENSG00000008441.12 | NFIX |
|
NFIB
|
ENSG00000147862.10 | NFIB |
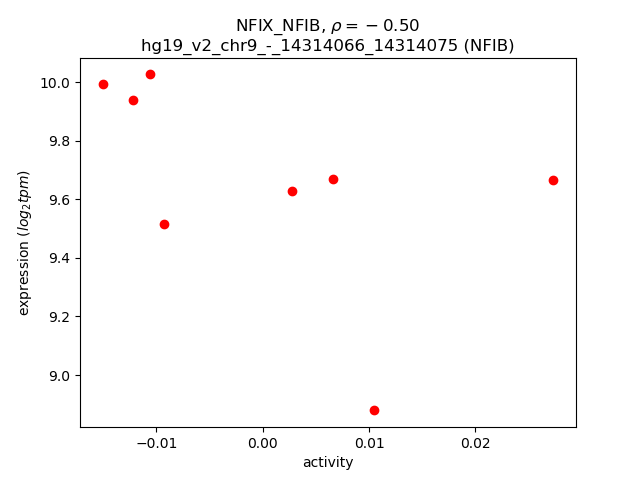
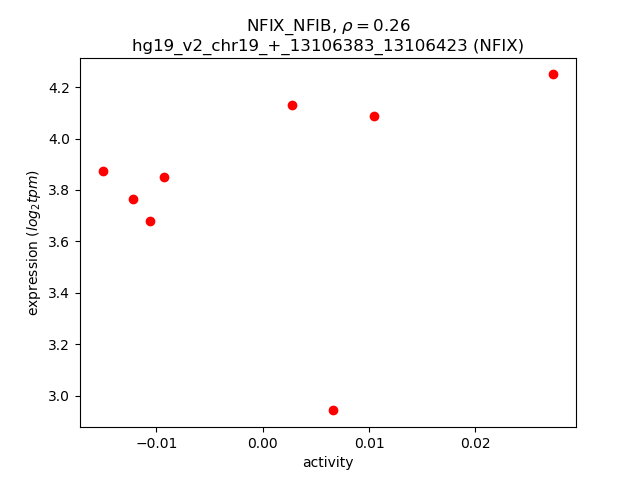
Activity-expression correlation:
| Gene | Promoter | Pearson corr. coef. | P-value | Plot |
|---|---|---|---|---|
| NFIB | hg19_v2_chr9_-_14314066_14314075, hg19_v2_chr9_-_14314566_14314618, hg19_v2_chr9_-_14314518_14314556, hg19_v2_chr9_-_14313641_14313666 | -0.50 | 2.0e-01 | Click! |
| NFIX | hg19_v2_chr19_+_13106383_13106423, hg19_v2_chr19_+_13135731_13135787, hg19_v2_chr19_+_13134772_13134846 | 0.26 | 5.4e-01 | Click! |
Activity profile of NFIX_NFIB motif
Sorted Z-values of NFIX_NFIB motif
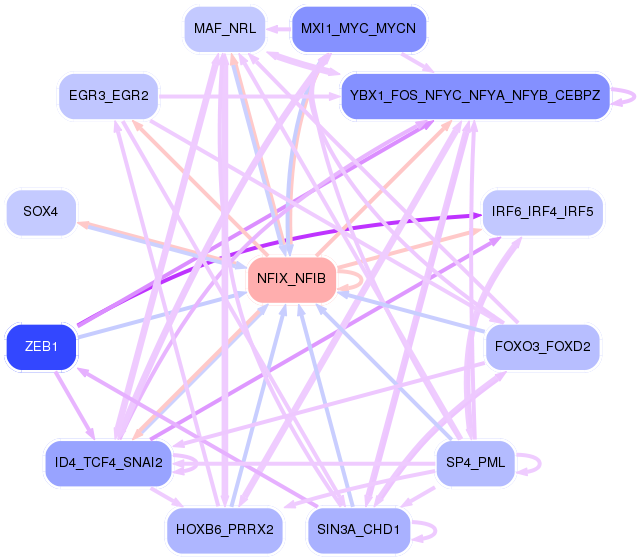
Network of associatons between targets according to the STRING database.

First level regulatory network of NFIX_NFIB
| Promoter | Score | Transcript | Gene | Gene Info |
|---|---|---|---|---|
| chr3_-_189840223 | 1.27 |
ENST00000427335.2 |
LEPREL1 |
leprecan-like 1 |
| chr22_+_24990746 | 1.07 |
ENST00000456869.1 ENST00000411974.1 |
GGT1 |
gamma-glutamyltransferase 1 |
| chr14_+_96722539 | 0.94 |
ENST00000553356.1 |
BDKRB1 |
bradykinin receptor B1 |
| chr5_+_167181917 | 0.92 |
ENST00000519204.1 |
TENM2 |
teneurin transmembrane protein 2 |
| chr2_-_46385 | 0.90 |
ENST00000327669.4 |
FAM110C |
family with sequence similarity 110, member C |
| chr12_+_20848282 | 0.88 |
ENST00000545604.1 |
SLCO1C1 |
solute carrier organic anion transporter family, member 1C1 |
| chr12_+_20848377 | 0.82 |
ENST00000540354.1 ENST00000266509.2 ENST00000381552.1 |
SLCO1C1 |
solute carrier organic anion transporter family, member 1C1 |
| chr7_-_41742697 | 0.73 |
ENST00000242208.4 |
INHBA |
inhibin, beta A |
| chr11_+_1889880 | 0.73 |
ENST00000405957.2 |
LSP1 |
lymphocyte-specific protein 1 |
| chr1_+_153746683 | 0.71 |
ENST00000271857.2 |
SLC27A3 |
solute carrier family 27 (fatty acid transporter), member 3 |
| chr12_-_8815299 | 0.70 |
ENST00000535336.1 |
MFAP5 |
microfibrillar associated protein 5 |
| chr12_-_8815215 | 0.67 |
ENST00000544889.1 ENST00000543369.1 |
MFAP5 |
microfibrillar associated protein 5 |
| chr16_+_2880296 | 0.67 |
ENST00000571723.1 |
ZG16B |
zymogen granule protein 16B |
| chr6_+_30848557 | 0.67 |
ENST00000460944.2 ENST00000324771.8 |
DDR1 |
discoidin domain receptor tyrosine kinase 1 |
| chr14_+_75745477 | 0.66 |
ENST00000303562.4 ENST00000554617.1 ENST00000554212.1 ENST00000535987.1 ENST00000555242.1 |
FOS |
FBJ murine osteosarcoma viral oncogene homolog |
| chr11_+_6866883 | 0.65 |
ENST00000299454.4 ENST00000379831.2 |
OR10A5 |
olfactory receptor, family 10, subfamily A, member 5 |
| chr3_-_87040233 | 0.64 |
ENST00000398399.2 |
VGLL3 |
vestigial like 3 (Drosophila) |
| chr5_+_36608422 | 0.62 |
ENST00000381918.3 |
SLC1A3 |
solute carrier family 1 (glial high affinity glutamate transporter), member 3 |
| chr4_+_41614720 | 0.61 |
ENST00000509277.1 |
LIMCH1 |
LIM and calponin homology domains 1 |
| chr12_-_15038779 | 0.59 |
ENST00000228938.5 ENST00000539261.1 |
MGP |
matrix Gla protein |
| chr1_+_86889769 | 0.59 |
ENST00000370565.4 |
CLCA2 |
chloride channel accessory 2 |
| chr19_-_51456321 | 0.58 |
ENST00000391809.2 |
KLK5 |
kallikrein-related peptidase 5 |
| chr1_+_44399466 | 0.58 |
ENST00000498139.2 ENST00000491846.1 |
ARTN |
artemin |
| chr11_-_119999611 | 0.58 |
ENST00000529044.1 |
TRIM29 |
tripartite motif containing 29 |
| chr19_-_42894420 | 0.57 |
ENST00000597255.1 ENST00000222032.5 |
CNFN |
cornifelin |
| chr13_-_20805109 | 0.56 |
ENST00000241124.6 |
GJB6 |
gap junction protein, beta 6, 30kDa |
| chr19_-_6720686 | 0.55 |
ENST00000245907.6 |
C3 |
complement component 3 |
| chr19_-_51456344 | 0.55 |
ENST00000336334.3 ENST00000593428.1 |
KLK5 |
kallikrein-related peptidase 5 |
| chr12_+_6493319 | 0.55 |
ENST00000536876.1 |
LTBR |
lymphotoxin beta receptor (TNFR superfamily, member 3) |
| chr1_+_44398943 | 0.54 |
ENST00000372359.5 ENST00000414809.3 |
ARTN |
artemin |
| chr1_+_233749739 | 0.54 |
ENST00000366621.3 |
KCNK1 |
potassium channel, subfamily K, member 1 |
| chr1_-_242612779 | 0.54 |
ENST00000427495.1 |
PLD5 |
phospholipase D family, member 5 |
| chr22_-_51066521 | 0.53 |
ENST00000395621.3 ENST00000395619.3 ENST00000356098.5 ENST00000216124.5 ENST00000453344.2 ENST00000547307.1 ENST00000547805.1 |
ARSA |
arylsulfatase A |
| chr19_+_35609380 | 0.53 |
ENST00000604621.1 |
FXYD3 |
FXYD domain containing ion transport regulator 3 |
| chr19_+_17392672 | 0.53 |
ENST00000594072.1 ENST00000598347.1 |
ANKLE1 |
ankyrin repeat and LEM domain containing 1 |
| chr12_-_52685312 | 0.51 |
ENST00000327741.5 |
KRT81 |
keratin 81 |
| chr16_+_2880254 | 0.50 |
ENST00000570670.1 |
ZG16B |
zymogen granule protein 16B |
| chr17_+_54671047 | 0.50 |
ENST00000332822.4 |
NOG |
noggin |
| chr12_-_52911718 | 0.50 |
ENST00000548409.1 |
KRT5 |
keratin 5 |
| chr15_+_40532058 | 0.50 |
ENST00000260404.4 |
PAK6 |
p21 protein (Cdc42/Rac)-activated kinase 6 |
| chr6_-_29343068 | 0.50 |
ENST00000396806.3 |
OR12D3 |
olfactory receptor, family 12, subfamily D, member 3 |
| chrX_+_103031758 | 0.50 |
ENST00000303958.2 ENST00000361621.2 |
PLP1 |
proteolipid protein 1 |
| chr18_-_28622774 | 0.49 |
ENST00000434452.1 |
DSC3 |
desmocollin 3 |
| chr17_+_39394250 | 0.49 |
ENST00000254072.6 |
KRTAP9-8 |
keratin associated protein 9-8 |
| chr8_+_95653427 | 0.49 |
ENST00000454170.2 |
ESRP1 |
epithelial splicing regulatory protein 1 |
| chr1_-_209979465 | 0.49 |
ENST00000542854.1 |
IRF6 |
interferon regulatory factor 6 |
| chr19_+_45417921 | 0.49 |
ENST00000252491.4 ENST00000592885.1 ENST00000589781.1 |
APOC1 |
apolipoprotein C-I |
| chr17_-_39769005 | 0.49 |
ENST00000301653.4 ENST00000593067.1 |
KRT16 |
keratin 16 |
| chr15_+_40531243 | 0.48 |
ENST00000558055.1 ENST00000455577.2 |
PAK6 |
p21 protein (Cdc42/Rac)-activated kinase 6 |
| chr9_-_139948487 | 0.48 |
ENST00000355097.2 |
ENTPD2 |
ectonucleoside triphosphate diphosphohydrolase 2 |
| chr21_+_27011899 | 0.48 |
ENST00000425221.2 |
JAM2 |
junctional adhesion molecule 2 |
| chr6_-_39197226 | 0.48 |
ENST00000359534.3 |
KCNK5 |
potassium channel, subfamily K, member 5 |
| chr16_-_79634595 | 0.47 |
ENST00000326043.4 ENST00000393350.1 |
MAF |
v-maf avian musculoaponeurotic fibrosarcoma oncogene homolog |
| chr10_-_64576105 | 0.47 |
ENST00000242480.3 ENST00000411732.1 |
EGR2 |
early growth response 2 |
| chr2_+_220550047 | 0.47 |
ENST00000607654.1 ENST00000606673.1 |
AC009502.4 |
AC009502.4 |
| chr1_+_153003671 | 0.47 |
ENST00000307098.4 |
SPRR1B |
small proline-rich protein 1B |
| chr11_+_5410607 | 0.47 |
ENST00000328611.3 |
OR51M1 |
olfactory receptor, family 51, subfamily M, member 1 |
| chr19_-_51456198 | 0.46 |
ENST00000594846.1 |
KLK5 |
kallikrein-related peptidase 5 |
| chr18_-_28622699 | 0.46 |
ENST00000360428.4 |
DSC3 |
desmocollin 3 |
| chr18_-_52989217 | 0.45 |
ENST00000570287.2 |
TCF4 |
transcription factor 4 |
| chr21_+_27011584 | 0.44 |
ENST00000400532.1 ENST00000480456.1 ENST00000312957.5 |
JAM2 |
junctional adhesion molecule 2 |
| chr11_-_119999539 | 0.44 |
ENST00000541857.1 |
TRIM29 |
tripartite motif containing 29 |
| chr11_+_59480899 | 0.44 |
ENST00000300150.7 |
STX3 |
syntaxin 3 |
| chr6_+_132891461 | 0.44 |
ENST00000275198.1 |
TAAR6 |
trace amine associated receptor 6 |
| chr18_+_21529811 | 0.44 |
ENST00000588004.1 |
LAMA3 |
laminin, alpha 3 |
| chr8_+_95653373 | 0.43 |
ENST00000358397.5 |
ESRP1 |
epithelial splicing regulatory protein 1 |
| chr8_+_95653302 | 0.43 |
ENST00000423620.2 ENST00000433389.2 |
ESRP1 |
epithelial splicing regulatory protein 1 |
| chr18_-_53303123 | 0.42 |
ENST00000569357.1 ENST00000565124.1 ENST00000398339.1 |
TCF4 |
transcription factor 4 |
| chr8_+_124194875 | 0.42 |
ENST00000522648.1 ENST00000276699.6 |
FAM83A |
family with sequence similarity 83, member A |
| chr10_+_111967345 | 0.42 |
ENST00000332674.5 ENST00000453116.1 |
MXI1 |
MAX interactor 1, dimerization protein |
| chr12_-_52845910 | 0.42 |
ENST00000252252.3 |
KRT6B |
keratin 6B |
| chr4_-_186697044 | 0.42 |
ENST00000437304.2 |
SORBS2 |
sorbin and SH3 domain containing 2 |
| chr4_+_15480828 | 0.42 |
ENST00000389652.5 |
CC2D2A |
coiled-coil and C2 domain containing 2A |
| chr1_+_171227069 | 0.42 |
ENST00000354841.4 |
FMO1 |
flavin containing monooxygenase 1 |
| chr1_+_155100342 | 0.41 |
ENST00000368406.2 |
EFNA1 |
ephrin-A1 |
| chr1_-_204116078 | 0.41 |
ENST00000367198.2 ENST00000452983.1 |
ETNK2 |
ethanolamine kinase 2 |
| chr11_+_130542851 | 0.39 |
ENST00000317019.2 |
C11orf44 |
chromosome 11 open reading frame 44 |
| chr16_-_58328870 | 0.39 |
ENST00000543437.1 |
PRSS54 |
protease, serine, 54 |
| chr5_-_150948414 | 0.39 |
ENST00000261800.5 |
FAT2 |
FAT atypical cadherin 2 |
| chr19_-_35992780 | 0.39 |
ENST00000593342.1 ENST00000601650.1 ENST00000408915.2 |
DMKN |
dermokine |
| chr19_+_17581253 | 0.39 |
ENST00000252595.7 ENST00000598424.1 |
SLC27A1 |
solute carrier family 27 (fatty acid transporter), member 1 |
| chr19_-_51327034 | 0.39 |
ENST00000301420.2 ENST00000448701.2 |
KLK1 |
kallikrein 1 |
| chr6_+_21593972 | 0.38 |
ENST00000244745.1 ENST00000543472.1 |
SOX4 |
SRY (sex determining region Y)-box 4 |
| chr8_-_135522425 | 0.38 |
ENST00000521673.1 |
ZFAT |
zinc finger and AT hook domain containing |
| chr12_-_8815404 | 0.37 |
ENST00000359478.2 ENST00000396549.2 |
MFAP5 |
microfibrillar associated protein 5 |
| chr3_+_193853927 | 0.37 |
ENST00000232424.3 |
HES1 |
hes family bHLH transcription factor 1 |
| chr1_+_24646002 | 0.37 |
ENST00000356046.2 |
GRHL3 |
grainyhead-like 3 (Drosophila) |
| chr20_-_43883197 | 0.37 |
ENST00000338380.2 |
SLPI |
secretory leukocyte peptidase inhibitor |
| chr1_-_161008697 | 0.37 |
ENST00000318289.10 ENST00000368023.3 ENST00000368024.1 ENST00000423014.2 |
TSTD1 |
thiosulfate sulfurtransferase (rhodanese)-like domain containing 1 |
| chr11_+_1891380 | 0.37 |
ENST00000429923.1 ENST00000418975.1 ENST00000406638.2 |
LSP1 |
lymphocyte-specific protein 1 |
| chr11_+_118403747 | 0.36 |
ENST00000526853.1 |
TMEM25 |
transmembrane protein 25 |
| chr4_+_20255123 | 0.36 |
ENST00000504154.1 ENST00000273739.5 |
SLIT2 |
slit homolog 2 (Drosophila) |
| chr2_+_233497931 | 0.36 |
ENST00000264059.3 |
EFHD1 |
EF-hand domain family, member D1 |
| chr3_+_9975497 | 0.35 |
ENST00000397170.3 ENST00000383811.3 ENST00000452070.1 ENST00000326434.5 |
CRELD1 |
cysteine-rich with EGF-like domains 1 |
| chr2_+_169926047 | 0.35 |
ENST00000428522.1 ENST00000450153.1 ENST00000421653.1 |
DHRS9 |
dehydrogenase/reductase (SDR family) member 9 |
| chr17_+_48503603 | 0.35 |
ENST00000502667.1 |
ACSF2 |
acyl-CoA synthetase family member 2 |
| chr11_-_1771797 | 0.35 |
ENST00000340134.4 |
IFITM10 |
interferon induced transmembrane protein 10 |
| chr14_+_75746781 | 0.35 |
ENST00000555347.1 |
FOS |
FBJ murine osteosarcoma viral oncogene homolog |
| chr16_+_84224780 | 0.35 |
ENST00000315906.5 |
ADAD2 |
adenosine deaminase domain containing 2 |
| chr22_+_40390930 | 0.34 |
ENST00000333407.6 |
FAM83F |
family with sequence similarity 83, member F |
| chr14_+_96722152 | 0.34 |
ENST00000216629.6 |
BDKRB1 |
bradykinin receptor B1 |
| chr16_-_58328923 | 0.34 |
ENST00000567164.1 ENST00000219301.4 ENST00000569727.1 |
PRSS54 |
protease, serine, 54 |
| chr12_-_7281469 | 0.34 |
ENST00000542370.1 ENST00000266560.3 |
RBP5 |
retinol binding protein 5, cellular |
| chr10_+_60759378 | 0.34 |
ENST00000432535.1 |
LINC00844 |
long intergenic non-protein coding RNA 844 |
| chr16_+_84224740 | 0.34 |
ENST00000268624.3 |
ADAD2 |
adenosine deaminase domain containing 2 |
| chr1_-_39407450 | 0.34 |
ENST00000372990.1 |
RHBDL2 |
rhomboid, veinlet-like 2 (Drosophila) |
| chr7_+_147830776 | 0.34 |
ENST00000538075.1 |
CNTNAP2 |
contactin associated protein-like 2 |
| chr8_+_124194752 | 0.34 |
ENST00000318462.6 |
FAM83A |
family with sequence similarity 83, member A |
| chr4_-_83719983 | 0.34 |
ENST00000319540.4 |
SCD5 |
stearoyl-CoA desaturase 5 |
| chr20_+_6748311 | 0.33 |
ENST00000378827.4 |
BMP2 |
bone morphogenetic protein 2 |
| chr4_-_53617798 | 0.33 |
ENST00000443173.1 |
ERVMER34-1 |
endogenous retrovirus group MER34, member 1 |
| chr19_+_45417812 | 0.33 |
ENST00000592535.1 |
APOC1 |
apolipoprotein C-I |
| chr17_-_72358001 | 0.33 |
ENST00000375366.3 |
BTBD17 |
BTB (POZ) domain containing 17 |
| chr15_+_40531621 | 0.33 |
ENST00000560346.1 |
PAK6 |
p21 protein (Cdc42/Rac)-activated kinase 6 |
| chr6_+_13925098 | 0.33 |
ENST00000488300.1 ENST00000544682.1 ENST00000420478.2 |
RNF182 |
ring finger protein 182 |
| chr1_-_39407467 | 0.32 |
ENST00000540558.1 |
RHBDL2 |
rhomboid, veinlet-like 2 (Drosophila) |
| chr16_+_2198604 | 0.32 |
ENST00000210187.6 |
RAB26 |
RAB26, member RAS oncogene family |
| chr17_+_7344057 | 0.32 |
ENST00000575398.1 ENST00000575082.1 |
FGF11 |
fibroblast growth factor 11 |
| chr1_-_221915418 | 0.32 |
ENST00000323825.3 ENST00000366899.3 |
DUSP10 |
dual specificity phosphatase 10 |
| chr7_+_141463897 | 0.32 |
ENST00000247879.2 |
TAS2R3 |
taste receptor, type 2, member 3 |
| chr16_+_2880369 | 0.32 |
ENST00000572863.1 |
ZG16B |
zymogen granule protein 16B |
| chrX_+_103031421 | 0.32 |
ENST00000433491.1 ENST00000418604.1 ENST00000443502.1 |
PLP1 |
proteolipid protein 1 |
| chr6_-_155776966 | 0.32 |
ENST00000159060.2 |
NOX3 |
NADPH oxidase 3 |
| chr1_+_109792641 | 0.32 |
ENST00000271332.3 |
CELSR2 |
cadherin, EGF LAG seven-pass G-type receptor 2 |
| chr1_-_209979375 | 0.31 |
ENST00000367021.3 |
IRF6 |
interferon regulatory factor 6 |
| chr10_-_13276329 | 0.31 |
ENST00000378681.3 ENST00000463405.2 |
UCMA |
upper zone of growth plate and cartilage matrix associated |
| chr17_-_66951474 | 0.31 |
ENST00000269080.2 |
ABCA8 |
ATP-binding cassette, sub-family A (ABC1), member 8 |
| chr1_+_156252708 | 0.31 |
ENST00000295694.5 ENST00000357501.2 |
TMEM79 |
transmembrane protein 79 |
| chr4_-_10041872 | 0.31 |
ENST00000309065.3 |
SLC2A9 |
solute carrier family 2 (facilitated glucose transporter), member 9 |
| chr1_-_146696901 | 0.31 |
ENST00000369272.3 ENST00000441068.2 |
FMO5 |
flavin containing monooxygenase 5 |
| chr16_+_66914264 | 0.31 |
ENST00000311765.2 ENST00000568869.1 ENST00000561704.1 ENST00000568398.1 ENST00000566776.1 |
PDP2 |
pyruvate dehyrogenase phosphatase catalytic subunit 2 |
| chr10_-_10836919 | 0.31 |
ENST00000602763.1 ENST00000415590.2 ENST00000434919.2 |
SFTA1P |
surfactant associated 1, pseudogene |
| chr18_+_29027696 | 0.30 |
ENST00000257189.4 |
DSG3 |
desmoglein 3 |
| chr3_-_58613323 | 0.30 |
ENST00000474531.1 ENST00000465970.1 |
FAM107A |
family with sequence similarity 107, member A |
| chr1_-_155162658 | 0.30 |
ENST00000368389.2 ENST00000368396.4 ENST00000343256.5 ENST00000342482.4 ENST00000368398.3 ENST00000368390.3 ENST00000337604.5 ENST00000368392.3 ENST00000438413.1 ENST00000368393.3 ENST00000457295.2 ENST00000338684.5 ENST00000368395.1 |
MUC1 |
mucin 1, cell surface associated |
| chr17_-_39743139 | 0.30 |
ENST00000167586.6 |
KRT14 |
keratin 14 |
| chr6_-_41130914 | 0.30 |
ENST00000373113.3 ENST00000338469.3 |
TREM2 |
triggering receptor expressed on myeloid cells 2 |
| chr19_+_45281118 | 0.30 |
ENST00000270279.3 ENST00000341505.4 |
CBLC |
Cbl proto-oncogene C, E3 ubiquitin protein ligase |
| chr3_-_12800751 | 0.30 |
ENST00000435218.2 ENST00000435575.1 |
TMEM40 |
transmembrane protein 40 |
| chr7_-_22234381 | 0.30 |
ENST00000458533.1 |
RAPGEF5 |
Rap guanine nucleotide exchange factor (GEF) 5 |
| chr1_+_44401479 | 0.30 |
ENST00000438616.3 |
ARTN |
artemin |
| chr6_-_33041378 | 0.30 |
ENST00000428995.1 |
HLA-DPA1 |
major histocompatibility complex, class II, DP alpha 1 |
| chr4_-_90757364 | 0.30 |
ENST00000508895.1 |
SNCA |
synuclein, alpha (non A4 component of amyloid precursor) |
| chr12_-_10607084 | 0.30 |
ENST00000408006.3 ENST00000544822.1 ENST00000536188.1 |
KLRC1 |
killer cell lectin-like receptor subfamily C, member 1 |
| chr22_+_25003606 | 0.30 |
ENST00000432867.1 |
GGT1 |
gamma-glutamyltransferase 1 |
| chr1_+_47533160 | 0.29 |
ENST00000334194.3 |
CYP4Z1 |
cytochrome P450, family 4, subfamily Z, polypeptide 1 |
| chr6_+_123100853 | 0.29 |
ENST00000356535.4 |
FABP7 |
fatty acid binding protein 7, brain |
| chr14_+_21525981 | 0.29 |
ENST00000308227.2 |
RNASE8 |
ribonuclease, RNase A family, 8 |
| chr17_-_73874654 | 0.29 |
ENST00000254816.2 |
TRIM47 |
tripartite motif containing 47 |
| chr7_-_150652924 | 0.29 |
ENST00000330883.4 |
KCNH2 |
potassium voltage-gated channel, subfamily H (eag-related), member 2 |
| chr18_+_61144160 | 0.29 |
ENST00000489441.1 ENST00000424602.1 |
SERPINB5 |
serpin peptidase inhibitor, clade B (ovalbumin), member 5 |
| chr3_+_54157480 | 0.29 |
ENST00000490478.1 |
CACNA2D3 |
calcium channel, voltage-dependent, alpha 2/delta subunit 3 |
| chr17_+_42427826 | 0.29 |
ENST00000586443.1 |
GRN |
granulin |
| chr16_+_56995762 | 0.29 |
ENST00000200676.3 ENST00000379780.2 |
CETP |
cholesteryl ester transfer protein, plasma |
| chr8_+_67344710 | 0.29 |
ENST00000379385.4 ENST00000396623.3 ENST00000415254.1 |
ADHFE1 |
alcohol dehydrogenase, iron containing, 1 |
| chr5_+_147443534 | 0.29 |
ENST00000398454.1 ENST00000359874.3 ENST00000508733.1 ENST00000256084.7 |
SPINK5 |
serine peptidase inhibitor, Kazal type 5 |
| chr1_-_153363452 | 0.28 |
ENST00000368732.1 ENST00000368733.3 |
S100A8 |
S100 calcium binding protein A8 |
| chr14_+_45366518 | 0.28 |
ENST00000557112.1 |
C14orf28 |
chromosome 14 open reading frame 28 |
| chr17_-_42992856 | 0.28 |
ENST00000588316.1 ENST00000435360.2 ENST00000586793.1 ENST00000588735.1 ENST00000588037.1 ENST00000592320.1 ENST00000253408.5 |
GFAP |
glial fibrillary acidic protein |
| chr2_+_206547215 | 0.28 |
ENST00000360409.3 ENST00000540178.1 ENST00000540841.1 ENST00000355117.4 ENST00000450507.1 ENST00000417189.1 |
NRP2 |
neuropilin 2 |
| chr9_+_132099158 | 0.28 |
ENST00000444125.1 |
RP11-65J3.1 |
RP11-65J3.1 |
| chr17_-_40264692 | 0.28 |
ENST00000591220.1 ENST00000251642.3 |
DHX58 |
DEXH (Asp-Glu-X-His) box polypeptide 58 |
| chr12_-_71003568 | 0.28 |
ENST00000547715.1 ENST00000451516.2 ENST00000538708.1 ENST00000550857.1 ENST00000261266.5 |
PTPRB |
protein tyrosine phosphatase, receptor type, B |
| chr16_+_2880157 | 0.28 |
ENST00000382280.3 |
ZG16B |
zymogen granule protein 16B |
| chr13_+_31506818 | 0.28 |
ENST00000380473.3 |
TEX26 |
testis expressed 26 |
| chrX_-_102565932 | 0.28 |
ENST00000372674.1 ENST00000372677.3 |
BEX2 |
brain expressed X-linked 2 |
| chr2_+_74685527 | 0.28 |
ENST00000393972.3 ENST00000409737.1 ENST00000428943.1 |
WBP1 |
WW domain binding protein 1 |
| chr11_+_123986069 | 0.28 |
ENST00000456829.2 ENST00000361352.5 ENST00000449321.1 ENST00000392748.1 ENST00000360334.4 ENST00000392744.4 |
VWA5A |
von Willebrand factor A domain containing 5A |
| chr16_+_56995854 | 0.28 |
ENST00000566128.1 |
CETP |
cholesteryl ester transfer protein, plasma |
| chr19_+_42301079 | 0.27 |
ENST00000596544.1 |
CEACAM3 |
carcinoembryonic antigen-related cell adhesion molecule 3 |
| chr4_-_103682145 | 0.27 |
ENST00000226578.4 |
MANBA |
mannosidase, beta A, lysosomal |
| chr1_+_101185290 | 0.27 |
ENST00000370119.4 ENST00000347652.2 ENST00000294728.2 ENST00000370115.1 |
VCAM1 |
vascular cell adhesion molecule 1 |
| chr10_-_123357598 | 0.27 |
ENST00000358487.5 ENST00000369058.3 ENST00000369060.4 ENST00000359354.2 |
FGFR2 |
fibroblast growth factor receptor 2 |
| chrX_+_37430822 | 0.27 |
ENST00000378621.3 ENST00000378619.3 |
LANCL3 |
LanC lantibiotic synthetase component C-like 3 (bacterial) |
| chr19_-_45681482 | 0.27 |
ENST00000592647.1 ENST00000006275.4 ENST00000588062.1 ENST00000585934.1 |
TRAPPC6A |
trafficking protein particle complex 6A |
| chr6_+_26158343 | 0.27 |
ENST00000377777.4 ENST00000289316.2 |
HIST1H2BD |
histone cluster 1, H2bd |
| chr17_-_39093672 | 0.27 |
ENST00000209718.3 ENST00000436344.3 ENST00000485751.1 |
KRT23 |
keratin 23 (histone deacetylase inducible) |
| chr11_-_104905840 | 0.27 |
ENST00000526568.1 ENST00000393136.4 ENST00000531166.1 ENST00000534497.1 ENST00000527979.1 ENST00000446369.1 ENST00000353247.5 ENST00000528974.1 ENST00000533400.1 ENST00000525825.1 ENST00000436863.3 |
CASP1 |
caspase 1, apoptosis-related cysteine peptidase |
| chr17_+_48503519 | 0.27 |
ENST00000300441.4 ENST00000541920.1 ENST00000506582.1 ENST00000504392.1 ENST00000427954.2 |
ACSF2 |
acyl-CoA synthetase family member 2 |
| chr1_-_22263790 | 0.27 |
ENST00000374695.3 |
HSPG2 |
heparan sulfate proteoglycan 2 |
| chr3_-_151034734 | 0.26 |
ENST00000260843.4 |
GPR87 |
G protein-coupled receptor 87 |
| chr14_-_94856987 | 0.26 |
ENST00000449399.3 ENST00000404814.4 |
SERPINA1 |
serpin peptidase inhibitor, clade A (alpha-1 antiproteinase, antitrypsin), member 1 |
| chr9_-_139891165 | 0.26 |
ENST00000494426.1 |
CLIC3 |
chloride intracellular channel 3 |
| chr1_+_209878182 | 0.26 |
ENST00000367027.3 |
HSD11B1 |
hydroxysteroid (11-beta) dehydrogenase 1 |
| chr11_-_111781454 | 0.26 |
ENST00000533280.1 |
CRYAB |
crystallin, alpha B |
| chr2_+_37571845 | 0.26 |
ENST00000537448.1 |
QPCT |
glutaminyl-peptide cyclotransferase |
| chr11_+_85566422 | 0.26 |
ENST00000342404.3 |
CCDC83 |
coiled-coil domain containing 83 |
| chr22_+_30792846 | 0.26 |
ENST00000312932.9 ENST00000428195.1 |
SEC14L2 |
SEC14-like 2 (S. cerevisiae) |
| chr2_-_113542063 | 0.26 |
ENST00000263339.3 |
IL1A |
interleukin 1, alpha |
| chr6_+_72926145 | 0.26 |
ENST00000425662.2 ENST00000453976.2 |
RIMS1 |
regulating synaptic membrane exocytosis 1 |
| chr1_-_160990886 | 0.26 |
ENST00000537746.1 |
F11R |
F11 receptor |
| chr12_+_10366016 | 0.26 |
ENST00000546017.1 ENST00000535576.1 ENST00000539170.1 |
GABARAPL1 |
GABA(A) receptor-associated protein like 1 |
| chr19_-_20844343 | 0.26 |
ENST00000595405.1 |
ZNF626 |
zinc finger protein 626 |
| chr18_-_78005231 | 0.26 |
ENST00000470488.2 ENST00000353265.3 |
PARD6G |
par-6 family cell polarity regulator gamma |
| chr11_-_2924970 | 0.26 |
ENST00000533594.1 |
SLC22A18AS |
solute carrier family 22 (organic cation transporter), member 18 antisense |
| chr4_-_90756769 | 0.26 |
ENST00000345009.4 ENST00000505199.1 ENST00000502987.1 |
SNCA |
synuclein, alpha (non A4 component of amyloid precursor) |
| chr6_-_32145861 | 0.26 |
ENST00000336984.6 |
AGPAT1 |
1-acylglycerol-3-phosphate O-acyltransferase 1 |
| chr1_+_24645865 | 0.26 |
ENST00000342072.4 |
GRHL3 |
grainyhead-like 3 (Drosophila) |
| chr7_+_26191809 | 0.26 |
ENST00000056233.3 |
NFE2L3 |
nuclear factor, erythroid 2-like 3 |
| chr1_+_53527854 | 0.25 |
ENST00000371500.3 ENST00000395871.2 ENST00000312553.5 |
PODN |
podocan |
Gene Ontology Analysis
Gene overrepresentation in biological_process category:
| Log-likelihood per target | Total log-likelihood | Term | Description |
|---|---|---|---|
| 0.3 | 1.5 | GO:0097021 | lymphocyte migration into lymphoid organs(GO:0097021) |
| 0.3 | 1.7 | GO:0002225 | positive regulation of antimicrobial peptide production(GO:0002225) positive regulation of antimicrobial humoral response(GO:0002760) positive regulation of antibacterial peptide production(GO:0002803) |
| 0.3 | 0.3 | GO:0002784 | regulation of antimicrobial peptide production(GO:0002784) regulation of antibacterial peptide production(GO:0002786) |
| 0.3 | 1.0 | GO:0010900 | negative regulation of phosphatidylcholine catabolic process(GO:0010900) |
| 0.2 | 0.7 | GO:0060279 | regulation of ovulation(GO:0060278) positive regulation of ovulation(GO:0060279) |
| 0.2 | 0.8 | GO:0035905 | ascending aorta development(GO:0035905) ascending aorta morphogenesis(GO:0035910) |
| 0.2 | 0.6 | GO:0002894 | positive regulation of type IIa hypersensitivity(GO:0001798) positive regulation of type II hypersensitivity(GO:0002894) |
| 0.2 | 0.6 | GO:0032499 | detection of peptidoglycan(GO:0032499) |
| 0.2 | 1.4 | GO:0001661 | conditioned taste aversion(GO:0001661) |
| 0.2 | 0.5 | GO:0021569 | rhombomere 3 development(GO:0021569) |
| 0.2 | 0.6 | GO:0042361 | menaquinone catabolic process(GO:0042361) vitamin K catabolic process(GO:0042377) |
| 0.1 | 0.4 | GO:0035603 | fibroblast growth factor receptor signaling pathway involved in negative regulation of apoptotic process in bone marrow(GO:0035602) fibroblast growth factor receptor signaling pathway involved in hemopoiesis(GO:0035603) fibroblast growth factor receptor signaling pathway involved in positive regulation of cell proliferation in bone marrow(GO:0035604) |
| 0.1 | 0.4 | GO:0071109 | superior temporal gyrus development(GO:0071109) |
| 0.1 | 0.4 | GO:1902303 | regulation of heart rate by hormone(GO:0003064) negative regulation of potassium ion export(GO:1902303) |
| 0.1 | 1.0 | GO:0070995 | NADPH oxidation(GO:0070995) |
| 0.1 | 0.4 | GO:0018153 | isopeptide cross-linking via N6-(L-isoglutamyl)-L-lysine(GO:0018153) isopeptide cross-linking(GO:0018262) |
| 0.1 | 0.4 | GO:0021836 | cerebral cortex tangential migration using cell-cell interactions(GO:0021823) postnatal olfactory bulb interneuron migration(GO:0021827) chemorepulsion involved in postnatal olfactory bulb interneuron migration(GO:0021836) |
| 0.1 | 0.4 | GO:0017186 | peptidyl-pyroglutamic acid biosynthetic process, using glutaminyl-peptide cyclotransferase(GO:0017186) |
| 0.1 | 0.3 | GO:0048807 | female genitalia morphogenesis(GO:0048807) |
| 0.1 | 0.1 | GO:0010803 | regulation of tumor necrosis factor-mediated signaling pathway(GO:0010803) |
| 0.1 | 0.5 | GO:0050717 | positive regulation of interleukin-1 alpha secretion(GO:0050717) |
| 0.1 | 0.1 | GO:0036089 | cleavage furrow formation(GO:0036089) |
| 0.1 | 0.4 | GO:1990764 | regulation of myofibroblast contraction(GO:1904328) myofibroblast contraction(GO:1990764) |
| 0.1 | 0.2 | GO:0033861 | negative regulation of NAD(P)H oxidase activity(GO:0033861) |
| 0.1 | 1.2 | GO:0019344 | cysteine biosynthetic process(GO:0019344) |
| 0.1 | 0.1 | GO:1904674 | positive regulation of somatic stem cell population maintenance(GO:1904674) |
| 0.1 | 0.7 | GO:1903575 | cornified envelope assembly(GO:1903575) |
| 0.1 | 0.1 | GO:0060648 | mammary gland bud morphogenesis(GO:0060648) |
| 0.1 | 0.3 | GO:0070563 | negative regulation of vitamin D receptor signaling pathway(GO:0070563) |
| 0.1 | 0.8 | GO:0009449 | gamma-aminobutyric acid biosynthetic process(GO:0009449) |
| 0.1 | 0.8 | GO:2001181 | positive regulation of interleukin-10 secretion(GO:2001181) |
| 0.1 | 0.3 | GO:0060129 | thyroid-stimulating hormone-secreting cell differentiation(GO:0060129) |
| 0.1 | 0.1 | GO:0014718 | positive regulation of satellite cell activation involved in skeletal muscle regeneration(GO:0014718) |
| 0.1 | 0.3 | GO:1900220 | semaphorin-plexin signaling pathway involved in bone trabecula morphogenesis(GO:1900220) |
| 0.1 | 0.6 | GO:0051621 | negative regulation of dopamine uptake involved in synaptic transmission(GO:0051585) norepinephrine uptake(GO:0051620) regulation of norepinephrine uptake(GO:0051621) negative regulation of norepinephrine uptake(GO:0051622) negative regulation of catecholamine uptake involved in synaptic transmission(GO:0051945) regulation of glutathione peroxidase activity(GO:1903282) positive regulation of glutathione peroxidase activity(GO:1903284) positive regulation of hydrogen peroxide catabolic process(GO:1903285) positive regulation of peroxidase activity(GO:2000470) |
| 0.1 | 1.0 | GO:0061302 | smooth muscle cell-matrix adhesion(GO:0061302) |
| 0.1 | 0.6 | GO:0042335 | cuticle development(GO:0042335) |
| 0.1 | 1.5 | GO:0070327 | thyroid hormone transport(GO:0070327) |
| 0.1 | 0.9 | GO:0044821 | meiotic telomere tethering at nuclear periphery(GO:0044821) meiotic attachment of telomere to nuclear envelope(GO:0070197) chromosome attachment to the nuclear envelope(GO:0097240) |
| 0.1 | 0.4 | GO:0009822 | alkaloid catabolic process(GO:0009822) |
| 0.1 | 0.5 | GO:0002415 | immunoglobulin transcytosis in epithelial cells mediated by polymeric immunoglobulin receptor(GO:0002415) |
| 0.1 | 0.4 | GO:0014846 | esophagus smooth muscle contraction(GO:0014846) |
| 0.1 | 0.5 | GO:2000313 | fibroblast growth factor receptor signaling pathway involved in neural plate anterior/posterior pattern formation(GO:0060825) regulation of fibroblast growth factor receptor signaling pathway involved in neural plate anterior/posterior pattern formation(GO:2000313) |
| 0.1 | 0.4 | GO:0010730 | negative regulation of hydrogen peroxide biosynthetic process(GO:0010730) |
| 0.1 | 0.3 | GO:0061536 | glycine secretion(GO:0061536) glycine secretion, neurotransmission(GO:0061537) |
| 0.1 | 0.4 | GO:0014028 | notochord formation(GO:0014028) |
| 0.1 | 0.5 | GO:0021999 | neural plate anterior/posterior regionalization(GO:0021999) |
| 0.1 | 0.5 | GO:1902162 | regulation of DNA damage response, signal transduction by p53 class mediator resulting in transcription of p21 class mediator(GO:1902162) positive regulation of DNA damage response, signal transduction by p53 class mediator resulting in transcription of p21 class mediator(GO:1902164) |
| 0.1 | 0.3 | GO:0002125 | maternal aggressive behavior(GO:0002125) |
| 0.1 | 0.3 | GO:1902161 | positive regulation of cyclic nucleotide-gated ion channel activity(GO:1902161) |
| 0.1 | 0.3 | GO:0098746 | fast, calcium ion-dependent exocytosis of neurotransmitter(GO:0098746) |
| 0.1 | 0.1 | GO:0097062 | dendritic spine maintenance(GO:0097062) |
| 0.1 | 0.2 | GO:0009450 | gamma-aminobutyric acid catabolic process(GO:0009450) |
| 0.1 | 0.3 | GO:0003213 | cardiac right atrium morphogenesis(GO:0003213) |
| 0.1 | 0.4 | GO:0030311 | poly-N-acetyllactosamine biosynthetic process(GO:0030311) |
| 0.1 | 0.5 | GO:0045110 | intermediate filament bundle assembly(GO:0045110) |
| 0.1 | 0.3 | GO:1901899 | positive regulation of relaxation of cardiac muscle(GO:1901899) |
| 0.1 | 0.3 | GO:0044278 | cell wall disruption in other organism(GO:0044278) |
| 0.1 | 0.3 | GO:0061727 | methylglyoxal catabolic process to D-lactate via S-lactoyl-glutathione(GO:0019243) methylglyoxal catabolic process(GO:0051596) methylglyoxal catabolic process to lactate(GO:0061727) |
| 0.1 | 0.4 | GO:0015891 | iron chelate transport(GO:0015688) siderophore transport(GO:0015891) |
| 0.1 | 0.2 | GO:0050902 | leukocyte adhesive activation(GO:0050902) |
| 0.1 | 0.4 | GO:0043553 | negative regulation of phosphatidylinositol 3-kinase activity(GO:0043553) |
| 0.1 | 0.9 | GO:0031652 | positive regulation of heat generation(GO:0031652) |
| 0.1 | 0.3 | GO:0002086 | diaphragm contraction(GO:0002086) |
| 0.1 | 0.1 | GO:1904933 | regulation of cell proliferation in midbrain(GO:1904933) |
| 0.1 | 0.3 | GO:0043297 | apical junction assembly(GO:0043297) |
| 0.1 | 0.2 | GO:0090293 | nitrogen catabolite regulation of transcription from RNA polymerase II promoter(GO:0001079) nitrogen catabolite activation of transcription from RNA polymerase II promoter(GO:0001080) regulation of urea metabolic process(GO:0034255) intracellular bile acid receptor signaling pathway(GO:0038185) interleukin-17 secretion(GO:0072615) nitrogen catabolite regulation of transcription(GO:0090293) nitrogen catabolite activation of transcription(GO:0090294) regulation of nitrogen cycle metabolic process(GO:1903314) positive regulation of glutamate metabolic process(GO:2000213) regulation of ammonia assimilation cycle(GO:2001248) positive regulation of ammonia assimilation cycle(GO:2001250) |
| 0.1 | 0.2 | GO:1901207 | regulation of heart looping(GO:1901207) |
| 0.1 | 0.2 | GO:0035419 | activation of MAPK activity involved in innate immune response(GO:0035419) |
| 0.1 | 0.3 | GO:0039534 | negative regulation of MDA-5 signaling pathway(GO:0039534) |
| 0.1 | 0.2 | GO:0015993 | molecular hydrogen transport(GO:0015993) |
| 0.1 | 0.5 | GO:0071918 | urea transmembrane transport(GO:0071918) |
| 0.1 | 0.2 | GO:0045229 | cell envelope organization(GO:0043163) external encapsulating structure organization(GO:0045229) |
| 0.1 | 1.5 | GO:0030322 | stabilization of membrane potential(GO:0030322) |
| 0.1 | 0.2 | GO:1900673 | olefin metabolic process(GO:1900673) |
| 0.1 | 0.4 | GO:0060266 | negative regulation of respiratory burst involved in inflammatory response(GO:0060266) |
| 0.1 | 0.2 | GO:0072709 | cellular response to sorbitol(GO:0072709) |
| 0.1 | 0.1 | GO:0032765 | positive regulation of mast cell cytokine production(GO:0032765) |
| 0.1 | 0.2 | GO:0030264 | nuclear fragmentation involved in apoptotic nuclear change(GO:0030264) |
| 0.1 | 0.5 | GO:1904491 | protein localization to ciliary transition zone(GO:1904491) |
| 0.1 | 1.2 | GO:0097264 | self proteolysis(GO:0097264) |
| 0.1 | 0.1 | GO:0050720 | interleukin-1 beta biosynthetic process(GO:0050720) |
| 0.1 | 0.5 | GO:0098967 | exocytic insertion of neurotransmitter receptor to plasma membrane(GO:0098881) exocytic insertion of neurotransmitter receptor to postsynaptic membrane(GO:0098967) |
| 0.1 | 1.4 | GO:0019372 | lipoxygenase pathway(GO:0019372) |
| 0.1 | 0.3 | GO:0070100 | negative regulation of chemokine-mediated signaling pathway(GO:0070100) |
| 0.1 | 0.1 | GO:0021847 | ventricular zone neuroblast division(GO:0021847) |
| 0.1 | 0.1 | GO:0060031 | mediolateral intercalation(GO:0060031) planar cell polarity pathway involved in gastrula mediolateral intercalation(GO:0060775) |
| 0.1 | 0.3 | GO:0032811 | negative regulation of epinephrine secretion(GO:0032811) |
| 0.1 | 0.2 | GO:2000777 | positive regulation of proteasomal ubiquitin-dependent protein catabolic process involved in cellular response to hypoxia(GO:2000777) |
| 0.1 | 0.2 | GO:0044537 | regulation of circulating fibrinogen levels(GO:0044537) |
| 0.1 | 0.1 | GO:1901491 | negative regulation of lymphangiogenesis(GO:1901491) |
| 0.1 | 1.8 | GO:0061436 | establishment of skin barrier(GO:0061436) |
| 0.1 | 0.3 | GO:1902723 | negative regulation of skeletal muscle cell proliferation(GO:0014859) negative regulation of skeletal muscle satellite cell proliferation(GO:1902723) |
| 0.1 | 0.2 | GO:0090310 | negative regulation of methylation-dependent chromatin silencing(GO:0090310) |
| 0.1 | 0.1 | GO:1903595 | positive regulation of histamine secretion by mast cell(GO:1903595) |
| 0.1 | 0.1 | GO:1904798 | positive regulation of core promoter binding(GO:1904798) |
| 0.1 | 0.1 | GO:0008212 | mineralocorticoid biosynthetic process(GO:0006705) mineralocorticoid metabolic process(GO:0008212) |
| 0.1 | 0.4 | GO:0001660 | fever generation(GO:0001660) |
| 0.1 | 0.1 | GO:0061183 | dermatome development(GO:0061054) regulation of dermatome development(GO:0061183) |
| 0.1 | 0.2 | GO:0002728 | negative regulation of natural killer cell cytokine production(GO:0002728) |
| 0.1 | 0.1 | GO:0061763 | multivesicular body-lysosome fusion(GO:0061763) |
| 0.1 | 0.4 | GO:0009181 | purine nucleoside diphosphate catabolic process(GO:0009137) purine ribonucleoside diphosphate catabolic process(GO:0009181) |
| 0.1 | 0.2 | GO:0046103 | adenosine catabolic process(GO:0006154) inosine biosynthetic process(GO:0046103) |
| 0.1 | 0.4 | GO:1903232 | melanosome assembly(GO:1903232) |
| 0.1 | 0.5 | GO:0031642 | negative regulation of myelination(GO:0031642) |
| 0.1 | 0.3 | GO:0006554 | lysine catabolic process(GO:0006554) |
| 0.1 | 0.1 | GO:0048320 | axial mesoderm formation(GO:0048320) |
| 0.1 | 0.2 | GO:0030505 | inorganic diphosphate transport(GO:0030505) |
| 0.1 | 0.2 | GO:0060940 | epithelial to mesenchymal transition involved in cardiac fibroblast development(GO:0060940) |
| 0.1 | 0.6 | GO:0042759 | long-chain fatty acid biosynthetic process(GO:0042759) |
| 0.1 | 0.2 | GO:1902630 | regulation of membrane hyperpolarization(GO:1902630) |
| 0.1 | 0.2 | GO:0000255 | allantoin metabolic process(GO:0000255) |
| 0.1 | 0.2 | GO:1903028 | positive regulation of opsonization(GO:1903028) |
| 0.1 | 0.2 | GO:0097187 | dentinogenesis(GO:0097187) |
| 0.1 | 0.5 | GO:0046618 | drug export(GO:0046618) |
| 0.1 | 0.4 | GO:0051725 | protein de-ADP-ribosylation(GO:0051725) |
| 0.1 | 0.2 | GO:1904106 | protein localization to microvillus(GO:1904106) |
| 0.1 | 0.6 | GO:0034197 | acylglycerol transport(GO:0034196) triglyceride transport(GO:0034197) |
| 0.1 | 0.2 | GO:0006651 | diacylglycerol biosynthetic process(GO:0006651) |
| 0.1 | 0.2 | GO:1902960 | regulation of choline O-acetyltransferase activity(GO:1902769) positive regulation of choline O-acetyltransferase activity(GO:1902771) negative regulation of tau-protein kinase activity(GO:1902948) positive regulation of early endosome to recycling endosome transport(GO:1902955) negative regulation of aspartic-type endopeptidase activity involved in amyloid precursor protein catabolic process(GO:1902960) negative regulation of neurofibrillary tangle assembly(GO:1902997) negative regulation of aspartic-type peptidase activity(GO:1905246) |
| 0.1 | 0.1 | GO:0006425 | glutaminyl-tRNA aminoacylation(GO:0006425) |
| 0.1 | 0.6 | GO:1900028 | negative regulation of ruffle assembly(GO:1900028) |
| 0.1 | 0.1 | GO:0030431 | sleep(GO:0030431) |
| 0.1 | 0.5 | GO:0048840 | otolith development(GO:0048840) |
| 0.1 | 0.2 | GO:0009609 | response to symbiont(GO:0009608) response to symbiotic bacterium(GO:0009609) positive regulation of neutrophil degranulation(GO:0043315) cellular response to gravity(GO:0071258) positive regulation of neutrophil activation(GO:1902565) regulation of voltage-gated chloride channel activity(GO:1902941) positive regulation of voltage-gated chloride channel activity(GO:1902943) positive regulation of inorganic anion transmembrane transport(GO:1903797) regulation of transcytosis(GO:1904298) positive regulation of transcytosis(GO:1904300) regulation of maternal process involved in parturition(GO:1904301) positive regulation of maternal process involved in parturition(GO:1904303) response to 2-O-acetyl-1-O-hexadecyl-sn-glycero-3-phosphocholine(GO:1904316) cellular response to 2-O-acetyl-1-O-hexadecyl-sn-glycero-3-phosphocholine(GO:1904317) |
| 0.1 | 0.1 | GO:0003011 | involuntary skeletal muscle contraction(GO:0003011) |
| 0.1 | 0.1 | GO:0010621 | negative regulation of transcription by transcription factor localization(GO:0010621) |
| 0.1 | 0.2 | GO:0002644 | negative regulation of tolerance induction(GO:0002644) |
| 0.1 | 0.5 | GO:0042904 | 9-cis-retinoic acid biosynthetic process(GO:0042904) 9-cis-retinoic acid metabolic process(GO:0042905) |
| 0.1 | 0.2 | GO:0033326 | cerebrospinal fluid secretion(GO:0033326) |
| 0.1 | 0.2 | GO:0035544 | negative regulation of SNARE complex assembly(GO:0035544) |
| 0.0 | 0.1 | GO:0032079 | positive regulation of endodeoxyribonuclease activity(GO:0032079) |
| 0.0 | 0.3 | GO:0090487 | toxin catabolic process(GO:0009407) secondary metabolite catabolic process(GO:0090487) |
| 0.0 | 0.0 | GO:0044333 | Wnt signaling pathway involved in digestive tract morphogenesis(GO:0044333) |
| 0.0 | 0.3 | GO:0022614 | membrane to membrane docking(GO:0022614) |
| 0.0 | 0.1 | GO:1904886 | beta-catenin destruction complex disassembly(GO:1904886) |
| 0.0 | 0.1 | GO:0019442 | tryptophan catabolic process to acetyl-CoA(GO:0019442) |
| 0.0 | 0.2 | GO:0033591 | response to L-ascorbic acid(GO:0033591) |
| 0.0 | 0.2 | GO:2000809 | positive regulation of synaptic vesicle clustering(GO:2000809) |
| 0.0 | 0.4 | GO:0015705 | iodide transport(GO:0015705) |
| 0.0 | 0.4 | GO:1902219 | negative regulation of intrinsic apoptotic signaling pathway in response to osmotic stress(GO:1902219) |
| 0.0 | 0.1 | GO:0021722 | pons maturation(GO:0021586) superior olivary nucleus development(GO:0021718) superior olivary nucleus maturation(GO:0021722) |
| 0.0 | 0.1 | GO:0036515 | serotonergic neuron axon guidance(GO:0036515) |
| 0.0 | 0.7 | GO:0071499 | cellular response to laminar fluid shear stress(GO:0071499) |
| 0.0 | 0.1 | GO:0019074 | viral genome packaging(GO:0019072) viral RNA genome packaging(GO:0019074) |
| 0.0 | 0.2 | GO:0009191 | ribonucleoside diphosphate catabolic process(GO:0009191) |
| 0.0 | 0.2 | GO:0001550 | ovarian cumulus expansion(GO:0001550) fused antrum stage(GO:0048165) |
| 0.0 | 1.3 | GO:0031581 | hemidesmosome assembly(GO:0031581) |
| 0.0 | 0.5 | GO:0031087 | deadenylation-independent decapping of nuclear-transcribed mRNA(GO:0031087) |
| 0.0 | 0.4 | GO:0048341 | paraxial mesoderm formation(GO:0048341) |
| 0.0 | 0.2 | GO:2001287 | negative regulation of caveolin-mediated endocytosis(GO:2001287) |
| 0.0 | 0.2 | GO:2001288 | positive regulation of caveolin-mediated endocytosis(GO:2001288) |
| 0.0 | 0.1 | GO:0035915 | pore formation in membrane of other organism(GO:0035915) |
| 0.0 | 0.5 | GO:0048298 | positive regulation of isotype switching to IgA isotypes(GO:0048298) |
| 0.0 | 0.0 | GO:0032641 | lymphotoxin A production(GO:0032641) lymphotoxin A biosynthetic process(GO:0042109) |
| 0.0 | 0.1 | GO:0010430 | fatty acid omega-oxidation(GO:0010430) |
| 0.0 | 0.1 | GO:0006579 | amino-acid betaine catabolic process(GO:0006579) |
| 0.0 | 0.2 | GO:0061760 | antifungal innate immune response(GO:0061760) |
| 0.0 | 0.1 | GO:0048050 | post-embryonic eye morphogenesis(GO:0048050) post-embryonic organ morphogenesis(GO:0048563) |
| 0.0 | 0.2 | GO:1901842 | negative regulation of high voltage-gated calcium channel activity(GO:1901842) |
| 0.0 | 0.1 | GO:1903966 | monounsaturated fatty acid metabolic process(GO:1903964) monounsaturated fatty acid biosynthetic process(GO:1903966) |
| 0.0 | 0.1 | GO:0097156 | fasciculation of motor neuron axon(GO:0097156) |
| 0.0 | 2.0 | GO:0060216 | definitive hemopoiesis(GO:0060216) |
| 0.0 | 0.1 | GO:0043311 | positive regulation of eosinophil degranulation(GO:0043311) positive regulation of eosinophil activation(GO:1902568) |
| 0.0 | 0.1 | GO:0072034 | renal vesicle induction(GO:0072034) |
| 0.0 | 0.2 | GO:1990418 | response to insulin-like growth factor stimulus(GO:1990418) |
| 0.0 | 0.0 | GO:0040019 | positive regulation of embryonic development(GO:0040019) |
| 0.0 | 0.1 | GO:0048627 | myoblast development(GO:0048627) |
| 0.0 | 0.2 | GO:0045054 | constitutive secretory pathway(GO:0045054) |
| 0.0 | 0.1 | GO:0006478 | peptidyl-tyrosine sulfation(GO:0006478) |
| 0.0 | 0.3 | GO:0007290 | spermatid nucleus elongation(GO:0007290) |
| 0.0 | 0.3 | GO:0070493 | thrombin receptor signaling pathway(GO:0070493) |
| 0.0 | 0.1 | GO:0019858 | cytosine metabolic process(GO:0019858) |
| 0.0 | 0.0 | GO:0031117 | positive regulation of microtubule depolymerization(GO:0031117) |
| 0.0 | 0.1 | GO:0042360 | vitamin E metabolic process(GO:0042360) |
| 0.0 | 0.1 | GO:2000480 | negative regulation of cAMP-dependent protein kinase activity(GO:2000480) |
| 0.0 | 0.2 | GO:0060708 | spongiotrophoblast differentiation(GO:0060708) |
| 0.0 | 0.1 | GO:0002586 | regulation of antigen processing and presentation of peptide antigen via MHC class II(GO:0002586) |
| 0.0 | 0.1 | GO:0009436 | glyoxylate catabolic process(GO:0009436) |
| 0.0 | 0.2 | GO:0060120 | auditory receptor cell fate commitment(GO:0009912) inner ear receptor cell fate commitment(GO:0060120) |
| 0.0 | 0.0 | GO:0060585 | regulation of prostaglandin-endoperoxide synthase activity(GO:0060584) positive regulation of prostaglandin-endoperoxide synthase activity(GO:0060585) |
| 0.0 | 0.0 | GO:0035469 | determination of pancreatic left/right asymmetry(GO:0035469) determination of liver left/right asymmetry(GO:0071910) |
| 0.0 | 0.2 | GO:0006015 | 5-phosphoribose 1-diphosphate biosynthetic process(GO:0006015) 5-phosphoribose 1-diphosphate metabolic process(GO:0046391) |
| 0.0 | 0.1 | GO:0002731 | negative regulation of dendritic cell cytokine production(GO:0002731) |
| 0.0 | 0.6 | GO:0098828 | positive regulation of inhibitory postsynaptic potential(GO:0097151) modulation of inhibitory postsynaptic potential(GO:0098828) |
| 0.0 | 0.1 | GO:0071877 | regulation of adrenergic receptor signaling pathway(GO:0071877) |
| 0.0 | 0.3 | GO:0035694 | mitochondrial protein catabolic process(GO:0035694) |
| 0.0 | 0.0 | GO:0019240 | citrulline biosynthetic process(GO:0019240) |
| 0.0 | 0.2 | GO:0061743 | motor learning(GO:0061743) |
| 0.0 | 0.6 | GO:0051599 | response to hydrostatic pressure(GO:0051599) |
| 0.0 | 0.3 | GO:1990253 | cellular response to leucine starvation(GO:1990253) |
| 0.0 | 0.1 | GO:1903265 | positive regulation of tumor necrosis factor-mediated signaling pathway(GO:1903265) |
| 0.0 | 1.6 | GO:0007205 | protein kinase C-activating G-protein coupled receptor signaling pathway(GO:0007205) |
| 0.0 | 0.1 | GO:0072718 | response to cisplatin(GO:0072718) |
| 0.0 | 0.2 | GO:0070417 | cellular response to cold(GO:0070417) |
| 0.0 | 0.2 | GO:0097210 | response to gonadotropin-releasing hormone(GO:0097210) cellular response to gonadotropin-releasing hormone(GO:0097211) |
| 0.0 | 0.2 | GO:1903935 | response to sodium arsenite(GO:1903935) cellular response to sodium arsenite(GO:1903936) |
| 0.0 | 1.1 | GO:0060644 | mammary gland epithelial cell differentiation(GO:0060644) |
| 0.0 | 0.2 | GO:0060005 | vestibular reflex(GO:0060005) |
| 0.0 | 0.1 | GO:0006258 | UDP-glucose catabolic process(GO:0006258) galactose catabolic process via UDP-galactose(GO:0033499) |
| 0.0 | 0.2 | GO:0034224 | cellular response to zinc ion starvation(GO:0034224) |
| 0.0 | 0.1 | GO:0032763 | regulation of mast cell cytokine production(GO:0032763) negative regulation of mast cell cytokine production(GO:0032764) |
| 0.0 | 0.0 | GO:0002536 | respiratory burst involved in inflammatory response(GO:0002536) regulation of respiratory burst involved in inflammatory response(GO:0060264) positive regulation of respiratory burst involved in inflammatory response(GO:0060265) |
| 0.0 | 0.1 | GO:1900154 | regulation of bone trabecula formation(GO:1900154) negative regulation of bone trabecula formation(GO:1900155) |
| 0.0 | 0.1 | GO:0002881 | negative regulation of chronic inflammatory response to non-antigenic stimulus(GO:0002881) |
| 0.0 | 0.1 | GO:0018879 | biphenyl metabolic process(GO:0018879) |
| 0.0 | 0.2 | GO:0015793 | glycerol transport(GO:0015793) |
| 0.0 | 0.4 | GO:0032020 | ISG15-protein conjugation(GO:0032020) |
| 0.0 | 0.2 | GO:2000503 | positive regulation of natural killer cell chemotaxis(GO:2000503) |
| 0.0 | 0.2 | GO:0051005 | negative regulation of lipoprotein lipase activity(GO:0051005) |
| 0.0 | 0.1 | GO:0007406 | negative regulation of neuroblast proliferation(GO:0007406) |
| 0.0 | 0.3 | GO:0042908 | xenobiotic transport(GO:0042908) |
| 0.0 | 0.1 | GO:1900042 | positive regulation of interleukin-2 secretion(GO:1900042) |
| 0.0 | 0.1 | GO:0001743 | optic placode formation(GO:0001743) optic placode formation involved in camera-type eye formation(GO:0046619) |
| 0.0 | 0.1 | GO:0045659 | regulation of neutrophil differentiation(GO:0045658) negative regulation of neutrophil differentiation(GO:0045659) |
| 0.0 | 0.3 | GO:0033029 | regulation of neutrophil apoptotic process(GO:0033029) |
| 0.0 | 0.1 | GO:1902074 | response to salt(GO:1902074) |
| 0.0 | 0.5 | GO:0030321 | transepithelial chloride transport(GO:0030321) |
| 0.0 | 0.5 | GO:0046415 | urate metabolic process(GO:0046415) |
| 0.0 | 0.1 | GO:0030037 | actin filament reorganization involved in cell cycle(GO:0030037) |
| 0.0 | 0.1 | GO:1903644 | regulation of chaperone-mediated protein folding(GO:1903644) |
| 0.0 | 0.2 | GO:0002322 | B cell proliferation involved in immune response(GO:0002322) |
| 0.0 | 0.1 | GO:0071500 | cellular response to nitrosative stress(GO:0071500) |
| 0.0 | 0.0 | GO:1901079 | positive regulation of relaxation of muscle(GO:1901079) |
| 0.0 | 0.1 | GO:2000866 | positive regulation of estrogen secretion(GO:2000863) positive regulation of estradiol secretion(GO:2000866) |
| 0.0 | 0.2 | GO:0071494 | cellular response to UV-C(GO:0071494) |
| 0.0 | 0.1 | GO:0014057 | positive regulation of acetylcholine secretion, neurotransmission(GO:0014057) |
| 0.0 | 0.4 | GO:0060155 | platelet dense granule organization(GO:0060155) |
| 0.0 | 0.1 | GO:0002541 | activation of plasma proteins involved in acute inflammatory response(GO:0002541) |
| 0.0 | 0.0 | GO:0061084 | regulation of protein refolding(GO:0061083) negative regulation of protein refolding(GO:0061084) regulation of protein folding(GO:1903332) |
| 0.0 | 0.2 | GO:0032782 | bile acid secretion(GO:0032782) |
| 0.0 | 0.1 | GO:0046416 | D-amino acid metabolic process(GO:0046416) |
| 0.0 | 0.2 | GO:1990834 | response to odorant(GO:1990834) |
| 0.0 | 0.1 | GO:1900738 | positive regulation of phospholipase C-activating G-protein coupled receptor signaling pathway(GO:1900738) |
| 0.0 | 0.1 | GO:0086097 | phospholipase C-activating angiotensin-activated signaling pathway(GO:0086097) |
| 0.0 | 0.1 | GO:0021545 | cranial nerve development(GO:0021545) |
| 0.0 | 0.0 | GO:0003150 | muscular septum morphogenesis(GO:0003150) |
| 0.0 | 0.2 | GO:0016480 | negative regulation of transcription from RNA polymerase III promoter(GO:0016480) |
| 0.0 | 0.2 | GO:0019075 | virus maturation(GO:0019075) |
| 0.0 | 0.1 | GO:0018057 | peptidyl-lysine oxidation(GO:0018057) |
| 0.0 | 0.1 | GO:0008050 | female courtship behavior(GO:0008050) |
| 0.0 | 0.1 | GO:0010982 | regulation of high-density lipoprotein particle clearance(GO:0010982) |
| 0.0 | 0.3 | GO:0010265 | SCF complex assembly(GO:0010265) |
| 0.0 | 0.2 | GO:0006857 | oligopeptide transport(GO:0006857) |
| 0.0 | 0.1 | GO:0016561 | protein import into peroxisome matrix, translocation(GO:0016561) |
| 0.0 | 0.2 | GO:0000066 | mitochondrial ornithine transport(GO:0000066) |
| 0.0 | 0.1 | GO:0002879 | positive regulation of acute inflammatory response to non-antigenic stimulus(GO:0002879) |
| 0.0 | 0.2 | GO:1903899 | positive regulation of PERK-mediated unfolded protein response(GO:1903899) |
| 0.0 | 0.1 | GO:0052151 | positive regulation by symbiont of host apoptotic process(GO:0052151) positive regulation of apoptotic process by virus(GO:0060139) |
| 0.0 | 0.0 | GO:0045763 | negative regulation of cellular amino acid metabolic process(GO:0045763) |
| 0.0 | 0.2 | GO:0033629 | negative regulation of cell adhesion mediated by integrin(GO:0033629) |
| 0.0 | 0.2 | GO:0033504 | floor plate development(GO:0033504) |
| 0.0 | 0.7 | GO:0071985 | multivesicular body sorting pathway(GO:0071985) |
| 0.0 | 0.0 | GO:0009138 | pyrimidine nucleoside diphosphate metabolic process(GO:0009138) |
| 0.0 | 0.1 | GO:0038098 | sequestering of BMP from receptor via BMP binding(GO:0038098) |
| 0.0 | 0.0 | GO:2000547 | regulation of dendritic cell dendrite assembly(GO:2000547) |
| 0.0 | 0.3 | GO:1902746 | regulation of lens fiber cell differentiation(GO:1902746) |
| 0.0 | 0.5 | GO:0007021 | tubulin complex assembly(GO:0007021) |
| 0.0 | 0.1 | GO:0021577 | hindbrain structural organization(GO:0021577) cerebellum structural organization(GO:0021589) |
| 0.0 | 0.1 | GO:0060179 | male mating behavior(GO:0060179) |
| 0.0 | 0.0 | GO:0032707 | negative regulation of interleukin-23 production(GO:0032707) |
| 0.0 | 0.2 | GO:0048104 | establishment of body hair or bristle planar orientation(GO:0048104) establishment of body hair planar orientation(GO:0048105) |
| 0.0 | 0.1 | GO:0033386 | geranylgeranyl diphosphate metabolic process(GO:0033385) geranylgeranyl diphosphate biosynthetic process(GO:0033386) |
| 0.0 | 0.1 | GO:0005989 | lactose metabolic process(GO:0005988) lactose biosynthetic process(GO:0005989) |
| 0.0 | 0.1 | GO:0060298 | positive regulation of sarcomere organization(GO:0060298) |
| 0.0 | 0.1 | GO:1902612 | regulation of anti-Mullerian hormone signaling pathway(GO:1902612) negative regulation of anti-Mullerian hormone signaling pathway(GO:1902613) anti-Mullerian hormone signaling pathway(GO:1990262) |
| 0.0 | 0.1 | GO:0009386 | translational attenuation(GO:0009386) |
| 0.0 | 0.1 | GO:0061073 | ciliary body morphogenesis(GO:0061073) |
| 0.0 | 0.3 | GO:0007288 | sperm axoneme assembly(GO:0007288) |
| 0.0 | 0.1 | GO:0090341 | negative regulation of secretion of lysosomal enzymes(GO:0090341) |
| 0.0 | 0.2 | GO:0006021 | inositol biosynthetic process(GO:0006021) |
| 0.0 | 0.1 | GO:1902037 | negative regulation of hematopoietic stem cell differentiation(GO:1902037) |
| 0.0 | 0.1 | GO:0021797 | forebrain anterior/posterior pattern specification(GO:0021797) |
| 0.0 | 0.1 | GO:1903413 | cellular response to bile acid(GO:1903413) |
| 0.0 | 0.1 | GO:1903799 | negative regulation of production of miRNAs involved in gene silencing by miRNA(GO:1903799) |
| 0.0 | 0.0 | GO:0045187 | circadian sleep/wake cycle process(GO:0022410) circadian sleep/wake cycle(GO:0042745) regulation of circadian sleep/wake cycle(GO:0042749) regulation of circadian sleep/wake cycle, sleep(GO:0045187) circadian sleep/wake cycle, sleep(GO:0050802) |
| 0.0 | 0.2 | GO:0038145 | macrophage colony-stimulating factor signaling pathway(GO:0038145) |
| 0.0 | 0.1 | GO:0003358 | noradrenergic neuron development(GO:0003358) |
| 0.0 | 0.0 | GO:0060081 | membrane hyperpolarization(GO:0060081) |
| 0.0 | 0.1 | GO:0072719 | cellular response to cisplatin(GO:0072719) |
| 0.0 | 0.1 | GO:0021521 | ventral spinal cord interneuron specification(GO:0021521) cell fate specification involved in pattern specification(GO:0060573) |
| 0.0 | 0.4 | GO:0006704 | glucocorticoid biosynthetic process(GO:0006704) |
| 0.0 | 0.1 | GO:0035964 | COPI-coated vesicle budding(GO:0035964) Golgi transport vesicle coating(GO:0048200) COPI coating of Golgi vesicle(GO:0048205) |
| 0.0 | 0.1 | GO:0090272 | negative regulation of fibroblast growth factor production(GO:0090272) |
| 0.0 | 0.1 | GO:0006433 | prolyl-tRNA aminoacylation(GO:0006433) |
| 0.0 | 0.2 | GO:0014807 | regulation of somitogenesis(GO:0014807) |
| 0.0 | 0.1 | GO:1904808 | regulation of protein oxidation(GO:1904806) positive regulation of protein oxidation(GO:1904808) |
| 0.0 | 0.1 | GO:0035865 | cellular response to potassium ion(GO:0035865) |
| 0.0 | 0.3 | GO:2000009 | negative regulation of protein localization to cell surface(GO:2000009) |
| 0.0 | 0.1 | GO:0002024 | diet induced thermogenesis(GO:0002024) |
| 0.0 | 0.1 | GO:0010755 | regulation of plasminogen activation(GO:0010755) negative regulation of plasminogen activation(GO:0010757) |
| 0.0 | 0.7 | GO:0070886 | positive regulation of calcineurin-NFAT signaling cascade(GO:0070886) |
| 0.0 | 0.2 | GO:0002118 | aggressive behavior(GO:0002118) |
| 0.0 | 0.1 | GO:0016256 | N-glycan processing to lysosome(GO:0016256) |
| 0.0 | 0.1 | GO:0060993 | kidney morphogenesis(GO:0060993) |
| 0.0 | 0.1 | GO:0042045 | epithelial fluid transport(GO:0042045) |
| 0.0 | 0.1 | GO:0045918 | negative regulation of cytolysis(GO:0045918) |
| 0.0 | 0.2 | GO:0016102 | retinoic acid biosynthetic process(GO:0002138) diterpenoid biosynthetic process(GO:0016102) |
| 0.0 | 1.3 | GO:0006953 | acute-phase response(GO:0006953) |
| 0.0 | 0.1 | GO:0055099 | response to high density lipoprotein particle(GO:0055099) |
| 0.0 | 0.4 | GO:0043562 | cellular response to nitrogen starvation(GO:0006995) cellular response to nitrogen levels(GO:0043562) |
| 0.0 | 0.2 | GO:1900029 | positive regulation of ruffle assembly(GO:1900029) |
| 0.0 | 0.3 | GO:0002480 | antigen processing and presentation of exogenous peptide antigen via MHC class I, TAP-independent(GO:0002480) |
| 0.0 | 0.1 | GO:0006546 | glycine catabolic process(GO:0006546) glycine decarboxylation via glycine cleavage system(GO:0019464) |
| 0.0 | 0.1 | GO:0060447 | bud outgrowth involved in lung branching(GO:0060447) |
| 0.0 | 0.1 | GO:1901523 | leukotriene catabolic process(GO:0036100) leukotriene B4 catabolic process(GO:0036101) leukotriene B4 metabolic process(GO:0036102) icosanoid catabolic process(GO:1901523) fatty acid derivative catabolic process(GO:1901569) |
| 0.0 | 0.2 | GO:0002176 | male germ cell proliferation(GO:0002176) germ cell proliferation(GO:0036093) |
| 0.0 | 0.2 | GO:0035803 | egg coat formation(GO:0035803) |
| 0.0 | 0.1 | GO:0016185 | synaptic vesicle budding from presynaptic endocytic zone membrane(GO:0016185) |
| 0.0 | 0.1 | GO:0007525 | somatic muscle development(GO:0007525) |
| 0.0 | 2.8 | GO:0070268 | cornification(GO:0070268) |
| 0.0 | 0.0 | GO:0035054 | embryonic heart tube anterior/posterior pattern specification(GO:0035054) |
| 0.0 | 0.1 | GO:1904245 | regulation of polynucleotide adenylyltransferase activity(GO:1904245) positive regulation of polynucleotide adenylyltransferase activity(GO:1904247) |
| 0.0 | 0.1 | GO:0090403 | oxidative stress-induced premature senescence(GO:0090403) |
| 0.0 | 0.1 | GO:0090260 | negative regulation of retinal ganglion cell axon guidance(GO:0090260) |
| 0.0 | 0.0 | GO:0090370 | negative regulation of cholesterol efflux(GO:0090370) |
| 0.0 | 0.1 | GO:0010820 | positive regulation of T cell chemotaxis(GO:0010820) |
| 0.0 | 0.1 | GO:0052027 | modulation of signal transduction in other organism(GO:0044501) modulation by symbiont of host signal transduction pathway(GO:0052027) modulation of signal transduction in other organism involved in symbiotic interaction(GO:0052250) modulation by symbiont of host I-kappaB kinase/NF-kappaB cascade(GO:0085032) |
| 0.0 | 0.0 | GO:1904204 | regulation of skeletal muscle hypertrophy(GO:1904204) |
| 0.0 | 0.2 | GO:0042940 | D-amino acid transport(GO:0042940) |
| 0.0 | 0.1 | GO:2000609 | regulation of thyroid hormone generation(GO:2000609) |
| 0.0 | 0.1 | GO:0030997 | regulation of centriole-centriole cohesion(GO:0030997) |
| 0.0 | 0.1 | GO:0010966 | regulation of phosphate transport(GO:0010966) |
| 0.0 | 0.5 | GO:0036158 | outer dynein arm assembly(GO:0036158) |
| 0.0 | 0.0 | GO:1902523 | positive regulation of protein K63-linked ubiquitination(GO:1902523) |
| 0.0 | 0.2 | GO:0060712 | spongiotrophoblast layer development(GO:0060712) |
| 0.0 | 0.1 | GO:1901162 | primary amino compound biosynthetic process(GO:1901162) |
| 0.0 | 0.0 | GO:0002439 | chronic inflammatory response to antigenic stimulus(GO:0002439) |
| 0.0 | 0.1 | GO:0042161 | plasma lipoprotein particle oxidation(GO:0034441) lipoprotein modification(GO:0042160) lipoprotein oxidation(GO:0042161) |
| 0.0 | 0.1 | GO:0014063 | regulation of serotonin secretion(GO:0014062) negative regulation of serotonin secretion(GO:0014063) |
| 0.0 | 0.1 | GO:0014043 | negative regulation of neuron maturation(GO:0014043) |
| 0.0 | 0.3 | GO:0030277 | maintenance of gastrointestinal epithelium(GO:0030277) |
| 0.0 | 0.0 | GO:0090238 | positive regulation of arachidonic acid secretion(GO:0090238) |
| 0.0 | 0.1 | GO:0030259 | lipid glycosylation(GO:0030259) |
| 0.0 | 0.1 | GO:0021633 | optic nerve structural organization(GO:0021633) |
| 0.0 | 0.0 | GO:0044034 | negative stranded viral RNA replication(GO:0039689) multi-organism biosynthetic process(GO:0044034) |
| 0.0 | 0.1 | GO:0042369 | vitamin D catabolic process(GO:0042369) |
| 0.0 | 0.1 | GO:1902490 | regulation of sperm capacitation(GO:1902490) |
| 0.0 | 0.1 | GO:0010756 | positive regulation of plasminogen activation(GO:0010756) |
| 0.0 | 0.1 | GO:1902714 | negative regulation of interferon-gamma secretion(GO:1902714) |
| 0.0 | 0.0 | GO:0046122 | purine deoxyribonucleoside metabolic process(GO:0046122) |
| 0.0 | 0.2 | GO:1902902 | negative regulation of autophagosome assembly(GO:1902902) |
| 0.0 | 0.7 | GO:0097503 | sialylation(GO:0097503) |
| 0.0 | 0.0 | GO:0061300 | cerebellum vasculature development(GO:0061300) |
| 0.0 | 0.2 | GO:0070257 | positive regulation of mucus secretion(GO:0070257) |
| 0.0 | 0.0 | GO:2001016 | positive regulation of skeletal muscle cell differentiation(GO:2001016) |
| 0.0 | 0.0 | GO:1903371 | regulation of endoplasmic reticulum tubular network organization(GO:1903371) |
| 0.0 | 0.0 | GO:0010866 | regulation of triglyceride biosynthetic process(GO:0010866) positive regulation of triglyceride biosynthetic process(GO:0010867) |
| 0.0 | 0.0 | GO:0000711 | meiotic DNA repair synthesis(GO:0000711) |
| 0.0 | 0.0 | GO:0032972 | regulation of muscle filament sliding speed(GO:0032972) |
| 0.0 | 0.1 | GO:0072678 | T cell migration(GO:0072678) |
| 0.0 | 0.1 | GO:0032962 | positive regulation of inositol trisphosphate biosynthetic process(GO:0032962) |
| 0.0 | 0.4 | GO:0050930 | induction of positive chemotaxis(GO:0050930) |
| 0.0 | 0.1 | GO:0002933 | lipid hydroxylation(GO:0002933) |
| 0.0 | 0.5 | GO:0007130 | synaptonemal complex assembly(GO:0007130) |
| 0.0 | 0.1 | GO:1903565 | negative regulation of protein localization to cilium(GO:1903565) regulation of protein localization to ciliary membrane(GO:1903567) negative regulation of protein localization to ciliary membrane(GO:1903568) |
| 0.0 | 0.3 | GO:0051639 | actin filament network formation(GO:0051639) |
| 0.0 | 0.1 | GO:0044209 | AMP salvage(GO:0044209) |
| 0.0 | 0.2 | GO:0035589 | G-protein coupled purinergic nucleotide receptor signaling pathway(GO:0035589) |
| 0.0 | 0.1 | GO:0001757 | somite specification(GO:0001757) |
| 0.0 | 0.1 | GO:0001573 | ganglioside metabolic process(GO:0001573) |
| 0.0 | 0.1 | GO:0042350 | GDP-L-fucose biosynthetic process(GO:0042350) |
| 0.0 | 0.2 | GO:0006026 | aminoglycan catabolic process(GO:0006026) glycosaminoglycan catabolic process(GO:0006027) |
| 0.0 | 0.2 | GO:1904352 | positive regulation of protein catabolic process in the vacuole(GO:1904352) |
| 0.0 | 0.1 | GO:0033512 | L-lysine catabolic process to acetyl-CoA via saccharopine(GO:0033512) |
| 0.0 | 0.1 | GO:1903093 | regulation of protein K48-linked deubiquitination(GO:1903093) negative regulation of protein K48-linked deubiquitination(GO:1903094) negative regulation of ubiquitin-specific protease activity(GO:2000157) |
| 0.0 | 0.1 | GO:0045792 | negative regulation of cell size(GO:0045792) |
| 0.0 | 0.1 | GO:0070676 | intralumenal vesicle formation(GO:0070676) |
| 0.0 | 0.1 | GO:0043415 | positive regulation of skeletal muscle tissue regeneration(GO:0043415) |
| 0.0 | 0.1 | GO:0046013 | regulation of T cell homeostatic proliferation(GO:0046013) |
| 0.0 | 0.1 | GO:0031133 | regulation of axon diameter(GO:0031133) |
| 0.0 | 0.2 | GO:0001675 | acrosome assembly(GO:0001675) |
| 0.0 | 0.3 | GO:0009313 | oligosaccharide catabolic process(GO:0009313) |
| 0.0 | 0.1 | GO:0044266 | angiotensin catabolic process in blood(GO:0002005) multicellular organismal protein catabolic process(GO:0044254) protein digestion(GO:0044256) multicellular organismal macromolecule catabolic process(GO:0044266) |
| 0.0 | 0.1 | GO:0090107 | regulation of high-density lipoprotein particle assembly(GO:0090107) |
| 0.0 | 0.0 | GO:0002522 | leukocyte migration involved in immune response(GO:0002522) |
| 0.0 | 0.1 | GO:0097089 | methyl-branched fatty acid metabolic process(GO:0097089) |
| 0.0 | 0.0 | GO:0045362 | regulation of interleukin-1 biosynthetic process(GO:0045360) positive regulation of interleukin-1 biosynthetic process(GO:0045362) |
| 0.0 | 0.0 | GO:1901074 | regulation of engulfment of apoptotic cell(GO:1901074) |
| 0.0 | 0.0 | GO:0045651 | positive regulation of macrophage differentiation(GO:0045651) |
| 0.0 | 0.2 | GO:2001054 | negative regulation of mesenchymal cell apoptotic process(GO:2001054) |
| 0.0 | 0.1 | GO:1902683 | regulation of receptor localization to synapse(GO:1902683) |
| 0.0 | 0.1 | GO:2000857 | positive regulation of mineralocorticoid secretion(GO:2000857) positive regulation of aldosterone secretion(GO:2000860) |
| 0.0 | 0.1 | GO:2000402 | negative regulation of lymphocyte migration(GO:2000402) |
| 0.0 | 0.2 | GO:0015732 | prostaglandin transport(GO:0015732) |
| 0.0 | 0.3 | GO:0010839 | negative regulation of keratinocyte proliferation(GO:0010839) |
| 0.0 | 0.0 | GO:0070445 | oligodendrocyte progenitor proliferation(GO:0070444) regulation of oligodendrocyte progenitor proliferation(GO:0070445) |
| 0.0 | 0.0 | GO:0048854 | brain morphogenesis(GO:0048854) |
| 0.0 | 0.0 | GO:0032755 | positive regulation of interleukin-6 production(GO:0032755) |
| 0.0 | 0.2 | GO:0045919 | positive regulation of cytolysis(GO:0045919) |
| 0.0 | 0.1 | GO:0007258 | JUN phosphorylation(GO:0007258) |
| 0.0 | 0.5 | GO:0006123 | mitochondrial electron transport, cytochrome c to oxygen(GO:0006123) |
| 0.0 | 0.1 | GO:0021529 | spinal cord oligodendrocyte cell differentiation(GO:0021529) spinal cord oligodendrocyte cell fate specification(GO:0021530) |
| 0.0 | 0.1 | GO:1902462 | regulation of mesenchymal stem cell proliferation(GO:1902460) positive regulation of mesenchymal stem cell proliferation(GO:1902462) |
| 0.0 | 0.0 | GO:0043084 | penile erection(GO:0043084) |
| 0.0 | 0.1 | GO:0061739 | protein lipidation involved in autophagosome assembly(GO:0061739) |
| 0.0 | 0.1 | GO:0048041 | cell-substrate adherens junction assembly(GO:0007045) adherens junction assembly(GO:0034333) focal adhesion assembly(GO:0048041) |
| 0.0 | 0.1 | GO:0048505 | regulation of development, heterochronic(GO:0040034) regulation of timing of cell differentiation(GO:0048505) |
| 0.0 | 0.0 | GO:0060024 | rhythmic synaptic transmission(GO:0060024) |
| 0.0 | 0.2 | GO:0086068 | Purkinje myocyte to ventricular cardiac muscle cell signaling(GO:0086029) Purkinje myocyte to ventricular cardiac muscle cell communication(GO:0086068) |
| 0.0 | 0.3 | GO:0060134 | prepulse inhibition(GO:0060134) |
| 0.0 | 0.1 | GO:0033364 | mast cell secretory granule organization(GO:0033364) |
| 0.0 | 0.1 | GO:0034144 | negative regulation of toll-like receptor 4 signaling pathway(GO:0034144) |
| 0.0 | 0.2 | GO:1904714 | regulation of chaperone-mediated autophagy(GO:1904714) |
| 0.0 | 0.0 | GO:2001206 | positive regulation of osteoclast development(GO:2001206) |
| 0.0 | 0.0 | GO:2000546 | positive regulation of cell chemotaxis to fibroblast growth factor(GO:1904849) positive regulation of endothelial cell chemotaxis to fibroblast growth factor(GO:2000546) |
| 0.0 | 0.0 | GO:0003285 | septum secundum development(GO:0003285) |
| 0.0 | 0.1 | GO:0007352 | zygotic specification of dorsal/ventral axis(GO:0007352) |
| 0.0 | 0.0 | GO:0030185 | nitric oxide transport(GO:0030185) |
| 0.0 | 0.2 | GO:0015812 | gamma-aminobutyric acid transport(GO:0015812) |
| 0.0 | 0.0 | GO:0016188 | synaptic vesicle maturation(GO:0016188) |
| 0.0 | 0.1 | GO:1990637 | response to prolactin(GO:1990637) |
| 0.0 | 0.2 | GO:0032119 | sequestering of zinc ion(GO:0032119) |
| 0.0 | 0.1 | GO:2001224 | positive regulation of neuron migration(GO:2001224) |
| 0.0 | 0.1 | GO:0099640 | axo-dendritic protein transport(GO:0099640) |
| 0.0 | 0.1 | GO:2000843 | testosterone secretion(GO:0035936) regulation of hepatic stellate cell proliferation(GO:1904897) positive regulation of hepatic stellate cell proliferation(GO:1904899) hepatic stellate cell proliferation(GO:1990922) regulation of testosterone secretion(GO:2000843) positive regulation of testosterone secretion(GO:2000845) |
| 0.0 | 0.0 | GO:0072156 | distal tubule morphogenesis(GO:0072156) |
| 0.0 | 0.1 | GO:0033277 | abortive mitotic cell cycle(GO:0033277) |
| 0.0 | 0.2 | GO:0051608 | histamine transport(GO:0051608) |
| 0.0 | 0.0 | GO:0046110 | xanthine metabolic process(GO:0046110) |
| 0.0 | 0.3 | GO:0043401 | steroid hormone mediated signaling pathway(GO:0043401) |
| 0.0 | 0.1 | GO:0071104 | response to interleukin-9(GO:0071104) |
| 0.0 | 0.1 | GO:0046836 | glycolipid transport(GO:0046836) |
| 0.0 | 0.2 | GO:0021520 | spinal cord motor neuron cell fate specification(GO:0021520) |
| 0.0 | 0.1 | GO:0021849 | neuroblast division in subventricular zone(GO:0021849) |
| 0.0 | 0.2 | GO:0016191 | synaptic vesicle uncoating(GO:0016191) |
| 0.0 | 0.1 | GO:2000059 | negative regulation of protein ubiquitination involved in ubiquitin-dependent protein catabolic process(GO:2000059) |
| 0.0 | 0.1 | GO:0071442 | positive regulation of histone H3-K14 acetylation(GO:0071442) |
| 0.0 | 0.1 | GO:0042104 | positive regulation of activated T cell proliferation(GO:0042104) |
| 0.0 | 0.0 | GO:0060054 | positive regulation of epithelial cell proliferation involved in wound healing(GO:0060054) |
| 0.0 | 0.0 | GO:0071926 | endocannabinoid signaling pathway(GO:0071926) regulation of endocannabinoid signaling pathway(GO:2000124) |
| 0.0 | 0.2 | GO:0030157 | pancreatic juice secretion(GO:0030157) |
| 0.0 | 0.1 | GO:0090214 | spongiotrophoblast layer developmental growth(GO:0090214) |
| 0.0 | 0.1 | GO:0001964 | startle response(GO:0001964) |
| 0.0 | 0.3 | GO:0007175 | negative regulation of epidermal growth factor-activated receptor activity(GO:0007175) |
| 0.0 | 0.2 | GO:0070050 | neuron cellular homeostasis(GO:0070050) |
| 0.0 | 0.1 | GO:0015760 | hexose phosphate transport(GO:0015712) glucose-6-phosphate transport(GO:0015760) |
| 0.0 | 0.1 | GO:0071395 | response to jasmonic acid(GO:0009753) cellular response to jasmonic acid stimulus(GO:0071395) |
| 0.0 | 0.1 | GO:1903659 | complement-dependent cytotoxicity(GO:0097278) regulation of complement-dependent cytotoxicity(GO:1903659) |
| 0.0 | 0.0 | GO:2000418 | positive regulation of eosinophil migration(GO:2000418) |
| 0.0 | 0.1 | GO:0009629 | response to gravity(GO:0009629) |
| 0.0 | 0.2 | GO:0072540 | T-helper 17 cell lineage commitment(GO:0072540) |
| 0.0 | 0.2 | GO:0036066 | protein O-linked fucosylation(GO:0036066) |
| 0.0 | 0.1 | GO:0055064 | chloride ion homeostasis(GO:0055064) |
| 0.0 | 0.0 | GO:0032525 | somite rostral/caudal axis specification(GO:0032525) |
| 0.0 | 0.1 | GO:0051673 | membrane disruption in other organism(GO:0051673) |
| 0.0 | 0.0 | GO:1903244 | positive regulation of cardiac muscle adaptation(GO:0010615) positive regulation of cardiac muscle hypertrophy in response to stress(GO:1903244) |
| 0.0 | 0.2 | GO:0014883 | transition between fast and slow fiber(GO:0014883) |
| 0.0 | 0.1 | GO:0051562 | negative regulation of mitochondrial calcium ion concentration(GO:0051562) |
| 0.0 | 0.0 | GO:0042418 | epinephrine metabolic process(GO:0042414) epinephrine biosynthetic process(GO:0042418) |
| 0.0 | 0.1 | GO:0097116 | gephyrin clustering involved in postsynaptic density assembly(GO:0097116) neuroligin clustering involved in postsynaptic membrane assembly(GO:0097118) |
| 0.0 | 1.5 | GO:0050911 | detection of chemical stimulus involved in sensory perception of smell(GO:0050911) |
| 0.0 | 0.1 | GO:0036493 | positive regulation of translation in response to endoplasmic reticulum stress(GO:0036493) |
| 0.0 | 0.0 | GO:1902202 | regulation of hepatocyte growth factor receptor signaling pathway(GO:1902202) |
| 0.0 | 0.3 | GO:0051601 | exocyst localization(GO:0051601) |
| 0.0 | 0.1 | GO:0098501 | polynucleotide dephosphorylation(GO:0098501) |
| 0.0 | 0.0 | GO:0014744 | positive regulation of muscle adaptation(GO:0014744) |
| 0.0 | 0.1 | GO:2000768 | positive regulation of nephron tubule epithelial cell differentiation(GO:2000768) |
| 0.0 | 0.1 | GO:0030382 | sperm mitochondrion organization(GO:0030382) |
| 0.0 | 0.0 | GO:1903903 | regulation of establishment of T cell polarity(GO:1903903) |
| 0.0 | 0.1 | GO:0019626 | short-chain fatty acid catabolic process(GO:0019626) |
| 0.0 | 0.0 | GO:0061370 | testosterone biosynthetic process(GO:0061370) |
| 0.0 | 0.3 | GO:1904259 | regulation of basement membrane assembly involved in embryonic body morphogenesis(GO:1904259) positive regulation of basement membrane assembly involved in embryonic body morphogenesis(GO:1904261) basement membrane assembly involved in embryonic body morphogenesis(GO:2001197) |
| 0.0 | 0.2 | GO:0035095 | behavioral response to nicotine(GO:0035095) |
| 0.0 | 0.2 | GO:0048681 | negative regulation of axon regeneration(GO:0048681) |
| 0.0 | 0.0 | GO:0045082 | positive regulation of interleukin-10 biosynthetic process(GO:0045082) |
| 0.0 | 0.1 | GO:0032495 | response to muramyl dipeptide(GO:0032495) |
| 0.0 | 0.1 | GO:0032959 | inositol trisphosphate biosynthetic process(GO:0032959) |
| 0.0 | 0.1 | GO:0021869 | forebrain ventricular zone progenitor cell division(GO:0021869) |
| 0.0 | 0.2 | GO:0060124 | positive regulation of growth hormone secretion(GO:0060124) |
| 0.0 | 0.0 | GO:0021794 | thalamus development(GO:0021794) |
| 0.0 | 0.0 | GO:1903121 | regulation of TRAIL-activated apoptotic signaling pathway(GO:1903121) positive regulation of TRAIL-activated apoptotic signaling pathway(GO:1903984) |
| 0.0 | 0.0 | GO:0045084 | positive regulation of interleukin-12 biosynthetic process(GO:0045084) |
| 0.0 | 0.1 | GO:0044339 | canonical Wnt signaling pathway involved in osteoblast differentiation(GO:0044339) |
| 0.0 | 0.0 | GO:0044381 | glucose import in response to insulin stimulus(GO:0044381) |
| 0.0 | 0.0 | GO:0090290 | positive regulation of osteoclast proliferation(GO:0090290) |
| 0.0 | 0.0 | GO:0051152 | positive regulation of smooth muscle cell differentiation(GO:0051152) |
| 0.0 | 0.0 | GO:0032099 | negative regulation of response to food(GO:0032096) negative regulation of appetite(GO:0032099) |
| 0.0 | 0.1 | GO:1903237 | negative regulation of leukocyte tethering or rolling(GO:1903237) negative regulation of leukocyte adhesion to vascular endothelial cell(GO:1904995) |
| 0.0 | 0.1 | GO:0018095 | protein polyglutamylation(GO:0018095) |
| 0.0 | 0.1 | GO:2001106 | regulation of Rho guanyl-nucleotide exchange factor activity(GO:2001106) |
| 0.0 | 0.2 | GO:0010759 | positive regulation of macrophage chemotaxis(GO:0010759) |
| 0.0 | 0.1 | GO:0045716 | positive regulation of low-density lipoprotein particle receptor biosynthetic process(GO:0045716) |
| 0.0 | 0.4 | GO:0008535 | respiratory chain complex IV assembly(GO:0008535) |
| 0.0 | 0.3 | GO:0001502 | cartilage condensation(GO:0001502) |
| 0.0 | 0.0 | GO:0002625 | regulation of T cell antigen processing and presentation(GO:0002625) |
| 0.0 | 0.3 | GO:0043011 | myeloid dendritic cell differentiation(GO:0043011) |
| 0.0 | 0.0 | GO:0002276 | basophil activation involved in immune response(GO:0002276) |
| 0.0 | 0.1 | GO:0060332 | positive regulation of response to interferon-gamma(GO:0060332) positive regulation of interferon-gamma-mediated signaling pathway(GO:0060335) |
| 0.0 | 0.0 | GO:0022617 | extracellular matrix disassembly(GO:0022617) |
| 0.0 | 0.2 | GO:0071420 | cellular response to histamine(GO:0071420) |
| 0.0 | 0.1 | GO:0071243 | cellular response to arsenic-containing substance(GO:0071243) |
| 0.0 | 0.1 | GO:0006543 | glutamine catabolic process(GO:0006543) |
| 0.0 | 0.1 | GO:0043931 | ossification involved in bone maturation(GO:0043931) |
| 0.0 | 0.0 | GO:0097368 | establishment of Sertoli cell barrier(GO:0097368) |
| 0.0 | 0.4 | GO:0006825 | copper ion transport(GO:0006825) |
| 0.0 | 0.0 | GO:0000023 | maltose metabolic process(GO:0000023) |
| 0.0 | 0.0 | GO:0090526 | regulation of gluconeogenesis involved in cellular glucose homeostasis(GO:0090526) |
| 0.0 | 0.1 | GO:0061042 | vascular wound healing(GO:0061042) |
| 0.0 | 0.1 | GO:0051151 | negative regulation of smooth muscle cell differentiation(GO:0051151) |
| 0.0 | 0.1 | GO:0046604 | positive regulation of mitotic centrosome separation(GO:0046604) |
| 0.0 | 0.1 | GO:2000189 | positive regulation of cholesterol homeostasis(GO:2000189) |
| 0.0 | 0.6 | GO:0051602 | response to electrical stimulus(GO:0051602) |
| 0.0 | 0.1 | GO:0021540 | corpus callosum morphogenesis(GO:0021540) |
| 0.0 | 0.0 | GO:1902174 | positive regulation of keratinocyte apoptotic process(GO:1902174) |
| 0.0 | 0.1 | GO:0017196 | N-terminal peptidyl-methionine acetylation(GO:0017196) |
| 0.0 | 0.1 | GO:0010818 | T cell chemotaxis(GO:0010818) |
| 0.0 | 0.3 | GO:0045745 | positive regulation of G-protein coupled receptor protein signaling pathway(GO:0045745) |
| 0.0 | 0.0 | GO:0006788 | heme oxidation(GO:0006788) |
| 0.0 | 0.9 | GO:0006120 | mitochondrial electron transport, NADH to ubiquinone(GO:0006120) |
| 0.0 | 0.0 | GO:1903722 | regulation of centriole elongation(GO:1903722) |
| 0.0 | 0.1 | GO:0060478 | acrosomal vesicle exocytosis(GO:0060478) |
| 0.0 | 0.0 | GO:0060809 | mesodermal to mesenchymal transition involved in gastrulation(GO:0060809) |
| 0.0 | 0.1 | GO:2000638 | regulation of SREBP signaling pathway(GO:2000638) negative regulation of SREBP signaling pathway(GO:2000639) |
| 0.0 | 0.2 | GO:1901898 | negative regulation of relaxation of cardiac muscle(GO:1901898) |
| 0.0 | 0.1 | GO:0070673 | response to interleukin-18(GO:0070673) |
| 0.0 | 0.1 | GO:1901203 | positive regulation of extracellular matrix assembly(GO:1901203) |
| 0.0 | 0.2 | GO:0006122 | mitochondrial electron transport, ubiquinol to cytochrome c(GO:0006122) |
| 0.0 | 0.0 | GO:0016098 | monoterpenoid metabolic process(GO:0016098) |
| 0.0 | 0.1 | GO:0014733 | regulation of skeletal muscle adaptation(GO:0014733) |
| 0.0 | 0.0 | GO:0071418 | cellular response to amine stimulus(GO:0071418) |
| 0.0 | 0.0 | GO:0045409 | negative regulation of interleukin-6 biosynthetic process(GO:0045409) |
| 0.0 | 0.0 | GO:0002325 | natural killer cell differentiation involved in immune response(GO:0002325) negative regulation of natural killer cell differentiation(GO:0032824) regulation of natural killer cell differentiation involved in immune response(GO:0032826) negative regulation of natural killer cell differentiation involved in immune response(GO:0032827) |
| 0.0 | 0.0 | GO:1900239 | phenotypic switching(GO:0036166) regulation of phenotypic switching(GO:1900239) |
| 0.0 | 0.0 | GO:0002885 | positive regulation of hypersensitivity(GO:0002885) |
| 0.0 | 0.0 | GO:0010845 | positive regulation of reciprocal meiotic recombination(GO:0010845) |
| 0.0 | 0.0 | GO:0061152 | trachea submucosa development(GO:0061152) trachea gland development(GO:0061153) |
| 0.0 | 0.1 | GO:0038018 | Wnt receptor catabolic process(GO:0038018) |
| 0.0 | 0.0 | GO:0019254 | carnitine metabolic process, CoA-linked(GO:0019254) |
| 0.0 | 0.0 | GO:0016999 | antibiotic metabolic process(GO:0016999) |
| 0.0 | 0.0 | GO:0072054 | renal inner medulla development(GO:0072053) renal outer medulla development(GO:0072054) |
| 0.0 | 0.1 | GO:1904685 | positive regulation of metalloendopeptidase activity(GO:1904685) |
| 0.0 | 0.3 | GO:0034587 | piRNA metabolic process(GO:0034587) |
| 0.0 | 0.5 | GO:0007340 | acrosome reaction(GO:0007340) |
| 0.0 | 0.0 | GO:2000321 | positive regulation of T-helper 17 cell differentiation(GO:2000321) |
| 0.0 | 0.0 | GO:0044828 | negative regulation by host of viral genome replication(GO:0044828) |
| 0.0 | 0.1 | GO:0006040 | amino sugar metabolic process(GO:0006040) |
| 0.0 | 0.0 | GO:0051541 | elastin metabolic process(GO:0051541) |
| 0.0 | 0.3 | GO:0003298 | physiological muscle hypertrophy(GO:0003298) physiological cardiac muscle hypertrophy(GO:0003301) cell growth involved in cardiac muscle cell development(GO:0061049) |
| 0.0 | 0.2 | GO:2000766 | negative regulation of cytoplasmic translation(GO:2000766) |
| 0.0 | 0.1 | GO:0007256 | activation of JNKK activity(GO:0007256) |
| 0.0 | 0.0 | GO:0046532 | regulation of photoreceptor cell differentiation(GO:0046532) |
| 0.0 | 0.1 | GO:0006210 | pyrimidine nucleobase catabolic process(GO:0006208) thymine catabolic process(GO:0006210) thymine metabolic process(GO:0019859) |
| 0.0 | 0.1 | GO:0006600 | creatine metabolic process(GO:0006600) |
| 0.0 | 0.1 | GO:0015860 | purine nucleoside transmembrane transport(GO:0015860) |
| 0.0 | 0.1 | GO:0015755 | fructose transport(GO:0015755) fructose import(GO:0032445) carbohydrate import into cell(GO:0097319) carbohydrate import across plasma membrane(GO:0098704) fructose import across plasma membrane(GO:1990539) |
| 0.0 | 0.1 | GO:0032530 | regulation of microvillus organization(GO:0032530) |
| 0.0 | 0.0 | GO:0051643 | endoplasmic reticulum localization(GO:0051643) |
| 0.0 | 0.1 | GO:0021696 | cerebellar cortex morphogenesis(GO:0021696) |
| 0.0 | 0.1 | GO:0072008 | glomerular mesangial cell differentiation(GO:0072008) glomerular mesangial cell development(GO:0072144) |
| 0.0 | 0.4 | GO:0035082 | axoneme assembly(GO:0035082) |
| 0.0 | 0.2 | GO:0042340 | keratan sulfate catabolic process(GO:0042340) |
| 0.0 | 0.2 | GO:0034067 | protein localization to Golgi apparatus(GO:0034067) |
| 0.0 | 0.1 | GO:0038172 | interleukin-33-mediated signaling pathway(GO:0038172) |
| 0.0 | 0.1 | GO:0051873 | killing by host of symbiont cells(GO:0051873) |
| 0.0 | 0.1 | GO:0033078 | extrathymic T cell differentiation(GO:0033078) |
| 0.0 | 0.1 | GO:0045471 | response to ethanol(GO:0045471) |
| 0.0 | 0.0 | GO:1903351 | response to dopamine(GO:1903350) cellular response to dopamine(GO:1903351) |
| 0.0 | 0.1 | GO:1905247 | regulation of aspartic-type endopeptidase activity involved in amyloid precursor protein catabolic process(GO:1902959) positive regulation of aspartic-type endopeptidase activity involved in amyloid precursor protein catabolic process(GO:1902961) regulation of aspartic-type peptidase activity(GO:1905245) positive regulation of aspartic-type peptidase activity(GO:1905247) |
| 0.0 | 0.1 | GO:0015074 | DNA integration(GO:0015074) |
| 0.0 | 0.1 | GO:1903025 | regulation of RNA polymerase II regulatory region sequence-specific DNA binding(GO:1903025) |
| 0.0 | 0.0 | GO:1901655 | cellular response to ketone(GO:1901655) |
| 0.0 | 0.0 | GO:0036353 | histone H2A-K119 monoubiquitination(GO:0036353) |
| 0.0 | 0.0 | GO:1900246 | positive regulation of RIG-I signaling pathway(GO:1900246) |
| 0.0 | 0.0 | GO:0046130 | purine nucleoside catabolic process(GO:0006152) purine ribonucleoside catabolic process(GO:0046130) |
| 0.0 | 0.0 | GO:0060743 | epithelial cell maturation involved in prostate gland development(GO:0060743) |
| 0.0 | 0.0 | GO:0002143 | tRNA wobble position uridine thiolation(GO:0002143) |
| 0.0 | 0.0 | GO:0048250 | mitochondrial iron ion transport(GO:0048250) |
| 0.0 | 0.1 | GO:2000194 | regulation of female gonad development(GO:2000194) |
| 0.0 | 0.1 | GO:0038169 | somatostatin receptor signaling pathway(GO:0038169) somatostatin signaling pathway(GO:0038170) |
| 0.0 | 0.0 | GO:1990523 | bone regeneration(GO:1990523) |
| 0.0 | 0.0 | GO:0007191 | adenylate cyclase-activating dopamine receptor signaling pathway(GO:0007191) |
| 0.0 | 0.2 | GO:0010663 | positive regulation of striated muscle cell apoptotic process(GO:0010663) positive regulation of cardiac muscle cell apoptotic process(GO:0010666) |
| 0.0 | 0.0 | GO:0014826 | vein smooth muscle contraction(GO:0014826) |
| 0.0 | 0.0 | GO:2000397 | regulation of ubiquitin-dependent endocytosis(GO:2000395) positive regulation of ubiquitin-dependent endocytosis(GO:2000397) |
| 0.0 | 0.2 | GO:0032836 | glomerular basement membrane development(GO:0032836) |
| 0.0 | 0.2 | GO:0036498 | IRE1-mediated unfolded protein response(GO:0036498) |
| 0.0 | 0.0 | GO:2000035 | regulation of stem cell division(GO:2000035) |
| 0.0 | 0.6 | GO:0031424 | keratinization(GO:0031424) |
| 0.0 | 0.0 | GO:0071279 | cellular response to cobalt ion(GO:0071279) |
| 0.0 | 0.0 | GO:0072108 | positive regulation of mesenchymal to epithelial transition involved in metanephros morphogenesis(GO:0072108) |
| 0.0 | 0.9 | GO:0001895 | retina homeostasis(GO:0001895) |
| 0.0 | 0.1 | GO:0070560 | protein secretion by platelet(GO:0070560) |
| 0.0 | 0.0 | GO:0097032 | respiratory chain complex II assembly(GO:0034552) mitochondrial respiratory chain complex II assembly(GO:0034553) mitochondrial respiratory chain complex II biogenesis(GO:0097032) |
| 0.0 | 0.1 | GO:2000111 | positive regulation of macrophage apoptotic process(GO:2000111) |
| 0.0 | 0.0 | GO:0015813 | L-glutamate transport(GO:0015813) |
| 0.0 | 0.0 | GO:0032912 | negative regulation of transforming growth factor beta2 production(GO:0032912) |
| 0.0 | 0.0 | GO:0035372 | protein localization to microtubule(GO:0035372) |
| 0.0 | 0.0 | GO:1990414 | replication-born double-strand break repair via sister chromatid exchange(GO:1990414) |
| 0.0 | 0.2 | GO:0034975 | protein folding in endoplasmic reticulum(GO:0034975) |
| 0.0 | 0.4 | GO:0015701 | bicarbonate transport(GO:0015701) |
| 0.0 | 0.1 | GO:1903279 | regulation of calcium:sodium antiporter activity(GO:1903279) |
| 0.0 | 0.0 | GO:0007439 | ectodermal digestive tract development(GO:0007439) embryonic ectodermal digestive tract development(GO:0048611) |
| 0.0 | 0.1 | GO:0006552 | leucine catabolic process(GO:0006552) |
| 0.0 | 0.1 | GO:0035021 | negative regulation of Rac protein signal transduction(GO:0035021) |
| 0.0 | 0.1 | GO:0051684 | maintenance of Golgi location(GO:0051684) |
| 0.0 | 0.1 | GO:0051127 | positive regulation of actin nucleation(GO:0051127) |
| 0.0 | 0.1 | GO:1902109 | negative regulation of mitochondrial membrane permeability involved in apoptotic process(GO:1902109) |
| 0.0 | 0.0 | GO:1903336 | negative regulation of vacuolar transport(GO:1903336) |
| 0.0 | 0.1 | GO:0051697 | protein delipidation(GO:0051697) |
| 0.0 | 0.0 | GO:0007250 | activation of NF-kappaB-inducing kinase activity(GO:0007250) |
| 0.0 | 0.8 | GO:0006968 | cellular defense response(GO:0006968) |
| 0.0 | 0.0 | GO:0070105 | positive regulation of interleukin-6-mediated signaling pathway(GO:0070105) |
| 0.0 | 0.0 | GO:0036414 | protein citrullination(GO:0018101) histone citrullination(GO:0036414) |
| 0.0 | 0.1 | GO:0000738 | DNA catabolic process, exonucleolytic(GO:0000738) |
| 0.0 | 0.1 | GO:0035690 | cellular response to drug(GO:0035690) |
| 0.0 | 0.0 | GO:0060830 | ciliary receptor clustering involved in smoothened signaling pathway(GO:0060830) |
| 0.0 | 0.1 | GO:0090278 | negative regulation of peptide secretion(GO:0002792) negative regulation of peptide hormone secretion(GO:0090278) |
| 0.0 | 0.1 | GO:0007176 | regulation of epidermal growth factor-activated receptor activity(GO:0007176) |
| 0.0 | 0.1 | GO:1904706 | negative regulation of vascular smooth muscle cell proliferation(GO:1904706) |
| 0.0 | 0.0 | GO:0051801 | cytolysis in other organism involved in symbiotic interaction(GO:0051801) |
| 0.0 | 0.1 | GO:1900271 | regulation of long-term synaptic potentiation(GO:1900271) |
| 0.0 | 0.1 | GO:0042737 | drug catabolic process(GO:0042737) |
| 0.0 | 1.0 | GO:0060333 | interferon-gamma-mediated signaling pathway(GO:0060333) |
| 0.0 | 0.2 | GO:0015695 | organic cation transport(GO:0015695) |
| 0.0 | 0.1 | GO:0006657 | CDP-choline pathway(GO:0006657) |
| 0.0 | 0.0 | GO:0001923 | B-1 B cell differentiation(GO:0001923) |
| 0.0 | 0.1 | GO:0050774 | negative regulation of dendrite morphogenesis(GO:0050774) |
| 0.0 | 0.0 | GO:0006663 | platelet activating factor biosynthetic process(GO:0006663) |
| 0.0 | 0.0 | GO:1903203 | regulation of oxidative stress-induced neuron death(GO:1903203) |
| 0.0 | 0.0 | GO:0060736 | prostate gland growth(GO:0060736) |
| 0.0 | 0.3 | GO:0016339 | calcium-dependent cell-cell adhesion via plasma membrane cell adhesion molecules(GO:0016339) |
| 0.0 | 0.0 | GO:0046520 | sphingoid biosynthetic process(GO:0046520) |
| 0.0 | 0.0 | GO:0010800 | positive regulation of peptidyl-threonine phosphorylation(GO:0010800) |
| 0.0 | 0.0 | GO:1904717 | excitatory chemical synaptic transmission(GO:0098976) regulation of AMPA glutamate receptor clustering(GO:1904717) positive regulation of AMPA glutamate receptor clustering(GO:1904719) |
| 0.0 | 0.0 | GO:0052405 | modulation by symbiont of host molecular function(GO:0052055) modulation of catalytic activity in other organism involved in symbiotic interaction(GO:0052203) negative regulation by host of symbiont molecular function(GO:0052405) modulation by host of symbiont catalytic activity(GO:0052422) |
| 0.0 | 0.1 | GO:0018231 | peptidyl-L-cysteine S-palmitoylation(GO:0018230) peptidyl-S-diacylglycerol-L-cysteine biosynthetic process from peptidyl-cysteine(GO:0018231) |
| 0.0 | 0.1 | GO:1904936 | cerebral cortex GABAergic interneuron migration(GO:0021853) interneuron migration(GO:1904936) |
| 0.0 | 0.0 | GO:0002101 | tRNA wobble cytosine modification(GO:0002101) oxidative single-stranded DNA demethylation(GO:0035552) |
| 0.0 | 0.1 | GO:0042989 | sequestering of actin monomers(GO:0042989) |
Gene overrepresentation in cellular_component category:
| Log-likelihood per target | Total log-likelihood | Term | Description |
|---|---|---|---|
| 0.3 | 2.1 | GO:0097209 | epidermal lamellar body(GO:0097209) |
| 0.2 | 0.7 | GO:0043512 | inhibin complex(GO:0043511) inhibin A complex(GO:0043512) |
| 0.2 | 1.1 | GO:1902937 | inward rectifier potassium channel complex(GO:1902937) |
| 0.2 | 0.2 | GO:0097179 | protease inhibitor complex(GO:0097179) |
| 0.1 | 1.2 | GO:0035976 | AP1 complex(GO:0035976) |
| 0.1 | 0.4 | GO:0071065 | alpha9-beta1 integrin-vascular cell adhesion molecule-1 complex(GO:0071065) |
| 0.1 | 0.5 | GO:1990796 | photoreceptor cell terminal bouton(GO:1990796) |
| 0.1 | 0.6 | GO:0072558 | NLRP1 inflammasome complex(GO:0072558) |
| 0.1 | 0.1 | GO:0032590 | dendrite membrane(GO:0032590) |
| 0.1 | 0.3 | GO:0036338 | viral envelope(GO:0019031) viral membrane(GO:0036338) |
| 0.1 | 0.5 | GO:1990131 | Gtr1-Gtr2 GTPase complex(GO:1990131) |
| 0.1 | 0.6 | GO:0005610 | laminin-5 complex(GO:0005610) |
| 0.1 | 0.2 | GO:0070195 | growth hormone receptor complex(GO:0070195) |
| 0.1 | 4.1 | GO:0001533 | cornified envelope(GO:0001533) |
| 0.1 | 0.1 | GO:0005889 | hydrogen:potassium-exchanging ATPase complex(GO:0005889) |
| 0.1 | 0.3 | GO:0060201 | clathrin-sculpted acetylcholine transport vesicle(GO:0060200) clathrin-sculpted acetylcholine transport vesicle membrane(GO:0060201) |
| 0.1 | 0.8 | GO:0045179 | apical cortex(GO:0045179) |
| 0.1 | 0.2 | GO:1990031 | pinceau fiber(GO:1990031) |
| 0.1 | 0.2 | GO:0034686 | integrin alphav-beta8 complex(GO:0034686) |
| 0.0 | 0.6 | GO:0030666 | endocytic vesicle membrane(GO:0030666) |
| 0.0 | 0.2 | GO:0016533 | cyclin-dependent protein kinase 5 holoenzyme complex(GO:0016533) |
| 0.0 | 0.2 | GO:0097442 | CA3 pyramidal cell dendrite(GO:0097442) |
| 0.0 | 1.2 | GO:0043205 | microfibril(GO:0001527) fibril(GO:0043205) |
| 0.0 | 0.3 | GO:0005947 | mitochondrial alpha-ketoglutarate dehydrogenase complex(GO:0005947) |
| 0.0 | 0.4 | GO:0036056 | filtration diaphragm(GO:0036056) slit diaphragm(GO:0036057) |
| 0.0 | 0.1 | GO:1990357 | terminal web(GO:1990357) |
| 0.0 | 0.1 | GO:0097232 | lamellar body membrane(GO:0097232) alveolar lamellar body membrane(GO:0097233) |
| 0.0 | 0.2 | GO:0031205 | endoplasmic reticulum Sec complex(GO:0031205) |
| 0.0 | 0.2 | GO:0032144 | 4-aminobutyrate transaminase complex(GO:0032144) |
| 0.0 | 0.3 | GO:1990393 | 3M complex(GO:1990393) |
| 0.0 | 0.1 | GO:0031838 | haptoglobin-hemoglobin complex(GO:0031838) |
| 0.0 | 0.9 | GO:0005922 | connexon complex(GO:0005922) |
| 0.0 | 1.7 | GO:0034364 | high-density lipoprotein particle(GO:0034364) |
| 0.0 | 0.1 | GO:0097057 | TRAF2-GSTP1 complex(GO:0097057) |
| 0.0 | 0.5 | GO:0043209 | myelin sheath(GO:0043209) |
| 0.0 | 0.4 | GO:0097197 | tetraspanin-enriched microdomain(GO:0097197) |
| 0.0 | 0.1 | GO:0070436 | Grb2-EGFR complex(GO:0070436) |
| 0.0 | 0.2 | GO:1990584 | cardiac Troponin complex(GO:1990584) |
| 0.0 | 0.1 | GO:0043260 | laminin-3 complex(GO:0005608) laminin-11 complex(GO:0043260) |
| 0.0 | 0.2 | GO:0034991 | nuclear meiotic cohesin complex(GO:0034991) |
| 0.0 | 0.2 | GO:0031905 | early endosome lumen(GO:0031905) |
| 0.0 | 0.2 | GO:0044393 | microspike(GO:0044393) |
| 0.0 | 0.5 | GO:0033010 | paranodal junction(GO:0033010) |
| 0.0 | 0.1 | GO:0070435 | Shc-EGFR complex(GO:0070435) |
| 0.0 | 0.1 | GO:0031616 | spindle pole centrosome(GO:0031616) |
| 0.0 | 0.4 | GO:0097512 | cardiac myofibril(GO:0097512) |
| 0.0 | 0.2 | GO:0060076 | excitatory synapse(GO:0060076) |
| 0.0 | 0.4 | GO:0033018 | sarcoplasmic reticulum lumen(GO:0033018) |
| 0.0 | 0.1 | GO:0060187 | cell pole(GO:0060187) |
| 0.0 | 0.2 | GO:0030121 | AP-1 adaptor complex(GO:0030121) |
| 0.0 | 0.2 | GO:0032010 | phagolysosome(GO:0032010) |
| 0.0 | 0.3 | GO:0033391 | chromatoid body(GO:0033391) |
| 0.0 | 0.1 | GO:0001931 | uropod(GO:0001931) cell trailing edge(GO:0031254) |
| 0.0 | 0.7 | GO:0005639 | integral component of nuclear inner membrane(GO:0005639) intrinsic component of nuclear inner membrane(GO:0031229) |
| 0.0 | 0.3 | GO:0042612 | MHC class I protein complex(GO:0042612) |
| 0.0 | 0.6 | GO:0042613 | MHC class II protein complex(GO:0042613) |
| 0.0 | 0.1 | GO:0000444 | MIS12/MIND type complex(GO:0000444) |
| 0.0 | 0.1 | GO:0020005 | symbiont-containing vacuole(GO:0020003) symbiont-containing vacuole membrane(GO:0020005) |
| 0.0 | 0.5 | GO:0005861 | troponin complex(GO:0005861) |
| 0.0 | 0.2 | GO:1990111 | spermatoproteasome complex(GO:1990111) |
| 0.0 | 0.3 | GO:0032584 | growth cone membrane(GO:0032584) |
| 0.0 | 0.0 | GO:0098984 | symmetric synapse(GO:0032280) neuron to neuron synapse(GO:0098984) |
| 0.0 | 0.1 | GO:0030895 | apolipoprotein B mRNA editing enzyme complex(GO:0030895) |
| 0.0 | 0.3 | GO:0002116 | semaphorin receptor complex(GO:0002116) |
| 0.0 | 0.2 | GO:0000408 | EKC/KEOPS complex(GO:0000408) |
| 0.0 | 0.0 | GO:0002199 | zona pellucida receptor complex(GO:0002199) |
| 0.0 | 0.6 | GO:0045495 | P granule(GO:0043186) pole plasm(GO:0045495) germ plasm(GO:0060293) |
| 0.0 | 0.1 | GO:0002193 | MAML1-RBP-Jkappa- ICN1 complex(GO:0002193) |
| 0.0 | 0.1 | GO:0034666 | integrin alpha2-beta1 complex(GO:0034666) |
| 0.0 | 0.1 | GO:1905202 | 3-methylcrotonyl-CoA carboxylase complex, mitochondrial(GO:0002169) methylcrotonoyl-CoA carboxylase complex(GO:1905202) |
| 0.0 | 0.0 | GO:0044294 | dendritic growth cone(GO:0044294) |
| 0.0 | 0.2 | GO:0097418 | neurofibrillary tangle(GO:0097418) |
| 0.0 | 0.2 | GO:0016012 | sarcoglycan complex(GO:0016012) |
| 0.0 | 1.5 | GO:0030964 | mitochondrial respiratory chain complex I(GO:0005747) NADH dehydrogenase complex(GO:0030964) respiratory chain complex I(GO:0045271) |
| 0.0 | 0.1 | GO:0031417 | NatC complex(GO:0031417) |
| 0.0 | 0.2 | GO:1990712 | HFE-transferrin receptor complex(GO:1990712) |
| 0.0 | 0.4 | GO:0030056 | hemidesmosome(GO:0030056) |
| 0.0 | 0.1 | GO:0019008 | molybdopterin synthase complex(GO:0019008) |
| 0.0 | 0.1 | GO:0001652 | granular component(GO:0001652) |
| 0.0 | 0.1 | GO:1903349 | omegasome membrane(GO:1903349) |
| 0.0 | 0.1 | GO:0071458 | integral component of cytoplasmic side of endoplasmic reticulum membrane(GO:0071458) |
| 0.0 | 0.6 | GO:0005605 | basal lamina(GO:0005605) |
| 0.0 | 0.1 | GO:0097450 | astrocyte end-foot(GO:0097450) |
| 0.0 | 0.1 | GO:0030140 | trans-Golgi network transport vesicle(GO:0030140) |
| 0.0 | 0.1 | GO:0042272 | nuclear RNA export factor complex(GO:0042272) |
| 0.0 | 0.2 | GO:0000801 | central element(GO:0000801) |
| 0.0 | 0.1 | GO:0005850 | eukaryotic translation initiation factor 2 complex(GO:0005850) |
| 0.0 | 2.1 | GO:0035578 | azurophil granule lumen(GO:0035578) |
| 0.0 | 0.3 | GO:0045180 | basal cortex(GO:0045180) |
| 0.0 | 0.1 | GO:0097129 | cyclin D2-CDK4 complex(GO:0097129) |
| 0.0 | 0.0 | GO:1902710 | GABA receptor complex(GO:1902710) |
| 0.0 | 0.1 | GO:1902560 | GMP reductase complex(GO:1902560) |
| 0.0 | 0.0 | GO:0045177 | apical part of cell(GO:0045177) |
| 0.0 | 0.1 | GO:0097169 | AIM2 inflammasome complex(GO:0097169) |
| 0.0 | 0.1 | GO:0000220 | vacuolar proton-transporting V-type ATPase, V0 domain(GO:0000220) |
| 0.0 | 0.1 | GO:0070985 | TFIIK complex(GO:0070985) |
| 0.0 | 0.1 | GO:0044298 | neuronal cell body membrane(GO:0032809) cell body membrane(GO:0044298) |
| 0.0 | 0.0 | GO:0034657 | GID complex(GO:0034657) |
| 0.0 | 1.5 | GO:0034707 | chloride channel complex(GO:0034707) |
| 0.0 | 0.0 | GO:0033150 | cytoskeletal calyx(GO:0033150) |
| 0.0 | 0.1 | GO:0090498 | extrinsic component of Golgi membrane(GO:0090498) |
| 0.0 | 0.1 | GO:0043679 | axon terminus(GO:0043679) |
| 0.0 | 0.1 | GO:0070695 | FHF complex(GO:0070695) |
| 0.0 | 0.1 | GO:0031092 | platelet alpha granule membrane(GO:0031092) |
| 0.0 | 0.2 | GO:0042629 | mast cell granule(GO:0042629) |
| 0.0 | 0.3 | GO:0005751 | mitochondrial respiratory chain complex IV(GO:0005751) |
| 0.0 | 0.2 | GO:1990316 | ATG1/ULK1 kinase complex(GO:1990316) |
| 0.0 | 0.2 | GO:0035253 | ciliary rootlet(GO:0035253) |
| 0.0 | 0.4 | GO:0031226 | intrinsic component of plasma membrane(GO:0031226) |
| 0.0 | 1.1 | GO:0045095 | keratin filament(GO:0045095) |
| 0.0 | 0.1 | GO:0042765 | GPI-anchor transamidase complex(GO:0042765) |
| 0.0 | 0.2 | GO:0005719 | nuclear euchromatin(GO:0005719) |
| 0.0 | 0.1 | GO:0045252 | oxoglutarate dehydrogenase complex(GO:0045252) |
| 0.0 | 0.0 | GO:0031227 | intrinsic component of endoplasmic reticulum membrane(GO:0031227) |
| 0.0 | 0.0 | GO:0030688 | preribosome, small subunit precursor(GO:0030688) |
| 0.0 | 0.1 | GO:1990907 | beta-catenin-TCF complex(GO:1990907) |
| 0.0 | 0.1 | GO:0030057 | desmosome(GO:0030057) |
| 0.0 | 0.0 | GO:0098843 | postsynaptic endocytic zone(GO:0098843) |
| 0.0 | 0.1 | GO:0005641 | nuclear envelope lumen(GO:0005641) |
| 0.0 | 0.1 | GO:0030485 | smooth muscle contractile fiber(GO:0030485) |
| 0.0 | 0.1 | GO:0005677 | chromatin silencing complex(GO:0005677) |
| 0.0 | 0.2 | GO:0043020 | NADPH oxidase complex(GO:0043020) |
| 0.0 | 0.1 | GO:0035686 | sperm fibrous sheath(GO:0035686) |
| 0.0 | 0.3 | GO:0031095 | platelet dense tubular network membrane(GO:0031095) |
| 0.0 | 0.1 | GO:0005801 | cis-Golgi network(GO:0005801) |
| 0.0 | 0.2 | GO:0036513 | Derlin-1 retrotranslocation complex(GO:0036513) |
| 0.0 | 0.1 | GO:0008537 | proteasome activator complex(GO:0008537) |
| 0.0 | 0.0 | GO:0097449 | astrocyte projection(GO:0097449) |
| 0.0 | 0.3 | GO:0031083 | BLOC-1 complex(GO:0031083) |
| 0.0 | 0.1 | GO:1990246 | uniplex complex(GO:1990246) |
| 0.0 | 0.2 | GO:0030008 | TRAPP complex(GO:0030008) |
| 0.0 | 0.9 | GO:0035580 | specific granule lumen(GO:0035580) |
| 0.0 | 0.0 | GO:0031233 | intrinsic component of external side of plasma membrane(GO:0031233) |
| 0.0 | 0.0 | GO:0038038 | G-protein coupled receptor homodimeric complex(GO:0038038) |
| 0.0 | 0.0 | GO:0030125 | clathrin vesicle coat(GO:0030125) |
| 0.0 | 0.3 | GO:0044295 | axonal growth cone(GO:0044295) |
| 0.0 | 0.0 | GO:0008385 | IkappaB kinase complex(GO:0008385) |
| 0.0 | 0.2 | GO:0000813 | ESCRT I complex(GO:0000813) |
| 0.0 | 0.2 | GO:0031528 | microvillus membrane(GO:0031528) |
| 0.0 | 0.3 | GO:0034706 | sodium channel complex(GO:0034706) |
| 0.0 | 0.0 | GO:0036156 | inner dynein arm(GO:0036156) |
| 0.0 | 0.1 | GO:0097486 | multivesicular body lumen(GO:0097486) |
| 0.0 | 0.3 | GO:0032839 | dendrite cytoplasm(GO:0032839) |
| 0.0 | 0.1 | GO:0033256 | I-kappaB/NF-kappaB complex(GO:0033256) |
| 0.0 | 0.0 | GO:0030904 | retromer complex(GO:0030904) |
| 0.0 | 0.2 | GO:0036038 | MKS complex(GO:0036038) |
| 0.0 | 0.0 | GO:1990716 | axonemal central apparatus(GO:1990716) |
| 0.0 | 0.1 | GO:0005927 | muscle tendon junction(GO:0005927) |
| 0.0 | 0.1 | GO:0045275 | mitochondrial respiratory chain complex III(GO:0005750) respiratory chain complex III(GO:0045275) |
| 0.0 | 0.3 | GO:0016581 | NuRD complex(GO:0016581) CHD-type complex(GO:0090545) |
Gene overrepresentation in molecular_function category:
| Log-likelihood per target | Total log-likelihood | Term | Description |
|---|---|---|---|
| 0.5 | 1.4 | GO:0004947 | bradykinin receptor activity(GO:0004947) |
| 0.3 | 0.8 | GO:0070699 | type II activin receptor binding(GO:0070699) |
| 0.2 | 1.2 | GO:0038062 | protein tyrosine kinase collagen receptor activity(GO:0038062) |
| 0.2 | 1.7 | GO:0015349 | thyroid hormone transmembrane transporter activity(GO:0015349) |
| 0.2 | 1.5 | GO:0004499 | N,N-dimethylaniline monooxygenase activity(GO:0004499) |
| 0.2 | 0.5 | GO:0017129 | triglyceride binding(GO:0017129) |
| 0.2 | 0.5 | GO:0036313 | phosphatidylinositol 3-kinase catalytic subunit binding(GO:0036313) |
| 0.2 | 0.6 | GO:0047066 | phospholipid-hydroperoxide glutathione peroxidase activity(GO:0047066) |
| 0.1 | 0.4 | GO:0003845 | 11-beta-hydroxysteroid dehydrogenase [NAD(P)] activity(GO:0003845) |
| 0.1 | 0.4 | GO:0016603 | glutaminyl-peptide cyclotransferase activity(GO:0016603) |
| 0.1 | 0.5 | GO:0001588 | dopamine neurotransmitter receptor activity, coupled via Gs(GO:0001588) |
| 0.1 | 0.6 | GO:0060961 | phospholipase D inhibitor activity(GO:0060961) |
| 0.1 | 0.7 | GO:0015501 | glutamate:sodium symporter activity(GO:0015501) |
| 0.1 | 1.4 | GO:0001087 | transcription factor activity, sequence-specific DNA binding, RNA polymerase recruiting(GO:0001011) transcription factor activity, TFIIB-class binding(GO:0001087) |
| 0.1 | 0.2 | GO:0015254 | glycerol channel activity(GO:0015254) |
| 0.1 | 0.4 | GO:0052798 | beta-galactoside alpha-2,3-sialyltransferase activity(GO:0052798) |
| 0.1 | 0.4 | GO:0008431 | vitamin E binding(GO:0008431) |
| 0.1 | 0.4 | GO:0016404 | 15-hydroxyprostaglandin dehydrogenase (NAD+) activity(GO:0016404) |
| 0.1 | 0.3 | GO:0005260 | channel-conductance-controlling ATPase activity(GO:0005260) |
| 0.1 | 0.3 | GO:0097258 | tocopherol omega-hydroxylase activity(GO:0052870) alpha-tocopherol omega-hydroxylase activity(GO:0052871) 20-hydroxy-leukotriene B4 omega oxidase activity(GO:0097258) 20-aldehyde-leukotriene B4 20-monooxygenase activity(GO:0097259) |
| 0.1 | 0.3 | GO:0004938 | alpha2-adrenergic receptor activity(GO:0004938) |
| 0.1 | 0.3 | GO:0004416 | hydroxyacylglutathione hydrolase activity(GO:0004416) |
| 0.1 | 0.9 | GO:0050544 | arachidonic acid binding(GO:0050544) |
| 0.1 | 0.6 | GO:0070891 | lipoteichoic acid binding(GO:0070891) |
| 0.1 | 0.2 | GO:0047223 | beta-1,3-galactosyl-O-glycosyl-glycoprotein beta-1,3-N-acetylglucosaminyltransferase activity(GO:0047223) |
| 0.1 | 1.4 | GO:0031957 | very long-chain fatty acid-CoA ligase activity(GO:0031957) |
| 0.1 | 0.2 | GO:0098782 | mechanically-gated potassium channel activity(GO:0098782) |
| 0.1 | 0.4 | GO:0015265 | urea channel activity(GO:0015265) |
| 0.1 | 0.4 | GO:0070576 | vitamin D 24-hydroxylase activity(GO:0070576) |
| 0.1 | 0.2 | GO:1902122 | chenodeoxycholic acid binding(GO:1902122) |
| 0.1 | 0.3 | GO:0044715 | 8-oxo-dGDP phosphatase activity(GO:0044715) |
| 0.1 | 0.2 | GO:0030984 | kininogen binding(GO:0030984) |
| 0.1 | 0.4 | GO:0045029 | UDP-activated nucleotide receptor activity(GO:0045029) |
| 0.1 | 0.2 | GO:0038131 | neuregulin receptor activity(GO:0038131) |
| 0.1 | 0.3 | GO:0015375 | glycine:sodium symporter activity(GO:0015375) |
| 0.1 | 0.4 | GO:0015307 | drug:proton antiporter activity(GO:0015307) |
| 0.1 | 0.2 | GO:0016165 | linoleate 13S-lipoxygenase activity(GO:0016165) |
| 0.1 | 0.2 | GO:0017082 | mineralocorticoid receptor activity(GO:0017082) |
| 0.1 | 1.3 | GO:0022841 | potassium ion leak channel activity(GO:0022841) |
| 0.1 | 0.7 | GO:0060228 | phosphatidylcholine-sterol O-acyltransferase activator activity(GO:0060228) |
| 0.1 | 0.6 | GO:0016724 | ferroxidase activity(GO:0004322) oxidoreductase activity, oxidizing metal ions, oxygen as acceptor(GO:0016724) |
| 0.1 | 0.4 | GO:0008449 | N-acetylglucosamine-6-sulfatase activity(GO:0008449) |
| 0.1 | 0.1 | GO:0016015 | morphogen activity(GO:0016015) |
| 0.1 | 0.1 | GO:0008410 | CoA-transferase activity(GO:0008410) |
| 0.1 | 0.7 | GO:0003996 | acyl-CoA ligase activity(GO:0003996) |
| 0.1 | 0.2 | GO:0000994 | RNA polymerase III core binding(GO:0000994) |
| 0.1 | 0.6 | GO:0048495 | Roundabout binding(GO:0048495) |
| 0.1 | 0.1 | GO:0015204 | urea transmembrane transporter activity(GO:0015204) |
| 0.1 | 0.3 | GO:0023024 | MHC class I protein complex binding(GO:0023024) |
| 0.1 | 0.1 | GO:0034186 | apolipoprotein A-I binding(GO:0034186) |
| 0.1 | 0.1 | GO:0070696 | transmembrane receptor protein serine/threonine kinase binding(GO:0070696) |
| 0.1 | 0.2 | GO:0005150 | interleukin-1, Type I receptor binding(GO:0005150) |
| 0.1 | 0.3 | GO:0047820 | D-glutamate cyclase activity(GO:0047820) |
| 0.1 | 0.3 | GO:0008453 | alanine-glyoxylate transaminase activity(GO:0008453) |
| 0.1 | 0.9 | GO:0019911 | structural constituent of myelin sheath(GO:0019911) |
| 0.1 | 0.4 | GO:0004522 | ribonuclease A activity(GO:0004522) |
| 0.1 | 0.2 | GO:0031783 | corticotropin hormone receptor binding(GO:0031780) type 5 melanocortin receptor binding(GO:0031783) |
| 0.1 | 0.2 | GO:0003863 | alpha-ketoacid dehydrogenase activity(GO:0003826) 3-methyl-2-oxobutanoate dehydrogenase (2-methylpropanoyl-transferring) activity(GO:0003863) |
| 0.1 | 0.3 | GO:0004741 | [pyruvate dehydrogenase (lipoamide)] phosphatase activity(GO:0004741) |
| 0.1 | 0.4 | GO:0005005 | transmembrane-ephrin receptor activity(GO:0005005) |
| 0.1 | 0.7 | GO:0004022 | alcohol dehydrogenase (NAD) activity(GO:0004022) |
| 0.1 | 0.1 | GO:0038064 | collagen receptor activity(GO:0038064) |
| 0.1 | 0.3 | GO:0047288 | monosialoganglioside sialyltransferase activity(GO:0047288) |
| 0.1 | 0.2 | GO:0035651 | AP-3 adaptor complex binding(GO:0035651) |
| 0.1 | 0.1 | GO:0004819 | glutamine-tRNA ligase activity(GO:0004819) |
| 0.1 | 0.9 | GO:0036374 | glutathione hydrolase activity(GO:0036374) |
| 0.1 | 0.2 | GO:0022897 | peptide:proton symporter activity(GO:0015333) proton-dependent peptide secondary active transmembrane transporter activity(GO:0022897) |
| 0.0 | 0.3 | GO:0050610 | oxidoreductase activity, acting on a sulfur group of donors, quinone or similar compound as acceptor(GO:0016672) glutathione dehydrogenase (ascorbate) activity(GO:0045174) methylarsonate reductase activity(GO:0050610) |
| 0.0 | 0.2 | GO:0005124 | scavenger receptor binding(GO:0005124) |
| 0.0 | 0.8 | GO:0004000 | adenosine deaminase activity(GO:0004000) |
| 0.0 | 0.1 | GO:0004574 | oligo-1,6-glucosidase activity(GO:0004574) |
| 0.0 | 0.1 | GO:0050254 | rhodopsin kinase activity(GO:0050254) |
| 0.0 | 0.1 | GO:0016534 | cyclin-dependent protein kinase 5 activator activity(GO:0016534) |
| 0.0 | 0.1 | GO:0050698 | proteoglycan sulfotransferase activity(GO:0050698) |
| 0.0 | 0.2 | GO:0004699 | calcium-independent protein kinase C activity(GO:0004699) |
| 0.0 | 1.4 | GO:0098641 | cadherin binding involved in cell-cell adhesion(GO:0098641) |
| 0.0 | 0.2 | GO:0004667 | prostaglandin-D synthase activity(GO:0004667) |
| 0.0 | 0.4 | GO:0031730 | CCR5 chemokine receptor binding(GO:0031730) |
| 0.0 | 0.2 | GO:0010465 | nerve growth factor receptor activity(GO:0010465) |
| 0.0 | 0.2 | GO:0050656 | 3'-phosphoadenosine 5'-phosphosulfate binding(GO:0050656) |
| 0.0 | 0.6 | GO:0032395 | MHC class II receptor activity(GO:0032395) |
| 0.0 | 0.1 | GO:0019912 | cyclin-dependent protein kinase activating kinase activity(GO:0019912) |
| 0.0 | 0.9 | GO:0050700 | CARD domain binding(GO:0050700) |
| 0.0 | 0.1 | GO:0016899 | oxidoreductase activity, acting on the CH-OH group of donors, oxygen as acceptor(GO:0016899) |
| 0.0 | 0.3 | GO:0030348 | syntaxin-3 binding(GO:0030348) |
| 0.0 | 0.1 | GO:0001596 | angiotensin type I receptor activity(GO:0001596) |
| 0.0 | 0.4 | GO:0000155 | phosphorelay sensor kinase activity(GO:0000155) |
| 0.0 | 0.1 | GO:0008476 | protein-tyrosine sulfotransferase activity(GO:0008476) |
| 0.0 | 0.2 | GO:0072345 | NAADP-sensitive calcium-release channel activity(GO:0072345) |
| 0.0 | 0.1 | GO:0034040 | lipid-transporting ATPase activity(GO:0034040) |
| 0.0 | 0.6 | GO:0070700 | BMP receptor binding(GO:0070700) |
| 0.0 | 0.0 | GO:0003943 | N-acetylgalactosamine-4-sulfatase activity(GO:0003943) |
| 0.0 | 0.1 | GO:0047631 | ADP-ribose diphosphatase activity(GO:0047631) |
| 0.0 | 0.6 | GO:0036312 | phosphatidylinositol 3-kinase regulatory subunit binding(GO:0036312) |
| 0.0 | 0.2 | GO:0002060 | purine nucleobase binding(GO:0002060) |
| 0.0 | 0.4 | GO:0004305 | ethanolamine kinase activity(GO:0004305) |
| 0.0 | 0.1 | GO:0004019 | adenylosuccinate synthase activity(GO:0004019) |
| 0.0 | 0.2 | GO:0032145 | 4-aminobutyrate transaminase activity(GO:0003867) succinate-semialdehyde dehydrogenase binding(GO:0032145) (S)-3-amino-2-methylpropionate transaminase activity(GO:0047298) |
| 0.0 | 0.6 | GO:1901702 | urate transmembrane transporter activity(GO:0015143) salt transmembrane transporter activity(GO:1901702) |
| 0.0 | 0.1 | GO:0098821 | BMP receptor activity(GO:0098821) |
| 0.0 | 0.9 | GO:0050811 | GABA receptor binding(GO:0050811) |
| 0.0 | 0.2 | GO:0004949 | cannabinoid receptor activity(GO:0004949) |
| 0.0 | 0.1 | GO:0016495 | C-X3-C chemokine receptor activity(GO:0016495) |
| 0.0 | 0.1 | GO:0052836 | inositol 5-diphosphate pentakisphosphate 5-kinase activity(GO:0052836) inositol diphosphate tetrakisphosphate kinase activity(GO:0052839) |
| 0.0 | 0.5 | GO:0031433 | telethonin binding(GO:0031433) |
| 0.0 | 0.1 | GO:0010698 | acetyltransferase activator activity(GO:0010698) |
| 0.0 | 0.0 | GO:0055131 | C3HC4-type RING finger domain binding(GO:0055131) |
| 0.0 | 0.1 | GO:0004833 | tryptophan 2,3-dioxygenase activity(GO:0004833) |
| 0.0 | 0.6 | GO:0043560 | insulin receptor substrate binding(GO:0043560) |
| 0.0 | 0.3 | GO:0008559 | xenobiotic-transporting ATPase activity(GO:0008559) |
| 0.0 | 0.4 | GO:0031013 | troponin I binding(GO:0031013) |
| 0.0 | 0.2 | GO:0005332 | gamma-aminobutyric acid:sodium symporter activity(GO:0005332) |
| 0.0 | 0.2 | GO:0008401 | retinoic acid 4-hydroxylase activity(GO:0008401) |
| 0.0 | 0.1 | GO:0090554 | apolipoprotein A-I receptor activity(GO:0034188) phosphatidylcholine-translocating ATPase activity(GO:0090554) phosphatidylserine-translocating ATPase activity(GO:0090556) |
| 0.0 | 0.2 | GO:0008273 | calcium, potassium:sodium antiporter activity(GO:0008273) |
| 0.0 | 0.1 | GO:0016401 | palmitoyl-CoA oxidase activity(GO:0016401) |
| 0.0 | 0.2 | GO:0008934 | inositol monophosphate 1-phosphatase activity(GO:0008934) inositol monophosphate 3-phosphatase activity(GO:0052832) inositol monophosphate 4-phosphatase activity(GO:0052833) inositol monophosphate phosphatase activity(GO:0052834) |
| 0.0 | 0.2 | GO:0047894 | flavonol 3-sulfotransferase activity(GO:0047894) |
| 0.0 | 0.0 | GO:0001034 | RNA polymerase III transcription factor activity, sequence-specific DNA binding(GO:0001034) |
| 0.0 | 0.1 | GO:0016262 | protein N-acetylglucosaminyltransferase activity(GO:0016262) |
| 0.0 | 0.9 | GO:0008093 | cytoskeletal adaptor activity(GO:0008093) |
| 0.0 | 0.2 | GO:0070740 | tubulin-glutamic acid ligase activity(GO:0070740) |
| 0.0 | 0.2 | GO:0034711 | inhibin binding(GO:0034711) |
| 0.0 | 0.2 | GO:0001602 | pancreatic polypeptide receptor activity(GO:0001602) |
| 0.0 | 0.8 | GO:0071837 | HMG box domain binding(GO:0071837) |
| 0.0 | 0.2 | GO:0004144 | diacylglycerol O-acyltransferase activity(GO:0004144) |
| 0.0 | 0.4 | GO:0005007 | fibroblast growth factor-activated receptor activity(GO:0005007) |
| 0.0 | 0.1 | GO:0004047 | aminomethyltransferase activity(GO:0004047) |
| 0.0 | 0.2 | GO:0001665 | alpha-N-acetylgalactosaminide alpha-2,6-sialyltransferase activity(GO:0001665) |
| 0.0 | 0.3 | GO:0001730 | 2'-5'-oligoadenylate synthetase activity(GO:0001730) |
| 0.0 | 0.5 | GO:0005549 | odorant binding(GO:0005549) |
| 0.0 | 0.2 | GO:0004925 | prolactin receptor activity(GO:0004925) |
| 0.0 | 0.3 | GO:0003810 | protein-glutamine gamma-glutamyltransferase activity(GO:0003810) |
| 0.0 | 0.2 | GO:0019215 | intermediate filament binding(GO:0019215) |
| 0.0 | 0.2 | GO:0004992 | platelet activating factor receptor activity(GO:0004992) |
| 0.0 | 1.0 | GO:0043014 | alpha-tubulin binding(GO:0043014) |
| 0.0 | 0.2 | GO:0004630 | phospholipase D activity(GO:0004630) |
| 0.0 | 0.2 | GO:1990430 | extracellular matrix protein binding(GO:1990430) |
| 0.0 | 0.3 | GO:0071933 | Arp2/3 complex binding(GO:0071933) |
| 0.0 | 0.2 | GO:0045569 | TRAIL binding(GO:0045569) |
| 0.0 | 0.1 | GO:0061752 | telomeric repeat-containing RNA binding(GO:0061752) |
| 0.0 | 0.2 | GO:0015057 | thrombin receptor activity(GO:0015057) |
| 0.0 | 0.2 | GO:0008048 | calcium sensitive guanylate cyclase activator activity(GO:0008048) |
| 0.0 | 0.5 | GO:0070330 | aromatase activity(GO:0070330) |
| 0.0 | 0.1 | GO:0042903 | tubulin deacetylase activity(GO:0042903) |
| 0.0 | 0.2 | GO:0004445 | inositol-polyphosphate 5-phosphatase activity(GO:0004445) phosphatidylinositol-3,4,5-trisphosphate 5-phosphatase activity(GO:0034485) |
| 0.0 | 0.2 | GO:0001517 | N-acetylglucosamine 6-O-sulfotransferase activity(GO:0001517) |
| 0.0 | 0.2 | GO:0042577 | lipid phosphatase activity(GO:0042577) |
| 0.0 | 0.1 | GO:0070492 | oligosaccharide binding(GO:0070492) |
| 0.0 | 0.3 | GO:0042834 | peptidoglycan binding(GO:0042834) |
| 0.0 | 0.3 | GO:0017110 | nucleoside-diphosphatase activity(GO:0017110) |
| 0.0 | 0.1 | GO:0015361 | low-affinity sodium:dicarboxylate symporter activity(GO:0015361) |
| 0.0 | 0.3 | GO:0008503 | benzodiazepine receptor activity(GO:0008503) |
| 0.0 | 0.1 | GO:0005152 | interleukin-1 receptor antagonist activity(GO:0005152) |
| 0.0 | 0.1 | GO:0061629 | RNA polymerase II sequence-specific DNA binding transcription factor binding(GO:0061629) |
| 0.0 | 0.1 | GO:0098518 | polynucleotide phosphatase activity(GO:0098518) |
| 0.0 | 0.1 | GO:0004827 | proline-tRNA ligase activity(GO:0004827) |
| 0.0 | 0.5 | GO:0004089 | carbonate dehydratase activity(GO:0004089) |
| 0.0 | 0.2 | GO:0090599 | alpha-glucosidase activity(GO:0090599) |
| 0.0 | 0.2 | GO:0008121 | ubiquinol-cytochrome-c reductase activity(GO:0008121) oxidoreductase activity, acting on diphenols and related substances as donors, cytochrome as acceptor(GO:0016681) |
| 0.0 | 0.2 | GO:0004839 | ubiquitin activating enzyme activity(GO:0004839) |
| 0.0 | 0.4 | GO:0019841 | retinol binding(GO:0019841) |
| 0.0 | 0.1 | GO:0004768 | stearoyl-CoA 9-desaturase activity(GO:0004768) acyl-CoA desaturase activity(GO:0016215) |
| 0.0 | 0.1 | GO:0008900 | hydrogen:potassium-exchanging ATPase activity(GO:0008900) |
| 0.0 | 0.2 | GO:1990254 | keratin filament binding(GO:1990254) |
| 0.0 | 0.1 | GO:0042923 | neuropeptide binding(GO:0042923) |
| 0.0 | 0.2 | GO:0004167 | dopachrome isomerase activity(GO:0004167) |
| 0.0 | 0.1 | GO:0008440 | inositol-1,4,5-trisphosphate 3-kinase activity(GO:0008440) |
| 0.0 | 0.1 | GO:0003829 | beta-1,3-galactosyl-O-glycosyl-glycoprotein beta-1,6-N-acetylglucosaminyltransferase activity(GO:0003829) |
| 0.0 | 0.2 | GO:0004862 | cAMP-dependent protein kinase inhibitor activity(GO:0004862) |
| 0.0 | 0.2 | GO:0004126 | cytidine deaminase activity(GO:0004126) |
| 0.0 | 0.5 | GO:0004143 | diacylglycerol kinase activity(GO:0004143) |
| 0.0 | 0.1 | GO:0005220 | inositol 1,4,5-trisphosphate-sensitive calcium-release channel activity(GO:0005220) |
| 0.0 | 0.4 | GO:0004065 | arylsulfatase activity(GO:0004065) |
| 0.0 | 0.1 | GO:0070579 | methylcytosine dioxygenase activity(GO:0070579) |
| 0.0 | 0.2 | GO:0000064 | L-ornithine transmembrane transporter activity(GO:0000064) |
| 0.0 | 0.1 | GO:0004705 | JUN kinase activity(GO:0004705) SAP kinase activity(GO:0016909) |
| 0.0 | 0.1 | GO:0046899 | nucleoside triphosphate adenylate kinase activity(GO:0046899) |
| 0.0 | 0.7 | GO:0019198 | transmembrane receptor protein tyrosine phosphatase activity(GO:0005001) transmembrane receptor protein phosphatase activity(GO:0019198) |
| 0.0 | 1.3 | GO:0070412 | R-SMAD binding(GO:0070412) |
| 0.0 | 0.1 | GO:0005168 | neurotrophin TRKA receptor binding(GO:0005168) |
| 0.0 | 0.2 | GO:0005250 | A-type (transient outward) potassium channel activity(GO:0005250) |
| 0.0 | 0.1 | GO:0047389 | glycerophosphocholine phosphodiesterase activity(GO:0047389) |
| 0.0 | 0.0 | GO:0004830 | tryptophan-tRNA ligase activity(GO:0004830) |
| 0.0 | 0.1 | GO:0042015 | interleukin-20 binding(GO:0042015) |
| 0.0 | 0.3 | GO:0030215 | semaphorin receptor binding(GO:0030215) |
| 0.0 | 0.1 | GO:0004618 | phosphoglycerate kinase activity(GO:0004618) |
| 0.0 | 0.4 | GO:0005149 | interleukin-1 receptor binding(GO:0005149) |
| 0.0 | 0.3 | GO:0017034 | Rap guanyl-nucleotide exchange factor activity(GO:0017034) |
| 0.0 | 0.7 | GO:0005229 | intracellular calcium activated chloride channel activity(GO:0005229) |
| 0.0 | 0.1 | GO:0004105 | choline-phosphate cytidylyltransferase activity(GO:0004105) |
| 0.0 | 0.1 | GO:0008859 | exoribonuclease II activity(GO:0008859) |
| 0.0 | 0.4 | GO:0016175 | superoxide-generating NADPH oxidase activity(GO:0016175) |
| 0.0 | 0.3 | GO:0038132 | neuregulin binding(GO:0038132) |
| 0.0 | 0.0 | GO:0005287 | high-affinity basic amino acid transmembrane transporter activity(GO:0005287) high-affinity arginine transmembrane transporter activity(GO:0005289) high-affinity lysine transmembrane transporter activity(GO:0005292) |
| 0.0 | 0.2 | GO:0019534 | toxin transporter activity(GO:0019534) |
| 0.0 | 0.5 | GO:0045504 | dynein heavy chain binding(GO:0045504) |
| 0.0 | 0.1 | GO:0030272 | 5-formyltetrahydrofolate cyclo-ligase activity(GO:0030272) |
| 0.0 | 0.0 | GO:0016421 | CoA carboxylase activity(GO:0016421) |
| 0.0 | 0.1 | GO:0046848 | hydroxyapatite binding(GO:0046848) |
| 0.0 | 0.1 | GO:0004485 | methylcrotonoyl-CoA carboxylase activity(GO:0004485) |
| 0.0 | 0.5 | GO:0004861 | cyclin-dependent protein serine/threonine kinase inhibitor activity(GO:0004861) |
| 0.0 | 0.1 | GO:0005044 | scavenger receptor activity(GO:0005044) |
| 0.0 | 0.1 | GO:0061513 | hexose phosphate transmembrane transporter activity(GO:0015119) organophosphate:inorganic phosphate antiporter activity(GO:0015315) hexose-phosphate:inorganic phosphate antiporter activity(GO:0015526) glucose 6-phosphate:inorganic phosphate antiporter activity(GO:0061513) |
| 0.0 | 0.1 | GO:0031893 | vasopressin receptor binding(GO:0031893) |
| 0.0 | 0.2 | GO:0016174 | NAD(P)H oxidase activity(GO:0016174) |
| 0.0 | 0.4 | GO:0016505 | peptidase activator activity involved in apoptotic process(GO:0016505) |
| 0.0 | 0.1 | GO:0001515 | opioid peptide activity(GO:0001515) |
| 0.0 | 0.0 | GO:0016774 | phosphotransferase activity, carboxyl group as acceptor(GO:0016774) |
| 0.0 | 0.0 | GO:0015111 | iodide transmembrane transporter activity(GO:0015111) |
| 0.0 | 0.1 | GO:0003835 | beta-galactoside alpha-2,6-sialyltransferase activity(GO:0003835) |
| 0.0 | 0.1 | GO:0045545 | syndecan binding(GO:0045545) |
| 0.0 | 0.1 | GO:0005174 | CD40 receptor binding(GO:0005174) |
| 0.0 | 0.1 | GO:0004911 | interleukin-2 receptor activity(GO:0004911) interleukin-2 binding(GO:0019976) |
| 0.0 | 0.3 | GO:0038191 | neuropilin binding(GO:0038191) |
| 0.0 | 0.1 | GO:0004614 | phosphoglucomutase activity(GO:0004614) |
| 0.0 | 0.1 | GO:0003839 | gamma-glutamylcyclotransferase activity(GO:0003839) |
| 0.0 | 0.1 | GO:0005026 | transforming growth factor beta receptor activity, type II(GO:0005026) |
| 0.0 | 0.1 | GO:0008131 | primary amine oxidase activity(GO:0008131) |
| 0.0 | 0.1 | GO:0004791 | thioredoxin-disulfide reductase activity(GO:0004791) |
| 0.0 | 0.1 | GO:0032190 | acrosin binding(GO:0032190) |
| 0.0 | 0.0 | GO:0033149 | FFAT motif binding(GO:0033149) |
| 0.0 | 0.6 | GO:0046875 | ephrin receptor binding(GO:0046875) |
| 0.0 | 0.3 | GO:0005520 | insulin-like growth factor binding(GO:0005520) |
| 0.0 | 0.1 | GO:0030305 | heparanase activity(GO:0030305) |
| 0.0 | 0.1 | GO:0018636 | phenanthrene 9,10-monooxygenase activity(GO:0018636) ketosteroid monooxygenase activity(GO:0047086) |
| 0.0 | 0.2 | GO:0001758 | retinal dehydrogenase activity(GO:0001758) |
| 0.0 | 0.1 | GO:0004075 | biotin carboxylase activity(GO:0004075) |
| 0.0 | 0.1 | GO:0005119 | smoothened binding(GO:0005119) |
| 0.0 | 0.1 | GO:0008309 | double-stranded DNA exodeoxyribonuclease activity(GO:0008309) |
| 0.0 | 0.2 | GO:0047498 | calcium-dependent phospholipase A2 activity(GO:0047498) |
| 0.0 | 0.2 | GO:0019869 | chloride channel inhibitor activity(GO:0019869) |
| 0.0 | 0.1 | GO:0030144 | alpha-1,6-mannosylglycoprotein 6-beta-N-acetylglucosaminyltransferase activity(GO:0030144) |
| 0.0 | 0.1 | GO:0032810 | sterol response element binding(GO:0032810) |
| 0.0 | 0.0 | GO:0030171 | voltage-gated proton channel activity(GO:0030171) |
| 0.0 | 0.1 | GO:0004609 | phosphatidylserine decarboxylase activity(GO:0004609) |
| 0.0 | 0.4 | GO:0000978 | RNA polymerase II core promoter proximal region sequence-specific DNA binding(GO:0000978) |
| 0.0 | 0.1 | GO:0046979 | TAP2 binding(GO:0046979) |
| 0.0 | 0.1 | GO:0016657 | GMP reductase activity(GO:0003920) oxidoreductase activity, acting on NAD(P)H, nitrogenous group as acceptor(GO:0016657) |
| 0.0 | 0.2 | GO:0070679 | inositol 1,4,5 trisphosphate binding(GO:0070679) |
| 0.0 | 0.0 | GO:0001632 | leukotriene B4 receptor activity(GO:0001632) |
| 0.0 | 0.0 | GO:0004908 | interleukin-1 receptor activity(GO:0004908) |
| 0.0 | 0.2 | GO:0048273 | mitogen-activated protein kinase p38 binding(GO:0048273) |
| 0.0 | 0.1 | GO:0019828 | aspartic-type endopeptidase inhibitor activity(GO:0019828) |
| 0.0 | 0.1 | GO:0004906 | interferon-gamma receptor activity(GO:0004906) |
| 0.0 | 0.3 | GO:0005537 | mannose binding(GO:0005537) |
| 0.0 | 0.4 | GO:0042043 | neurexin family protein binding(GO:0042043) |
| 0.0 | 5.0 | GO:0004252 | serine-type endopeptidase activity(GO:0004252) |
| 0.0 | 0.0 | GO:0004603 | phenylethanolamine N-methyltransferase activity(GO:0004603) |
| 0.0 | 0.5 | GO:0005035 | tumor necrosis factor-activated receptor activity(GO:0005031) death receptor activity(GO:0005035) |
| 0.0 | 0.1 | GO:0022850 | serotonin-gated cation channel activity(GO:0022850) |
| 0.0 | 0.1 | GO:0047006 | 17-alpha,20-alpha-dihydroxypregn-4-en-3-one dehydrogenase activity(GO:0047006) |
| 0.0 | 0.1 | GO:0042500 | aspartic endopeptidase activity, intramembrane cleaving(GO:0042500) |
| 0.0 | 0.1 | GO:0048030 | disaccharide binding(GO:0048030) |
| 0.0 | 0.0 | GO:0005171 | hepatocyte growth factor receptor binding(GO:0005171) |
| 0.0 | 0.1 | GO:0043548 | phosphatidylinositol 3-kinase binding(GO:0043548) |
| 0.0 | 0.5 | GO:0008157 | protein phosphatase 1 binding(GO:0008157) |
| 0.0 | 0.4 | GO:0016709 | oxidoreductase activity, acting on paired donors, with incorporation or reduction of molecular oxygen, NAD(P)H as one donor, and incorporation of one atom of oxygen(GO:0016709) |
| 0.0 | 0.0 | GO:0070538 | oleic acid binding(GO:0070538) |
| 0.0 | 0.0 | GO:0034353 | RNA pyrophosphohydrolase activity(GO:0034353) |
| 0.0 | 0.0 | GO:0034988 | Fc-gamma receptor I complex binding(GO:0034988) |
| 0.0 | 0.5 | GO:0015002 | cytochrome-c oxidase activity(GO:0004129) heme-copper terminal oxidase activity(GO:0015002) oxidoreductase activity, acting on a heme group of donors, oxygen as acceptor(GO:0016676) |
| 0.0 | 0.1 | GO:0004013 | adenosylhomocysteinase activity(GO:0004013) trialkylsulfonium hydrolase activity(GO:0016802) |
| 0.0 | 0.2 | GO:0019871 | sodium channel inhibitor activity(GO:0019871) |
| 0.0 | 0.7 | GO:0008009 | chemokine activity(GO:0008009) |
| 0.0 | 0.5 | GO:0019706 | protein-cysteine S-palmitoyltransferase activity(GO:0019706) protein-cysteine S-acyltransferase activity(GO:0019707) |
| 0.0 | 0.1 | GO:0004461 | lactose synthase activity(GO:0004461) |
| 0.0 | 0.1 | GO:0004359 | glutaminase activity(GO:0004359) |
| 0.0 | 0.2 | GO:0004969 | histamine receptor activity(GO:0004969) |
| 0.0 | 0.1 | GO:0051185 | coenzyme transporter activity(GO:0051185) |
| 0.0 | 0.0 | GO:0047977 | hepoxilin-epoxide hydrolase activity(GO:0047977) |
| 0.0 | 0.1 | GO:0003923 | GPI-anchor transamidase activity(GO:0003923) |
| 0.0 | 0.7 | GO:0005154 | epidermal growth factor receptor binding(GO:0005154) |
| 0.0 | 0.1 | GO:0047499 | calcium-independent phospholipase A2 activity(GO:0047499) |
| 0.0 | 0.4 | GO:0004653 | polypeptide N-acetylgalactosaminyltransferase activity(GO:0004653) |
| 0.0 | 0.1 | GO:0033906 | hyaluronoglucuronidase activity(GO:0033906) |
| 0.0 | 0.1 | GO:0003875 | ADP-ribosylarginine hydrolase activity(GO:0003875) |
| 0.0 | 0.1 | GO:0000182 | rDNA binding(GO:0000182) |
| 0.0 | 0.1 | GO:0008112 | nicotinamide N-methyltransferase activity(GO:0008112) pyridine N-methyltransferase activity(GO:0030760) |
| 0.0 | 0.1 | GO:0051019 | mitogen-activated protein kinase binding(GO:0051019) |
| 0.0 | 0.0 | GO:0004392 | heme oxygenase (decyclizing) activity(GO:0004392) |
| 0.0 | 0.0 | GO:0044378 | non-sequence-specific DNA binding, bending(GO:0044378) |
| 0.0 | 0.1 | GO:0017162 | aryl hydrocarbon receptor binding(GO:0017162) |
| 0.0 | 0.0 | GO:0004852 | uroporphyrinogen-III synthase activity(GO:0004852) |
| 0.0 | 0.3 | GO:0016881 | acid-amino acid ligase activity(GO:0016881) |
| 0.0 | 0.1 | GO:1990459 | transferrin receptor binding(GO:1990459) |
| 0.0 | 0.1 | GO:0008526 | phosphatidylinositol transporter activity(GO:0008526) |
| 0.0 | 0.1 | GO:0031386 | protein tag(GO:0031386) |
| 0.0 | 0.1 | GO:0086083 | cell adhesive protein binding involved in bundle of His cell-Purkinje myocyte communication(GO:0086083) |
| 0.0 | 0.1 | GO:0000702 | oxidized base lesion DNA N-glycosylase activity(GO:0000702) |
| 0.0 | 0.1 | GO:0001025 | RNA polymerase III transcription factor binding(GO:0001025) |
| 0.0 | 0.1 | GO:0004980 | melanocyte-stimulating hormone receptor activity(GO:0004980) |
| 0.0 | 0.2 | GO:0030881 | beta-2-microglobulin binding(GO:0030881) |
| 0.0 | 1.1 | GO:0004984 | olfactory receptor activity(GO:0004984) |
| 0.0 | 0.1 | GO:0005353 | fructose transmembrane transporter activity(GO:0005353) |
| 0.0 | 0.1 | GO:0030296 | protein tyrosine kinase activator activity(GO:0030296) |
| 0.0 | 0.0 | GO:0070878 | primary miRNA binding(GO:0070878) |
| 0.0 | 0.1 | GO:0015272 | ATP-activated inward rectifier potassium channel activity(GO:0015272) |
| 0.0 | 0.0 | GO:0016628 | oxidoreductase activity, acting on the CH-CH group of donors, NAD or NADP as acceptor(GO:0016628) |
| 0.0 | 0.1 | GO:0047134 | protein-disulfide reductase activity(GO:0047134) |
| 0.0 | 1.4 | GO:0005201 | extracellular matrix structural constituent(GO:0005201) |
| 0.0 | 0.3 | GO:0019956 | chemokine binding(GO:0019956) |
| 0.0 | 0.3 | GO:0042813 | Wnt-activated receptor activity(GO:0042813) |
| 0.0 | 0.1 | GO:0004758 | serine C-palmitoyltransferase activity(GO:0004758) C-palmitoyltransferase activity(GO:0016454) |
| 0.0 | 0.1 | GO:0033188 | sphingomyelin synthase activity(GO:0033188) ceramide cholinephosphotransferase activity(GO:0047493) |
| 0.0 | 0.1 | GO:0050692 | DBD domain binding(GO:0050692) |
| 0.0 | 0.1 | GO:0004994 | somatostatin receptor activity(GO:0004994) |
| 0.0 | 0.0 | GO:0032036 | myosin heavy chain binding(GO:0032036) |
| 0.0 | 0.1 | GO:0016833 | oxo-acid-lyase activity(GO:0016833) |
| 0.0 | 0.5 | GO:0003785 | actin monomer binding(GO:0003785) |
| 0.0 | 0.1 | GO:0004096 | catalase activity(GO:0004096) |
| 0.0 | 0.2 | GO:0004859 | phospholipase inhibitor activity(GO:0004859) |
| 0.0 | 0.0 | GO:0086006 | voltage-gated sodium channel activity involved in cardiac muscle cell action potential(GO:0086006) |
| 0.0 | 0.1 | GO:0004784 | superoxide dismutase activity(GO:0004784) oxidoreductase activity, acting on superoxide radicals as acceptor(GO:0016721) |
| 0.0 | 0.1 | GO:0004668 | protein-arginine deiminase activity(GO:0004668) |
| 0.0 | 0.0 | GO:0017128 | phospholipid scramblase activity(GO:0017128) |
| 0.0 | 0.0 | GO:0015184 | L-cystine transmembrane transporter activity(GO:0015184) |
| 0.0 | 0.1 | GO:0015271 | outward rectifier potassium channel activity(GO:0015271) |
| 0.0 | 0.0 | GO:0030368 | interleukin-17 receptor activity(GO:0030368) |
| 0.0 | 0.4 | GO:0042056 | chemoattractant activity(GO:0042056) |
| 0.0 | 0.0 | GO:0008426 | protein kinase C inhibitor activity(GO:0008426) |
| 0.0 | 0.3 | GO:0070742 | C2H2 zinc finger domain binding(GO:0070742) |
| 0.0 | 0.0 | GO:0038181 | bile acid receptor activity(GO:0038181) |
| 0.0 | 0.1 | GO:0016413 | O-acetyltransferase activity(GO:0016413) |
| 0.0 | 0.0 | GO:0003846 | 2-acylglycerol O-acyltransferase activity(GO:0003846) |
| 0.0 | 0.1 | GO:0070569 | uridylyltransferase activity(GO:0070569) |
| 0.0 | 0.0 | GO:0004982 | N-formyl peptide receptor activity(GO:0004982) |
| 0.0 | 0.2 | GO:0035259 | glucocorticoid receptor binding(GO:0035259) |
| 0.0 | 0.1 | GO:0061133 | endopeptidase activator activity(GO:0061133) |
| 0.0 | 0.0 | GO:0061663 | NEDD8 ligase activity(GO:0061663) |
| 0.0 | 0.0 | GO:0004965 | G-protein coupled GABA receptor activity(GO:0004965) |
| 0.0 | 0.1 | GO:0005025 | transforming growth factor beta receptor activity, type I(GO:0005025) |
| 0.0 | 0.7 | GO:0003954 | NADH dehydrogenase activity(GO:0003954) |
| 0.0 | 0.1 | GO:0004468 | lysine N-acetyltransferase activity, acting on acetyl phosphate as donor(GO:0004468) |
| 0.0 | 0.1 | GO:0070026 | nitric oxide binding(GO:0070026) |
| 0.0 | 0.2 | GO:0045028 | G-protein coupled nucleotide receptor activity(GO:0001608) G-protein coupled purinergic nucleotide receptor activity(GO:0045028) |
| 0.0 | 0.2 | GO:1904264 | ubiquitin protein ligase activity involved in ERAD pathway(GO:1904264) |
| 0.0 | 0.1 | GO:0002114 | interleukin-33 receptor activity(GO:0002114) |
| 0.0 | 0.1 | GO:0098632 | protein binding involved in cell-cell adhesion(GO:0098632) |
| 0.0 | 0.5 | GO:0005164 | tumor necrosis factor receptor binding(GO:0005164) |
Gene overrepresentation in C2:CP category:
| Log-likelihood per target | Total log-likelihood | Term | Description |
|---|---|---|---|
| 0.0 | 0.8 | PID TCR RAS PATHWAY | Ras signaling in the CD4+ TCR pathway |
| 0.0 | 1.2 | PID ANTHRAX PATHWAY | Cellular roles of Anthrax toxin |
| 0.0 | 0.8 | PID INTEGRIN4 PATHWAY | Alpha6 beta4 integrin-ligand interactions |
| 0.0 | 1.6 | PID TAP63 PATHWAY | Validated transcriptional targets of TAp63 isoforms |
| 0.0 | 2.3 | PID DELTA NP63 PATHWAY | Validated transcriptional targets of deltaNp63 isoforms |
| 0.0 | 0.3 | PID P38 ALPHA BETA DOWNSTREAM PATHWAY | Signaling mediated by p38-alpha and p38-beta |
| 0.0 | 0.4 | ST STAT3 PATHWAY | STAT3 Pathway |
| 0.0 | 1.1 | PID NEPHRIN NEPH1 PATHWAY | Nephrin/Neph1 signaling in the kidney podocyte |
| 0.0 | 1.2 | SIG REGULATION OF THE ACTIN CYTOSKELETON BY RHO GTPASES | Genes related to regulation of the actin cytoskeleton |
| 0.0 | 0.1 | SA G2 AND M PHASES | Cdc25 activates the cdc2/cyclin B complex to induce the G2/M transition. |
| 0.0 | 0.8 | PID P38 MK2 PATHWAY | p38 signaling mediated by MAPKAP kinases |
| 0.0 | 0.3 | PID HEDGEHOG 2PATHWAY | Signaling events mediated by the Hedgehog family |
| 0.0 | 0.7 | PID ALPHA SYNUCLEIN PATHWAY | Alpha-synuclein signaling |
| 0.0 | 1.4 | PID NOTCH PATHWAY | Notch signaling pathway |
| 0.0 | 0.0 | ST INTERFERON GAMMA PATHWAY | Interferon gamma pathway. |
| 0.0 | 0.7 | PID EPHA FWDPATHWAY | EPHA forward signaling |
| 0.0 | 0.2 | ST PAC1 RECEPTOR PATHWAY | PAC1 Receptor Pathway |
| 0.0 | 0.4 | PID CONE PATHWAY | Visual signal transduction: Cones |
| 0.0 | 0.7 | NABA BASEMENT MEMBRANES | Genes encoding structural components of basement membranes |
| 0.0 | 0.1 | PID IL2 STAT5 PATHWAY | IL2 signaling events mediated by STAT5 |
| 0.0 | 0.8 | PID INTEGRIN1 PATHWAY | Beta1 integrin cell surface interactions |
| 0.0 | 0.4 | PID A6B1 A6B4 INTEGRIN PATHWAY | a6b1 and a6b4 Integrin signaling |
| 0.0 | 0.2 | PID ALK2 PATHWAY | ALK2 signaling events |
| 0.0 | 0.2 | PID GLYPICAN 1PATHWAY | Glypican 1 network |
| 0.0 | 0.4 | PID RXR VDR PATHWAY | RXR and RAR heterodimerization with other nuclear receptor |
| 0.0 | 0.3 | ST GA12 PATHWAY | G alpha 12 Pathway |
| 0.0 | 0.8 | PID NFAT TFPATHWAY | Calcineurin-regulated NFAT-dependent transcription in lymphocytes |
| 0.0 | 0.1 | PID NFKAPPAB ATYPICAL PATHWAY | Atypical NF-kappaB pathway |
| 0.0 | 0.2 | PID EPHRINB REV PATHWAY | Ephrin B reverse signaling |
| 0.0 | 0.2 | PID NECTIN PATHWAY | Nectin adhesion pathway |
| 0.0 | 0.7 | PID MTOR 4PATHWAY | mTOR signaling pathway |
| 0.0 | 4.3 | NABA SECRETED FACTORS | Genes encoding secreted soluble factors |
| 0.0 | 0.3 | PID ANGIOPOIETIN RECEPTOR PATHWAY | Angiopoietin receptor Tie2-mediated signaling |
| 0.0 | 0.0 | PID IL3 PATHWAY | IL3-mediated signaling events |
Gene overrepresentation in C2:CP:REACTOME category:
| Log-likelihood per target | Total log-likelihood | Term | Description |
|---|---|---|---|
| 0.1 | 1.8 | REACTOME TRANSPORT OF ORGANIC ANIONS | Genes involved in Transport of organic anions |
| 0.1 | 1.8 | REACTOME ACTIVATION OF RAC | Genes involved in Activation of Rac |
| 0.1 | 0.1 | REACTOME REGULATION OF GLUCOKINASE BY GLUCOKINASE REGULATORY PROTEIN | Genes involved in Regulation of Glucokinase by Glucokinase Regulatory Protein |
| 0.1 | 1.3 | REACTOME ACTIVATION OF THE AP1 FAMILY OF TRANSCRIPTION FACTORS | Genes involved in Activation of the AP-1 family of transcription factors |
| 0.1 | 1.0 | REACTOME TANDEM PORE DOMAIN POTASSIUM CHANNELS | Genes involved in Tandem pore domain potassium channels |
| 0.0 | 1.0 | REACTOME GAP JUNCTION ASSEMBLY | Genes involved in Gap junction assembly |
| 0.0 | 0.1 | REACTOME SIGNALING BY THE B CELL RECEPTOR BCR | Genes involved in Signaling by the B Cell Receptor (BCR) |
| 0.0 | 0.8 | REACTOME NOREPINEPHRINE NEUROTRANSMITTER RELEASE CYCLE | Genes involved in Norepinephrine Neurotransmitter Release Cycle |
| 0.0 | 1.1 | REACTOME TGF BETA RECEPTOR SIGNALING IN EMT EPITHELIAL TO MESENCHYMAL TRANSITION | Genes involved in TGF-beta receptor signaling in EMT (epithelial to mesenchymal transition) |
| 0.0 | 0.6 | REACTOME GLYCOPROTEIN HORMONES | Genes involved in Glycoprotein hormones |
| 0.0 | 0.3 | REACTOME GABA SYNTHESIS RELEASE REUPTAKE AND DEGRADATION | Genes involved in GABA synthesis, release, reuptake and degradation |
| 0.0 | 0.7 | REACTOME HDL MEDIATED LIPID TRANSPORT | Genes involved in HDL-mediated lipid transport |
| 0.0 | 0.5 | REACTOME XENOBIOTICS | Genes involved in Xenobiotics |
| 0.0 | 1.4 | REACTOME MYOGENESIS | Genes involved in Myogenesis |
| 0.0 | 0.6 | REACTOME FACILITATIVE NA INDEPENDENT GLUCOSE TRANSPORTERS | Genes involved in Facilitative Na+-independent glucose transporters |
| 0.0 | 0.7 | REACTOME OTHER SEMAPHORIN INTERACTIONS | Genes involved in Other semaphorin interactions |
| 0.0 | 0.5 | REACTOME THE NLRP3 INFLAMMASOME | Genes involved in The NLRP3 inflammasome |
| 0.0 | 2.8 | REACTOME INTERFERON GAMMA SIGNALING | Genes involved in Interferon gamma signaling |
| 0.0 | 1.2 | REACTOME GLUTATHIONE CONJUGATION | Genes involved in Glutathione conjugation |
| 0.0 | 0.7 | REACTOME GROWTH HORMONE RECEPTOR SIGNALING | Genes involved in Growth hormone receptor signaling |
| 0.0 | 0.1 | REACTOME PKB MEDIATED EVENTS | Genes involved in PKB-mediated events |
| 0.0 | 1.8 | REACTOME PHASE1 FUNCTIONALIZATION OF COMPOUNDS | Genes involved in Phase 1 - Functionalization of compounds |
| 0.0 | 0.9 | REACTOME AMINE COMPOUND SLC TRANSPORTERS | Genes involved in Amine compound SLC transporters |
| 0.0 | 0.5 | REACTOME PROTEOLYTIC CLEAVAGE OF SNARE COMPLEX PROTEINS | Genes involved in Proteolytic cleavage of SNARE complex proteins |
| 0.0 | 0.8 | REACTOME METAL ION SLC TRANSPORTERS | Genes involved in Metal ion SLC transporters |
| 0.0 | 0.4 | REACTOME THE ACTIVATION OF ARYLSULFATASES | Genes involved in The activation of arylsulfatases |
| 0.0 | 0.3 | REACTOME REVERSIBLE HYDRATION OF CARBON DIOXIDE | Genes involved in Reversible Hydration of Carbon Dioxide |
| 0.0 | 0.5 | REACTOME ADVANCED GLYCOSYLATION ENDPRODUCT RECEPTOR SIGNALING | Genes involved in Advanced glycosylation endproduct receptor signaling |
| 0.0 | 0.1 | REACTOME PLATELET ADHESION TO EXPOSED COLLAGEN | Genes involved in Platelet Adhesion to exposed collagen |
| 0.0 | 0.6 | REACTOME SIGNALING BY ROBO RECEPTOR | Genes involved in Signaling by Robo receptor |
| 0.0 | 0.4 | REACTOME STEROID HORMONES | Genes involved in Steroid hormones |
| 0.0 | 0.8 | REACTOME SIGNALING BY BMP | Genes involved in Signaling by BMP |
| 0.0 | 0.7 | REACTOME KERATAN SULFATE BIOSYNTHESIS | Genes involved in Keratan sulfate biosynthesis |
| 0.0 | 0.3 | REACTOME COMMON PATHWAY | Genes involved in Common Pathway |
| 0.0 | 0.1 | REACTOME SIGNALING BY WNT | Genes involved in Signaling by Wnt |
| 0.0 | 1.0 | REACTOME COLLAGEN FORMATION | Genes involved in Collagen formation |
| 0.0 | 0.2 | REACTOME ROLE OF SECOND MESSENGERS IN NETRIN1 SIGNALING | Genes involved in Role of second messengers in netrin-1 signaling |
| 0.0 | 0.1 | REACTOME ACTIVATION OF NF KAPPAB IN B CELLS | Genes involved in Activation of NF-kappaB in B Cells |
| 0.0 | 0.1 | REACTOME P75NTR SIGNALS VIA NFKB | Genes involved in p75NTR signals via NF-kB |
| 0.0 | 0.0 | REACTOME NEF MEDIATES DOWN MODULATION OF CELL SURFACE RECEPTORS BY RECRUITING THEM TO CLATHRIN ADAPTERS | Genes involved in Nef-mediates down modulation of cell surface receptors by recruiting them to clathrin adapters |
| 0.0 | 0.3 | REACTOME P2Y RECEPTORS | Genes involved in P2Y receptors |
| 0.0 | 0.7 | REACTOME ABC FAMILY PROTEINS MEDIATED TRANSPORT | Genes involved in ABC-family proteins mediated transport |
| 0.0 | 0.2 | REACTOME NEF MEDIATED DOWNREGULATION OF MHC CLASS I COMPLEX CELL SURFACE EXPRESSION | Genes involved in Nef mediated downregulation of MHC class I complex cell surface expression |
| 0.0 | 0.2 | REACTOME GLUTAMATE NEUROTRANSMITTER RELEASE CYCLE | Genes involved in Glutamate Neurotransmitter Release Cycle |
| 0.0 | 0.1 | REACTOME RIG I MDA5 MEDIATED INDUCTION OF IFN ALPHA BETA PATHWAYS | Genes involved in RIG-I/MDA5 mediated induction of IFN-alpha/beta pathways |
| 0.0 | 0.3 | REACTOME INITIAL TRIGGERING OF COMPLEMENT | Genes involved in Initial triggering of complement |
| 0.0 | 0.1 | REACTOME G BETA GAMMA SIGNALLING THROUGH PLC BETA | Genes involved in G beta:gamma signalling through PLC beta |
| 0.0 | 0.4 | REACTOME GABA A RECEPTOR ACTIVATION | Genes involved in GABA A receptor activation |
| 0.0 | 1.1 | REACTOME AMYLOIDS | Genes involved in Amyloids |
| 0.0 | 1.1 | REACTOME RESPIRATORY ELECTRON TRANSPORT | Genes involved in Respiratory electron transport |
| 0.0 | 0.5 | REACTOME LATENT INFECTION OF HOMO SAPIENS WITH MYCOBACTERIUM TUBERCULOSIS | Genes involved in Latent infection of Homo sapiens with Mycobacterium tuberculosis |
| 0.0 | 0.1 | REACTOME NOD1 2 SIGNALING PATHWAY | Genes involved in NOD1/2 Signaling Pathway |
| 0.0 | 0.4 | REACTOME EXTRINSIC PATHWAY FOR APOPTOSIS | Genes involved in Extrinsic Pathway for Apoptosis |
| 0.0 | 0.2 | REACTOME PURINE CATABOLISM | Genes involved in Purine catabolism |
| 0.0 | 0.5 | REACTOME TIGHT JUNCTION INTERACTIONS | Genes involved in Tight junction interactions |
| 0.0 | 0.2 | REACTOME INTRINSIC PATHWAY | Genes involved in Intrinsic Pathway |
| 0.0 | 0.2 | REACTOME APOPTOTIC CLEAVAGE OF CELL ADHESION PROTEINS | Genes involved in Apoptotic cleavage of cell adhesion proteins |
| 0.0 | 0.2 | REACTOME DOWNREGULATION OF ERBB2 ERBB3 SIGNALING | Genes involved in Downregulation of ERBB2:ERBB3 signaling |
| 0.0 | 0.2 | REACTOME ORGANIC CATION ANION ZWITTERION TRANSPORT | Genes involved in Organic cation/anion/zwitterion transport |
| 0.0 | 0.3 | REACTOME TRANSPORT OF VITAMINS NUCLEOSIDES AND RELATED MOLECULES | Genes involved in Transport of vitamins, nucleosides, and related molecules |