Project
Epithelial-Mesenchymal Transition, human (Scheel, 2011)
Navigation
Downloads
Results for NRF1
Z-value: 3.79
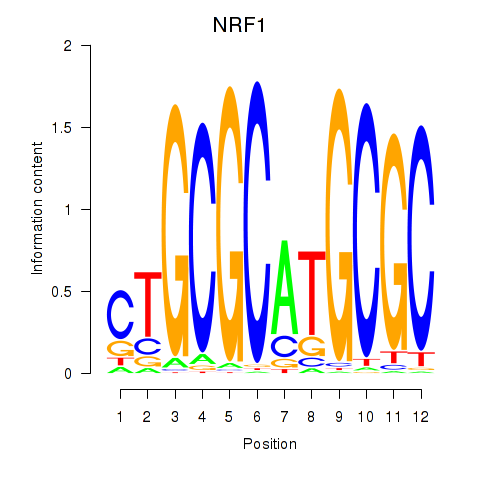
Motif logo
Transcription factors associated with NRF1
| Gene Symbol | Gene ID | Gene Info |
|---|---|---|
|
NRF1
|
ENSG00000106459.10 | NRF1 |
Activity-expression correlation:
| Gene | Promoter | Pearson corr. coef. | P-value | Plot |
|---|---|---|---|---|
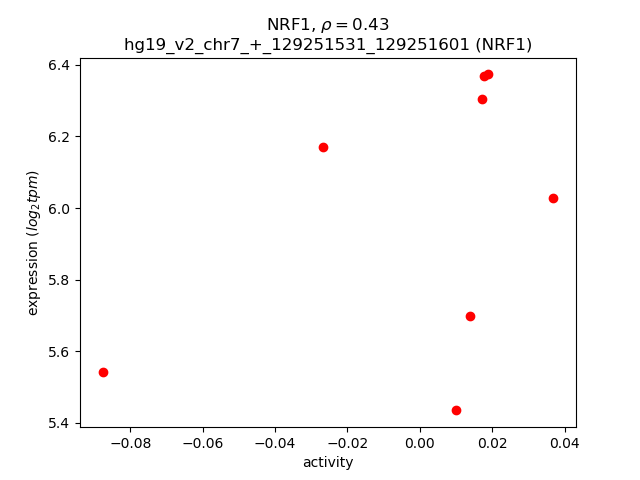
| NRF1 | hg19_v2_chr7_+_129251531_129251601 | 0.43 | 2.9e-01 | Click! |
Activity profile of NRF1 motif
Sorted Z-values of NRF1 motif
Network of associatons between targets according to the STRING database.

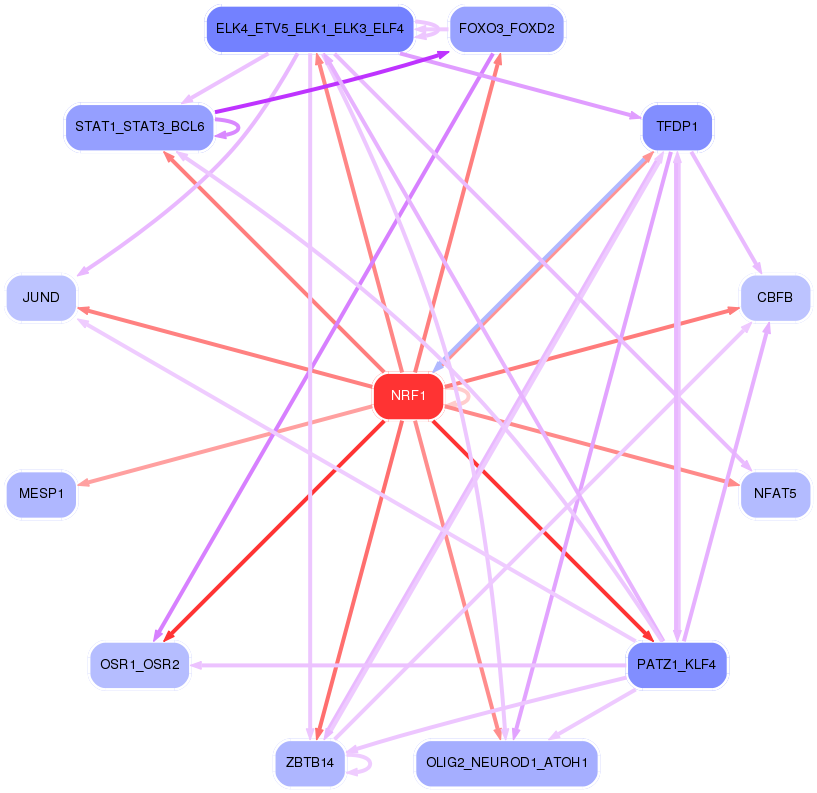
First level regulatory network of NRF1
| Promoter | Score | Transcript | Gene | Gene Info |
|---|---|---|---|---|
| chr1_+_183605200 | 5.59 |
ENST00000304685.4 |
RGL1 |
ral guanine nucleotide dissociation stimulator-like 1 |
| chr3_+_49449636 | 4.40 |
ENST00000273590.3 |
TCTA |
T-cell leukemia translocation altered |
| chr12_-_124457371 | 4.24 |
ENST00000238156.3 ENST00000545037.1 |
CCDC92 |
coiled-coil domain containing 92 |
| chr20_-_34042558 | 3.89 |
ENST00000374372.1 |
GDF5 |
growth differentiation factor 5 |
| chr12_-_124457257 | 3.65 |
ENST00000545891.1 |
CCDC92 |
coiled-coil domain containing 92 |
| chr7_+_149571045 | 3.55 |
ENST00000479613.1 ENST00000606024.1 ENST00000464662.1 ENST00000425642.2 |
ATP6V0E2 |
ATPase, H+ transporting V0 subunit e2 |
| chrX_+_54835493 | 2.97 |
ENST00000396224.1 |
MAGED2 |
melanoma antigen family D, 2 |
| chr20_-_35580104 | 2.62 |
ENST00000373694.5 |
SAMHD1 |
SAM domain and HD domain 1 |
| chr22_+_24666763 | 2.60 |
ENST00000437398.1 ENST00000421374.1 ENST00000314328.9 ENST00000541492.1 |
SPECC1L |
sperm antigen with calponin homology and coiled-coil domains 1-like |
| chr17_+_260097 | 2.53 |
ENST00000360127.6 ENST00000571106.1 ENST00000491373.1 |
C17orf97 |
chromosome 17 open reading frame 97 |
| chr19_-_44123734 | 2.51 |
ENST00000598676.1 |
ZNF428 |
zinc finger protein 428 |
| chr19_-_44124019 | 2.42 |
ENST00000300811.3 |
ZNF428 |
zinc finger protein 428 |
| chr4_-_39640513 | 2.41 |
ENST00000511809.1 ENST00000505729.1 |
SMIM14 |
small integral membrane protein 14 |
| chr17_-_43045439 | 2.30 |
ENST00000253407.3 |
C1QL1 |
complement component 1, q subcomponent-like 1 |
| chr13_-_49107303 | 2.28 |
ENST00000344532.3 |
RCBTB2 |
regulator of chromosome condensation (RCC1) and BTB (POZ) domain containing protein 2 |
| chr8_+_97506033 | 2.14 |
ENST00000518385.1 |
SDC2 |
syndecan 2 |
| chr20_-_35580240 | 2.10 |
ENST00000262878.4 |
SAMHD1 |
SAM domain and HD domain 1 |
| chr9_+_17134980 | 2.07 |
ENST00000380647.3 |
CNTLN |
centlein, centrosomal protein |
| chr4_-_39640700 | 2.00 |
ENST00000295958.5 |
SMIM14 |
small integral membrane protein 14 |
| chr5_-_178054014 | 1.93 |
ENST00000520957.1 |
CLK4 |
CDC-like kinase 4 |
| chr6_+_31620191 | 1.88 |
ENST00000375918.2 ENST00000375920.4 |
APOM |
apolipoprotein M |
| chr2_-_19558373 | 1.86 |
ENST00000272223.2 |
OSR1 |
odd-skipped related transciption factor 1 |
| chr22_-_31741757 | 1.84 |
ENST00000215919.3 |
PATZ1 |
POZ (BTB) and AT hook containing zinc finger 1 |
| chrX_+_51927919 | 1.82 |
ENST00000416960.1 |
MAGED4 |
melanoma antigen family D, 4 |
| chr4_-_7044657 | 1.80 |
ENST00000310085.4 |
CCDC96 |
coiled-coil domain containing 96 |
| chr2_-_127864577 | 1.79 |
ENST00000376113.2 |
BIN1 |
bridging integrator 1 |
| chr19_+_14544099 | 1.77 |
ENST00000242783.6 ENST00000586557.1 ENST00000590097.1 |
PKN1 |
protein kinase N1 |
| chr5_+_148521381 | 1.77 |
ENST00000504238.1 |
ABLIM3 |
actin binding LIM protein family, member 3 |
| chr10_-_50747064 | 1.75 |
ENST00000355832.5 ENST00000603152.1 ENST00000447839.2 |
ERCC6 PGBD3 ERCC6-PGBD3 |
excision repair cross-complementing rodent repair deficiency, complementation group 6 piggyBac transposable element derived 3 ERCC6-PGBD3 readthrough |
| chr2_+_37311588 | 1.69 |
ENST00000409774.1 ENST00000608836.1 |
GPATCH11 |
G patch domain containing 11 |
| chr12_-_58131931 | 1.68 |
ENST00000547588.1 |
AGAP2 |
ArfGAP with GTPase domain, ankyrin repeat and PH domain 2 |
| chrX_-_51812268 | 1.68 |
ENST00000486010.1 ENST00000497164.1 ENST00000360134.6 ENST00000485287.1 ENST00000335504.5 ENST00000431659.1 |
MAGED4B |
melanoma antigen family D, 4B |
| chr2_-_230135937 | 1.65 |
ENST00000392054.3 ENST00000409462.1 ENST00000392055.3 |
PID1 |
phosphotyrosine interaction domain containing 1 |
| chr22_-_31742218 | 1.65 |
ENST00000266269.5 ENST00000405309.3 ENST00000351933.4 |
PATZ1 |
POZ (BTB) and AT hook containing zinc finger 1 |
| chr9_-_20622478 | 1.65 |
ENST00000355930.6 ENST00000380338.4 |
MLLT3 |
myeloid/lymphoid or mixed-lineage leukemia (trithorax homolog, Drosophila); translocated to, 3 |
| chr21_+_45553535 | 1.64 |
ENST00000348499.5 ENST00000389690.3 ENST00000449622.1 |
C21orf33 |
chromosome 21 open reading frame 33 |
| chr13_-_44361025 | 1.64 |
ENST00000261488.6 |
ENOX1 |
ecto-NOX disulfide-thiol exchanger 1 |
| chr1_+_197170592 | 1.63 |
ENST00000535699.1 |
CRB1 |
crumbs homolog 1 (Drosophila) |
| chr5_-_159827033 | 1.62 |
ENST00000523213.1 |
C5orf54 |
chromosome 5 open reading frame 54 |
| chr5_-_159827073 | 1.56 |
ENST00000408953.3 |
C5orf54 |
chromosome 5 open reading frame 54 |
| chr3_-_49449521 | 1.54 |
ENST00000431929.1 ENST00000418115.1 |
RHOA |
ras homolog family member A |
| chr9_+_91003271 | 1.53 |
ENST00000375859.3 ENST00000541629.1 |
SPIN1 |
spindlin 1 |
| chr20_-_35402123 | 1.53 |
ENST00000373740.3 ENST00000426836.1 ENST00000373745.3 ENST00000448110.2 ENST00000438549.1 ENST00000447406.1 ENST00000373750.4 ENST00000373734.4 |
DSN1 |
DSN1, MIS12 kinetochore complex component |
| chr21_+_45553484 | 1.52 |
ENST00000291577.6 ENST00000427803.2 |
C21orf33 |
chromosome 21 open reading frame 33 |
| chr16_+_15528332 | 1.51 |
ENST00000566490.1 |
C16orf45 |
chromosome 16 open reading frame 45 |
| chr6_+_43543864 | 1.51 |
ENST00000372236.4 ENST00000535400.1 |
POLH |
polymerase (DNA directed), eta |
| chrX_-_150067173 | 1.51 |
ENST00000370377.3 ENST00000320893.6 |
CD99L2 |
CD99 molecule-like 2 |
| chr2_+_37311645 | 1.51 |
ENST00000281932.5 |
GPATCH11 |
G patch domain containing 11 |
| chr19_-_40791211 | 1.51 |
ENST00000579047.1 |
AKT2 |
v-akt murine thymoma viral oncogene homolog 2 |
| chr6_-_57087042 | 1.50 |
ENST00000317483.3 |
RAB23 |
RAB23, member RAS oncogene family |
| chr2_+_71295733 | 1.50 |
ENST00000443938.2 ENST00000244204.6 |
NAGK |
N-acetylglucosamine kinase |
| chr8_+_16884740 | 1.49 |
ENST00000318063.5 |
MICU3 |
mitochondrial calcium uptake family, member 3 |
| chr15_+_63340553 | 1.49 |
ENST00000334895.5 |
TPM1 |
tropomyosin 1 (alpha) |
| chr1_-_16939976 | 1.47 |
ENST00000430580.2 |
NBPF1 |
neuroblastoma breakpoint family, member 1 |
| chr18_-_54305658 | 1.46 |
ENST00000586262.1 ENST00000217515.6 |
TXNL1 |
thioredoxin-like 1 |
| chrX_-_150067272 | 1.43 |
ENST00000355149.3 ENST00000437787.2 |
CD99L2 |
CD99 molecule-like 2 |
| chr19_+_56159362 | 1.42 |
ENST00000593069.1 ENST00000308964.3 |
CCDC106 |
coiled-coil domain containing 106 |
| chr5_+_134181625 | 1.42 |
ENST00000394976.3 |
C5orf24 |
chromosome 5 open reading frame 24 |
| chr3_-_48594248 | 1.42 |
ENST00000545984.1 ENST00000232375.3 ENST00000416568.1 ENST00000383734.2 ENST00000541519.1 ENST00000412035.1 |
PFKFB4 |
6-phosphofructo-2-kinase/fructose-2,6-biphosphatase 4 |
| chr21_+_38445539 | 1.40 |
ENST00000418766.1 ENST00000450533.1 ENST00000438055.1 ENST00000355666.1 ENST00000540756.1 ENST00000399010.1 |
TTC3 |
tetratricopeptide repeat domain 3 |
| chr16_-_2390704 | 1.39 |
ENST00000301732.5 ENST00000382381.3 |
ABCA3 |
ATP-binding cassette, sub-family A (ABC1), member 3 |
| chr3_-_49449350 | 1.38 |
ENST00000454011.2 ENST00000445425.1 ENST00000422781.1 |
RHOA |
ras homolog family member A |
| chr6_-_33679452 | 1.37 |
ENST00000374231.4 ENST00000607484.1 ENST00000374214.3 |
UQCC2 |
ubiquinol-cytochrome c reductase complex assembly factor 2 |
| chr20_-_30539773 | 1.37 |
ENST00000202017.4 |
PDRG1 |
p53 and DNA-damage regulated 1 |
| chrX_+_51928002 | 1.37 |
ENST00000375626.3 |
MAGED4 |
melanoma antigen family D, 4 |
| chr20_+_34043085 | 1.37 |
ENST00000397527.1 ENST00000342580.4 |
CEP250 |
centrosomal protein 250kDa |
| chr2_+_71295717 | 1.37 |
ENST00000418807.3 ENST00000443872.2 |
NAGK |
N-acetylglucosamine kinase |
| chr21_+_48055527 | 1.36 |
ENST00000397638.2 ENST00000458387.2 ENST00000451211.2 ENST00000291705.6 ENST00000397637.1 ENST00000334494.4 ENST00000397628.1 ENST00000440086.1 |
PRMT2 |
protein arginine methyltransferase 2 |
| chr19_-_46405861 | 1.36 |
ENST00000322217.5 |
MYPOP |
Myb-related transcription factor, partner of profilin |
| chr19_+_36359341 | 1.35 |
ENST00000221891.4 |
APLP1 |
amyloid beta (A4) precursor-like protein 1 |
| chr17_-_42277203 | 1.34 |
ENST00000587097.1 |
ATXN7L3 |
ataxin 7-like 3 |
| chr20_+_11871433 | 1.32 |
ENST00000399006.2 ENST00000405977.1 |
BTBD3 |
BTB (POZ) domain containing 3 |
| chr12_-_54070098 | 1.32 |
ENST00000394349.3 ENST00000549164.1 |
ATP5G2 |
ATP synthase, H+ transporting, mitochondrial Fo complex, subunit C2 (subunit 9) |
| chr9_+_134378289 | 1.31 |
ENST00000423007.1 ENST00000404875.2 ENST00000441334.1 ENST00000341012.7 ENST00000372228.3 ENST00000402686.3 ENST00000419118.2 ENST00000541219.1 ENST00000354713.4 ENST00000418774.1 ENST00000415075.1 ENST00000448212.1 ENST00000430619.1 |
POMT1 |
protein-O-mannosyltransferase 1 |
| chr19_+_56915668 | 1.31 |
ENST00000333201.9 ENST00000391778.3 |
ZNF583 |
zinc finger protein 583 |
| chr12_-_54069856 | 1.31 |
ENST00000602871.1 |
ATP5G2 |
ATP synthase, H+ transporting, mitochondrial Fo complex, subunit C2 (subunit 9) |
| chr19_+_56159509 | 1.30 |
ENST00000586790.1 ENST00000591578.1 ENST00000588740.1 |
CCDC106 |
coiled-coil domain containing 106 |
| chrX_+_51636629 | 1.30 |
ENST00000375722.1 ENST00000326587.7 ENST00000375695.2 |
MAGED1 |
melanoma antigen family D, 1 |
| chr15_+_63340775 | 1.30 |
ENST00000559281.1 ENST00000317516.7 |
TPM1 |
tropomyosin 1 (alpha) |
| chr3_-_178790057 | 1.29 |
ENST00000311417.2 |
ZMAT3 |
zinc finger, matrin-type 3 |
| chr7_-_150974494 | 1.29 |
ENST00000392811.2 |
SMARCD3 |
SWI/SNF related, matrix associated, actin dependent regulator of chromatin, subfamily d, member 3 |
| chr5_-_133561752 | 1.28 |
ENST00000519718.1 ENST00000481195.1 |
CTD-2410N18.5 PPP2CA |
S-phase kinase-associated protein 1 protein phosphatase 2, catalytic subunit, alpha isozyme |
| chr20_+_11871371 | 1.28 |
ENST00000254977.3 |
BTBD3 |
BTB (POZ) domain containing 3 |
| chr10_-_134145321 | 1.27 |
ENST00000368625.4 ENST00000368619.3 ENST00000456004.1 ENST00000368620.2 |
STK32C |
serine/threonine kinase 32C |
| chr9_-_100459639 | 1.26 |
ENST00000375128.4 |
XPA |
xeroderma pigmentosum, complementation group A |
| chr6_+_43543942 | 1.26 |
ENST00000372226.1 ENST00000443535.1 |
POLH |
polymerase (DNA directed), eta |
| chr6_-_153452356 | 1.25 |
ENST00000206262.1 |
RGS17 |
regulator of G-protein signaling 17 |
| chr20_+_39657454 | 1.24 |
ENST00000361337.2 |
TOP1 |
topoisomerase (DNA) I |
| chr2_+_56411131 | 1.24 |
ENST00000407595.2 |
CCDC85A |
coiled-coil domain containing 85A |
| chr9_+_4985016 | 1.24 |
ENST00000539801.1 |
JAK2 |
Janus kinase 2 |
| chr12_+_107349497 | 1.23 |
ENST00000548125.1 ENST00000280756.4 |
C12orf23 |
chromosome 12 open reading frame 23 |
| chr17_-_19281203 | 1.23 |
ENST00000487415.2 |
B9D1 |
B9 protein domain 1 |
| chr12_-_15942309 | 1.22 |
ENST00000544064.1 ENST00000543523.1 ENST00000536793.1 |
EPS8 |
epidermal growth factor receptor pathway substrate 8 |
| chr17_+_38599693 | 1.21 |
ENST00000542955.1 ENST00000269593.4 |
IGFBP4 |
insulin-like growth factor binding protein 4 |
| chr7_+_142985308 | 1.21 |
ENST00000310447.5 |
CASP2 |
caspase 2, apoptosis-related cysteine peptidase |
| chr1_-_47134101 | 1.20 |
ENST00000576409.1 |
ATPAF1 |
ATP synthase mitochondrial F1 complex assembly factor 1 |
| chr5_+_154238149 | 1.20 |
ENST00000519430.1 ENST00000520671.1 ENST00000521583.1 ENST00000518028.1 ENST00000519404.1 ENST00000519394.1 ENST00000518775.1 |
CNOT8 |
CCR4-NOT transcription complex, subunit 8 |
| chr5_-_178054105 | 1.20 |
ENST00000316308.4 |
CLK4 |
CDC-like kinase 4 |
| chr1_+_26146397 | 1.19 |
ENST00000374303.2 ENST00000533762.1 ENST00000529116.1 ENST00000474295.1 ENST00000488327.2 ENST00000472643.1 ENST00000526894.1 ENST00000524618.1 ENST00000374307.5 |
MTFR1L |
mitochondrial fission regulator 1-like |
| chr9_+_4985228 | 1.19 |
ENST00000381652.3 |
JAK2 |
Janus kinase 2 |
| chr3_-_178789993 | 1.18 |
ENST00000432729.1 |
ZMAT3 |
zinc finger, matrin-type 3 |
| chr12_-_15942503 | 1.17 |
ENST00000281172.5 |
EPS8 |
epidermal growth factor receptor pathway substrate 8 |
| chr11_+_133938955 | 1.17 |
ENST00000534549.1 ENST00000441717.3 |
JAM3 |
junctional adhesion molecule 3 |
| chr11_+_133938820 | 1.16 |
ENST00000299106.4 ENST00000529443.2 |
JAM3 |
junctional adhesion molecule 3 |
| chr17_+_40811283 | 1.16 |
ENST00000251412.7 |
TUBG2 |
tubulin, gamma 2 |
| chr15_+_41786065 | 1.16 |
ENST00000260386.5 |
ITPKA |
inositol-trisphosphate 3-kinase A |
| chr10_+_104180580 | 1.15 |
ENST00000425536.1 |
FBXL15 |
F-box and leucine-rich repeat protein 15 |
| chr2_+_238395803 | 1.14 |
ENST00000264605.3 |
MLPH |
melanophilin |
| chr6_+_30525051 | 1.14 |
ENST00000376557.3 |
PRR3 |
proline rich 3 |
| chr5_+_178450753 | 1.13 |
ENST00000444149.2 ENST00000519896.1 ENST00000522442.1 |
ZNF879 |
zinc finger protein 879 |
| chr5_-_139682658 | 1.13 |
ENST00000524074.1 ENST00000510217.1 ENST00000261813.4 |
PFDN1 |
prefoldin subunit 1 |
| chr4_-_175443943 | 1.13 |
ENST00000296522.6 |
HPGD |
hydroxyprostaglandin dehydrogenase 15-(NAD) |
| chr18_-_5296138 | 1.12 |
ENST00000400143.3 |
ZBTB14 |
zinc finger and BTB domain containing 14 |
| chr2_+_238395879 | 1.12 |
ENST00000445024.2 ENST00000338530.4 ENST00000409373.1 |
MLPH |
melanophilin |
| chr12_-_54673871 | 1.11 |
ENST00000209875.4 |
CBX5 |
chromobox homolog 5 |
| chr12_-_131323719 | 1.11 |
ENST00000392373.2 |
STX2 |
syntaxin 2 |
| chr1_+_26146674 | 1.11 |
ENST00000525713.1 ENST00000374301.3 |
MTFR1L |
mitochondrial fission regulator 1-like |
| chr1_-_47134085 | 1.11 |
ENST00000371937.4 ENST00000574428.1 ENST00000329231.4 |
ATPAF1 |
ATP synthase mitochondrial F1 complex assembly factor 1 |
| chr8_+_13424352 | 1.10 |
ENST00000297324.4 |
C8orf48 |
chromosome 8 open reading frame 48 |
| chr20_-_42839378 | 1.10 |
ENST00000255174.2 |
OSER1 |
oxidative stress responsive serine-rich 1 |
| chr7_-_102312048 | 1.09 |
ENST00000333432.6 ENST00000591000.1 ENST00000358438.5 |
POLR2J2 |
DNA-directed RNA polymerase II subunit RPB11-b1 |
| chr5_+_134181755 | 1.09 |
ENST00000504727.1 ENST00000435259.2 ENST00000508791.1 |
C5orf24 |
chromosome 5 open reading frame 24 |
| chr1_+_246887349 | 1.09 |
ENST00000366510.3 |
SCCPDH |
saccharopine dehydrogenase (putative) |
| chr14_+_74004051 | 1.09 |
ENST00000557556.1 |
ACOT1 |
acyl-CoA thioesterase 1 |
| chr11_+_62104897 | 1.08 |
ENST00000415229.2 ENST00000535727.1 ENST00000301776.5 |
ASRGL1 |
asparaginase like 1 |
| chr22_-_29075853 | 1.08 |
ENST00000397906.2 |
TTC28 |
tetratricopeptide repeat domain 28 |
| chr15_+_63340734 | 1.08 |
ENST00000560959.1 |
TPM1 |
tropomyosin 1 (alpha) |
| chr3_+_43732362 | 1.07 |
ENST00000458276.2 |
ABHD5 |
abhydrolase domain containing 5 |
| chr2_-_219433014 | 1.07 |
ENST00000418019.1 ENST00000454775.1 ENST00000338465.5 ENST00000415516.1 ENST00000258399.3 |
USP37 |
ubiquitin specific peptidase 37 |
| chr3_-_122134882 | 1.06 |
ENST00000330689.4 |
WDR5B |
WD repeat domain 5B |
| chr5_-_139944196 | 1.05 |
ENST00000357560.4 |
APBB3 |
amyloid beta (A4) precursor protein-binding, family B, member 3 |
| chr15_+_63340858 | 1.05 |
ENST00000560615.1 |
TPM1 |
tropomyosin 1 (alpha) |
| chr1_-_202858227 | 1.05 |
ENST00000367262.3 |
RABIF |
RAB interacting factor |
| chr3_+_10157276 | 1.04 |
ENST00000530758.1 ENST00000256463.6 |
BRK1 |
BRICK1, SCAR/WAVE actin-nucleating complex subunit |
| chr10_+_134145735 | 1.04 |
ENST00000368613.4 |
LRRC27 |
leucine rich repeat containing 27 |
| chr20_+_42839722 | 1.04 |
ENST00000442383.1 ENST00000435163.1 |
OSER1-AS1 |
OSER1 antisense RNA 1 (head to head) |
| chr3_-_178789220 | 1.03 |
ENST00000414084.1 |
ZMAT3 |
zinc finger, matrin-type 3 |
| chr12_+_124457746 | 1.03 |
ENST00000392404.3 ENST00000538932.2 ENST00000337815.4 ENST00000540762.2 |
ZNF664 FAM101A |
zinc finger protein 664 family with sequence similarity 101, member A |
| chrX_-_103087136 | 1.02 |
ENST00000243298.2 |
RAB9B |
RAB9B, member RAS oncogene family |
| chr11_+_8932715 | 1.02 |
ENST00000529876.1 ENST00000525005.1 ENST00000524577.1 ENST00000534506.1 |
AKIP1 |
A kinase (PRKA) interacting protein 1 |
| chr3_+_51976338 | 1.01 |
ENST00000417220.2 ENST00000431474.1 ENST00000398755.3 |
PARP3 |
poly (ADP-ribose) polymerase family, member 3 |
| chr7_-_156433195 | 1.01 |
ENST00000333319.6 |
C7orf13 |
chromosome 7 open reading frame 13 |
| chr20_+_42839600 | 1.01 |
ENST00000439943.1 ENST00000437730.1 |
OSER1-AS1 |
OSER1 antisense RNA 1 (head to head) |
| chr1_+_77997785 | 1.00 |
ENST00000478255.1 |
AK5 |
adenylate kinase 5 |
| chr10_-_16859361 | 1.00 |
ENST00000377921.3 |
RSU1 |
Ras suppressor protein 1 |
| chr10_+_104178946 | 1.00 |
ENST00000432590.1 |
FBXL15 |
F-box and leucine-rich repeat protein 15 |
| chr2_+_27498289 | 0.99 |
ENST00000296097.3 ENST00000420191.1 |
DNAJC5G |
DnaJ (Hsp40) homolog, subfamily C, member 5 gamma |
| chr4_-_1107306 | 0.99 |
ENST00000433731.2 ENST00000333673.5 ENST00000382968.5 |
RNF212 |
ring finger protein 212 |
| chr4_-_25161996 | 0.98 |
ENST00000513285.1 ENST00000382103.2 |
SEPSECS |
Sep (O-phosphoserine) tRNA:Sec (selenocysteine) tRNA synthase |
| chr13_-_20357110 | 0.98 |
ENST00000427943.1 |
PSPC1 |
paraspeckle component 1 |
| chr19_+_36630454 | 0.97 |
ENST00000246533.3 |
CAPNS1 |
calpain, small subunit 1 |
| chr14_+_74003818 | 0.97 |
ENST00000311148.4 |
ACOT1 |
acyl-CoA thioesterase 1 |
| chr16_+_67063262 | 0.97 |
ENST00000565389.1 |
CBFB |
core-binding factor, beta subunit |
| chr10_-_127511790 | 0.97 |
ENST00000368797.4 ENST00000420761.1 |
UROS |
uroporphyrinogen III synthase |
| chr10_-_16859442 | 0.97 |
ENST00000602389.1 ENST00000345264.5 |
RSU1 |
Ras suppressor protein 1 |
| chr5_-_139943830 | 0.95 |
ENST00000412920.3 ENST00000511201.2 ENST00000356738.2 ENST00000354402.5 ENST00000358580.5 ENST00000508496.2 |
APBB3 |
amyloid beta (A4) precursor protein-binding, family B, member 3 |
| chr19_+_36630855 | 0.95 |
ENST00000589146.1 |
CAPNS1 |
calpain, small subunit 1 |
| chr6_-_36515177 | 0.95 |
ENST00000229812.7 |
STK38 |
serine/threonine kinase 38 |
| chr2_-_191885686 | 0.95 |
ENST00000432058.1 |
STAT1 |
signal transducer and activator of transcription 1, 91kDa |
| chr19_-_19144243 | 0.95 |
ENST00000594445.1 ENST00000452918.2 ENST00000600377.1 ENST00000337018.6 |
SUGP2 |
SURP and G patch domain containing 2 |
| chr19_-_40023450 | 0.95 |
ENST00000326282.4 |
EID2B |
EP300 interacting inhibitor of differentiation 2B |
| chr12_-_48551366 | 0.95 |
ENST00000535988.1 ENST00000536953.1 ENST00000535055.1 ENST00000317697.3 ENST00000536549.1 |
ASB8 |
ankyrin repeat and SOCS box containing 8 |
| chr15_+_25200108 | 0.94 |
ENST00000577949.1 ENST00000338094.6 ENST00000338327.4 ENST00000579070.1 ENST00000577565.1 |
SNURF SNRPN |
SNRPN upstream reading frame protein small nuclear ribonucleoprotein polypeptide N |
| chr10_-_124639062 | 0.94 |
ENST00000368898.3 ENST00000368896.1 ENST00000545804.1 |
FAM24B CUZD1 |
family with sequence similarity 24, member B CUB and zona pellucida-like domains 1 |
| chr19_-_58609570 | 0.94 |
ENST00000600845.1 ENST00000240727.6 ENST00000600897.1 ENST00000421612.2 ENST00000601063.1 ENST00000601144.1 |
ZSCAN18 |
zinc finger and SCAN domain containing 18 |
| chr11_-_65625014 | 0.93 |
ENST00000534784.1 |
CFL1 |
cofilin 1 (non-muscle) |
| chr6_+_108881012 | 0.93 |
ENST00000343882.6 |
FOXO3 |
forkhead box O3 |
| chr10_-_88854518 | 0.93 |
ENST00000277865.4 |
GLUD1 |
glutamate dehydrogenase 1 |
| chr5_+_154238096 | 0.93 |
ENST00000517568.1 ENST00000524105.1 ENST00000285896.6 |
CNOT8 |
CCR4-NOT transcription complex, subunit 8 |
| chr2_+_27498331 | 0.92 |
ENST00000402462.1 ENST00000404433.1 ENST00000406962.1 |
DNAJC5G |
DnaJ (Hsp40) homolog, subfamily C, member 5 gamma |
| chr5_+_154238042 | 0.92 |
ENST00000519211.1 ENST00000522458.1 ENST00000519903.1 ENST00000521450.1 ENST00000403027.2 |
CNOT8 |
CCR4-NOT transcription complex, subunit 8 |
| chr2_-_145090035 | 0.92 |
ENST00000542155.1 ENST00000241391.5 ENST00000463875.2 |
GTDC1 |
glycosyltransferase-like domain containing 1 |
| chr22_-_20850070 | 0.91 |
ENST00000440659.2 ENST00000458248.1 ENST00000443285.1 ENST00000444967.1 ENST00000451553.1 ENST00000431430.1 |
KLHL22 |
kelch-like family member 22 |
| chr4_-_159592996 | 0.91 |
ENST00000508457.1 |
C4orf46 |
chromosome 4 open reading frame 46 |
| chr5_+_154237778 | 0.91 |
ENST00000523698.1 ENST00000517876.1 ENST00000520472.1 |
CNOT8 |
CCR4-NOT transcription complex, subunit 8 |
| chr19_-_18391708 | 0.91 |
ENST00000600972.1 |
JUND |
jun D proto-oncogene |
| chr2_-_33824382 | 0.91 |
ENST00000238823.8 |
FAM98A |
family with sequence similarity 98, member A |
| chr5_-_64920115 | 0.91 |
ENST00000381018.3 ENST00000274327.7 |
TRIM23 |
tripartite motif containing 23 |
| chr22_-_43485381 | 0.90 |
ENST00000331018.7 ENST00000266254.7 ENST00000445824.1 |
TTLL1 |
tubulin tyrosine ligase-like family, member 1 |
| chr15_+_49170281 | 0.90 |
ENST00000560490.1 |
EID1 |
EP300 interacting inhibitor of differentiation 1 |
| chr14_+_105781102 | 0.90 |
ENST00000547217.1 |
PACS2 |
phosphofurin acidic cluster sorting protein 2 |
| chr11_+_65029233 | 0.89 |
ENST00000265465.3 |
POLA2 |
polymerase (DNA directed), alpha 2, accessory subunit |
| chr12_-_120554534 | 0.89 |
ENST00000538903.1 ENST00000534951.1 |
RAB35 |
RAB35, member RAS oncogene family |
| chr17_+_64298944 | 0.88 |
ENST00000413366.3 |
PRKCA |
protein kinase C, alpha |
| chr19_-_58662139 | 0.88 |
ENST00000598312.1 |
ZNF329 |
zinc finger protein 329 |
| chr17_+_44668035 | 0.88 |
ENST00000398238.4 ENST00000225282.8 |
NSF |
N-ethylmaleimide-sensitive factor |
| chr3_+_137906109 | 0.88 |
ENST00000481646.1 ENST00000469044.1 ENST00000491704.1 ENST00000461600.1 |
ARMC8 |
armadillo repeat containing 8 |
| chr17_-_19266045 | 0.88 |
ENST00000395616.3 |
B9D1 |
B9 protein domain 1 |
| chr16_+_29984962 | 0.87 |
ENST00000308893.4 |
TAOK2 |
TAO kinase 2 |
| chr15_+_72410629 | 0.87 |
ENST00000340912.4 ENST00000544171.1 |
SENP8 |
SUMO/sentrin specific peptidase family member 8 |
| chr19_-_53662257 | 0.87 |
ENST00000599096.1 ENST00000334197.7 ENST00000597183.1 ENST00000601804.1 ENST00000601469.2 ENST00000452676.2 |
ZNF347 |
zinc finger protein 347 |
| chr19_+_4304632 | 0.87 |
ENST00000597590.1 |
FSD1 |
fibronectin type III and SPRY domain containing 1 |
| chr14_+_76127529 | 0.87 |
ENST00000556977.1 ENST00000557636.1 ENST00000286650.5 ENST00000298832.9 |
TTLL5 |
tubulin tyrosine ligase-like family, member 5 |
| chr3_-_66551351 | 0.86 |
ENST00000273261.3 |
LRIG1 |
leucine-rich repeats and immunoglobulin-like domains 1 |
| chr19_+_36605850 | 0.86 |
ENST00000221855.3 |
TBCB |
tubulin folding cofactor B |
| chr2_-_33824336 | 0.86 |
ENST00000431950.1 ENST00000403368.1 ENST00000441530.2 |
FAM98A |
family with sequence similarity 98, member A |
| chr20_+_327668 | 0.86 |
ENST00000382291.3 ENST00000609504.1 ENST00000382285.2 |
NRSN2 |
neurensin 2 |
| chr17_-_18585131 | 0.86 |
ENST00000443457.1 ENST00000583002.1 |
ZNF286B |
zinc finger protein 286B |
| chr4_+_668348 | 0.86 |
ENST00000511290.1 |
MYL5 |
myosin, light chain 5, regulatory |
| chr1_+_197871854 | 0.86 |
ENST00000436652.1 |
C1orf53 |
chromosome 1 open reading frame 53 |
Gene Ontology Analysis
Gene overrepresentation in biological_process category:
| Log-likelihood per target | Total log-likelihood | Term | Description |
|---|---|---|---|
| 0.9 | 4.7 | GO:0006203 | dGTP catabolic process(GO:0006203) |
| 0.9 | 3.4 | GO:0006050 | mannosamine metabolic process(GO:0006050) N-acetylmannosamine metabolic process(GO:0006051) |
| 0.8 | 6.4 | GO:0003065 | positive regulation of heart rate by epinephrine(GO:0003065) |
| 0.7 | 4.4 | GO:0072674 | multinuclear osteoclast differentiation(GO:0072674) osteoclast fusion(GO:0072675) |
| 0.7 | 2.9 | GO:1990869 | response to chemokine(GO:1990868) cellular response to chemokine(GO:1990869) |
| 0.6 | 1.9 | GO:0072186 | metanephric cap development(GO:0072185) metanephric cap morphogenesis(GO:0072186) metanephric cap mesenchymal cell proliferation involved in metanephros development(GO:0090094) |
| 0.6 | 1.8 | GO:0060988 | lipid tube assembly(GO:0060988) |
| 0.6 | 2.3 | GO:0061743 | motor learning(GO:0061743) |
| 0.6 | 3.9 | GO:0043932 | ossification involved in bone remodeling(GO:0043932) |
| 0.5 | 0.5 | GO:0019471 | peptidyl-proline hydroxylation to 4-hydroxy-L-proline(GO:0018401) 4-hydroxyproline metabolic process(GO:0019471) |
| 0.5 | 2.4 | GO:1902724 | mineralocorticoid receptor signaling pathway(GO:0031959) positive regulation of skeletal muscle satellite cell proliferation(GO:1902724) positive regulation of growth factor dependent skeletal muscle satellite cell proliferation(GO:1902728) |
| 0.5 | 2.4 | GO:0070358 | actin polymerization-dependent cell motility(GO:0070358) |
| 0.5 | 1.9 | GO:0034444 | regulation of plasma lipoprotein particle oxidation(GO:0034444) negative regulation of plasma lipoprotein particle oxidation(GO:0034445) |
| 0.4 | 1.3 | GO:0035494 | SNARE complex disassembly(GO:0035494) |
| 0.4 | 1.3 | GO:1903722 | regulation of centriole elongation(GO:1903722) |
| 0.4 | 1.7 | GO:1903490 | regulation of cytokinetic process(GO:0032954) regulation of mitotic cytokinetic process(GO:1903436) positive regulation of mitotic cytokinetic process(GO:1903438) positive regulation of mitotic cytokinesis(GO:1903490) |
| 0.4 | 1.7 | GO:2001170 | negative regulation of ATP biosynthetic process(GO:2001170) |
| 0.4 | 3.7 | GO:0070294 | renal sodium ion absorption(GO:0070294) |
| 0.4 | 2.1 | GO:0033615 | mitochondrial proton-transporting ATP synthase complex assembly(GO:0033615) |
| 0.4 | 1.6 | GO:0018283 | metal incorporation into metallo-sulfur cluster(GO:0018282) iron incorporation into metallo-sulfur cluster(GO:0018283) |
| 0.4 | 1.6 | GO:0009644 | response to high light intensity(GO:0009644) |
| 0.4 | 1.1 | GO:0071418 | cellular response to amine stimulus(GO:0071418) |
| 0.4 | 0.4 | GO:1902954 | regulation of early endosome to recycling endosome transport(GO:1902954) |
| 0.4 | 2.1 | GO:0008218 | bioluminescence(GO:0008218) |
| 0.3 | 4.5 | GO:0006290 | pyrimidine dimer repair(GO:0006290) |
| 0.3 | 1.7 | GO:0032474 | otolith morphogenesis(GO:0032474) |
| 0.3 | 1.0 | GO:0036353 | histone H2A-K119 monoubiquitination(GO:0036353) |
| 0.3 | 2.3 | GO:0097056 | selenocysteinyl-tRNA(Sec) biosynthetic process(GO:0097056) |
| 0.3 | 0.9 | GO:0001544 | initiation of primordial ovarian follicle growth(GO:0001544) |
| 0.3 | 1.5 | GO:1903976 | negative regulation of glial cell migration(GO:1903976) |
| 0.3 | 0.9 | GO:0071336 | submandibular salivary gland formation(GO:0060661) hair follicle cell proliferation(GO:0071335) regulation of hair follicle cell proliferation(GO:0071336) positive regulation of hair follicle cell proliferation(GO:0071338) |
| 0.3 | 0.9 | GO:0021966 | corticospinal neuron axon guidance(GO:0021966) |
| 0.3 | 1.8 | GO:0035407 | histone H3-T11 phosphorylation(GO:0035407) |
| 0.3 | 0.9 | GO:2000705 | dense core granule biogenesis(GO:0061110) regulation of dense core granule biogenesis(GO:2000705) |
| 0.3 | 3.2 | GO:0016926 | protein desumoylation(GO:0016926) |
| 0.3 | 1.7 | GO:1903575 | cornified envelope assembly(GO:1903575) |
| 0.3 | 2.6 | GO:0017062 | respiratory chain complex III assembly(GO:0017062) mitochondrial respiratory chain complex III assembly(GO:0034551) mitochondrial respiratory chain complex III biogenesis(GO:0097033) |
| 0.3 | 5.1 | GO:0010457 | centriole-centriole cohesion(GO:0010457) |
| 0.3 | 1.4 | GO:0097112 | gamma-aminobutyric acid receptor clustering(GO:0097112) |
| 0.3 | 2.5 | GO:2001300 | lipoxin metabolic process(GO:2001300) |
| 0.3 | 0.8 | GO:1905066 | positive regulation of ephrin receptor signaling pathway(GO:1901189) regulation of canonical Wnt signaling pathway involved in cardiac muscle cell fate commitment(GO:1901295) positive regulation of canonical Wnt signaling pathway involved in cardiac muscle cell fate commitment(GO:1901297) regulation of canonical Wnt signaling pathway involved in heart development(GO:1905066) positive regulation of canonical Wnt signaling pathway involved in heart development(GO:1905068) |
| 0.3 | 1.4 | GO:0071874 | cellular response to norepinephrine stimulus(GO:0071874) |
| 0.3 | 0.8 | GO:0019287 | isopentenyl diphosphate biosynthetic process, mevalonate pathway(GO:0019287) |
| 0.3 | 0.5 | GO:0042663 | regulation of endodermal cell fate specification(GO:0042663) |
| 0.3 | 1.8 | GO:0070375 | ERK5 cascade(GO:0070375) |
| 0.3 | 1.3 | GO:0048133 | germ-line stem cell division(GO:0042078) male germ-line stem cell asymmetric division(GO:0048133) germline stem cell asymmetric division(GO:0098728) |
| 0.3 | 2.3 | GO:0002318 | myeloid progenitor cell differentiation(GO:0002318) |
| 0.3 | 1.3 | GO:0003219 | cardiac right ventricle formation(GO:0003219) |
| 0.3 | 0.8 | GO:0051598 | meiotic recombination checkpoint(GO:0051598) |
| 0.3 | 0.8 | GO:0046416 | D-amino acid metabolic process(GO:0046416) |
| 0.3 | 1.0 | GO:0009183 | ADP biosynthetic process(GO:0006172) purine deoxyribonucleoside diphosphate biosynthetic process(GO:0009183) |
| 0.2 | 1.7 | GO:0061739 | protein lipidation involved in autophagosome assembly(GO:0061739) |
| 0.2 | 0.7 | GO:0098746 | fast, calcium ion-dependent exocytosis of neurotransmitter(GO:0098746) |
| 0.2 | 0.7 | GO:0071879 | positive regulation of adrenergic receptor signaling pathway(GO:0071879) |
| 0.2 | 0.2 | GO:0070272 | proton-transporting ATP synthase complex assembly(GO:0043461) proton-transporting ATP synthase complex biogenesis(GO:0070272) |
| 0.2 | 0.7 | GO:0036512 | trimming of terminal mannose on B branch(GO:0036509) trimming of first mannose on A branch(GO:0036511) trimming of second mannose on A branch(GO:0036512) |
| 0.2 | 0.9 | GO:0072308 | negative regulation by virus of viral protein levels in host cell(GO:0046725) negative regulation of metanephric nephron tubule epithelial cell differentiation(GO:0072308) |
| 0.2 | 1.4 | GO:0006003 | fructose 2,6-bisphosphate metabolic process(GO:0006003) |
| 0.2 | 0.9 | GO:0042412 | taurine biosynthetic process(GO:0042412) |
| 0.2 | 0.5 | GO:0034163 | regulation of toll-like receptor 9 signaling pathway(GO:0034163) |
| 0.2 | 1.9 | GO:1901475 | pyruvate transport(GO:0006848) pyruvate transmembrane transport(GO:1901475) |
| 0.2 | 0.7 | GO:1904924 | negative regulation of mitophagy in response to mitochondrial depolarization(GO:1904924) |
| 0.2 | 1.4 | GO:1903377 | negative regulation of oxidative stress-induced neuron intrinsic apoptotic signaling pathway(GO:1903377) |
| 0.2 | 0.4 | GO:0046726 | positive regulation by virus of viral protein levels in host cell(GO:0046726) |
| 0.2 | 1.1 | GO:0002032 | desensitization of G-protein coupled receptor protein signaling pathway by arrestin(GO:0002032) |
| 0.2 | 0.6 | GO:0006617 | SRP-dependent cotranslational protein targeting to membrane, signal sequence recognition(GO:0006617) |
| 0.2 | 1.2 | GO:0031087 | deadenylation-independent decapping of nuclear-transcribed mRNA(GO:0031087) |
| 0.2 | 0.6 | GO:0010360 | negative regulation of anion channel activity(GO:0010360) Golgi to plasma membrane CFTR protein transport(GO:0043000) |
| 0.2 | 0.6 | GO:0097212 | lysosomal membrane organization(GO:0097212) |
| 0.2 | 1.5 | GO:0051106 | positive regulation of DNA ligation(GO:0051106) |
| 0.2 | 1.3 | GO:2000769 | regulation of unidimensional cell growth(GO:0051510) negative regulation of unidimensional cell growth(GO:0051511) establishment of cell polarity regulating cell shape(GO:0071964) regulation of establishment or maintenance of cell polarity regulating cell shape(GO:2000769) positive regulation of establishment or maintenance of cell polarity regulating cell shape(GO:2000771) regulation of establishment of cell polarity regulating cell shape(GO:2000782) positive regulation of establishment of cell polarity regulating cell shape(GO:2000784) positive regulation of barbed-end actin filament capping(GO:2000814) |
| 0.2 | 0.9 | GO:0014835 | myoblast differentiation involved in skeletal muscle regeneration(GO:0014835) |
| 0.2 | 0.2 | GO:2000812 | regulation of barbed-end actin filament capping(GO:2000812) |
| 0.2 | 1.9 | GO:2000601 | positive regulation of Arp2/3 complex-mediated actin nucleation(GO:2000601) |
| 0.2 | 1.8 | GO:0007288 | sperm axoneme assembly(GO:0007288) |
| 0.2 | 1.0 | GO:0070537 | histone H2A K63-linked deubiquitination(GO:0070537) |
| 0.2 | 0.7 | GO:0048698 | negative regulation of collateral sprouting in absence of injury(GO:0048698) |
| 0.2 | 1.0 | GO:0051684 | maintenance of Golgi location(GO:0051684) |
| 0.2 | 2.0 | GO:1903608 | protein localization to cytoplasmic stress granule(GO:1903608) |
| 0.2 | 0.5 | GO:0003340 | negative regulation of mesenchymal to epithelial transition involved in metanephros morphogenesis(GO:0003340) |
| 0.2 | 0.8 | GO:0050916 | sensory perception of sweet taste(GO:0050916) |
| 0.2 | 0.2 | GO:0044805 | late nucleophagy(GO:0044805) |
| 0.2 | 0.7 | GO:0035720 | intraciliary anterograde transport(GO:0035720) |
| 0.2 | 1.5 | GO:0006528 | asparagine metabolic process(GO:0006528) |
| 0.2 | 1.0 | GO:0060729 | intestinal epithelial structure maintenance(GO:0060729) |
| 0.2 | 0.7 | GO:0070213 | protein auto-ADP-ribosylation(GO:0070213) |
| 0.2 | 0.3 | GO:1903978 | regulation of microglial cell activation(GO:1903978) |
| 0.2 | 0.5 | GO:0014876 | response to injury involved in regulation of muscle adaptation(GO:0014876) |
| 0.2 | 0.3 | GO:0070327 | thyroid hormone transport(GO:0070327) |
| 0.2 | 2.7 | GO:0016082 | synaptic vesicle priming(GO:0016082) |
| 0.2 | 1.3 | GO:0045144 | meiotic sister chromatid segregation(GO:0045144) |
| 0.2 | 0.6 | GO:0060434 | bronchus morphogenesis(GO:0060434) |
| 0.2 | 7.0 | GO:0043928 | exonucleolytic nuclear-transcribed mRNA catabolic process involved in deadenylation-dependent decay(GO:0043928) |
| 0.2 | 1.2 | GO:0051026 | chiasma assembly(GO:0051026) |
| 0.2 | 0.8 | GO:1904100 | regulation of protein O-linked glycosylation(GO:1904098) positive regulation of protein O-linked glycosylation(GO:1904100) |
| 0.2 | 0.9 | GO:2000676 | positive regulation of type B pancreatic cell apoptotic process(GO:2000676) |
| 0.2 | 0.8 | GO:0090258 | negative regulation of mitochondrial fission(GO:0090258) |
| 0.2 | 1.2 | GO:0001554 | luteolysis(GO:0001554) |
| 0.2 | 0.3 | GO:0000972 | transcription-dependent tethering of RNA polymerase II gene DNA at nuclear periphery(GO:0000972) |
| 0.1 | 0.9 | GO:2000825 | positive regulation of androgen receptor activity(GO:2000825) |
| 0.1 | 0.6 | GO:1905244 | regulation of modification of synaptic structure(GO:1905244) |
| 0.1 | 6.3 | GO:0015991 | ATP hydrolysis coupled proton transport(GO:0015991) |
| 0.1 | 0.4 | GO:0009051 | pentose-phosphate shunt, oxidative branch(GO:0009051) |
| 0.1 | 0.6 | GO:1902544 | regulation of DNA N-glycosylase activity(GO:1902544) |
| 0.1 | 0.9 | GO:0015853 | adenine transport(GO:0015853) |
| 0.1 | 0.6 | GO:0090034 | regulation of chaperone-mediated protein complex assembly(GO:0090034) positive regulation of chaperone-mediated protein complex assembly(GO:0090035) |
| 0.1 | 1.4 | GO:0010265 | SCF complex assembly(GO:0010265) |
| 0.1 | 0.6 | GO:0019230 | proprioception(GO:0019230) |
| 0.1 | 1.7 | GO:2000096 | positive regulation of Wnt signaling pathway, planar cell polarity pathway(GO:2000096) |
| 0.1 | 1.9 | GO:0034497 | protein localization to pre-autophagosomal structure(GO:0034497) |
| 0.1 | 0.5 | GO:1905167 | astrocyte activation involved in immune response(GO:0002265) positive regulation of lysosomal protein catabolic process(GO:1905167) |
| 0.1 | 1.6 | GO:0035986 | senescence-associated heterochromatin focus assembly(GO:0035986) |
| 0.1 | 0.9 | GO:0006537 | glutamate biosynthetic process(GO:0006537) |
| 0.1 | 0.5 | GO:0010816 | substance P catabolic process(GO:0010814) calcitonin catabolic process(GO:0010816) endothelin maturation(GO:0034959) |
| 0.1 | 0.3 | GO:0018312 | peptidyl-serine ADP-ribosylation(GO:0018312) |
| 0.1 | 1.2 | GO:0006931 | substrate-dependent cell migration, cell attachment to substrate(GO:0006931) |
| 0.1 | 0.6 | GO:1902268 | negative regulation of polyamine transmembrane transport(GO:1902268) |
| 0.1 | 0.4 | GO:0048213 | Golgi vesicle prefusion complex stabilization(GO:0048213) |
| 0.1 | 0.3 | GO:0060830 | ciliary receptor clustering involved in smoothened signaling pathway(GO:0060830) |
| 0.1 | 2.0 | GO:0033539 | fatty acid beta-oxidation using acyl-CoA dehydrogenase(GO:0033539) |
| 0.1 | 1.4 | GO:0019919 | peptidyl-arginine methylation, to asymmetrical-dimethyl arginine(GO:0019919) |
| 0.1 | 1.1 | GO:0033578 | protein glycosylation in Golgi(GO:0033578) |
| 0.1 | 0.9 | GO:0006741 | NADP biosynthetic process(GO:0006741) |
| 0.1 | 0.4 | GO:0071787 | endoplasmic reticulum tubular network assembly(GO:0071787) |
| 0.1 | 0.4 | GO:0098917 | retrograde trans-synaptic signaling(GO:0098917) |
| 0.1 | 0.4 | GO:0070541 | response to platinum ion(GO:0070541) cellular response to lead ion(GO:0071284) |
| 0.1 | 0.4 | GO:1900042 | positive regulation of interleukin-2 secretion(GO:1900042) |
| 0.1 | 1.9 | GO:0034244 | negative regulation of transcription elongation from RNA polymerase II promoter(GO:0034244) |
| 0.1 | 0.7 | GO:2000324 | positive regulation of glucocorticoid receptor signaling pathway(GO:2000324) |
| 0.1 | 1.1 | GO:0000056 | ribosomal small subunit export from nucleus(GO:0000056) |
| 0.1 | 0.2 | GO:0051138 | positive regulation of NK T cell differentiation(GO:0051138) |
| 0.1 | 0.4 | GO:0000070 | mitotic sister chromatid segregation(GO:0000070) |
| 0.1 | 0.3 | GO:0015680 | intracellular copper ion transport(GO:0015680) |
| 0.1 | 0.2 | GO:0022614 | membrane to membrane docking(GO:0022614) |
| 0.1 | 0.3 | GO:0009410 | response to xenobiotic stimulus(GO:0009410) |
| 0.1 | 0.5 | GO:0021650 | vestibulocochlear nerve formation(GO:0021650) |
| 0.1 | 1.3 | GO:0070914 | UV-damage excision repair(GO:0070914) |
| 0.1 | 0.3 | GO:0044340 | canonical Wnt signaling pathway involved in regulation of cell proliferation(GO:0044340) |
| 0.1 | 0.3 | GO:1990086 | lens fiber cell apoptotic process(GO:1990086) |
| 0.1 | 0.1 | GO:0002589 | regulation of antigen processing and presentation of peptide antigen via MHC class I(GO:0002589) negative regulation of antigen processing and presentation of peptide antigen via MHC class I(GO:0002590) |
| 0.1 | 0.4 | GO:1903507 | negative regulation of RNA biosynthetic process(GO:1902679) negative regulation of nucleic acid-templated transcription(GO:1903507) |
| 0.1 | 0.2 | GO:0002314 | germinal center B cell differentiation(GO:0002314) |
| 0.1 | 0.4 | GO:1904781 | positive regulation of protein localization to centrosome(GO:1904781) |
| 0.1 | 0.3 | GO:1903336 | negative regulation of vacuolar transport(GO:1903336) |
| 0.1 | 0.4 | GO:0070124 | mitochondrial translational initiation(GO:0070124) |
| 0.1 | 0.6 | GO:1904354 | negative regulation of telomere capping(GO:1904354) |
| 0.1 | 0.3 | GO:1904530 | regulation of actin filament binding(GO:1904529) negative regulation of actin filament binding(GO:1904530) regulation of actin binding(GO:1904616) negative regulation of actin binding(GO:1904617) |
| 0.1 | 0.4 | GO:0038108 | negative regulation of appetite by leptin-mediated signaling pathway(GO:0038108) |
| 0.1 | 1.8 | GO:0034063 | stress granule assembly(GO:0034063) |
| 0.1 | 1.0 | GO:0021891 | olfactory bulb interneuron development(GO:0021891) |
| 0.1 | 2.4 | GO:0016578 | histone deubiquitination(GO:0016578) |
| 0.1 | 1.5 | GO:0006020 | inositol metabolic process(GO:0006020) |
| 0.1 | 0.3 | GO:0043311 | positive regulation of eosinophil degranulation(GO:0043311) positive regulation of eosinophil activation(GO:1902568) |
| 0.1 | 0.4 | GO:0072344 | rescue of stalled ribosome(GO:0072344) |
| 0.1 | 0.4 | GO:0016334 | morphogenesis of follicular epithelium(GO:0016333) establishment or maintenance of polarity of follicular epithelium(GO:0016334) establishment of planar polarity of follicular epithelium(GO:0042247) |
| 0.1 | 0.6 | GO:1901525 | negative regulation of macromitophagy(GO:1901525) |
| 0.1 | 1.1 | GO:0010898 | positive regulation of triglyceride catabolic process(GO:0010898) |
| 0.1 | 0.4 | GO:0072131 | kidney mesenchyme morphogenesis(GO:0072131) metanephric mesenchyme morphogenesis(GO:0072133) |
| 0.1 | 0.3 | GO:0032289 | central nervous system myelin formation(GO:0032289) |
| 0.1 | 2.3 | GO:0036010 | protein localization to endosome(GO:0036010) |
| 0.1 | 0.7 | GO:0006933 | negative regulation of cell adhesion involved in substrate-bound cell migration(GO:0006933) |
| 0.1 | 0.3 | GO:0033364 | mast cell secretory granule organization(GO:0033364) |
| 0.1 | 0.9 | GO:0035871 | protein K11-linked deubiquitination(GO:0035871) |
| 0.1 | 0.5 | GO:0051344 | regulation of cyclic-nucleotide phosphodiesterase activity(GO:0051342) negative regulation of cyclic-nucleotide phosphodiesterase activity(GO:0051344) |
| 0.1 | 0.1 | GO:0036090 | cleavage furrow ingression(GO:0036090) |
| 0.1 | 0.2 | GO:1903553 | positive regulation of extracellular exosome assembly(GO:1903553) |
| 0.1 | 0.3 | GO:0060979 | vasculogenesis involved in coronary vascular morphogenesis(GO:0060979) |
| 0.1 | 0.5 | GO:0006574 | valine catabolic process(GO:0006574) |
| 0.1 | 0.3 | GO:1903070 | negative regulation of ER-associated ubiquitin-dependent protein catabolic process(GO:1903070) |
| 0.1 | 0.4 | GO:0015846 | polyamine transport(GO:0015846) |
| 0.1 | 0.7 | GO:0046836 | glycolipid transport(GO:0046836) |
| 0.1 | 0.3 | GO:0072319 | synaptic vesicle uncoating(GO:0016191) vesicle uncoating(GO:0072319) |
| 0.1 | 0.3 | GO:0032060 | bleb assembly(GO:0032060) |
| 0.1 | 0.8 | GO:2000270 | negative regulation of fibroblast apoptotic process(GO:2000270) |
| 0.1 | 0.8 | GO:0021769 | orbitofrontal cortex development(GO:0021769) |
| 0.1 | 1.8 | GO:0032012 | regulation of ARF protein signal transduction(GO:0032012) |
| 0.1 | 1.0 | GO:0019372 | lipoxygenase pathway(GO:0019372) |
| 0.1 | 0.4 | GO:0006696 | ergosterol biosynthetic process(GO:0006696) ergosterol metabolic process(GO:0008204) |
| 0.1 | 0.2 | GO:2000619 | negative regulation of histone H4-K16 acetylation(GO:2000619) |
| 0.1 | 0.2 | GO:0045040 | protein import into mitochondrial outer membrane(GO:0045040) |
| 0.1 | 0.2 | GO:0034453 | microtubule anchoring(GO:0034453) |
| 0.1 | 1.9 | GO:0042776 | mitochondrial ATP synthesis coupled proton transport(GO:0042776) |
| 0.1 | 0.8 | GO:2000535 | regulation of entry of bacterium into host cell(GO:2000535) |
| 0.1 | 0.3 | GO:0048239 | negative regulation of DNA recombination at telomere(GO:0048239) regulation of DNA recombination at telomere(GO:0072695) |
| 0.1 | 0.3 | GO:0097368 | establishment of Sertoli cell barrier(GO:0097368) |
| 0.1 | 0.3 | GO:0044314 | protein K27-linked ubiquitination(GO:0044314) |
| 0.1 | 0.7 | GO:0070345 | negative regulation of fat cell proliferation(GO:0070345) |
| 0.1 | 0.2 | GO:0033387 | putrescine biosynthetic process from ornithine(GO:0033387) |
| 0.1 | 1.2 | GO:0016446 | somatic hypermutation of immunoglobulin genes(GO:0016446) |
| 0.1 | 0.2 | GO:2000395 | regulation of ubiquitin-dependent endocytosis(GO:2000395) positive regulation of ubiquitin-dependent endocytosis(GO:2000397) |
| 0.1 | 0.9 | GO:0045008 | depyrimidination(GO:0045008) |
| 0.1 | 1.3 | GO:0007175 | negative regulation of epidermal growth factor-activated receptor activity(GO:0007175) |
| 0.1 | 0.2 | GO:0015709 | thiosulfate transport(GO:0015709) oxaloacetate transport(GO:0015729) malate transport(GO:0015743) malate transmembrane transport(GO:0071423) oxaloacetate(2-) transmembrane transport(GO:1902356) |
| 0.1 | 0.6 | GO:0022027 | interkinetic nuclear migration(GO:0022027) |
| 0.1 | 0.4 | GO:0001880 | Mullerian duct regression(GO:0001880) |
| 0.1 | 1.0 | GO:0035878 | nail development(GO:0035878) |
| 0.1 | 1.7 | GO:0048490 | anterograde synaptic vesicle transport(GO:0048490) synaptic vesicle cytoskeletal transport(GO:0099514) synaptic vesicle transport along microtubule(GO:0099517) |
| 0.1 | 0.1 | GO:0006283 | transcription-coupled nucleotide-excision repair(GO:0006283) |
| 0.1 | 2.3 | GO:0043968 | histone H2A acetylation(GO:0043968) |
| 0.1 | 0.7 | GO:0032364 | oxygen homeostasis(GO:0032364) |
| 0.1 | 0.2 | GO:1904717 | excitatory chemical synaptic transmission(GO:0098976) regulation of AMPA glutamate receptor clustering(GO:1904717) positive regulation of AMPA glutamate receptor clustering(GO:1904719) |
| 0.1 | 0.6 | GO:0032790 | ribosome disassembly(GO:0032790) |
| 0.1 | 0.4 | GO:0046600 | negative regulation of centriole replication(GO:0046600) |
| 0.1 | 0.9 | GO:0051715 | cytolysis in other organism(GO:0051715) |
| 0.1 | 0.5 | GO:1902897 | regulation of postsynaptic density protein 95 clustering(GO:1902897) |
| 0.1 | 1.5 | GO:0031958 | corticosteroid receptor signaling pathway(GO:0031958) |
| 0.1 | 0.3 | GO:0042091 | interleukin-10 biosynthetic process(GO:0042091) regulation of interleukin-10 biosynthetic process(GO:0045074) |
| 0.1 | 0.4 | GO:0061086 | negative regulation of histone H3-K27 methylation(GO:0061086) |
| 0.1 | 0.4 | GO:0045903 | positive regulation of translational fidelity(GO:0045903) |
| 0.1 | 0.2 | GO:0033385 | geranylgeranyl diphosphate metabolic process(GO:0033385) geranylgeranyl diphosphate biosynthetic process(GO:0033386) |
| 0.1 | 0.9 | GO:0006108 | malate metabolic process(GO:0006108) |
| 0.1 | 0.2 | GO:0051596 | methylglyoxal catabolic process to D-lactate via S-lactoyl-glutathione(GO:0019243) methylglyoxal catabolic process(GO:0051596) methylglyoxal catabolic process to lactate(GO:0061727) |
| 0.1 | 1.0 | GO:0006044 | N-acetylglucosamine metabolic process(GO:0006044) |
| 0.1 | 0.2 | GO:0045210 | negative regulation of dendritic cell cytokine production(GO:0002731) FasL biosynthetic process(GO:0045210) |
| 0.1 | 0.2 | GO:0006983 | ER overload response(GO:0006983) |
| 0.1 | 1.0 | GO:1903690 | negative regulation of wound healing, spreading of epidermal cells(GO:1903690) |
| 0.1 | 0.3 | GO:0035553 | oxidative RNA demethylation(GO:0035513) oxidative single-stranded RNA demethylation(GO:0035553) |
| 0.1 | 0.4 | GO:0048388 | endosomal lumen acidification(GO:0048388) |
| 0.1 | 0.3 | GO:0032661 | regulation of interleukin-18 production(GO:0032661) positive regulation of interferon-alpha biosynthetic process(GO:0045356) negative regulation of calcium-transporting ATPase activity(GO:1901895) |
| 0.1 | 0.5 | GO:0010890 | positive regulation of sequestering of triglyceride(GO:0010890) |
| 0.1 | 0.3 | GO:0007181 | transforming growth factor beta receptor complex assembly(GO:0007181) |
| 0.1 | 0.3 | GO:1900242 | regulation of synaptic vesicle endocytosis(GO:1900242) |
| 0.1 | 0.5 | GO:0048104 | establishment of body hair or bristle planar orientation(GO:0048104) establishment of body hair planar orientation(GO:0048105) |
| 0.1 | 0.2 | GO:0038163 | endomitotic cell cycle(GO:0007113) thrombopoietin-mediated signaling pathway(GO:0038163) |
| 0.1 | 0.4 | GO:0042989 | sequestering of actin monomers(GO:0042989) |
| 0.1 | 0.2 | GO:0007057 | spindle assembly involved in female meiosis I(GO:0007057) |
| 0.1 | 0.3 | GO:0045007 | depurination(GO:0045007) |
| 0.1 | 0.2 | GO:0046103 | adenosine catabolic process(GO:0006154) inosine biosynthetic process(GO:0046103) |
| 0.1 | 0.1 | GO:0071963 | establishment or maintenance of cell polarity regulating cell shape(GO:0071963) |
| 0.1 | 0.2 | GO:0010847 | regulation of chromatin assembly(GO:0010847) |
| 0.1 | 1.1 | GO:0045717 | negative regulation of fatty acid biosynthetic process(GO:0045717) |
| 0.1 | 2.3 | GO:0070884 | regulation of calcineurin-NFAT signaling cascade(GO:0070884) |
| 0.1 | 0.4 | GO:0035694 | mitochondrial protein catabolic process(GO:0035694) |
| 0.1 | 0.1 | GO:1903595 | positive regulation of histamine secretion by mast cell(GO:1903595) |
| 0.1 | 0.3 | GO:0010286 | heat acclimation(GO:0010286) cellular heat acclimation(GO:0070370) |
| 0.1 | 0.8 | GO:0040016 | embryonic cleavage(GO:0040016) |
| 0.1 | 0.9 | GO:0035970 | peptidyl-threonine dephosphorylation(GO:0035970) |
| 0.1 | 0.2 | GO:0046833 | positive regulation of RNA export from nucleus(GO:0046833) |
| 0.1 | 2.2 | GO:0060216 | definitive hemopoiesis(GO:0060216) |
| 0.1 | 0.5 | GO:0031017 | exocrine pancreas development(GO:0031017) |
| 0.1 | 0.2 | GO:0043402 | glucocorticoid mediated signaling pathway(GO:0043402) regulation of glucocorticoid mediated signaling pathway(GO:1900169) |
| 0.1 | 0.3 | GO:0046831 | regulation of nucleobase-containing compound transport(GO:0032239) regulation of RNA export from nucleus(GO:0046831) |
| 0.1 | 0.2 | GO:0043449 | olfactory learning(GO:0008355) cellular alkene metabolic process(GO:0043449) |
| 0.1 | 0.3 | GO:0097084 | vascular smooth muscle cell development(GO:0097084) |
| 0.1 | 1.3 | GO:0000717 | nucleotide-excision repair, DNA duplex unwinding(GO:0000717) |
| 0.1 | 0.4 | GO:0032000 | positive regulation of fatty acid beta-oxidation(GO:0032000) |
| 0.1 | 0.2 | GO:0036289 | peptidyl-serine autophosphorylation(GO:0036289) |
| 0.1 | 0.2 | GO:0071816 | tail-anchored membrane protein insertion into ER membrane(GO:0071816) |
| 0.1 | 0.3 | GO:0070940 | dephosphorylation of RNA polymerase II C-terminal domain(GO:0070940) |
| 0.1 | 3.0 | GO:0042073 | intraciliary transport(GO:0042073) |
| 0.1 | 0.2 | GO:0030047 | actin modification(GO:0030047) |
| 0.1 | 0.8 | GO:0034162 | toll-like receptor 9 signaling pathway(GO:0034162) |
| 0.1 | 0.9 | GO:0090110 | cargo loading into COPII-coated vesicle(GO:0090110) |
| 0.1 | 1.2 | GO:0043568 | positive regulation of insulin-like growth factor receptor signaling pathway(GO:0043568) |
| 0.1 | 0.2 | GO:0090649 | response to oxygen-glucose deprivation(GO:0090649) cellular response to oxygen-glucose deprivation(GO:0090650) |
| 0.1 | 2.1 | GO:0032008 | positive regulation of TOR signaling(GO:0032008) |
| 0.1 | 0.4 | GO:0035524 | proline transmembrane transport(GO:0035524) |
| 0.1 | 0.8 | GO:0060315 | negative regulation of ryanodine-sensitive calcium-release channel activity(GO:0060315) |
| 0.1 | 2.5 | GO:0060976 | coronary vasculature development(GO:0060976) |
| 0.1 | 0.7 | GO:1903874 | ferrous iron transport(GO:0015684) ferrous iron transmembrane transport(GO:1903874) |
| 0.1 | 0.3 | GO:0045198 | establishment of epithelial cell apical/basal polarity(GO:0045198) |
| 0.1 | 0.2 | GO:0021898 | regulation of transcription from RNA polymerase II promoter involved in forebrain neuron fate commitment(GO:0021882) cerebral cortex GABAergic interneuron fate commitment(GO:0021893) commitment of multipotent stem cells to neuronal lineage in forebrain(GO:0021898) positive regulation of neural retina development(GO:0061075) positive regulation of retina development in camera-type eye(GO:1902868) regulation of amacrine cell differentiation(GO:1902869) positive regulation of amacrine cell differentiation(GO:1902871) |
| 0.1 | 0.2 | GO:0051150 | regulation of smooth muscle cell differentiation(GO:0051150) |
| 0.1 | 2.5 | GO:0050690 | regulation of defense response to virus by virus(GO:0050690) |
| 0.1 | 0.4 | GO:0060628 | regulation of ER to Golgi vesicle-mediated transport(GO:0060628) |
| 0.1 | 0.2 | GO:2000439 | positive regulation of monocyte extravasation(GO:2000439) |
| 0.1 | 1.0 | GO:0032784 | regulation of DNA-templated transcription, elongation(GO:0032784) |
| 0.0 | 0.6 | GO:0001514 | selenocysteine incorporation(GO:0001514) translational readthrough(GO:0006451) |
| 0.0 | 0.5 | GO:0039536 | negative regulation of RIG-I signaling pathway(GO:0039536) |
| 0.0 | 0.6 | GO:0032968 | positive regulation of transcription elongation from RNA polymerase II promoter(GO:0032968) |
| 0.0 | 0.2 | GO:2001169 | regulation of ATP biosynthetic process(GO:2001169) positive regulation of ATP biosynthetic process(GO:2001171) |
| 0.0 | 0.3 | GO:0046543 | development of secondary female sexual characteristics(GO:0046543) |
| 0.0 | 0.9 | GO:0097094 | craniofacial suture morphogenesis(GO:0097094) |
| 0.0 | 1.8 | GO:0030513 | positive regulation of BMP signaling pathway(GO:0030513) |
| 0.0 | 0.7 | GO:0035751 | regulation of lysosomal lumen pH(GO:0035751) |
| 0.0 | 0.0 | GO:1901300 | positive regulation of hydrogen peroxide-mediated programmed cell death(GO:1901300) |
| 0.0 | 1.4 | GO:0006479 | protein methylation(GO:0006479) protein alkylation(GO:0008213) |
| 0.0 | 1.1 | GO:0045899 | positive regulation of RNA polymerase II transcriptional preinitiation complex assembly(GO:0045899) |
| 0.0 | 1.2 | GO:0006646 | phosphatidylethanolamine biosynthetic process(GO:0006646) |
| 0.0 | 0.9 | GO:0006851 | mitochondrial calcium ion transport(GO:0006851) |
| 0.0 | 0.6 | GO:0046784 | viral mRNA export from host cell nucleus(GO:0046784) |
| 0.0 | 0.6 | GO:1900364 | negative regulation of mRNA polyadenylation(GO:1900364) |
| 0.0 | 2.0 | GO:0000266 | mitochondrial fission(GO:0000266) |
| 0.0 | 0.4 | GO:0034058 | endosomal vesicle fusion(GO:0034058) |
| 0.0 | 0.4 | GO:0019509 | L-methionine biosynthetic process from methylthioadenosine(GO:0019509) |
| 0.0 | 0.1 | GO:0031247 | actin rod assembly(GO:0031247) |
| 0.0 | 2.8 | GO:0000186 | activation of MAPKK activity(GO:0000186) |
| 0.0 | 0.3 | GO:1903433 | regulation of constitutive secretory pathway(GO:1903433) |
| 0.0 | 0.5 | GO:0042984 | amyloid precursor protein biosynthetic process(GO:0042983) regulation of amyloid precursor protein biosynthetic process(GO:0042984) |
| 0.0 | 0.6 | GO:0060137 | maternal process involved in parturition(GO:0060137) |
| 0.0 | 0.2 | GO:0071894 | histone H2B conserved C-terminal lysine ubiquitination(GO:0071894) |
| 0.0 | 0.3 | GO:0098535 | de novo centriole assembly(GO:0098535) |
| 0.0 | 0.2 | GO:0031915 | positive regulation of synaptic plasticity(GO:0031915) |
| 0.0 | 4.7 | GO:1903955 | positive regulation of protein targeting to mitochondrion(GO:1903955) |
| 0.0 | 0.8 | GO:0009109 | coenzyme catabolic process(GO:0009109) |
| 0.0 | 0.2 | GO:1904751 | positive regulation of protein localization to nucleolus(GO:1904751) |
| 0.0 | 0.2 | GO:0009956 | radial pattern formation(GO:0009956) |
| 0.0 | 0.2 | GO:0014886 | transition between slow and fast fiber(GO:0014886) |
| 0.0 | 0.4 | GO:0048280 | vesicle fusion with Golgi apparatus(GO:0048280) |
| 0.0 | 0.4 | GO:0043653 | mitochondrial fragmentation involved in apoptotic process(GO:0043653) |
| 0.0 | 0.6 | GO:0043651 | linoleic acid metabolic process(GO:0043651) |
| 0.0 | 0.1 | GO:0072513 | positive regulation of secondary heart field cardioblast proliferation(GO:0072513) |
| 0.0 | 0.5 | GO:0006987 | activation of signaling protein activity involved in unfolded protein response(GO:0006987) |
| 0.0 | 0.2 | GO:0044837 | assembly of actomyosin apparatus involved in cytokinesis(GO:0000912) actomyosin contractile ring assembly(GO:0000915) actomyosin contractile ring organization(GO:0044837) |
| 0.0 | 0.6 | GO:0045669 | positive regulation of osteoblast differentiation(GO:0045669) |
| 0.0 | 0.2 | GO:0006269 | DNA replication, synthesis of RNA primer(GO:0006269) |
| 0.0 | 3.4 | GO:0042147 | retrograde transport, endosome to Golgi(GO:0042147) |
| 0.0 | 0.1 | GO:1902528 | regulation of protein linear polyubiquitination(GO:1902528) positive regulation of protein linear polyubiquitination(GO:1902530) |
| 0.0 | 0.3 | GO:0018406 | protein C-linked glycosylation(GO:0018103) peptidyl-tryptophan modification(GO:0018211) protein C-linked glycosylation via tryptophan(GO:0018317) protein C-linked glycosylation via 2'-alpha-mannosyl-L-tryptophan(GO:0018406) |
| 0.0 | 0.1 | GO:0036446 | myofibroblast differentiation(GO:0036446) regulation of myofibroblast differentiation(GO:1904760) |
| 0.0 | 0.2 | GO:0000389 | mRNA 3'-splice site recognition(GO:0000389) |
| 0.0 | 0.2 | GO:0060501 | positive regulation of epithelial cell proliferation involved in lung morphogenesis(GO:0060501) |
| 0.0 | 0.5 | GO:0007097 | nuclear migration(GO:0007097) |
| 0.0 | 0.2 | GO:0021869 | forebrain ventricular zone progenitor cell division(GO:0021869) |
| 0.0 | 0.8 | GO:0042424 | catechol-containing compound catabolic process(GO:0019614) catecholamine catabolic process(GO:0042424) |
| 0.0 | 0.2 | GO:0006616 | SRP-dependent cotranslational protein targeting to membrane, translocation(GO:0006616) |
| 0.0 | 1.1 | GO:0006937 | regulation of muscle contraction(GO:0006937) |
| 0.0 | 0.9 | GO:2000479 | regulation of cAMP-dependent protein kinase activity(GO:2000479) |
| 0.0 | 0.3 | GO:0030252 | growth hormone secretion(GO:0030252) |
| 0.0 | 0.3 | GO:0002175 | protein localization to paranode region of axon(GO:0002175) |
| 0.0 | 0.4 | GO:0015760 | hexose phosphate transport(GO:0015712) glucose-6-phosphate transport(GO:0015760) |
| 0.0 | 0.1 | GO:0031125 | rRNA 3'-end processing(GO:0031125) |
| 0.0 | 0.6 | GO:0006303 | double-strand break repair via nonhomologous end joining(GO:0006303) |
| 0.0 | 1.1 | GO:0046597 | negative regulation of viral entry into host cell(GO:0046597) |
| 0.0 | 1.5 | GO:0042462 | eye photoreceptor cell development(GO:0042462) |
| 0.0 | 0.3 | GO:0045792 | negative regulation of cell size(GO:0045792) |
| 0.0 | 0.3 | GO:1900029 | positive regulation of ruffle assembly(GO:1900029) |
| 0.0 | 0.9 | GO:0009083 | branched-chain amino acid catabolic process(GO:0009083) |
| 0.0 | 0.7 | GO:0010569 | regulation of double-strand break repair via homologous recombination(GO:0010569) |
| 0.0 | 1.0 | GO:0046827 | positive regulation of protein export from nucleus(GO:0046827) |
| 0.0 | 0.1 | GO:0000012 | single strand break repair(GO:0000012) |
| 0.0 | 0.5 | GO:0006995 | cellular response to nitrogen starvation(GO:0006995) cellular response to nitrogen levels(GO:0043562) |
| 0.0 | 0.9 | GO:0007020 | microtubule nucleation(GO:0007020) |
| 0.0 | 0.2 | GO:0071224 | cellular response to peptidoglycan(GO:0071224) |
| 0.0 | 0.3 | GO:0035457 | cellular response to interferon-alpha(GO:0035457) |
| 0.0 | 0.4 | GO:0030638 | polyketide metabolic process(GO:0030638) daunorubicin metabolic process(GO:0044597) doxorubicin metabolic process(GO:0044598) |
| 0.0 | 1.2 | GO:0048025 | negative regulation of mRNA splicing, via spliceosome(GO:0048025) |
| 0.0 | 0.1 | GO:0000294 | nuclear-transcribed mRNA catabolic process, endonucleolytic cleavage-dependent decay(GO:0000294) |
| 0.0 | 2.4 | GO:0006120 | mitochondrial electron transport, NADH to ubiquinone(GO:0006120) |
| 0.0 | 0.5 | GO:0061635 | regulation of protein complex stability(GO:0061635) |
| 0.0 | 0.2 | GO:0034421 | post-translational protein acetylation(GO:0034421) |
| 0.0 | 0.6 | GO:0000132 | establishment of mitotic spindle orientation(GO:0000132) |
| 0.0 | 0.2 | GO:1903599 | positive regulation of mitophagy(GO:1903599) |
| 0.0 | 0.3 | GO:0046855 | phosphorylated carbohydrate dephosphorylation(GO:0046838) inositol phosphate dephosphorylation(GO:0046855) |
| 0.0 | 0.2 | GO:0044878 | mitotic cytokinesis checkpoint(GO:0044878) |
| 0.0 | 0.1 | GO:0032328 | alanine transport(GO:0032328) |
| 0.0 | 0.2 | GO:2000467 | positive regulation of glycogen (starch) synthase activity(GO:2000467) |
| 0.0 | 0.1 | GO:0034093 | positive regulation of maintenance of sister chromatid cohesion(GO:0034093) positive regulation of maintenance of mitotic sister chromatid cohesion(GO:0034184) |
| 0.0 | 0.2 | GO:0018343 | protein farnesylation(GO:0018343) |
| 0.0 | 0.5 | GO:0006768 | biotin metabolic process(GO:0006768) |
| 0.0 | 0.2 | GO:0016480 | negative regulation of transcription from RNA polymerase III promoter(GO:0016480) |
| 0.0 | 0.3 | GO:0060576 | intestinal epithelial cell development(GO:0060576) |
| 0.0 | 3.4 | GO:0090630 | activation of GTPase activity(GO:0090630) |
| 0.0 | 0.1 | GO:0045897 | positive regulation of transcription during mitosis(GO:0045897) |
| 0.0 | 0.2 | GO:0007035 | vacuolar acidification(GO:0007035) |
| 0.0 | 0.7 | GO:0010718 | positive regulation of epithelial to mesenchymal transition(GO:0010718) |
| 0.0 | 3.5 | GO:0021987 | cerebral cortex development(GO:0021987) |
| 0.0 | 0.2 | GO:2000035 | regulation of stem cell division(GO:2000035) |
| 0.0 | 1.2 | GO:0006607 | NLS-bearing protein import into nucleus(GO:0006607) |
| 0.0 | 1.0 | GO:0000188 | inactivation of MAPK activity(GO:0000188) |
| 0.0 | 0.7 | GO:0006376 | mRNA splice site selection(GO:0006376) |
| 0.0 | 0.2 | GO:0090344 | negative regulation of cell aging(GO:0090344) |
| 0.0 | 0.5 | GO:0051016 | barbed-end actin filament capping(GO:0051016) |
| 0.0 | 0.2 | GO:0060573 | ventral spinal cord interneuron specification(GO:0021521) cell fate specification involved in pattern specification(GO:0060573) |
| 0.0 | 0.9 | GO:0071526 | semaphorin-plexin signaling pathway(GO:0071526) |
| 0.0 | 0.6 | GO:0033540 | fatty acid beta-oxidation using acyl-CoA oxidase(GO:0033540) |
| 0.0 | 0.9 | GO:0000060 | protein import into nucleus, translocation(GO:0000060) |
| 0.0 | 0.1 | GO:0048539 | bone marrow development(GO:0048539) |
| 0.0 | 1.0 | GO:1902808 | positive regulation of cell cycle G1/S phase transition(GO:1902808) |
| 0.0 | 4.2 | GO:0046546 | male gonad development(GO:0008584) development of primary male sexual characteristics(GO:0046546) |
| 0.0 | 0.6 | GO:0042347 | negative regulation of NF-kappaB import into nucleus(GO:0042347) |
| 0.0 | 0.9 | GO:0002076 | osteoblast development(GO:0002076) |
| 0.0 | 0.1 | GO:1990022 | RNA polymerase II complex import to nucleus(GO:0044376) RNA polymerase III complex localization to nucleus(GO:1990022) |
| 0.0 | 0.1 | GO:1901503 | ether lipid biosynthetic process(GO:0008611) glycerol ether biosynthetic process(GO:0046504) ether biosynthetic process(GO:1901503) |
| 0.0 | 0.1 | GO:0045324 | late endosome to vacuole transport(GO:0045324) |
| 0.0 | 0.2 | GO:0006122 | mitochondrial electron transport, ubiquinol to cytochrome c(GO:0006122) |
| 0.0 | 0.2 | GO:0006348 | chromatin silencing at telomere(GO:0006348) |
| 0.0 | 0.2 | GO:0098532 | histone H3-K27 trimethylation(GO:0098532) |
| 0.0 | 0.6 | GO:0016048 | detection of temperature stimulus(GO:0016048) |
| 0.0 | 0.2 | GO:0051152 | positive regulation of smooth muscle cell differentiation(GO:0051152) |
| 0.0 | 0.6 | GO:0034198 | cellular response to amino acid starvation(GO:0034198) |
| 0.0 | 0.3 | GO:1902600 | hydrogen ion transmembrane transport(GO:1902600) |
| 0.0 | 0.1 | GO:0010499 | proteasomal ubiquitin-independent protein catabolic process(GO:0010499) |
| 0.0 | 1.1 | GO:0043407 | negative regulation of MAP kinase activity(GO:0043407) |
| 0.0 | 0.7 | GO:0006779 | porphyrin-containing compound biosynthetic process(GO:0006779) |
| 0.0 | 0.5 | GO:0044241 | lipid digestion(GO:0044241) |
| 0.0 | 0.1 | GO:0043922 | negative regulation by host of viral transcription(GO:0043922) |
| 0.0 | 0.3 | GO:0060124 | positive regulation of growth hormone secretion(GO:0060124) |
| 0.0 | 0.1 | GO:0045075 | interleukin-12 biosynthetic process(GO:0042090) regulation of interleukin-12 biosynthetic process(GO:0045075) |
| 0.0 | 2.8 | GO:0007224 | smoothened signaling pathway(GO:0007224) |
| 0.0 | 0.1 | GO:0046778 | modulation by virus of host gene expression(GO:0039656) modification by virus of host mRNA processing(GO:0046778) |
| 0.0 | 0.1 | GO:0070601 | centromeric sister chromatid cohesion(GO:0070601) |
| 0.0 | 0.1 | GO:0060710 | chorio-allantoic fusion(GO:0060710) |
| 0.0 | 0.2 | GO:0008595 | blastoderm segmentation(GO:0007350) tripartite regional subdivision(GO:0007351) anterior/posterior axis specification, embryo(GO:0008595) |
| 0.0 | 0.6 | GO:0061157 | mRNA destabilization(GO:0061157) |
| 0.0 | 0.1 | GO:0051725 | protein de-ADP-ribosylation(GO:0051725) |
| 0.0 | 0.6 | GO:0045840 | positive regulation of mitotic nuclear division(GO:0045840) |
| 0.0 | 0.2 | GO:0031053 | primary miRNA processing(GO:0031053) |
| 0.0 | 0.1 | GO:0035617 | stress granule disassembly(GO:0035617) |
| 0.0 | 0.0 | GO:1904562 | phosphatidylinositol 5-phosphate metabolic process(GO:1904562) |
| 0.0 | 0.8 | GO:0006513 | protein monoubiquitination(GO:0006513) |
| 0.0 | 0.4 | GO:1900271 | regulation of long-term synaptic potentiation(GO:1900271) |
| 0.0 | 0.5 | GO:0050850 | positive regulation of calcium-mediated signaling(GO:0050850) |
| 0.0 | 0.1 | GO:0042373 | vitamin K metabolic process(GO:0042373) |
| 0.0 | 0.1 | GO:0032486 | Rap protein signal transduction(GO:0032486) |
| 0.0 | 0.4 | GO:0050962 | detection of light stimulus involved in visual perception(GO:0050908) detection of light stimulus involved in sensory perception(GO:0050962) |
| 0.0 | 0.2 | GO:0051775 | response to redox state(GO:0051775) |
| 0.0 | 0.3 | GO:0006555 | methionine metabolic process(GO:0006555) |
| 0.0 | 1.6 | GO:0032418 | lysosome localization(GO:0032418) |
| 0.0 | 0.1 | GO:0045579 | positive regulation of B cell differentiation(GO:0045579) |
| 0.0 | 0.0 | GO:2000623 | regulation of nuclear-transcribed mRNA catabolic process, nonsense-mediated decay(GO:2000622) negative regulation of nuclear-transcribed mRNA catabolic process, nonsense-mediated decay(GO:2000623) |
| 0.0 | 0.2 | GO:0007250 | activation of NF-kappaB-inducing kinase activity(GO:0007250) |
| 0.0 | 0.5 | GO:0021522 | spinal cord motor neuron differentiation(GO:0021522) |
| 0.0 | 0.3 | GO:0035855 | megakaryocyte development(GO:0035855) |
| 0.0 | 0.3 | GO:0001946 | lymphangiogenesis(GO:0001946) |
| 0.0 | 0.1 | GO:0010042 | response to manganese ion(GO:0010042) |
| 0.0 | 0.4 | GO:0000028 | ribosomal small subunit assembly(GO:0000028) |
| 0.0 | 0.3 | GO:0097264 | self proteolysis(GO:0097264) |
| 0.0 | 0.8 | GO:0031670 | cellular response to nutrient(GO:0031670) |
| 0.0 | 0.1 | GO:0090501 | RNA phosphodiester bond hydrolysis(GO:0090501) |
| 0.0 | 0.3 | GO:0016973 | poly(A)+ mRNA export from nucleus(GO:0016973) |
| 0.0 | 0.1 | GO:0018364 | peptidyl-glutamine methylation(GO:0018364) |
| 0.0 | 0.3 | GO:0048169 | regulation of long-term neuronal synaptic plasticity(GO:0048169) |
| 0.0 | 0.5 | GO:0043101 | purine-containing compound salvage(GO:0043101) |
| 0.0 | 0.3 | GO:1901522 | positive regulation of transcription from RNA polymerase II promoter involved in cellular response to chemical stimulus(GO:1901522) |
| 0.0 | 0.0 | GO:0006379 | mRNA cleavage(GO:0006379) |
| 0.0 | 0.5 | GO:0072384 | organelle transport along microtubule(GO:0072384) |
| 0.0 | 1.1 | GO:0000380 | alternative mRNA splicing, via spliceosome(GO:0000380) |
| 0.0 | 1.5 | GO:0001578 | microtubule bundle formation(GO:0001578) |
| 0.0 | 2.5 | GO:0070268 | cornification(GO:0070268) |
| 0.0 | 0.1 | GO:0032482 | Rab protein signal transduction(GO:0032482) |
| 0.0 | 0.1 | GO:2001137 | positive regulation of endocytic recycling(GO:2001137) |
| 0.0 | 0.3 | GO:2000144 | positive regulation of DNA-templated transcription, initiation(GO:2000144) |
| 0.0 | 0.1 | GO:0007614 | short-term memory(GO:0007614) |
| 0.0 | 0.2 | GO:0032091 | negative regulation of protein binding(GO:0032091) |
| 0.0 | 0.3 | GO:0002089 | lens morphogenesis in camera-type eye(GO:0002089) |
| 0.0 | 0.3 | GO:0072321 | chaperone-mediated protein transport(GO:0072321) |
| 0.0 | 0.9 | GO:0043392 | negative regulation of DNA binding(GO:0043392) |
| 0.0 | 0.1 | GO:1904885 | beta-catenin destruction complex assembly(GO:1904885) |
| 0.0 | 0.1 | GO:1901185 | negative regulation of epidermal growth factor receptor signaling pathway(GO:0042059) negative regulation of ERBB signaling pathway(GO:1901185) |
| 0.0 | 0.1 | GO:0014878 | response to electrical stimulus involved in regulation of muscle adaptation(GO:0014878) positive regulation of skeletal muscle tissue growth(GO:0048633) |
| 0.0 | 0.1 | GO:0032006 | regulation of TOR signaling(GO:0032006) |
| 0.0 | 0.6 | GO:0000245 | spliceosomal complex assembly(GO:0000245) |
| 0.0 | 0.1 | GO:0001828 | inner cell mass cellular morphogenesis(GO:0001828) |
| 0.0 | 0.3 | GO:0048247 | lymphocyte chemotaxis(GO:0048247) |
| 0.0 | 0.7 | GO:0007520 | myoblast fusion(GO:0007520) |
| 0.0 | 0.0 | GO:1902410 | mitotic cytokinetic process(GO:1902410) |
| 0.0 | 0.2 | GO:0070828 | heterochromatin organization(GO:0070828) |
| 0.0 | 0.3 | GO:0046856 | phosphatidylinositol dephosphorylation(GO:0046856) |
| 0.0 | 0.2 | GO:1990001 | inhibition of cysteine-type endopeptidase activity involved in apoptotic process(GO:1990001) |
| 0.0 | 0.4 | GO:0070423 | nucleotide-binding oligomerization domain containing signaling pathway(GO:0070423) |
| 0.0 | 0.5 | GO:0014904 | myotube cell development(GO:0014904) |
| 0.0 | 0.2 | GO:0051382 | kinetochore assembly(GO:0051382) |
| 0.0 | 0.1 | GO:0015742 | alpha-ketoglutarate transport(GO:0015742) |
| 0.0 | 0.6 | GO:0051607 | defense response to virus(GO:0051607) |
| 0.0 | 0.6 | GO:0030308 | negative regulation of cell growth(GO:0030308) |
| 0.0 | 0.1 | GO:0006729 | tetrahydrobiopterin biosynthetic process(GO:0006729) tetrahydrobiopterin metabolic process(GO:0046146) |
| 0.0 | 0.2 | GO:0006369 | termination of RNA polymerase II transcription(GO:0006369) |
| 0.0 | 0.3 | GO:0018195 | peptidyl-arginine modification(GO:0018195) |
| 0.0 | 0.1 | GO:0010839 | negative regulation of keratinocyte proliferation(GO:0010839) |
| 0.0 | 0.0 | GO:0045359 | positive regulation of interferon-beta biosynthetic process(GO:0045359) |
| 0.0 | 10.5 | GO:0043547 | positive regulation of GTPase activity(GO:0043547) |
| 0.0 | 0.3 | GO:0033344 | cholesterol efflux(GO:0033344) |
| 0.0 | 0.3 | GO:0048268 | clathrin coat assembly(GO:0048268) |
| 0.0 | 0.2 | GO:0016180 | snRNA processing(GO:0016180) |
| 0.0 | 0.2 | GO:0048172 | regulation of short-term neuronal synaptic plasticity(GO:0048172) |
| 0.0 | 0.7 | GO:0021762 | substantia nigra development(GO:0021762) |
| 0.0 | 0.2 | GO:0015074 | DNA integration(GO:0015074) |
| 0.0 | 0.2 | GO:0045599 | negative regulation of fat cell differentiation(GO:0045599) |
| 0.0 | 0.1 | GO:0097428 | protein maturation by iron-sulfur cluster transfer(GO:0097428) |
| 0.0 | 0.5 | GO:0045540 | regulation of cholesterol biosynthetic process(GO:0045540) |
| 0.0 | 0.1 | GO:0048148 | behavioral response to cocaine(GO:0048148) |
| 0.0 | 0.0 | GO:1903756 | regulation of transcription from RNA polymerase II promoter by histone modification(GO:1903756) negative regulation of transcription from RNA polymerase II promoter by histone modification(GO:1903758) |
| 0.0 | 0.1 | GO:0051194 | positive regulation of nucleotide catabolic process(GO:0030813) positive regulation of glycolytic process(GO:0045821) positive regulation of cofactor metabolic process(GO:0051194) positive regulation of coenzyme metabolic process(GO:0051197) |
| 0.0 | 0.1 | GO:0051189 | Mo-molybdopterin cofactor biosynthetic process(GO:0006777) Mo-molybdopterin cofactor metabolic process(GO:0019720) molybdopterin cofactor biosynthetic process(GO:0032324) molybdopterin cofactor metabolic process(GO:0043545) prosthetic group metabolic process(GO:0051189) |
| 0.0 | 0.4 | GO:2000300 | regulation of synaptic vesicle exocytosis(GO:2000300) |
| 0.0 | 0.1 | GO:0034384 | high-density lipoprotein particle clearance(GO:0034384) |
| 0.0 | 0.4 | GO:0090503 | RNA phosphodiester bond hydrolysis, exonucleolytic(GO:0090503) |
| 0.0 | 0.2 | GO:0061154 | endothelial tube morphogenesis(GO:0061154) |
| 0.0 | 1.2 | GO:0042752 | regulation of circadian rhythm(GO:0042752) |
| 0.0 | 0.3 | GO:1901687 | glutathione derivative metabolic process(GO:1901685) glutathione derivative biosynthetic process(GO:1901687) |
| 0.0 | 0.1 | GO:0016241 | regulation of macroautophagy(GO:0016241) |
| 0.0 | 0.1 | GO:0001561 | fatty acid alpha-oxidation(GO:0001561) |
| 0.0 | 0.1 | GO:0045721 | negative regulation of gluconeogenesis(GO:0045721) |
| 0.0 | 0.0 | GO:0097201 | negative regulation of transcription from RNA polymerase II promoter in response to stress(GO:0097201) |
| 0.0 | 0.0 | GO:0086021 | SA node cell to atrial cardiac muscle cell communication by electrical coupling(GO:0086021) |
| 0.0 | 0.0 | GO:0045647 | negative regulation of erythrocyte differentiation(GO:0045647) |
| 0.0 | 0.7 | GO:0007422 | peripheral nervous system development(GO:0007422) |
| 0.0 | 0.0 | GO:0060033 | anatomical structure regression(GO:0060033) |
| 0.0 | 0.1 | GO:0006102 | isocitrate metabolic process(GO:0006102) |
| 0.0 | 0.3 | GO:0006401 | RNA catabolic process(GO:0006401) |
| 0.0 | 1.5 | GO:0006613 | cotranslational protein targeting to membrane(GO:0006613) |
| 0.0 | 0.1 | GO:0042953 | lipoprotein transport(GO:0042953) lipoprotein localization(GO:0044872) |
| 0.0 | 0.2 | GO:0031648 | protein destabilization(GO:0031648) |
| 0.0 | 0.1 | GO:0055072 | iron ion homeostasis(GO:0055072) |
| 0.0 | 0.2 | GO:1902083 | negative regulation of peptidyl-cysteine S-nitrosylation(GO:1902083) |
| 0.0 | 0.1 | GO:0090625 | mRNA cleavage involved in gene silencing by siRNA(GO:0090625) |
| 0.0 | 0.8 | GO:0019886 | antigen processing and presentation of exogenous peptide antigen via MHC class II(GO:0019886) |
| 0.0 | 0.2 | GO:0015671 | oxygen transport(GO:0015671) |
| 0.0 | 0.3 | GO:0035914 | skeletal muscle cell differentiation(GO:0035914) |
| 0.0 | 0.2 | GO:2000171 | negative regulation of dendrite development(GO:2000171) |
| 0.0 | 0.2 | GO:0052695 | cellular glucuronidation(GO:0052695) |
| 0.0 | 0.3 | GO:0007158 | neuron cell-cell adhesion(GO:0007158) |
Gene overrepresentation in cellular_component category:
| Log-likelihood per target | Total log-likelihood | Term | Description |
|---|---|---|---|
| 0.6 | 1.9 | GO:0034365 | discoidal high-density lipoprotein particle(GO:0034365) |
| 0.6 | 2.3 | GO:0044301 | climbing fiber(GO:0044301) |
| 0.6 | 1.7 | GO:0035189 | Rb-E2F complex(GO:0035189) |
| 0.5 | 1.5 | GO:0000818 | nuclear MIS12/MIND complex(GO:0000818) condensed chromosome inner kinetochore(GO:0000939) |
| 0.5 | 1.4 | GO:0016935 | glycine-gated chloride channel complex(GO:0016935) |
| 0.5 | 1.4 | GO:0097233 | lamellar body membrane(GO:0097232) alveolar lamellar body membrane(GO:0097233) |
| 0.4 | 1.2 | GO:0009330 | DNA topoisomerase complex (ATP-hydrolyzing)(GO:0009330) |
| 0.4 | 3.6 | GO:0030015 | CCR4-NOT core complex(GO:0030015) |
| 0.3 | 1.7 | GO:0035370 | UBC13-UEV1A complex(GO:0035370) |
| 0.3 | 6.4 | GO:0005862 | muscle thin filament tropomyosin(GO:0005862) |
| 0.3 | 2.5 | GO:0016272 | prefoldin complex(GO:0016272) |
| 0.3 | 0.8 | GO:0031021 | interphase microtubule organizing center(GO:0031021) |
| 0.2 | 4.3 | GO:0000276 | mitochondrial proton-transporting ATP synthase complex, coupling factor F(o)(GO:0000276) |
| 0.2 | 3.3 | GO:0033179 | proton-transporting V-type ATPase, V0 domain(GO:0033179) |
| 0.2 | 2.0 | GO:0042382 | paraspeckles(GO:0042382) |
| 0.2 | 3.2 | GO:0000124 | SAGA complex(GO:0000124) |
| 0.2 | 1.4 | GO:0005658 | alpha DNA polymerase:primase complex(GO:0005658) |
| 0.2 | 1.8 | GO:0061574 | ASAP complex(GO:0061574) |
| 0.2 | 0.6 | GO:0005683 | U7 snRNP(GO:0005683) |
| 0.2 | 0.8 | GO:0097135 | cyclin E2-CDK2 complex(GO:0097135) |
| 0.2 | 1.3 | GO:0000408 | EKC/KEOPS complex(GO:0000408) |
| 0.2 | 1.9 | GO:0072669 | tRNA-splicing ligase complex(GO:0072669) |
| 0.2 | 3.5 | GO:0036038 | MKS complex(GO:0036038) |
| 0.2 | 0.7 | GO:0031510 | SUMO activating enzyme complex(GO:0031510) |
| 0.2 | 1.3 | GO:0000110 | nucleotide-excision repair factor 1 complex(GO:0000110) |
| 0.2 | 0.7 | GO:0070044 | synaptobrevin 2-SNAP-25-syntaxin-1a complex(GO:0070044) |
| 0.2 | 1.7 | GO:0031931 | TORC1 complex(GO:0031931) |
| 0.2 | 1.2 | GO:1990726 | Lsm1-7-Pat1 complex(GO:1990726) |
| 0.2 | 0.5 | GO:0043224 | nuclear SCF ubiquitin ligase complex(GO:0043224) |
| 0.2 | 0.8 | GO:1990425 | ryanodine receptor complex(GO:1990425) |
| 0.2 | 2.6 | GO:0033010 | paranodal junction(GO:0033010) |
| 0.2 | 0.8 | GO:0002193 | MAML1-RBP-Jkappa- ICN1 complex(GO:0002193) |
| 0.2 | 1.5 | GO:0005827 | polar microtubule(GO:0005827) |
| 0.2 | 0.6 | GO:0000333 | telomerase catalytic core complex(GO:0000333) |
| 0.2 | 2.7 | GO:0017146 | NMDA selective glutamate receptor complex(GO:0017146) |
| 0.2 | 0.5 | GO:0097450 | astrocyte end-foot(GO:0097450) |
| 0.2 | 1.1 | GO:0031467 | Cul7-RING ubiquitin ligase complex(GO:0031467) |
| 0.2 | 0.8 | GO:0070876 | SOSS complex(GO:0070876) |
| 0.2 | 0.9 | GO:0034274 | Atg12-Atg5-Atg16 complex(GO:0034274) |
| 0.2 | 0.6 | GO:0055087 | Ski complex(GO:0055087) |
| 0.1 | 0.4 | GO:0005674 | transcription factor TFIIF complex(GO:0005674) |
| 0.1 | 0.7 | GO:0060200 | clathrin-sculpted acetylcholine transport vesicle(GO:0060200) clathrin-sculpted acetylcholine transport vesicle membrane(GO:0060201) |
| 0.1 | 0.6 | GO:0097196 | Shu complex(GO:0097196) |
| 0.1 | 3.6 | GO:0005686 | U2 snRNP(GO:0005686) |
| 0.1 | 0.9 | GO:0045323 | interleukin-1 receptor complex(GO:0045323) |
| 0.1 | 2.3 | GO:0031209 | SCAR complex(GO:0031209) |
| 0.1 | 0.6 | GO:0016939 | kinesin II complex(GO:0016939) |
| 0.1 | 0.4 | GO:1902636 | kinociliary basal body(GO:1902636) |
| 0.1 | 0.4 | GO:0097598 | sperm cytoplasmic droplet(GO:0097598) |
| 0.1 | 1.6 | GO:1990316 | ATG1/ULK1 kinase complex(GO:1990316) |
| 0.1 | 0.4 | GO:0072563 | endothelial microparticle(GO:0072563) |
| 0.1 | 0.9 | GO:0042589 | zymogen granule membrane(GO:0042589) |
| 0.1 | 1.6 | GO:0035985 | senescence-associated heterochromatin focus(GO:0035985) |
| 0.1 | 0.7 | GO:0032021 | NELF complex(GO:0032021) |
| 0.1 | 0.5 | GO:0031302 | intrinsic component of endosome membrane(GO:0031302) |
| 0.1 | 0.9 | GO:0005947 | mitochondrial alpha-ketoglutarate dehydrogenase complex(GO:0005947) |
| 0.1 | 0.5 | GO:0060187 | cell pole(GO:0060187) |
| 0.1 | 2.3 | GO:0090543 | Flemming body(GO:0090543) |
| 0.1 | 0.9 | GO:0089701 | U2AF(GO:0089701) |
| 0.1 | 0.7 | GO:0030981 | cortical microtubule cytoskeleton(GO:0030981) |
| 0.1 | 0.4 | GO:0044753 | amphisome(GO:0044753) |
| 0.1 | 3.1 | GO:0030992 | intraciliary transport particle B(GO:0030992) |
| 0.1 | 0.4 | GO:0071203 | WASH complex(GO:0071203) |
| 0.1 | 0.7 | GO:0098837 | postsynaptic recycling endosome(GO:0098837) |
| 0.1 | 1.2 | GO:0000322 | storage vacuole(GO:0000322) |
| 0.1 | 0.5 | GO:0034751 | aryl hydrocarbon receptor complex(GO:0034751) |
| 0.1 | 0.5 | GO:0005713 | recombination nodule(GO:0005713) |
| 0.1 | 3.1 | GO:0031083 | BLOC-1 complex(GO:0031083) |
| 0.1 | 0.8 | GO:1990635 | proximal dendrite(GO:1990635) |
| 0.1 | 0.4 | GO:0097165 | nuclear stress granule(GO:0097165) |
| 0.1 | 0.8 | GO:0045298 | tubulin complex(GO:0045298) |
| 0.1 | 1.0 | GO:0071546 | pi-body(GO:0071546) |
| 0.1 | 1.2 | GO:0005750 | mitochondrial respiratory chain complex III(GO:0005750) respiratory chain complex III(GO:0045275) |
| 0.1 | 6.9 | GO:0019005 | SCF ubiquitin ligase complex(GO:0019005) |
| 0.1 | 13.4 | GO:0005814 | centriole(GO:0005814) |
| 0.1 | 1.1 | GO:0070531 | BRCA1-A complex(GO:0070531) |
| 0.1 | 3.6 | GO:0032391 | photoreceptor connecting cilium(GO:0032391) |
| 0.1 | 1.5 | GO:0000242 | pericentriolar material(GO:0000242) |
| 0.1 | 0.6 | GO:0044614 | nuclear pore cytoplasmic filaments(GO:0044614) |
| 0.1 | 1.5 | GO:0030008 | TRAPP complex(GO:0030008) |
| 0.1 | 0.7 | GO:0032133 | chromosome passenger complex(GO:0032133) |
| 0.1 | 2.7 | GO:0033268 | node of Ranvier(GO:0033268) |
| 0.1 | 0.4 | GO:0032044 | DSIF complex(GO:0032044) |
| 0.1 | 1.6 | GO:0005902 | microvillus(GO:0005902) |
| 0.1 | 1.0 | GO:0000439 | core TFIIH complex(GO:0000439) |
| 0.1 | 0.8 | GO:0036157 | outer dynein arm(GO:0036157) |
| 0.1 | 0.9 | GO:0033588 | Elongator holoenzyme complex(GO:0033588) |
| 0.1 | 7.2 | GO:0032154 | cleavage furrow(GO:0032154) cell surface furrow(GO:0097610) |
| 0.1 | 0.4 | GO:0020016 | ciliary pocket(GO:0020016) ciliary pocket membrane(GO:0020018) |
| 0.1 | 1.1 | GO:0031595 | nuclear proteasome complex(GO:0031595) |
| 0.1 | 0.4 | GO:0005899 | insulin receptor complex(GO:0005899) |
| 0.1 | 0.9 | GO:0043190 | ATP-binding cassette (ABC) transporter complex(GO:0043190) |
| 0.1 | 0.2 | GO:0032302 | MutSbeta complex(GO:0032302) |
| 0.1 | 0.4 | GO:0042643 | actomyosin, actin portion(GO:0042643) |
| 0.1 | 0.4 | GO:0032389 | MutLalpha complex(GO:0032389) |
| 0.1 | 0.3 | GO:0005726 | perichromatin fibrils(GO:0005726) |
| 0.1 | 0.4 | GO:0030906 | retromer, cargo-selective complex(GO:0030906) |
| 0.1 | 1.2 | GO:0000815 | ESCRT III complex(GO:0000815) |
| 0.1 | 0.5 | GO:1902560 | GMP reductase complex(GO:1902560) |
| 0.1 | 4.8 | GO:0016235 | aggresome(GO:0016235) |
| 0.1 | 0.6 | GO:0005869 | dynactin complex(GO:0005869) |
| 0.1 | 0.6 | GO:0005742 | mitochondrial outer membrane translocase complex(GO:0005742) |
| 0.1 | 2.6 | GO:0043189 | NuA4 histone acetyltransferase complex(GO:0035267) H4/H2A histone acetyltransferase complex(GO:0043189) H4 histone acetyltransferase complex(GO:1902562) |
| 0.1 | 0.6 | GO:0071986 | Ragulator complex(GO:0071986) |
| 0.1 | 0.7 | GO:0035749 | myelin sheath adaxonal region(GO:0035749) |
| 0.1 | 0.4 | GO:0030991 | intraciliary transport particle A(GO:0030991) |
| 0.1 | 2.9 | GO:0008023 | transcription elongation factor complex(GO:0008023) |
| 0.1 | 0.7 | GO:0000445 | THO complex(GO:0000347) THO complex part of transcription export complex(GO:0000445) |
| 0.1 | 0.4 | GO:0033263 | CORVET complex(GO:0033263) |
| 0.1 | 0.5 | GO:0030915 | Smc5-Smc6 complex(GO:0030915) |
| 0.1 | 0.7 | GO:0044233 | ER-mitochondrion membrane contact site(GO:0044233) |
| 0.1 | 0.2 | GO:0043291 | RAVE complex(GO:0043291) |
| 0.1 | 1.6 | GO:0031011 | Ino80 complex(GO:0031011) DNA helicase complex(GO:0033202) |
| 0.1 | 0.4 | GO:0097346 | INO80-type complex(GO:0097346) |
| 0.1 | 0.8 | GO:0030127 | COPII vesicle coat(GO:0030127) |
| 0.1 | 0.4 | GO:1990769 | proximal neuron projection(GO:1990769) |
| 0.1 | 0.2 | GO:0070436 | Grb2-EGFR complex(GO:0070436) |
| 0.1 | 0.7 | GO:0008290 | F-actin capping protein complex(GO:0008290) |
| 0.1 | 2.1 | GO:0005921 | gap junction(GO:0005921) |
| 0.1 | 0.9 | GO:0031618 | nuclear pericentric heterochromatin(GO:0031618) |
| 0.1 | 2.0 | GO:0080008 | Cul4-RING E3 ubiquitin ligase complex(GO:0080008) |
| 0.1 | 1.1 | GO:0030904 | retromer complex(GO:0030904) |
| 0.1 | 0.5 | GO:0000109 | nucleotide-excision repair complex(GO:0000109) |
| 0.1 | 0.7 | GO:0044666 | MLL3/4 complex(GO:0044666) |
| 0.1 | 0.7 | GO:0000153 | cytoplasmic ubiquitin ligase complex(GO:0000153) |
| 0.1 | 0.4 | GO:0032437 | cuticular plate(GO:0032437) |
| 0.1 | 0.4 | GO:0031462 | Cul2-RING ubiquitin ligase complex(GO:0031462) |
| 0.1 | 3.9 | GO:0030670 | phagocytic vesicle membrane(GO:0030670) |
| 0.0 | 0.8 | GO:0005689 | U12-type spliceosomal complex(GO:0005689) |
| 0.0 | 0.2 | GO:0005832 | chaperonin-containing T-complex(GO:0005832) |
| 0.0 | 0.2 | GO:0005965 | protein farnesyltransferase complex(GO:0005965) |
| 0.0 | 1.0 | GO:0031588 | nucleotide-activated protein kinase complex(GO:0031588) |
| 0.0 | 0.7 | GO:0000940 | condensed chromosome outer kinetochore(GO:0000940) |
| 0.0 | 0.1 | GO:0070938 | contractile ring(GO:0070938) |
| 0.0 | 0.4 | GO:0043196 | varicosity(GO:0043196) |
| 0.0 | 0.3 | GO:0031616 | spindle pole centrosome(GO:0031616) |
| 0.0 | 0.1 | GO:0071159 | NF-kappaB complex(GO:0071159) |
| 0.0 | 0.3 | GO:0030870 | Mre11 complex(GO:0030870) |
| 0.0 | 0.5 | GO:0005790 | smooth endoplasmic reticulum(GO:0005790) |
| 0.0 | 1.2 | GO:0070971 | endoplasmic reticulum exit site(GO:0070971) |
| 0.0 | 0.8 | GO:0071141 | SMAD protein complex(GO:0071141) |
| 0.0 | 4.7 | GO:0005905 | clathrin-coated pit(GO:0005905) |
| 0.0 | 0.2 | GO:0005896 | interleukin-6 receptor complex(GO:0005896) |
| 0.0 | 0.2 | GO:0031501 | mannosyltransferase complex(GO:0031501) |
| 0.0 | 0.3 | GO:0097361 | CIA complex(GO:0097361) |
| 0.0 | 2.4 | GO:0031904 | endosome lumen(GO:0031904) |
| 0.0 | 0.2 | GO:0030868 | smooth endoplasmic reticulum membrane(GO:0030868) smooth endoplasmic reticulum part(GO:0097425) |
| 0.0 | 0.1 | GO:0030289 | protein phosphatase 4 complex(GO:0030289) |
| 0.0 | 0.2 | GO:0070761 | pre-snoRNP complex(GO:0070761) |
| 0.0 | 0.2 | GO:0005863 | striated muscle myosin thick filament(GO:0005863) |
| 0.0 | 0.6 | GO:0042405 | nuclear inclusion body(GO:0042405) |
| 0.0 | 0.2 | GO:0016222 | procollagen-proline 4-dioxygenase complex(GO:0016222) |
| 0.0 | 1.2 | GO:0035098 | ESC/E(Z) complex(GO:0035098) |
| 0.0 | 2.8 | GO:0005747 | mitochondrial respiratory chain complex I(GO:0005747) NADH dehydrogenase complex(GO:0030964) respiratory chain complex I(GO:0045271) |
| 0.0 | 0.5 | GO:0019773 | proteasome core complex, alpha-subunit complex(GO:0019773) |
| 0.0 | 0.2 | GO:0031205 | endoplasmic reticulum Sec complex(GO:0031205) |
| 0.0 | 0.3 | GO:0036020 | endolysosome membrane(GO:0036020) |
| 0.0 | 1.6 | GO:0016592 | mediator complex(GO:0016592) |
| 0.0 | 3.8 | GO:0000777 | condensed chromosome kinetochore(GO:0000777) |
| 0.0 | 0.4 | GO:0016342 | catenin complex(GO:0016342) |
| 0.0 | 0.3 | GO:0035869 | ciliary transition zone(GO:0035869) |
| 0.0 | 0.4 | GO:0005786 | signal recognition particle, endoplasmic reticulum targeting(GO:0005786) |
| 0.0 | 0.7 | GO:0043218 | compact myelin(GO:0043218) |
| 0.0 | 0.1 | GO:0005846 | nuclear cap binding complex(GO:0005846) |
| 0.0 | 2.5 | GO:0022627 | cytosolic small ribosomal subunit(GO:0022627) |
| 0.0 | 0.7 | GO:0005885 | Arp2/3 protein complex(GO:0005885) |
| 0.0 | 0.1 | GO:0005850 | eukaryotic translation initiation factor 2 complex(GO:0005850) |
| 0.0 | 0.5 | GO:0005844 | polysome(GO:0005844) |
| 0.0 | 0.3 | GO:0033165 | interphotoreceptor matrix(GO:0033165) |
| 0.0 | 0.8 | GO:0000407 | pre-autophagosomal structure(GO:0000407) |
| 0.0 | 0.6 | GO:0034451 | centriolar satellite(GO:0034451) |
| 0.0 | 0.3 | GO:0016602 | CCAAT-binding factor complex(GO:0016602) |
| 0.0 | 1.6 | GO:0005881 | cytoplasmic microtubule(GO:0005881) |
| 0.0 | 0.3 | GO:0016011 | dystroglycan complex(GO:0016011) sarcoglycan complex(GO:0016012) |
| 0.0 | 1.1 | GO:0005859 | muscle myosin complex(GO:0005859) |
| 0.0 | 0.3 | GO:0097431 | mitotic spindle pole(GO:0097431) |
| 0.0 | 0.1 | GO:0005943 | phosphatidylinositol 3-kinase complex, class IA(GO:0005943) |
| 0.0 | 0.5 | GO:0005682 | U5 snRNP(GO:0005682) |
| 0.0 | 0.5 | GO:0008385 | IkappaB kinase complex(GO:0008385) |
| 0.0 | 0.8 | GO:0071339 | MLL1/2 complex(GO:0044665) MLL1 complex(GO:0071339) |
| 0.0 | 0.2 | GO:0000015 | phosphopyruvate hydratase complex(GO:0000015) |
| 0.0 | 0.6 | GO:0032591 | dendritic spine membrane(GO:0032591) |
| 0.0 | 0.2 | GO:0065010 | extracellular membrane-bounded organelle(GO:0065010) |
| 0.0 | 0.3 | GO:0000137 | Golgi cis cisterna(GO:0000137) |
| 0.0 | 0.2 | GO:0005956 | protein kinase CK2 complex(GO:0005956) |
| 0.0 | 0.2 | GO:0030123 | AP-3 adaptor complex(GO:0030123) |
| 0.0 | 0.9 | GO:0031258 | lamellipodium membrane(GO:0031258) |
| 0.0 | 0.2 | GO:0042719 | mitochondrial intermembrane space protein transporter complex(GO:0042719) |
| 0.0 | 3.3 | GO:0000932 | cytoplasmic mRNA processing body(GO:0000932) |
| 0.0 | 0.3 | GO:0000930 | gamma-tubulin complex(GO:0000930) |
| 0.0 | 1.2 | GO:0031201 | SNARE complex(GO:0031201) |
| 0.0 | 0.1 | GO:0032593 | insulin-responsive compartment(GO:0032593) |
| 0.0 | 0.2 | GO:0070852 | cell body fiber(GO:0070852) |
| 0.0 | 0.2 | GO:0001940 | male pronucleus(GO:0001940) |
| 0.0 | 1.9 | GO:0005776 | autophagosome(GO:0005776) |
| 0.0 | 1.2 | GO:0014704 | intercalated disc(GO:0014704) |
| 0.0 | 0.7 | GO:0000795 | synaptonemal complex(GO:0000795) |
| 0.0 | 1.4 | GO:0043198 | dendritic shaft(GO:0043198) |
| 0.0 | 0.5 | GO:0071782 | endoplasmic reticulum tubular network(GO:0071782) |
| 0.0 | 0.1 | GO:0032311 | angiogenin-PRI complex(GO:0032311) |
| 0.0 | 1.4 | GO:0031907 | peroxisomal matrix(GO:0005782) microbody lumen(GO:0031907) |
| 0.0 | 0.1 | GO:0019008 | molybdopterin synthase complex(GO:0019008) |
| 0.0 | 0.7 | GO:0031519 | PcG protein complex(GO:0031519) |
| 0.0 | 2.6 | GO:0005815 | microtubule organizing center(GO:0005815) |
| 0.0 | 0.9 | GO:0072686 | mitotic spindle(GO:0072686) |
| 0.0 | 1.0 | GO:0008180 | COP9 signalosome(GO:0008180) |
| 0.0 | 1.5 | GO:0000315 | organellar large ribosomal subunit(GO:0000315) mitochondrial large ribosomal subunit(GO:0005762) |
| 0.0 | 0.3 | GO:0033180 | proton-transporting V-type ATPase, V1 domain(GO:0033180) |
| 0.0 | 0.2 | GO:0005641 | nuclear envelope lumen(GO:0005641) |
| 0.0 | 0.2 | GO:0043240 | Fanconi anaemia nuclear complex(GO:0043240) |
| 0.0 | 0.3 | GO:0005753 | mitochondrial proton-transporting ATP synthase complex(GO:0005753) |
| 0.0 | 1.4 | GO:0031970 | organelle envelope lumen(GO:0031970) |
| 0.0 | 1.6 | GO:0005811 | lipid particle(GO:0005811) |
| 0.0 | 0.9 | GO:0043195 | terminal bouton(GO:0043195) |
| 0.0 | 0.2 | GO:0032045 | guanyl-nucleotide exchange factor complex(GO:0032045) |
| 0.0 | 0.7 | GO:0000159 | protein phosphatase type 2A complex(GO:0000159) |
| 0.0 | 2.1 | GO:0042579 | peroxisome(GO:0005777) microbody(GO:0042579) |
| 0.0 | 0.2 | GO:0035686 | sperm fibrous sheath(GO:0035686) |
| 0.0 | 0.2 | GO:0005577 | fibrinogen complex(GO:0005577) |
| 0.0 | 0.4 | GO:0005839 | proteasome core complex(GO:0005839) |
| 0.0 | 0.2 | GO:0044327 | dendritic spine head(GO:0044327) |
| 0.0 | 0.2 | GO:0000808 | origin recognition complex(GO:0000808) nuclear origin of replication recognition complex(GO:0005664) |
| 0.0 | 0.5 | GO:0005876 | spindle microtubule(GO:0005876) |
| 0.0 | 0.2 | GO:0005833 | hemoglobin complex(GO:0005833) |
| 0.0 | 0.2 | GO:0016013 | syntrophin complex(GO:0016013) |
| 0.0 | 0.5 | GO:0097546 | ciliary base(GO:0097546) |
| 0.0 | 0.1 | GO:0035976 | AP1 complex(GO:0035976) |
| 0.0 | 2.7 | GO:0005924 | cell-substrate adherens junction(GO:0005924) focal adhesion(GO:0005925) cell-substrate junction(GO:0030055) |
| 0.0 | 0.2 | GO:0035145 | exon-exon junction complex(GO:0035145) |
| 0.0 | 1.2 | GO:1990904 | ribonucleoprotein complex(GO:1990904) |
| 0.0 | 1.1 | GO:0030864 | cortical actin cytoskeleton(GO:0030864) |
| 0.0 | 2.6 | GO:0030027 | lamellipodium(GO:0030027) |
| 0.0 | 0.4 | GO:0005680 | anaphase-promoting complex(GO:0005680) |
| 0.0 | 0.1 | GO:0098554 | cytoplasmic side of endoplasmic reticulum membrane(GO:0098554) |
| 0.0 | 0.4 | GO:0031304 | intrinsic component of mitochondrial inner membrane(GO:0031304) integral component of mitochondrial inner membrane(GO:0031305) |
| 0.0 | 0.3 | GO:0035861 | site of double-strand break(GO:0035861) |
| 0.0 | 0.2 | GO:0000788 | nuclear nucleosome(GO:0000788) |
| 0.0 | 0.2 | GO:0017119 | Golgi transport complex(GO:0017119) |
| 0.0 | 0.1 | GO:0000172 | ribonuclease MRP complex(GO:0000172) |
| 0.0 | 0.1 | GO:0001673 | male germ cell nucleus(GO:0001673) |
| 0.0 | 0.5 | GO:0032420 | stereocilium(GO:0032420) |
| 0.0 | 0.0 | GO:0036396 | MIS complex(GO:0036396) mRNA editing complex(GO:0045293) |
| 0.0 | 0.1 | GO:0044291 | cell-cell contact zone(GO:0044291) |
| 0.0 | 1.3 | GO:0001669 | acrosomal vesicle(GO:0001669) |
| 0.0 | 0.2 | GO:0046930 | pore complex(GO:0046930) |
Gene overrepresentation in molecular_function category:
| Log-likelihood per target | Total log-likelihood | Term | Description |
|---|---|---|---|
| 1.1 | 3.4 | GO:0045127 | N-acetylglucosamine kinase activity(GO:0045127) |
| 0.9 | 5.6 | GO:0008321 | Ral guanyl-nucleotide exchange factor activity(GO:0008321) |
| 0.6 | 3.7 | GO:0051022 | GDP-dissociation inhibitor binding(GO:0051021) Rho GDP-dissociation inhibitor binding(GO:0051022) |
| 0.6 | 2.5 | GO:0016404 | 15-hydroxyprostaglandin dehydrogenase (NAD+) activity(GO:0016404) |
| 0.6 | 4.9 | GO:0032554 | purine deoxyribonucleotide binding(GO:0032554) |
| 0.5 | 1.6 | GO:0031071 | cysteine desulfurase activity(GO:0031071) |
| 0.5 | 1.4 | GO:0035034 | histone acetyltransferase regulator activity(GO:0035034) |
| 0.4 | 1.6 | GO:0005477 | pyruvate secondary active transmembrane transporter activity(GO:0005477) |
| 0.4 | 2.3 | GO:0070137 | ubiquitin-like protein-specific endopeptidase activity(GO:0070137) SUMO-specific endopeptidase activity(GO:0070139) |
| 0.4 | 1.1 | GO:0004852 | uroporphyrinogen-III synthase activity(GO:0004852) |
| 0.4 | 1.1 | GO:0016649 | electron-transferring-flavoprotein dehydrogenase activity(GO:0004174) oxidoreductase activity, acting on the CH-NH group of donors, quinone or similar compound as acceptor(GO:0016649) |
| 0.4 | 1.1 | GO:0031859 | platelet activating factor receptor binding(GO:0031859) |
| 0.4 | 3.3 | GO:0008158 | hedgehog receptor activity(GO:0008158) |
| 0.4 | 1.1 | GO:0008798 | beta-aspartyl-peptidase activity(GO:0008798) |
| 0.3 | 2.7 | GO:0005087 | Ran guanyl-nucleotide exchange factor activity(GO:0005087) |
| 0.3 | 1.3 | GO:0031694 | alpha-2A adrenergic receptor binding(GO:0031694) |
| 0.3 | 0.9 | GO:0003863 | alpha-ketoacid dehydrogenase activity(GO:0003826) 3-methyl-2-oxobutanoate dehydrogenase (2-methylpropanoyl-transferring) activity(GO:0003863) |
| 0.3 | 0.9 | GO:0086062 | voltage-gated sodium channel activity involved in Purkinje myocyte action potential(GO:0086062) |
| 0.3 | 0.9 | GO:0001716 | L-amino-acid oxidase activity(GO:0001716) |
| 0.3 | 1.8 | GO:0035402 | histone kinase activity (H3-T11 specific)(GO:0035402) |
| 0.3 | 0.9 | GO:0015439 | heme-transporting ATPase activity(GO:0015439) |
| 0.3 | 0.9 | GO:0005150 | interleukin-1, Type I receptor binding(GO:0005150) |
| 0.3 | 1.4 | GO:0016933 | extracellular-glycine-gated ion channel activity(GO:0016933) extracellular-glycine-gated chloride channel activity(GO:0016934) |
| 0.3 | 3.9 | GO:0036122 | BMP binding(GO:0036122) |
| 0.3 | 2.4 | GO:0005143 | interleukin-12 receptor binding(GO:0005143) |
| 0.3 | 0.8 | GO:0031531 | thyrotropin-releasing hormone receptor binding(GO:0031531) |
| 0.3 | 1.6 | GO:0019776 | Atg8 ligase activity(GO:0019776) |
| 0.3 | 0.8 | GO:0003986 | acetyl-CoA hydrolase activity(GO:0003986) |
| 0.3 | 0.8 | GO:0047661 | racemase and epimerase activity, acting on amino acids and derivatives(GO:0016855) racemase activity, acting on amino acids and derivatives(GO:0036361) amino-acid racemase activity(GO:0047661) |
| 0.2 | 1.0 | GO:0047066 | phospholipid-hydroperoxide glutathione peroxidase activity(GO:0047066) |
| 0.2 | 1.4 | GO:0003873 | 6-phosphofructo-2-kinase activity(GO:0003873) fructose-2,6-bisphosphate 2-phosphatase activity(GO:0004331) |
| 0.2 | 0.9 | GO:0004782 | sulfinoalanine decarboxylase activity(GO:0004782) |
| 0.2 | 1.4 | GO:0043515 | kinetochore binding(GO:0043515) |
| 0.2 | 0.9 | GO:0016639 | oxidoreductase activity, acting on the CH-NH2 group of donors, NAD or NADP as acceptor(GO:0016639) |
| 0.2 | 0.7 | GO:0052810 | 1-phosphatidylinositol-5-kinase activity(GO:0052810) |
| 0.2 | 1.2 | GO:0003998 | acylphosphatase activity(GO:0003998) |
| 0.2 | 2.6 | GO:0016290 | palmitoyl-CoA hydrolase activity(GO:0016290) |
| 0.2 | 1.0 | GO:0004306 | ethanolamine-phosphate cytidylyltransferase activity(GO:0004306) |
| 0.2 | 0.6 | GO:0043739 | G/U mismatch-specific uracil-DNA glycosylase activity(GO:0043739) |
| 0.2 | 0.9 | GO:0016929 | SUMO-specific protease activity(GO:0016929) |
| 0.2 | 0.8 | GO:0047708 | biotinidase activity(GO:0047708) |
| 0.2 | 0.7 | GO:0016532 | superoxide dismutase copper chaperone activity(GO:0016532) |
| 0.2 | 0.5 | GO:0005298 | proline:sodium symporter activity(GO:0005298) |
| 0.2 | 0.7 | GO:0017089 | glycolipid transporter activity(GO:0017089) |
| 0.2 | 1.2 | GO:0016681 | ubiquinol-cytochrome-c reductase activity(GO:0008121) oxidoreductase activity, acting on diphenols and related substances as donors, cytochrome as acceptor(GO:0016681) |
| 0.2 | 3.5 | GO:0004535 | poly(A)-specific ribonuclease activity(GO:0004535) |
| 0.2 | 0.6 | GO:0099609 | microtubule lateral binding(GO:0099609) |
| 0.2 | 0.5 | GO:0004157 | dihydropyrimidinase activity(GO:0004157) |
| 0.2 | 1.2 | GO:0030628 | pre-mRNA 3'-splice site binding(GO:0030628) |
| 0.1 | 0.9 | GO:0004839 | ubiquitin activating enzyme activity(GO:0004839) |
| 0.1 | 0.4 | GO:0005483 | soluble NSF attachment protein activity(GO:0005483) |
| 0.1 | 0.7 | GO:0009055 | electron carrier activity(GO:0009055) |
| 0.1 | 0.4 | GO:0010309 | acireductone dioxygenase [iron(II)-requiring] activity(GO:0010309) |
| 0.1 | 0.4 | GO:0035403 | histone kinase activity (H3-T6 specific)(GO:0035403) |
| 0.1 | 0.6 | GO:0071209 | U7 snRNA binding(GO:0071209) |
| 0.1 | 0.6 | GO:0000822 | inositol hexakisphosphate binding(GO:0000822) |
| 0.1 | 0.4 | GO:0017057 | 6-phosphogluconolactonase activity(GO:0017057) |
| 0.1 | 0.4 | GO:0070260 | tyrosyl-RNA phosphodiesterase activity(GO:0036317) 5'-tyrosyl-DNA phosphodiesterase activity(GO:0070260) |
| 0.1 | 0.7 | GO:0033857 | diphosphoinositol-pentakisphosphate kinase activity(GO:0033857) |
| 0.1 | 0.4 | GO:0070888 | E-box binding(GO:0070888) |
| 0.1 | 0.5 | GO:0004616 | phosphogluconate dehydrogenase (decarboxylating) activity(GO:0004616) |
| 0.1 | 2.9 | GO:0004861 | cyclin-dependent protein serine/threonine kinase inhibitor activity(GO:0004861) |
| 0.1 | 6.9 | GO:0044769 | ATPase activity, coupled to transmembrane movement of ions, rotational mechanism(GO:0044769) |
| 0.1 | 0.4 | GO:0033149 | FFAT motif binding(GO:0033149) |
| 0.1 | 0.6 | GO:0008073 | ornithine decarboxylase inhibitor activity(GO:0008073) |
| 0.1 | 0.8 | GO:0004169 | dolichyl-phosphate-mannose-protein mannosyltransferase activity(GO:0004169) |
| 0.1 | 1.4 | GO:0031995 | insulin-like growth factor II binding(GO:0031995) |
| 0.1 | 0.9 | GO:0030060 | L-malate dehydrogenase activity(GO:0030060) |
| 0.1 | 1.4 | GO:0035242 | protein-arginine omega-N asymmetric methyltransferase activity(GO:0035242) |
| 0.1 | 0.7 | GO:0030348 | syntaxin-3 binding(GO:0030348) |
| 0.1 | 1.1 | GO:0008440 | inositol-1,4,5-trisphosphate 3-kinase activity(GO:0008440) |
| 0.1 | 0.8 | GO:0032138 | single base insertion or deletion binding(GO:0032138) |
| 0.1 | 4.3 | GO:0003887 | DNA-directed DNA polymerase activity(GO:0003887) |
| 0.1 | 0.8 | GO:0051425 | PTB domain binding(GO:0051425) |
| 0.1 | 0.3 | GO:0019961 | interferon binding(GO:0019961) |
| 0.1 | 0.4 | GO:0061628 | H3K27me3 modified histone binding(GO:0061628) |
| 0.1 | 0.5 | GO:0042954 | apolipoprotein receptor activity(GO:0030226) lipoprotein transporter activity(GO:0042954) |
| 0.1 | 0.6 | GO:0039552 | RIG-I binding(GO:0039552) |
| 0.1 | 0.3 | GO:0090541 | MIT domain binding(GO:0090541) |
| 0.1 | 1.5 | GO:0047134 | protein-disulfide reductase activity(GO:0047134) |
| 0.1 | 0.4 | GO:0008184 | glycogen phosphorylase activity(GO:0008184) |
| 0.1 | 0.3 | GO:0017116 | single-stranded DNA-dependent ATP-dependent DNA helicase activity(GO:0017116) DNA/RNA helicase activity(GO:0033677) |
| 0.1 | 1.1 | GO:0070181 | small ribosomal subunit rRNA binding(GO:0070181) |
| 0.1 | 1.1 | GO:0003909 | DNA ligase activity(GO:0003909) |
| 0.1 | 1.0 | GO:0015288 | porin activity(GO:0015288) |
| 0.1 | 1.1 | GO:0051525 | NFAT protein binding(GO:0051525) |
| 0.1 | 1.2 | GO:0097100 | supercoiled DNA binding(GO:0097100) |
| 0.1 | 0.6 | GO:0016717 | oxidoreductase activity, acting on paired donors, with oxidation of a pair of donors resulting in the reduction of molecular oxygen to two molecules of water(GO:0016717) |
| 0.1 | 0.3 | GO:0005173 | stem cell factor receptor binding(GO:0005173) |
| 0.1 | 0.3 | GO:0051537 | 2 iron, 2 sulfur cluster binding(GO:0051537) |
| 0.1 | 0.3 | GO:0045322 | unmethylated CpG binding(GO:0045322) |
| 0.1 | 1.3 | GO:0070410 | co-SMAD binding(GO:0070410) |
| 0.1 | 0.8 | GO:0016206 | catechol O-methyltransferase activity(GO:0016206) |
| 0.1 | 0.5 | GO:0004045 | aminoacyl-tRNA hydrolase activity(GO:0004045) |
| 0.1 | 0.4 | GO:0008113 | peptide-methionine (S)-S-oxide reductase activity(GO:0008113) |
| 0.1 | 0.8 | GO:0019788 | NEDD8 transferase activity(GO:0019788) |
| 0.1 | 0.6 | GO:0004534 | 5'-3' exoribonuclease activity(GO:0004534) |
| 0.1 | 0.2 | GO:0034046 | poly(G) binding(GO:0034046) |
| 0.1 | 2.6 | GO:0030296 | protein tyrosine kinase activator activity(GO:0030296) |
| 0.1 | 1.5 | GO:0048156 | tau protein binding(GO:0048156) |
| 0.1 | 0.7 | GO:0015093 | ferrous iron transmembrane transporter activity(GO:0015093) |
| 0.1 | 0.4 | GO:0004066 | asparagine synthase (glutamine-hydrolyzing) activity(GO:0004066) |
| 0.1 | 0.5 | GO:0003920 | GMP reductase activity(GO:0003920) oxidoreductase activity, acting on NAD(P)H, nitrogenous group as acceptor(GO:0016657) |
| 0.1 | 0.3 | GO:0016230 | sphingomyelin phosphodiesterase activator activity(GO:0016230) |
| 0.1 | 0.2 | GO:0061752 | telomeric repeat-containing RNA binding(GO:0061752) |
| 0.1 | 0.2 | GO:0015131 | thiosulfate transmembrane transporter activity(GO:0015117) oxaloacetate transmembrane transporter activity(GO:0015131) |
| 0.1 | 3.5 | GO:0005484 | SNAP receptor activity(GO:0005484) |
| 0.1 | 0.3 | GO:0050833 | pyruvate transmembrane transporter activity(GO:0050833) |
| 0.1 | 0.2 | GO:0032137 | guanine/thymine mispair binding(GO:0032137) |
| 0.1 | 0.1 | GO:0070259 | tyrosyl-DNA phosphodiesterase activity(GO:0070259) |
| 0.1 | 7.5 | GO:0008307 | structural constituent of muscle(GO:0008307) |
| 0.1 | 2.5 | GO:0004198 | calcium-dependent cysteine-type endopeptidase activity(GO:0004198) |
| 0.1 | 2.0 | GO:0005086 | ARF guanyl-nucleotide exchange factor activity(GO:0005086) |
| 0.1 | 0.2 | GO:0004416 | hydroxyacylglutathione hydrolase activity(GO:0004416) |
| 0.1 | 1.3 | GO:0035259 | glucocorticoid receptor binding(GO:0035259) |
| 0.1 | 0.3 | GO:0035515 | oxidative RNA demethylase activity(GO:0035515) |
| 0.1 | 1.4 | GO:0097602 | cullin family protein binding(GO:0097602) |
| 0.1 | 0.2 | GO:0019166 | trans-2-enoyl-CoA reductase (NADPH) activity(GO:0019166) |
| 0.1 | 5.4 | GO:0019003 | GDP binding(GO:0019003) |
| 0.1 | 0.5 | GO:0043533 | inositol 1,3,4,5 tetrakisphosphate binding(GO:0043533) |
| 0.1 | 0.2 | GO:0010858 | calcium-dependent protein kinase inhibitor activity(GO:0008427) calcium-dependent protein kinase regulator activity(GO:0010858) |
| 0.1 | 0.8 | GO:0005072 | transforming growth factor beta receptor, cytoplasmic mediator activity(GO:0005072) |
| 0.1 | 0.4 | GO:0033192 | calmodulin-dependent protein phosphatase activity(GO:0033192) |
| 0.1 | 0.2 | GO:0015173 | aromatic amino acid transmembrane transporter activity(GO:0015173) |
| 0.1 | 0.4 | GO:0004430 | 1-phosphatidylinositol 4-kinase activity(GO:0004430) |
| 0.1 | 0.2 | GO:0005137 | interleukin-5 receptor binding(GO:0005137) |
| 0.1 | 0.4 | GO:0016866 | intramolecular transferase activity(GO:0016866) |
| 0.1 | 0.4 | GO:0050733 | RS domain binding(GO:0050733) |
| 0.1 | 0.7 | GO:0016538 | cyclin-dependent protein serine/threonine kinase regulator activity(GO:0016538) |
| 0.1 | 0.7 | GO:0005168 | neurotrophin TRKA receptor binding(GO:0005168) |
| 0.1 | 0.2 | GO:0051800 | phosphatidylinositol-3,4,5-trisphosphate 3-phosphatase activity(GO:0016314) phosphatidylinositol-3,4-bisphosphate 3-phosphatase activity(GO:0051800) |
| 0.1 | 0.4 | GO:0004301 | epoxide hydrolase activity(GO:0004301) |
| 0.1 | 1.0 | GO:0004017 | adenylate kinase activity(GO:0004017) |
| 0.1 | 0.6 | GO:0031386 | protein tag(GO:0031386) |
| 0.1 | 1.9 | GO:0031434 | mitogen-activated protein kinase kinase binding(GO:0031434) |
| 0.1 | 0.6 | GO:0019211 | phosphatase activator activity(GO:0019211) |
| 0.1 | 0.3 | GO:0031996 | thioesterase binding(GO:0031996) |
| 0.1 | 0.5 | GO:1901612 | cardiolipin binding(GO:1901612) |
| 0.1 | 0.8 | GO:0017162 | aryl hydrocarbon receptor binding(GO:0017162) |
| 0.1 | 0.4 | GO:0015119 | hexose phosphate transmembrane transporter activity(GO:0015119) organophosphate:inorganic phosphate antiporter activity(GO:0015315) hexose-phosphate:inorganic phosphate antiporter activity(GO:0015526) glucose 6-phosphate:inorganic phosphate antiporter activity(GO:0061513) |
| 0.1 | 0.4 | GO:1990932 | 5.8S rRNA binding(GO:1990932) |
| 0.1 | 1.7 | GO:0005092 | GDP-dissociation inhibitor activity(GO:0005092) |
| 0.1 | 0.8 | GO:0034713 | type I transforming growth factor beta receptor binding(GO:0034713) |
| 0.1 | 0.3 | GO:0047617 | acyl-CoA hydrolase activity(GO:0047617) |
| 0.1 | 1.3 | GO:0019104 | DNA N-glycosylase activity(GO:0019104) |
| 0.1 | 0.6 | GO:0004197 | cysteine-type endopeptidase activity(GO:0004197) |
| 0.1 | 1.1 | GO:0045504 | dynein heavy chain binding(GO:0045504) |
| 0.1 | 1.3 | GO:0050811 | GABA receptor binding(GO:0050811) |
| 0.1 | 0.6 | GO:0003993 | acid phosphatase activity(GO:0003993) |
| 0.1 | 0.5 | GO:0004563 | beta-N-acetylhexosaminidase activity(GO:0004563) |
| 0.1 | 0.3 | GO:1904047 | S-adenosyl-L-methionine binding(GO:1904047) |
| 0.1 | 0.8 | GO:0016018 | cyclosporin A binding(GO:0016018) |
| 0.1 | 0.8 | GO:0031489 | myosin V binding(GO:0031489) |
| 0.1 | 0.4 | GO:0003956 | NAD(P)+-protein-arginine ADP-ribosyltransferase activity(GO:0003956) |
| 0.1 | 0.3 | GO:0033613 | activating transcription factor binding(GO:0033613) |
| 0.1 | 1.0 | GO:0008253 | 5'-nucleotidase activity(GO:0008253) |
| 0.1 | 0.2 | GO:0031871 | proteinase activated receptor binding(GO:0031871) |
| 0.0 | 0.4 | GO:0003997 | acyl-CoA oxidase activity(GO:0003997) |
| 0.0 | 0.1 | GO:0016838 | carbon-oxygen lyase activity, acting on phosphates(GO:0016838) |
| 0.0 | 0.2 | GO:0004660 | protein farnesyltransferase activity(GO:0004660) |
| 0.0 | 0.7 | GO:0004865 | protein serine/threonine phosphatase inhibitor activity(GO:0004865) |
| 0.0 | 0.5 | GO:0004571 | mannosyl-oligosaccharide 1,2-alpha-mannosidase activity(GO:0004571) |
| 0.0 | 0.8 | GO:0004679 | AMP-activated protein kinase activity(GO:0004679) |
| 0.0 | 0.1 | GO:0015140 | malate transmembrane transporter activity(GO:0015140) |
| 0.0 | 1.2 | GO:0097200 | cysteine-type endopeptidase activity involved in execution phase of apoptosis(GO:0097200) |
| 0.0 | 0.7 | GO:0008143 | poly(A) binding(GO:0008143) |
| 0.0 | 0.4 | GO:0015266 | protein channel activity(GO:0015266) |
| 0.0 | 0.6 | GO:1990247 | N6-methyladenosine-containing RNA binding(GO:1990247) |
| 0.0 | 0.8 | GO:0005149 | interleukin-1 receptor binding(GO:0005149) |
| 0.0 | 0.4 | GO:0046870 | cadmium ion binding(GO:0046870) |
| 0.0 | 0.8 | GO:0070513 | death domain binding(GO:0070513) |
| 0.0 | 0.6 | GO:0034452 | dynactin binding(GO:0034452) |
| 0.0 | 0.4 | GO:0016721 | superoxide dismutase activity(GO:0004784) oxidoreductase activity, acting on superoxide radicals as acceptor(GO:0016721) |
| 0.0 | 1.0 | GO:0008574 | ATP-dependent microtubule motor activity, plus-end-directed(GO:0008574) |
| 0.0 | 2.5 | GO:0017022 | myosin binding(GO:0017022) |
| 0.0 | 3.0 | GO:0048365 | Rac GTPase binding(GO:0048365) |
| 0.0 | 0.3 | GO:1902444 | riboflavin binding(GO:1902444) |
| 0.0 | 0.2 | GO:0015199 | amino-acid betaine transmembrane transporter activity(GO:0015199) carnitine transmembrane transporter activity(GO:0015226) |
| 0.0 | 1.0 | GO:0000339 | RNA cap binding(GO:0000339) |
| 0.0 | 0.4 | GO:0055104 | ligase inhibitor activity(GO:0055104) ubiquitin ligase inhibitor activity(GO:1990948) |
| 0.0 | 1.4 | GO:0031210 | phosphatidylcholine binding(GO:0031210) |
| 0.0 | 0.2 | GO:0004337 | dimethylallyltranstransferase activity(GO:0004161) geranyltranstransferase activity(GO:0004337) |
| 0.0 | 0.4 | GO:0035877 | death effector domain binding(GO:0035877) |
| 0.0 | 0.5 | GO:0016594 | glycine binding(GO:0016594) |
| 0.0 | 0.3 | GO:0070740 | tubulin-glutamic acid ligase activity(GO:0070740) |
| 0.0 | 0.2 | GO:0047751 | 3-oxo-5-alpha-steroid 4-dehydrogenase activity(GO:0003865) steroid dehydrogenase activity, acting on the CH-CH group of donors(GO:0033765) cholestenone 5-alpha-reductase activity(GO:0047751) |
| 0.0 | 0.8 | GO:0019789 | SUMO transferase activity(GO:0019789) |
| 0.0 | 0.5 | GO:0000150 | recombinase activity(GO:0000150) |
| 0.0 | 0.5 | GO:0035374 | chondroitin sulfate binding(GO:0035374) |
| 0.0 | 0.4 | GO:0008327 | methyl-CpG binding(GO:0008327) |
| 0.0 | 1.7 | GO:0005164 | tumor necrosis factor receptor binding(GO:0005164) |
| 0.0 | 1.1 | GO:0004806 | triglyceride lipase activity(GO:0004806) |
| 0.0 | 0.7 | GO:0008409 | 5'-3' exonuclease activity(GO:0008409) |
| 0.0 | 2.7 | GO:0004674 | protein serine/threonine kinase activity(GO:0004674) |
| 0.0 | 0.7 | GO:0004707 | MAP kinase activity(GO:0004707) |
| 0.0 | 0.4 | GO:0035197 | siRNA binding(GO:0035197) |
| 0.0 | 0.7 | GO:0004065 | arylsulfatase activity(GO:0004065) |
| 0.0 | 0.3 | GO:1990226 | histone methyltransferase binding(GO:1990226) |
| 0.0 | 2.2 | GO:0050136 | NADH dehydrogenase (ubiquinone) activity(GO:0008137) NADH dehydrogenase (quinone) activity(GO:0050136) |
| 0.0 | 0.2 | GO:0008597 | calcium-dependent protein serine/threonine phosphatase regulator activity(GO:0008597) |
| 0.0 | 0.2 | GO:0004645 | phosphorylase activity(GO:0004645) |
| 0.0 | 0.1 | GO:0050815 | phosphoserine binding(GO:0050815) |
| 0.0 | 0.2 | GO:0017060 | 3-galactosyl-N-acetylglucosaminide 4-alpha-L-fucosyltransferase activity(GO:0017060) |
| 0.0 | 0.3 | GO:0034597 | phosphatidylinositol-4,5-bisphosphate 4-phosphatase activity(GO:0034597) |
| 0.0 | 0.1 | GO:0046921 | glycoprotein 6-alpha-L-fucosyltransferase activity(GO:0008424) alpha-(1->6)-fucosyltransferase activity(GO:0046921) |
| 0.0 | 0.3 | GO:0070878 | primary miRNA binding(GO:0070878) |
| 0.0 | 1.1 | GO:0000993 | RNA polymerase II core binding(GO:0000993) |
| 0.0 | 2.3 | GO:0004407 | histone deacetylase activity(GO:0004407) |
| 0.0 | 1.3 | GO:0035255 | ionotropic glutamate receptor binding(GO:0035255) |
| 0.0 | 0.3 | GO:0008353 | RNA polymerase II carboxy-terminal domain kinase activity(GO:0008353) |
| 0.0 | 0.1 | GO:0008428 | ribonuclease inhibitor activity(GO:0008428) |
| 0.0 | 0.4 | GO:0005068 | transmembrane receptor protein tyrosine kinase adaptor activity(GO:0005068) |
| 0.0 | 0.3 | GO:0036402 | proteasome-activating ATPase activity(GO:0036402) |
| 0.0 | 0.1 | GO:0004090 | carbonyl reductase (NADPH) activity(GO:0004090) |
| 0.0 | 2.1 | GO:0017112 | Rab guanyl-nucleotide exchange factor activity(GO:0017112) |
| 0.0 | 0.6 | GO:0017154 | semaphorin receptor activity(GO:0017154) |
| 0.0 | 0.2 | GO:0005138 | interleukin-6 receptor binding(GO:0005138) |
| 0.0 | 0.9 | GO:0003951 | NAD+ kinase activity(GO:0003951) |
| 0.0 | 1.0 | GO:0035035 | histone acetyltransferase binding(GO:0035035) |
| 0.0 | 0.3 | GO:0097157 | pre-mRNA intronic binding(GO:0097157) |
| 0.0 | 0.7 | GO:0031690 | adrenergic receptor binding(GO:0031690) |
| 0.0 | 2.1 | GO:0035064 | methylated histone binding(GO:0035064) |
| 0.0 | 0.2 | GO:0016823 | hydrolase activity, acting on acid carbon-carbon bonds(GO:0016822) hydrolase activity, acting on acid carbon-carbon bonds, in ketonic substances(GO:0016823) |
| 0.0 | 0.2 | GO:0004634 | phosphopyruvate hydratase activity(GO:0004634) |
| 0.0 | 0.1 | GO:0071532 | ankyrin repeat binding(GO:0071532) |
| 0.0 | 0.7 | GO:0005003 | ephrin receptor activity(GO:0005003) |
| 0.0 | 0.2 | GO:0008266 | poly(U) RNA binding(GO:0008266) |
| 0.0 | 0.1 | GO:0051990 | (R)-2-hydroxyglutarate dehydrogenase activity(GO:0051990) |
| 0.0 | 0.8 | GO:0004532 | exoribonuclease activity(GO:0004532) |
| 0.0 | 0.3 | GO:0036002 | pre-mRNA binding(GO:0036002) |
| 0.0 | 0.1 | GO:0097001 | ceramide binding(GO:0097001) |
| 0.0 | 0.3 | GO:0050998 | nitric-oxide synthase binding(GO:0050998) |
| 0.0 | 0.2 | GO:0010997 | anaphase-promoting complex binding(GO:0010997) |
| 0.0 | 0.5 | GO:0004862 | cAMP-dependent protein kinase inhibitor activity(GO:0004862) |
| 0.0 | 0.2 | GO:0004526 | ribonuclease P activity(GO:0004526) |
| 0.0 | 0.1 | GO:0004359 | glutaminase activity(GO:0004359) |
| 0.0 | 0.2 | GO:0008097 | 5S rRNA binding(GO:0008097) |
| 0.0 | 0.3 | GO:0043047 | single-stranded telomeric DNA binding(GO:0043047) G-rich strand telomeric DNA binding(GO:0098505) |
| 0.0 | 0.4 | GO:0070273 | phosphatidylinositol-4-phosphate binding(GO:0070273) |
| 0.0 | 0.4 | GO:0004859 | phospholipase inhibitor activity(GO:0004859) |
| 0.0 | 0.3 | GO:0008138 | protein tyrosine/serine/threonine phosphatase activity(GO:0008138) |
| 0.0 | 0.1 | GO:0004886 | 9-cis retinoic acid receptor activity(GO:0004886) |
| 0.0 | 0.1 | GO:1990460 | leptin receptor binding(GO:1990460) |
| 0.0 | 0.7 | GO:0001965 | G-protein alpha-subunit binding(GO:0001965) |
| 0.0 | 2.5 | GO:1902936 | phosphatidylinositol bisphosphate binding(GO:1902936) |
| 0.0 | 0.4 | GO:0008190 | eukaryotic initiation factor 4E binding(GO:0008190) |
| 0.0 | 0.2 | GO:0019784 | NEDD8-specific protease activity(GO:0019784) |
| 0.0 | 0.3 | GO:1990825 | sequence-specific mRNA binding(GO:1990825) |
| 0.0 | 0.2 | GO:0001165 | RNA polymerase I upstream control element sequence-specific DNA binding(GO:0001165) |
| 0.0 | 0.9 | GO:0030371 | translation repressor activity(GO:0030371) |
| 0.0 | 0.2 | GO:0043422 | protein kinase B binding(GO:0043422) |
| 0.0 | 0.4 | GO:0045295 | gamma-catenin binding(GO:0045295) |
| 0.0 | 0.2 | GO:0004656 | procollagen-proline 4-dioxygenase activity(GO:0004656) procollagen-proline dioxygenase activity(GO:0019798) |
| 0.0 | 0.1 | GO:0004647 | phosphoserine phosphatase activity(GO:0004647) |
| 0.0 | 0.3 | GO:0052629 | phosphatidylinositol-3,5-bisphosphate 3-phosphatase activity(GO:0052629) |
| 0.0 | 0.1 | GO:0030366 | molybdopterin synthase activity(GO:0030366) |
| 0.0 | 0.8 | GO:0032266 | phosphatidylinositol-3-phosphate binding(GO:0032266) |
| 0.0 | 0.1 | GO:0047756 | chondroitin 4-sulfotransferase activity(GO:0047756) |
| 0.0 | 0.1 | GO:0001223 | transcription coactivator binding(GO:0001223) |
| 0.0 | 0.3 | GO:0001055 | RNA polymerase II activity(GO:0001055) |
| 0.0 | 0.2 | GO:0001042 | RNA polymerase I core binding(GO:0001042) |
| 0.0 | 0.1 | GO:0051538 | 3 iron, 4 sulfur cluster binding(GO:0051538) |
| 0.0 | 0.3 | GO:0031005 | filamin binding(GO:0031005) |
| 0.0 | 0.2 | GO:0035612 | AP-2 adaptor complex binding(GO:0035612) |
| 0.0 | 0.4 | GO:0005521 | lamin binding(GO:0005521) |
| 0.0 | 0.8 | GO:0003684 | damaged DNA binding(GO:0003684) |
| 0.0 | 0.2 | GO:0017034 | Rap guanyl-nucleotide exchange factor activity(GO:0017034) |
| 0.0 | 4.7 | GO:0060090 | binding, bridging(GO:0060090) |
| 0.0 | 0.1 | GO:0030983 | mismatched DNA binding(GO:0030983) |
| 0.0 | 0.7 | GO:0030331 | estrogen receptor binding(GO:0030331) |
| 0.0 | 1.1 | GO:0004693 | cyclin-dependent protein serine/threonine kinase activity(GO:0004693) |
| 0.0 | 0.1 | GO:0004376 | glycolipid mannosyltransferase activity(GO:0004376) |
| 0.0 | 0.6 | GO:0042162 | telomeric DNA binding(GO:0042162) |
| 0.0 | 0.1 | GO:0035005 | 1-phosphatidylinositol-4-phosphate 3-kinase activity(GO:0035005) |
| 0.0 | 0.6 | GO:0051019 | mitogen-activated protein kinase binding(GO:0051019) |
| 0.0 | 0.2 | GO:0043184 | vascular endothelial growth factor receptor 2 binding(GO:0043184) |
| 0.0 | 0.8 | GO:0097110 | scaffold protein binding(GO:0097110) |
| 0.0 | 0.9 | GO:0001102 | RNA polymerase II activating transcription factor binding(GO:0001102) |
| 0.0 | 0.1 | GO:0004711 | ribosomal protein S6 kinase activity(GO:0004711) |
| 0.0 | 0.2 | GO:0070700 | BMP receptor binding(GO:0070700) |
| 0.0 | 0.1 | GO:0004449 | isocitrate dehydrogenase (NAD+) activity(GO:0004449) |
| 0.0 | 0.4 | GO:0004709 | MAP kinase kinase kinase activity(GO:0004709) |
| 0.0 | 0.0 | GO:0008192 | RNA guanylyltransferase activity(GO:0008192) |
| 0.0 | 0.4 | GO:0000287 | magnesium ion binding(GO:0000287) |
| 0.0 | 0.2 | GO:0017049 | GTP-Rho binding(GO:0017049) |
| 0.0 | 0.4 | GO:0042826 | histone deacetylase binding(GO:0042826) |
| 0.0 | 0.2 | GO:0008140 | cAMP response element binding protein binding(GO:0008140) |
| 0.0 | 0.3 | GO:0008331 | high voltage-gated calcium channel activity(GO:0008331) |
| 0.0 | 0.1 | GO:1990829 | C-rich single-stranded DNA binding(GO:1990829) |
| 0.0 | 0.8 | GO:0004712 | protein serine/threonine/tyrosine kinase activity(GO:0004712) |
| 0.0 | 0.3 | GO:0070530 | K63-linked polyubiquitin binding(GO:0070530) |
| 0.0 | 0.1 | GO:0004677 | DNA-dependent protein kinase activity(GO:0004677) |
| 0.0 | 1.1 | GO:0008276 | protein methyltransferase activity(GO:0008276) |
| 0.0 | 0.2 | GO:0016174 | NAD(P)H oxidase activity(GO:0016174) |
| 0.0 | 0.0 | GO:1990259 | protein-glutamine N-methyltransferase activity(GO:0036009) histone-glutamine methyltransferase activity(GO:1990259) |
| 0.0 | 0.1 | GO:1990189 | peptide-serine-N-acetyltransferase activity(GO:1990189) |
| 0.0 | 0.4 | GO:0070003 | threonine-type endopeptidase activity(GO:0004298) threonine-type peptidase activity(GO:0070003) |
| 0.0 | 0.1 | GO:0008536 | Ran GTPase binding(GO:0008536) |
| 0.0 | 0.1 | GO:0043996 | histone acetyltransferase activity (H4-K5 specific)(GO:0043995) histone acetyltransferase activity (H4-K8 specific)(GO:0043996) histone acetyltransferase activity (H4-K16 specific)(GO:0046972) |
| 0.0 | 0.3 | GO:0043027 | cysteine-type endopeptidase inhibitor activity involved in apoptotic process(GO:0043027) |
| 0.0 | 0.2 | GO:0016922 | ligand-dependent nuclear receptor binding(GO:0016922) |
| 0.0 | 0.1 | GO:0004719 | protein-L-isoaspartate (D-aspartate) O-methyltransferase activity(GO:0004719) |
| 0.0 | 0.2 | GO:0035613 | RNA stem-loop binding(GO:0035613) |
| 0.0 | 0.4 | GO:0046966 | thyroid hormone receptor binding(GO:0046966) |
| 0.0 | 0.0 | GO:0071535 | RING-like zinc finger domain binding(GO:0071535) |
| 0.0 | 0.3 | GO:0004602 | glutathione peroxidase activity(GO:0004602) |
| 0.0 | 0.0 | GO:0086020 | gap junction channel activity involved in SA node cell-atrial cardiac muscle cell electrical coupling(GO:0086020) |
| 0.0 | 0.9 | GO:0001540 | beta-amyloid binding(GO:0001540) |
| 0.0 | 0.3 | GO:0030275 | LRR domain binding(GO:0030275) |
| 0.0 | 0.2 | GO:0070742 | C2H2 zinc finger domain binding(GO:0070742) |
| 0.0 | 18.3 | GO:0001071 | nucleic acid binding transcription factor activity(GO:0001071) transcription factor activity, sequence-specific DNA binding(GO:0003700) |
| 0.0 | 0.3 | GO:0030742 | GTP-dependent protein binding(GO:0030742) |
| 0.0 | 0.5 | GO:0008188 | neuropeptide receptor activity(GO:0008188) |
| 0.0 | 0.1 | GO:0016861 | intramolecular oxidoreductase activity, interconverting aldoses and ketoses(GO:0016861) |
| 0.0 | 0.2 | GO:0020037 | heme binding(GO:0020037) |
| 0.0 | 0.1 | GO:0042043 | neurexin family protein binding(GO:0042043) |
| 0.0 | 0.2 | GO:0004000 | adenosine deaminase activity(GO:0004000) |
| 0.0 | 0.4 | GO:0032947 | protein complex scaffold(GO:0032947) |
| 0.0 | 6.0 | GO:0019787 | ubiquitin-like protein transferase activity(GO:0019787) |
| 0.0 | 0.1 | GO:0089720 | caspase binding(GO:0089720) |
| 0.0 | 0.2 | GO:0016879 | ligase activity, forming carbon-nitrogen bonds(GO:0016879) |
| 0.0 | 0.2 | GO:0005344 | oxygen transporter activity(GO:0005344) |
| 0.0 | 0.3 | GO:0005104 | fibroblast growth factor receptor binding(GO:0005104) |
| 0.0 | 3.7 | GO:0005096 | GTPase activator activity(GO:0005096) |
Gene overrepresentation in C2:CP category:
| Log-likelihood per target | Total log-likelihood | Term | Description |
|---|---|---|---|
| 0.2 | 3.5 | ST INTERFERON GAMMA PATHWAY | Interferon gamma pathway. |
| 0.2 | 4.1 | PID S1P S1P4 PATHWAY | S1P4 pathway |
| 0.1 | 2.7 | PID P38 GAMMA DELTA PATHWAY | Signaling mediated by p38-gamma and p38-delta |
| 0.1 | 0.1 | PID TCPTP PATHWAY | Signaling events mediated by TCPTP |
| 0.1 | 0.2 | PID ERB GENOMIC PATHWAY | Validated nuclear estrogen receptor beta network |
| 0.1 | 2.6 | SA REG CASCADE OF CYCLIN EXPR | Expression of cyclins regulates progression through the cell cycle by activating cyclin-dependent kinases. |
| 0.1 | 1.2 | ST PAC1 RECEPTOR PATHWAY | PAC1 Receptor Pathway |
| 0.1 | 1.8 | PID ALK2 PATHWAY | ALK2 signaling events |
| 0.1 | 1.5 | SA G1 AND S PHASES | Cdk2, 4, and 6 bind cyclin D in G1, while cdk2/cyclin E promotes the G1/S transition. |
| 0.1 | 0.7 | SIG CD40PATHWAYMAP | Genes related to CD40 signaling |
| 0.1 | 2.1 | SA TRKA RECEPTOR | The TrkA receptor binds nerve growth factor to activate MAP kinase pathways and promote cell growth. |
| 0.1 | 5.8 | PID HEDGEHOG GLI PATHWAY | Hedgehog signaling events mediated by Gli proteins |
| 0.1 | 2.4 | PID CXCR3 PATHWAY | CXCR3-mediated signaling events |
| 0.1 | 1.5 | PID BETA CATENIN DEG PATHWAY | Degradation of beta catenin |
| 0.1 | 3.9 | PID IL1 PATHWAY | IL1-mediated signaling events |
| 0.1 | 2.8 | PID MYC PATHWAY | C-MYC pathway |
| 0.1 | 1.9 | ST WNT BETA CATENIN PATHWAY | Wnt/beta-catenin Pathway |
| 0.1 | 3.5 | PID PI3K PLC TRK PATHWAY | Trk receptor signaling mediated by PI3K and PLC-gamma |
| 0.1 | 1.9 | PID NFKAPPAB CANONICAL PATHWAY | Canonical NF-kappaB pathway |
| 0.1 | 3.3 | PID AMB2 NEUTROPHILS PATHWAY | amb2 Integrin signaling |
| 0.1 | 1.8 | ST B CELL ANTIGEN RECEPTOR | B Cell Antigen Receptor |
| 0.1 | 1.4 | PID ARF 3PATHWAY | Arf1 pathway |
| 0.1 | 3.4 | PID ARF6 TRAFFICKING PATHWAY | Arf6 trafficking events |
| 0.1 | 2.9 | PID SHP2 PATHWAY | SHP2 signaling |
| 0.0 | 0.3 | ST TYPE I INTERFERON PATHWAY | Type I Interferon (alpha/beta IFN) Pathway |
| 0.0 | 0.6 | PID HIF1A PATHWAY | Hypoxic and oxygen homeostasis regulation of HIF-1-alpha |
| 0.0 | 0.2 | PID BARD1 PATHWAY | BARD1 signaling events |
| 0.0 | 3.7 | PID ERA GENOMIC PATHWAY | Validated nuclear estrogen receptor alpha network |
| 0.0 | 4.2 | PID AR PATHWAY | Coregulation of Androgen receptor activity |
| 0.0 | 3.0 | PID RAC1 REG PATHWAY | Regulation of RAC1 activity |
| 0.0 | 1.3 | PID ATM PATHWAY | ATM pathway |
| 0.0 | 1.5 | PID ERBB1 INTERNALIZATION PATHWAY | Internalization of ErbB1 |
| 0.0 | 0.1 | PID PI3KCI AKT PATHWAY | Class I PI3K signaling events mediated by Akt |
| 0.0 | 3.3 | PID SMAD2 3NUCLEAR PATHWAY | Regulation of nuclear SMAD2/3 signaling |
| 0.0 | 0.9 | ST G ALPHA I PATHWAY | G alpha i Pathway |
| 0.0 | 1.5 | PID TRKR PATHWAY | Neurotrophic factor-mediated Trk receptor signaling |
| 0.0 | 0.8 | PID PI3KCI PATHWAY | Class I PI3K signaling events |
| 0.0 | 0.2 | ST DIFFERENTIATION PATHWAY IN PC12 CELLS | Differentiation Pathway in PC12 Cells; this is a specific case of PAC1 Receptor Pathway. |
| 0.0 | 0.6 | PID RET PATHWAY | Signaling events regulated by Ret tyrosine kinase |
| 0.0 | 1.3 | PID IL12 STAT4 PATHWAY | IL12 signaling mediated by STAT4 |
| 0.0 | 0.2 | SA PTEN PATHWAY | PTEN is a tumor suppressor that dephosphorylates the lipid messenger phosphatidylinositol triphosphate. |
| 0.0 | 0.2 | PID IL5 PATHWAY | IL5-mediated signaling events |
| 0.0 | 0.4 | PID CD40 PATHWAY | CD40/CD40L signaling |
| 0.0 | 0.8 | PID FAK PATHWAY | Signaling events mediated by focal adhesion kinase |
| 0.0 | 0.9 | PID WNT SIGNALING PATHWAY | Wnt signaling network |
| 0.0 | 2.2 | PID ERBB1 DOWNSTREAM PATHWAY | ErbB1 downstream signaling |
| 0.0 | 1.0 | PID AURORA A PATHWAY | Aurora A signaling |
| 0.0 | 0.2 | PID LYMPH ANGIOGENESIS PATHWAY | VEGFR3 signaling in lymphatic endothelium |
| 0.0 | 0.5 | PID CDC42 REG PATHWAY | Regulation of CDC42 activity |
| 0.0 | 1.2 | PID P53 REGULATION PATHWAY | p53 pathway |
| 0.0 | 0.2 | PID EPHA2 FWD PATHWAY | EPHA2 forward signaling |
| 0.0 | 1.1 | PID FRA PATHWAY | Validated transcriptional targets of AP1 family members Fra1 and Fra2 |
| 0.0 | 0.7 | PID ARF6 PATHWAY | Arf6 signaling events |
| 0.0 | 0.5 | PID INTEGRIN A9B1 PATHWAY | Alpha9 beta1 integrin signaling events |
| 0.0 | 0.5 | PID ECADHERIN NASCENT AJ PATHWAY | E-cadherin signaling in the nascent adherens junction |
| 0.0 | 0.6 | PID ERBB2 ERBB3 PATHWAY | ErbB2/ErbB3 signaling events |
| 0.0 | 0.3 | PID INSULIN GLUCOSE PATHWAY | Insulin-mediated glucose transport |
| 0.0 | 0.6 | PID NCADHERIN PATHWAY | N-cadherin signaling events |
| 0.0 | 0.8 | SIG REGULATION OF THE ACTIN CYTOSKELETON BY RHO GTPASES | Genes related to regulation of the actin cytoskeleton |
| 0.0 | 0.6 | PID HDAC CLASSII PATHWAY | Signaling events mediated by HDAC Class II |
| 0.0 | 1.5 | PID CASPASE PATHWAY | Caspase cascade in apoptosis |
| 0.0 | 1.1 | PID E2F PATHWAY | E2F transcription factor network |
| 0.0 | 0.3 | PID HDAC CLASSIII PATHWAY | Signaling events mediated by HDAC Class III |
| 0.0 | 0.9 | PID LKB1 PATHWAY | LKB1 signaling events |
| 0.0 | 0.3 | PID FOXO PATHWAY | FoxO family signaling |
| 0.0 | 0.4 | PID CONE PATHWAY | Visual signal transduction: Cones |
| 0.0 | 0.2 | PID SYNDECAN 3 PATHWAY | Syndecan-3-mediated signaling events |
| 0.0 | 0.6 | PID TELOMERASE PATHWAY | Regulation of Telomerase |
| 0.0 | 0.2 | PID THROMBIN PAR1 PATHWAY | PAR1-mediated thrombin signaling events |
| 0.0 | 0.2 | PID PRL SIGNALING EVENTS PATHWAY | Signaling events mediated by PRL |
Gene overrepresentation in C2:CP:REACTOME category:
| Log-likelihood per target | Total log-likelihood | Term | Description |
|---|---|---|---|
| 0.3 | 0.5 | REACTOME SCF BETA TRCP MEDIATED DEGRADATION OF EMI1 | Genes involved in SCF-beta-TrCP mediated degradation of Emi1 |
| 0.3 | 0.3 | REACTOME SYNTHESIS OF PIPS AT THE LATE ENDOSOME MEMBRANE | Genes involved in Synthesis of PIPs at the late endosome membrane |
| 0.2 | 3.7 | REACTOME INHIBITION OF REPLICATION INITIATION OF DAMAGED DNA BY RB1 E2F1 | Genes involved in Inhibition of replication initiation of damaged DNA by RB1/E2F1 |
| 0.2 | 2.2 | REACTOME NEGATIVE REGULATION OF THE PI3K AKT NETWORK | Genes involved in Negative regulation of the PI3K/AKT network |
| 0.2 | 3.5 | REACTOME IL 6 SIGNALING | Genes involved in Interleukin-6 signaling |
| 0.2 | 0.3 | REACTOME TRAF3 DEPENDENT IRF ACTIVATION PATHWAY | Genes involved in TRAF3-dependent IRF activation pathway |
| 0.1 | 0.4 | REACTOME VIRAL MESSENGER RNA SYNTHESIS | Genes involved in Viral Messenger RNA Synthesis |
| 0.1 | 2.4 | REACTOME NEF MEDIATED DOWNREGULATION OF MHC CLASS I COMPLEX CELL SURFACE EXPRESSION | Genes involved in Nef mediated downregulation of MHC class I complex cell surface expression |
| 0.1 | 3.1 | REACTOME TGF BETA RECEPTOR SIGNALING IN EMT EPITHELIAL TO MESENCHYMAL TRANSITION | Genes involved in TGF-beta receptor signaling in EMT (epithelial to mesenchymal transition) |
| 0.1 | 6.4 | REACTOME SMOOTH MUSCLE CONTRACTION | Genes involved in Smooth Muscle Contraction |
| 0.1 | 2.7 | REACTOME DEADENYLATION OF MRNA | Genes involved in Deadenylation of mRNA |
| 0.1 | 1.3 | REACTOME ROLE OF DCC IN REGULATING APOPTOSIS | Genes involved in Role of DCC in regulating apoptosis |
| 0.1 | 1.7 | REACTOME MRNA DECAY BY 5 TO 3 EXORIBONUCLEASE | Genes involved in mRNA Decay by 5' to 3' Exoribonuclease |
| 0.1 | 2.0 | REACTOME PROLACTIN RECEPTOR SIGNALING | Genes involved in Prolactin receptor signaling |
| 0.1 | 0.8 | REACTOME REGULATION OF ORNITHINE DECARBOXYLASE ODC | Genes involved in Regulation of ornithine decarboxylase (ODC) |
| 0.1 | 2.5 | REACTOME BOTULINUM NEUROTOXICITY | Genes involved in Botulinum neurotoxicity |
| 0.1 | 1.1 | REACTOME TRAF6 MEDIATED IRF7 ACTIVATION IN TLR7 8 OR 9 SIGNALING | Genes involved in TRAF6 mediated IRF7 activation in TLR7/8 or 9 signaling |
| 0.1 | 1.8 | REACTOME FORMATION OF ATP BY CHEMIOSMOTIC COUPLING | Genes involved in Formation of ATP by chemiosmotic coupling |
| 0.1 | 0.7 | REACTOME ERKS ARE INACTIVATED | Genes involved in ERKs are inactivated |
| 0.1 | 0.9 | REACTOME REGULATION OF INSULIN SECRETION BY ACETYLCHOLINE | Genes involved in Regulation of Insulin Secretion by Acetylcholine |
| 0.1 | 0.4 | REACTOME ABORTIVE ELONGATION OF HIV1 TRANSCRIPT IN THE ABSENCE OF TAT | Genes involved in Abortive elongation of HIV-1 transcript in the absence of Tat |
| 0.1 | 2.1 | REACTOME CELL EXTRACELLULAR MATRIX INTERACTIONS | Genes involved in Cell-extracellular matrix interactions |
| 0.1 | 2.1 | REACTOME FORMATION OF INCISION COMPLEX IN GG NER | Genes involved in Formation of incision complex in GG-NER |
| 0.1 | 1.5 | REACTOME MTORC1 MEDIATED SIGNALLING | Genes involved in mTORC1-mediated signalling |
| 0.1 | 2.0 | REACTOME DCC MEDIATED ATTRACTIVE SIGNALING | Genes involved in DCC mediated attractive signaling |
| 0.1 | 0.5 | REACTOME NFKB IS ACTIVATED AND SIGNALS SURVIVAL | Genes involved in NF-kB is activated and signals survival |
| 0.1 | 1.2 | REACTOME RESOLUTION OF AP SITES VIA THE SINGLE NUCLEOTIDE REPLACEMENT PATHWAY | Genes involved in Resolution of AP sites via the single-nucleotide replacement pathway |
| 0.1 | 0.6 | REACTOME ACTIVATION OF NF KAPPAB IN B CELLS | Genes involved in Activation of NF-kappaB in B Cells |
| 0.1 | 1.6 | REACTOME POST CHAPERONIN TUBULIN FOLDING PATHWAY | Genes involved in Post-chaperonin tubulin folding pathway |
| 0.1 | 0.9 | REACTOME DSCAM INTERACTIONS | Genes involved in DSCAM interactions |
| 0.1 | 2.3 | REACTOME G1 PHASE | Genes involved in G1 Phase |
| 0.1 | 1.5 | REACTOME BRANCHED CHAIN AMINO ACID CATABOLISM | Genes involved in Branched-chain amino acid catabolism |
| 0.1 | 1.0 | REACTOME ALPHA LINOLENIC ACID ALA METABOLISM | Genes involved in alpha-linolenic acid (ALA) metabolism |
| 0.1 | 1.4 | REACTOME METABOLISM OF PORPHYRINS | Genes involved in Metabolism of porphyrins |
| 0.1 | 1.0 | REACTOME RECRUITMENT OF NUMA TO MITOTIC CENTROSOMES | Genes involved in Recruitment of NuMA to mitotic centrosomes |
| 0.1 | 4.4 | REACTOME RESPIRATORY ELECTRON TRANSPORT | Genes involved in Respiratory electron transport |
| 0.0 | 0.5 | REACTOME ROLE OF SECOND MESSENGERS IN NETRIN1 SIGNALING | Genes involved in Role of second messengers in netrin-1 signaling |
| 0.0 | 0.8 | REACTOME SOS MEDIATED SIGNALLING | Genes involved in SOS-mediated signalling |
| 0.0 | 1.2 | REACTOME REGULATION OF INSULIN LIKE GROWTH FACTOR IGF ACTIVITY BY INSULIN LIKE GROWTH FACTOR BINDING PROTEINS IGFBPS | Genes involved in Regulation of Insulin-like Growth Factor (IGF) Activity by Insulin-like Growth Factor Binding Proteins (IGFBPs) |
| 0.0 | 1.0 | REACTOME ABCA TRANSPORTERS IN LIPID HOMEOSTASIS | Genes involved in ABCA transporters in lipid homeostasis |
| 0.0 | 0.7 | REACTOME SIGNALING BY TGF BETA RECEPTOR COMPLEX | Genes involved in Signaling by TGF-beta Receptor Complex |
| 0.0 | 1.7 | REACTOME LIGAND GATED ION CHANNEL TRANSPORT | Genes involved in Ligand-gated ion channel transport |
| 0.0 | 1.4 | REACTOME CHOLESTEROL BIOSYNTHESIS | Genes involved in Cholesterol biosynthesis |
| 0.0 | 0.8 | REACTOME CALNEXIN CALRETICULIN CYCLE | Genes involved in Calnexin/calreticulin cycle |
| 0.0 | 1.1 | REACTOME HS GAG DEGRADATION | Genes involved in HS-GAG degradation |
| 0.0 | 0.3 | REACTOME AKT PHOSPHORYLATES TARGETS IN THE CYTOSOL | Genes involved in AKT phosphorylates targets in the cytosol |
| 0.0 | 0.6 | REACTOME SEMA3A PAK DEPENDENT AXON REPULSION | Genes involved in Sema3A PAK dependent Axon repulsion |
| 0.0 | 1.8 | REACTOME SIGNALING BY ROBO RECEPTOR | Genes involved in Signaling by Robo receptor |
| 0.0 | 0.7 | REACTOME THE ACTIVATION OF ARYLSULFATASES | Genes involved in The activation of arylsulfatases |
| 0.0 | 0.3 | REACTOME REGULATION OF THE FANCONI ANEMIA PATHWAY | Genes involved in Regulation of the Fanconi anemia pathway |
| 0.0 | 0.9 | REACTOME ABC FAMILY PROTEINS MEDIATED TRANSPORT | Genes involved in ABC-family proteins mediated transport |
| 0.0 | 0.8 | REACTOME REGULATION OF RHEB GTPASE ACTIVITY BY AMPK | Genes involved in Regulation of Rheb GTPase activity by AMPK |
| 0.0 | 0.5 | REACTOME NOTCH HLH TRANSCRIPTION PATHWAY | Genes involved in Notch-HLH transcription pathway |
| 0.0 | 1.5 | REACTOME YAP1 AND WWTR1 TAZ STIMULATED GENE EXPRESSION | Genes involved in YAP1- and WWTR1 (TAZ)-stimulated gene expression |
| 0.0 | 1.6 | REACTOME DOWNREGULATION OF SMAD2 3 SMAD4 TRANSCRIPTIONAL ACTIVITY | Genes involved in Downregulation of SMAD2/3:SMAD4 transcriptional activity |
| 0.0 | 0.7 | REACTOME G0 AND EARLY G1 | Genes involved in G0 and Early G1 |
| 0.0 | 1.3 | REACTOME NOD1 2 SIGNALING PATHWAY | Genes involved in NOD1/2 Signaling Pathway |
| 0.0 | 0.6 | REACTOME REGULATION OF GENE EXPRESSION IN BETA CELLS | Genes involved in Regulation of gene expression in beta cells |
| 0.0 | 0.8 | REACTOME SIGNALING BY NODAL | Genes involved in Signaling by NODAL |
| 0.0 | 0.8 | REACTOME MRNA SPLICING MINOR PATHWAY | Genes involved in mRNA Splicing - Minor Pathway |
| 0.0 | 1.4 | REACTOME NEP NS2 INTERACTS WITH THE CELLULAR EXPORT MACHINERY | Genes involved in NEP/NS2 Interacts with the Cellular Export Machinery |
| 0.0 | 0.6 | REACTOME SYNTHESIS OF PIPS AT THE EARLY ENDOSOME MEMBRANE | Genes involved in Synthesis of PIPs at the early endosome membrane |
| 0.0 | 0.6 | REACTOME DOWNREGULATION OF ERBB2 ERBB3 SIGNALING | Genes involved in Downregulation of ERBB2:ERBB3 signaling |
| 0.0 | 0.9 | REACTOME AMINO ACID SYNTHESIS AND INTERCONVERSION TRANSAMINATION | Genes involved in Amino acid synthesis and interconversion (transamination) |
| 0.0 | 1.2 | REACTOME THROMBIN SIGNALLING THROUGH PROTEINASE ACTIVATED RECEPTORS PARS | Genes involved in Thrombin signalling through proteinase activated receptors (PARs) |
| 0.0 | 0.4 | REACTOME GRB2 SOS PROVIDES LINKAGE TO MAPK SIGNALING FOR INTERGRINS | Genes involved in GRB2:SOS provides linkage to MAPK signaling for Intergrins |
| 0.0 | 0.8 | REACTOME CRMPS IN SEMA3A SIGNALING | Genes involved in CRMPs in Sema3A signaling |
| 0.0 | 0.9 | REACTOME ENDOSOMAL SORTING COMPLEX REQUIRED FOR TRANSPORT ESCRT | Genes involved in Endosomal Sorting Complex Required For Transport (ESCRT) |
| 0.0 | 0.5 | REACTOME SLBP DEPENDENT PROCESSING OF REPLICATION DEPENDENT HISTONE PRE MRNAS | Genes involved in SLBP Dependent Processing of Replication-Dependent Histone Pre-mRNAs |
| 0.0 | 1.2 | REACTOME G ALPHA Z SIGNALLING EVENTS | Genes involved in G alpha (z) signalling events |
| 0.0 | 0.7 | REACTOME FORMATION OF TRANSCRIPTION COUPLED NER TC NER REPAIR COMPLEX | Genes involved in Formation of transcription-coupled NER (TC-NER) repair complex |
| 0.0 | 0.5 | REACTOME CTNNB1 PHOSPHORYLATION CASCADE | Genes involved in Beta-catenin phosphorylation cascade |
| 0.0 | 1.3 | REACTOME TRANSCRIPTIONAL REGULATION OF WHITE ADIPOCYTE DIFFERENTIATION | Genes involved in Transcriptional Regulation of White Adipocyte Differentiation |
| 0.0 | 0.3 | REACTOME ACTIVATION OF CHAPERONE GENES BY ATF6 ALPHA | Genes involved in Activation of Chaperone Genes by ATF6-alpha |
| 0.0 | 0.6 | REACTOME OTHER SEMAPHORIN INTERACTIONS | Genes involved in Other semaphorin interactions |
| 0.0 | 2.6 | REACTOME MITOTIC PROMETAPHASE | Genes involved in Mitotic Prometaphase |
| 0.0 | 1.0 | REACTOME SYNTHESIS AND INTERCONVERSION OF NUCLEOTIDE DI AND TRIPHOSPHATES | Genes involved in Synthesis and interconversion of nucleotide di- and triphosphates |
| 0.0 | 1.3 | REACTOME LATE PHASE OF HIV LIFE CYCLE | Genes involved in Late Phase of HIV Life Cycle |
| 0.0 | 0.7 | REACTOME SIGNALING BY FGFR1 FUSION MUTANTS | Genes involved in Signaling by FGFR1 fusion mutants |
| 0.0 | 1.8 | REACTOME P53 DEPENDENT G1 DNA DAMAGE RESPONSE | Genes involved in p53-Dependent G1 DNA Damage Response |
| 0.0 | 0.4 | REACTOME GLUCOSE TRANSPORT | Genes involved in Glucose transport |
| 0.0 | 0.7 | REACTOME HORMONE SENSITIVE LIPASE HSL MEDIATED TRIACYLGLYCEROL HYDROLYSIS | Genes involved in Hormone-sensitive lipase (HSL)-mediated triacylglycerol hydrolysis |
| 0.0 | 1.1 | REACTOME GLYCOLYSIS | Genes involved in Glycolysis |
| 0.0 | 0.6 | REACTOME PURINE SALVAGE | Genes involved in Purine salvage |
| 0.0 | 0.7 | REACTOME TRAFFICKING OF GLUR2 CONTAINING AMPA RECEPTORS | Genes involved in Trafficking of GluR2-containing AMPA receptors |
| 0.0 | 0.8 | REACTOME CASPASE MEDIATED CLEAVAGE OF CYTOSKELETAL PROTEINS | Genes involved in Caspase-mediated cleavage of cytoskeletal proteins |
| 0.0 | 8.9 | REACTOME GENERIC TRANSCRIPTION PATHWAY | Genes involved in Generic Transcription Pathway |
| 0.0 | 0.6 | REACTOME ANTIGEN PRESENTATION FOLDING ASSEMBLY AND PEPTIDE LOADING OF CLASS I MHC | Genes involved in Antigen Presentation: Folding, assembly and peptide loading of class I MHC |
| 0.0 | 0.5 | REACTOME PEROXISOMAL LIPID METABOLISM | Genes involved in Peroxisomal lipid metabolism |
| 0.0 | 0.9 | REACTOME SULFUR AMINO ACID METABOLISM | Genes involved in Sulfur amino acid metabolism |
| 0.0 | 0.3 | REACTOME GLUCAGON SIGNALING IN METABOLIC REGULATION | Genes involved in Glucagon signaling in metabolic regulation |
| 0.0 | 0.2 | REACTOME ER PHAGOSOME PATHWAY | Genes involved in ER-Phagosome pathway |
| 0.0 | 0.4 | REACTOME FACILITATIVE NA INDEPENDENT GLUCOSE TRANSPORTERS | Genes involved in Facilitative Na+-independent glucose transporters |
| 0.0 | 0.5 | REACTOME ADVANCED GLYCOSYLATION ENDPRODUCT RECEPTOR SIGNALING | Genes involved in Advanced glycosylation endproduct receptor signaling |
| 0.0 | 1.4 | REACTOME DNA REPAIR | Genes involved in DNA Repair |
| 0.0 | 0.4 | REACTOME BILE SALT AND ORGANIC ANION SLC TRANSPORTERS | Genes involved in Bile salt and organic anion SLC transporters |
| 0.0 | 0.2 | REACTOME NEF MEDIATES DOWN MODULATION OF CELL SURFACE RECEPTORS BY RECRUITING THEM TO CLATHRIN ADAPTERS | Genes involved in Nef-mediates down modulation of cell surface receptors by recruiting them to clathrin adapters |
| 0.0 | 3.4 | REACTOME NONSENSE MEDIATED DECAY ENHANCED BY THE EXON JUNCTION COMPLEX | Genes involved in Nonsense Mediated Decay Enhanced by the Exon Junction Complex |
| 0.0 | 0.1 | REACTOME TRANSPORT OF RIBONUCLEOPROTEINS INTO THE HOST NUCLEUS | Genes involved in Transport of Ribonucleoproteins into the Host Nucleus |
| 0.0 | 0.6 | REACTOME GLUTATHIONE CONJUGATION | Genes involved in Glutathione conjugation |
| 0.0 | 0.2 | REACTOME IL 7 SIGNALING | Genes involved in Interleukin-7 signaling |
| 0.0 | 1.3 | REACTOME TRANS GOLGI NETWORK VESICLE BUDDING | Genes involved in trans-Golgi Network Vesicle Budding |
| 0.0 | 1.5 | REACTOME MHC CLASS II ANTIGEN PRESENTATION | Genes involved in MHC class II antigen presentation |
| 0.0 | 0.1 | REACTOME TETRAHYDROBIOPTERIN BH4 SYNTHESIS RECYCLING SALVAGE AND REGULATION | Genes involved in Tetrahydrobiopterin (BH4) synthesis, recycling, salvage and regulation |
| 0.0 | 0.1 | REACTOME INTEGRATION OF PROVIRUS | Genes involved in Integration of provirus |
| 0.0 | 0.3 | REACTOME GLYCOGEN BREAKDOWN GLYCOGENOLYSIS | Genes involved in Glycogen breakdown (glycogenolysis) |
| 0.0 | 0.7 | REACTOME SIGNALING BY EGFR IN CANCER | Genes involved in Signaling by EGFR in Cancer |
| 0.0 | 0.6 | REACTOME METABOLISM OF STEROID HORMONES AND VITAMINS A AND D | Genes involved in Metabolism of steroid hormones and vitamins A and D |
| 0.0 | 0.3 | REACTOME NETRIN1 SIGNALING | Genes involved in Netrin-1 signaling |
| 0.0 | 0.4 | REACTOME NEGATIVE REGULATORS OF RIG I MDA5 SIGNALING | Genes involved in Negative regulators of RIG-I/MDA5 signaling |