Project
Epithelial-Mesenchymal Transition, human (Scheel, 2011)
Navigation
Downloads
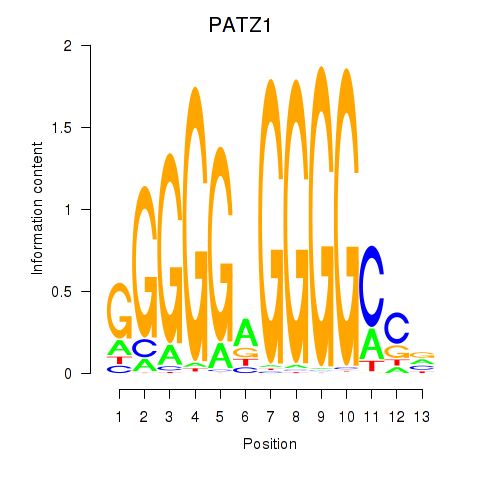
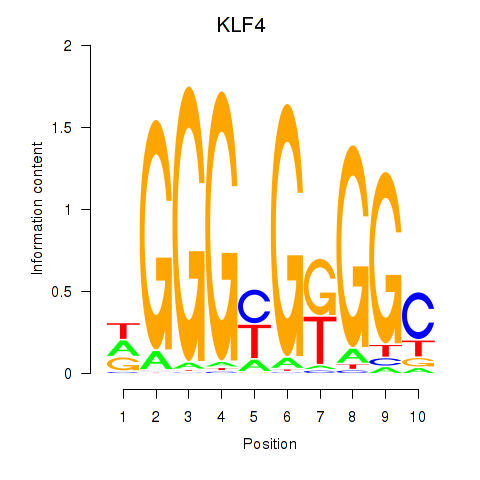
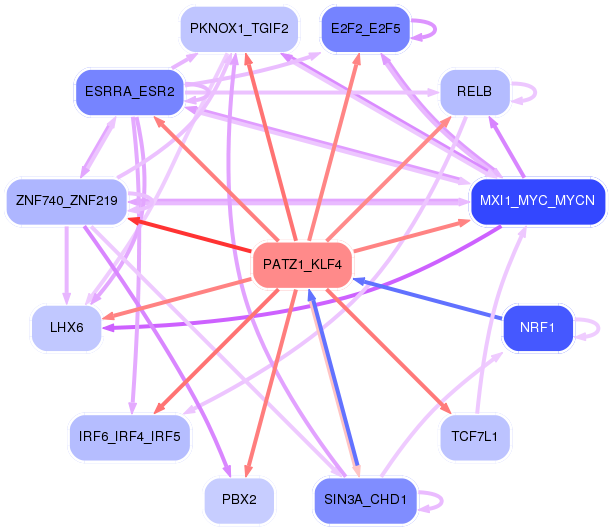
Results for PATZ1_KLF4
Z-value: 1.85
Motif logo
Transcription factors associated with PATZ1_KLF4
| Gene Symbol | Gene ID | Gene Info |
|---|---|---|
|
PATZ1
|
ENSG00000100105.13 | PATZ1 |
|
KLF4
|
ENSG00000136826.10 | KLF4 |
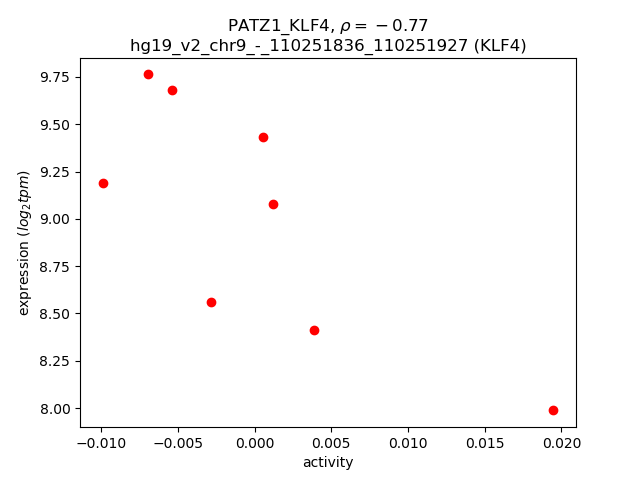
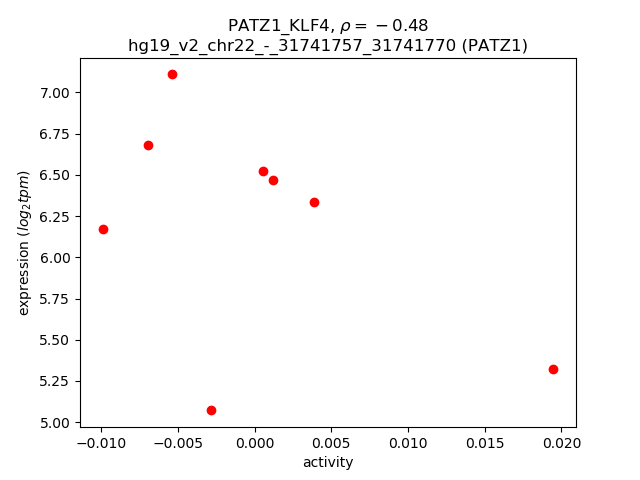
Activity-expression correlation:
| Gene | Promoter | Pearson corr. coef. | P-value | Plot |
|---|---|---|---|---|
| KLF4 | hg19_v2_chr9_-_110251836_110251927 | -0.77 | 2.5e-02 | Click! |
| PATZ1 | hg19_v2_chr22_-_31741757_31741770 | -0.48 | 2.3e-01 | Click! |
Activity profile of PATZ1_KLF4 motif
Sorted Z-values of PATZ1_KLF4 motif
Network of associatons between targets according to the STRING database.

First level regulatory network of PATZ1_KLF4
| Promoter | Score | Transcript | Gene | Gene Info |
|---|---|---|---|---|
| chr19_-_55658687 | 4.92 |
ENST00000593046.1 |
TNNT1 |
troponin T type 1 (skeletal, slow) |
| chr19_-_55658650 | 4.47 |
ENST00000589226.1 |
TNNT1 |
troponin T type 1 (skeletal, slow) |
| chr18_+_11981427 | 3.99 |
ENST00000269159.3 |
IMPA2 |
inositol(myo)-1(or 4)-monophosphatase 2 |
| chr18_+_11981547 | 3.77 |
ENST00000588927.1 |
IMPA2 |
inositol(myo)-1(or 4)-monophosphatase 2 |
| chr18_+_11981014 | 3.56 |
ENST00000589238.1 |
IMPA2 |
inositol(myo)-1(or 4)-monophosphatase 2 |
| chr19_-_55658281 | 3.35 |
ENST00000585321.2 ENST00000587465.2 |
TNNT1 |
troponin T type 1 (skeletal, slow) |
| chr14_-_105635090 | 3.16 |
ENST00000331782.3 ENST00000347004.2 |
JAG2 |
jagged 2 |
| chr19_-_6767516 | 3.14 |
ENST00000245908.6 |
SH2D3A |
SH2 domain containing 3A |
| chr19_-_291365 | 3.12 |
ENST00000591572.1 ENST00000269812.3 ENST00000434325.2 |
PPAP2C |
phosphatidic acid phosphatase type 2C |
| chr1_-_11714700 | 3.12 |
ENST00000354287.4 |
FBXO2 |
F-box protein 2 |
| chr13_-_114018400 | 3.00 |
ENST00000375430.4 ENST00000375431.4 |
GRTP1 |
growth hormone regulated TBC protein 1 |
| chr19_-_6767431 | 2.90 |
ENST00000437152.3 ENST00000597687.1 |
SH2D3A |
SH2 domain containing 3A |
| chr19_+_35606692 | 2.88 |
ENST00000406242.3 ENST00000454903.2 |
FXYD3 |
FXYD domain containing ion transport regulator 3 |
| chr22_+_45098067 | 2.85 |
ENST00000336985.6 ENST00000403696.1 ENST00000457960.1 ENST00000361473.5 |
PRR5 PRR5-ARHGAP8 |
proline rich 5 (renal) PRR5-ARHGAP8 readthrough |
| chr8_-_144651024 | 2.74 |
ENST00000524906.1 ENST00000532862.1 ENST00000534459.1 |
MROH6 |
maestro heat-like repeat family member 6 |
| chr22_+_45148432 | 2.67 |
ENST00000389774.2 ENST00000396119.2 ENST00000336963.4 ENST00000356099.6 ENST00000412433.1 |
ARHGAP8 |
Rho GTPase activating protein 8 |
| chr14_-_21566731 | 2.64 |
ENST00000360947.3 |
ZNF219 |
zinc finger protein 219 |
| chr1_+_233463507 | 2.59 |
ENST00000366623.3 ENST00000366624.3 |
MLK4 |
Mitogen-activated protein kinase kinase kinase MLK4 |
| chr19_+_45843994 | 2.28 |
ENST00000391946.2 |
KLC3 |
kinesin light chain 3 |
| chr19_-_55660561 | 2.27 |
ENST00000587758.1 ENST00000356783.5 ENST00000291901.8 ENST00000588426.1 ENST00000588147.1 ENST00000536926.1 ENST00000588981.1 |
TNNT1 |
troponin T type 1 (skeletal, slow) |
| chr7_-_98030360 | 2.26 |
ENST00000005260.8 |
BAIAP2L1 |
BAI1-associated protein 2-like 1 |
| chr1_-_32801825 | 2.18 |
ENST00000329421.7 |
MARCKSL1 |
MARCKS-like 1 |
| chr11_-_72492878 | 2.17 |
ENST00000535054.1 ENST00000545082.1 |
STARD10 |
StAR-related lipid transfer (START) domain containing 10 |
| chr6_+_150464155 | 2.15 |
ENST00000361131.4 |
PPP1R14C |
protein phosphatase 1, regulatory (inhibitor) subunit 14C |
| chr1_+_1981890 | 2.12 |
ENST00000378567.3 ENST00000468310.1 |
PRKCZ |
protein kinase C, zeta |
| chr2_+_47596287 | 2.11 |
ENST00000263735.4 |
EPCAM |
epithelial cell adhesion molecule |
| chr19_-_291133 | 2.09 |
ENST00000327790.3 |
PPAP2C |
phosphatidic acid phosphatase type 2C |
| chr19_-_2015699 | 2.08 |
ENST00000255608.4 |
BTBD2 |
BTB (POZ) domain containing 2 |
| chr19_-_51504411 | 2.08 |
ENST00000593490.1 |
KLK8 |
kallikrein-related peptidase 8 |
| chr22_+_51112800 | 2.06 |
ENST00000414786.2 |
SHANK3 |
SH3 and multiple ankyrin repeat domains 3 |
| chr14_-_21567009 | 2.05 |
ENST00000556174.1 ENST00000554478.1 ENST00000553980.1 ENST00000421093.2 |
ZNF219 |
zinc finger protein 219 |
| chr15_+_41136586 | 2.04 |
ENST00000431806.1 |
SPINT1 |
serine peptidase inhibitor, Kunitz type 1 |
| chr8_-_494824 | 2.02 |
ENST00000427263.2 ENST00000324079.6 |
TDRP |
testis development related protein |
| chr19_+_45844018 | 1.98 |
ENST00000585434.1 |
KLC3 |
kinesin light chain 3 |
| chr1_-_160068465 | 1.96 |
ENST00000314485.7 ENST00000368086.1 |
IGSF8 |
immunoglobulin superfamily, member 8 |
| chr8_-_57232656 | 1.96 |
ENST00000396721.2 |
SDR16C5 |
short chain dehydrogenase/reductase family 16C, member 5 |
| chr1_-_201368707 | 1.94 |
ENST00000391967.2 |
LAD1 |
ladinin 1 |
| chr4_+_1795012 | 1.93 |
ENST00000481110.2 ENST00000340107.4 ENST00000440486.2 ENST00000412135.2 |
FGFR3 |
fibroblast growth factor receptor 3 |
| chr1_-_41131326 | 1.93 |
ENST00000372684.3 |
RIMS3 |
regulating synaptic membrane exocytosis 3 |
| chr19_+_35606777 | 1.93 |
ENST00000604404.1 ENST00000435734.2 ENST00000603181.1 |
FXYD3 |
FXYD domain containing ion transport regulator 3 |
| chr9_-_139948487 | 1.92 |
ENST00000355097.2 |
ENTPD2 |
ectonucleoside triphosphate diphosphohydrolase 2 |
| chr18_+_33877654 | 1.91 |
ENST00000257209.4 ENST00000445677.1 ENST00000590592.1 ENST00000359247.4 |
FHOD3 |
formin homology 2 domain containing 3 |
| chr19_+_45844032 | 1.88 |
ENST00000589837.1 |
KLC3 |
kinesin light chain 3 |
| chr2_-_46385 | 1.88 |
ENST00000327669.4 |
FAM110C |
family with sequence similarity 110, member C |
| chr3_-_128840604 | 1.84 |
ENST00000476465.1 ENST00000315150.5 ENST00000393304.1 ENST00000393308.1 ENST00000393307.1 ENST00000393305.1 |
RAB43 |
RAB43, member RAS oncogene family |
| chr16_-_402639 | 1.84 |
ENST00000262320.3 |
AXIN1 |
axin 1 |
| chr11_-_72492903 | 1.84 |
ENST00000537947.1 |
STARD10 |
StAR-related lipid transfer (START) domain containing 10 |
| chr12_-_54785054 | 1.82 |
ENST00000352268.6 ENST00000549962.1 |
ZNF385A |
zinc finger protein 385A |
| chr16_+_68679193 | 1.81 |
ENST00000581171.1 |
CDH3 |
cadherin 3, type 1, P-cadherin (placental) |
| chr19_-_51456344 | 1.79 |
ENST00000336334.3 ENST00000593428.1 |
KLK5 |
kallikrein-related peptidase 5 |
| chr8_+_27348649 | 1.77 |
ENST00000521780.1 ENST00000380476.3 ENST00000518379.1 ENST00000521684.1 |
EPHX2 |
epoxide hydrolase 2, cytoplasmic |
| chr19_-_51456198 | 1.77 |
ENST00000594846.1 |
KLK5 |
kallikrein-related peptidase 5 |
| chr14_-_21994525 | 1.75 |
ENST00000538754.1 |
SALL2 |
spalt-like transcription factor 2 |
| chr22_-_43583079 | 1.75 |
ENST00000216129.6 |
TTLL12 |
tubulin tyrosine ligase-like family, member 12 |
| chr19_-_51456321 | 1.75 |
ENST00000391809.2 |
KLK5 |
kallikrein-related peptidase 5 |
| chr22_-_20255212 | 1.69 |
ENST00000416372.1 |
RTN4R |
reticulon 4 receptor |
| chr17_+_73521763 | 1.68 |
ENST00000167462.5 ENST00000375227.4 ENST00000392550.3 ENST00000578363.1 ENST00000579392.1 |
LLGL2 |
lethal giant larvae homolog 2 (Drosophila) |
| chr1_-_9970227 | 1.66 |
ENST00000377263.1 |
CTNNBIP1 |
catenin, beta interacting protein 1 |
| chr6_+_37137939 | 1.66 |
ENST00000373509.5 |
PIM1 |
pim-1 oncogene |
| chr19_+_39279838 | 1.66 |
ENST00000314980.4 |
LGALS7B |
lectin, galactoside-binding, soluble, 7B |
| chr16_+_67233007 | 1.65 |
ENST00000360833.1 ENST00000393997.2 |
ELMO3 |
engulfment and cell motility 3 |
| chr8_+_27348626 | 1.64 |
ENST00000517536.1 |
EPHX2 |
epoxide hydrolase 2, cytoplasmic |
| chr1_+_15250596 | 1.63 |
ENST00000361144.5 |
KAZN |
kazrin, periplakin interacting protein |
| chr1_-_201368653 | 1.61 |
ENST00000367313.3 |
LAD1 |
ladinin 1 |
| chr8_+_86376081 | 1.61 |
ENST00000285379.5 |
CA2 |
carbonic anhydrase II |
| chr9_+_139685782 | 1.59 |
ENST00000290079.8 ENST00000456614.2 |
TMEM141 RP11-216L13.17 |
transmembrane protein 141 RP11-216L13.17 |
| chr7_+_145813453 | 1.59 |
ENST00000361727.3 |
CNTNAP2 |
contactin associated protein-like 2 |
| chr12_-_51785182 | 1.59 |
ENST00000356317.3 ENST00000603188.1 ENST00000604847.1 ENST00000604506.1 |
GALNT6 |
UDP-N-acetyl-alpha-D-galactosamine:polypeptide N-acetylgalactosaminyltransferase 6 (GalNAc-T6) |
| chr17_+_48610074 | 1.57 |
ENST00000503690.1 ENST00000514874.1 ENST00000537145.1 ENST00000541226.1 |
EPN3 |
epsin 3 |
| chr8_-_127570603 | 1.57 |
ENST00000304916.3 |
FAM84B |
family with sequence similarity 84, member B |
| chr1_+_60280458 | 1.54 |
ENST00000455990.1 ENST00000371208.3 |
HOOK1 |
hook microtubule-tethering protein 1 |
| chr12_-_54785074 | 1.53 |
ENST00000338010.5 ENST00000550774.1 |
ZNF385A |
zinc finger protein 385A |
| chr1_-_209979465 | 1.53 |
ENST00000542854.1 |
IRF6 |
interferon regulatory factor 6 |
| chr20_+_35201857 | 1.53 |
ENST00000373874.2 |
TGIF2 |
TGFB-induced factor homeobox 2 |
| chr16_+_618837 | 1.51 |
ENST00000409439.2 |
PIGQ |
phosphatidylinositol glycan anchor biosynthesis, class Q |
| chr9_+_132099158 | 1.51 |
ENST00000444125.1 |
RP11-65J3.1 |
RP11-65J3.1 |
| chr14_-_92302825 | 1.49 |
ENST00000556018.1 |
TC2N |
tandem C2 domains, nuclear |
| chr12_-_56882136 | 1.49 |
ENST00000311966.4 |
GLS2 |
glutaminase 2 (liver, mitochondrial) |
| chr8_-_57233103 | 1.49 |
ENST00000303749.3 ENST00000522671.1 |
SDR16C5 |
short chain dehydrogenase/reductase family 16C, member 5 |
| chr22_-_45636650 | 1.48 |
ENST00000336156.5 |
KIAA0930 |
KIAA0930 |
| chr14_-_105647606 | 1.47 |
ENST00000392568.2 |
NUDT14 |
nudix (nucleoside diphosphate linked moiety X)-type motif 14 |
| chr18_-_78005231 | 1.47 |
ENST00000470488.2 ENST00000353265.3 |
PARD6G |
par-6 family cell polarity regulator gamma |
| chr19_+_4343691 | 1.46 |
ENST00000597036.1 |
MPND |
MPN domain containing |
| chr19_-_54984354 | 1.46 |
ENST00000301200.2 |
CDC42EP5 |
CDC42 effector protein (Rho GTPase binding) 5 |
| chr16_+_3115298 | 1.46 |
ENST00000325568.5 ENST00000534507.1 |
IL32 |
interleukin 32 |
| chr14_+_94640633 | 1.45 |
ENST00000304338.3 |
PPP4R4 |
protein phosphatase 4, regulatory subunit 4 |
| chr22_+_40390930 | 1.45 |
ENST00000333407.6 |
FAM83F |
family with sequence similarity 83, member F |
| chr15_+_101420028 | 1.45 |
ENST00000557963.1 ENST00000346623.6 |
ALDH1A3 |
aldehyde dehydrogenase 1 family, member A3 |
| chr14_-_92302784 | 1.45 |
ENST00000340892.5 ENST00000360594.5 |
TC2N |
tandem C2 domains, nuclear |
| chr15_+_43885252 | 1.44 |
ENST00000453782.1 ENST00000300283.6 ENST00000437924.1 ENST00000450086.2 |
CKMT1B |
creatine kinase, mitochondrial 1B |
| chr2_+_85360499 | 1.44 |
ENST00000282111.3 |
TCF7L1 |
transcription factor 7-like 1 (T-cell specific, HMG-box) |
| chr1_+_211432700 | 1.43 |
ENST00000452621.2 |
RCOR3 |
REST corepressor 3 |
| chr19_-_39264072 | 1.43 |
ENST00000599035.1 ENST00000378626.4 |
LGALS7 |
lectin, galactoside-binding, soluble, 7 |
| chr2_+_64681219 | 1.43 |
ENST00000238875.5 |
LGALSL |
lectin, galactoside-binding-like |
| chr9_+_133971909 | 1.42 |
ENST00000247291.3 ENST00000372302.1 ENST00000372300.1 ENST00000372298.1 |
AIF1L |
allograft inflammatory factor 1-like |
| chr19_-_38746979 | 1.42 |
ENST00000591291.1 |
PPP1R14A |
protein phosphatase 1, regulatory (inhibitor) subunit 14A |
| chr19_+_34287174 | 1.42 |
ENST00000587559.1 ENST00000588637.1 |
KCTD15 |
potassium channel tetramerization domain containing 15 |
| chr2_+_220306745 | 1.42 |
ENST00000431523.1 ENST00000396698.1 ENST00000396695.2 |
SPEG |
SPEG complex locus |
| chr15_+_43985084 | 1.41 |
ENST00000434505.1 ENST00000411750.1 |
CKMT1A |
creatine kinase, mitochondrial 1A |
| chr19_+_35609380 | 1.41 |
ENST00000604621.1 |
FXYD3 |
FXYD domain containing ion transport regulator 3 |
| chr12_+_133066137 | 1.40 |
ENST00000434748.2 |
FBRSL1 |
fibrosin-like 1 |
| chr11_+_134201911 | 1.39 |
ENST00000389881.3 |
GLB1L2 |
galactosidase, beta 1-like 2 |
| chr17_-_76124711 | 1.39 |
ENST00000306591.7 ENST00000590602.1 |
TMC6 |
transmembrane channel-like 6 |
| chr1_-_153588765 | 1.38 |
ENST00000368701.1 ENST00000344616.2 |
S100A14 |
S100 calcium binding protein A14 |
| chr17_-_882966 | 1.38 |
ENST00000336868.3 |
NXN |
nucleoredoxin |
| chr10_+_23728198 | 1.37 |
ENST00000376495.3 |
OTUD1 |
OTU domain containing 1 |
| chr5_-_175964366 | 1.37 |
ENST00000274811.4 |
RNF44 |
ring finger protein 44 |
| chr1_+_33207381 | 1.37 |
ENST00000401073.2 |
KIAA1522 |
KIAA1522 |
| chr1_+_203274639 | 1.37 |
ENST00000290551.4 |
BTG2 |
BTG family, member 2 |
| chr6_-_32157947 | 1.36 |
ENST00000375050.4 |
PBX2 |
pre-B-cell leukemia homeobox 2 |
| chrX_-_102565858 | 1.36 |
ENST00000449185.1 ENST00000536889.1 |
BEX2 |
brain expressed X-linked 2 |
| chr9_-_135996537 | 1.35 |
ENST00000372050.3 ENST00000372047.3 |
RALGDS |
ral guanine nucleotide dissociation stimulator |
| chr19_-_51504852 | 1.35 |
ENST00000391806.2 ENST00000347619.4 ENST00000291726.7 ENST00000320838.5 |
KLK8 |
kallikrein-related peptidase 8 |
| chr20_+_35201993 | 1.35 |
ENST00000373872.4 |
TGIF2 |
TGFB-induced factor homeobox 2 |
| chr16_-_31147020 | 1.34 |
ENST00000568261.1 ENST00000567797.1 ENST00000317508.6 |
PRSS8 |
protease, serine, 8 |
| chr19_-_38747172 | 1.34 |
ENST00000347262.4 ENST00000591585.1 ENST00000301242.4 |
PPP1R14A |
protein phosphatase 1, regulatory (inhibitor) subunit 14A |
| chr16_+_1203194 | 1.34 |
ENST00000348261.5 ENST00000358590.4 |
CACNA1H |
calcium channel, voltage-dependent, T type, alpha 1H subunit |
| chr1_-_209979375 | 1.34 |
ENST00000367021.3 |
IRF6 |
interferon regulatory factor 6 |
| chr9_+_133971863 | 1.33 |
ENST00000372309.3 |
AIF1L |
allograft inflammatory factor 1-like |
| chr11_+_64073022 | 1.33 |
ENST00000406310.1 ENST00000000442.6 ENST00000539594.1 |
ESRRA |
estrogen-related receptor alpha |
| chr6_+_125475335 | 1.33 |
ENST00000532429.1 ENST00000534199.1 |
TPD52L1 |
tumor protein D52-like 1 |
| chr8_-_99837856 | 1.32 |
ENST00000518165.1 ENST00000419617.2 |
STK3 |
serine/threonine kinase 3 |
| chr19_-_49258606 | 1.31 |
ENST00000310160.3 |
FUT1 |
fucosyltransferase 1 (galactoside 2-alpha-L-fucosyltransferase, H blood group) |
| chr8_-_144952631 | 1.31 |
ENST00000525985.1 |
EPPK1 |
epiplakin 1 |
| chr7_-_143105941 | 1.31 |
ENST00000275815.3 |
EPHA1 |
EPH receptor A1 |
| chr19_+_35607166 | 1.30 |
ENST00000604255.1 ENST00000346446.5 ENST00000344013.6 ENST00000603449.1 ENST00000406988.1 ENST00000605550.1 ENST00000604804.1 ENST00000605552.1 |
FXYD3 |
FXYD domain containing ion transport regulator 3 |
| chr20_+_58179582 | 1.30 |
ENST00000371015.1 ENST00000395639.4 |
PHACTR3 |
phosphatase and actin regulator 3 |
| chr4_+_85504075 | 1.30 |
ENST00000295887.5 |
CDS1 |
CDP-diacylglycerol synthase (phosphatidate cytidylyltransferase) 1 |
| chr19_+_17581253 | 1.29 |
ENST00000252595.7 ENST00000598424.1 |
SLC27A1 |
solute carrier family 27 (fatty acid transporter), member 1 |
| chr3_-_185542817 | 1.29 |
ENST00000382199.2 |
IGF2BP2 |
insulin-like growth factor 2 mRNA binding protein 2 |
| chrX_-_3631635 | 1.29 |
ENST00000262848.5 |
PRKX |
protein kinase, X-linked |
| chr1_-_160990886 | 1.28 |
ENST00000537746.1 |
F11R |
F11 receptor |
| chr9_-_124976154 | 1.27 |
ENST00000482062.1 |
LHX6 |
LIM homeobox 6 |
| chr1_-_231175964 | 1.27 |
ENST00000366654.4 |
FAM89A |
family with sequence similarity 89, member A |
| chr10_+_111985713 | 1.27 |
ENST00000239007.7 |
MXI1 |
MAX interactor 1, dimerization protein |
| chr2_-_235405679 | 1.27 |
ENST00000390645.2 |
ARL4C |
ADP-ribosylation factor-like 4C |
| chr19_-_11450249 | 1.27 |
ENST00000222120.3 |
RAB3D |
RAB3D, member RAS oncogene family |
| chr1_-_153588334 | 1.26 |
ENST00000476873.1 |
S100A14 |
S100 calcium binding protein A14 |
| chr17_-_74497432 | 1.26 |
ENST00000590288.1 ENST00000313080.4 ENST00000592123.1 ENST00000591255.1 ENST00000585989.1 ENST00000591697.1 ENST00000389760.4 |
RHBDF2 |
rhomboid 5 homolog 2 (Drosophila) |
| chr8_-_134309823 | 1.26 |
ENST00000414097.2 |
NDRG1 |
N-myc downstream regulated 1 |
| chr3_-_12800751 | 1.26 |
ENST00000435218.2 ENST00000435575.1 |
TMEM40 |
transmembrane protein 40 |
| chr8_-_134309335 | 1.25 |
ENST00000522890.1 ENST00000323851.7 ENST00000518176.1 ENST00000354944.5 ENST00000537882.1 ENST00000522476.1 ENST00000518066.1 ENST00000521544.1 ENST00000518480.1 ENST00000523892.1 |
NDRG1 |
N-myc downstream regulated 1 |
| chr18_-_28682374 | 1.25 |
ENST00000280904.6 |
DSC2 |
desmocollin 2 |
| chr12_+_50017327 | 1.25 |
ENST00000261897.1 |
PRPF40B |
PRP40 pre-mRNA processing factor 40 homolog B (S. cerevisiae) |
| chr17_+_29718642 | 1.25 |
ENST00000325874.8 |
RAB11FIP4 |
RAB11 family interacting protein 4 (class II) |
| chr19_-_2721336 | 1.25 |
ENST00000588128.1 |
DIRAS1 |
DIRAS family, GTP-binding RAS-like 1 |
| chr17_+_7942424 | 1.24 |
ENST00000573359.1 |
ALOX15B |
arachidonate 15-lipoxygenase, type B |
| chr16_+_68771128 | 1.24 |
ENST00000261769.5 ENST00000422392.2 |
CDH1 |
cadherin 1, type 1, E-cadherin (epithelial) |
| chr17_-_42277203 | 1.23 |
ENST00000587097.1 |
ATXN7L3 |
ataxin 7-like 3 |
| chr9_+_140500087 | 1.22 |
ENST00000371421.4 |
ARRDC1 |
arrestin domain containing 1 |
| chr12_+_58148842 | 1.22 |
ENST00000266643.5 |
MARCH9 |
membrane-associated ring finger (C3HC4) 9 |
| chr2_+_30369859 | 1.22 |
ENST00000402003.3 |
YPEL5 |
yippee-like 5 (Drosophila) |
| chr8_+_86089460 | 1.22 |
ENST00000418930.2 |
E2F5 |
E2F transcription factor 5, p130-binding |
| chr1_-_117210290 | 1.21 |
ENST00000369483.1 ENST00000369486.3 |
IGSF3 |
immunoglobulin superfamily, member 3 |
| chr1_-_113258090 | 1.21 |
ENST00000309276.6 |
PPM1J |
protein phosphatase, Mg2+/Mn2+ dependent, 1J |
| chr8_+_86089619 | 1.21 |
ENST00000256117.5 ENST00000416274.2 |
E2F5 |
E2F transcription factor 5, p130-binding |
| chr19_-_44143939 | 1.21 |
ENST00000222374.2 |
CADM4 |
cell adhesion molecule 4 |
| chr1_+_43996518 | 1.21 |
ENST00000359947.4 ENST00000438120.1 |
PTPRF |
protein tyrosine phosphatase, receptor type, F |
| chrX_+_152953505 | 1.21 |
ENST00000253122.5 |
SLC6A8 |
solute carrier family 6 (neurotransmitter transporter), member 8 |
| chr19_+_38755203 | 1.20 |
ENST00000587090.1 ENST00000454580.3 |
SPINT2 |
serine peptidase inhibitor, Kunitz type, 2 |
| chr7_-_44265492 | 1.19 |
ENST00000425809.1 |
CAMK2B |
calcium/calmodulin-dependent protein kinase II beta |
| chr19_+_45281118 | 1.18 |
ENST00000270279.3 ENST00000341505.4 |
CBLC |
Cbl proto-oncogene C, E3 ubiquitin protein ligase |
| chr1_-_23810664 | 1.18 |
ENST00000336689.3 ENST00000437606.2 |
ASAP3 |
ArfGAP with SH3 domain, ankyrin repeat and PH domain 3 |
| chr11_+_64002292 | 1.18 |
ENST00000426086.2 |
VEGFB |
vascular endothelial growth factor B |
| chr1_-_113257905 | 1.18 |
ENST00000464951.1 |
PPM1J |
protein phosphatase, Mg2+/Mn2+ dependent, 1J |
| chr11_+_394196 | 1.17 |
ENST00000331563.2 ENST00000531857.1 |
PKP3 |
plakophilin 3 |
| chr19_-_36001286 | 1.17 |
ENST00000602679.1 ENST00000492341.2 ENST00000472252.2 ENST00000602781.1 ENST00000402589.2 ENST00000458071.1 ENST00000436012.1 ENST00000443640.1 ENST00000450261.1 ENST00000467637.1 ENST00000480502.1 ENST00000474928.1 ENST00000414866.2 ENST00000392206.2 ENST00000488892.1 |
DMKN |
dermokine |
| chr1_+_26856236 | 1.17 |
ENST00000374168.2 ENST00000374166.4 |
RPS6KA1 |
ribosomal protein S6 kinase, 90kDa, polypeptide 1 |
| chr10_+_48355024 | 1.16 |
ENST00000395702.2 ENST00000442001.1 ENST00000433077.1 ENST00000436850.1 ENST00000494156.1 ENST00000586537.1 |
ZNF488 |
zinc finger protein 488 |
| chr17_-_34122596 | 1.16 |
ENST00000250144.8 |
MMP28 |
matrix metallopeptidase 28 |
| chr6_+_41606176 | 1.16 |
ENST00000441667.1 ENST00000230321.6 ENST00000373050.4 ENST00000446650.1 ENST00000435476.1 |
MDFI |
MyoD family inhibitor |
| chr19_+_4343584 | 1.16 |
ENST00000596722.1 |
MPND |
MPN domain containing |
| chr1_+_955448 | 1.16 |
ENST00000379370.2 |
AGRN |
agrin |
| chr11_-_72353451 | 1.15 |
ENST00000376450.3 |
PDE2A |
phosphodiesterase 2A, cGMP-stimulated |
| chr11_-_119234876 | 1.15 |
ENST00000525735.1 |
USP2 |
ubiquitin specific peptidase 2 |
| chr9_-_100935043 | 1.15 |
ENST00000343933.5 |
CORO2A |
coronin, actin binding protein, 2A |
| chr15_+_41136216 | 1.15 |
ENST00000562057.1 ENST00000344051.4 |
SPINT1 |
serine peptidase inhibitor, Kunitz type 1 |
| chr8_+_95653302 | 1.15 |
ENST00000423620.2 ENST00000433389.2 |
ESRP1 |
epithelial splicing regulatory protein 1 |
| chr17_+_7942335 | 1.14 |
ENST00000380183.4 ENST00000572022.1 ENST00000380173.2 |
ALOX15B |
arachidonate 15-lipoxygenase, type B |
| chr17_-_76124812 | 1.14 |
ENST00000592063.1 ENST00000589271.1 ENST00000322933.4 ENST00000589553.1 |
TMC6 |
transmembrane channel-like 6 |
| chr10_-_14646388 | 1.14 |
ENST00000468747.1 ENST00000378467.4 |
FAM107B |
family with sequence similarity 107, member B |
| chr11_+_45944190 | 1.14 |
ENST00000401752.1 ENST00000389968.3 ENST00000325468.5 ENST00000536139.1 |
GYLTL1B |
glycosyltransferase-like 1B |
| chr19_+_45504688 | 1.13 |
ENST00000221452.8 ENST00000540120.1 ENST00000505236.1 |
RELB |
v-rel avian reticuloendotheliosis viral oncogene homolog B |
| chr19_+_38755042 | 1.13 |
ENST00000301244.7 |
SPINT2 |
serine peptidase inhibitor, Kunitz type, 2 |
| chr16_+_67233412 | 1.12 |
ENST00000477898.1 |
ELMO3 |
engulfment and cell motility 3 |
| chr2_+_64681103 | 1.12 |
ENST00000464281.1 |
LGALSL |
lectin, galactoside-binding-like |
| chr9_-_140196703 | 1.11 |
ENST00000356628.2 |
NRARP |
NOTCH-regulated ankyrin repeat protein |
| chr17_-_72869086 | 1.11 |
ENST00000581530.1 ENST00000420580.2 ENST00000455107.2 ENST00000413947.2 ENST00000581219.1 ENST00000582944.1 |
FDXR |
ferredoxin reductase |
| chr8_+_95653373 | 1.10 |
ENST00000358397.5 |
ESRP1 |
epithelial splicing regulatory protein 1 |
| chr17_+_78075361 | 1.10 |
ENST00000577106.1 ENST00000390015.3 |
GAA |
glucosidase, alpha; acid |
| chr17_-_42200996 | 1.10 |
ENST00000587135.1 ENST00000225983.6 ENST00000393622.2 ENST00000588703.1 |
HDAC5 |
histone deacetylase 5 |
| chr3_-_185542761 | 1.10 |
ENST00000457616.2 ENST00000346192.3 |
IGF2BP2 |
insulin-like growth factor 2 mRNA binding protein 2 |
| chr8_-_142011036 | 1.10 |
ENST00000520892.1 |
PTK2 |
protein tyrosine kinase 2 |
| chr14_+_24867992 | 1.10 |
ENST00000382554.3 |
NYNRIN |
NYN domain and retroviral integrase containing |
| chr1_+_11724167 | 1.10 |
ENST00000376753.4 |
FBXO6 |
F-box protein 6 |
| chr8_-_12051576 | 1.09 |
ENST00000524571.2 ENST00000533852.2 ENST00000533513.1 ENST00000448228.2 ENST00000534520.1 ENST00000321602.8 |
FAM86B1 |
family with sequence similarity 86, member B1 |
| chr9_-_124976185 | 1.09 |
ENST00000464484.2 |
LHX6 |
LIM homeobox 6 |
| chr14_+_96342729 | 1.09 |
ENST00000504119.1 |
LINC00617 |
long intergenic non-protein coding RNA 617 |
| chr16_+_89894875 | 1.09 |
ENST00000393062.2 |
SPIRE2 |
spire-type actin nucleation factor 2 |
| chr19_-_49864746 | 1.09 |
ENST00000598810.1 |
TEAD2 |
TEA domain family member 2 |
Gene Ontology Analysis
Gene overrepresentation in biological_process category:
| Log-likelihood per target | Total log-likelihood | Term | Description |
|---|---|---|---|
| 2.1 | 12.5 | GO:0006021 | inositol biosynthetic process(GO:0006021) |
| 1.7 | 15.4 | GO:0031444 | slow-twitch skeletal muscle fiber contraction(GO:0031444) |
| 1.2 | 7.0 | GO:0002803 | positive regulation of antimicrobial peptide production(GO:0002225) positive regulation of antimicrobial humoral response(GO:0002760) positive regulation of antibacterial peptide production(GO:0002803) |
| 1.2 | 3.5 | GO:1902910 | regulation of monophenol monooxygenase activity(GO:0032771) positive regulation of monophenol monooxygenase activity(GO:0032773) negative regulation of catagen(GO:0051796) regulation of hair cycle by canonical Wnt signaling pathway(GO:0060901) positive regulation of melanosome transport(GO:1902910) |
| 1.0 | 5.2 | GO:0010609 | mRNA localization resulting in posttranscriptional regulation of gene expression(GO:0010609) |
| 0.9 | 3.5 | GO:0046271 | phenylpropanoid catabolic process(GO:0046271) |
| 0.8 | 2.4 | GO:0002582 | positive regulation of antigen processing and presentation of peptide or polysaccharide antigen via MHC class II(GO:0002582) positive regulation of antigen processing and presentation of peptide antigen(GO:0002585) positive regulation of antigen processing and presentation of peptide antigen via MHC class II(GO:0002588) |
| 0.8 | 2.4 | GO:0006535 | cysteine biosynthetic process from serine(GO:0006535) |
| 0.7 | 2.0 | GO:0035419 | activation of MAPK activity involved in innate immune response(GO:0035419) |
| 0.7 | 2.0 | GO:0033693 | neurofilament bundle assembly(GO:0033693) |
| 0.6 | 3.9 | GO:2001181 | positive regulation of interleukin-10 secretion(GO:2001181) |
| 0.6 | 1.9 | GO:0048320 | axial mesoderm formation(GO:0048320) |
| 0.6 | 3.2 | GO:0060672 | epithelial cell differentiation involved in embryonic placenta development(GO:0060671) epithelial cell morphogenesis involved in placental branching(GO:0060672) |
| 0.6 | 3.2 | GO:0061146 | Peyer's patch morphogenesis(GO:0061146) |
| 0.6 | 1.9 | GO:0035526 | retrograde transport, plasma membrane to Golgi(GO:0035526) |
| 0.6 | 3.1 | GO:0097114 | NMDA glutamate receptor clustering(GO:0097114) |
| 0.6 | 3.1 | GO:1904274 | tricellular tight junction assembly(GO:1904274) |
| 0.6 | 2.4 | GO:1902499 | positive regulation of protein autoubiquitination(GO:1902499) |
| 0.6 | 6.4 | GO:0086042 | cardiac muscle cell-cardiac muscle cell adhesion(GO:0086042) |
| 0.6 | 0.6 | GO:0046855 | phosphorylated carbohydrate dephosphorylation(GO:0046838) inositol phosphate dephosphorylation(GO:0046855) |
| 0.6 | 1.7 | GO:1904800 | negative regulation of dendrite extension(GO:1903860) regulation of neuron remodeling(GO:1904799) negative regulation of neuron remodeling(GO:1904800) negative regulation of branching morphogenesis of a nerve(GO:2000173) |
| 0.6 | 1.7 | GO:0002528 | regulation of vascular permeability involved in acute inflammatory response(GO:0002528) |
| 0.5 | 1.6 | GO:0071109 | superior temporal gyrus development(GO:0071109) |
| 0.5 | 1.6 | GO:0060166 | olfactory pit development(GO:0060166) |
| 0.5 | 4.1 | GO:0060120 | auditory receptor cell fate commitment(GO:0009912) inner ear receptor cell fate commitment(GO:0060120) |
| 0.5 | 0.5 | GO:0003197 | endocardial cushion development(GO:0003197) |
| 0.5 | 2.0 | GO:2001287 | negative regulation of caveolin-mediated endocytosis(GO:2001287) |
| 0.5 | 2.0 | GO:0033277 | abortive mitotic cell cycle(GO:0033277) |
| 0.5 | 4.9 | GO:1900029 | positive regulation of ruffle assembly(GO:1900029) |
| 0.5 | 7.7 | GO:0021894 | cerebral cortex GABAergic interneuron development(GO:0021894) |
| 0.5 | 4.8 | GO:0006600 | creatine metabolic process(GO:0006600) |
| 0.5 | 1.4 | GO:0046066 | dGDP metabolic process(GO:0046066) |
| 0.5 | 1.9 | GO:0002086 | diaphragm contraction(GO:0002086) |
| 0.5 | 3.3 | GO:0051121 | hepoxilin metabolic process(GO:0051121) hepoxilin biosynthetic process(GO:0051122) |
| 0.5 | 0.9 | GO:0002159 | desmosome assembly(GO:0002159) |
| 0.5 | 1.4 | GO:0019243 | methylglyoxal catabolic process to D-lactate via S-lactoyl-glutathione(GO:0019243) methylglyoxal catabolic process(GO:0051596) methylglyoxal catabolic process to lactate(GO:0061727) |
| 0.5 | 1.4 | GO:0060129 | thyroid-stimulating hormone-secreting cell differentiation(GO:0060129) |
| 0.5 | 2.7 | GO:0070560 | protein secretion by platelet(GO:0070560) |
| 0.5 | 1.4 | GO:0042351 | 'de novo' GDP-L-fucose biosynthetic process(GO:0042351) |
| 0.4 | 1.3 | GO:0061394 | regulation of transcription from RNA polymerase II promoter in response to arsenic-containing substance(GO:0061394) |
| 0.4 | 1.3 | GO:0048627 | myoblast development(GO:0048627) |
| 0.4 | 6.0 | GO:0038203 | TORC2 signaling(GO:0038203) |
| 0.4 | 3.4 | GO:0031642 | negative regulation of myelination(GO:0031642) |
| 0.4 | 2.1 | GO:0018125 | peptidyl-cysteine methylation(GO:0018125) |
| 0.4 | 1.7 | GO:0050976 | detection of mechanical stimulus involved in sensory perception of touch(GO:0050976) |
| 0.4 | 1.3 | GO:0046103 | adenosine catabolic process(GO:0006154) inosine biosynthetic process(GO:0046103) |
| 0.4 | 1.7 | GO:0060448 | dichotomous subdivision of terminal units involved in lung branching(GO:0060448) |
| 0.4 | 1.7 | GO:0071955 | recycling endosome to Golgi transport(GO:0071955) |
| 0.4 | 4.2 | GO:0046940 | nucleoside monophosphate phosphorylation(GO:0046940) |
| 0.4 | 1.2 | GO:0014028 | notochord formation(GO:0014028) |
| 0.4 | 1.2 | GO:0042361 | menaquinone catabolic process(GO:0042361) vitamin K catabolic process(GO:0042377) |
| 0.4 | 0.4 | GO:1905064 | negative regulation of vascular smooth muscle cell differentiation(GO:1905064) |
| 0.4 | 2.0 | GO:1901091 | regulation of protein tetramerization(GO:1901090) negative regulation of protein tetramerization(GO:1901091) regulation of protein homotetramerization(GO:1901093) negative regulation of protein homotetramerization(GO:1901094) |
| 0.4 | 2.4 | GO:2000048 | negative regulation of cell-cell adhesion mediated by cadherin(GO:2000048) |
| 0.4 | 0.4 | GO:0046136 | positive regulation of vitamin metabolic process(GO:0046136) positive regulation of vitamin D biosynthetic process(GO:0060557) positive regulation of calcidiol 1-monooxygenase activity(GO:0060559) |
| 0.4 | 1.1 | GO:0030037 | actin filament reorganization involved in cell cycle(GO:0030037) |
| 0.4 | 1.5 | GO:0048867 | stem cell fate determination(GO:0048867) |
| 0.4 | 1.1 | GO:0042938 | dipeptide transport(GO:0042938) |
| 0.4 | 4.5 | GO:0032782 | bile acid secretion(GO:0032782) |
| 0.4 | 0.7 | GO:1901656 | glycoside transport(GO:1901656) |
| 0.4 | 1.1 | GO:0045994 | positive regulation of translational initiation by iron(GO:0045994) |
| 0.4 | 1.4 | GO:0033159 | negative regulation of protein import into nucleus, translocation(GO:0033159) |
| 0.4 | 1.4 | GO:0042360 | vitamin E metabolic process(GO:0042360) |
| 0.4 | 1.1 | GO:1900220 | semaphorin-plexin signaling pathway involved in bone trabecula morphogenesis(GO:1900220) |
| 0.4 | 1.1 | GO:0051685 | maintenance of ER location(GO:0051685) |
| 0.4 | 1.4 | GO:0060066 | oviduct development(GO:0060066) |
| 0.3 | 2.1 | GO:1903237 | negative regulation of leukocyte tethering or rolling(GO:1903237) |
| 0.3 | 0.7 | GO:0031587 | positive regulation of inositol 1,4,5-trisphosphate-sensitive calcium-release channel activity(GO:0031587) |
| 0.3 | 0.3 | GO:0060574 | intestinal epithelial cell maturation(GO:0060574) |
| 0.3 | 1.7 | GO:1903412 | response to bile acid(GO:1903412) |
| 0.3 | 1.7 | GO:0003430 | growth plate cartilage chondrocyte growth(GO:0003430) |
| 0.3 | 1.3 | GO:0009386 | translational attenuation(GO:0009386) |
| 0.3 | 1.7 | GO:2000468 | negative regulation of dopamine uptake involved in synaptic transmission(GO:0051585) norepinephrine uptake(GO:0051620) regulation of norepinephrine uptake(GO:0051621) negative regulation of norepinephrine uptake(GO:0051622) negative regulation of catecholamine uptake involved in synaptic transmission(GO:0051945) regulation of glutathione peroxidase activity(GO:1903282) positive regulation of glutathione peroxidase activity(GO:1903284) positive regulation of hydrogen peroxide catabolic process(GO:1903285) regulation of peroxidase activity(GO:2000468) positive regulation of peroxidase activity(GO:2000470) |
| 0.3 | 1.3 | GO:1904398 | positive regulation of neuromuscular junction development(GO:1904398) |
| 0.3 | 1.0 | GO:0018153 | isopeptide cross-linking via N6-(L-isoglutamyl)-L-lysine(GO:0018153) isopeptide cross-linking(GO:0018262) |
| 0.3 | 2.0 | GO:0007386 | compartment pattern specification(GO:0007386) |
| 0.3 | 2.9 | GO:0048875 | chemical homeostasis within a tissue(GO:0048875) |
| 0.3 | 1.3 | GO:0097010 | eukaryotic translation initiation factor 4F complex assembly(GO:0097010) |
| 0.3 | 1.0 | GO:1904806 | regulation of protein oxidation(GO:1904806) positive regulation of protein oxidation(GO:1904808) |
| 0.3 | 1.0 | GO:0000117 | regulation of transcription involved in G2/M transition of mitotic cell cycle(GO:0000117) |
| 0.3 | 2.2 | GO:0071072 | negative regulation of phospholipid biosynthetic process(GO:0071072) |
| 0.3 | 1.9 | GO:1903575 | cornified envelope assembly(GO:1903575) |
| 0.3 | 0.9 | GO:0043000 | Golgi to plasma membrane CFTR protein transport(GO:0043000) |
| 0.3 | 1.2 | GO:0030311 | poly-N-acetyllactosamine biosynthetic process(GO:0030311) |
| 0.3 | 1.5 | GO:0009439 | cyanate metabolic process(GO:0009439) cyanate catabolic process(GO:0009440) |
| 0.3 | 0.6 | GO:0002352 | B cell negative selection(GO:0002352) post-embryonic camera-type eye morphogenesis(GO:0048597) |
| 0.3 | 0.6 | GO:0010863 | positive regulation of phospholipase C activity(GO:0010863) |
| 0.3 | 0.9 | GO:0045014 | carbon catabolite repression of transcription(GO:0045013) negative regulation of transcription by glucose(GO:0045014) |
| 0.3 | 0.9 | GO:1904580 | regulation of intracellular mRNA localization(GO:1904580) positive regulation of intracellular mRNA localization(GO:1904582) |
| 0.3 | 1.2 | GO:2000820 | negative regulation of transcription from RNA polymerase II promoter involved in smooth muscle cell differentiation(GO:2000820) |
| 0.3 | 1.7 | GO:0042335 | cuticle development(GO:0042335) |
| 0.3 | 2.0 | GO:0007621 | negative regulation of female receptivity(GO:0007621) |
| 0.3 | 1.7 | GO:1902445 | regulation of mitochondrial membrane permeability involved in programmed necrotic cell death(GO:1902445) |
| 0.3 | 0.3 | GO:0006433 | prolyl-tRNA aminoacylation(GO:0006433) |
| 0.3 | 1.1 | GO:0007185 | transmembrane receptor protein tyrosine phosphatase signaling pathway(GO:0007185) |
| 0.3 | 0.6 | GO:0003415 | chondrocyte hypertrophy(GO:0003415) |
| 0.3 | 0.3 | GO:0060623 | regulation of chromosome condensation(GO:0060623) |
| 0.3 | 1.4 | GO:0006543 | glutamine catabolic process(GO:0006543) |
| 0.3 | 3.1 | GO:0032287 | peripheral nervous system myelin maintenance(GO:0032287) |
| 0.3 | 0.8 | GO:0021722 | superior olivary nucleus development(GO:0021718) superior olivary nucleus maturation(GO:0021722) |
| 0.3 | 1.7 | GO:0010918 | positive regulation of mitochondrial membrane potential(GO:0010918) |
| 0.3 | 0.3 | GO:0097252 | oligodendrocyte apoptotic process(GO:0097252) |
| 0.3 | 2.2 | GO:0035897 | proteolysis in other organism(GO:0035897) |
| 0.3 | 1.1 | GO:1903936 | response to sodium arsenite(GO:1903935) cellular response to sodium arsenite(GO:1903936) |
| 0.3 | 0.5 | GO:0035408 | histone H3-T6 phosphorylation(GO:0035408) |
| 0.3 | 0.5 | GO:1903519 | apoptotic process involved in mammary gland involution(GO:0060057) positive regulation of apoptotic process involved in mammary gland involution(GO:0060058) positive regulation of apoptotic process involved in morphogenesis(GO:1902339) regulation of mammary gland involution(GO:1903519) positive regulation of mammary gland involution(GO:1903521) positive regulation of apoptotic process involved in development(GO:1904747) |
| 0.3 | 1.9 | GO:0014807 | regulation of somitogenesis(GO:0014807) |
| 0.3 | 1.6 | GO:0016480 | negative regulation of transcription from RNA polymerase III promoter(GO:0016480) |
| 0.3 | 0.3 | GO:0032912 | negative regulation of transforming growth factor beta2 production(GO:0032912) |
| 0.3 | 2.7 | GO:0032020 | ISG15-protein conjugation(GO:0032020) |
| 0.3 | 1.6 | GO:0060373 | regulation of ventricular cardiac muscle cell membrane depolarization(GO:0060373) |
| 0.3 | 0.8 | GO:0044209 | AMP salvage(GO:0044209) |
| 0.3 | 1.3 | GO:0060800 | regulation of cell differentiation involved in embryonic placenta development(GO:0060800) |
| 0.3 | 0.8 | GO:0002949 | tRNA threonylcarbamoyladenosine modification(GO:0002949) |
| 0.3 | 1.3 | GO:0009181 | purine nucleoside diphosphate catabolic process(GO:0009137) purine ribonucleoside diphosphate catabolic process(GO:0009181) |
| 0.3 | 1.5 | GO:0060754 | positive regulation of mast cell chemotaxis(GO:0060754) |
| 0.2 | 0.7 | GO:0009786 | regulation of asymmetric cell division(GO:0009786) |
| 0.2 | 2.0 | GO:2000138 | positive regulation of cell proliferation involved in heart morphogenesis(GO:2000138) |
| 0.2 | 1.7 | GO:0097428 | protein maturation by iron-sulfur cluster transfer(GO:0097428) |
| 0.2 | 0.7 | GO:0019858 | cytosine metabolic process(GO:0019858) |
| 0.2 | 0.5 | GO:1902227 | negative regulation of macrophage colony-stimulating factor signaling pathway(GO:1902227) negative regulation of response to macrophage colony-stimulating factor(GO:1903970) negative regulation of cellular response to macrophage colony-stimulating factor stimulus(GO:1903973) |
| 0.2 | 0.7 | GO:0045658 | regulation of neutrophil differentiation(GO:0045658) negative regulation of neutrophil differentiation(GO:0045659) |
| 0.2 | 0.2 | GO:0007296 | vitellogenesis(GO:0007296) |
| 0.2 | 1.2 | GO:0001306 | age-dependent response to oxidative stress(GO:0001306) age-dependent response to reactive oxygen species(GO:0001315) regulation of systemic arterial blood pressure by acetylcholine(GO:0003068) vasodilation by acetylcholine involved in regulation of systemic arterial blood pressure(GO:0003069) regulation of systemic arterial blood pressure by neurotransmitter(GO:0003070) age-dependent general metabolic decline(GO:0007571) |
| 0.2 | 1.7 | GO:2000491 | positive regulation of hepatic stellate cell activation(GO:2000491) |
| 0.2 | 1.5 | GO:2000489 | regulation of hepatic stellate cell activation(GO:2000489) negative regulation of hepatic stellate cell activation(GO:2000490) |
| 0.2 | 1.2 | GO:0071460 | cellular response to cell-matrix adhesion(GO:0071460) |
| 0.2 | 0.7 | GO:1900224 | positive regulation of nodal signaling pathway involved in determination of lateral mesoderm left/right asymmetry(GO:1900224) |
| 0.2 | 0.5 | GO:0006434 | seryl-tRNA aminoacylation(GO:0006434) |
| 0.2 | 1.7 | GO:0032808 | lacrimal gland development(GO:0032808) |
| 0.2 | 0.7 | GO:0002894 | positive regulation of type IIa hypersensitivity(GO:0001798) positive regulation of type II hypersensitivity(GO:0002894) |
| 0.2 | 0.2 | GO:0030309 | poly-N-acetyllactosamine metabolic process(GO:0030309) |
| 0.2 | 2.6 | GO:0048680 | positive regulation of axon regeneration(GO:0048680) |
| 0.2 | 0.2 | GO:0032736 | positive regulation of interleukin-13 production(GO:0032736) |
| 0.2 | 0.7 | GO:0006258 | UDP-glucose catabolic process(GO:0006258) |
| 0.2 | 1.4 | GO:0008063 | Toll signaling pathway(GO:0008063) |
| 0.2 | 0.5 | GO:0016561 | protein import into peroxisome matrix, translocation(GO:0016561) |
| 0.2 | 1.2 | GO:0010760 | negative regulation of macrophage chemotaxis(GO:0010760) |
| 0.2 | 0.9 | GO:1904046 | negative regulation of vascular endothelial growth factor production(GO:1904046) |
| 0.2 | 0.7 | GO:1903031 | regulation of microtubule plus-end binding(GO:1903031) positive regulation of microtubule plus-end binding(GO:1903033) |
| 0.2 | 0.7 | GO:0097212 | lysosomal membrane organization(GO:0097212) |
| 0.2 | 2.5 | GO:0060670 | branching involved in labyrinthine layer morphogenesis(GO:0060670) |
| 0.2 | 0.2 | GO:0036289 | peptidyl-serine autophosphorylation(GO:0036289) |
| 0.2 | 0.7 | GO:0090341 | negative regulation of secretion of lysosomal enzymes(GO:0090341) |
| 0.2 | 0.2 | GO:0048511 | rhythmic process(GO:0048511) |
| 0.2 | 0.2 | GO:1900110 | negative regulation of histone H3-K9 dimethylation(GO:1900110) |
| 0.2 | 0.5 | GO:0044752 | response to human chorionic gonadotropin(GO:0044752) |
| 0.2 | 0.4 | GO:0060440 | trachea formation(GO:0060440) |
| 0.2 | 1.1 | GO:0006015 | 5-phosphoribose 1-diphosphate biosynthetic process(GO:0006015) 5-phosphoribose 1-diphosphate metabolic process(GO:0046391) |
| 0.2 | 0.6 | GO:0035544 | negative regulation of SNARE complex assembly(GO:0035544) |
| 0.2 | 0.2 | GO:0045578 | negative regulation of B cell differentiation(GO:0045578) |
| 0.2 | 1.3 | GO:0001807 | regulation of type IV hypersensitivity(GO:0001807) |
| 0.2 | 0.4 | GO:0021558 | trochlear nerve development(GO:0021558) |
| 0.2 | 1.9 | GO:0034720 | histone H3-K4 demethylation(GO:0034720) |
| 0.2 | 0.4 | GO:0071963 | establishment or maintenance of cell polarity regulating cell shape(GO:0071963) |
| 0.2 | 1.4 | GO:0098881 | exocytic insertion of neurotransmitter receptor to plasma membrane(GO:0098881) exocytic insertion of neurotransmitter receptor to postsynaptic membrane(GO:0098967) |
| 0.2 | 3.3 | GO:0006531 | aspartate metabolic process(GO:0006531) |
| 0.2 | 0.2 | GO:0035915 | pore formation in membrane of other organism(GO:0035915) |
| 0.2 | 0.4 | GO:0019343 | cysteine biosynthetic process via cystathionine(GO:0019343) |
| 0.2 | 0.8 | GO:0072344 | rescue of stalled ribosome(GO:0072344) |
| 0.2 | 0.2 | GO:0050975 | sensory perception of touch(GO:0050975) |
| 0.2 | 0.4 | GO:0007406 | negative regulation of neuroblast proliferation(GO:0007406) |
| 0.2 | 1.0 | GO:0090261 | positive regulation of inclusion body assembly(GO:0090261) |
| 0.2 | 0.6 | GO:0098582 | innate vocalization behavior(GO:0098582) |
| 0.2 | 1.4 | GO:0034351 | regulation of glial cell apoptotic process(GO:0034350) negative regulation of glial cell apoptotic process(GO:0034351) |
| 0.2 | 0.8 | GO:0002268 | follicular dendritic cell differentiation(GO:0002268) |
| 0.2 | 0.2 | GO:1904393 | regulation of skeletal muscle acetylcholine-gated channel clustering(GO:1904393) |
| 0.2 | 1.8 | GO:0061302 | smooth muscle cell-matrix adhesion(GO:0061302) |
| 0.2 | 0.2 | GO:0044333 | Wnt signaling pathway involved in digestive tract morphogenesis(GO:0044333) |
| 0.2 | 0.4 | GO:0070814 | hydrogen sulfide biosynthetic process(GO:0070814) |
| 0.2 | 1.0 | GO:0006438 | valyl-tRNA aminoacylation(GO:0006438) |
| 0.2 | 1.2 | GO:0045218 | zonula adherens maintenance(GO:0045218) |
| 0.2 | 0.8 | GO:1902723 | negative regulation of skeletal muscle cell proliferation(GO:0014859) negative regulation of skeletal muscle satellite cell proliferation(GO:1902723) |
| 0.2 | 0.6 | GO:0045229 | cell envelope organization(GO:0043163) external encapsulating structure organization(GO:0045229) |
| 0.2 | 0.6 | GO:0031339 | negative regulation of vesicle fusion(GO:0031339) |
| 0.2 | 0.4 | GO:0010002 | cardioblast differentiation(GO:0010002) |
| 0.2 | 0.6 | GO:0033623 | regulation of integrin activation(GO:0033623) |
| 0.2 | 0.6 | GO:0046900 | tetrahydrofolylpolyglutamate metabolic process(GO:0046900) |
| 0.2 | 1.9 | GO:0042699 | follicle-stimulating hormone signaling pathway(GO:0042699) |
| 0.2 | 0.6 | GO:1904300 | positive regulation of neutrophil degranulation(GO:0043315) cellular response to gravity(GO:0071258) positive regulation of neutrophil activation(GO:1902565) regulation of transcytosis(GO:1904298) positive regulation of transcytosis(GO:1904300) regulation of maternal process involved in parturition(GO:1904301) positive regulation of maternal process involved in parturition(GO:1904303) response to 2-O-acetyl-1-O-hexadecyl-sn-glycero-3-phosphocholine(GO:1904316) cellular response to 2-O-acetyl-1-O-hexadecyl-sn-glycero-3-phosphocholine(GO:1904317) |
| 0.2 | 1.0 | GO:0001923 | B-1 B cell differentiation(GO:0001923) |
| 0.2 | 1.3 | GO:0070649 | polar body extrusion after meiotic divisions(GO:0040038) formin-nucleated actin cable assembly(GO:0070649) |
| 0.2 | 1.1 | GO:0035633 | maintenance of blood-brain barrier(GO:0035633) |
| 0.2 | 1.3 | GO:0070778 | L-aspartate transport(GO:0070778) L-aspartate transmembrane transport(GO:0089712) |
| 0.2 | 2.4 | GO:0018401 | peptidyl-proline hydroxylation to 4-hydroxy-L-proline(GO:0018401) |
| 0.2 | 0.9 | GO:0036324 | vascular endothelial growth factor receptor-2 signaling pathway(GO:0036324) |
| 0.2 | 0.9 | GO:0098502 | DNA dephosphorylation(GO:0098502) |
| 0.2 | 1.5 | GO:0006572 | tyrosine catabolic process(GO:0006572) |
| 0.2 | 0.7 | GO:0055099 | response to high density lipoprotein particle(GO:0055099) |
| 0.2 | 0.7 | GO:0042418 | epinephrine biosynthetic process(GO:0042418) |
| 0.2 | 0.2 | GO:2000182 | regulation of progesterone biosynthetic process(GO:2000182) |
| 0.2 | 0.2 | GO:0071603 | endothelial cell-cell adhesion(GO:0071603) |
| 0.2 | 0.7 | GO:0046909 | intermembrane transport(GO:0046909) protein transport from ciliary membrane to plasma membrane(GO:1903445) |
| 0.2 | 0.4 | GO:0002302 | CD8-positive, alpha-beta T cell differentiation involved in immune response(GO:0002302) |
| 0.2 | 0.2 | GO:0010633 | negative regulation of epithelial cell migration(GO:0010633) |
| 0.2 | 0.4 | GO:0002316 | follicular B cell differentiation(GO:0002316) |
| 0.2 | 0.7 | GO:0034224 | cellular response to zinc ion starvation(GO:0034224) |
| 0.2 | 0.5 | GO:0042137 | sequestering of neurotransmitter(GO:0042137) |
| 0.2 | 0.4 | GO:2000286 | receptor internalization involved in canonical Wnt signaling pathway(GO:2000286) |
| 0.2 | 1.2 | GO:0006685 | sphingomyelin catabolic process(GO:0006685) |
| 0.2 | 0.4 | GO:0045824 | negative regulation of innate immune response(GO:0045824) |
| 0.2 | 1.4 | GO:0035865 | cellular response to potassium ion(GO:0035865) |
| 0.2 | 2.6 | GO:0051639 | actin filament network formation(GO:0051639) |
| 0.2 | 1.2 | GO:0060296 | regulation of cilium movement involved in cell motility(GO:0060295) regulation of cilium beat frequency involved in ciliary motility(GO:0060296) regulation of cilium-dependent cell motility(GO:1902019) |
| 0.2 | 0.7 | GO:0002296 | T-helper 1 cell lineage commitment(GO:0002296) |
| 0.2 | 0.3 | GO:0003011 | involuntary skeletal muscle contraction(GO:0003011) |
| 0.2 | 3.6 | GO:1900151 | regulation of nuclear-transcribed mRNA catabolic process, deadenylation-dependent decay(GO:1900151) positive regulation of nuclear-transcribed mRNA catabolic process, deadenylation-dependent decay(GO:1900153) |
| 0.2 | 0.9 | GO:0071105 | response to interleukin-11(GO:0071105) |
| 0.2 | 0.3 | GO:0002774 | Fc receptor mediated inhibitory signaling pathway(GO:0002774) |
| 0.2 | 1.2 | GO:0010641 | positive regulation of platelet-derived growth factor receptor signaling pathway(GO:0010641) |
| 0.2 | 0.9 | GO:0002415 | immunoglobulin transcytosis in epithelial cells mediated by polymeric immunoglobulin receptor(GO:0002415) |
| 0.2 | 0.3 | GO:0038042 | dimeric G-protein coupled receptor signaling pathway(GO:0038042) calcitonin family receptor signaling pathway(GO:0097646) amylin receptor signaling pathway(GO:0097647) |
| 0.2 | 0.2 | GO:0035166 | post-embryonic hemopoiesis(GO:0035166) |
| 0.2 | 0.5 | GO:1904578 | response to thapsigargin(GO:1904578) cellular response to thapsigargin(GO:1904579) |
| 0.2 | 0.7 | GO:0072302 | negative regulation of metanephric glomerulus development(GO:0072299) negative regulation of metanephric glomerular mesangial cell proliferation(GO:0072302) |
| 0.2 | 4.0 | GO:0006516 | glycoprotein catabolic process(GO:0006516) |
| 0.2 | 0.3 | GO:0090182 | regulation of secretion of lysosomal enzymes(GO:0090182) |
| 0.2 | 0.2 | GO:1901187 | regulation of ephrin receptor signaling pathway(GO:1901187) |
| 0.2 | 3.6 | GO:0014733 | regulation of skeletal muscle adaptation(GO:0014733) |
| 0.2 | 0.5 | GO:2000036 | regulation of stem cell population maintenance(GO:2000036) |
| 0.2 | 0.7 | GO:0032929 | negative regulation of superoxide anion generation(GO:0032929) |
| 0.2 | 0.5 | GO:0098968 | neurotransmitter receptor transport postsynaptic membrane to endosome(GO:0098968) |
| 0.2 | 2.1 | GO:0023041 | neuronal signal transduction(GO:0023041) |
| 0.2 | 0.5 | GO:1903028 | positive regulation of opsonization(GO:1903028) |
| 0.2 | 0.8 | GO:1902268 | negative regulation of polyamine transmembrane transport(GO:1902268) |
| 0.2 | 0.2 | GO:0032757 | positive regulation of interleukin-8 production(GO:0032757) |
| 0.2 | 0.5 | GO:0019640 | glucuronate catabolic process(GO:0006064) glucuronate catabolic process to xylulose 5-phosphate(GO:0019640) xylulose 5-phosphate metabolic process(GO:0051167) xylulose 5-phosphate biosynthetic process(GO:1901159) |
| 0.2 | 2.3 | GO:0051599 | response to hydrostatic pressure(GO:0051599) |
| 0.2 | 0.5 | GO:0045918 | negative regulation of cytolysis(GO:0045918) |
| 0.2 | 0.6 | GO:0071226 | response to molecule of fungal origin(GO:0002238) cellular response to molecule of fungal origin(GO:0071226) |
| 0.2 | 2.7 | GO:2000251 | positive regulation of actin cytoskeleton reorganization(GO:2000251) |
| 0.2 | 0.6 | GO:0097411 | hypoxia-inducible factor-1alpha signaling pathway(GO:0097411) |
| 0.2 | 0.6 | GO:0035521 | monoubiquitinated histone deubiquitination(GO:0035521) monoubiquitinated histone H2A deubiquitination(GO:0035522) |
| 0.2 | 1.3 | GO:0010940 | positive regulation of necrotic cell death(GO:0010940) |
| 0.2 | 0.9 | GO:0071318 | cellular response to ATP(GO:0071318) |
| 0.2 | 0.8 | GO:0019344 | cysteine biosynthetic process(GO:0019344) |
| 0.2 | 0.5 | GO:0042732 | D-xylose metabolic process(GO:0042732) |
| 0.2 | 0.2 | GO:0035995 | detection of muscle stretch(GO:0035995) |
| 0.2 | 1.2 | GO:0036444 | calcium ion transmembrane import into mitochondrion(GO:0036444) |
| 0.2 | 0.2 | GO:0090241 | negative regulation of histone H4 acetylation(GO:0090241) |
| 0.2 | 0.3 | GO:0046051 | UTP metabolic process(GO:0046051) |
| 0.2 | 2.3 | GO:0090361 | platelet-derived growth factor production(GO:0090360) regulation of platelet-derived growth factor production(GO:0090361) |
| 0.2 | 0.3 | GO:0033233 | regulation of protein sumoylation(GO:0033233) |
| 0.2 | 0.6 | GO:1903644 | regulation of chaperone-mediated protein folding(GO:1903644) |
| 0.2 | 1.8 | GO:0070257 | positive regulation of mucus secretion(GO:0070257) |
| 0.2 | 0.2 | GO:0098905 | regulation of bundle of His cell action potential(GO:0098905) |
| 0.2 | 0.2 | GO:0060268 | negative regulation of respiratory burst(GO:0060268) |
| 0.2 | 0.3 | GO:0060516 | primary prostatic bud elongation(GO:0060516) negative regulation of dopaminergic neuron differentiation(GO:1904339) |
| 0.2 | 0.2 | GO:1900126 | negative regulation of hyaluronan biosynthetic process(GO:1900126) |
| 0.2 | 0.6 | GO:0010900 | negative regulation of phosphatidylcholine catabolic process(GO:0010900) |
| 0.2 | 0.2 | GO:0045838 | positive regulation of membrane potential(GO:0045838) |
| 0.1 | 0.6 | GO:1902460 | regulation of mesenchymal stem cell proliferation(GO:1902460) positive regulation of mesenchymal stem cell proliferation(GO:1902462) |
| 0.1 | 0.9 | GO:0051352 | negative regulation of ligase activity(GO:0051352) |
| 0.1 | 2.2 | GO:0045741 | positive regulation of epidermal growth factor-activated receptor activity(GO:0045741) |
| 0.1 | 0.4 | GO:0015772 | disaccharide transport(GO:0015766) sucrose transport(GO:0015770) oligosaccharide transport(GO:0015772) |
| 0.1 | 3.1 | GO:0007172 | signal complex assembly(GO:0007172) |
| 0.1 | 0.4 | GO:0070676 | intralumenal vesicle formation(GO:0070676) |
| 0.1 | 0.1 | GO:1901382 | chorionic trophoblast cell proliferation(GO:0097360) regulation of chorionic trophoblast cell proliferation(GO:1901382) |
| 0.1 | 2.2 | GO:0009950 | dorsal/ventral axis specification(GO:0009950) |
| 0.1 | 1.0 | GO:0030917 | midbrain-hindbrain boundary development(GO:0030917) |
| 0.1 | 0.4 | GO:2000777 | positive regulation of proteasomal ubiquitin-dependent protein catabolic process involved in cellular response to hypoxia(GO:2000777) |
| 0.1 | 1.2 | GO:0072364 | regulation of cellular ketone metabolic process by regulation of transcription from RNA polymerase II promoter(GO:0072364) |
| 0.1 | 1.2 | GO:0033029 | regulation of neutrophil apoptotic process(GO:0033029) |
| 0.1 | 1.3 | GO:0007256 | activation of JNKK activity(GO:0007256) |
| 0.1 | 0.3 | GO:0051344 | regulation of cyclic-nucleotide phosphodiesterase activity(GO:0051342) negative regulation of cyclic-nucleotide phosphodiesterase activity(GO:0051344) |
| 0.1 | 1.4 | GO:0032261 | purine nucleotide salvage(GO:0032261) IMP salvage(GO:0032264) |
| 0.1 | 0.4 | GO:0071301 | cellular response to vitamin B1(GO:0071301) response to formaldehyde(GO:1904404) |
| 0.1 | 2.2 | GO:0006995 | cellular response to nitrogen starvation(GO:0006995) cellular response to nitrogen levels(GO:0043562) |
| 0.1 | 0.4 | GO:0016185 | synaptic vesicle budding from presynaptic endocytic zone membrane(GO:0016185) |
| 0.1 | 0.4 | GO:1902534 | single-organism membrane invagination(GO:1902534) |
| 0.1 | 0.4 | GO:1902595 | regulation of DNA replication origin binding(GO:1902595) |
| 0.1 | 0.4 | GO:1902769 | regulation of choline O-acetyltransferase activity(GO:1902769) positive regulation of choline O-acetyltransferase activity(GO:1902771) negative regulation of tau-protein kinase activity(GO:1902948) positive regulation of early endosome to recycling endosome transport(GO:1902955) negative regulation of aspartic-type endopeptidase activity involved in amyloid precursor protein catabolic process(GO:1902960) regulation of neurofibrillary tangle assembly(GO:1902996) negative regulation of neurofibrillary tangle assembly(GO:1902997) negative regulation of aspartic-type peptidase activity(GO:1905246) |
| 0.1 | 0.1 | GO:0007292 | female gamete generation(GO:0007292) |
| 0.1 | 0.9 | GO:0030035 | microspike assembly(GO:0030035) |
| 0.1 | 1.6 | GO:0090168 | Golgi reassembly(GO:0090168) |
| 0.1 | 0.4 | GO:0070668 | regulation of mast cell proliferation(GO:0070666) positive regulation of mast cell proliferation(GO:0070668) |
| 0.1 | 0.7 | GO:1990834 | response to odorant(GO:1990834) |
| 0.1 | 0.1 | GO:0046208 | spermine catabolic process(GO:0046208) |
| 0.1 | 0.7 | GO:0010481 | epidermal cell division(GO:0010481) regulation of epidermal cell division(GO:0010482) |
| 0.1 | 2.1 | GO:0030903 | notochord development(GO:0030903) |
| 0.1 | 1.4 | GO:1902455 | negative regulation of stem cell population maintenance(GO:1902455) |
| 0.1 | 1.3 | GO:0060770 | negative regulation of epithelial cell proliferation involved in prostate gland development(GO:0060770) |
| 0.1 | 0.3 | GO:1904862 | inhibitory synapse assembly(GO:1904862) |
| 0.1 | 0.1 | GO:0038161 | prolactin signaling pathway(GO:0038161) |
| 0.1 | 0.4 | GO:0006597 | spermine biosynthetic process(GO:0006597) |
| 0.1 | 0.6 | GO:0032485 | Ral protein signal transduction(GO:0032484) regulation of Ral protein signal transduction(GO:0032485) |
| 0.1 | 1.0 | GO:0070995 | NADPH oxidation(GO:0070995) |
| 0.1 | 0.1 | GO:0051024 | positive regulation of immunoglobulin secretion(GO:0051024) |
| 0.1 | 0.3 | GO:2000366 | regulation of STAT protein import into nucleus(GO:2000364) positive regulation of STAT protein import into nucleus(GO:2000366) |
| 0.1 | 0.1 | GO:0035905 | ascending aorta development(GO:0035905) ascending aorta morphogenesis(GO:0035910) |
| 0.1 | 1.0 | GO:0002084 | protein depalmitoylation(GO:0002084) |
| 0.1 | 0.1 | GO:2000381 | negative regulation of mesoderm development(GO:2000381) |
| 0.1 | 1.2 | GO:0048672 | positive regulation of collateral sprouting(GO:0048672) |
| 0.1 | 0.7 | GO:0045204 | MAPK export from nucleus(GO:0045204) |
| 0.1 | 0.7 | GO:0071802 | negative regulation of podosome assembly(GO:0071802) |
| 0.1 | 0.5 | GO:1901079 | positive regulation of relaxation of muscle(GO:1901079) |
| 0.1 | 2.4 | GO:0038092 | nodal signaling pathway(GO:0038092) |
| 0.1 | 0.3 | GO:0042178 | xenobiotic catabolic process(GO:0042178) |
| 0.1 | 0.3 | GO:0043633 | polyadenylation-dependent RNA catabolic process(GO:0043633) polyadenylation-dependent ncRNA catabolic process(GO:0043634) |
| 0.1 | 0.4 | GO:1902630 | regulation of membrane hyperpolarization(GO:1902630) |
| 0.1 | 1.1 | GO:0015705 | iodide transport(GO:0015705) |
| 0.1 | 2.0 | GO:0035878 | nail development(GO:0035878) |
| 0.1 | 0.1 | GO:0009310 | polyamine catabolic process(GO:0006598) spermine metabolic process(GO:0008215) amine catabolic process(GO:0009310) cellular biogenic amine catabolic process(GO:0042402) |
| 0.1 | 0.1 | GO:0046532 | regulation of photoreceptor cell differentiation(GO:0046532) |
| 0.1 | 0.5 | GO:0010637 | negative regulation of mitochondrial fusion(GO:0010637) |
| 0.1 | 0.1 | GO:0035881 | amacrine cell differentiation(GO:0035881) |
| 0.1 | 0.5 | GO:0045080 | positive regulation of chemokine biosynthetic process(GO:0045080) |
| 0.1 | 1.1 | GO:0035021 | negative regulation of Rac protein signal transduction(GO:0035021) |
| 0.1 | 0.4 | GO:0006422 | aspartyl-tRNA aminoacylation(GO:0006422) |
| 0.1 | 0.8 | GO:1902414 | protein localization to cell junction(GO:1902414) |
| 0.1 | 1.1 | GO:0032439 | endosome localization(GO:0032439) |
| 0.1 | 0.3 | GO:0032495 | response to muramyl dipeptide(GO:0032495) |
| 0.1 | 0.4 | GO:2000721 | positive regulation of transcription from RNA polymerase II promoter involved in smooth muscle cell differentiation(GO:2000721) |
| 0.1 | 2.5 | GO:0042574 | retinal metabolic process(GO:0042574) |
| 0.1 | 0.4 | GO:0060708 | spongiotrophoblast differentiation(GO:0060708) |
| 0.1 | 1.2 | GO:0045054 | constitutive secretory pathway(GO:0045054) |
| 0.1 | 0.5 | GO:2000774 | positive regulation of cellular senescence(GO:2000774) |
| 0.1 | 0.5 | GO:0000430 | regulation of transcription from RNA polymerase II promoter by glucose(GO:0000430) positive regulation of transcription from RNA polymerase II promoter by glucose(GO:0000432) |
| 0.1 | 0.1 | GO:0045976 | negative regulation of mitotic cell cycle, embryonic(GO:0045976) |
| 0.1 | 0.4 | GO:0061300 | cerebellum vasculature development(GO:0061300) |
| 0.1 | 0.1 | GO:1903061 | positive regulation of protein lipidation(GO:1903061) |
| 0.1 | 0.1 | GO:0061152 | trachea submucosa development(GO:0061152) trachea gland development(GO:0061153) |
| 0.1 | 0.1 | GO:0021798 | forebrain dorsal/ventral pattern formation(GO:0021798) |
| 0.1 | 0.4 | GO:0015680 | intracellular copper ion transport(GO:0015680) |
| 0.1 | 0.4 | GO:1905203 | regulation of connective tissue replacement involved in inflammatory response wound healing(GO:1904596) negative regulation of connective tissue replacement involved in inflammatory response wound healing(GO:1904597) regulation of advanced glycation end-product receptor activity(GO:1904603) negative regulation of advanced glycation end-product receptor activity(GO:1904604) regulation of connective tissue replacement(GO:1905203) negative regulation of connective tissue replacement(GO:1905204) |
| 0.1 | 0.4 | GO:0071423 | thiosulfate transport(GO:0015709) oxaloacetate transport(GO:0015729) malate transport(GO:0015743) malate transmembrane transport(GO:0071423) oxaloacetate(2-) transmembrane transport(GO:1902356) |
| 0.1 | 0.5 | GO:0060319 | primitive erythrocyte differentiation(GO:0060319) |
| 0.1 | 0.6 | GO:1990928 | response to amino acid starvation(GO:1990928) |
| 0.1 | 2.0 | GO:0006183 | GTP biosynthetic process(GO:0006183) |
| 0.1 | 0.3 | GO:0043555 | regulation of translation in response to stress(GO:0043555) |
| 0.1 | 0.4 | GO:0002143 | tRNA wobble position uridine thiolation(GO:0002143) |
| 0.1 | 0.3 | GO:0009608 | response to symbiont(GO:0009608) response to symbiotic bacterium(GO:0009609) |
| 0.1 | 0.1 | GO:0061110 | dense core granule biogenesis(GO:0061110) regulation of dense core granule biogenesis(GO:2000705) |
| 0.1 | 0.8 | GO:1903588 | negative regulation of blood vessel endothelial cell proliferation involved in sprouting angiogenesis(GO:1903588) |
| 0.1 | 0.1 | GO:1903984 | positive regulation of TRAIL-activated apoptotic signaling pathway(GO:1903984) |
| 0.1 | 1.5 | GO:2000210 | positive regulation of anoikis(GO:2000210) |
| 0.1 | 0.2 | GO:0061101 | neuroendocrine cell differentiation(GO:0061101) |
| 0.1 | 0.4 | GO:1901731 | positive regulation of platelet aggregation(GO:1901731) |
| 0.1 | 0.4 | GO:0060019 | radial glial cell differentiation(GO:0060019) |
| 0.1 | 1.2 | GO:0046078 | dUMP metabolic process(GO:0046078) |
| 0.1 | 0.9 | GO:0042985 | negative regulation of amyloid precursor protein biosynthetic process(GO:0042985) |
| 0.1 | 0.4 | GO:0075044 | autophagy of host cells involved in interaction with symbiont(GO:0075044) autophagy involved in symbiotic interaction(GO:0075071) |
| 0.1 | 0.6 | GO:0018364 | peptidyl-glutamine methylation(GO:0018364) |
| 0.1 | 0.1 | GO:0045176 | apical protein localization(GO:0045176) |
| 0.1 | 0.4 | GO:0048203 | vesicle targeting, trans-Golgi to endosome(GO:0048203) |
| 0.1 | 0.4 | GO:0070213 | protein auto-ADP-ribosylation(GO:0070213) |
| 0.1 | 0.4 | GO:0033385 | geranylgeranyl diphosphate metabolic process(GO:0033385) geranylgeranyl diphosphate biosynthetic process(GO:0033386) |
| 0.1 | 1.9 | GO:0033235 | positive regulation of protein sumoylation(GO:0033235) |
| 0.1 | 0.5 | GO:0021773 | striatal medium spiny neuron differentiation(GO:0021773) |
| 0.1 | 0.5 | GO:0015910 | peroxisomal long-chain fatty acid import(GO:0015910) |
| 0.1 | 0.7 | GO:2000568 | memory T cell activation(GO:0035709) regulation of memory T cell activation(GO:2000567) positive regulation of memory T cell activation(GO:2000568) |
| 0.1 | 0.2 | GO:0036446 | myofibroblast differentiation(GO:0036446) regulation of myofibroblast differentiation(GO:1904760) |
| 0.1 | 0.2 | GO:0021937 | cerebellar Purkinje cell-granule cell precursor cell signaling involved in regulation of granule cell precursor cell proliferation(GO:0021937) |
| 0.1 | 0.1 | GO:1904798 | positive regulation of core promoter binding(GO:1904798) |
| 0.1 | 1.6 | GO:0001675 | acrosome assembly(GO:0001675) |
| 0.1 | 0.4 | GO:0044537 | regulation of circulating fibrinogen levels(GO:0044537) |
| 0.1 | 0.4 | GO:2000301 | negative regulation of synaptic vesicle exocytosis(GO:2000301) |
| 0.1 | 0.6 | GO:0060563 | neuroepithelial cell differentiation(GO:0060563) |
| 0.1 | 0.1 | GO:1903526 | negative regulation of membrane tubulation(GO:1903526) |
| 0.1 | 0.2 | GO:0035115 | embryonic forelimb morphogenesis(GO:0035115) |
| 0.1 | 0.1 | GO:0072104 | glomerulus vasculature morphogenesis(GO:0072103) glomerular capillary formation(GO:0072104) |
| 0.1 | 1.1 | GO:0031087 | nuclear-transcribed mRNA catabolic process, deadenylation-independent decay(GO:0031086) deadenylation-independent decapping of nuclear-transcribed mRNA(GO:0031087) |
| 0.1 | 0.4 | GO:1902463 | protein localization to cell leading edge(GO:1902463) |
| 0.1 | 1.4 | GO:0019372 | lipoxygenase pathway(GO:0019372) |
| 0.1 | 0.5 | GO:0071894 | histone H2B conserved C-terminal lysine ubiquitination(GO:0071894) |
| 0.1 | 0.4 | GO:0014057 | positive regulation of acetylcholine secretion, neurotransmission(GO:0014057) |
| 0.1 | 1.1 | GO:0045109 | intermediate filament organization(GO:0045109) |
| 0.1 | 1.8 | GO:2001199 | negative regulation of dendritic cell differentiation(GO:2001199) |
| 0.1 | 0.5 | GO:0042997 | negative regulation of Golgi to plasma membrane protein transport(GO:0042997) |
| 0.1 | 0.4 | GO:0003064 | regulation of heart rate by hormone(GO:0003064) |
| 0.1 | 3.2 | GO:0090200 | positive regulation of release of cytochrome c from mitochondria(GO:0090200) |
| 0.1 | 0.2 | GO:1903301 | positive regulation of glucokinase activity(GO:0033133) positive regulation of hexokinase activity(GO:1903301) |
| 0.1 | 1.1 | GO:0032510 | endosome to lysosome transport via multivesicular body sorting pathway(GO:0032510) |
| 0.1 | 0.2 | GO:1900138 | negative regulation of phospholipase A2 activity(GO:1900138) |
| 0.1 | 0.5 | GO:0061739 | protein lipidation involved in autophagosome assembly(GO:0061739) |
| 0.1 | 0.5 | GO:0032792 | negative regulation of CREB transcription factor activity(GO:0032792) |
| 0.1 | 2.1 | GO:0071243 | cellular response to arsenic-containing substance(GO:0071243) |
| 0.1 | 0.1 | GO:0043313 | regulation of neutrophil degranulation(GO:0043313) |
| 0.1 | 0.5 | GO:0099640 | axo-dendritic protein transport(GO:0099640) |
| 0.1 | 1.3 | GO:0034393 | positive regulation of smooth muscle cell apoptotic process(GO:0034393) |
| 0.1 | 0.1 | GO:0002032 | desensitization of G-protein coupled receptor protein signaling pathway by arrestin(GO:0002032) |
| 0.1 | 0.3 | GO:0043983 | histone H4-K12 acetylation(GO:0043983) |
| 0.1 | 0.2 | GO:1903336 | negative regulation of vacuolar transport(GO:1903336) |
| 0.1 | 0.2 | GO:0052255 | induction by symbiont of host defense response(GO:0044416) induction of host immune response by virus(GO:0046730) active induction of host immune response by virus(GO:0046732) modulation by symbiont of host defense response(GO:0052031) induction by organism of defense response of other organism involved in symbiotic interaction(GO:0052251) modulation by organism of defense response of other organism involved in symbiotic interaction(GO:0052255) positive regulation by symbiont of host defense response(GO:0052509) positive regulation by organism of defense response of other organism involved in symbiotic interaction(GO:0052510) modulation by organism of immune response of other organism involved in symbiotic interaction(GO:0052552) modulation by symbiont of host immune response(GO:0052553) modulation by virus of host immune response(GO:0075528) |
| 0.1 | 0.1 | GO:0097051 | establishment of protein localization to endoplasmic reticulum membrane(GO:0097051) |
| 0.1 | 0.3 | GO:0001560 | regulation of cell growth by extracellular stimulus(GO:0001560) |
| 0.1 | 0.3 | GO:1904636 | response to ionomycin(GO:1904636) cellular response to ionomycin(GO:1904637) |
| 0.1 | 0.3 | GO:1902219 | regulation of intrinsic apoptotic signaling pathway in response to osmotic stress(GO:1902218) negative regulation of intrinsic apoptotic signaling pathway in response to osmotic stress(GO:1902219) |
| 0.1 | 1.2 | GO:1900028 | negative regulation of ruffle assembly(GO:1900028) |
| 0.1 | 0.8 | GO:0001661 | conditioned taste aversion(GO:0001661) |
| 0.1 | 0.6 | GO:0046985 | positive regulation of hemoglobin biosynthetic process(GO:0046985) |
| 0.1 | 0.6 | GO:0000738 | DNA catabolic process, exonucleolytic(GO:0000738) |
| 0.1 | 0.9 | GO:0048386 | positive regulation of retinoic acid receptor signaling pathway(GO:0048386) |
| 0.1 | 0.4 | GO:0006382 | adenosine to inosine editing(GO:0006382) |
| 0.1 | 0.3 | GO:0090290 | positive regulation of osteoclast proliferation(GO:0090290) |
| 0.1 | 0.2 | GO:0019369 | arachidonic acid metabolic process(GO:0019369) |
| 0.1 | 1.3 | GO:0090051 | negative regulation of cell migration involved in sprouting angiogenesis(GO:0090051) |
| 0.1 | 0.4 | GO:0018002 | N-terminal peptidyl-serine acetylation(GO:0017198) N-terminal peptidyl-glutamic acid acetylation(GO:0018002) peptidyl-serine acetylation(GO:0030920) |
| 0.1 | 0.1 | GO:1904672 | regulation of somatic stem cell population maintenance(GO:1904672) |
| 0.1 | 0.3 | GO:1904562 | phosphatidylinositol 5-phosphate metabolic process(GO:1904562) |
| 0.1 | 0.2 | GO:0051136 | regulation of NK T cell differentiation(GO:0051136) |
| 0.1 | 0.3 | GO:0042727 | flavin-containing compound biosynthetic process(GO:0042727) |
| 0.1 | 0.5 | GO:0045743 | positive regulation of fibroblast growth factor receptor signaling pathway(GO:0045743) |
| 0.1 | 0.3 | GO:0045907 | positive regulation of vasoconstriction(GO:0045907) |
| 0.1 | 0.9 | GO:0000160 | phosphorelay signal transduction system(GO:0000160) |
| 0.1 | 0.5 | GO:0038001 | paracrine signaling(GO:0038001) |
| 0.1 | 0.1 | GO:0060081 | membrane hyperpolarization(GO:0060081) |
| 0.1 | 2.7 | GO:0090026 | positive regulation of monocyte chemotaxis(GO:0090026) |
| 0.1 | 0.1 | GO:0042953 | lipoprotein transport(GO:0042953) lipoprotein localization(GO:0044872) |
| 0.1 | 0.5 | GO:0060282 | positive regulation of oocyte development(GO:0060282) |
| 0.1 | 0.6 | GO:1903715 | regulation of aerobic respiration(GO:1903715) |
| 0.1 | 0.2 | GO:0021988 | olfactory bulb development(GO:0021772) olfactory lobe development(GO:0021988) |
| 0.1 | 0.3 | GO:0090219 | negative regulation of lipid kinase activity(GO:0090219) |
| 0.1 | 0.1 | GO:0009583 | detection of light stimulus(GO:0009583) |
| 0.1 | 0.5 | GO:0090650 | response to oxygen-glucose deprivation(GO:0090649) cellular response to oxygen-glucose deprivation(GO:0090650) |
| 0.1 | 0.4 | GO:2000686 | regulation of rubidium ion transmembrane transporter activity(GO:2000686) |
| 0.1 | 0.1 | GO:0045082 | positive regulation of interleukin-10 biosynthetic process(GO:0045082) |
| 0.1 | 0.7 | GO:0016127 | cholesterol catabolic process(GO:0006707) sterol catabolic process(GO:0016127) |
| 0.1 | 0.8 | GO:0010867 | positive regulation of triglyceride biosynthetic process(GO:0010867) |
| 0.1 | 0.1 | GO:0021514 | ventral spinal cord interneuron differentiation(GO:0021514) |
| 0.1 | 0.2 | GO:0061502 | early endosome to recycling endosome transport(GO:0061502) |
| 0.1 | 1.5 | GO:0044351 | macropinocytosis(GO:0044351) |
| 0.1 | 0.4 | GO:0010796 | regulation of multivesicular body size(GO:0010796) |
| 0.1 | 0.5 | GO:0035063 | nuclear speck organization(GO:0035063) |
| 0.1 | 0.4 | GO:0031069 | hair follicle morphogenesis(GO:0031069) |
| 0.1 | 0.1 | GO:1902824 | regulation of late endosome to lysosome transport(GO:1902822) positive regulation of late endosome to lysosome transport(GO:1902824) |
| 0.1 | 2.4 | GO:0060644 | mammary gland epithelial cell differentiation(GO:0060644) |
| 0.1 | 11.9 | GO:0070268 | cornification(GO:0070268) |
| 0.1 | 0.1 | GO:0071415 | cellular response to purine-containing compound(GO:0071415) |
| 0.1 | 0.3 | GO:0093001 | glycolysis from storage polysaccharide through glucose-1-phosphate(GO:0093001) |
| 0.1 | 1.2 | GO:0015074 | DNA integration(GO:0015074) |
| 0.1 | 0.1 | GO:1902162 | regulation of DNA damage response, signal transduction by p53 class mediator resulting in transcription of p21 class mediator(GO:1902162) positive regulation of DNA damage response, signal transduction by p53 class mediator resulting in transcription of p21 class mediator(GO:1902164) |
| 0.1 | 0.4 | GO:0060265 | positive regulation of respiratory burst involved in inflammatory response(GO:0060265) |
| 0.1 | 0.5 | GO:0060334 | regulation of response to interferon-gamma(GO:0060330) regulation of interferon-gamma-mediated signaling pathway(GO:0060334) |
| 0.1 | 0.6 | GO:0002679 | respiratory burst involved in defense response(GO:0002679) |
| 0.1 | 0.3 | GO:0090238 | regulation of arachidonic acid secretion(GO:0090237) positive regulation of arachidonic acid secretion(GO:0090238) |
| 0.1 | 0.4 | GO:2000271 | positive regulation of fibroblast apoptotic process(GO:2000271) |
| 0.1 | 0.2 | GO:0014067 | negative regulation of phosphatidylinositol 3-kinase signaling(GO:0014067) |
| 0.1 | 0.5 | GO:0060744 | thelarche(GO:0042695) mammary gland branching involved in thelarche(GO:0060744) |
| 0.1 | 1.5 | GO:0006787 | porphyrin-containing compound catabolic process(GO:0006787) tetrapyrrole catabolic process(GO:0033015) heme catabolic process(GO:0042167) pigment catabolic process(GO:0046149) |
| 0.1 | 0.3 | GO:0098886 | modification of dendritic spine(GO:0098886) |
| 0.1 | 0.4 | GO:0043320 | natural killer cell degranulation(GO:0043320) |
| 0.1 | 0.9 | GO:0072216 | positive regulation of metanephros development(GO:0072216) |
| 0.1 | 0.3 | GO:0014707 | branchiomeric skeletal muscle development(GO:0014707) |
| 0.1 | 1.2 | GO:0032688 | negative regulation of interferon-beta production(GO:0032688) |
| 0.1 | 0.1 | GO:0006014 | D-ribose metabolic process(GO:0006014) |
| 0.1 | 8.5 | GO:2000649 | regulation of sodium ion transmembrane transporter activity(GO:2000649) |
| 0.1 | 0.2 | GO:1900273 | positive regulation of long-term synaptic potentiation(GO:1900273) |
| 0.1 | 0.9 | GO:1904903 | ESCRT complex disassembly(GO:1904896) ESCRT III complex disassembly(GO:1904903) |
| 0.1 | 1.1 | GO:0030432 | peristalsis(GO:0030432) |
| 0.1 | 0.6 | GO:0051708 | intracellular transport of viral protein in host cell(GO:0019060) symbiont intracellular protein transport in host(GO:0030581) intracellular protein transport in other organism involved in symbiotic interaction(GO:0051708) |
| 0.1 | 0.4 | GO:0009257 | 10-formyltetrahydrofolate biosynthetic process(GO:0009257) |
| 0.1 | 0.7 | GO:0033353 | S-adenosylmethionine cycle(GO:0033353) |
| 0.1 | 0.2 | GO:0036518 | chemorepulsion of dopaminergic neuron axon(GO:0036518) |
| 0.1 | 0.4 | GO:0072656 | maintenance of protein location in mitochondrion(GO:0072656) |
| 0.1 | 0.5 | GO:0097577 | intracellular sequestering of iron ion(GO:0006880) sequestering of iron ion(GO:0097577) |
| 0.1 | 0.2 | GO:0018879 | biphenyl metabolic process(GO:0018879) |
| 0.1 | 0.1 | GO:0044144 | regulation of growth of symbiont in host(GO:0044126) modulation of growth of symbiont involved in interaction with host(GO:0044144) |
| 0.1 | 0.7 | GO:0038145 | macrophage colony-stimulating factor signaling pathway(GO:0038145) |
| 0.1 | 0.8 | GO:0006741 | NADP biosynthetic process(GO:0006741) |
| 0.1 | 0.5 | GO:0019075 | virus maturation(GO:0019075) |
| 0.1 | 0.8 | GO:0010606 | positive regulation of cytoplasmic mRNA processing body assembly(GO:0010606) |
| 0.1 | 0.6 | GO:0045722 | positive regulation of gluconeogenesis(GO:0045722) |
| 0.1 | 0.2 | GO:0039534 | negative regulation of MDA-5 signaling pathway(GO:0039534) |
| 0.1 | 0.2 | GO:0071286 | cellular response to magnesium ion(GO:0071286) |
| 0.1 | 0.9 | GO:2000601 | positive regulation of Arp2/3 complex-mediated actin nucleation(GO:2000601) |
| 0.1 | 0.6 | GO:0070940 | dephosphorylation of RNA polymerase II C-terminal domain(GO:0070940) |
| 0.1 | 0.4 | GO:1903778 | protein localization to vacuolar membrane(GO:1903778) |
| 0.1 | 0.5 | GO:0090611 | ubiquitin-independent protein catabolic process via the multivesicular body sorting pathway(GO:0090611) |
| 0.1 | 0.2 | GO:0016559 | peroxisome fission(GO:0016559) |
| 0.1 | 0.2 | GO:0006566 | threonine metabolic process(GO:0006566) |
| 0.1 | 0.2 | GO:0000002 | mitochondrial genome maintenance(GO:0000002) |
| 0.1 | 0.1 | GO:1901204 | negative regulation of adrenergic receptor signaling pathway(GO:0071878) retrograde trans-synaptic signaling by soluble gas(GO:0098923) trans-synaptic signaling by soluble gas(GO:0099543) regulation of adrenergic receptor signaling pathway involved in heart process(GO:1901204) negative regulation of adrenergic receptor signaling pathway involved in heart process(GO:1901205) |
| 0.1 | 0.4 | GO:0090035 | regulation of chaperone-mediated protein complex assembly(GO:0090034) positive regulation of chaperone-mediated protein complex assembly(GO:0090035) |
| 0.1 | 0.1 | GO:0003220 | left ventricular cardiac muscle tissue morphogenesis(GO:0003220) |
| 0.1 | 0.7 | GO:0051725 | protein de-ADP-ribosylation(GO:0051725) |
| 0.1 | 0.3 | GO:0019364 | NADP catabolic process(GO:0006742) pyridine nucleotide catabolic process(GO:0019364) |
| 0.1 | 0.3 | GO:0060178 | regulation of exocyst assembly(GO:0001928) regulation of exocyst localization(GO:0060178) |
| 0.1 | 0.4 | GO:0042986 | positive regulation of amyloid precursor protein biosynthetic process(GO:0042986) |
| 0.1 | 0.5 | GO:0009080 | alanine metabolic process(GO:0006522) alanine catabolic process(GO:0006524) pyruvate family amino acid metabolic process(GO:0009078) pyruvate family amino acid catabolic process(GO:0009080) |
| 0.1 | 0.3 | GO:2000395 | regulation of ubiquitin-dependent endocytosis(GO:2000395) positive regulation of ubiquitin-dependent endocytosis(GO:2000397) |
| 0.1 | 2.1 | GO:0097034 | mitochondrial respiratory chain complex IV assembly(GO:0033617) mitochondrial respiratory chain complex IV biogenesis(GO:0097034) |
| 0.1 | 0.3 | GO:0000472 | endonucleolytic cleavage to generate mature 5'-end of SSU-rRNA from (SSU-rRNA, 5.8S rRNA, LSU-rRNA)(GO:0000472) rRNA 5'-end processing(GO:0000967) ncRNA 5'-end processing(GO:0034471) |
| 0.1 | 1.1 | GO:0006122 | mitochondrial electron transport, ubiquinol to cytochrome c(GO:0006122) |
| 0.1 | 0.5 | GO:0016240 | autophagosome docking(GO:0016240) |
| 0.1 | 0.1 | GO:0060830 | ciliary receptor clustering involved in smoothened signaling pathway(GO:0060830) |
| 0.1 | 0.3 | GO:0061198 | fungiform papilla formation(GO:0061198) |
| 0.1 | 0.1 | GO:0045053 | protein retention in Golgi apparatus(GO:0045053) asymmetric Golgi ribbon formation(GO:0090164) |
| 0.1 | 0.4 | GO:0007258 | JUN phosphorylation(GO:0007258) |
| 0.1 | 0.2 | GO:0035425 | autocrine signaling(GO:0035425) |
| 0.1 | 0.6 | GO:0015961 | diadenosine polyphosphate catabolic process(GO:0015961) diphosphoinositol polyphosphate metabolic process(GO:0071543) diadenosine pentaphosphate metabolic process(GO:1901906) diadenosine pentaphosphate catabolic process(GO:1901907) diadenosine hexaphosphate metabolic process(GO:1901908) diadenosine hexaphosphate catabolic process(GO:1901909) adenosine 5'-(hexahydrogen pentaphosphate) metabolic process(GO:1901910) adenosine 5'-(hexahydrogen pentaphosphate) catabolic process(GO:1901911) |
| 0.1 | 0.3 | GO:2000406 | positive regulation of T cell migration(GO:2000406) |
| 0.1 | 1.0 | GO:0010764 | negative regulation of fibroblast migration(GO:0010764) |
| 0.1 | 0.2 | GO:1904020 | regulation of G-protein coupled receptor internalization(GO:1904020) |
| 0.1 | 0.5 | GO:0033274 | response to vitamin B2(GO:0033274) heterochromatin maintenance(GO:0070829) |
| 0.1 | 0.6 | GO:0043987 | histone H3-S10 phosphorylation(GO:0043987) |
| 0.1 | 0.3 | GO:0006595 | polyamine metabolic process(GO:0006595) |
| 0.1 | 0.9 | GO:0097500 | receptor localization to nonmotile primary cilium(GO:0097500) |
| 0.1 | 2.0 | GO:0070977 | bone maturation(GO:0070977) |
| 0.1 | 0.1 | GO:0044034 | negative stranded viral RNA replication(GO:0039689) multi-organism biosynthetic process(GO:0044034) |
| 0.1 | 0.3 | GO:0090038 | negative regulation of protein kinase C signaling(GO:0090038) |
| 0.1 | 0.6 | GO:1902902 | negative regulation of autophagosome assembly(GO:1902902) |
| 0.1 | 0.2 | GO:0060753 | regulation of mast cell chemotaxis(GO:0060753) |
| 0.1 | 0.5 | GO:0002249 | lymphocyte anergy(GO:0002249) regulation of T cell anergy(GO:0002667) T cell anergy(GO:0002870) regulation of lymphocyte anergy(GO:0002911) |
| 0.1 | 1.0 | GO:0045475 | locomotor rhythm(GO:0045475) |
| 0.1 | 0.6 | GO:0050915 | sensory perception of sour taste(GO:0050915) |
| 0.1 | 0.1 | GO:0010616 | negative regulation of cardiac muscle adaptation(GO:0010616) negative regulation of cardiac muscle hypertrophy in response to stress(GO:1903243) |
| 0.1 | 0.4 | GO:0010908 | regulation of heparan sulfate proteoglycan biosynthetic process(GO:0010908) positive regulation of heparan sulfate proteoglycan biosynthetic process(GO:0010909) canonical Wnt signaling pathway involved in positive regulation of epithelial to mesenchymal transition(GO:0044334) positive regulation of proteoglycan biosynthetic process(GO:1902730) |
| 0.1 | 0.1 | GO:1901526 | positive regulation of macromitophagy(GO:1901526) positive regulation of mitophagy in response to mitochondrial depolarization(GO:1904925) |
| 0.1 | 1.7 | GO:0036148 | phosphatidylglycerol acyl-chain remodeling(GO:0036148) |
| 0.1 | 0.1 | GO:0001836 | release of cytochrome c from mitochondria(GO:0001836) |
| 0.1 | 0.5 | GO:0006562 | proline catabolic process(GO:0006562) proline catabolic process to glutamate(GO:0010133) |
| 0.1 | 0.2 | GO:0019074 | viral genome packaging(GO:0019072) viral RNA genome packaging(GO:0019074) |
| 0.1 | 0.3 | GO:2000118 | regulation of sodium-dependent phosphate transport(GO:2000118) |
| 0.1 | 0.4 | GO:1904217 | regulation of CDP-diacylglycerol-serine O-phosphatidyltransferase activity(GO:1904217) positive regulation of CDP-diacylglycerol-serine O-phosphatidyltransferase activity(GO:1904219) positive regulation of serine C-palmitoyltransferase activity(GO:1904222) |
| 0.1 | 0.1 | GO:1904220 | regulation of serine C-palmitoyltransferase activity(GO:1904220) |
| 0.1 | 0.3 | GO:0006549 | isoleucine metabolic process(GO:0006549) |
| 0.1 | 0.4 | GO:0071681 | response to indole-3-methanol(GO:0071680) cellular response to indole-3-methanol(GO:0071681) |
| 0.1 | 0.2 | GO:0070813 | hydrogen sulfide metabolic process(GO:0070813) |
| 0.1 | 1.5 | GO:0090557 | establishment of endothelial intestinal barrier(GO:0090557) |
| 0.1 | 0.7 | GO:1900027 | regulation of ruffle assembly(GO:1900027) |
| 0.1 | 0.3 | GO:0061537 | glycine secretion(GO:0061536) glycine secretion, neurotransmission(GO:0061537) |
| 0.1 | 1.2 | GO:0042354 | fucose catabolic process(GO:0019317) L-fucose metabolic process(GO:0042354) L-fucose catabolic process(GO:0042355) |
| 0.1 | 0.2 | GO:0036022 | limb joint morphogenesis(GO:0036022) embryonic skeletal limb joint morphogenesis(GO:0036023) |
| 0.1 | 0.3 | GO:0046166 | glyceraldehyde-3-phosphate biosynthetic process(GO:0046166) |
| 0.1 | 0.6 | GO:0019323 | pentose catabolic process(GO:0019323) |
| 0.1 | 1.1 | GO:0006564 | L-serine biosynthetic process(GO:0006564) |
| 0.1 | 1.1 | GO:0070327 | thyroid hormone transport(GO:0070327) |
| 0.1 | 0.3 | GO:0044359 | modulation of molecular function in other organism(GO:0044359) negative regulation of molecular function in other organism(GO:0044362) negative regulation of molecular function in other organism involved in symbiotic interaction(GO:0052204) modulation of molecular function in other organism involved in symbiotic interaction(GO:0052205) negative regulation by host of symbiont molecular function(GO:0052405) modification by host of symbiont molecular function(GO:0052428) |
| 0.1 | 0.3 | GO:0033152 | immunoglobulin V(D)J recombination(GO:0033152) |
| 0.1 | 0.9 | GO:0009200 | deoxyribonucleoside triphosphate metabolic process(GO:0009200) |
| 0.1 | 1.6 | GO:1902991 | regulation of amyloid precursor protein catabolic process(GO:1902991) |
| 0.1 | 0.2 | GO:2000035 | regulation of stem cell division(GO:2000035) |
| 0.1 | 0.1 | GO:0043409 | negative regulation of MAPK cascade(GO:0043409) |
| 0.1 | 1.7 | GO:0030150 | protein import into mitochondrial matrix(GO:0030150) |
| 0.1 | 0.3 | GO:0071901 | negative regulation of protein serine/threonine kinase activity(GO:0071901) |
| 0.1 | 0.1 | GO:0007019 | microtubule depolymerization(GO:0007019) |
| 0.1 | 0.9 | GO:0002741 | positive regulation of cytokine secretion involved in immune response(GO:0002741) |
| 0.1 | 0.4 | GO:0035116 | embryonic hindlimb morphogenesis(GO:0035116) |
| 0.1 | 3.0 | GO:0070286 | axonemal dynein complex assembly(GO:0070286) |
| 0.1 | 0.3 | GO:0006478 | peptidyl-tyrosine sulfation(GO:0006478) |
| 0.1 | 0.4 | GO:0060022 | hard palate development(GO:0060022) |
| 0.1 | 3.3 | GO:0043928 | exonucleolytic nuclear-transcribed mRNA catabolic process involved in deadenylation-dependent decay(GO:0043928) |
| 0.1 | 0.9 | GO:0071803 | positive regulation of podosome assembly(GO:0071803) |
| 0.1 | 0.1 | GO:1901533 | negative regulation of hematopoietic progenitor cell differentiation(GO:1901533) |
| 0.1 | 0.2 | GO:0032906 | transforming growth factor beta2 production(GO:0032906) regulation of transforming growth factor beta2 production(GO:0032909) |
| 0.1 | 0.3 | GO:2001033 | negative regulation of double-strand break repair via nonhomologous end joining(GO:2001033) |
| 0.1 | 0.3 | GO:1901097 | negative regulation of autophagosome maturation(GO:1901097) |
| 0.1 | 0.8 | GO:0006528 | asparagine metabolic process(GO:0006528) |
| 0.1 | 0.3 | GO:0035845 | photoreceptor cell outer segment organization(GO:0035845) |
| 0.1 | 0.2 | GO:1902172 | keratinocyte apoptotic process(GO:0097283) regulation of keratinocyte apoptotic process(GO:1902172) |
| 0.1 | 0.8 | GO:0010968 | regulation of microtubule nucleation(GO:0010968) |
| 0.1 | 0.1 | GO:0060584 | regulation of prostaglandin-endoperoxide synthase activity(GO:0060584) positive regulation of prostaglandin-endoperoxide synthase activity(GO:0060585) |
| 0.1 | 0.2 | GO:0034729 | histone H3-K79 methylation(GO:0034729) |
| 0.1 | 0.2 | GO:0051897 | positive regulation of protein kinase B signaling(GO:0051897) |
| 0.1 | 0.2 | GO:0030644 | cellular chloride ion homeostasis(GO:0030644) |
| 0.1 | 0.3 | GO:1900425 | negative regulation of defense response to bacterium(GO:1900425) |
| 0.1 | 1.0 | GO:0010248 | establishment or maintenance of transmembrane electrochemical gradient(GO:0010248) |
| 0.1 | 0.4 | GO:0006436 | tryptophanyl-tRNA aminoacylation(GO:0006436) |
| 0.1 | 0.2 | GO:1903542 | negative regulation of exosomal secretion(GO:1903542) |
| 0.1 | 0.2 | GO:0021766 | hippocampus development(GO:0021766) |
| 0.1 | 0.2 | GO:0038060 | nitric oxide-cGMP-mediated signaling pathway(GO:0038060) |
| 0.1 | 0.2 | GO:0031053 | primary miRNA processing(GO:0031053) |
| 0.1 | 0.9 | GO:0051195 | negative regulation of glycolytic process(GO:0045820) negative regulation of cofactor metabolic process(GO:0051195) negative regulation of coenzyme metabolic process(GO:0051198) |
| 0.1 | 0.5 | GO:0032185 | septin cytoskeleton organization(GO:0032185) |
| 0.1 | 0.2 | GO:1902047 | polyamine transmembrane transport(GO:1902047) regulation of polyamine transmembrane transport(GO:1902267) |
| 0.1 | 0.4 | GO:0015888 | thiamine transport(GO:0015888) |
| 0.1 | 0.4 | GO:0048227 | plasma membrane to endosome transport(GO:0048227) |
| 0.1 | 0.7 | GO:1901142 | insulin metabolic process(GO:1901142) |
| 0.1 | 0.1 | GO:0061056 | sclerotome development(GO:0061056) |
| 0.1 | 0.1 | GO:0032425 | positive regulation of mismatch repair(GO:0032425) |
| 0.1 | 0.7 | GO:0006655 | phosphatidylglycerol biosynthetic process(GO:0006655) |
| 0.1 | 0.2 | GO:0045653 | negative regulation of megakaryocyte differentiation(GO:0045653) |
| 0.1 | 2.0 | GO:0046710 | GDP metabolic process(GO:0046710) |
| 0.1 | 1.1 | GO:0010818 | T cell chemotaxis(GO:0010818) |
| 0.1 | 0.1 | GO:0071225 | cellular response to muramyl dipeptide(GO:0071225) |
| 0.1 | 0.2 | GO:0051066 | dihydrobiopterin metabolic process(GO:0051066) |
| 0.1 | 0.1 | GO:0098909 | regulation of cardiac muscle cell action potential involved in regulation of contraction(GO:0098909) |
| 0.1 | 0.9 | GO:0061179 | negative regulation of insulin secretion involved in cellular response to glucose stimulus(GO:0061179) |
| 0.1 | 5.4 | GO:0006383 | transcription from RNA polymerase III promoter(GO:0006383) |
| 0.1 | 0.5 | GO:0060158 | phospholipase C-activating dopamine receptor signaling pathway(GO:0060158) |
| 0.1 | 0.3 | GO:0071462 | cellular response to water deprivation(GO:0042631) cellular response to water stimulus(GO:0071462) |
| 0.1 | 0.5 | GO:2000074 | regulation of type B pancreatic cell development(GO:2000074) |
| 0.1 | 0.1 | GO:0003221 | right ventricular cardiac muscle tissue morphogenesis(GO:0003221) |
| 0.1 | 0.4 | GO:1904744 | positive regulation of telomeric DNA binding(GO:1904744) |
| 0.1 | 0.2 | GO:1902525 | regulation of protein monoubiquitination(GO:1902525) |
| 0.1 | 0.2 | GO:0016256 | N-glycan processing to lysosome(GO:0016256) |
| 0.1 | 0.3 | GO:0040034 | regulation of development, heterochronic(GO:0040034) regulation of timing of cell differentiation(GO:0048505) |
| 0.1 | 0.2 | GO:0002215 | defense response to nematode(GO:0002215) |
| 0.1 | 1.9 | GO:0006743 | ubiquinone metabolic process(GO:0006743) ubiquinone biosynthetic process(GO:0006744) quinone biosynthetic process(GO:1901663) |
| 0.1 | 1.8 | GO:0007216 | G-protein coupled glutamate receptor signaling pathway(GO:0007216) |
| 0.1 | 0.3 | GO:0021633 | optic nerve structural organization(GO:0021633) |
| 0.1 | 0.2 | GO:0043966 | histone H3 acetylation(GO:0043966) |
| 0.1 | 0.2 | GO:0018016 | N-terminal protein amino acid methylation(GO:0006480) N-terminal peptidyl-alanine methylation(GO:0018011) N-terminal peptidyl-alanine trimethylation(GO:0018012) N-terminal peptidyl-glycine methylation(GO:0018013) N-terminal peptidyl-proline dimethylation(GO:0018016) peptidyl-alanine modification(GO:0018194) N-terminal peptidyl-proline methylation(GO:0035568) N-terminal peptidyl-serine methylation(GO:0035570) N-terminal peptidyl-serine dimethylation(GO:0035572) N-terminal peptidyl-serine trimethylation(GO:0035573) |
| 0.1 | 0.1 | GO:0036089 | cleavage furrow formation(GO:0036089) |
| 0.1 | 0.3 | GO:0071394 | cellular response to testosterone stimulus(GO:0071394) |
| 0.1 | 0.1 | GO:0009146 | purine nucleoside triphosphate catabolic process(GO:0009146) |
| 0.1 | 0.3 | GO:0060024 | rhythmic synaptic transmission(GO:0060024) |
| 0.1 | 0.1 | GO:0017055 | female courtship behavior(GO:0008050) negative regulation of RNA polymerase II transcriptional preinitiation complex assembly(GO:0017055) |
| 0.1 | 0.2 | GO:0010845 | positive regulation of reciprocal meiotic recombination(GO:0010845) |
| 0.1 | 0.1 | GO:0048245 | eosinophil chemotaxis(GO:0048245) |
| 0.1 | 0.3 | GO:0072138 | mesenchymal cell proliferation involved in ureteric bud development(GO:0072138) |
| 0.1 | 0.2 | GO:0032571 | response to vitamin K(GO:0032571) |
| 0.1 | 2.2 | GO:0042994 | cytoplasmic sequestering of transcription factor(GO:0042994) |
| 0.1 | 0.2 | GO:0014004 | microglia differentiation(GO:0014004) microglia development(GO:0014005) |
| 0.1 | 0.2 | GO:1902222 | L-phenylalanine metabolic process(GO:0006558) L-phenylalanine catabolic process(GO:0006559) erythrose 4-phosphate/phosphoenolpyruvate family amino acid metabolic process(GO:1902221) erythrose 4-phosphate/phosphoenolpyruvate family amino acid catabolic process(GO:1902222) |
| 0.1 | 0.3 | GO:0007468 | regulation of rhodopsin gene expression(GO:0007468) positive regulation of rhodopsin gene expression(GO:0045872) |
| 0.1 | 2.7 | GO:1904031 | positive regulation of cyclin-dependent protein kinase activity(GO:1904031) |
| 0.1 | 0.9 | GO:2000696 | regulation of epithelial cell differentiation involved in kidney development(GO:2000696) |
| 0.1 | 0.5 | GO:0032927 | positive regulation of activin receptor signaling pathway(GO:0032927) |
| 0.1 | 0.7 | GO:0090204 | protein localization to nuclear pore(GO:0090204) |
| 0.1 | 0.4 | GO:1902474 | positive regulation of protein localization to synapse(GO:1902474) |
| 0.1 | 0.3 | GO:0035803 | egg coat formation(GO:0035803) |
| 0.1 | 1.7 | GO:2000785 | regulation of autophagosome assembly(GO:2000785) |
| 0.1 | 0.2 | GO:0060017 | parathyroid gland development(GO:0060017) |
| 0.1 | 0.1 | GO:2000483 | negative regulation of interleukin-8 secretion(GO:2000483) |
| 0.1 | 0.6 | GO:0007506 | gonadal mesoderm development(GO:0007506) |
| 0.1 | 0.7 | GO:0006552 | leucine catabolic process(GO:0006552) |
| 0.1 | 2.1 | GO:0048268 | clathrin coat assembly(GO:0048268) |
| 0.1 | 0.1 | GO:0051054 | positive regulation of DNA metabolic process(GO:0051054) |
| 0.1 | 0.1 | GO:1901858 | regulation of mitochondrial DNA metabolic process(GO:1901858) |
| 0.1 | 0.6 | GO:0097039 | protein linear polyubiquitination(GO:0097039) |
| 0.1 | 0.8 | GO:0008612 | peptidyl-lysine modification to peptidyl-hypusine(GO:0008612) |
| 0.1 | 0.5 | GO:1903232 | melanosome assembly(GO:1903232) |
| 0.1 | 0.4 | GO:0060356 | leucine import(GO:0060356) |
| 0.1 | 0.3 | GO:0043308 | eosinophil activation involved in immune response(GO:0002278) eosinophil mediated immunity(GO:0002447) eosinophil degranulation(GO:0043308) |
| 0.1 | 0.2 | GO:2000329 | peptidyl-lysine oxidation(GO:0018057) negative regulation of T-helper 17 cell lineage commitment(GO:2000329) |
| 0.1 | 0.7 | GO:0005981 | regulation of glycogen catabolic process(GO:0005981) |
| 0.1 | 0.1 | GO:0032466 | negative regulation of cytokinesis(GO:0032466) |
| 0.1 | 0.4 | GO:0090487 | toxin catabolic process(GO:0009407) secondary metabolite catabolic process(GO:0090487) |
| 0.1 | 0.3 | GO:0017085 | response to insecticide(GO:0017085) |
| 0.1 | 0.4 | GO:0010025 | wax biosynthetic process(GO:0010025) wax metabolic process(GO:0010166) |
| 0.1 | 0.2 | GO:0035674 | tricarboxylic acid transmembrane transport(GO:0035674) |
| 0.1 | 3.0 | GO:0000188 | inactivation of MAPK activity(GO:0000188) |
| 0.1 | 0.3 | GO:0035553 | oxidative RNA demethylation(GO:0035513) oxidative single-stranded RNA demethylation(GO:0035553) |
| 0.1 | 0.1 | GO:1901535 | regulation of DNA demethylation(GO:1901535) |
| 0.1 | 0.4 | GO:0018206 | peptidyl-methionine modification(GO:0018206) |
| 0.1 | 0.3 | GO:0048165 | ovarian cumulus expansion(GO:0001550) fused antrum stage(GO:0048165) |
| 0.1 | 0.1 | GO:0007351 | tripartite regional subdivision(GO:0007351) anterior/posterior axis specification, embryo(GO:0008595) |
| 0.1 | 1.5 | GO:0097320 | membrane tubulation(GO:0097320) |
| 0.1 | 1.7 | GO:0010971 | positive regulation of G2/M transition of mitotic cell cycle(GO:0010971) |
| 0.1 | 8.3 | GO:0070126 | mitochondrial translational termination(GO:0070126) |
| 0.1 | 0.2 | GO:0061188 | negative regulation of chromatin silencing at rDNA(GO:0061188) |
| 0.1 | 0.3 | GO:0060478 | acrosomal vesicle exocytosis(GO:0060478) |
| 0.1 | 0.3 | GO:0046340 | diacylglycerol catabolic process(GO:0046340) |
| 0.1 | 0.2 | GO:1900017 | positive regulation of cytokine production involved in inflammatory response(GO:1900017) |
| 0.1 | 0.2 | GO:0044571 | [2Fe-2S] cluster assembly(GO:0044571) |
| 0.1 | 0.4 | GO:0002138 | retinoic acid biosynthetic process(GO:0002138) diterpenoid biosynthetic process(GO:0016102) |
| 0.1 | 0.1 | GO:0021897 | forebrain astrocyte differentiation(GO:0021896) forebrain astrocyte development(GO:0021897) |
| 0.1 | 0.1 | GO:0040009 | regulation of growth rate(GO:0040009) |
| 0.1 | 0.4 | GO:0051151 | negative regulation of smooth muscle cell differentiation(GO:0051151) |
| 0.1 | 0.1 | GO:0042534 | tumor necrosis factor biosynthetic process(GO:0042533) regulation of tumor necrosis factor biosynthetic process(GO:0042534) |
| 0.1 | 0.1 | GO:1901509 | regulation of endothelial tube morphogenesis(GO:1901509) |
| 0.1 | 0.1 | GO:1902309 | negative regulation of peptidyl-serine dephosphorylation(GO:1902309) |
| 0.1 | 0.1 | GO:0002586 | regulation of antigen processing and presentation of peptide antigen via MHC class II(GO:0002586) |
| 0.1 | 0.1 | GO:0042091 | interleukin-10 biosynthetic process(GO:0042091) regulation of interleukin-10 biosynthetic process(GO:0045074) |
| 0.1 | 0.1 | GO:0090521 | glomerular visceral epithelial cell migration(GO:0090521) |
| 0.1 | 4.1 | GO:0008088 | axo-dendritic transport(GO:0008088) |
| 0.1 | 0.1 | GO:0090214 | spongiotrophoblast layer developmental growth(GO:0090214) |
| 0.1 | 0.8 | GO:0001867 | complement activation, lectin pathway(GO:0001867) |
| 0.1 | 0.5 | GO:0045736 | negative regulation of cyclin-dependent protein serine/threonine kinase activity(GO:0045736) |
| 0.1 | 1.5 | GO:0032463 | negative regulation of protein homooligomerization(GO:0032463) |
| 0.1 | 0.1 | GO:0003241 | growth involved in heart morphogenesis(GO:0003241) |
| 0.1 | 0.4 | GO:0071630 | nucleus-associated proteasomal ubiquitin-dependent protein catabolic process(GO:0071630) |
| 0.1 | 0.3 | GO:0044501 | modulation of signal transduction in other organism(GO:0044501) modulation by symbiont of host signal transduction pathway(GO:0052027) modulation of signal transduction in other organism involved in symbiotic interaction(GO:0052250) modulation by symbiont of host I-kappaB kinase/NF-kappaB cascade(GO:0085032) |
| 0.1 | 0.2 | GO:0014887 | muscle hypertrophy in response to stress(GO:0003299) cardiac muscle adaptation(GO:0014887) cardiac muscle hypertrophy in response to stress(GO:0014898) |
| 0.1 | 0.3 | GO:1904158 | axonemal central apparatus assembly(GO:1904158) |
| 0.1 | 0.4 | GO:0070459 | prolactin secretion(GO:0070459) |
| 0.1 | 0.4 | GO:0048308 | organelle inheritance(GO:0048308) Golgi inheritance(GO:0048313) |
| 0.1 | 0.4 | GO:0071636 | positive regulation of transforming growth factor beta production(GO:0071636) |
| 0.1 | 0.2 | GO:0006216 | cytidine catabolic process(GO:0006216) cytidine deamination(GO:0009972) cytidine metabolic process(GO:0046087) |
| 0.1 | 0.2 | GO:0003408 | optic cup formation involved in camera-type eye development(GO:0003408) |
| 0.1 | 0.5 | GO:2000860 | positive regulation of mineralocorticoid secretion(GO:2000857) positive regulation of aldosterone secretion(GO:2000860) |
| 0.1 | 0.9 | GO:0030422 | production of siRNA involved in RNA interference(GO:0030422) |
| 0.1 | 0.3 | GO:0033210 | leptin-mediated signaling pathway(GO:0033210) |
| 0.1 | 0.1 | GO:1904751 | positive regulation of protein localization to nucleolus(GO:1904751) |
| 0.1 | 0.5 | GO:0002544 | chronic inflammatory response(GO:0002544) |
| 0.1 | 0.2 | GO:0035350 | FAD transport(GO:0015883) FAD transmembrane transport(GO:0035350) |
| 0.1 | 0.5 | GO:0006432 | phenylalanyl-tRNA aminoacylation(GO:0006432) |
| 0.1 | 0.3 | GO:0046292 | formaldehyde metabolic process(GO:0046292) |
| 0.1 | 0.2 | GO:0030997 | regulation of centriole-centriole cohesion(GO:0030997) |
| 0.1 | 0.3 | GO:0060743 | epithelial cell maturation involved in prostate gland development(GO:0060743) |
| 0.1 | 0.5 | GO:0061469 | regulation of type B pancreatic cell proliferation(GO:0061469) |
| 0.1 | 0.5 | GO:0032957 | inositol trisphosphate metabolic process(GO:0032957) |
| 0.1 | 0.1 | GO:2000298 | regulation of Rho-dependent protein serine/threonine kinase activity(GO:2000298) |
| 0.1 | 0.2 | GO:0070781 | response to biotin(GO:0070781) |
| 0.1 | 0.3 | GO:1901842 | negative regulation of high voltage-gated calcium channel activity(GO:1901842) |
| 0.1 | 0.6 | GO:0006307 | DNA dealkylation involved in DNA repair(GO:0006307) |
| 0.1 | 0.4 | GO:0042753 | positive regulation of circadian rhythm(GO:0042753) |
| 0.1 | 1.3 | GO:0032878 | regulation of establishment or maintenance of cell polarity(GO:0032878) |
| 0.1 | 0.3 | GO:0032886 | regulation of microtubule-based process(GO:0032886) |
| 0.1 | 0.1 | GO:0007398 | ectoderm development(GO:0007398) |
| 0.1 | 0.1 | GO:0036090 | cleavage furrow ingression(GO:0036090) |
| 0.1 | 0.1 | GO:0043335 | protein unfolding(GO:0043335) |
| 0.1 | 1.2 | GO:0009954 | proximal/distal pattern formation(GO:0009954) |
| 0.1 | 0.3 | GO:0051866 | general adaptation syndrome(GO:0051866) |
| 0.1 | 0.5 | GO:0045072 | regulation of interferon-gamma biosynthetic process(GO:0045072) |
| 0.1 | 0.4 | GO:0060316 | positive regulation of ryanodine-sensitive calcium-release channel activity(GO:0060316) |
| 0.1 | 0.5 | GO:0035458 | cellular response to interferon-beta(GO:0035458) |
| 0.1 | 0.4 | GO:0097194 | execution phase of apoptosis(GO:0097194) |
| 0.1 | 1.4 | GO:1902857 | positive regulation of nonmotile primary cilium assembly(GO:1902857) |
| 0.1 | 0.4 | GO:1990822 | basic amino acid transmembrane transport(GO:1990822) |
| 0.1 | 0.1 | GO:0003352 | regulation of cilium movement(GO:0003352) |
| 0.1 | 0.3 | GO:0000379 | tRNA-type intron splice site recognition and cleavage(GO:0000379) |
| 0.1 | 0.4 | GO:0051030 | snRNA transport(GO:0051030) |
| 0.1 | 0.4 | GO:0021794 | thalamus development(GO:0021794) |
| 0.1 | 0.1 | GO:0009644 | response to high light intensity(GO:0009644) |
| 0.1 | 0.1 | GO:0006477 | protein sulfation(GO:0006477) |
| 0.1 | 0.6 | GO:0070193 | synaptonemal complex assembly(GO:0007130) synaptonemal complex organization(GO:0070193) |
| 0.1 | 0.4 | GO:0006420 | arginyl-tRNA aminoacylation(GO:0006420) |
| 0.1 | 0.3 | GO:0033184 | positive regulation of histone ubiquitination(GO:0033184) regulation of histone H2B ubiquitination(GO:2001166) positive regulation of histone H2B ubiquitination(GO:2001168) |
| 0.1 | 0.1 | GO:0034134 | toll-like receptor 2 signaling pathway(GO:0034134) |
| 0.1 | 0.1 | GO:0003351 | epithelial cilium movement(GO:0003351) |
| 0.1 | 1.7 | GO:0035590 | purinergic nucleotide receptor signaling pathway(GO:0035590) |
| 0.1 | 0.3 | GO:0000480 | endonucleolytic cleavage in 5'-ETS of tricistronic rRNA transcript (SSU-rRNA, 5.8S rRNA, LSU-rRNA)(GO:0000480) |
| 0.1 | 1.1 | GO:2000480 | negative regulation of cAMP-dependent protein kinase activity(GO:2000480) |
| 0.1 | 0.1 | GO:1902229 | regulation of intrinsic apoptotic signaling pathway in response to DNA damage(GO:1902229) |
| 0.1 | 0.2 | GO:0034970 | histone H3-R2 methylation(GO:0034970) |
| 0.1 | 0.6 | GO:0035634 | response to stilbenoid(GO:0035634) |
| 0.1 | 0.6 | GO:0008535 | respiratory chain complex IV assembly(GO:0008535) |
| 0.1 | 0.5 | GO:0035247 | peptidyl-arginine omega-N-methylation(GO:0035247) |
| 0.1 | 0.1 | GO:2001180 | negative regulation of interleukin-10 secretion(GO:2001180) |
| 0.1 | 0.2 | GO:0046778 | modification by virus of host mRNA processing(GO:0046778) |
| 0.1 | 0.4 | GO:1901096 | regulation of autophagosome maturation(GO:1901096) |
| 0.1 | 0.2 | GO:0097091 | synaptic vesicle clustering(GO:0097091) |
| 0.1 | 0.3 | GO:0031937 | positive regulation of chromatin silencing(GO:0031937) |
| 0.1 | 0.2 | GO:0060712 | spongiotrophoblast layer development(GO:0060712) |
| 0.1 | 0.1 | GO:0006067 | ethanol metabolic process(GO:0006067) |
| 0.1 | 0.7 | GO:0060333 | interferon-gamma-mediated signaling pathway(GO:0060333) |
| 0.1 | 0.1 | GO:0045647 | negative regulation of erythrocyte differentiation(GO:0045647) |
| 0.1 | 1.1 | GO:0050908 | detection of light stimulus involved in visual perception(GO:0050908) detection of light stimulus involved in sensory perception(GO:0050962) |
| 0.1 | 0.5 | GO:0006560 | proline metabolic process(GO:0006560) |
| 0.1 | 0.5 | GO:0060033 | anatomical structure regression(GO:0060033) |
| 0.1 | 0.1 | GO:0010936 | negative regulation of macrophage cytokine production(GO:0010936) |
| 0.1 | 0.2 | GO:0061073 | ciliary body morphogenesis(GO:0061073) |
| 0.1 | 0.1 | GO:0060161 | positive regulation of dopamine receptor signaling pathway(GO:0060161) |
| 0.1 | 0.1 | GO:0006579 | amino-acid betaine catabolic process(GO:0006579) |
| 0.1 | 0.2 | GO:0043985 | histone H4-R3 methylation(GO:0043985) |
| 0.1 | 0.3 | GO:0031124 | mRNA 3'-end processing(GO:0031124) |
| 0.1 | 0.1 | GO:0071484 | cellular response to light intensity(GO:0071484) |
| 0.1 | 0.1 | GO:0002276 | basophil activation involved in immune response(GO:0002276) |
| 0.1 | 2.0 | GO:0097503 | sialylation(GO:0097503) |
| 0.1 | 0.2 | GO:0033326 | cerebrospinal fluid secretion(GO:0033326) |
| 0.1 | 0.1 | GO:1902916 | positive regulation of protein polyubiquitination(GO:1902916) |
| 0.1 | 0.2 | GO:0006218 | uridine catabolic process(GO:0006218) |
| 0.1 | 0.1 | GO:0050859 | negative regulation of B cell receptor signaling pathway(GO:0050859) |
| 0.1 | 0.2 | GO:1904706 | negative regulation of vascular smooth muscle cell proliferation(GO:1904706) |
| 0.1 | 0.2 | GO:0046035 | CMP salvage(GO:0006238) CMP biosynthetic process(GO:0009224) CMP metabolic process(GO:0046035) |
| 0.1 | 0.7 | GO:1901186 | positive regulation of epidermal growth factor receptor signaling pathway(GO:0045742) positive regulation of ERBB signaling pathway(GO:1901186) |
| 0.1 | 0.4 | GO:0034315 | regulation of Arp2/3 complex-mediated actin nucleation(GO:0034315) |
| 0.1 | 0.2 | GO:1904327 | protein localization to cytosolic proteasome complex(GO:1904327) protein localization to cytosolic proteasome complex involved in ERAD pathway(GO:1904379) |
| 0.1 | 0.2 | GO:0060992 | response to fungicide(GO:0060992) |
| 0.1 | 0.1 | GO:0090400 | stress-induced premature senescence(GO:0090400) |
| 0.1 | 0.2 | GO:0014826 | vein smooth muscle contraction(GO:0014826) |
| 0.1 | 0.5 | GO:0019368 | fatty acid elongation, saturated fatty acid(GO:0019367) fatty acid elongation, unsaturated fatty acid(GO:0019368) fatty acid elongation, monounsaturated fatty acid(GO:0034625) fatty acid elongation, polyunsaturated fatty acid(GO:0034626) |
| 0.1 | 0.3 | GO:0044341 | sodium-dependent phosphate transport(GO:0044341) |
| 0.1 | 0.2 | GO:0046495 | nicotinamide riboside catabolic process(GO:0006738) nicotinamide riboside metabolic process(GO:0046495) pyridine nucleoside metabolic process(GO:0070637) pyridine nucleoside catabolic process(GO:0070638) |
| 0.1 | 0.6 | GO:0060391 | positive regulation of SMAD protein import into nucleus(GO:0060391) |
| 0.1 | 0.9 | GO:0019371 | cyclooxygenase pathway(GO:0019371) |
| 0.1 | 0.1 | GO:0071877 | regulation of adrenergic receptor signaling pathway(GO:0071877) |
| 0.1 | 0.2 | GO:0045624 | positive regulation of T-helper cell differentiation(GO:0045624) |
| 0.1 | 0.2 | GO:0002881 | microglial cell activation involved in immune response(GO:0002282) negative regulation of chronic inflammatory response to non-antigenic stimulus(GO:0002881) |
| 0.1 | 0.5 | GO:0018344 | protein geranylgeranylation(GO:0018344) |
| 0.1 | 0.1 | GO:0042501 | serine phosphorylation of STAT protein(GO:0042501) |
| 0.1 | 0.9 | GO:0003016 | respiratory system process(GO:0003016) |
| 0.1 | 0.1 | GO:0021797 | forebrain anterior/posterior pattern specification(GO:0021797) |
| 0.1 | 0.2 | GO:0015870 | acetylcholine transport(GO:0015870) |
| 0.1 | 0.3 | GO:0071442 | positive regulation of histone H3-K14 acetylation(GO:0071442) |
| 0.1 | 0.6 | GO:0009109 | coenzyme catabolic process(GO:0009109) |
| 0.1 | 0.3 | GO:2000324 | positive regulation of glucocorticoid receptor signaling pathway(GO:2000324) |
| 0.1 | 0.6 | GO:0045329 | carnitine biosynthetic process(GO:0045329) |
| 0.1 | 2.4 | GO:0050690 | regulation of defense response to virus by virus(GO:0050690) |
| 0.1 | 0.8 | GO:0032515 | negative regulation of phosphoprotein phosphatase activity(GO:0032515) |
| 0.1 | 0.1 | GO:0070601 | centromeric sister chromatid cohesion(GO:0070601) |
| 0.1 | 0.2 | GO:0001994 | norepinephrine-epinephrine vasoconstriction involved in regulation of systemic arterial blood pressure(GO:0001994) |
| 0.1 | 0.2 | GO:0042369 | vitamin D catabolic process(GO:0042369) |
| 0.1 | 1.3 | GO:0045063 | T-helper 1 cell differentiation(GO:0045063) |
| 0.1 | 0.1 | GO:1902626 | assembly of large subunit precursor of preribosome(GO:1902626) |
| 0.1 | 0.3 | GO:0070979 | protein K11-linked ubiquitination(GO:0070979) |
| 0.1 | 0.1 | GO:0060632 | regulation of microtubule-based movement(GO:0060632) |
| 0.1 | 0.1 | GO:0006780 | uroporphyrinogen III biosynthetic process(GO:0006780) uroporphyrinogen III metabolic process(GO:0046502) |
| 0.1 | 0.1 | GO:1903244 | positive regulation of cardiac muscle adaptation(GO:0010615) positive regulation of cardiac muscle hypertrophy in response to stress(GO:1903244) |
| 0.1 | 0.1 | GO:1990776 | response to angiotensin(GO:1990776) |
| 0.1 | 0.1 | GO:0050893 | sensory processing(GO:0050893) |
| 0.1 | 0.4 | GO:0035609 | C-terminal protein deglutamylation(GO:0035609) |
| 0.1 | 1.1 | GO:0071276 | cellular response to cadmium ion(GO:0071276) |
| 0.1 | 0.5 | GO:0010944 | negative regulation of transcription by competitive promoter binding(GO:0010944) |
| 0.1 | 0.1 | GO:0071514 | genetic imprinting(GO:0071514) |
| 0.1 | 0.1 | GO:0010880 | regulation of release of sequestered calcium ion into cytosol by sarcoplasmic reticulum(GO:0010880) |
| 0.1 | 0.2 | GO:0003404 | optic vesicle morphogenesis(GO:0003404) optic cup structural organization(GO:0003409) |
| 0.1 | 0.2 | GO:0042126 | nitrate metabolic process(GO:0042126) |
| 0.1 | 0.4 | GO:0044375 | regulation of peroxisome size(GO:0044375) |
| 0.1 | 1.3 | GO:0018146 | keratan sulfate biosynthetic process(GO:0018146) |
| 0.1 | 0.4 | GO:0042635 | positive regulation of hair cycle(GO:0042635) |
| 0.1 | 0.4 | GO:0045837 | negative regulation of membrane potential(GO:0045837) |
| 0.1 | 2.2 | GO:0007223 | Wnt signaling pathway, calcium modulating pathway(GO:0007223) |
| 0.1 | 0.3 | GO:0060669 | embryonic placenta morphogenesis(GO:0060669) |
| 0.1 | 0.3 | GO:1990253 | cellular response to leucine starvation(GO:1990253) |
| 0.1 | 0.1 | GO:0072205 | metanephric collecting duct development(GO:0072205) |
| 0.1 | 0.1 | GO:0045792 | negative regulation of cell size(GO:0045792) |
| 0.1 | 0.2 | GO:0060011 | Sertoli cell proliferation(GO:0060011) |
| 0.1 | 0.4 | GO:0016926 | protein desumoylation(GO:0016926) |
| 0.1 | 0.2 | GO:0070407 | oxidation-dependent protein catabolic process(GO:0070407) |
| 0.1 | 0.7 | GO:0034356 | NAD biosynthesis via nicotinamide riboside salvage pathway(GO:0034356) |
| 0.1 | 0.2 | GO:0043012 | regulation of fusion of sperm to egg plasma membrane(GO:0043012) |
| 0.1 | 0.1 | GO:0046015 | regulation of transcription by glucose(GO:0046015) |
| 0.1 | 0.2 | GO:0043615 | astrocyte cell migration(GO:0043615) |
| 0.1 | 1.7 | GO:0070911 | global genome nucleotide-excision repair(GO:0070911) |
| 0.1 | 1.0 | GO:0046339 | diacylglycerol metabolic process(GO:0046339) |
| 0.1 | 0.2 | GO:0001188 | RNA polymerase I transcriptional preinitiation complex assembly(GO:0001188) RNA polymerase I transcriptional preinitiation complex assembly at the promoter for the nuclear large rRNA transcript(GO:0001189) |
| 0.1 | 0.4 | GO:0002943 | tRNA dihydrouridine synthesis(GO:0002943) |
| 0.1 | 0.2 | GO:0060010 | Sertoli cell fate commitment(GO:0060010) |
| 0.1 | 0.5 | GO:0035331 | negative regulation of hippo signaling(GO:0035331) |
| 0.1 | 0.1 | GO:0050847 | progesterone receptor signaling pathway(GO:0050847) |
| 0.1 | 2.0 | GO:1901016 | regulation of potassium ion transmembrane transporter activity(GO:1901016) |
| 0.1 | 0.3 | GO:0090009 | primitive streak formation(GO:0090009) |
| 0.1 | 0.1 | GO:0034553 | respiratory chain complex II assembly(GO:0034552) mitochondrial respiratory chain complex II assembly(GO:0034553) mitochondrial respiratory chain complex II biogenesis(GO:0097032) |
| 0.1 | 0.2 | GO:2000653 | regulation of genetic imprinting(GO:2000653) |
| 0.1 | 0.1 | GO:0071163 | DNA replication preinitiation complex assembly(GO:0071163) |
| 0.1 | 0.1 | GO:0071880 | adenylate cyclase-activating adrenergic receptor signaling pathway(GO:0071880) |
| 0.1 | 0.2 | GO:1903697 | negative regulation of microvillus assembly(GO:1903697) |
| 0.1 | 0.5 | GO:0031119 | tRNA pseudouridine synthesis(GO:0031119) |
| 0.1 | 0.1 | GO:0003256 | regulation of transcription from RNA polymerase II promoter involved in myocardial precursor cell differentiation(GO:0003256) |
| 0.1 | 0.5 | GO:0033182 | regulation of histone ubiquitination(GO:0033182) |
| 0.1 | 0.4 | GO:0032482 | Rab protein signal transduction(GO:0032482) |
| 0.1 | 0.3 | GO:0048539 | bone marrow development(GO:0048539) |
| 0.1 | 0.1 | GO:0003032 | detection of oxygen(GO:0003032) |
| 0.1 | 0.1 | GO:0034227 | tRNA thio-modification(GO:0034227) |
| 0.1 | 0.1 | GO:0001827 | inner cell mass cell fate commitment(GO:0001827) |
| 0.1 | 0.4 | GO:0017196 | N-terminal peptidyl-methionine acetylation(GO:0017196) |
| 0.1 | 0.1 | GO:1901739 | regulation of myoblast fusion(GO:1901739) |
| 0.1 | 0.1 | GO:0061470 | T follicular helper cell differentiation(GO:0061470) |
| 0.0 | 0.1 | GO:0010621 | negative regulation of transcription by transcription factor localization(GO:0010621) |
| 0.0 | 0.7 | GO:0035092 | sperm chromatin condensation(GO:0035092) |
| 0.0 | 0.9 | GO:0010800 | positive regulation of peptidyl-threonine phosphorylation(GO:0010800) |
| 0.0 | 0.0 | GO:0031126 | snoRNA 3'-end processing(GO:0031126) |
| 0.0 | 2.9 | GO:0006414 | translational elongation(GO:0006414) |
| 0.0 | 2.6 | GO:0070830 | bicellular tight junction assembly(GO:0070830) |
| 0.0 | 0.6 | GO:0031268 | pseudopodium organization(GO:0031268) |
| 0.0 | 0.9 | GO:0003334 | keratinocyte development(GO:0003334) |
| 0.0 | 0.2 | GO:0070254 | mucus secretion(GO:0070254) |
| 0.0 | 0.2 | GO:0010765 | positive regulation of sodium ion transport(GO:0010765) |
| 0.0 | 0.4 | GO:0009249 | protein lipoylation(GO:0009249) |
| 0.0 | 0.2 | GO:1903599 | positive regulation of mitophagy(GO:1903599) |
| 0.0 | 0.1 | GO:0034154 | toll-like receptor 7 signaling pathway(GO:0034154) |
| 0.0 | 0.1 | GO:0042040 | molybdenum incorporation into molybdenum-molybdopterin complex(GO:0018315) metal incorporation into metallo-molybdopterin complex(GO:0042040) glycine receptor clustering(GO:0072579) |
| 0.0 | 0.1 | GO:0060179 | male mating behavior(GO:0060179) |
| 0.0 | 0.5 | GO:0048298 | positive regulation of isotype switching to IgA isotypes(GO:0048298) |
| 0.0 | 0.0 | GO:0051187 | cofactor catabolic process(GO:0051187) |
| 0.0 | 0.0 | GO:0048807 | female genitalia morphogenesis(GO:0048807) |
| 0.0 | 0.2 | GO:1901223 | negative regulation of NIK/NF-kappaB signaling(GO:1901223) |
| 0.0 | 0.2 | GO:0014050 | negative regulation of glutamate secretion(GO:0014050) negative regulation of amino acid transport(GO:0051956) |
| 0.0 | 0.4 | GO:0007379 | segment specification(GO:0007379) |
| 0.0 | 0.0 | GO:0061428 | negative regulation of transcription from RNA polymerase II promoter in response to hypoxia(GO:0061428) |
| 0.0 | 0.3 | GO:0034244 | negative regulation of transcription elongation from RNA polymerase II promoter(GO:0034244) |
| 0.0 | 0.1 | GO:0035308 | negative regulation of protein dephosphorylation(GO:0035308) |
| 0.0 | 0.8 | GO:0006265 | DNA topological change(GO:0006265) |
| 0.0 | 0.1 | GO:1901207 | regulation of heart looping(GO:1901207) |
| 0.0 | 0.2 | GO:0021520 | spinal cord motor neuron cell fate specification(GO:0021520) |
| 0.0 | 0.8 | GO:0075522 | IRES-dependent viral translational initiation(GO:0075522) |
| 0.0 | 0.1 | GO:0051451 | myoblast migration(GO:0051451) |
| 0.0 | 0.0 | GO:0070318 | positive regulation of G0 to G1 transition(GO:0070318) |
| 0.0 | 0.2 | GO:0003406 | retinal pigment epithelium development(GO:0003406) |
| 0.0 | 0.6 | GO:0033169 | histone H3-K9 demethylation(GO:0033169) |
| 0.0 | 0.1 | GO:0032713 | negative regulation of interleukin-4 production(GO:0032713) |
| 0.0 | 1.3 | GO:2000249 | regulation of actin cytoskeleton reorganization(GO:2000249) |
| 0.0 | 0.9 | GO:0010882 | regulation of cardiac muscle contraction by calcium ion signaling(GO:0010882) |
| 0.0 | 0.1 | GO:0003431 | growth plate cartilage chondrocyte development(GO:0003431) |
| 0.0 | 0.8 | GO:0007250 | activation of NF-kappaB-inducing kinase activity(GO:0007250) |
| 0.0 | 0.3 | GO:0072757 | cellular response to camptothecin(GO:0072757) |
| 0.0 | 1.0 | GO:0010591 | regulation of lamellipodium assembly(GO:0010591) |
| 0.0 | 0.1 | GO:0070842 | aggresome assembly(GO:0070842) |
| 0.0 | 0.6 | GO:0030388 | fructose 1,6-bisphosphate metabolic process(GO:0030388) |
| 0.0 | 0.1 | GO:0003373 | dynamin polymerization involved in membrane fission(GO:0003373) dynamin polymerization involved in mitochondrial fission(GO:0003374) |
| 0.0 | 0.4 | GO:0043457 | regulation of cellular respiration(GO:0043457) |
| 0.0 | 0.0 | GO:0001574 | ganglioside biosynthetic process(GO:0001574) |
| 0.0 | 0.3 | GO:0021840 | directional guidance of interneurons involved in migration from the subpallium to the cortex(GO:0021840) chemorepulsion involved in interneuron migration from the subpallium to the cortex(GO:0021842) |
| 0.0 | 1.0 | GO:0045116 | protein neddylation(GO:0045116) |
| 0.0 | 0.2 | GO:0071801 | regulation of podosome assembly(GO:0071801) |
| 0.0 | 0.5 | GO:1904886 | beta-catenin destruction complex disassembly(GO:1904886) |
| 0.0 | 0.3 | GO:0070383 | DNA deamination(GO:0045006) DNA cytosine deamination(GO:0070383) |
| 0.0 | 0.0 | GO:0010982 | regulation of high-density lipoprotein particle clearance(GO:0010982) |
| 0.0 | 0.7 | GO:0043248 | proteasome assembly(GO:0043248) |
| 0.0 | 2.0 | GO:0035019 | somatic stem cell population maintenance(GO:0035019) |
| 0.0 | 0.0 | GO:0033504 | floor plate development(GO:0033504) |
| 0.0 | 0.0 | GO:0048880 | sensory system development(GO:0048880) |
| 0.0 | 0.2 | GO:0051490 | negative regulation of filopodium assembly(GO:0051490) |
| 0.0 | 0.2 | GO:0050930 | induction of positive chemotaxis(GO:0050930) |
| 0.0 | 0.0 | GO:0000255 | allantoin metabolic process(GO:0000255) |
| 0.0 | 0.1 | GO:0000726 | non-recombinational repair(GO:0000726) double-strand break repair via nonhomologous end joining(GO:0006303) |
| 0.0 | 0.0 | GO:1904779 | regulation of protein localization to centrosome(GO:1904779) |
| 0.0 | 0.1 | GO:0060546 | negative regulation of necroptotic process(GO:0060546) |
| 0.0 | 3.6 | GO:0071357 | type I interferon signaling pathway(GO:0060337) cellular response to type I interferon(GO:0071357) |
| 0.0 | 0.9 | GO:0043984 | histone H4-K16 acetylation(GO:0043984) |
| 0.0 | 0.1 | GO:0003266 | regulation of secondary heart field cardioblast proliferation(GO:0003266) positive regulation of secondary heart field cardioblast proliferation(GO:0072513) |
| 0.0 | 0.7 | GO:0043508 | negative regulation of JUN kinase activity(GO:0043508) |
| 0.0 | 0.1 | GO:0060742 | epithelial cell differentiation involved in prostate gland development(GO:0060742) |
| 0.0 | 0.5 | GO:0097201 | negative regulation of transcription from RNA polymerase II promoter in response to stress(GO:0097201) |
| 0.0 | 0.3 | GO:0061732 | mitochondrial acetyl-CoA biosynthetic process from pyruvate(GO:0061732) |
| 0.0 | 0.1 | GO:0006423 | cysteinyl-tRNA aminoacylation(GO:0006423) |
| 0.0 | 0.4 | GO:0015760 | hexose phosphate transport(GO:0015712) glucose-6-phosphate transport(GO:0015760) |
| 0.0 | 0.1 | GO:0038098 | sequestering of BMP from receptor via BMP binding(GO:0038098) |
| 0.0 | 0.0 | GO:0097151 | positive regulation of inhibitory postsynaptic potential(GO:0097151) modulation of inhibitory postsynaptic potential(GO:0098828) |
| 0.0 | 0.4 | GO:2000052 | positive regulation of non-canonical Wnt signaling pathway(GO:2000052) |
| 0.0 | 0.1 | GO:0036006 | response to macrophage colony-stimulating factor(GO:0036005) cellular response to macrophage colony-stimulating factor stimulus(GO:0036006) |
| 0.0 | 0.3 | GO:0001887 | selenium compound metabolic process(GO:0001887) |
| 0.0 | 0.1 | GO:0046688 | response to copper ion(GO:0046688) |
| 0.0 | 2.5 | GO:0006120 | mitochondrial electron transport, NADH to ubiquinone(GO:0006120) |
| 0.0 | 0.5 | GO:0042347 | negative regulation of NF-kappaB import into nucleus(GO:0042347) |
| 0.0 | 0.1 | GO:0032286 | central nervous system myelin maintenance(GO:0032286) |
| 0.0 | 0.5 | GO:0070863 | positive regulation of protein exit from endoplasmic reticulum(GO:0070863) |
| 0.0 | 0.0 | GO:0021830 | interneuron migration from the subpallium to the cortex(GO:0021830) |
| 0.0 | 0.3 | GO:0010288 | response to lead ion(GO:0010288) |
| 0.0 | 0.1 | GO:0051132 | NK T cell activation(GO:0051132) |
| 0.0 | 0.9 | GO:0045747 | positive regulation of Notch signaling pathway(GO:0045747) |
| 0.0 | 0.1 | GO:0021526 | medial motor column neuron differentiation(GO:0021526) |
| 0.0 | 0.7 | GO:0046415 | urate metabolic process(GO:0046415) |
| 0.0 | 0.1 | GO:0007059 | chromosome segregation(GO:0007059) |
| 0.0 | 0.2 | GO:1903333 | regulation of protein refolding(GO:0061083) negative regulation of protein refolding(GO:0061084) negative regulation of protein folding(GO:1903333) |
| 0.0 | 0.5 | GO:0060314 | regulation of ryanodine-sensitive calcium-release channel activity(GO:0060314) |
| 0.0 | 0.0 | GO:2000812 | regulation of barbed-end actin filament capping(GO:2000812) |
| 0.0 | 0.1 | GO:0006956 | complement activation(GO:0006956) |
| 0.0 | 0.5 | GO:0046951 | ketone body biosynthetic process(GO:0046951) |
| 0.0 | 0.1 | GO:0002118 | aggressive behavior(GO:0002118) |
| 0.0 | 0.1 | GO:1900155 | regulation of bone trabecula formation(GO:1900154) negative regulation of bone trabecula formation(GO:1900155) |
| 0.0 | 0.4 | GO:0032025 | response to cobalt ion(GO:0032025) |
| 0.0 | 0.1 | GO:0000711 | meiotic DNA repair synthesis(GO:0000711) |
| 0.0 | 0.1 | GO:0032095 | regulation of response to food(GO:0032095) |
| 0.0 | 0.4 | GO:0080182 | histone H3-K4 trimethylation(GO:0080182) |
| 0.0 | 0.2 | GO:0006551 | leucine metabolic process(GO:0006551) |
| 0.0 | 0.1 | GO:2001224 | positive regulation of neuron migration(GO:2001224) |
| 0.0 | 0.2 | GO:0002318 | myeloid progenitor cell differentiation(GO:0002318) |
| 0.0 | 0.1 | GO:0050747 | positive regulation of lipoprotein metabolic process(GO:0050747) |
| 0.0 | 0.3 | GO:0016198 | axon choice point recognition(GO:0016198) |
| 0.0 | 0.1 | GO:0032074 | negative regulation of nuclease activity(GO:0032074) |
| 0.0 | 0.1 | GO:0010989 | negative regulation of low-density lipoprotein particle clearance(GO:0010989) |
| 0.0 | 1.2 | GO:0070536 | protein K63-linked deubiquitination(GO:0070536) |
| 0.0 | 1.3 | GO:0046928 | regulation of neurotransmitter secretion(GO:0046928) |
| 0.0 | 0.6 | GO:0006388 | tRNA splicing, via endonucleolytic cleavage and ligation(GO:0006388) |
| 0.0 | 0.1 | GO:1903567 | negative regulation of protein localization to cilium(GO:1903565) regulation of protein localization to ciliary membrane(GO:1903567) negative regulation of protein localization to ciliary membrane(GO:1903568) |
| 0.0 | 0.7 | GO:0000185 | activation of MAPKKK activity(GO:0000185) |
| 0.0 | 0.2 | GO:0019626 | short-chain fatty acid catabolic process(GO:0019626) |
| 0.0 | 0.8 | GO:0072539 | T-helper 17 cell differentiation(GO:0072539) |
| 0.0 | 0.5 | GO:0046784 | viral mRNA export from host cell nucleus(GO:0046784) |
| 0.0 | 0.4 | GO:0060216 | definitive hemopoiesis(GO:0060216) |
| 0.0 | 0.1 | GO:0036016 | response to interleukin-3(GO:0036015) cellular response to interleukin-3(GO:0036016) |
| 0.0 | 0.0 | GO:0051029 | rRNA transport(GO:0051029) |
| 0.0 | 0.2 | GO:0003322 | pancreatic A cell development(GO:0003322) |
| 0.0 | 0.9 | GO:0032008 | positive regulation of TOR signaling(GO:0032008) |
| 0.0 | 0.3 | GO:2000637 | positive regulation of gene silencing by miRNA(GO:2000637) |
| 0.0 | 0.2 | GO:0060613 | fat pad development(GO:0060613) |
| 0.0 | 0.2 | GO:0009162 | deoxyribonucleoside monophosphate metabolic process(GO:0009162) |
| 0.0 | 0.2 | GO:0048749 | compound eye development(GO:0048749) |
| 0.0 | 0.5 | GO:0042554 | superoxide anion generation(GO:0042554) |
| 0.0 | 0.2 | GO:0001672 | regulation of chromatin assembly or disassembly(GO:0001672) |
| 0.0 | 0.3 | GO:0003084 | positive regulation of systemic arterial blood pressure(GO:0003084) |
| 0.0 | 1.1 | GO:0015858 | nucleoside transport(GO:0015858) |
| 0.0 | 0.3 | GO:0007623 | circadian rhythm(GO:0007623) |
| 0.0 | 0.6 | GO:0000028 | ribosomal small subunit assembly(GO:0000028) |
| 0.0 | 0.2 | GO:0072321 | chaperone-mediated protein transport(GO:0072321) |
| 0.0 | 2.0 | GO:0038128 | ERBB2 signaling pathway(GO:0038128) |
| 0.0 | 0.0 | GO:0045210 | FasL biosynthetic process(GO:0045210) |
| 0.0 | 1.2 | GO:0042776 | mitochondrial ATP synthesis coupled proton transport(GO:0042776) |
| 0.0 | 0.2 | GO:0032324 | Mo-molybdopterin cofactor biosynthetic process(GO:0006777) Mo-molybdopterin cofactor metabolic process(GO:0019720) molybdopterin cofactor biosynthetic process(GO:0032324) molybdopterin cofactor metabolic process(GO:0043545) prosthetic group metabolic process(GO:0051189) |
| 0.0 | 0.1 | GO:0043117 | positive regulation of vascular permeability(GO:0043117) |
| 0.0 | 0.1 | GO:0019859 | pyrimidine nucleobase catabolic process(GO:0006208) thymine catabolic process(GO:0006210) thymine metabolic process(GO:0019859) |
| 0.0 | 0.4 | GO:0000050 | urea cycle(GO:0000050) |
| 0.0 | 0.1 | GO:0009120 | deoxyribonucleoside metabolic process(GO:0009120) |
| 0.0 | 0.3 | GO:0048384 | retinoic acid receptor signaling pathway(GO:0048384) |
| 0.0 | 0.1 | GO:0032780 | negative regulation of ATPase activity(GO:0032780) |
| 0.0 | 0.4 | GO:0000183 | chromatin silencing at rDNA(GO:0000183) |
| 0.0 | 0.0 | GO:0010044 | response to aluminum ion(GO:0010044) |
| 0.0 | 0.1 | GO:0090118 | receptor-mediated endocytosis of low-density lipoprotein particle involved in cholesterol transport(GO:0090118) |
| 0.0 | 0.0 | GO:0000098 | sulfur amino acid catabolic process(GO:0000098) |
| 0.0 | 0.4 | GO:0034497 | protein localization to pre-autophagosomal structure(GO:0034497) |
| 0.0 | 1.9 | GO:0035914 | skeletal muscle cell differentiation(GO:0035914) |
| 0.0 | 0.3 | GO:0048149 | behavioral response to ethanol(GO:0048149) |
| 0.0 | 0.3 | GO:0035456 | response to interferon-beta(GO:0035456) |
| 0.0 | 0.4 | GO:0018026 | peptidyl-lysine monomethylation(GO:0018026) |
| 0.0 | 0.1 | GO:2000825 | positive regulation of androgen receptor activity(GO:2000825) |
| 0.0 | 0.0 | GO:0019249 | lactate biosynthetic process(GO:0019249) |
| 0.0 | 0.2 | GO:0051697 | protein delipidation(GO:0051697) |
| 0.0 | 0.5 | GO:0070314 | G1 to G0 transition(GO:0070314) |
| 0.0 | 0.0 | GO:0010986 | positive regulation of lipoprotein particle clearance(GO:0010986) |
| 0.0 | 0.1 | GO:0015803 | branched-chain amino acid transport(GO:0015803) leucine transport(GO:0015820) |
| 0.0 | 0.1 | GO:0052805 | histidine catabolic process(GO:0006548) imidazole-containing compound catabolic process(GO:0052805) |
| 0.0 | 0.1 | GO:2000824 | negative regulation of androgen receptor activity(GO:2000824) |
| 0.0 | 0.1 | GO:0019242 | methylglyoxal biosynthetic process(GO:0019242) |
| 0.0 | 0.1 | GO:0055064 | chloride ion homeostasis(GO:0055064) |
| 0.0 | 0.4 | GO:0060603 | mammary gland duct morphogenesis(GO:0060603) |
| 0.0 | 0.1 | GO:0051561 | positive regulation of mitochondrial calcium ion concentration(GO:0051561) |
| 0.0 | 0.1 | GO:0021691 | cerebellar Purkinje cell layer maturation(GO:0021691) |
| 0.0 | 0.4 | GO:0051715 | cytolysis in other organism(GO:0051715) |
| 0.0 | 0.5 | GO:0061377 | mammary gland alveolus development(GO:0060749) mammary gland lobule development(GO:0061377) |
| 0.0 | 0.5 | GO:0051438 | regulation of ubiquitin-protein transferase activity(GO:0051438) |
| 0.0 | 0.1 | GO:0051964 | negative regulation of synapse assembly(GO:0051964) |
| 0.0 | 0.2 | GO:0016553 | base conversion or substitution editing(GO:0016553) |
| 0.0 | 0.1 | GO:0010692 | regulation of alkaline phosphatase activity(GO:0010692) positive regulation of alkaline phosphatase activity(GO:0010694) |
| 0.0 | 0.0 | GO:0098535 | de novo centriole assembly(GO:0098535) |
| 0.0 | 0.1 | GO:0006421 | asparaginyl-tRNA aminoacylation(GO:0006421) |
| 0.0 | 0.0 | GO:0032289 | central nervous system myelin formation(GO:0032289) |
| 0.0 | 0.1 | GO:0042982 | amyloid precursor protein metabolic process(GO:0042982) |
| 0.0 | 0.1 | GO:0002862 | negative regulation of inflammatory response to antigenic stimulus(GO:0002862) |
| 0.0 | 0.0 | GO:0060684 | epithelial-mesenchymal cell signaling(GO:0060684) |
| 0.0 | 0.1 | GO:0006864 | pyrimidine nucleotide transport(GO:0006864) mitochondrial pyrimidine nucleotide import(GO:1990519) |
| 0.0 | 0.0 | GO:1903659 | complement-dependent cytotoxicity(GO:0097278) regulation of complement-dependent cytotoxicity(GO:1903659) |
| 0.0 | 0.1 | GO:0019482 | beta-alanine metabolic process(GO:0019482) |
| 0.0 | 0.0 | GO:0034447 | very-low-density lipoprotein particle clearance(GO:0034447) |
| 0.0 | 0.0 | GO:2000196 | positive regulation of female gonad development(GO:2000196) |
| 0.0 | 0.6 | GO:0007191 | adenylate cyclase-activating dopamine receptor signaling pathway(GO:0007191) |
| 0.0 | 0.1 | GO:2000195 | negative regulation of female gonad development(GO:2000195) |
| 0.0 | 0.6 | GO:0002385 | mucosal immune response(GO:0002385) |
| 0.0 | 0.1 | GO:0042271 | susceptibility to natural killer cell mediated cytotoxicity(GO:0042271) |
| 0.0 | 0.6 | GO:0016578 | histone deubiquitination(GO:0016578) |
| 0.0 | 0.3 | GO:0051457 | maintenance of protein location in nucleus(GO:0051457) |
| 0.0 | 0.4 | GO:1904776 | regulation of protein localization to cell cortex(GO:1904776) positive regulation of protein localization to cell cortex(GO:1904778) |
| 0.0 | 0.2 | GO:0098814 | spontaneous neurotransmitter secretion(GO:0061669) spontaneous synaptic transmission(GO:0098814) |
| 0.0 | 0.4 | GO:0035855 | megakaryocyte development(GO:0035855) |
| 0.0 | 0.1 | GO:0060481 | lobar bronchus epithelium development(GO:0060481) |
| 0.0 | 0.1 | GO:0072093 | ureteric bud invasion(GO:0072092) metanephric renal vesicle formation(GO:0072093) |
| 0.0 | 0.1 | GO:0071422 | succinate transport(GO:0015744) succinate transmembrane transport(GO:0071422) |
| 0.0 | 0.8 | GO:0034314 | Arp2/3 complex-mediated actin nucleation(GO:0034314) |
| 0.0 | 0.1 | GO:0061589 | calcium activated phospholipid scrambling(GO:0061588) calcium activated phosphatidylserine scrambling(GO:0061589) calcium activated phosphatidylcholine scrambling(GO:0061590) calcium activated galactosylceramide scrambling(GO:0061591) |
| 0.0 | 0.8 | GO:0016254 | preassembly of GPI anchor in ER membrane(GO:0016254) |
| 0.0 | 0.1 | GO:1901898 | negative regulation of relaxation of cardiac muscle(GO:1901898) |
| 0.0 | 0.3 | GO:0006782 | protoporphyrinogen IX biosynthetic process(GO:0006782) |
| 0.0 | 0.2 | GO:0070508 | sterol import(GO:0035376) cholesterol import(GO:0070508) |
| 0.0 | 0.2 | GO:0010724 | regulation of definitive erythrocyte differentiation(GO:0010724) |
| 0.0 | 0.0 | GO:0071557 | histone H3-K27 demethylation(GO:0071557) |
| 0.0 | 1.4 | GO:0035690 | cellular response to drug(GO:0035690) |
| 0.0 | 0.1 | GO:0045163 | clustering of voltage-gated potassium channels(GO:0045163) |
| 0.0 | 0.1 | GO:0045651 | positive regulation of macrophage differentiation(GO:0045651) |
| 0.0 | 0.3 | GO:0007000 | nucleolus organization(GO:0007000) |
| 0.0 | 0.3 | GO:0021527 | spinal cord association neuron differentiation(GO:0021527) |
| 0.0 | 0.3 | GO:0032331 | negative regulation of chondrocyte differentiation(GO:0032331) |
| 0.0 | 0.1 | GO:0071494 | cellular response to UV-C(GO:0071494) |
| 0.0 | 0.4 | GO:1903432 | regulation of TORC1 signaling(GO:1903432) |
| 0.0 | 4.1 | GO:0006614 | SRP-dependent cotranslational protein targeting to membrane(GO:0006614) |
| 0.0 | 0.2 | GO:0071468 | cellular response to acidic pH(GO:0071468) |
| 0.0 | 0.0 | GO:1904378 | maintenance of unfolded protein(GO:0036506) maintenance of unfolded protein involved in ERAD pathway(GO:1904378) |
| 0.0 | 0.2 | GO:1903608 | protein localization to cytoplasmic stress granule(GO:1903608) |
| 0.0 | 0.1 | GO:0019230 | proprioception(GO:0019230) |
| 0.0 | 0.1 | GO:1900226 | negative regulation of NLRP3 inflammasome complex assembly(GO:1900226) |
| 0.0 | 0.1 | GO:0014912 | negative regulation of smooth muscle cell migration(GO:0014912) |
| 0.0 | 0.1 | GO:2000439 | positive regulation of monocyte extravasation(GO:2000439) |
| 0.0 | 0.1 | GO:1902108 | regulation of mitochondrial membrane permeability involved in apoptotic process(GO:1902108) |
| 0.0 | 1.9 | GO:0010923 | negative regulation of phosphatase activity(GO:0010923) |
| 0.0 | 0.3 | GO:2000772 | regulation of cellular senescence(GO:2000772) |
| 0.0 | 0.1 | GO:0009629 | response to gravity(GO:0009629) |
| 0.0 | 0.0 | GO:0051415 | interphase microtubule nucleation by interphase microtubule organizing center(GO:0051415) microtubule nucleation by microtubule organizing center(GO:0051418) |
| 0.0 | 0.0 | GO:1990481 | mRNA pseudouridine synthesis(GO:1990481) |
| 0.0 | 0.1 | GO:0006287 | base-excision repair, gap-filling(GO:0006287) |
| 0.0 | 1.2 | GO:0033119 | negative regulation of RNA splicing(GO:0033119) |
| 0.0 | 0.2 | GO:0016560 | protein import into peroxisome matrix, docking(GO:0016560) |
| 0.0 | 0.2 | GO:0070475 | rRNA base methylation(GO:0070475) |
| 0.0 | 0.2 | GO:0060242 | contact inhibition(GO:0060242) |
| 0.0 | 0.2 | GO:0045950 | negative regulation of mitotic recombination(GO:0045950) |
| 0.0 | 0.1 | GO:0090071 | negative regulation of ribosome biogenesis(GO:0090071) |
| 0.0 | 0.2 | GO:0007021 | tubulin complex assembly(GO:0007021) |
| 0.0 | 0.1 | GO:0006669 | sphinganine-1-phosphate biosynthetic process(GO:0006669) |
| 0.0 | 0.1 | GO:1901162 | primary amino compound biosynthetic process(GO:1901162) |
| 0.0 | 0.0 | GO:0017158 | regulation of calcium ion-dependent exocytosis(GO:0017158) |
| 0.0 | 0.2 | GO:0030174 | regulation of DNA-dependent DNA replication initiation(GO:0030174) |
| 0.0 | 0.1 | GO:0016246 | RNA interference(GO:0016246) |
| 0.0 | 0.3 | GO:0030878 | thyroid gland development(GO:0030878) |
| 0.0 | 0.3 | GO:2000146 | negative regulation of cell motility(GO:2000146) |
| 0.0 | 0.3 | GO:0032480 | negative regulation of type I interferon production(GO:0032480) |
| 0.0 | 0.1 | GO:0006104 | succinyl-CoA metabolic process(GO:0006104) |
| 0.0 | 0.1 | GO:0043461 | proton-transporting ATP synthase complex assembly(GO:0043461) proton-transporting ATP synthase complex biogenesis(GO:0070272) |
| 0.0 | 0.5 | GO:0048934 | peripheral nervous system neuron differentiation(GO:0048934) peripheral nervous system neuron development(GO:0048935) |
| 0.0 | 0.2 | GO:0015742 | alpha-ketoglutarate transport(GO:0015742) |
| 0.0 | 0.3 | GO:0006206 | pyrimidine nucleobase metabolic process(GO:0006206) |
| 0.0 | 0.2 | GO:0006105 | succinate metabolic process(GO:0006105) |
| 0.0 | 0.2 | GO:1900121 | negative regulation of receptor binding(GO:1900121) |
| 0.0 | 0.0 | GO:1901660 | calcium ion export(GO:1901660) calcium ion export from cell(GO:1990034) |
| 0.0 | 0.2 | GO:0035162 | embryonic hemopoiesis(GO:0035162) |
| 0.0 | 0.3 | GO:0035493 | SNARE complex assembly(GO:0035493) |
| 0.0 | 0.2 | GO:1903265 | positive regulation of tumor necrosis factor-mediated signaling pathway(GO:1903265) |
| 0.0 | 0.2 | GO:0052565 | response to defense-related nitric oxide production by other organism involved in symbiotic interaction(GO:0052551) response to defense-related host nitric oxide production(GO:0052565) |
| 0.0 | 0.1 | GO:1901160 | primary amino compound metabolic process(GO:1901160) |
| 0.0 | 0.2 | GO:1902686 | positive regulation of mitochondrial membrane permeability involved in apoptotic process(GO:1902110) mitochondrial outer membrane permeabilization involved in programmed cell death(GO:1902686) |
| 0.0 | 0.1 | GO:0030220 | platelet formation(GO:0030220) |
| 0.0 | 0.1 | GO:0016598 | protein arginylation(GO:0016598) |
| 0.0 | 0.1 | GO:2000503 | positive regulation of natural killer cell chemotaxis(GO:2000503) |
| 0.0 | 0.1 | GO:0008211 | glucocorticoid biosynthetic process(GO:0006704) glucocorticoid metabolic process(GO:0008211) |
| 0.0 | 0.5 | GO:0036075 | endochondral ossification(GO:0001958) replacement ossification(GO:0036075) |
| 0.0 | 0.4 | GO:0052695 | cellular glucuronidation(GO:0052695) |
| 0.0 | 0.4 | GO:0006974 | cellular response to DNA damage stimulus(GO:0006974) |
| 0.0 | 0.6 | GO:0032981 | NADH dehydrogenase complex assembly(GO:0010257) mitochondrial respiratory chain complex I assembly(GO:0032981) mitochondrial respiratory chain complex I biogenesis(GO:0097031) |
| 0.0 | 0.1 | GO:0046039 | GTP metabolic process(GO:0046039) |
| 0.0 | 0.1 | GO:0070124 | mitochondrial translational initiation(GO:0070124) |
| 0.0 | 0.1 | GO:0050773 | regulation of dendrite development(GO:0050773) |
| 0.0 | 0.4 | GO:0043574 | peroxisomal transport(GO:0043574) |
| 0.0 | 0.2 | GO:1900004 | negative regulation of serine-type endopeptidase activity(GO:1900004) negative regulation of serine-type peptidase activity(GO:1902572) |
| 0.0 | 0.2 | GO:0050961 | detection of temperature stimulus involved in sensory perception(GO:0050961) detection of temperature stimulus involved in sensory perception of pain(GO:0050965) |
| 0.0 | 0.1 | GO:0038170 | somatostatin receptor signaling pathway(GO:0038169) somatostatin signaling pathway(GO:0038170) |
| 0.0 | 0.2 | GO:0007217 | tachykinin receptor signaling pathway(GO:0007217) |
| 0.0 | 0.2 | GO:1903025 | regulation of RNA polymerase II regulatory region sequence-specific DNA binding(GO:1903025) |
| 0.0 | 0.0 | GO:2001252 | positive regulation of chromosome organization(GO:2001252) |
| 0.0 | 0.2 | GO:0044743 | intracellular protein transmembrane import(GO:0044743) |
| 0.0 | 0.2 | GO:0090385 | phagosome-lysosome fusion(GO:0090385) |
| 0.0 | 0.0 | GO:0030185 | nitric oxide transport(GO:0030185) |
| 0.0 | 0.1 | GO:2000270 | negative regulation of fibroblast apoptotic process(GO:2000270) |
| 0.0 | 0.0 | GO:0045348 | positive regulation of MHC class II biosynthetic process(GO:0045348) |
| 0.0 | 0.5 | GO:0006123 | mitochondrial electron transport, cytochrome c to oxygen(GO:0006123) |
| 0.0 | 0.0 | GO:2001032 | regulation of double-strand break repair via nonhomologous end joining(GO:2001032) |
| 0.0 | 0.4 | GO:0042744 | hydrogen peroxide catabolic process(GO:0042744) |
| 0.0 | 0.2 | GO:0001771 | immunological synapse formation(GO:0001771) |
| 0.0 | 0.1 | GO:0000393 | spliceosomal conformational changes to generate catalytic conformation(GO:0000393) |
| 0.0 | 0.2 | GO:0036342 | post-anal tail morphogenesis(GO:0036342) |
| 0.0 | 0.0 | GO:0001656 | metanephros development(GO:0001656) |
| 0.0 | 0.4 | GO:0045008 | depyrimidination(GO:0045008) |
| 0.0 | 0.1 | GO:0000294 | nuclear-transcribed mRNA catabolic process, endonucleolytic cleavage-dependent decay(GO:0000294) |
| 0.0 | 0.0 | GO:0043144 | snoRNA processing(GO:0043144) |
| 0.0 | 0.0 | GO:0036465 | synaptic vesicle recycling(GO:0036465) |
| 0.0 | 0.1 | GO:0006391 | transcription initiation from mitochondrial promoter(GO:0006391) |
| 0.0 | 0.2 | GO:0033141 | positive regulation of peptidyl-serine phosphorylation of STAT protein(GO:0033141) |
| 0.0 | 0.0 | GO:0032661 | regulation of interleukin-18 production(GO:0032661) |
| 0.0 | 0.2 | GO:0048387 | negative regulation of retinoic acid receptor signaling pathway(GO:0048387) |
| 0.0 | 0.0 | GO:0001845 | phagolysosome assembly(GO:0001845) |
| 0.0 | 2.0 | GO:0061418 | regulation of transcription from RNA polymerase II promoter in response to hypoxia(GO:0061418) |
| 0.0 | 0.1 | GO:0071169 | establishment of protein localization to chromatin(GO:0071169) |
| 0.0 | 0.1 | GO:0019520 | aldonic acid metabolic process(GO:0019520) D-gluconate metabolic process(GO:0019521) |
| 0.0 | 1.1 | GO:0008625 | extrinsic apoptotic signaling pathway via death domain receptors(GO:0008625) |
| 0.0 | 0.1 | GO:0030046 | parallel actin filament bundle assembly(GO:0030046) |
| 0.0 | 1.2 | GO:0006904 | vesicle docking involved in exocytosis(GO:0006904) |
| 0.0 | 0.3 | GO:0048007 | antigen processing and presentation of lipid antigen via MHC class Ib(GO:0048003) antigen processing and presentation, exogenous lipid antigen via MHC class Ib(GO:0048007) |
| 0.0 | 0.1 | GO:0032971 | regulation of muscle filament sliding(GO:0032971) |
| 0.0 | 1.4 | GO:0006369 | termination of RNA polymerase II transcription(GO:0006369) |
| 0.0 | 0.1 | GO:0006907 | pinocytosis(GO:0006907) |
| 0.0 | 0.2 | GO:2000766 | negative regulation of cytoplasmic translation(GO:2000766) |
| 0.0 | 0.0 | GO:0044783 | G1 DNA damage checkpoint(GO:0044783) |
| 0.0 | 0.0 | GO:0050927 | positive regulation of positive chemotaxis(GO:0050927) |
| 0.0 | 0.0 | GO:0006370 | 7-methylguanosine mRNA capping(GO:0006370) |
| 0.0 | 0.0 | GO:0098501 | polynucleotide dephosphorylation(GO:0098501) |
| 0.0 | 0.2 | GO:0002755 | MyD88-dependent toll-like receptor signaling pathway(GO:0002755) |
| 0.0 | 0.1 | GO:0019747 | regulation of isoprenoid metabolic process(GO:0019747) |
| 0.0 | 0.0 | GO:0046601 | positive regulation of centriole replication(GO:0046601) |
| 0.0 | 0.2 | GO:0045003 | DNA recombinase assembly(GO:0000730) double-strand break repair via synthesis-dependent strand annealing(GO:0045003) |
| 0.0 | 0.0 | GO:0071569 | protein ufmylation(GO:0071569) protein polyufmylation(GO:1990564) protein K69-linked ufmylation(GO:1990592) |
| 0.0 | 0.1 | GO:0000492 | box C/D snoRNP assembly(GO:0000492) |
| 0.0 | 0.1 | GO:0002230 | positive regulation of defense response to virus by host(GO:0002230) |
| 0.0 | 0.1 | GO:0060392 | negative regulation of SMAD protein import into nucleus(GO:0060392) |
| 0.0 | 1.2 | GO:0009301 | snRNA transcription(GO:0009301) snRNA transcription from RNA polymerase II promoter(GO:0042795) |
| 0.0 | 0.0 | GO:1902908 | regulation of melanosome transport(GO:1902908) |
| 0.0 | 0.0 | GO:1903977 | positive regulation of glial cell migration(GO:1903977) |
| 0.0 | 0.1 | GO:0021678 | third ventricle development(GO:0021678) |
| 0.0 | 0.6 | GO:0008333 | endosome to lysosome transport(GO:0008333) |
| 0.0 | 0.1 | GO:0038165 | oncostatin-M-mediated signaling pathway(GO:0038165) |
| 0.0 | 0.2 | GO:0046604 | positive regulation of mitotic centrosome separation(GO:0046604) |
| 0.0 | 0.1 | GO:1901318 | negative regulation of sperm motility(GO:1901318) |
| 0.0 | 0.1 | GO:0032383 | regulation of intracellular lipid transport(GO:0032377) regulation of intracellular sterol transport(GO:0032380) regulation of intracellular cholesterol transport(GO:0032383) |
| 0.0 | 0.0 | GO:0031054 | pre-miRNA processing(GO:0031054) |
| 0.0 | 0.2 | GO:0098703 | calcium ion import across plasma membrane(GO:0098703) calcium ion import into cell(GO:1990035) |
| 0.0 | 0.3 | GO:1901072 | glucosamine-containing compound catabolic process(GO:1901072) |
| 0.0 | 0.0 | GO:0032639 | TRAIL production(GO:0032639) regulation of TRAIL production(GO:0032679) positive regulation of TRAIL production(GO:0032759) |
| 0.0 | 0.1 | GO:0046005 | positive regulation of circadian sleep/wake cycle, wakefulness(GO:0010841) positive regulation of circadian sleep/wake cycle, REM sleep(GO:0046005) |
| 0.0 | 0.1 | GO:0033135 | regulation of peptidyl-serine phosphorylation(GO:0033135) |
| 0.0 | 0.0 | GO:2000980 | regulation of auditory receptor cell differentiation(GO:0045607) regulation of mechanoreceptor differentiation(GO:0045631) regulation of inner ear receptor cell differentiation(GO:2000980) |
| 0.0 | 1.0 | GO:0070936 | protein K48-linked ubiquitination(GO:0070936) |
| 0.0 | 0.1 | GO:0048702 | embryonic neurocranium morphogenesis(GO:0048702) |
| 0.0 | 0.1 | GO:0032725 | positive regulation of granulocyte macrophage colony-stimulating factor production(GO:0032725) |
| 0.0 | 0.1 | GO:0035411 | catenin import into nucleus(GO:0035411) |
| 0.0 | 0.1 | GO:0071985 | multivesicular body sorting pathway(GO:0071985) |
| 0.0 | 0.2 | GO:0032202 | telomere assembly(GO:0032202) |
| 0.0 | 0.0 | GO:0042270 | protection from natural killer cell mediated cytotoxicity(GO:0042270) |
| 0.0 | 0.0 | GO:0045763 | negative regulation of cellular amino acid metabolic process(GO:0045763) |
| 0.0 | 0.2 | GO:0031295 | T cell costimulation(GO:0031295) |
| 0.0 | 0.3 | GO:0007213 | G-protein coupled acetylcholine receptor signaling pathway(GO:0007213) |
| 0.0 | 0.9 | GO:0048791 | calcium ion-regulated exocytosis of neurotransmitter(GO:0048791) |
| 0.0 | 0.1 | GO:0031584 | activation of phospholipase D activity(GO:0031584) |
| 0.0 | 0.2 | GO:0034975 | protein folding in endoplasmic reticulum(GO:0034975) |
| 0.0 | 0.4 | GO:0030011 | maintenance of cell polarity(GO:0030011) |
| 0.0 | 0.2 | GO:0071474 | cellular hyperosmotic response(GO:0071474) |
| 0.0 | 2.3 | GO:2001235 | positive regulation of apoptotic signaling pathway(GO:2001235) |
| 0.0 | 0.1 | GO:0010310 | regulation of hydrogen peroxide metabolic process(GO:0010310) |
| 0.0 | 0.2 | GO:0045732 | positive regulation of protein catabolic process(GO:0045732) |
| 0.0 | 0.1 | GO:0090131 | mesenchyme migration(GO:0090131) |
| 0.0 | 0.3 | GO:0071539 | protein localization to centrosome(GO:0071539) |
| 0.0 | 0.0 | GO:0009804 | coumarin metabolic process(GO:0009804) |
| 0.0 | 0.3 | GO:0032469 | endoplasmic reticulum calcium ion homeostasis(GO:0032469) |
| 0.0 | 0.0 | GO:0001992 | regulation of systemic arterial blood pressure by vasopressin(GO:0001992) |
| 0.0 | 0.7 | GO:0071349 | interleukin-12-mediated signaling pathway(GO:0035722) cellular response to interleukin-12(GO:0071349) |
| 0.0 | 0.1 | GO:1990403 | embryonic brain development(GO:1990403) |
| 0.0 | 0.1 | GO:1901994 | meiotic cell cycle phase transition(GO:0044771) regulation of meiotic cell cycle phase transition(GO:1901993) negative regulation of meiotic cell cycle phase transition(GO:1901994) |
| 0.0 | 0.0 | GO:0035879 | plasma membrane lactate transport(GO:0035879) |
| 0.0 | 0.1 | GO:0019081 | viral translation(GO:0019081) |
| 0.0 | 0.4 | GO:0006012 | galactose metabolic process(GO:0006012) |
| 0.0 | 0.1 | GO:2000504 | positive regulation of blood vessel remodeling(GO:2000504) |
| 0.0 | 0.5 | GO:0007141 | male meiosis I(GO:0007141) |
| 0.0 | 0.2 | GO:0030647 | polyketide metabolic process(GO:0030638) aminoglycoside antibiotic metabolic process(GO:0030647) daunorubicin metabolic process(GO:0044597) doxorubicin metabolic process(GO:0044598) |
| 0.0 | 0.2 | GO:0006415 | translational termination(GO:0006415) |
| 0.0 | 0.2 | GO:0006776 | vitamin A metabolic process(GO:0006776) |
| 0.0 | 0.0 | GO:0007341 | penetration of zona pellucida(GO:0007341) |
| 0.0 | 0.1 | GO:0090314 | positive regulation of protein targeting to membrane(GO:0090314) |
| 0.0 | 0.8 | GO:0006584 | catecholamine metabolic process(GO:0006584) catechol-containing compound metabolic process(GO:0009712) |
| 0.0 | 0.1 | GO:0002441 | histamine production involved in inflammatory response(GO:0002349) histamine secretion involved in inflammatory response(GO:0002441) histamine secretion by mast cell(GO:0002553) |
| 0.0 | 0.1 | GO:1904062 | regulation of cation transmembrane transport(GO:1904062) |
| 0.0 | 0.1 | GO:0002070 | epithelial cell maturation(GO:0002070) |
| 0.0 | 0.1 | GO:0000389 | mRNA 3'-splice site recognition(GO:0000389) |
| 0.0 | 0.2 | GO:0070664 | negative regulation of leukocyte proliferation(GO:0070664) |
| 0.0 | 0.6 | GO:1900181 | negative regulation of protein localization to nucleus(GO:1900181) |
| 0.0 | 0.1 | GO:0000380 | alternative mRNA splicing, via spliceosome(GO:0000380) |
| 0.0 | 0.0 | GO:0097028 | dendritic cell differentiation(GO:0097028) |
| 0.0 | 0.0 | GO:0097029 | mature conventional dendritic cell differentiation(GO:0097029) |
| 0.0 | 0.0 | GO:0071158 | positive regulation of cell cycle arrest(GO:0071158) |
| 0.0 | 0.2 | GO:0031167 | rRNA methylation(GO:0031167) |
| 0.0 | 0.1 | GO:0007198 | adenylate cyclase-inhibiting serotonin receptor signaling pathway(GO:0007198) |
| 0.0 | 0.0 | GO:0031508 | pericentric heterochromatin assembly(GO:0031508) |
| 0.0 | 0.2 | GO:0042407 | cristae formation(GO:0042407) |
| 0.0 | 0.0 | GO:1902510 | regulation of apoptotic DNA fragmentation(GO:1902510) |
| 0.0 | 0.1 | GO:0033143 | regulation of intracellular steroid hormone receptor signaling pathway(GO:0033143) |
| 0.0 | 0.0 | GO:0019321 | pentose metabolic process(GO:0019321) |
| 0.0 | 0.0 | GO:0042701 | progesterone secretion(GO:0042701) regulation of progesterone secretion(GO:2000870) |
| 0.0 | 0.1 | GO:0065002 | intracellular protein transmembrane transport(GO:0065002) |
| 0.0 | 0.0 | GO:0051792 | medium-chain fatty acid biosynthetic process(GO:0051792) |
| 0.0 | 0.1 | GO:0032446 | protein modification by small protein conjugation(GO:0032446) |
| 0.0 | 0.1 | GO:0032211 | negative regulation of telomere maintenance via telomerase(GO:0032211) |
| 0.0 | 0.1 | GO:0043105 | regulation of GTP cyclohydrolase I activity(GO:0043095) negative regulation of GTP cyclohydrolase I activity(GO:0043105) |
| 0.0 | 0.5 | GO:0050830 | defense response to Gram-positive bacterium(GO:0050830) |
| 0.0 | 0.4 | GO:0051602 | response to electrical stimulus(GO:0051602) |
| 0.0 | 0.0 | GO:0006975 | DNA damage induced protein phosphorylation(GO:0006975) |
| 0.0 | 0.1 | GO:0042758 | long-chain fatty acid catabolic process(GO:0042758) |
| 0.0 | 0.3 | GO:0071554 | cell wall macromolecule metabolic process(GO:0044036) cell wall organization or biogenesis(GO:0071554) |
| 0.0 | 0.0 | GO:0042737 | drug catabolic process(GO:0042737) |
| 0.0 | 0.1 | GO:0010265 | SCF complex assembly(GO:0010265) |
| 0.0 | 0.3 | GO:0007638 | mechanosensory behavior(GO:0007638) |
| 0.0 | 0.1 | GO:0043586 | tongue development(GO:0043586) |
| 0.0 | 0.1 | GO:0060294 | cilium movement involved in cell motility(GO:0060294) |
| 0.0 | 0.1 | GO:0048696 | collateral sprouting in absence of injury(GO:0048669) regulation of collateral sprouting in absence of injury(GO:0048696) negative regulation of collateral sprouting in absence of injury(GO:0048698) |
| 0.0 | 0.2 | GO:0002430 | complement receptor mediated signaling pathway(GO:0002430) |
| 0.0 | 0.1 | GO:0032700 | negative regulation of interleukin-17 production(GO:0032700) |
| 0.0 | 0.5 | GO:0060395 | SMAD protein signal transduction(GO:0060395) |
| 0.0 | 0.2 | GO:0006362 | transcription elongation from RNA polymerase I promoter(GO:0006362) |
| 0.0 | 0.2 | GO:0016574 | histone ubiquitination(GO:0016574) |
| 0.0 | 0.0 | GO:0042984 | amyloid precursor protein biosynthetic process(GO:0042983) regulation of amyloid precursor protein biosynthetic process(GO:0042984) |
| 0.0 | 0.1 | GO:0009404 | toxin metabolic process(GO:0009404) |
| 0.0 | 0.1 | GO:0035608 | protein deglutamylation(GO:0035608) |
| 0.0 | 0.1 | GO:0070127 | tRNA aminoacylation for mitochondrial protein translation(GO:0070127) |
| 0.0 | 0.1 | GO:0061635 | regulation of protein complex stability(GO:0061635) |
| 0.0 | 0.1 | GO:0007595 | lactation(GO:0007595) |
| 0.0 | 0.1 | GO:0098787 | mRNA cleavage involved in mRNA processing(GO:0098787) |
| 0.0 | 0.1 | GO:0046827 | positive regulation of protein export from nucleus(GO:0046827) |
| 0.0 | 0.0 | GO:0043970 | histone H3-K9 acetylation(GO:0043970) |
| 0.0 | 0.0 | GO:0010193 | response to ozone(GO:0010193) |
| 0.0 | 0.1 | GO:0043217 | myelin maintenance(GO:0043217) |
| 0.0 | 0.1 | GO:1903803 | glutamine secretion(GO:0010585) L-glutamine import(GO:0036229) L-glutamine import into cell(GO:1903803) |
| 0.0 | 0.0 | GO:0014850 | response to muscle activity(GO:0014850) |
| 0.0 | 0.2 | GO:0090307 | mitotic spindle assembly(GO:0090307) |
| 0.0 | 0.1 | GO:0097338 | response to clozapine(GO:0097338) |
| 0.0 | 0.1 | GO:0019240 | citrulline biosynthetic process(GO:0019240) |
| 0.0 | 0.1 | GO:0042364 | water-soluble vitamin biosynthetic process(GO:0042364) |
| 0.0 | 0.0 | GO:0048066 | developmental pigmentation(GO:0048066) |
| 0.0 | 0.1 | GO:0030032 | lamellipodium assembly(GO:0030032) |
| 0.0 | 0.2 | GO:0021904 | dorsal/ventral neural tube patterning(GO:0021904) |
| 0.0 | 0.0 | GO:1990523 | bone regeneration(GO:1990523) |
| 0.0 | 0.2 | GO:0046513 | ceramide biosynthetic process(GO:0046513) |
| 0.0 | 0.0 | GO:0046586 | regulation of calcium-dependent cell-cell adhesion(GO:0046586) |
| 0.0 | 0.0 | GO:0046548 | retinal rod cell development(GO:0046548) |
| 0.0 | 0.0 | GO:0018394 | peptidyl-lysine acetylation(GO:0018394) |
| 0.0 | 0.0 | GO:0060323 | head morphogenesis(GO:0060323) |
| 0.0 | 0.2 | GO:2000171 | negative regulation of dendrite development(GO:2000171) |
| 0.0 | 0.5 | GO:0032456 | endocytic recycling(GO:0032456) |
| 0.0 | 0.0 | GO:0043517 | positive regulation of DNA damage response, signal transduction by p53 class mediator(GO:0043517) |
| 0.0 | 0.0 | GO:1904469 | positive regulation of tumor necrosis factor secretion(GO:1904469) |
| 0.0 | 0.1 | GO:0007340 | acrosome reaction(GO:0007340) |
| 0.0 | 0.1 | GO:0045776 | negative regulation of blood pressure(GO:0045776) |
| 0.0 | 0.0 | GO:0044376 | RNA polymerase II complex import to nucleus(GO:0044376) RNA polymerase III complex localization to nucleus(GO:1990022) |
| 0.0 | 0.9 | GO:0030049 | muscle filament sliding(GO:0030049) actin-myosin filament sliding(GO:0033275) |
| 0.0 | 0.3 | GO:1901385 | regulation of voltage-gated calcium channel activity(GO:1901385) |
| 0.0 | 0.1 | GO:0038061 | NIK/NF-kappaB signaling(GO:0038061) |
| 0.0 | 0.0 | GO:0045953 | negative regulation of natural killer cell mediated cytotoxicity(GO:0045953) |
| 0.0 | 2.2 | GO:0042787 | protein ubiquitination involved in ubiquitin-dependent protein catabolic process(GO:0042787) |
| 0.0 | 0.6 | GO:0042771 | intrinsic apoptotic signaling pathway in response to DNA damage by p53 class mediator(GO:0042771) |
| 0.0 | 0.2 | GO:0019373 | epoxygenase P450 pathway(GO:0019373) |
| 0.0 | 1.1 | GO:0031338 | regulation of vesicle fusion(GO:0031338) |
| 0.0 | 0.1 | GO:2000344 | positive regulation of acrosome reaction(GO:2000344) |
| 0.0 | 0.3 | GO:0006198 | cAMP catabolic process(GO:0006198) |
| 0.0 | 0.2 | GO:0031146 | SCF-dependent proteasomal ubiquitin-dependent protein catabolic process(GO:0031146) |
| 0.0 | 0.1 | GO:0002347 | response to tumor cell(GO:0002347) |
| 0.0 | 0.1 | GO:0009201 | ribonucleoside triphosphate biosynthetic process(GO:0009201) |
| 0.0 | 0.1 | GO:0045654 | positive regulation of megakaryocyte differentiation(GO:0045654) |
| 0.0 | 0.1 | GO:0032490 | detection of molecule of bacterial origin(GO:0032490) |
| 0.0 | 0.1 | GO:0019375 | galactosylceramide biosynthetic process(GO:0006682) galactolipid biosynthetic process(GO:0019375) |
| 0.0 | 1.5 | GO:0043484 | regulation of RNA splicing(GO:0043484) |
| 0.0 | 0.0 | GO:0034145 | positive regulation of toll-like receptor 4 signaling pathway(GO:0034145) |
| 0.0 | 0.1 | GO:0002523 | leukocyte migration involved in inflammatory response(GO:0002523) |
| 0.0 | 0.0 | GO:0003094 | glomerular filtration(GO:0003094) |
| 0.0 | 0.1 | GO:0030263 | apoptotic chromosome condensation(GO:0030263) |
| 0.0 | 0.0 | GO:0019064 | fusion of virus membrane with host plasma membrane(GO:0019064) membrane fusion involved in viral entry into host cell(GO:0039663) multi-organism membrane fusion(GO:0044800) |
| 0.0 | 0.1 | GO:0002778 | antimicrobial peptide production(GO:0002775) antibacterial peptide production(GO:0002778) |
| 0.0 | 0.1 | GO:0030511 | positive regulation of transforming growth factor beta receptor signaling pathway(GO:0030511) positive regulation of cellular response to transforming growth factor beta stimulus(GO:1903846) |
| 0.0 | 0.2 | GO:0048706 | embryonic skeletal system development(GO:0048706) |
| 0.0 | 0.0 | GO:1900738 | positive regulation of phospholipase C-activating G-protein coupled receptor signaling pathway(GO:1900738) |
| 0.0 | 0.1 | GO:0090280 | positive regulation of calcium ion import(GO:0090280) |
| 0.0 | 0.0 | GO:0071806 | protein transmembrane transport(GO:0071806) |
| 0.0 | 0.0 | GO:0051140 | regulation of NK T cell proliferation(GO:0051140) positive regulation of NK T cell proliferation(GO:0051142) |
| 0.0 | 0.0 | GO:0042274 | ribosomal small subunit biogenesis(GO:0042274) |
| 0.0 | 0.0 | GO:1904861 | excitatory synapse assembly(GO:1904861) |
| 0.0 | 0.1 | GO:0050712 | negative regulation of interleukin-1 alpha production(GO:0032690) negative regulation of interleukin-1 alpha secretion(GO:0050712) |
| 0.0 | 0.0 | GO:0022605 | oogenesis stage(GO:0022605) |
| 0.0 | 0.2 | GO:0042481 | regulation of odontogenesis(GO:0042481) |
| 0.0 | 0.1 | GO:0031033 | myosin filament organization(GO:0031033) myosin filament assembly(GO:0031034) striated muscle myosin thick filament assembly(GO:0071688) |
| 0.0 | 0.0 | GO:0035378 | carbon dioxide transmembrane transport(GO:0035378) |
| 0.0 | 0.1 | GO:0006513 | protein monoubiquitination(GO:0006513) |
| 0.0 | 0.0 | GO:0045576 | mast cell activation(GO:0045576) |
| 0.0 | 0.1 | GO:0043649 | dicarboxylic acid catabolic process(GO:0043649) |
| 0.0 | 0.1 | GO:0002181 | cytoplasmic translation(GO:0002181) |
| 0.0 | 0.1 | GO:0048557 | embryonic digestive tract morphogenesis(GO:0048557) |
| 0.0 | 0.1 | GO:0034587 | piRNA metabolic process(GO:0034587) |
| 0.0 | 0.1 | GO:0009068 | aspartate family amino acid catabolic process(GO:0009068) |
| 0.0 | 0.1 | GO:0000715 | nucleotide-excision repair, DNA damage recognition(GO:0000715) |
| 0.0 | 0.0 | GO:0042756 | drinking behavior(GO:0042756) |
| 0.0 | 0.1 | GO:2000304 | positive regulation of sphingolipid biosynthetic process(GO:0090154) positive regulation of ceramide biosynthetic process(GO:2000304) |
| 0.0 | 0.1 | GO:0019236 | response to pheromone(GO:0019236) |
| 0.0 | 0.0 | GO:0009957 | epidermal cell fate specification(GO:0009957) |
| 0.0 | 0.0 | GO:0048087 | positive regulation of developmental pigmentation(GO:0048087) |
| 0.0 | 0.3 | GO:0050873 | brown fat cell differentiation(GO:0050873) |
| 0.0 | 0.0 | GO:0060700 | regulation of endoribonuclease activity(GO:0060699) regulation of ribonuclease activity(GO:0060700) |
| 0.0 | 0.0 | GO:0010825 | positive regulation of centrosome duplication(GO:0010825) |
| 0.0 | 0.0 | GO:0007500 | mesodermal cell fate determination(GO:0007500) regulation of intracellular transport of viral material(GO:1901252) negative regulation of intracellular transport of viral material(GO:1901253) |
| 0.0 | 0.0 | GO:0042350 | GDP-L-fucose biosynthetic process(GO:0042350) |
| 0.0 | 0.1 | GO:0043281 | regulation of cysteine-type endopeptidase activity involved in apoptotic process(GO:0043281) |
| 0.0 | 0.3 | GO:0032784 | regulation of DNA-templated transcription, elongation(GO:0032784) |
| 0.0 | 0.0 | GO:0006627 | protein processing involved in protein targeting to mitochondrion(GO:0006627) |
| 0.0 | 0.0 | GO:0060005 | vestibular reflex(GO:0060005) |
| 0.0 | 0.1 | GO:0071027 | nuclear RNA surveillance(GO:0071027) nuclear mRNA surveillance(GO:0071028) |
| 0.0 | 0.0 | GO:0032291 | central nervous system myelination(GO:0022010) axon ensheathment in central nervous system(GO:0032291) |
| 0.0 | 0.0 | GO:0030860 | regulation of polarized epithelial cell differentiation(GO:0030860) |
| 0.0 | 0.0 | GO:0006353 | DNA-templated transcription, termination(GO:0006353) |
| 0.0 | 0.0 | GO:2001178 | mediator complex assembly(GO:0036034) regulation of mediator complex assembly(GO:2001176) positive regulation of mediator complex assembly(GO:2001178) |
| 0.0 | 0.1 | GO:0051531 | NFAT protein import into nucleus(GO:0051531) |
| 0.0 | 0.1 | GO:0009396 | folic acid-containing compound biosynthetic process(GO:0009396) |
| 0.0 | 0.0 | GO:0006298 | mismatch repair(GO:0006298) |
| 0.0 | 0.1 | GO:0010792 | DNA double-strand break processing involved in repair via single-strand annealing(GO:0010792) double-strand break repair via single-strand annealing(GO:0045002) |
| 0.0 | 0.0 | GO:0060332 | positive regulation of response to interferon-gamma(GO:0060332) positive regulation of interferon-gamma-mediated signaling pathway(GO:0060335) |
| 0.0 | 0.0 | GO:0071918 | urea transmembrane transport(GO:0071918) |
| 0.0 | 0.2 | GO:0031397 | negative regulation of protein ubiquitination(GO:0031397) |
| 0.0 | 0.0 | GO:0044557 | relaxation of smooth muscle(GO:0044557) |
| 0.0 | 0.0 | GO:0032481 | positive regulation of type I interferon production(GO:0032481) |
| 0.0 | 2.1 | GO:0000377 | RNA splicing, via transesterification reactions with bulged adenosine as nucleophile(GO:0000377) mRNA splicing, via spliceosome(GO:0000398) |
| 0.0 | 0.1 | GO:0019731 | antibacterial humoral response(GO:0019731) |
| 0.0 | 0.1 | GO:0021522 | spinal cord motor neuron differentiation(GO:0021522) |
| 0.0 | 0.3 | GO:0008593 | regulation of Notch signaling pathway(GO:0008593) |
| 0.0 | 0.0 | GO:0097026 | dendritic cell dendrite assembly(GO:0097026) |
| 0.0 | 0.2 | GO:0030322 | stabilization of membrane potential(GO:0030322) |
| 0.0 | 0.0 | GO:0045059 | positive thymic T cell selection(GO:0045059) |
| 0.0 | 0.0 | GO:0042092 | type 2 immune response(GO:0042092) |
| 0.0 | 0.0 | GO:0043368 | positive T cell selection(GO:0043368) |
| 0.0 | 0.3 | GO:0031396 | regulation of protein ubiquitination(GO:0031396) |
| 0.0 | 0.1 | GO:0019509 | L-methionine biosynthetic process from methylthioadenosine(GO:0019509) |
| 0.0 | 0.1 | GO:0043537 | negative regulation of blood vessel endothelial cell migration(GO:0043537) |
| 0.0 | 0.0 | GO:0032621 | interleukin-18 production(GO:0032621) |
| 0.0 | 0.0 | GO:0061154 | endothelial tube morphogenesis(GO:0061154) |
| 0.0 | 0.1 | GO:0043031 | negative regulation of macrophage activation(GO:0043031) |
| 0.0 | 0.1 | GO:1900262 | regulation of DNA-directed DNA polymerase activity(GO:1900262) positive regulation of DNA-directed DNA polymerase activity(GO:1900264) |
Gene overrepresentation in cellular_component category:
| Log-likelihood per target | Total log-likelihood | Term | Description |
|---|---|---|---|
| 1.0 | 7.0 | GO:0097209 | epidermal lamellar body(GO:0097209) |
| 0.8 | 20.2 | GO:0005861 | troponin complex(GO:0005861) |
| 0.6 | 1.8 | GO:0032127 | dense core granule membrane(GO:0032127) |
| 0.6 | 1.8 | GO:1990622 | CHOP-ATF3 complex(GO:1990622) |
| 0.5 | 0.5 | GO:0031523 | Myb complex(GO:0031523) |
| 0.5 | 3.9 | GO:0098560 | cytoplasmic side of late endosome membrane(GO:0098560) |
| 0.5 | 2.3 | GO:0097123 | cyclin A1-CDK2 complex(GO:0097123) |
| 0.4 | 0.8 | GO:0005889 | hydrogen:potassium-exchanging ATPase complex(GO:0005889) |
| 0.4 | 0.8 | GO:0014802 | terminal cisterna(GO:0014802) |
| 0.4 | 3.6 | GO:0061689 | tricellular tight junction(GO:0061689) |
| 0.4 | 1.6 | GO:0036338 | viral envelope(GO:0019031) viral membrane(GO:0036338) |
| 0.4 | 1.5 | GO:0071149 | TEAD-2-YAP complex(GO:0071149) |
| 0.4 | 6.0 | GO:0035253 | ciliary rootlet(GO:0035253) |
| 0.4 | 4.8 | GO:0045179 | apical cortex(GO:0045179) |
| 0.4 | 1.1 | GO:0097057 | TRAF2-GSTP1 complex(GO:0097057) |
| 0.4 | 3.9 | GO:0046581 | intercellular canaliculus(GO:0046581) |
| 0.3 | 1.0 | GO:0034676 | integrin alpha6-beta4 complex(GO:0034676) |
| 0.3 | 1.4 | GO:0071595 | Nem1-Spo7 phosphatase complex(GO:0071595) |
| 0.3 | 11.5 | GO:0030057 | desmosome(GO:0030057) |
| 0.3 | 0.3 | GO:0032593 | insulin-responsive compartment(GO:0032593) |
| 0.3 | 1.1 | GO:1990796 | photoreceptor cell terminal bouton(GO:1990796) |
| 0.3 | 1.6 | GO:0097129 | cyclin D2-CDK4 complex(GO:0097129) |
| 0.3 | 1.3 | GO:0030056 | hemidesmosome(GO:0030056) |
| 0.3 | 6.0 | GO:0031932 | TORC2 complex(GO:0031932) |
| 0.3 | 1.0 | GO:0032437 | cuticular plate(GO:0032437) |
| 0.3 | 0.8 | GO:0036398 | TCR signalosome(GO:0036398) |
| 0.2 | 1.7 | GO:0035371 | microtubule plus-end(GO:0035371) |
| 0.2 | 0.2 | GO:0000806 | Y chromosome(GO:0000806) |
| 0.2 | 2.4 | GO:0016013 | syntrophin complex(GO:0016013) |
| 0.2 | 1.0 | GO:1990031 | pinceau fiber(GO:1990031) |
| 0.2 | 1.2 | GO:0001405 | presequence translocase-associated import motor(GO:0001405) |
| 0.2 | 1.0 | GO:0016533 | cyclin-dependent protein kinase 5 holoenzyme complex(GO:0016533) |
| 0.2 | 1.7 | GO:0030121 | AP-1 adaptor complex(GO:0030121) |
| 0.2 | 6.0 | GO:0044295 | axonal growth cone(GO:0044295) |
| 0.2 | 1.4 | GO:0072558 | NLRP1 inflammasome complex(GO:0072558) |
| 0.2 | 1.1 | GO:0034750 | Scrib-APC-beta-catenin complex(GO:0034750) |
| 0.2 | 1.1 | GO:1990597 | AIP1-IRE1 complex(GO:1990597) |
| 0.2 | 0.9 | GO:0008043 | intracellular ferritin complex(GO:0008043) ferritin complex(GO:0070288) |
| 0.2 | 0.6 | GO:0034365 | discoidal high-density lipoprotein particle(GO:0034365) |
| 0.2 | 3.4 | GO:0030877 | beta-catenin destruction complex(GO:0030877) |
| 0.2 | 0.6 | GO:0034657 | GID complex(GO:0034657) |
| 0.2 | 0.8 | GO:0033257 | Bcl3/NF-kappaB2 complex(GO:0033257) |
| 0.2 | 0.2 | GO:0005713 | recombination nodule(GO:0005713) |
| 0.2 | 0.6 | GO:0042720 | mitochondrial inner membrane peptidase complex(GO:0042720) |
| 0.2 | 1.5 | GO:0005610 | laminin-5 complex(GO:0005610) |
| 0.2 | 0.6 | GO:0000126 | transcription factor TFIIIB complex(GO:0000126) |
| 0.2 | 0.7 | GO:0032010 | phagolysosome(GO:0032010) |
| 0.2 | 0.5 | GO:1990716 | axonemal central apparatus(GO:1990716) |
| 0.2 | 4.0 | GO:0014731 | spectrin-associated cytoskeleton(GO:0014731) |
| 0.2 | 2.0 | GO:0042105 | alpha-beta T cell receptor complex(GO:0042105) |
| 0.2 | 1.6 | GO:0044194 | cytolytic granule(GO:0044194) |
| 0.2 | 1.7 | GO:0030015 | CCR4-NOT core complex(GO:0030015) |
| 0.2 | 0.2 | GO:0030123 | AP-3 adaptor complex(GO:0030123) |
| 0.2 | 0.7 | GO:0031510 | SUMO activating enzyme complex(GO:0031510) |
| 0.2 | 3.3 | GO:0005845 | mRNA cap binding complex(GO:0005845) RNA cap binding complex(GO:0034518) |
| 0.2 | 3.3 | GO:0005736 | DNA-directed RNA polymerase I complex(GO:0005736) |
| 0.2 | 1.5 | GO:1990111 | spermatoproteasome complex(GO:1990111) |
| 0.2 | 1.1 | GO:0000408 | EKC/KEOPS complex(GO:0000408) |
| 0.2 | 1.8 | GO:0097197 | tetraspanin-enriched microdomain(GO:0097197) |
| 0.2 | 0.2 | GO:0042587 | glycogen granule(GO:0042587) |
| 0.2 | 0.6 | GO:1990425 | ryanodine receptor complex(GO:1990425) |
| 0.2 | 0.8 | GO:0009368 | endopeptidase Clp complex(GO:0009368) |
| 0.2 | 0.6 | GO:0097196 | Shu complex(GO:0097196) |
| 0.2 | 1.7 | GO:0016602 | CCAAT-binding factor complex(GO:0016602) |
| 0.2 | 0.2 | GO:0043218 | compact myelin(GO:0043218) |
| 0.2 | 1.9 | GO:0033010 | paranodal junction(GO:0033010) |
| 0.2 | 0.8 | GO:0032449 | CBM complex(GO:0032449) |
| 0.2 | 0.8 | GO:0044393 | microspike(GO:0044393) |
| 0.2 | 11.7 | GO:0019005 | SCF ubiquitin ligase complex(GO:0019005) |
| 0.1 | 0.6 | GO:0030936 | collagen type XIII trimer(GO:0005600) transmembrane collagen trimer(GO:0030936) |
| 0.1 | 0.7 | GO:1990246 | uniplex complex(GO:1990246) |
| 0.1 | 1.0 | GO:0070695 | FHF complex(GO:0070695) |
| 0.1 | 2.3 | GO:0000124 | SAGA complex(GO:0000124) |
| 0.1 | 0.4 | GO:0017109 | glutamate-cysteine ligase complex(GO:0017109) |
| 0.1 | 0.7 | GO:0005945 | 6-phosphofructokinase complex(GO:0005945) |
| 0.1 | 0.4 | GO:0070435 | Shc-EGFR complex(GO:0070435) |
| 0.1 | 1.8 | GO:0000506 | glycosylphosphatidylinositol-N-acetylglucosaminyltransferase (GPI-GnT) complex(GO:0000506) |
| 0.1 | 1.5 | GO:0005915 | zonula adherens(GO:0005915) |
| 0.1 | 1.1 | GO:0033256 | I-kappaB/NF-kappaB complex(GO:0033256) |
| 0.1 | 4.3 | GO:0016327 | apicolateral plasma membrane(GO:0016327) |
| 0.1 | 0.3 | GO:0030904 | retromer complex(GO:0030904) |
| 0.1 | 1.0 | GO:0072487 | MSL complex(GO:0072487) |
| 0.1 | 0.4 | GO:0031372 | UBC13-MMS2 complex(GO:0031372) |
| 0.1 | 4.1 | GO:0016581 | NuRD complex(GO:0016581) CHD-type complex(GO:0090545) |
| 0.1 | 0.6 | GO:0005971 | ribonucleoside-diphosphate reductase complex(GO:0005971) |
| 0.1 | 0.6 | GO:0002193 | MAML1-RBP-Jkappa- ICN1 complex(GO:0002193) |
| 0.1 | 0.1 | GO:1990589 | ATF4-CREB1 transcription factor complex(GO:1990589) |
| 0.1 | 0.4 | GO:0005960 | glycine cleavage complex(GO:0005960) |
| 0.1 | 2.5 | GO:0016580 | Sin3 complex(GO:0016580) |
| 0.1 | 0.9 | GO:0005947 | mitochondrial alpha-ketoglutarate dehydrogenase complex(GO:0005947) |
| 0.1 | 0.7 | GO:0070381 | endosome to plasma membrane transport vesicle(GO:0070381) |
| 0.1 | 1.1 | GO:0033269 | internode region of axon(GO:0033269) |
| 0.1 | 0.4 | GO:0097450 | astrocyte end-foot(GO:0097450) |
| 0.1 | 0.7 | GO:0032444 | activin responsive factor complex(GO:0032444) |
| 0.1 | 0.3 | GO:0005953 | CAAX-protein geranylgeranyltransferase complex(GO:0005953) |
| 0.1 | 0.1 | GO:0000176 | nuclear exosome (RNase complex)(GO:0000176) |
| 0.1 | 0.6 | GO:0071797 | LUBAC complex(GO:0071797) |
| 0.1 | 0.6 | GO:1990726 | Lsm1-7-Pat1 complex(GO:1990726) |
| 0.1 | 1.1 | GO:0005853 | eukaryotic translation elongation factor 1 complex(GO:0005853) |
| 0.1 | 0.9 | GO:0031313 | extrinsic component of endosome membrane(GO:0031313) |
| 0.1 | 1.4 | GO:0032426 | stereocilium tip(GO:0032426) |
| 0.1 | 0.3 | GO:0030895 | apolipoprotein B mRNA editing enzyme complex(GO:0030895) |
| 0.1 | 0.4 | GO:1902937 | inward rectifier potassium channel complex(GO:1902937) |
| 0.1 | 0.8 | GO:0005672 | transcription factor TFIIA complex(GO:0005672) |
| 0.1 | 0.5 | GO:0016342 | catenin complex(GO:0016342) |
| 0.1 | 0.5 | GO:0002081 | outer acrosomal membrane(GO:0002081) |
| 0.1 | 0.3 | GO:0097444 | spine apparatus(GO:0097444) |
| 0.1 | 0.4 | GO:0005850 | eukaryotic translation initiation factor 2 complex(GO:0005850) |
| 0.1 | 0.9 | GO:0030314 | junctional membrane complex(GO:0030314) |
| 0.1 | 0.1 | GO:0044455 | mitochondrial membrane part(GO:0044455) |
| 0.1 | 0.5 | GO:0061673 | mitotic spindle astral microtubule(GO:0061673) |
| 0.1 | 3.0 | GO:0031231 | integral component of peroxisomal membrane(GO:0005779) intrinsic component of peroxisomal membrane(GO:0031231) |
| 0.1 | 0.5 | GO:0097422 | tubular endosome(GO:0097422) |
| 0.1 | 1.2 | GO:0005666 | DNA-directed RNA polymerase III complex(GO:0005666) |
| 0.1 | 0.8 | GO:0045240 | dihydrolipoyl dehydrogenase complex(GO:0045240) |
| 0.1 | 4.3 | GO:0030131 | clathrin adaptor complex(GO:0030131) |
| 0.1 | 0.1 | GO:0000939 | condensed chromosome inner kinetochore(GO:0000939) |
| 0.1 | 1.4 | GO:0042588 | zymogen granule(GO:0042588) |
| 0.1 | 1.1 | GO:0097418 | neurofibrillary tangle(GO:0097418) |
| 0.1 | 0.2 | GO:0016529 | sarcoplasmic reticulum(GO:0016529) |
| 0.1 | 0.4 | GO:0071664 | catenin-TCF7L2 complex(GO:0071664) |
| 0.1 | 0.4 | GO:0032798 | Swi5-Sfr1 complex(GO:0032798) |
| 0.1 | 0.5 | GO:0030485 | smooth muscle contractile fiber(GO:0030485) |
| 0.1 | 0.1 | GO:0031205 | endoplasmic reticulum Sec complex(GO:0031205) |
| 0.1 | 0.2 | GO:0043198 | dendritic shaft(GO:0043198) |
| 0.1 | 0.2 | GO:0009331 | glycerol-3-phosphate dehydrogenase complex(GO:0009331) |
| 0.1 | 0.6 | GO:1990130 | Iml1 complex(GO:1990130) |
| 0.1 | 3.1 | GO:0005685 | U1 snRNP(GO:0005685) |
| 0.1 | 0.5 | GO:0098837 | postsynaptic recycling endosome(GO:0098837) |
| 0.1 | 0.5 | GO:1990393 | 3M complex(GO:1990393) |
| 0.1 | 0.2 | GO:0034362 | low-density lipoprotein particle(GO:0034362) |
| 0.1 | 0.2 | GO:1990462 | omegasome(GO:1990462) |
| 0.1 | 1.6 | GO:0000177 | cytoplasmic exosome (RNase complex)(GO:0000177) |
| 0.1 | 0.5 | GO:0008537 | proteasome activator complex(GO:0008537) |
| 0.1 | 0.2 | GO:0097449 | astrocyte projection(GO:0097449) |
| 0.1 | 0.3 | GO:0098845 | postsynaptic endosome(GO:0098845) |
| 0.1 | 0.3 | GO:1990357 | terminal web(GO:1990357) |
| 0.1 | 0.8 | GO:0016323 | basolateral plasma membrane(GO:0016323) |
| 0.1 | 0.5 | GO:0045323 | interleukin-1 receptor complex(GO:0045323) |
| 0.1 | 2.4 | GO:0031143 | pseudopodium(GO:0031143) |
| 0.1 | 0.1 | GO:0019866 | organelle inner membrane(GO:0019866) |
| 0.1 | 0.6 | GO:0019815 | B cell receptor complex(GO:0019815) |
| 0.1 | 1.2 | GO:0030014 | CCR4-NOT complex(GO:0030014) |
| 0.1 | 0.6 | GO:0042406 | extrinsic component of endoplasmic reticulum membrane(GO:0042406) |
| 0.1 | 0.8 | GO:0005744 | mitochondrial inner membrane presequence translocase complex(GO:0005744) |
| 0.1 | 1.8 | GO:0098573 | intrinsic component of mitochondrial membrane(GO:0098573) |
| 0.1 | 5.8 | GO:0005762 | organellar large ribosomal subunit(GO:0000315) mitochondrial large ribosomal subunit(GO:0005762) |
| 0.1 | 0.4 | GO:0031428 | box C/D snoRNP complex(GO:0031428) |
| 0.1 | 0.3 | GO:0008282 | ATP-sensitive potassium channel complex(GO:0008282) |
| 0.1 | 1.9 | GO:0034045 | pre-autophagosomal structure membrane(GO:0034045) |
| 0.1 | 0.5 | GO:0070436 | Grb2-EGFR complex(GO:0070436) |
| 0.1 | 0.6 | GO:1990316 | ATG1/ULK1 kinase complex(GO:1990316) |
| 0.1 | 2.5 | GO:0005763 | organellar small ribosomal subunit(GO:0000314) mitochondrial small ribosomal subunit(GO:0005763) |
| 0.1 | 2.8 | GO:0001533 | cornified envelope(GO:0001533) |
| 0.1 | 1.0 | GO:0097512 | cardiac myofibril(GO:0097512) |
| 0.1 | 0.1 | GO:0044294 | dendritic growth cone(GO:0044294) |
| 0.1 | 0.2 | GO:0042022 | interleukin-12 receptor complex(GO:0042022) |
| 0.1 | 0.7 | GO:0071986 | Ragulator complex(GO:0071986) |
| 0.1 | 1.7 | GO:0005865 | striated muscle thin filament(GO:0005865) |
| 0.1 | 0.1 | GO:1990682 | CSF1-CSF1R complex(GO:1990682) |
| 0.1 | 7.6 | GO:0005913 | cell-cell adherens junction(GO:0005913) |
| 0.1 | 0.1 | GO:0071547 | piP-body(GO:0071547) |
| 0.1 | 0.2 | GO:1990851 | Wnt-Frizzled-LRP5/6 complex(GO:1990851) |
| 0.1 | 0.4 | GO:0035976 | AP1 complex(GO:0035976) |
| 0.1 | 0.1 | GO:0071004 | U2-type prespliceosome(GO:0071004) |
| 0.1 | 1.0 | GO:0097136 | Bcl-2 family protein complex(GO:0097136) |
| 0.1 | 0.2 | GO:0010009 | cytoplasmic side of endosome membrane(GO:0010009) |
| 0.1 | 0.2 | GO:0043511 | inhibin complex(GO:0043511) inhibin A complex(GO:0043512) |
| 0.1 | 1.5 | GO:0005952 | cAMP-dependent protein kinase complex(GO:0005952) |
| 0.1 | 0.7 | GO:0000445 | THO complex(GO:0000347) THO complex part of transcription export complex(GO:0000445) |
| 0.1 | 0.2 | GO:0016600 | flotillin complex(GO:0016600) |
| 0.1 | 0.1 | GO:0043202 | lysosomal lumen(GO:0043202) |
| 0.1 | 4.9 | GO:0005747 | mitochondrial respiratory chain complex I(GO:0005747) NADH dehydrogenase complex(GO:0030964) respiratory chain complex I(GO:0045271) |
| 0.1 | 0.7 | GO:0000801 | central element(GO:0000801) |
| 0.1 | 0.3 | GO:0070761 | pre-snoRNP complex(GO:0070761) |
| 0.1 | 0.3 | GO:0005641 | nuclear envelope lumen(GO:0005641) |
| 0.1 | 0.5 | GO:0070847 | core mediator complex(GO:0070847) |
| 0.1 | 0.3 | GO:0030286 | dynein complex(GO:0030286) |
| 0.1 | 1.8 | GO:0031083 | BLOC-1 complex(GO:0031083) |
| 0.1 | 0.1 | GO:0002945 | cyclin K-CDK13 complex(GO:0002945) |
| 0.1 | 1.4 | GO:0005665 | DNA-directed RNA polymerase II, core complex(GO:0005665) |
| 0.1 | 0.4 | GO:0005688 | U6 snRNP(GO:0005688) |
| 0.1 | 5.0 | GO:1903293 | protein serine/threonine phosphatase complex(GO:0008287) phosphatase complex(GO:1903293) |
| 0.1 | 0.9 | GO:0070578 | RISC-loading complex(GO:0070578) |
| 0.1 | 5.7 | GO:0017053 | transcriptional repressor complex(GO:0017053) |
| 0.1 | 0.6 | GO:0061574 | ASAP complex(GO:0061574) |
| 0.1 | 3.2 | GO:0033017 | sarcoplasmic reticulum membrane(GO:0033017) |
| 0.1 | 0.1 | GO:0070938 | contractile ring(GO:0070938) |
| 0.1 | 0.1 | GO:0031933 | telomeric heterochromatin(GO:0031933) |
| 0.1 | 0.4 | GO:0051233 | spindle midzone(GO:0051233) |
| 0.1 | 0.4 | GO:0098797 | plasma membrane protein complex(GO:0098797) |
| 0.1 | 0.4 | GO:0097165 | nuclear stress granule(GO:0097165) |
| 0.1 | 0.4 | GO:1902560 | GMP reductase complex(GO:1902560) |
| 0.1 | 0.7 | GO:0005750 | mitochondrial respiratory chain complex III(GO:0005750) respiratory chain complex III(GO:0045275) |
| 0.1 | 6.0 | GO:0034707 | chloride channel complex(GO:0034707) |
| 0.1 | 0.3 | GO:0097208 | alveolar lamellar body(GO:0097208) |
| 0.1 | 0.7 | GO:0005876 | spindle microtubule(GO:0005876) |
| 0.1 | 0.2 | GO:0070557 | PCNA-p21 complex(GO:0070557) |
| 0.1 | 1.2 | GO:0048786 | presynaptic active zone(GO:0048786) |
| 0.1 | 0.9 | GO:0031209 | SCAR complex(GO:0031209) |
| 0.1 | 1.1 | GO:0033178 | proton-transporting two-sector ATPase complex, catalytic domain(GO:0033178) |
| 0.1 | 29.3 | GO:0005759 | mitochondrial matrix(GO:0005759) |
| 0.1 | 0.2 | GO:0030905 | retromer, tubulation complex(GO:0030905) |
| 0.1 | 0.1 | GO:0031379 | RNA-directed RNA polymerase complex(GO:0031379) |
| 0.1 | 0.4 | GO:0097361 | CIA complex(GO:0097361) |
| 0.1 | 0.1 | GO:0031012 | extracellular matrix(GO:0031012) |
| 0.1 | 0.9 | GO:0008290 | F-actin capping protein complex(GO:0008290) |
| 0.1 | 0.7 | GO:0098799 | outer mitochondrial membrane protein complex(GO:0098799) |
| 0.1 | 0.9 | GO:0031588 | nucleotide-activated protein kinase complex(GO:0031588) |
| 0.1 | 0.5 | GO:0042612 | MHC class I protein complex(GO:0042612) |
| 0.1 | 0.2 | GO:0002189 | ribose phosphate diphosphokinase complex(GO:0002189) |
| 0.1 | 1.4 | GO:0031229 | integral component of nuclear inner membrane(GO:0005639) intrinsic component of nuclear inner membrane(GO:0031229) |
| 0.1 | 0.8 | GO:0000783 | telomere cap complex(GO:0000782) nuclear telomere cap complex(GO:0000783) |
| 0.1 | 0.8 | GO:0030126 | COPI vesicle coat(GO:0030126) |
| 0.1 | 0.4 | GO:0031415 | NatA complex(GO:0031415) |
| 0.1 | 1.2 | GO:0005922 | connexon complex(GO:0005922) |
| 0.1 | 0.8 | GO:0000276 | mitochondrial proton-transporting ATP synthase complex, coupling factor F(o)(GO:0000276) |
| 0.1 | 0.8 | GO:0060077 | inhibitory synapse(GO:0060077) |
| 0.1 | 0.3 | GO:0097169 | AIM2 inflammasome complex(GO:0097169) |
| 0.1 | 0.2 | GO:0055029 | nuclear DNA-directed RNA polymerase complex(GO:0055029) |
| 0.1 | 0.5 | GO:0034709 | methylosome(GO:0034709) |
| 0.1 | 0.1 | GO:0043564 | Ku70:Ku80 complex(GO:0043564) |
| 0.1 | 0.9 | GO:0000815 | ESCRT III complex(GO:0000815) |
| 0.1 | 0.2 | GO:0031462 | Cul2-RING ubiquitin ligase complex(GO:0031462) |
| 0.1 | 0.4 | GO:0070554 | synaptobrevin 2-SNAP-25-syntaxin-3-complexin complex(GO:0070554) |
| 0.1 | 0.7 | GO:0000788 | nuclear nucleosome(GO:0000788) |
| 0.0 | 0.4 | GO:0016272 | prefoldin complex(GO:0016272) |
| 0.0 | 0.0 | GO:1990667 | PCSK9-AnxA2 complex(GO:1990667) |
| 0.0 | 0.5 | GO:0043219 | lateral loop(GO:0043219) |
| 0.0 | 1.0 | GO:0005885 | Arp2/3 protein complex(GO:0005885) |
| 0.0 | 0.1 | GO:0043293 | apoptosome(GO:0043293) |
| 0.0 | 0.2 | GO:0060187 | cell pole(GO:0060187) |
| 0.0 | 0.1 | GO:0019008 | molybdopterin synthase complex(GO:0019008) |
| 0.0 | 0.2 | GO:0034098 | VCP-NPL4-UFD1 AAA ATPase complex(GO:0034098) |
| 0.0 | 0.6 | GO:0031371 | ubiquitin conjugating enzyme complex(GO:0031371) |
| 0.0 | 0.6 | GO:0001673 | male germ cell nucleus(GO:0001673) |
| 0.0 | 0.1 | GO:0020016 | ciliary pocket(GO:0020016) ciliary pocket membrane(GO:0020018) |
| 0.0 | 1.0 | GO:0005682 | U5 snRNP(GO:0005682) |
| 0.0 | 0.5 | GO:0008541 | proteasome regulatory particle, lid subcomplex(GO:0008541) |
| 0.0 | 0.1 | GO:0034686 | integrin alphav-beta8 complex(GO:0034686) |
| 0.0 | 0.4 | GO:0005882 | intermediate filament(GO:0005882) |
| 0.0 | 5.0 | GO:0070821 | tertiary granule membrane(GO:0070821) |
| 0.0 | 0.2 | GO:0043625 | delta DNA polymerase complex(GO:0043625) |
| 0.0 | 0.2 | GO:0097524 | sperm plasma membrane(GO:0097524) |
| 0.0 | 0.2 | GO:1990131 | Gtr1-Gtr2 GTPase complex(GO:1990131) |
| 0.0 | 0.7 | GO:0035102 | PRC1 complex(GO:0035102) |
| 0.0 | 9.8 | GO:0019897 | extrinsic component of plasma membrane(GO:0019897) |
| 0.0 | 0.2 | GO:0000308 | cytoplasmic cyclin-dependent protein kinase holoenzyme complex(GO:0000308) |
| 0.0 | 0.4 | GO:0000120 | RNA polymerase I transcription factor complex(GO:0000120) |
| 0.0 | 0.4 | GO:0005677 | chromatin silencing complex(GO:0005677) |
| 0.0 | 0.1 | GO:0031084 | BLOC-2 complex(GO:0031084) |
| 0.0 | 0.1 | GO:0032002 | interleukin-28 receptor complex(GO:0032002) |
| 0.0 | 0.2 | GO:0005968 | Rab-protein geranylgeranyltransferase complex(GO:0005968) |
| 0.0 | 0.1 | GO:0044326 | dendritic spine neck(GO:0044326) |
| 0.0 | 0.3 | GO:0044292 | dendrite terminus(GO:0044292) |
| 0.0 | 5.3 | GO:0016605 | PML body(GO:0016605) |
| 0.0 | 0.2 | GO:0045257 | mitochondrial respiratory chain complex II, succinate dehydrogenase complex (ubiquinone)(GO:0005749) succinate dehydrogenase complex (ubiquinone)(GO:0045257) respiratory chain complex II(GO:0045273) succinate dehydrogenase complex(GO:0045281) fumarate reductase complex(GO:0045283) |
| 0.0 | 0.5 | GO:0070652 | HAUS complex(GO:0070652) |
| 0.0 | 0.1 | GO:0031074 | nucleocytoplasmic shuttling complex(GO:0031074) |
| 0.0 | 0.3 | GO:0033276 | transcription factor TFTC complex(GO:0033276) |
| 0.0 | 4.8 | GO:0022625 | cytosolic large ribosomal subunit(GO:0022625) |
| 0.0 | 0.1 | GO:0016589 | NURF complex(GO:0016589) |
| 0.0 | 7.7 | GO:1904813 | ficolin-1-rich granule(GO:0101002) ficolin-1-rich granule lumen(GO:1904813) |
| 0.0 | 0.2 | GO:0035032 | phosphatidylinositol 3-kinase complex, class III(GO:0035032) |
| 0.0 | 0.2 | GO:0000214 | tRNA-intron endonuclease complex(GO:0000214) |
| 0.0 | 0.9 | GO:0032839 | dendrite cytoplasm(GO:0032839) |
| 0.0 | 0.4 | GO:0012510 | trans-Golgi network transport vesicle membrane(GO:0012510) |
| 0.0 | 2.0 | GO:0055038 | recycling endosome membrane(GO:0055038) |
| 0.0 | 0.2 | GO:0097550 | transcriptional preinitiation complex(GO:0097550) |
| 0.0 | 0.3 | GO:0034719 | SMN-Sm protein complex(GO:0034719) |
| 0.0 | 0.6 | GO:0030008 | TRAPP complex(GO:0030008) |
| 0.0 | 0.2 | GO:0000932 | cytoplasmic mRNA processing body(GO:0000932) |
| 0.0 | 0.1 | GO:0031021 | interphase microtubule organizing center(GO:0031021) |
| 0.0 | 4.7 | GO:0005923 | bicellular tight junction(GO:0005923) |
| 0.0 | 0.2 | GO:0030868 | smooth endoplasmic reticulum membrane(GO:0030868) smooth endoplasmic reticulum part(GO:0097425) |
| 0.0 | 0.6 | GO:0045009 | melanosome membrane(GO:0033162) chitosome(GO:0045009) |
| 0.0 | 0.2 | GO:0034451 | centriolar satellite(GO:0034451) |
| 0.0 | 2.1 | GO:0005758 | mitochondrial intermembrane space(GO:0005758) |
| 0.0 | 0.2 | GO:0031466 | Cul5-RING ubiquitin ligase complex(GO:0031466) |
| 0.0 | 0.2 | GO:0098843 | postsynaptic endocytic zone(GO:0098843) |
| 0.0 | 0.5 | GO:0000407 | pre-autophagosomal structure(GO:0000407) |
| 0.0 | 0.4 | GO:0097440 | apical dendrite(GO:0097440) |
| 0.0 | 0.1 | GO:0071437 | invadopodium(GO:0071437) |
| 0.0 | 1.0 | GO:0032156 | septin cytoskeleton(GO:0032156) |
| 0.0 | 0.2 | GO:0033263 | CORVET complex(GO:0033263) |
| 0.0 | 0.3 | GO:0061617 | MICOS complex(GO:0061617) |
| 0.0 | 0.0 | GO:0000242 | pericentriolar material(GO:0000242) |
| 0.0 | 1.8 | GO:0000118 | histone deacetylase complex(GO:0000118) |
| 0.0 | 0.6 | GO:0060170 | ciliary membrane(GO:0060170) |
| 0.0 | 11.3 | GO:0005743 | mitochondrial inner membrane(GO:0005743) |
| 0.0 | 0.0 | GO:0098536 | deuterosome(GO:0098536) |
| 0.0 | 0.1 | GO:0030125 | clathrin vesicle coat(GO:0030125) |
| 0.0 | 0.1 | GO:0032009 | early phagosome(GO:0032009) |
| 0.0 | 0.2 | GO:0005854 | nascent polypeptide-associated complex(GO:0005854) |
| 0.0 | 2.9 | GO:0031463 | Cul3-RING ubiquitin ligase complex(GO:0031463) |
| 0.0 | 0.1 | GO:0036156 | inner dynein arm(GO:0036156) |
| 0.0 | 0.2 | GO:0000346 | transcription export complex(GO:0000346) |
| 0.0 | 0.2 | GO:0043190 | ATP-binding cassette (ABC) transporter complex(GO:0043190) |
| 0.0 | 0.8 | GO:0016328 | lateral plasma membrane(GO:0016328) |
| 0.0 | 0.4 | GO:0005686 | U2 snRNP(GO:0005686) |
| 0.0 | 1.9 | GO:0005891 | voltage-gated calcium channel complex(GO:0005891) |
| 0.0 | 1.6 | GO:0016235 | aggresome(GO:0016235) |
| 0.0 | 0.2 | GO:0002199 | zona pellucida receptor complex(GO:0002199) |
| 0.0 | 0.4 | GO:0033588 | Elongator holoenzyme complex(GO:0033588) |
| 0.0 | 0.2 | GO:1903440 | calcitonin family receptor complex(GO:1903439) amylin receptor complex(GO:1903440) |
| 0.0 | 0.1 | GO:0098636 | protein complex involved in cell adhesion(GO:0098636) |
| 0.0 | 0.1 | GO:0032044 | DSIF complex(GO:0032044) |
| 0.0 | 0.7 | GO:0031941 | filamentous actin(GO:0031941) |
| 0.0 | 0.4 | GO:0002178 | palmitoyltransferase complex(GO:0002178) |
| 0.0 | 0.1 | GO:0005607 | laminin-2 complex(GO:0005607) |
| 0.0 | 0.1 | GO:0005796 | Golgi lumen(GO:0005796) |
| 0.0 | 0.8 | GO:0097381 | photoreceptor disc membrane(GO:0097381) |
| 0.0 | 0.4 | GO:0034464 | BBSome(GO:0034464) |
| 0.0 | 0.1 | GO:0044300 | cerebellar mossy fiber(GO:0044300) |
| 0.0 | 0.1 | GO:0030906 | retromer, cargo-selective complex(GO:0030906) |
| 0.0 | 0.7 | GO:0016514 | SWI/SNF complex(GO:0016514) |
| 0.0 | 0.0 | GO:0005687 | U4 snRNP(GO:0005687) |
| 0.0 | 0.8 | GO:0034706 | sodium channel complex(GO:0034706) |
| 0.0 | 0.1 | GO:0031931 | TORC1 complex(GO:0031931) |
| 0.0 | 0.4 | GO:0000813 | ESCRT I complex(GO:0000813) |
| 0.0 | 1.8 | GO:0015935 | small ribosomal subunit(GO:0015935) |
| 0.0 | 0.5 | GO:0016281 | eukaryotic translation initiation factor 4F complex(GO:0016281) |
| 0.0 | 0.1 | GO:0031461 | cullin-RING ubiquitin ligase complex(GO:0031461) |
| 0.0 | 1.0 | GO:0035580 | specific granule lumen(GO:0035580) |
| 0.0 | 0.4 | GO:0032039 | integrator complex(GO:0032039) |
| 0.0 | 0.5 | GO:0005614 | interstitial matrix(GO:0005614) |
| 0.0 | 3.8 | GO:0032587 | ruffle membrane(GO:0032587) |
| 0.0 | 1.3 | GO:0016591 | DNA-directed RNA polymerase II, holoenzyme(GO:0016591) |
| 0.0 | 0.5 | GO:0042613 | MHC class II protein complex(GO:0042613) |
| 0.0 | 0.3 | GO:0005884 | actin filament(GO:0005884) |
| 0.0 | 0.1 | GO:0032021 | NELF complex(GO:0032021) |
| 0.0 | 0.2 | GO:0005905 | clathrin-coated pit(GO:0005905) |
| 0.0 | 0.2 | GO:0098984 | neuron to neuron synapse(GO:0098984) |
| 0.0 | 0.3 | GO:0048188 | Set1C/COMPASS complex(GO:0048188) |
| 0.0 | 0.2 | GO:0019774 | proteasome core complex, beta-subunit complex(GO:0019774) |
| 0.0 | 0.1 | GO:0070069 | cytochrome complex(GO:0070069) |
| 0.0 | 0.0 | GO:0030673 | axolemma(GO:0030673) |
| 0.0 | 1.7 | GO:0045095 | keratin filament(GO:0045095) |
| 0.0 | 0.6 | GO:0035577 | azurophil granule membrane(GO:0035577) |
| 0.0 | 0.3 | GO:0031254 | uropod(GO:0001931) cell trailing edge(GO:0031254) |
| 0.0 | 0.1 | GO:0070985 | TFIIK complex(GO:0070985) |
| 0.0 | 0.1 | GO:0034366 | spherical high-density lipoprotein particle(GO:0034366) |
| 0.0 | 1.2 | GO:0045171 | intercellular bridge(GO:0045171) |
| 0.0 | 0.0 | GO:0019908 | nuclear cyclin-dependent protein kinase holoenzyme complex(GO:0019908) |
| 0.0 | 0.1 | GO:0098855 | HCN channel complex(GO:0098855) |
| 0.0 | 0.7 | GO:0005720 | nuclear heterochromatin(GO:0005720) |
| 0.0 | 0.1 | GO:0019907 | cyclin-dependent protein kinase activating kinase holoenzyme complex(GO:0019907) |
| 0.0 | 0.0 | GO:0035748 | myelin sheath abaxonal region(GO:0035748) |
| 0.0 | 0.2 | GO:0005833 | hemoglobin complex(GO:0005833) |
| 0.0 | 0.1 | GO:0071564 | npBAF complex(GO:0071564) |
| 0.0 | 0.7 | GO:0097014 | axoneme(GO:0005930) ciliary plasm(GO:0097014) |
| 0.0 | 0.1 | GO:0030027 | lamellipodium(GO:0030027) |
| 0.0 | 0.3 | GO:0005844 | polysome(GO:0005844) |
| 0.0 | 0.7 | GO:0001917 | photoreceptor inner segment(GO:0001917) |
| 0.0 | 0.2 | GO:0035859 | Seh1-associated complex(GO:0035859) |
| 0.0 | 0.0 | GO:0034666 | integrin alpha2-beta1 complex(GO:0034666) |
| 0.0 | 0.2 | GO:0031390 | Ctf18 RFC-like complex(GO:0031390) |
| 0.0 | 0.1 | GO:0009328 | phenylalanine-tRNA ligase complex(GO:0009328) |
| 0.0 | 0.0 | GO:0034681 | integrin alpha11-beta1 complex(GO:0034681) |
| 0.0 | 0.1 | GO:0055087 | Ski complex(GO:0055087) |
| 0.0 | 0.2 | GO:0072669 | tRNA-splicing ligase complex(GO:0072669) |
| 0.0 | 0.6 | GO:0035869 | ciliary transition zone(GO:0035869) |
| 0.0 | 0.1 | GO:0071458 | integral component of cytoplasmic side of endoplasmic reticulum membrane(GO:0071458) |
| 0.0 | 0.2 | GO:0000145 | exocyst(GO:0000145) |
| 0.0 | 0.3 | GO:0042627 | chylomicron(GO:0042627) |
| 0.0 | 0.5 | GO:0016459 | myosin complex(GO:0016459) |
| 0.0 | 0.1 | GO:0042272 | nuclear RNA export factor complex(GO:0042272) |
| 0.0 | 0.0 | GO:0001940 | male pronucleus(GO:0001940) |
| 0.0 | 0.1 | GO:0044218 | other organism cell membrane(GO:0044218) other organism membrane(GO:0044279) |
| 0.0 | 0.0 | GO:0097228 | sperm principal piece(GO:0097228) |
| 0.0 | 4.3 | GO:0000790 | nuclear chromatin(GO:0000790) |
| 0.0 | 0.0 | GO:1902710 | GABA receptor complex(GO:1902710) |
| 0.0 | 0.1 | GO:0000444 | MIS12/MIND type complex(GO:0000444) |
| 0.0 | 0.0 | GO:0030992 | intraciliary transport particle B(GO:0030992) |
| 0.0 | 1.9 | GO:0001650 | fibrillar center(GO:0001650) |
| 0.0 | 0.1 | GO:0044530 | supraspliceosomal complex(GO:0044530) |
| 0.0 | 0.4 | GO:0055037 | recycling endosome(GO:0055037) |
| 0.0 | 0.0 | GO:0031838 | haptoglobin-hemoglobin complex(GO:0031838) |
| 0.0 | 0.1 | GO:0035867 | alphav-beta3 integrin-IGF-1-IGF1R complex(GO:0035867) |
| 0.0 | 0.1 | GO:0016442 | RISC complex(GO:0016442) RNAi effector complex(GO:0031332) |
| 0.0 | 1.1 | GO:0036064 | ciliary basal body(GO:0036064) |
| 0.0 | 0.3 | GO:0012507 | ER to Golgi transport vesicle membrane(GO:0012507) |
| 0.0 | 0.1 | GO:0030897 | HOPS complex(GO:0030897) |
| 0.0 | 0.2 | GO:0000930 | gamma-tubulin complex(GO:0000930) |
| 0.0 | 0.2 | GO:0097225 | sperm midpiece(GO:0097225) |
| 0.0 | 0.0 | GO:0045293 | MIS complex(GO:0036396) mRNA editing complex(GO:0045293) |
| 0.0 | 0.1 | GO:0005868 | cytoplasmic dynein complex(GO:0005868) |
| 0.0 | 0.0 | GO:0030669 | clathrin-coated endocytic vesicle membrane(GO:0030669) |
| 0.0 | 0.0 | GO:0035327 | transcriptionally active chromatin(GO:0035327) |
| 0.0 | 0.1 | GO:0000938 | GARP complex(GO:0000938) |
| 0.0 | 0.2 | GO:0005847 | mRNA cleavage and polyadenylation specificity factor complex(GO:0005847) |
| 0.0 | 1.0 | GO:0005938 | cell cortex(GO:0005938) |
| 0.0 | 0.0 | GO:0036021 | endolysosome lumen(GO:0036021) |
| 0.0 | 0.0 | GO:0071010 | prespliceosome(GO:0071010) |
| 0.0 | 0.3 | GO:0008023 | transcription elongation factor complex(GO:0008023) |
| 0.0 | 0.1 | GO:0034388 | Pwp2p-containing subcomplex of 90S preribosome(GO:0034388) |
| 0.0 | 0.1 | GO:0005786 | signal recognition particle, endoplasmic reticulum targeting(GO:0005786) |
| 0.0 | 0.0 | GO:0005784 | Sec61 translocon complex(GO:0005784) translocon complex(GO:0071256) |
| 0.0 | 0.0 | GO:0000178 | exosome (RNase complex)(GO:0000178) |
| 0.0 | 0.0 | GO:0043159 | acrosomal matrix(GO:0043159) |
| 0.0 | 0.1 | GO:0032045 | guanyl-nucleotide exchange factor complex(GO:0032045) |
| 0.0 | 0.1 | GO:0097610 | cleavage furrow(GO:0032154) cell surface furrow(GO:0097610) |
| 0.0 | 0.1 | GO:0005790 | smooth endoplasmic reticulum(GO:0005790) |
Gene overrepresentation in molecular_function category:
| Log-likelihood per target | Total log-likelihood | Term | Description |
|---|---|---|---|
| 2.2 | 11.1 | GO:0052834 | inositol monophosphate 1-phosphatase activity(GO:0008934) inositol monophosphate 3-phosphatase activity(GO:0052832) inositol monophosphate 4-phosphatase activity(GO:0052833) inositol monophosphate phosphatase activity(GO:0052834) |
| 1.4 | 19.6 | GO:0031014 | troponin T binding(GO:0031014) |
| 1.2 | 1.2 | GO:0035373 | chondroitin sulfate proteoglycan binding(GO:0035373) |
| 1.0 | 3.1 | GO:0038131 | neuregulin receptor activity(GO:0038131) |
| 0.9 | 0.9 | GO:0030371 | translation repressor activity(GO:0030371) |
| 0.8 | 2.4 | GO:0016165 | linoleate 13S-lipoxygenase activity(GO:0016165) |
| 0.8 | 2.4 | GO:0050421 | cystathionine beta-synthase activity(GO:0004122) oxidoreductase activity, acting on other nitrogenous compounds as donors, cytochrome as acceptor(GO:0016662) nitrite reductase (NO-forming) activity(GO:0050421) carbon monoxide binding(GO:0070025) nitrite reductase activity(GO:0098809) |
| 0.7 | 2.1 | GO:0016731 | ferredoxin-NADP+ reductase activity(GO:0004324) NADPH-adrenodoxin reductase activity(GO:0015039) oxidoreductase activity, acting on iron-sulfur proteins as donors(GO:0016730) oxidoreductase activity, acting on iron-sulfur proteins as donors, NAD or NADP as acceptor(GO:0016731) |
| 0.7 | 3.4 | GO:0046899 | nucleoside triphosphate adenylate kinase activity(GO:0046899) |
| 0.6 | 5.2 | GO:0086083 | cell adhesive protein binding involved in bundle of His cell-Purkinje myocyte communication(GO:0086083) |
| 0.6 | 1.7 | GO:0004574 | oligo-1,6-glucosidase activity(GO:0004574) |
| 0.6 | 3.4 | GO:0042577 | lipid phosphatase activity(GO:0042577) |
| 0.6 | 1.7 | GO:0098782 | mechanically-gated potassium channel activity(GO:0098782) |
| 0.5 | 1.6 | GO:0031751 | D4 dopamine receptor binding(GO:0031751) |
| 0.5 | 2.1 | GO:0047066 | phospholipid-hydroperoxide glutathione peroxidase activity(GO:0047066) |
| 0.5 | 3.4 | GO:0004111 | creatine kinase activity(GO:0004111) |
| 0.5 | 5.3 | GO:0004969 | histamine receptor activity(GO:0004969) |
| 0.5 | 1.4 | GO:0004416 | hydroxyacylglutathione hydrolase activity(GO:0004416) |
| 0.4 | 1.3 | GO:0008332 | low voltage-gated calcium channel activity(GO:0008332) |
| 0.4 | 2.2 | GO:0001025 | RNA polymerase III transcription factor binding(GO:0001025) |
| 0.4 | 0.4 | GO:0047115 | trans-1,2-dihydrobenzene-1,2-diol dehydrogenase activity(GO:0047115) |
| 0.4 | 1.7 | GO:0031735 | CCR10 chemokine receptor binding(GO:0031735) |
| 0.4 | 1.6 | GO:0002060 | purine nucleobase binding(GO:0002060) |
| 0.4 | 1.6 | GO:0004074 | biliverdin reductase activity(GO:0004074) |
| 0.4 | 0.4 | GO:0051120 | hepoxilin A3 synthase activity(GO:0051120) |
| 0.4 | 2.0 | GO:0005219 | ryanodine-sensitive calcium-release channel activity(GO:0005219) |
| 0.4 | 2.3 | GO:0043183 | vascular endothelial growth factor receptor 1 binding(GO:0043183) |
| 0.4 | 2.0 | GO:0070644 | vitamin D response element binding(GO:0070644) |
| 0.4 | 1.1 | GO:0003845 | 11-beta-hydroxysteroid dehydrogenase [NAD(P)] activity(GO:0003845) |
| 0.4 | 0.8 | GO:0070026 | nitric oxide binding(GO:0070026) |
| 0.4 | 1.1 | GO:0031896 | V2 vasopressin receptor binding(GO:0031896) |
| 0.4 | 1.1 | GO:0008969 | phosphohistidine phosphatase activity(GO:0008969) |
| 0.4 | 1.5 | GO:0016784 | 3-mercaptopyruvate sulfurtransferase activity(GO:0016784) |
| 0.4 | 0.7 | GO:0032767 | copper-dependent protein binding(GO:0032767) |
| 0.4 | 2.5 | GO:0001665 | alpha-N-acetylgalactosaminide alpha-2,6-sialyltransferase activity(GO:0001665) |
| 0.3 | 2.7 | GO:0030160 | GKAP/Homer scaffold activity(GO:0030160) |
| 0.3 | 1.7 | GO:0060961 | phospholipase D inhibitor activity(GO:0060961) |
| 0.3 | 1.3 | GO:0034057 | RNA strand-exchange activity(GO:0034057) |
| 0.3 | 2.6 | GO:0042296 | ISG15 transferase activity(GO:0042296) |
| 0.3 | 0.3 | GO:0004012 | phospholipid-translocating ATPase activity(GO:0004012) |
| 0.3 | 1.8 | GO:0034648 | histone demethylase activity (H3-dimethyl-K4 specific)(GO:0034648) |
| 0.3 | 1.2 | GO:0008532 | N-acetyllactosaminide beta-1,3-N-acetylglucosaminyltransferase activity(GO:0008532) |
| 0.3 | 0.9 | GO:0019834 | phospholipase A2 inhibitor activity(GO:0019834) |
| 0.3 | 1.8 | GO:0005166 | neurotrophin p75 receptor binding(GO:0005166) |
| 0.3 | 0.3 | GO:0004827 | proline-tRNA ligase activity(GO:0004827) |
| 0.3 | 8.5 | GO:0098641 | cadherin binding involved in cell-cell adhesion(GO:0098641) |
| 0.3 | 0.8 | GO:0016534 | cyclin-dependent protein kinase 5 activator activity(GO:0016534) |
| 0.3 | 1.1 | GO:0097677 | STAT family protein binding(GO:0097677) |
| 0.3 | 3.3 | GO:0035612 | AP-2 adaptor complex binding(GO:0035612) |
| 0.3 | 0.8 | GO:0032090 | Pyrin domain binding(GO:0032090) |
| 0.3 | 0.3 | GO:0031698 | beta-2 adrenergic receptor binding(GO:0031698) |
| 0.3 | 0.6 | GO:0001026 | TFIIIB-type transcription factor activity(GO:0001026) |
| 0.3 | 1.4 | GO:0038062 | protein tyrosine kinase collagen receptor activity(GO:0038062) |
| 0.3 | 0.8 | GO:0031859 | platelet activating factor receptor binding(GO:0031859) |
| 0.3 | 0.8 | GO:0034041 | sterol-transporting ATPase activity(GO:0034041) |
| 0.3 | 2.7 | GO:0070324 | thyroid hormone binding(GO:0070324) |
| 0.3 | 0.8 | GO:0052827 | inositol tetrakisphosphate 1-kinase activity(GO:0047325) inositol-1,3,4-trisphosphate 6-kinase activity(GO:0052725) inositol-1,3,4-trisphosphate 5-kinase activity(GO:0052726) inositol-1,3,4,5,6-pentakisphosphate 1-phosphatase activity(GO:0052825) inositol pentakisphosphate phosphatase activity(GO:0052827) inositol-1,3,4,6-tetrakisphosphate 6-phosphatase activity(GO:0052830) inositol-1,3,4,6-tetrakisphosphate 1-phosphatase activity(GO:0052831) inositol-3,4,6-trisphosphate 1-kinase activity(GO:0052835) |
| 0.3 | 1.3 | GO:0004359 | glutaminase activity(GO:0004359) |
| 0.3 | 0.8 | GO:0008440 | inositol-1,4,5-trisphosphate 3-kinase activity(GO:0008440) |
| 0.3 | 1.0 | GO:0042605 | peptide antigen binding(GO:0042605) |
| 0.3 | 1.0 | GO:0047888 | fatty acid peroxidase activity(GO:0047888) |
| 0.3 | 0.5 | GO:0035650 | AP-1 adaptor complex binding(GO:0035650) |
| 0.2 | 0.2 | GO:0019787 | ubiquitin-like protein transferase activity(GO:0019787) |
| 0.2 | 0.2 | GO:0035374 | chondroitin sulfate binding(GO:0035374) |
| 0.2 | 3.0 | GO:0031386 | protein tag(GO:0031386) |
| 0.2 | 1.2 | GO:0015111 | iodide transmembrane transporter activity(GO:0015111) |
| 0.2 | 1.0 | GO:0008900 | hydrogen:potassium-exchanging ATPase activity(GO:0008900) |
| 0.2 | 4.5 | GO:0070016 | armadillo repeat domain binding(GO:0070016) |
| 0.2 | 2.3 | GO:0004305 | ethanolamine kinase activity(GO:0004305) |
| 0.2 | 0.7 | GO:0051500 | D-aminoacyl-tRNA deacylase activity(GO:0051499) D-tyrosyl-tRNA(Tyr) deacylase activity(GO:0051500) |
| 0.2 | 1.6 | GO:0070891 | lipoteichoic acid binding(GO:0070891) |
| 0.2 | 0.9 | GO:0003938 | IMP dehydrogenase activity(GO:0003938) |
| 0.2 | 1.4 | GO:0086006 | voltage-gated sodium channel activity involved in cardiac muscle cell action potential(GO:0086006) |
| 0.2 | 1.8 | GO:0005052 | peroxisome matrix targeting signal-1 binding(GO:0005052) |
| 0.2 | 1.4 | GO:0004118 | cGMP-stimulated cyclic-nucleotide phosphodiesterase activity(GO:0004118) |
| 0.2 | 1.6 | GO:0000285 | 1-phosphatidylinositol-3-phosphate 5-kinase activity(GO:0000285) |
| 0.2 | 1.8 | GO:0005087 | Ran guanyl-nucleotide exchange factor activity(GO:0005087) |
| 0.2 | 0.7 | GO:0008859 | exoribonuclease II activity(GO:0008859) |
| 0.2 | 0.7 | GO:0030984 | kininogen binding(GO:0030984) |
| 0.2 | 0.9 | GO:0004514 | nicotinate-nucleotide diphosphorylase (carboxylating) activity(GO:0004514) |
| 0.2 | 0.9 | GO:0004699 | calcium-independent protein kinase C activity(GO:0004699) |
| 0.2 | 0.6 | GO:0016309 | 1-phosphatidylinositol-5-phosphate 4-kinase activity(GO:0016309) |
| 0.2 | 2.8 | GO:0038132 | neuregulin binding(GO:0038132) |
| 0.2 | 0.6 | GO:0000994 | RNA polymerase III core binding(GO:0000994) |
| 0.2 | 0.6 | GO:0004828 | serine-tRNA ligase activity(GO:0004828) |
| 0.2 | 0.9 | GO:0004461 | lactose synthase activity(GO:0004461) |
| 0.2 | 2.3 | GO:0047498 | calcium-dependent phospholipase A2 activity(GO:0047498) |
| 0.2 | 0.8 | GO:0030305 | heparanase activity(GO:0030305) |
| 0.2 | 1.3 | GO:0004719 | protein-L-isoaspartate (D-aspartate) O-methyltransferase activity(GO:0004719) |
| 0.2 | 0.6 | GO:0052894 | norspermine:oxygen oxidoreductase activity(GO:0052894) N1-acetylspermine:oxygen oxidoreductase (N1-acetylspermidine-forming) activity(GO:0052895) |
| 0.2 | 0.8 | GO:0009041 | uridylate kinase activity(GO:0009041) |
| 0.2 | 3.6 | GO:0017017 | MAP kinase tyrosine/serine/threonine phosphatase activity(GO:0017017) |
| 0.2 | 0.8 | GO:0035939 | microsatellite binding(GO:0035939) |
| 0.2 | 2.2 | GO:0035381 | extracellular ATP-gated cation channel activity(GO:0004931) ATP-gated ion channel activity(GO:0035381) |
| 0.2 | 1.0 | GO:0004832 | valine-tRNA ligase activity(GO:0004832) |
| 0.2 | 1.2 | GO:0016822 | hydrolase activity, acting on acid carbon-carbon bonds(GO:0016822) hydrolase activity, acting on acid carbon-carbon bonds, in ketonic substances(GO:0016823) |
| 0.2 | 0.8 | GO:0003835 | beta-galactoside alpha-2,6-sialyltransferase activity(GO:0003835) |
| 0.2 | 1.2 | GO:0004045 | aminoacyl-tRNA hydrolase activity(GO:0004045) |
| 0.2 | 5.4 | GO:0031489 | myosin V binding(GO:0031489) |
| 0.2 | 1.5 | GO:0005005 | transmembrane-ephrin receptor activity(GO:0005005) |
| 0.2 | 0.4 | GO:0038036 | sphingosine-1-phosphate receptor activity(GO:0038036) |
| 0.2 | 1.9 | GO:0071253 | connexin binding(GO:0071253) |
| 0.2 | 1.3 | GO:0015183 | L-aspartate transmembrane transporter activity(GO:0015183) |
| 0.2 | 0.8 | GO:0004706 | JUN kinase kinase kinase activity(GO:0004706) |
| 0.2 | 1.1 | GO:0004647 | phosphoserine phosphatase activity(GO:0004647) |
| 0.2 | 0.8 | GO:0070326 | very-low-density lipoprotein particle receptor binding(GO:0070326) |
| 0.2 | 1.3 | GO:0030267 | hydroxypyruvate reductase activity(GO:0016618) glyoxylate reductase (NADP) activity(GO:0030267) |
| 0.2 | 1.1 | GO:0016909 | JUN kinase activity(GO:0004705) SAP kinase activity(GO:0016909) |
| 0.2 | 3.7 | GO:0009931 | calcium-dependent protein serine/threonine kinase activity(GO:0009931) |
| 0.2 | 2.0 | GO:0004865 | protein serine/threonine phosphatase inhibitor activity(GO:0004865) |
| 0.2 | 0.7 | GO:0008426 | protein kinase C inhibitor activity(GO:0008426) |
| 0.2 | 2.2 | GO:0005007 | fibroblast growth factor-activated receptor activity(GO:0005007) |
| 0.2 | 0.9 | GO:0004419 | hydroxymethylglutaryl-CoA lyase activity(GO:0004419) |
| 0.2 | 2.0 | GO:0001730 | 2'-5'-oligoadenylate synthetase activity(GO:0001730) |
| 0.2 | 0.4 | GO:0008665 | 2'-phosphotransferase activity(GO:0008665) |
| 0.2 | 1.1 | GO:0000309 | nicotinamide-nucleotide adenylyltransferase activity(GO:0000309) |
| 0.2 | 0.2 | GO:0044715 | 8-oxo-dGDP phosphatase activity(GO:0044715) |
| 0.2 | 0.5 | GO:0030272 | 5-formyltetrahydrofolate cyclo-ligase activity(GO:0030272) |
| 0.2 | 0.9 | GO:0070404 | NADH binding(GO:0070404) |
| 0.2 | 9.4 | GO:0004864 | protein phosphatase inhibitor activity(GO:0004864) |
| 0.2 | 0.5 | GO:0051019 | mitogen-activated protein kinase binding(GO:0051019) |
| 0.2 | 2.7 | GO:0047429 | nucleoside-triphosphate diphosphatase activity(GO:0047429) |
| 0.2 | 0.7 | GO:0003986 | acetyl-CoA hydrolase activity(GO:0003986) |
| 0.2 | 0.5 | GO:0019912 | cyclin-dependent protein kinase activating kinase activity(GO:0019912) |
| 0.2 | 1.8 | GO:0035256 | G-protein coupled glutamate receptor binding(GO:0035256) |
| 0.2 | 1.5 | GO:0016721 | superoxide dismutase activity(GO:0004784) oxidoreductase activity, acting on superoxide radicals as acceptor(GO:0016721) |
| 0.2 | 1.2 | GO:1903136 | cuprous ion binding(GO:1903136) |
| 0.2 | 0.7 | GO:0004740 | pyruvate dehydrogenase (acetyl-transferring) kinase activity(GO:0004740) |
| 0.2 | 3.3 | GO:0001054 | RNA polymerase I activity(GO:0001054) |
| 0.2 | 0.8 | GO:0008073 | ornithine decarboxylase inhibitor activity(GO:0008073) |
| 0.2 | 0.5 | GO:0047696 | beta-adrenergic receptor kinase activity(GO:0047696) |
| 0.2 | 9.3 | GO:0017080 | sodium channel regulator activity(GO:0017080) |
| 0.2 | 0.2 | GO:0033549 | MAP kinase phosphatase activity(GO:0033549) |
| 0.2 | 1.5 | GO:0016174 | NAD(P)H oxidase activity(GO:0016174) |
| 0.2 | 0.2 | GO:0015230 | FAD transmembrane transporter activity(GO:0015230) |
| 0.2 | 0.5 | GO:0004019 | adenylosuccinate synthase activity(GO:0004019) |
| 0.2 | 0.2 | GO:0016885 | CoA carboxylase activity(GO:0016421) ligase activity, forming carbon-carbon bonds(GO:0016885) |
| 0.2 | 1.0 | GO:0004445 | inositol-polyphosphate 5-phosphatase activity(GO:0004445) |
| 0.2 | 5.7 | GO:0071889 | 14-3-3 protein binding(GO:0071889) |
| 0.2 | 0.9 | GO:0042015 | interleukin-20 binding(GO:0042015) |
| 0.2 | 2.2 | GO:0019826 | oxygen sensor activity(GO:0019826) |
| 0.2 | 0.5 | GO:0004603 | phenylethanolamine N-methyltransferase activity(GO:0004603) |
| 0.2 | 0.6 | GO:0098518 | polynucleotide phosphatase activity(GO:0098518) |
| 0.2 | 0.3 | GO:0004530 | deoxyribonuclease I activity(GO:0004530) |
| 0.2 | 1.8 | GO:0039706 | co-receptor binding(GO:0039706) |
| 0.1 | 1.8 | GO:0017176 | phosphatidylinositol N-acetylglucosaminyltransferase activity(GO:0017176) |
| 0.1 | 1.5 | GO:0004565 | beta-galactosidase activity(GO:0004565) |
| 0.1 | 0.7 | GO:0001641 | group II metabotropic glutamate receptor activity(GO:0001641) |
| 0.1 | 0.4 | GO:0008515 | sucrose:proton symporter activity(GO:0008506) sucrose transmembrane transporter activity(GO:0008515) disaccharide transmembrane transporter activity(GO:0015154) oligosaccharide transmembrane transporter activity(GO:0015157) |
| 0.1 | 3.2 | GO:0004708 | MAP kinase kinase activity(GO:0004708) |
| 0.1 | 0.3 | GO:0035240 | dopamine binding(GO:0035240) |
| 0.1 | 1.2 | GO:0004064 | arylesterase activity(GO:0004064) |
| 0.1 | 1.3 | GO:0003876 | AMP deaminase activity(GO:0003876) adenosine-phosphate deaminase activity(GO:0047623) |
| 0.1 | 1.3 | GO:0004767 | sphingomyelin phosphodiesterase activity(GO:0004767) |
| 0.1 | 0.6 | GO:0015319 | sodium:inorganic phosphate symporter activity(GO:0015319) |
| 0.1 | 0.4 | GO:0061663 | NEDD8 ligase activity(GO:0061663) |
| 0.1 | 0.3 | GO:0004033 | aldo-keto reductase (NADP) activity(GO:0004033) |
| 0.1 | 0.3 | GO:0098519 | nucleotide phosphatase activity, acting on free nucleotides(GO:0098519) |
| 0.1 | 0.4 | GO:0070984 | SET domain binding(GO:0070984) |
| 0.1 | 0.4 | GO:0004357 | glutamate-cysteine ligase activity(GO:0004357) |
| 0.1 | 1.7 | GO:0042608 | T cell receptor binding(GO:0042608) |
| 0.1 | 2.0 | GO:0016176 | superoxide-generating NADPH oxidase activator activity(GO:0016176) |
| 0.1 | 0.4 | GO:0008281 | sulfonylurea receptor activity(GO:0008281) |
| 0.1 | 1.5 | GO:0019784 | NEDD8-specific protease activity(GO:0019784) |
| 0.1 | 0.6 | GO:0004142 | diacylglycerol cholinephosphotransferase activity(GO:0004142) |
| 0.1 | 0.1 | GO:0016406 | carnitine O-acyltransferase activity(GO:0016406) |
| 0.1 | 0.4 | GO:0004052 | arachidonate 12-lipoxygenase activity(GO:0004052) |
| 0.1 | 1.2 | GO:0003847 | 1-alkyl-2-acetylglycerophosphocholine esterase activity(GO:0003847) |
| 0.1 | 0.4 | GO:0004938 | alpha2-adrenergic receptor activity(GO:0004938) |
| 0.1 | 0.7 | GO:0044729 | hemi-methylated DNA-binding(GO:0044729) |
| 0.1 | 2.3 | GO:0003708 | retinoic acid receptor activity(GO:0003708) |
| 0.1 | 2.3 | GO:0008349 | MAP kinase kinase kinase kinase activity(GO:0008349) |
| 0.1 | 2.9 | GO:0038191 | neuropilin binding(GO:0038191) |
| 0.1 | 0.1 | GO:0047192 | 1-alkylglycerophosphocholine O-acetyltransferase activity(GO:0047192) |
| 0.1 | 0.1 | GO:0032564 | adenyl deoxyribonucleotide binding(GO:0032558) dATP binding(GO:0032564) |
| 0.1 | 1.2 | GO:0008420 | CTD phosphatase activity(GO:0008420) |
| 0.1 | 0.7 | GO:0033613 | activating transcription factor binding(GO:0033613) |
| 0.1 | 0.6 | GO:0016728 | ribonucleoside-diphosphate reductase activity, thioredoxin disulfide as acceptor(GO:0004748) oxidoreductase activity, acting on CH or CH2 groups, disulfide as acceptor(GO:0016728) ribonucleoside-diphosphate reductase activity(GO:0061731) |
| 0.1 | 0.9 | GO:0004591 | oxoglutarate dehydrogenase (succinyl-transferring) activity(GO:0004591) |
| 0.1 | 9.1 | GO:0004407 | histone deacetylase activity(GO:0004407) |
| 0.1 | 0.4 | GO:1904599 | advanced glycation end-product binding(GO:1904599) |
| 0.1 | 0.4 | GO:0015131 | thiosulfate transmembrane transporter activity(GO:0015117) oxaloacetate transmembrane transporter activity(GO:0015131) |
| 0.1 | 0.9 | GO:0035614 | snRNA stem-loop binding(GO:0035614) |
| 0.1 | 0.5 | GO:0016638 | oxidoreductase activity, acting on the CH-NH2 group of donors(GO:0016638) |
| 0.1 | 0.9 | GO:0008142 | oxysterol binding(GO:0008142) |
| 0.1 | 0.1 | GO:0047631 | ADP-ribose diphosphatase activity(GO:0047631) |
| 0.1 | 0.4 | GO:0034353 | RNA pyrophosphohydrolase activity(GO:0034353) |
| 0.1 | 1.1 | GO:0003917 | DNA topoisomerase type I activity(GO:0003917) |
| 0.1 | 0.5 | GO:0004165 | dodecenoyl-CoA delta-isomerase activity(GO:0004165) |
| 0.1 | 1.3 | GO:0004652 | polynucleotide adenylyltransferase activity(GO:0004652) |
| 0.1 | 0.5 | GO:0001588 | dopamine neurotransmitter receptor activity, coupled via Gs(GO:0001588) |
| 0.1 | 0.4 | GO:0036313 | phosphatidylinositol 3-kinase catalytic subunit binding(GO:0036313) |
| 0.1 | 1.6 | GO:0097371 | MDM2/MDM4 family protein binding(GO:0097371) |
| 0.1 | 1.1 | GO:0015349 | thyroid hormone transmembrane transporter activity(GO:0015349) |
| 0.1 | 1.0 | GO:0030215 | semaphorin receptor binding(GO:0030215) |
| 0.1 | 0.7 | GO:0023030 | MHC class Ib protein complex binding(GO:0023025) MHC class Ib protein binding, via antigen binding groove(GO:0023030) |
| 0.1 | 0.8 | GO:0008121 | ubiquinol-cytochrome-c reductase activity(GO:0008121) oxidoreductase activity, acting on diphenols and related substances as donors, cytochrome as acceptor(GO:0016681) |
| 0.1 | 0.6 | GO:0008401 | retinoic acid 4-hydroxylase activity(GO:0008401) |
| 0.1 | 2.2 | GO:0030306 | ADP-ribosylation factor binding(GO:0030306) |
| 0.1 | 1.3 | GO:0003996 | acyl-CoA ligase activity(GO:0003996) |
| 0.1 | 0.5 | GO:0050220 | prostaglandin-E synthase activity(GO:0050220) |
| 0.1 | 0.4 | GO:1904455 | ubiquitin-specific protease activity involved in negative regulation of ERAD pathway(GO:1904455) |
| 0.1 | 0.4 | GO:0005150 | interleukin-1, Type I receptor binding(GO:0005150) |
| 0.1 | 1.1 | GO:0000155 | phosphorelay sensor kinase activity(GO:0000155) |
| 0.1 | 0.1 | GO:0030742 | GTP-dependent protein binding(GO:0030742) |
| 0.1 | 1.1 | GO:0004046 | aminoacylase activity(GO:0004046) |
| 0.1 | 0.3 | GO:0050698 | proteoglycan sulfotransferase activity(GO:0050698) |
| 0.1 | 0.5 | GO:0004948 | calcitonin receptor activity(GO:0004948) |
| 0.1 | 0.9 | GO:0035591 | signaling adaptor activity(GO:0035591) |
| 0.1 | 0.1 | GO:0050473 | arachidonate 15-lipoxygenase activity(GO:0050473) |
| 0.1 | 0.3 | GO:0004662 | CAAX-protein geranylgeranyltransferase activity(GO:0004662) |
| 0.1 | 0.7 | GO:0045569 | TRAIL binding(GO:0045569) |
| 0.1 | 0.5 | GO:0003974 | UDP-N-acetylglucosamine 4-epimerase activity(GO:0003974) UDP-glucose 4-epimerase activity(GO:0003978) |
| 0.1 | 3.0 | GO:0004745 | retinol dehydrogenase activity(GO:0004745) |
| 0.1 | 0.1 | GO:0004812 | aminoacyl-tRNA ligase activity(GO:0004812) ligase activity, forming carbon-oxygen bonds(GO:0016875) ligase activity, forming aminoacyl-tRNA and related compounds(GO:0016876) |
| 0.1 | 1.1 | GO:0008553 | hydrogen-exporting ATPase activity, phosphorylative mechanism(GO:0008553) |
| 0.1 | 0.5 | GO:0035662 | Toll-like receptor 4 binding(GO:0035662) |
| 0.1 | 1.0 | GO:0001225 | RNA polymerase II transcription coactivator binding(GO:0001225) |
| 0.1 | 1.6 | GO:0050072 | m7G(5')pppN diphosphatase activity(GO:0050072) |
| 0.1 | 2.0 | GO:0031957 | very long-chain fatty acid-CoA ligase activity(GO:0031957) |
| 0.1 | 0.8 | GO:0048406 | nerve growth factor binding(GO:0048406) |
| 0.1 | 0.7 | GO:0004013 | adenosylhomocysteinase activity(GO:0004013) trialkylsulfonium hydrolase activity(GO:0016802) |
| 0.1 | 0.3 | GO:0004967 | glucagon receptor activity(GO:0004967) |
| 0.1 | 0.4 | GO:1990190 | peptide-glutamate-N-acetyltransferase activity(GO:1990190) |
| 0.1 | 0.9 | GO:1990380 | Lys48-specific deubiquitinase activity(GO:1990380) |
| 0.1 | 0.9 | GO:0005250 | A-type (transient outward) potassium channel activity(GO:0005250) |
| 0.1 | 1.5 | GO:0043024 | ribosomal small subunit binding(GO:0043024) |
| 0.1 | 0.4 | GO:0033906 | hyaluronoglucuronidase activity(GO:0033906) |
| 0.1 | 0.6 | GO:0044736 | acid-sensing ion channel activity(GO:0044736) |
| 0.1 | 0.3 | GO:0033878 | hormone-sensitive lipase activity(GO:0033878) |
| 0.1 | 3.0 | GO:0043014 | alpha-tubulin binding(GO:0043014) |
| 0.1 | 0.3 | GO:0003839 | gamma-glutamylcyclotransferase activity(GO:0003839) |
| 0.1 | 0.3 | GO:0050145 | nucleoside phosphate kinase activity(GO:0050145) |
| 0.1 | 0.3 | GO:0000062 | fatty-acyl-CoA binding(GO:0000062) |
| 0.1 | 3.3 | GO:0030676 | Rac guanyl-nucleotide exchange factor activity(GO:0030676) |
| 0.1 | 0.7 | GO:0004952 | dopamine neurotransmitter receptor activity, coupled via Gi/Go(GO:0001591) dopamine neurotransmitter receptor activity(GO:0004952) |
| 0.1 | 0.8 | GO:0015269 | calcium-activated potassium channel activity(GO:0015269) |
| 0.1 | 3.1 | GO:0003746 | translation elongation factor activity(GO:0003746) |
| 0.1 | 0.4 | GO:0034046 | poly(G) binding(GO:0034046) |
| 0.1 | 0.5 | GO:0004906 | interferon-gamma receptor activity(GO:0004906) |
| 0.1 | 0.3 | GO:0005174 | CD40 receptor binding(GO:0005174) |
| 0.1 | 0.4 | GO:0052798 | beta-galactoside alpha-2,3-sialyltransferase activity(GO:0052798) |
| 0.1 | 1.7 | GO:0004000 | adenosine deaminase activity(GO:0004000) |
| 0.1 | 1.4 | GO:0047134 | protein-disulfide reductase activity(GO:0047134) |
| 0.1 | 0.4 | GO:0004874 | aryl hydrocarbon receptor activity(GO:0004874) |
| 0.1 | 0.2 | GO:0060229 | phospholipase activator activity(GO:0016004) lipase activator activity(GO:0060229) |
| 0.1 | 0.4 | GO:0004047 | aminomethyltransferase activity(GO:0004047) |
| 0.1 | 0.4 | GO:0004329 | formate-tetrahydrofolate ligase activity(GO:0004329) |
| 0.1 | 2.3 | GO:0005328 | neurotransmitter:sodium symporter activity(GO:0005328) |
| 0.1 | 0.4 | GO:0033981 | D-dopachrome decarboxylase activity(GO:0033981) |
| 0.1 | 0.2 | GO:0035243 | protein-arginine omega-N symmetric methyltransferase activity(GO:0035243) |
| 0.1 | 1.0 | GO:0003810 | protein-glutamine gamma-glutamyltransferase activity(GO:0003810) |
| 0.1 | 0.3 | GO:0047389 | glycerophosphocholine phosphodiesterase activity(GO:0047389) |
| 0.1 | 0.7 | GO:0017077 | oxidative phosphorylation uncoupler activity(GO:0017077) |
| 0.1 | 1.0 | GO:0098599 | palmitoyl-(protein) hydrolase activity(GO:0008474) palmitoyl hydrolase activity(GO:0098599) |
| 0.1 | 1.9 | GO:0008603 | cAMP-dependent protein kinase regulator activity(GO:0008603) |
| 0.1 | 0.7 | GO:1901612 | cardiolipin binding(GO:1901612) |
| 0.1 | 0.2 | GO:0000268 | peroxisome targeting sequence binding(GO:0000268) |
| 0.1 | 0.7 | GO:0019788 | NEDD8 transferase activity(GO:0019788) |
| 0.1 | 0.3 | GO:0051010 | microtubule plus-end binding(GO:0051010) |
| 0.1 | 0.6 | GO:0008526 | phosphatidylinositol transporter activity(GO:0008526) |
| 0.1 | 0.2 | GO:0055077 | gap junction hemi-channel activity(GO:0055077) |
| 0.1 | 0.1 | GO:0004965 | G-protein coupled GABA receptor activity(GO:0004965) |
| 0.1 | 3.8 | GO:0004385 | guanylate kinase activity(GO:0004385) |
| 0.1 | 2.1 | GO:0005112 | Notch binding(GO:0005112) |
| 0.1 | 0.2 | GO:0004167 | dopachrome isomerase activity(GO:0004167) |
| 0.1 | 1.1 | GO:0032052 | bile acid binding(GO:0032052) |
| 0.1 | 0.2 | GO:0015140 | malate transmembrane transporter activity(GO:0015140) |
| 0.1 | 0.5 | GO:0004489 | methylenetetrahydrofolate reductase (NAD(P)H) activity(GO:0004489) |
| 0.1 | 0.3 | GO:0004766 | spermidine synthase activity(GO:0004766) |
| 0.1 | 1.0 | GO:0004859 | phospholipase inhibitor activity(GO:0004859) |
| 0.1 | 0.5 | GO:0042289 | MHC class II protein binding(GO:0042289) |
| 0.1 | 2.7 | GO:0008138 | protein tyrosine/serine/threonine phosphatase activity(GO:0008138) |
| 0.1 | 1.4 | GO:0035925 | mRNA 3'-UTR AU-rich region binding(GO:0035925) |
| 0.1 | 1.1 | GO:0030548 | acetylcholine receptor regulator activity(GO:0030548) neurotransmitter receptor regulator activity(GO:0099602) |
| 0.1 | 1.2 | GO:0005347 | ATP transmembrane transporter activity(GO:0005347) ADP transmembrane transporter activity(GO:0015217) |
| 0.1 | 0.5 | GO:0004090 | carbonyl reductase (NADPH) activity(GO:0004090) |
| 0.1 | 0.3 | GO:0036009 | protein-glutamine N-methyltransferase activity(GO:0036009) histone-glutamine methyltransferase activity(GO:1990259) |
| 0.1 | 0.3 | GO:0050252 | retinol O-fatty-acyltransferase activity(GO:0050252) |
| 0.1 | 1.6 | GO:0004143 | diacylglycerol kinase activity(GO:0004143) |
| 0.1 | 0.9 | GO:0019534 | toxin transporter activity(GO:0019534) |
| 0.1 | 0.4 | GO:0080019 | fatty-acyl-CoA reductase (alcohol-forming) activity(GO:0080019) |
| 0.1 | 0.3 | GO:0036134 | thromboxane-A synthase activity(GO:0004796) 12-hydroxyheptadecatrienoic acid synthase activity(GO:0036134) |
| 0.1 | 1.1 | GO:0016861 | intramolecular oxidoreductase activity, interconverting aldoses and ketoses(GO:0016861) |
| 0.1 | 0.5 | GO:0004735 | pyrroline-5-carboxylate reductase activity(GO:0004735) |
| 0.1 | 1.0 | GO:0017034 | Rap guanyl-nucleotide exchange factor activity(GO:0017034) |
| 0.1 | 1.4 | GO:0001222 | transcription corepressor binding(GO:0001222) |
| 0.1 | 1.5 | GO:0019841 | retinol binding(GO:0019841) |
| 0.1 | 0.3 | GO:0035241 | protein-arginine omega-N monomethyltransferase activity(GO:0035241) |
| 0.1 | 0.7 | GO:0070097 | delta-catenin binding(GO:0070097) |
| 0.1 | 0.3 | GO:0004140 | dephospho-CoA kinase activity(GO:0004140) |
| 0.1 | 0.5 | GO:0031705 | bombesin receptor binding(GO:0031705) |
| 0.1 | 0.2 | GO:0048027 | mRNA 5'-UTR binding(GO:0048027) |
| 0.1 | 0.3 | GO:0017095 | heparan sulfate 6-O-sulfotransferase activity(GO:0017095) |
| 0.1 | 0.5 | GO:0031435 | mitogen-activated protein kinase kinase kinase binding(GO:0031435) |
| 0.1 | 0.2 | GO:0031893 | vasopressin receptor binding(GO:0031893) |
| 0.1 | 0.3 | GO:0008476 | protein-tyrosine sulfotransferase activity(GO:0008476) |
| 0.1 | 0.4 | GO:0047820 | D-glutamate cyclase activity(GO:0047820) |
| 0.1 | 0.5 | GO:0051185 | coenzyme transporter activity(GO:0051185) |
| 0.1 | 0.4 | GO:0004117 | calmodulin-dependent cyclic-nucleotide phosphodiesterase activity(GO:0004117) |
| 0.1 | 0.1 | GO:0051765 | inositol tetrakisphosphate kinase activity(GO:0051765) |
| 0.1 | 0.4 | GO:0004830 | tryptophan-tRNA ligase activity(GO:0004830) |
| 0.1 | 0.5 | GO:0008269 | JAK pathway signal transduction adaptor activity(GO:0008269) |
| 0.1 | 0.2 | GO:0034979 | NAD-dependent protein deacetylase activity(GO:0034979) |
| 0.1 | 0.2 | GO:0051219 | phosphoprotein binding(GO:0051219) |
| 0.1 | 0.2 | GO:0004947 | bradykinin receptor activity(GO:0004947) |
| 0.1 | 4.5 | GO:0001784 | phosphotyrosine binding(GO:0001784) |
| 0.1 | 0.6 | GO:0032794 | GTPase activating protein binding(GO:0032794) |
| 0.1 | 0.2 | GO:0045155 | electron transporter, transferring electrons from CoQH2-cytochrome c reductase complex and cytochrome c oxidase complex activity(GO:0045155) |
| 0.1 | 0.4 | GO:0004301 | epoxide hydrolase activity(GO:0004301) |
| 0.1 | 0.2 | GO:0071885 | N-terminal protein N-methyltransferase activity(GO:0071885) |
| 0.1 | 0.6 | GO:0035005 | 1-phosphatidylinositol-4-phosphate 3-kinase activity(GO:0035005) |
| 0.1 | 4.0 | GO:0061650 | ubiquitin-like protein conjugating enzyme activity(GO:0061650) |
| 0.1 | 8.0 | GO:0003730 | mRNA 3'-UTR binding(GO:0003730) |
| 0.1 | 0.5 | GO:0003998 | acylphosphatase activity(GO:0003998) |
| 0.1 | 1.1 | GO:0030618 | transforming growth factor beta receptor, pathway-specific cytoplasmic mediator activity(GO:0030618) |
| 0.1 | 0.3 | GO:0060422 | peptidyl-dipeptidase inhibitor activity(GO:0060422) |
| 0.1 | 0.2 | GO:0046848 | hydroxyapatite binding(GO:0046848) |
| 0.1 | 0.2 | GO:0034038 | deoxyhypusine synthase activity(GO:0034038) |
| 0.1 | 0.2 | GO:0033858 | N-acetylgalactosamine kinase activity(GO:0033858) |
| 0.1 | 0.3 | GO:0004657 | proline dehydrogenase activity(GO:0004657) |
| 0.1 | 0.5 | GO:0070300 | phosphatidic acid binding(GO:0070300) |
| 0.1 | 0.5 | GO:0010385 | double-stranded methylated DNA binding(GO:0010385) |
| 0.1 | 0.3 | GO:0008112 | nicotinamide N-methyltransferase activity(GO:0008112) pyridine N-methyltransferase activity(GO:0030760) |
| 0.1 | 0.2 | GO:0004731 | purine-nucleoside phosphorylase activity(GO:0004731) |
| 0.1 | 0.2 | GO:0004030 | aldehyde dehydrogenase [NAD(P)+] activity(GO:0004030) |
| 0.1 | 0.2 | GO:0003863 | alpha-ketoacid dehydrogenase activity(GO:0003826) 3-methyl-2-oxobutanoate dehydrogenase (2-methylpropanoyl-transferring) activity(GO:0003863) |
| 0.1 | 0.7 | GO:0031013 | troponin I binding(GO:0031013) |
| 0.1 | 0.2 | GO:0017057 | 6-phosphogluconolactonase activity(GO:0017057) |
| 0.1 | 0.4 | GO:0070905 | serine binding(GO:0070905) |
| 0.1 | 0.2 | GO:0016517 | interleukin-12 receptor activity(GO:0016517) |
| 0.1 | 0.1 | GO:0044388 | small protein activating enzyme binding(GO:0044388) |
| 0.1 | 0.3 | GO:0003963 | RNA-3'-phosphate cyclase activity(GO:0003963) |
| 0.1 | 0.5 | GO:0015119 | hexose phosphate transmembrane transporter activity(GO:0015119) organophosphate:inorganic phosphate antiporter activity(GO:0015315) hexose-phosphate:inorganic phosphate antiporter activity(GO:0015526) glucose 6-phosphate:inorganic phosphate antiporter activity(GO:0061513) |
| 0.1 | 0.1 | GO:0016273 | arginine N-methyltransferase activity(GO:0016273) protein-arginine N-methyltransferase activity(GO:0016274) |
| 0.1 | 0.3 | GO:1901375 | acetylcholine transmembrane transporter activity(GO:0005277) acetate ester transmembrane transporter activity(GO:1901375) |
| 0.1 | 0.4 | GO:0070095 | fructose-6-phosphate binding(GO:0070095) |
| 0.1 | 0.1 | GO:0004611 | phosphoenolpyruvate carboxykinase activity(GO:0004611) phosphoenolpyruvate carboxykinase (GTP) activity(GO:0004613) |
| 0.1 | 0.3 | GO:0004449 | isocitrate dehydrogenase (NAD+) activity(GO:0004449) |
| 0.1 | 0.3 | GO:0035515 | oxidative RNA demethylase activity(GO:0035515) |
| 0.1 | 0.8 | GO:0008199 | ferric iron binding(GO:0008199) |
| 0.1 | 2.8 | GO:0003899 | DNA-directed RNA polymerase activity(GO:0003899) |
| 0.1 | 0.8 | GO:0019855 | calcium channel inhibitor activity(GO:0019855) |
| 0.1 | 0.7 | GO:0098632 | protein binding involved in cell-cell adhesion(GO:0098632) |
| 0.1 | 1.7 | GO:0016502 | purinergic nucleotide receptor activity(GO:0001614) nucleotide receptor activity(GO:0016502) |
| 0.1 | 0.1 | GO:0070325 | lipoprotein particle receptor binding(GO:0070325) |
| 0.1 | 1.9 | GO:0046875 | ephrin receptor binding(GO:0046875) |
| 0.1 | 0.2 | GO:0015141 | succinate transmembrane transporter activity(GO:0015141) |
| 0.1 | 0.4 | GO:0030348 | syntaxin-3 binding(GO:0030348) |
| 0.1 | 1.0 | GO:0050998 | nitric-oxide synthase binding(GO:0050998) |
| 0.1 | 0.6 | GO:0045294 | alpha-catenin binding(GO:0045294) |
| 0.1 | 0.3 | GO:0070180 | large ribosomal subunit rRNA binding(GO:0070180) |
| 0.1 | 1.6 | GO:0030553 | cGMP binding(GO:0030553) |
| 0.1 | 0.8 | GO:0070883 | pre-miRNA binding(GO:0070883) |
| 0.1 | 0.1 | GO:0019206 | nucleoside kinase activity(GO:0019206) |
| 0.1 | 1.1 | GO:0030280 | structural constituent of epidermis(GO:0030280) |
| 0.1 | 0.4 | GO:0004084 | branched-chain-amino-acid transaminase activity(GO:0004084) L-leucine transaminase activity(GO:0052654) L-valine transaminase activity(GO:0052655) L-isoleucine transaminase activity(GO:0052656) |
| 0.1 | 0.6 | GO:0008158 | hedgehog receptor activity(GO:0008158) |
| 0.1 | 0.2 | GO:0031071 | cysteine desulfurase activity(GO:0031071) |
| 0.1 | 0.3 | GO:0044020 | histone methyltransferase activity (H4-R3 specific)(GO:0044020) |
| 0.1 | 0.8 | GO:0017110 | nucleoside-diphosphatase activity(GO:0017110) |
| 0.1 | 0.1 | GO:0019966 | interleukin-1 binding(GO:0019966) |
| 0.1 | 1.1 | GO:0032454 | histone demethylase activity (H3-K9 specific)(GO:0032454) |
| 0.1 | 2.0 | GO:0030296 | protein tyrosine kinase activator activity(GO:0030296) |
| 0.1 | 0.8 | GO:0005068 | transmembrane receptor protein tyrosine kinase adaptor activity(GO:0005068) |
| 0.1 | 0.3 | GO:0033829 | O-fucosylpeptide 3-beta-N-acetylglucosaminyltransferase activity(GO:0033829) |
| 0.1 | 0.1 | GO:0050405 | [hydroxymethylglutaryl-CoA reductase (NADPH)] kinase activity(GO:0047322) [acetyl-CoA carboxylase] kinase activity(GO:0050405) |
| 0.1 | 0.8 | GO:0097322 | 7SK snRNA binding(GO:0097322) |
| 0.1 | 0.2 | GO:0071532 | ankyrin repeat binding(GO:0071532) |
| 0.1 | 0.3 | GO:0004995 | tachykinin receptor activity(GO:0004995) |
| 0.1 | 0.4 | GO:0016433 | rRNA (adenine) methyltransferase activity(GO:0016433) |
| 0.1 | 0.9 | GO:0035259 | glucocorticoid receptor binding(GO:0035259) |
| 0.1 | 1.3 | GO:0050811 | GABA receptor binding(GO:0050811) |
| 0.1 | 0.3 | GO:0015254 | glycerol channel activity(GO:0015254) |
| 0.1 | 0.5 | GO:0004826 | phenylalanine-tRNA ligase activity(GO:0004826) |
| 0.1 | 1.7 | GO:0003705 | transcription factor activity, RNA polymerase II distal enhancer sequence-specific binding(GO:0003705) |
| 0.1 | 0.2 | GO:0030506 | ankyrin binding(GO:0030506) |
| 0.1 | 0.7 | GO:0008525 | phosphatidylcholine transporter activity(GO:0008525) |
| 0.1 | 0.6 | GO:0000987 | core promoter proximal region sequence-specific DNA binding(GO:0000987) |
| 0.1 | 0.9 | GO:0001206 | transcriptional repressor activity, RNA polymerase II distal enhancer sequence-specific binding(GO:0001206) |
| 0.1 | 0.3 | GO:0008483 | transaminase activity(GO:0008483) |
| 0.1 | 0.5 | GO:0004887 | thyroid hormone receptor activity(GO:0004887) |
| 0.1 | 0.9 | GO:0019213 | deacetylase activity(GO:0019213) |
| 0.1 | 0.4 | GO:0050816 | phosphothreonine binding(GO:0050816) |
| 0.1 | 0.7 | GO:0070412 | R-SMAD binding(GO:0070412) |
| 0.1 | 3.3 | GO:0005484 | SNAP receptor activity(GO:0005484) |
| 0.1 | 0.4 | GO:0008940 | nitrate reductase activity(GO:0008940) |
| 0.1 | 0.5 | GO:0004126 | cytidine deaminase activity(GO:0004126) |
| 0.1 | 0.2 | GO:0004853 | uroporphyrinogen decarboxylase activity(GO:0004853) |
| 0.1 | 1.0 | GO:0004691 | cAMP-dependent protein kinase activity(GO:0004691) |
| 0.1 | 0.4 | GO:0030620 | U2 snRNA binding(GO:0030620) |
| 0.1 | 1.2 | GO:0034450 | ubiquitin-ubiquitin ligase activity(GO:0034450) |
| 0.1 | 4.5 | GO:0019003 | GDP binding(GO:0019003) |
| 0.1 | 0.4 | GO:0004814 | arginine-tRNA ligase activity(GO:0004814) |
| 0.1 | 1.3 | GO:0051400 | BH domain binding(GO:0051400) |
| 0.1 | 0.6 | GO:0004983 | neuropeptide Y receptor activity(GO:0004983) |
| 0.1 | 1.1 | GO:0004535 | poly(A)-specific ribonuclease activity(GO:0004535) |
| 0.1 | 0.4 | GO:0016657 | GMP reductase activity(GO:0003920) oxidoreductase activity, acting on NAD(P)H, nitrogenous group as acceptor(GO:0016657) |
| 0.1 | 0.9 | GO:0033691 | sialic acid binding(GO:0033691) |
| 0.1 | 1.1 | GO:0050321 | tau-protein kinase activity(GO:0050321) |
| 0.1 | 0.6 | GO:1990226 | histone methyltransferase binding(GO:1990226) |
| 0.1 | 0.5 | GO:0001162 | RNA polymerase II intronic transcription regulatory region sequence-specific DNA binding(GO:0001162) |
| 0.1 | 0.2 | GO:0001034 | RNA polymerase III transcription factor activity, sequence-specific DNA binding(GO:0001034) |
| 0.1 | 0.3 | GO:0070728 | leucine binding(GO:0070728) |
| 0.1 | 0.4 | GO:0017018 | myosin phosphatase activity(GO:0017018) |
| 0.1 | 0.4 | GO:0045505 | dynein intermediate chain binding(GO:0045505) |
| 0.1 | 0.2 | GO:0010521 | telomerase inhibitor activity(GO:0010521) |
| 0.1 | 0.3 | GO:0043008 | ATP-dependent protein binding(GO:0043008) |
| 0.1 | 0.1 | GO:0050840 | extracellular matrix binding(GO:0050840) |
| 0.1 | 0.3 | GO:1990430 | extracellular matrix protein binding(GO:1990430) |
| 0.1 | 0.7 | GO:0050664 | oxidoreductase activity, acting on NAD(P)H, oxygen as acceptor(GO:0050664) |
| 0.1 | 0.2 | GO:0042043 | neurexin family protein binding(GO:0042043) |
| 0.1 | 0.4 | GO:0033743 | peptide-methionine (R)-S-oxide reductase activity(GO:0033743) |
| 0.1 | 0.1 | GO:0035651 | AP-3 adaptor complex binding(GO:0035651) |
| 0.1 | 4.0 | GO:0017112 | Rab guanyl-nucleotide exchange factor activity(GO:0017112) |
| 0.1 | 0.9 | GO:0015035 | protein disulfide oxidoreductase activity(GO:0015035) |
| 0.1 | 0.2 | GO:1990825 | sequence-specific mRNA binding(GO:1990825) |
| 0.1 | 0.7 | GO:0008503 | benzodiazepine receptor activity(GO:0008503) |
| 0.1 | 0.3 | GO:0004679 | AMP-activated protein kinase activity(GO:0004679) |
| 0.1 | 0.5 | GO:0102336 | fatty acid elongase activity(GO:0009922) 3-oxo-arachidoyl-CoA synthase activity(GO:0102336) 3-oxo-cerotoyl-CoA synthase activity(GO:0102337) 3-oxo-lignoceronyl-CoA synthase activity(GO:0102338) |
| 0.1 | 0.2 | GO:0004663 | Rab geranylgeranyltransferase activity(GO:0004663) |
| 0.1 | 0.6 | GO:0071933 | Arp2/3 complex binding(GO:0071933) |
| 0.1 | 0.5 | GO:0004457 | lactate dehydrogenase activity(GO:0004457) |
| 0.1 | 0.2 | GO:0042134 | rRNA primary transcript binding(GO:0042134) |
| 0.1 | 0.2 | GO:0016495 | C-X3-C chemokine receptor activity(GO:0016495) |
| 0.1 | 0.3 | GO:0004161 | dimethylallyltranstransferase activity(GO:0004161) geranyltranstransferase activity(GO:0004337) |
| 0.1 | 1.5 | GO:0051537 | 2 iron, 2 sulfur cluster binding(GO:0051537) |
| 0.1 | 0.2 | GO:0061629 | RNA polymerase II sequence-specific DNA binding transcription factor binding(GO:0061629) |
| 0.1 | 0.3 | GO:0030613 | oxidoreductase activity, acting on phosphorus or arsenic in donors(GO:0030613) oxidoreductase activity, acting on phosphorus or arsenic in donors, disulfide as acceptor(GO:0030614) |
| 0.1 | 0.7 | GO:0019215 | intermediate filament binding(GO:0019215) |
| 0.1 | 0.4 | GO:0061665 | SUMO ligase activity(GO:0061665) |
| 0.1 | 0.4 | GO:0016015 | morphogen activity(GO:0016015) |
| 0.1 | 0.2 | GO:0004937 | alpha1-adrenergic receptor activity(GO:0004937) |
| 0.1 | 0.4 | GO:0000340 | RNA 7-methylguanosine cap binding(GO:0000340) |
| 0.1 | 0.3 | GO:0050294 | steroid sulfotransferase activity(GO:0050294) |
| 0.1 | 4.4 | GO:0005070 | SH3/SH2 adaptor activity(GO:0005070) |
| 0.1 | 0.2 | GO:0052836 | inositol 5-diphosphate pentakisphosphate 5-kinase activity(GO:0052836) inositol diphosphate tetrakisphosphate kinase activity(GO:0052839) |
| 0.1 | 0.8 | GO:0031702 | type 1 angiotensin receptor binding(GO:0031702) |
| 0.1 | 1.9 | GO:0043015 | gamma-tubulin binding(GO:0043015) |
| 0.1 | 0.8 | GO:0019911 | structural constituent of myelin sheath(GO:0019911) |
| 0.1 | 0.7 | GO:0030159 | receptor signaling complex scaffold activity(GO:0030159) |
| 0.1 | 0.2 | GO:0070362 | mitochondrial light strand promoter anti-sense binding(GO:0070361) mitochondrial heavy strand promoter anti-sense binding(GO:0070362) mitochondrial heavy strand promoter sense binding(GO:0070364) |
| 0.1 | 2.0 | GO:0051959 | dynein light intermediate chain binding(GO:0051959) |
| 0.1 | 1.5 | GO:0016505 | peptidase activator activity involved in apoptotic process(GO:0016505) |
| 0.1 | 0.2 | GO:0003858 | 3-hydroxybutyrate dehydrogenase activity(GO:0003858) |
| 0.1 | 0.4 | GO:0017150 | tRNA dihydrouridine synthase activity(GO:0017150) |
| 0.1 | 0.1 | GO:0010857 | calcium-dependent protein kinase activity(GO:0010857) |
| 0.1 | 0.7 | GO:0004723 | calcium-dependent protein serine/threonine phosphatase activity(GO:0004723) |
| 0.1 | 0.8 | GO:0004861 | cyclin-dependent protein serine/threonine kinase inhibitor activity(GO:0004861) |
| 0.1 | 0.6 | GO:0015266 | protein channel activity(GO:0015266) |
| 0.1 | 0.2 | GO:0016401 | palmitoyl-CoA oxidase activity(GO:0016401) |
| 0.1 | 0.2 | GO:0030619 | U1 snRNA binding(GO:0030619) |
| 0.1 | 0.2 | GO:0004022 | alcohol dehydrogenase (NAD) activity(GO:0004022) |
| 0.1 | 12.7 | GO:0003735 | structural constituent of ribosome(GO:0003735) |
| 0.1 | 0.1 | GO:0097363 | protein O-GlcNAc transferase activity(GO:0097363) |
| 0.1 | 0.3 | GO:0005324 | long-chain fatty acid transporter activity(GO:0005324) |
| 0.1 | 1.2 | GO:0004602 | glutathione peroxidase activity(GO:0004602) |
| 0.1 | 0.1 | GO:0050682 | AF-2 domain binding(GO:0050682) |
| 0.1 | 0.1 | GO:0004618 | phosphoglycerate kinase activity(GO:0004618) |
| 0.1 | 1.4 | GO:0051428 | peptide hormone receptor binding(GO:0051428) |
| 0.1 | 0.8 | GO:0001223 | transcription coactivator binding(GO:0001223) |
| 0.1 | 0.4 | GO:0032396 | inhibitory MHC class I receptor activity(GO:0032396) |
| 0.1 | 0.2 | GO:0001016 | RNA polymerase III regulatory region DNA binding(GO:0001016) |
| 0.1 | 2.1 | GO:0005164 | tumor necrosis factor receptor binding(GO:0005164) |
| 0.1 | 0.4 | GO:0042978 | ornithine decarboxylase activator activity(GO:0042978) |
| 0.0 | 5.5 | GO:0001158 | enhancer sequence-specific DNA binding(GO:0001158) |
| 0.0 | 0.3 | GO:0070740 | protein-glutamic acid ligase activity(GO:0070739) tubulin-glutamic acid ligase activity(GO:0070740) |
| 0.0 | 0.1 | GO:0034511 | U3 snoRNA binding(GO:0034511) |
| 0.0 | 0.3 | GO:0009374 | biotin binding(GO:0009374) |
| 0.0 | 3.0 | GO:0004715 | non-membrane spanning protein tyrosine kinase activity(GO:0004715) |
| 0.0 | 0.1 | GO:0004029 | aldehyde dehydrogenase (NAD) activity(GO:0004029) |
| 0.0 | 0.6 | GO:0017070 | U6 snRNA binding(GO:0017070) |
| 0.0 | 2.4 | GO:0030507 | spectrin binding(GO:0030507) |
| 0.0 | 0.1 | GO:0050528 | acyloxyacyl hydrolase activity(GO:0050528) |
| 0.0 | 0.5 | GO:0016846 | carbon-sulfur lyase activity(GO:0016846) |
| 0.0 | 0.0 | GO:0016863 | intramolecular oxidoreductase activity, transposing C=C bonds(GO:0016863) |
| 0.0 | 0.1 | GO:0031748 | D1 dopamine receptor binding(GO:0031748) |
| 0.0 | 0.0 | GO:0008527 | taste receptor activity(GO:0008527) |
| 0.0 | 0.5 | GO:0032190 | acrosin binding(GO:0032190) |
| 0.0 | 0.3 | GO:0000213 | tRNA-intron endonuclease activity(GO:0000213) |
| 0.0 | 0.1 | GO:0071535 | RING-like zinc finger domain binding(GO:0071535) |
| 0.0 | 0.1 | GO:0032217 | riboflavin transporter activity(GO:0032217) |
| 0.0 | 0.7 | GO:0042609 | CD4 receptor binding(GO:0042609) |
| 0.0 | 0.2 | GO:1990460 | leptin receptor binding(GO:1990460) |
| 0.0 | 2.6 | GO:0008137 | NADH dehydrogenase (ubiquinone) activity(GO:0008137) NADH dehydrogenase (quinone) activity(GO:0050136) |
| 0.0 | 1.4 | GO:0004298 | threonine-type endopeptidase activity(GO:0004298) threonine-type peptidase activity(GO:0070003) |
| 0.0 | 0.2 | GO:0009019 | tRNA (guanine-N1-)-methyltransferase activity(GO:0009019) |
| 0.0 | 0.3 | GO:0008569 | ATP-dependent microtubule motor activity, minus-end-directed(GO:0008569) |
| 0.0 | 0.1 | GO:0016646 | oxidoreductase activity, acting on the CH-NH group of donors, NAD or NADP as acceptor(GO:0016646) |
| 0.0 | 0.2 | GO:0004132 | dCMP deaminase activity(GO:0004132) |
| 0.0 | 2.5 | GO:0042379 | chemokine receptor binding(GO:0042379) |
| 0.0 | 2.2 | GO:0044390 | ubiquitin-like protein conjugating enzyme binding(GO:0044390) |
| 0.0 | 1.0 | GO:0008187 | poly-pyrimidine tract binding(GO:0008187) |
| 0.0 | 1.5 | GO:0043027 | cysteine-type endopeptidase inhibitor activity involved in apoptotic process(GO:0043027) |
| 0.0 | 0.9 | GO:0005123 | death receptor binding(GO:0005123) |
| 0.0 | 0.2 | GO:0036312 | phosphatidylinositol 3-kinase regulatory subunit binding(GO:0036312) |
| 0.0 | 2.3 | GO:0097110 | scaffold protein binding(GO:0097110) |
| 0.0 | 3.7 | GO:0004722 | protein serine/threonine phosphatase activity(GO:0004722) |
| 0.0 | 0.1 | GO:0004730 | pseudouridylate synthase activity(GO:0004730) |
| 0.0 | 0.2 | GO:0032183 | SUMO binding(GO:0032183) |
| 0.0 | 1.2 | GO:0005251 | delayed rectifier potassium channel activity(GO:0005251) |
| 0.0 | 0.1 | GO:0070643 | vitamin D3 25-hydroxylase activity(GO:0030343) vitamin D 25-hydroxylase activity(GO:0070643) |
| 0.0 | 0.1 | GO:0016882 | cyclo-ligase activity(GO:0016882) |
| 0.0 | 0.4 | GO:0043121 | neurotrophin binding(GO:0043121) |
| 0.0 | 0.9 | GO:0005246 | calcium channel regulator activity(GO:0005246) |
| 0.0 | 0.2 | GO:0004485 | methylcrotonoyl-CoA carboxylase activity(GO:0004485) |
| 0.0 | 0.0 | GO:0015245 | fatty acid transporter activity(GO:0015245) |
| 0.0 | 0.1 | GO:0003945 | N-acetyllactosamine synthase activity(GO:0003945) |
| 0.0 | 0.3 | GO:0070840 | dynein complex binding(GO:0070840) |
| 0.0 | 0.2 | GO:0000182 | rDNA binding(GO:0000182) |
| 0.0 | 0.1 | GO:0004817 | cysteine-tRNA ligase activity(GO:0004817) |
| 0.0 | 0.1 | GO:0004609 | phosphatidylserine decarboxylase activity(GO:0004609) |
| 0.0 | 0.2 | GO:0008336 | gamma-butyrobetaine dioxygenase activity(GO:0008336) |
| 0.0 | 0.2 | GO:0008140 | cAMP response element binding protein binding(GO:0008140) |
| 0.0 | 0.2 | GO:0003976 | UDP-N-acetylglucosamine-lysosomal-enzyme N-acetylglucosaminephosphotransferase activity(GO:0003976) |
| 0.0 | 0.3 | GO:0061133 | endopeptidase activator activity(GO:0061133) |
| 0.0 | 0.2 | GO:0046979 | TAP2 binding(GO:0046979) |
| 0.0 | 0.2 | GO:0043023 | ribosomal large subunit binding(GO:0043023) |
| 0.0 | 2.7 | GO:0048306 | calcium-dependent protein binding(GO:0048306) |
| 0.0 | 5.3 | GO:0004867 | serine-type endopeptidase inhibitor activity(GO:0004867) |
| 0.0 | 0.4 | GO:1990381 | ubiquitin-specific protease binding(GO:1990381) |
| 0.0 | 1.4 | GO:0017025 | TBP-class protein binding(GO:0017025) |
| 0.0 | 0.7 | GO:0003906 | DNA-(apurinic or apyrimidinic site) lyase activity(GO:0003906) |
| 0.0 | 0.2 | GO:0043141 | ATP-dependent 5'-3' DNA helicase activity(GO:0043141) |
| 0.0 | 0.2 | GO:0004991 | parathyroid hormone receptor activity(GO:0004991) |
| 0.0 | 0.0 | GO:0008169 | C-methyltransferase activity(GO:0008169) |
| 0.0 | 0.1 | GO:0004999 | vasoactive intestinal polypeptide receptor activity(GO:0004999) |
| 0.0 | 0.3 | GO:0008865 | glucokinase activity(GO:0004340) hexokinase activity(GO:0004396) fructokinase activity(GO:0008865) mannokinase activity(GO:0019158) |
| 0.0 | 0.2 | GO:0004536 | deoxyribonuclease activity(GO:0004536) |
| 0.0 | 0.1 | GO:0004608 | phosphatidyl-N-methylethanolamine N-methyltransferase activity(GO:0000773) phosphatidylethanolamine N-methyltransferase activity(GO:0004608) phosphatidyl-N-dimethylethanolamine N-methyltransferase activity(GO:0080101) |
| 0.0 | 0.2 | GO:0089720 | caspase binding(GO:0089720) |
| 0.0 | 0.2 | GO:0032810 | sterol response element binding(GO:0032810) |
| 0.0 | 0.4 | GO:0046975 | histone methyltransferase activity (H3-K36 specific)(GO:0046975) |
| 0.0 | 0.4 | GO:0016783 | sulfurtransferase activity(GO:0016783) |
| 0.0 | 0.2 | GO:0004040 | amidase activity(GO:0004040) |
| 0.0 | 0.1 | GO:0032184 | SUMO polymer binding(GO:0032184) |
| 0.0 | 0.1 | GO:0016426 | tRNA (adenine) methyltransferase activity(GO:0016426) tRNA (adenine-N1-)-methyltransferase activity(GO:0016429) |
| 0.0 | 2.6 | GO:0000979 | RNA polymerase II core promoter sequence-specific DNA binding(GO:0000979) |
| 0.0 | 0.0 | GO:0003828 | alpha-N-acetylneuraminate alpha-2,8-sialyltransferase activity(GO:0003828) |
| 0.0 | 0.5 | GO:0097109 | neuroligin family protein binding(GO:0097109) |
| 0.0 | 0.2 | GO:0016316 | phosphatidylinositol-3,4-bisphosphate 4-phosphatase activity(GO:0016316) inositol-1,3,4-trisphosphate 4-phosphatase activity(GO:0017161) inositol-3,4-bisphosphate 4-phosphatase activity(GO:0052828) |
| 0.0 | 0.5 | GO:0008190 | eukaryotic initiation factor 4E binding(GO:0008190) |
| 0.0 | 0.2 | GO:0016922 | ligand-dependent nuclear receptor binding(GO:0016922) |
| 0.0 | 0.6 | GO:0017091 | AU-rich element binding(GO:0017091) |
| 0.0 | 0.3 | GO:0004499 | N,N-dimethylaniline monooxygenase activity(GO:0004499) |
| 0.0 | 0.1 | GO:0004813 | alanine-tRNA ligase activity(GO:0004813) |
| 0.0 | 1.1 | GO:0005154 | epidermal growth factor receptor binding(GO:0005154) |
| 0.0 | 0.4 | GO:0004707 | MAP kinase activity(GO:0004707) |
| 0.0 | 0.1 | GO:0004793 | glycine hydroxymethyltransferase activity(GO:0004372) threonine aldolase activity(GO:0004793) L-allo-threonine aldolase activity(GO:0008732) |
| 0.0 | 0.1 | GO:0004139 | deoxyribose-phosphate aldolase activity(GO:0004139) |
| 0.0 | 0.1 | GO:0004774 | succinate-CoA ligase activity(GO:0004774) succinate-CoA ligase (ADP-forming) activity(GO:0004775) |
| 0.0 | 0.3 | GO:0016765 | transferase activity, transferring alkyl or aryl (other than methyl) groups(GO:0016765) |
| 0.0 | 0.1 | GO:0070538 | oleic acid binding(GO:0070538) |
| 0.0 | 0.0 | GO:0035368 | selenocysteine insertion sequence binding(GO:0035368) |
| 0.0 | 0.1 | GO:0071558 | histone demethylase activity (H3-K27 specific)(GO:0071558) |
| 0.0 | 0.4 | GO:0016888 | endodeoxyribonuclease activity, producing 5'-phosphomonoesters(GO:0016888) |
| 0.0 | 0.5 | GO:0001087 | transcription factor activity, sequence-specific DNA binding, RNA polymerase recruiting(GO:0001011) transcription factor activity, TFIIB-class binding(GO:0001087) |
| 0.0 | 0.1 | GO:0003747 | translation release factor activity(GO:0003747) translation termination factor activity(GO:0008079) |
| 0.0 | 0.4 | GO:0031492 | nucleosomal DNA binding(GO:0031492) |
| 0.0 | 0.1 | GO:0016624 | oxidoreductase activity, acting on the aldehyde or oxo group of donors, disulfide as acceptor(GO:0016624) |
| 0.0 | 0.0 | GO:0032089 | NACHT domain binding(GO:0032089) |
| 0.0 | 3.1 | GO:0004843 | thiol-dependent ubiquitin-specific protease activity(GO:0004843) |
| 0.0 | 1.5 | GO:0003785 | actin monomer binding(GO:0003785) |
| 0.0 | 0.2 | GO:0035257 | nuclear hormone receptor binding(GO:0035257) hormone receptor binding(GO:0051427) |
| 0.0 | 0.2 | GO:0015321 | sodium-dependent phosphate transmembrane transporter activity(GO:0015321) |
| 0.0 | 0.1 | GO:0032036 | myosin heavy chain binding(GO:0032036) |
| 0.0 | 10.4 | GO:0004252 | serine-type endopeptidase activity(GO:0004252) |
| 0.0 | 0.2 | GO:0003954 | NADH dehydrogenase activity(GO:0003954) |
| 0.0 | 0.1 | GO:0001047 | core promoter binding(GO:0001047) |
| 0.0 | 1.6 | GO:0019894 | kinesin binding(GO:0019894) |
| 0.0 | 0.3 | GO:0004726 | non-membrane spanning protein tyrosine phosphatase activity(GO:0004726) |
| 0.0 | 0.1 | GO:0008267 | poly-glutamine tract binding(GO:0008267) |
| 0.0 | 0.1 | GO:0015218 | pyrimidine nucleotide transmembrane transporter activity(GO:0015218) |
| 0.0 | 0.0 | GO:0030229 | very-low-density lipoprotein particle receptor activity(GO:0030229) |
| 0.0 | 0.8 | GO:0010485 | H4 histone acetyltransferase activity(GO:0010485) |
| 0.0 | 0.6 | GO:0008417 | fucosyltransferase activity(GO:0008417) |
| 0.0 | 0.1 | GO:0035242 | protein-arginine omega-N asymmetric methyltransferase activity(GO:0035242) |
| 0.0 | 0.0 | GO:0004430 | 1-phosphatidylinositol 4-kinase activity(GO:0004430) |
| 0.0 | 0.1 | GO:0016635 | oxidoreductase activity, acting on the CH-CH group of donors, quinone or related compound as acceptor(GO:0016635) |
| 0.0 | 0.2 | GO:0060002 | plus-end directed microfilament motor activity(GO:0060002) |
| 0.0 | 1.3 | GO:0016811 | hydrolase activity, acting on carbon-nitrogen (but not peptide) bonds, in linear amides(GO:0016811) |
| 0.0 | 0.0 | GO:0004427 | inorganic diphosphatase activity(GO:0004427) |
| 0.0 | 0.3 | GO:0004300 | enoyl-CoA hydratase activity(GO:0004300) |
| 0.0 | 0.1 | GO:0004711 | ribosomal protein S6 kinase activity(GO:0004711) |
| 0.0 | 0.6 | GO:0042813 | Wnt-activated receptor activity(GO:0042813) |
| 0.0 | 0.1 | GO:0047894 | flavonol 3-sulfotransferase activity(GO:0047894) |
| 0.0 | 0.2 | GO:0030291 | protein serine/threonine kinase inhibitor activity(GO:0030291) |
| 0.0 | 0.2 | GO:0001102 | RNA polymerase II activating transcription factor binding(GO:0001102) |
| 0.0 | 0.2 | GO:0050253 | retinyl-palmitate esterase activity(GO:0050253) |
| 0.0 | 0.6 | GO:0016881 | acid-amino acid ligase activity(GO:0016881) |
| 0.0 | 0.2 | GO:0016167 | glial cell-derived neurotrophic factor receptor activity(GO:0016167) |
| 0.0 | 0.2 | GO:0030942 | endoplasmic reticulum signal peptide binding(GO:0030942) |
| 0.0 | 0.3 | GO:0035325 | Toll-like receptor binding(GO:0035325) |
| 0.0 | 0.1 | GO:0034191 | apolipoprotein A-I receptor binding(GO:0034191) |
| 0.0 | 0.4 | GO:0000339 | RNA cap binding(GO:0000339) |
| 0.0 | 0.4 | GO:0010314 | phosphatidylinositol-5-phosphate binding(GO:0010314) |
| 0.0 | 0.8 | GO:0004683 | calmodulin-dependent protein kinase activity(GO:0004683) |
| 0.0 | 0.2 | GO:0016434 | rRNA (cytosine) methyltransferase activity(GO:0016434) |
| 0.0 | 0.0 | GO:0035174 | histone serine kinase activity(GO:0035174) |
| 0.0 | 0.1 | GO:0019239 | deaminase activity(GO:0019239) |
| 0.0 | 0.1 | GO:0052870 | tocopherol omega-hydroxylase activity(GO:0052870) alpha-tocopherol omega-hydroxylase activity(GO:0052871) 20-hydroxy-leukotriene B4 omega oxidase activity(GO:0097258) 20-aldehyde-leukotriene B4 20-monooxygenase activity(GO:0097259) |
| 0.0 | 0.1 | GO:0061575 | cyclin-dependent protein serine/threonine kinase activator activity(GO:0061575) |
| 0.0 | 0.1 | GO:0005111 | type 2 fibroblast growth factor receptor binding(GO:0005111) |
| 0.0 | 0.1 | GO:0061676 | importin-alpha family protein binding(GO:0061676) |
| 0.0 | 0.7 | GO:0043325 | phosphatidylinositol-3,4-bisphosphate binding(GO:0043325) |
| 0.0 | 0.0 | GO:0030621 | U4 snRNA binding(GO:0030621) |
| 0.0 | 0.1 | GO:0005275 | amine transmembrane transporter activity(GO:0005275) |
| 0.0 | 0.4 | GO:0071837 | HMG box domain binding(GO:0071837) |
| 0.0 | 0.1 | GO:0004057 | arginyltransferase activity(GO:0004057) |
| 0.0 | 0.3 | GO:0042834 | peptidoglycan binding(GO:0042834) |
| 0.0 | 0.5 | GO:0034237 | protein kinase A regulatory subunit binding(GO:0034237) |
| 0.0 | 1.3 | GO:0003743 | translation initiation factor activity(GO:0003743) |
| 0.0 | 0.1 | GO:0008466 | glycogenin glucosyltransferase activity(GO:0008466) |
| 0.0 | 1.2 | GO:0050699 | WW domain binding(GO:0050699) |
| 0.0 | 0.6 | GO:0008331 | high voltage-gated calcium channel activity(GO:0008331) |
| 0.0 | 0.0 | GO:0000035 | acyl binding(GO:0000035) |
| 0.0 | 0.1 | GO:0001595 | angiotensin receptor activity(GO:0001595) angiotensin type II receptor activity(GO:0004945) |
| 0.0 | 0.0 | GO:0004450 | isocitrate dehydrogenase (NADP+) activity(GO:0004450) |
| 0.0 | 0.1 | GO:0048030 | disaccharide binding(GO:0048030) |
| 0.0 | 0.4 | GO:0004806 | triglyceride lipase activity(GO:0004806) |
| 0.0 | 0.1 | GO:0004850 | uridine phosphorylase activity(GO:0004850) |
| 0.0 | 0.1 | GO:0005280 | hydrogen:amino acid symporter activity(GO:0005280) |
| 0.0 | 0.1 | GO:0005152 | interleukin-1 receptor antagonist activity(GO:0005152) |
| 0.0 | 0.8 | GO:0005031 | tumor necrosis factor-activated receptor activity(GO:0005031) death receptor activity(GO:0005035) |
| 0.0 | 0.1 | GO:0086007 | voltage-gated calcium channel activity involved in cardiac muscle cell action potential(GO:0086007) |
| 0.0 | 0.6 | GO:0000983 | transcription factor activity, RNA polymerase II core promoter sequence-specific(GO:0000983) |
| 0.0 | 10.2 | GO:0005525 | GTP binding(GO:0005525) |
| 0.0 | 0.2 | GO:0035326 | enhancer binding(GO:0035326) |
| 0.0 | 0.3 | GO:0003951 | NAD+ kinase activity(GO:0003951) |
| 0.0 | 0.3 | GO:0030882 | lipid antigen binding(GO:0030882) endogenous lipid antigen binding(GO:0030883) exogenous lipid antigen binding(GO:0030884) lipopeptide binding(GO:0071723) |
| 0.0 | 0.1 | GO:0003875 | ADP-ribosylarginine hydrolase activity(GO:0003875) |
| 0.0 | 0.1 | GO:0016595 | glutamate binding(GO:0016595) |
| 0.0 | 0.1 | GO:0004366 | glycerol-3-phosphate O-acyltransferase activity(GO:0004366) |
| 0.0 | 0.1 | GO:0005391 | sodium:potassium-exchanging ATPase activity(GO:0005391) |
| 0.0 | 0.3 | GO:0004332 | fructose-bisphosphate aldolase activity(GO:0004332) |
| 0.0 | 0.0 | GO:1901567 | icosanoid binding(GO:0050542) fatty acid derivative binding(GO:1901567) |
| 0.0 | 0.1 | GO:0001181 | transcription factor activity, core RNA polymerase I binding(GO:0001181) |
| 0.0 | 0.1 | GO:0004365 | glyceraldehyde-3-phosphate dehydrogenase (NAD+) (phosphorylating) activity(GO:0004365) glyceraldehyde-3-phosphate dehydrogenase (NAD(P)+) (phosphorylating) activity(GO:0043891) |
| 0.0 | 0.0 | GO:0035197 | siRNA binding(GO:0035197) |
| 0.0 | 0.1 | GO:0003870 | 5-aminolevulinate synthase activity(GO:0003870) N-succinyltransferase activity(GO:0016749) |
| 0.0 | 0.3 | GO:0005243 | gap junction channel activity(GO:0005243) |
| 0.0 | 1.4 | GO:0051117 | ATPase binding(GO:0051117) |
| 0.0 | 0.1 | GO:0099529 | neurotransmitter receptor activity involved in regulation of postsynaptic membrane potential(GO:0099529) transmitter-gated ion channel activity involved in regulation of postsynaptic membrane potential(GO:1904315) |
| 0.0 | 0.1 | GO:0004749 | ribose phosphate diphosphokinase activity(GO:0004749) |
| 0.0 | 0.1 | GO:0004935 | adrenergic receptor activity(GO:0004935) |
| 0.0 | 0.7 | GO:0005212 | structural constituent of eye lens(GO:0005212) |
| 0.0 | 0.1 | GO:0019166 | trans-2-enoyl-CoA reductase (NADPH) activity(GO:0019166) |
| 0.0 | 0.2 | GO:0017128 | phospholipid scramblase activity(GO:0017128) |
| 0.0 | 0.0 | GO:0015265 | urea channel activity(GO:0015265) |
| 0.0 | 0.3 | GO:0009982 | pseudouridine synthase activity(GO:0009982) |
| 0.0 | 0.1 | GO:0001515 | opioid peptide activity(GO:0001515) |
| 0.0 | 0.0 | GO:0070402 | NADPH binding(GO:0070402) |
| 0.0 | 0.2 | GO:0004527 | exonuclease activity(GO:0004527) |
| 0.0 | 0.1 | GO:0005137 | interleukin-5 receptor binding(GO:0005137) |
| 0.0 | 0.1 | GO:0005222 | intracellular cAMP activated cation channel activity(GO:0005222) |
| 0.0 | 2.2 | GO:0044325 | ion channel binding(GO:0044325) |
| 0.0 | 0.2 | GO:0036132 | 13-prostaglandin reductase activity(GO:0036132) 15-oxoprostaglandin 13-oxidase activity(GO:0047522) |
| 0.0 | 0.3 | GO:0015143 | urate transmembrane transporter activity(GO:0015143) salt transmembrane transporter activity(GO:1901702) |
| 0.0 | 0.0 | GO:0032422 | purine-rich negative regulatory element binding(GO:0032422) |
| 0.0 | 0.1 | GO:0000384 | first spliceosomal transesterification activity(GO:0000384) |
| 0.0 | 0.0 | GO:0004629 | phospholipase C activity(GO:0004629) |
| 0.0 | 0.0 | GO:0045309 | protein phosphorylated amino acid binding(GO:0045309) |
| 0.0 | 0.2 | GO:0004849 | uridine kinase activity(GO:0004849) |
| 0.0 | 0.3 | GO:0001871 | pattern binding(GO:0001871) polysaccharide binding(GO:0030247) |
| 0.0 | 0.3 | GO:0000175 | 3'-5'-exoribonuclease activity(GO:0000175) |
| 0.0 | 0.3 | GO:0070273 | phosphatidylinositol-4-phosphate binding(GO:0070273) |
| 0.0 | 0.2 | GO:0034711 | inhibin binding(GO:0034711) |
| 0.0 | 0.2 | GO:0031433 | telethonin binding(GO:0031433) |
| 0.0 | 0.7 | GO:0032947 | protein complex scaffold(GO:0032947) |
| 0.0 | 0.0 | GO:0016312 | inositol bisphosphate phosphatase activity(GO:0016312) |
| 0.0 | 0.0 | GO:0070411 | I-SMAD binding(GO:0070411) |
| 0.0 | 0.2 | GO:0001851 | complement component C3b binding(GO:0001851) |
| 0.0 | 0.1 | GO:0008046 | axon guidance receptor activity(GO:0008046) |
| 0.0 | 3.1 | GO:0001078 | transcriptional repressor activity, RNA polymerase II core promoter proximal region sequence-specific binding(GO:0001078) |
| 0.0 | 0.0 | GO:0038064 | collagen receptor activity(GO:0038064) |
| 0.0 | 0.1 | GO:0004979 | beta-endorphin receptor activity(GO:0004979) morphine receptor activity(GO:0038047) |
| 0.0 | 0.1 | GO:0004914 | interleukin-5 receptor activity(GO:0004914) |
| 0.0 | 0.1 | GO:1901474 | thiamine transmembrane transporter activity(GO:0015234) azole transmembrane transporter activity(GO:1901474) |
| 0.0 | 0.1 | GO:0044549 | GTP cyclohydrolase binding(GO:0044549) |
| 0.0 | 0.1 | GO:0032453 | histone demethylase activity (H3-K4 specific)(GO:0032453) |
| 0.0 | 0.1 | GO:0005483 | soluble NSF attachment protein activity(GO:0005483) |
| 0.0 | 0.1 | GO:0001013 | RNA polymerase I regulatory region DNA binding(GO:0001013) RNA polymerase I regulatory region sequence-specific DNA binding(GO:0001163) RNA polymerase I CORE element sequence-specific DNA binding(GO:0001164) |
| 0.0 | 0.1 | GO:0016724 | ferroxidase activity(GO:0004322) oxidoreductase activity, oxidizing metal ions, oxygen as acceptor(GO:0016724) |
| 0.0 | 0.1 | GO:0002046 | opsin binding(GO:0002046) |
| 0.0 | 0.4 | GO:0005245 | voltage-gated calcium channel activity(GO:0005245) |
| 0.0 | 0.6 | GO:0004435 | phosphatidylinositol phospholipase C activity(GO:0004435) |
| 0.0 | 0.0 | GO:0052594 | tryptamine:oxygen oxidoreductase (deaminating) activity(GO:0052593) aminoacetone:oxygen oxidoreductase(deaminating) activity(GO:0052594) aliphatic-amine oxidase activity(GO:0052595) phenethylamine:oxygen oxidoreductase (deaminating) activity(GO:0052596) |
| 0.0 | 0.1 | GO:0044213 | intronic transcription regulatory region sequence-specific DNA binding(GO:0001161) intronic transcription regulatory region DNA binding(GO:0044213) |
| 0.0 | 0.6 | GO:0004129 | cytochrome-c oxidase activity(GO:0004129) heme-copper terminal oxidase activity(GO:0015002) oxidoreductase activity, acting on a heme group of donors, oxygen as acceptor(GO:0016676) |
| 0.0 | 0.1 | GO:0004668 | protein-arginine deiminase activity(GO:0004668) |
| 0.0 | 0.3 | GO:0005337 | nucleoside transmembrane transporter activity(GO:0005337) |
| 0.0 | 0.1 | GO:0005172 | vascular endothelial growth factor receptor binding(GO:0005172) |
| 0.0 | 0.1 | GO:0004862 | cAMP-dependent protein kinase inhibitor activity(GO:0004862) |
| 0.0 | 0.4 | GO:0031267 | small GTPase binding(GO:0031267) |
| 0.0 | 0.9 | GO:0004693 | cyclin-dependent protein serine/threonine kinase activity(GO:0004693) |
| 0.0 | 0.2 | GO:0098748 | clathrin adaptor activity(GO:0035615) endocytic adaptor activity(GO:0098748) |
| 0.0 | 0.1 | GO:0017162 | aryl hydrocarbon receptor binding(GO:0017162) |
| 0.0 | 0.1 | GO:0008453 | alanine-glyoxylate transaminase activity(GO:0008453) |
| 0.0 | 0.5 | GO:0051879 | Hsp90 protein binding(GO:0051879) |
| 0.0 | 0.0 | GO:0016838 | carbon-oxygen lyase activity, acting on phosphates(GO:0016838) |
| 0.0 | 0.2 | GO:0032395 | MHC class II receptor activity(GO:0032395) |
| 0.0 | 8.5 | GO:0000977 | RNA polymerase II regulatory region sequence-specific DNA binding(GO:0000977) |
| 0.0 | 0.1 | GO:0000981 | RNA polymerase II transcription factor activity, sequence-specific DNA binding(GO:0000981) |
| 0.0 | 0.2 | GO:0016500 | protein-hormone receptor activity(GO:0016500) |
| 0.0 | 0.0 | GO:0016307 | phosphatidylinositol phosphate kinase activity(GO:0016307) |
| 0.0 | 0.2 | GO:0050291 | sphingosine N-acyltransferase activity(GO:0050291) |
| 0.0 | 0.2 | GO:0004875 | complement receptor activity(GO:0004875) |
| 0.0 | 0.0 | GO:0035034 | histone acetyltransferase regulator activity(GO:0035034) |
| 0.0 | 0.5 | GO:0042826 | histone deacetylase binding(GO:0042826) |
| 0.0 | 0.1 | GO:0008048 | calcium sensitive guanylate cyclase activator activity(GO:0008048) |
| 0.0 | 0.5 | GO:0000982 | transcription factor activity, RNA polymerase II core promoter proximal region sequence-specific binding(GO:0000982) |
| 0.0 | 0.1 | GO:0004105 | choline-phosphate cytidylyltransferase activity(GO:0004105) |
| 0.0 | 0.1 | GO:0090599 | alpha-glucosidase activity(GO:0090599) |
| 0.0 | 0.0 | GO:0086089 | voltage-gated potassium channel activity involved in atrial cardiac muscle cell action potential repolarization(GO:0086089) |
| 0.0 | 0.1 | GO:0004447 | iodide peroxidase activity(GO:0004447) |
| 0.0 | 0.2 | GO:0005544 | calcium-dependent phospholipid binding(GO:0005544) |
| 0.0 | 0.1 | GO:0019776 | Atg8 ligase activity(GO:0019776) |
| 0.0 | 0.0 | GO:0035379 | carbon dioxide transmembrane transporter activity(GO:0035379) |
| 0.0 | 0.0 | GO:0036435 | K48-linked polyubiquitin binding(GO:0036435) |
| 0.0 | 0.1 | GO:0008467 | [heparan sulfate]-glucosamine 3-sulfotransferase 1 activity(GO:0008467) |
| 0.0 | 0.1 | GO:0005080 | protein kinase C binding(GO:0005080) |
| 0.0 | 0.0 | GO:0047783 | steroid 11-beta-monooxygenase activity(GO:0004507) corticosterone 18-monooxygenase activity(GO:0047783) |
| 0.0 | 0.2 | GO:0031210 | phosphatidylcholine binding(GO:0031210) |
| 0.0 | 0.4 | GO:0004198 | calcium-dependent cysteine-type endopeptidase activity(GO:0004198) |
| 0.0 | 0.0 | GO:0004815 | aspartate-tRNA ligase activity(GO:0004815) |
| 0.0 | 0.1 | GO:0008568 | microtubule-severing ATPase activity(GO:0008568) |
| 0.0 | 0.0 | GO:0070653 | high-density lipoprotein particle receptor binding(GO:0070653) |
| 0.0 | 0.0 | GO:1990239 | steroid hormone binding(GO:1990239) |
| 0.0 | 0.1 | GO:0017127 | cholesterol transporter activity(GO:0017127) |
| 0.0 | 0.5 | GO:0002039 | p53 binding(GO:0002039) |
| 0.0 | 0.1 | GO:0003689 | DNA clamp loader activity(GO:0003689) protein-DNA loading ATPase activity(GO:0033170) |
| 0.0 | 0.0 | GO:0052857 | NADHX epimerase activity(GO:0052856) NADPHX epimerase activity(GO:0052857) |
| 0.0 | 0.0 | GO:0015137 | citrate transmembrane transporter activity(GO:0015137) tricarboxylic acid transmembrane transporter activity(GO:0015142) |
| 0.0 | 0.0 | GO:0051575 | 5'-deoxyribose-5-phosphate lyase activity(GO:0051575) |
| 0.0 | 0.0 | GO:0048408 | epidermal growth factor binding(GO:0048408) |
| 0.0 | 0.1 | GO:0047288 | monosialoganglioside sialyltransferase activity(GO:0047288) |
| 0.0 | 0.0 | GO:0001632 | leukotriene B4 receptor activity(GO:0001632) |
| 0.0 | 0.1 | GO:0050786 | RAGE receptor binding(GO:0050786) |
| 0.0 | 0.1 | GO:0008479 | queuine tRNA-ribosyltransferase activity(GO:0008479) |
| 0.0 | 0.0 | GO:0046912 | transferase activity, transferring acyl groups, acyl groups converted into alkyl on transfer(GO:0046912) |
| 0.0 | 0.0 | GO:0070546 | L-phenylalanine aminotransferase activity(GO:0070546) L-phenylalanine:2-oxoglutarate aminotransferase activity(GO:0080130) |
| 0.0 | 5.1 | GO:0004842 | ubiquitin-protein transferase activity(GO:0004842) |
| 0.0 | 0.0 | GO:0003867 | 4-aminobutyrate transaminase activity(GO:0003867) succinate-semialdehyde dehydrogenase binding(GO:0032145) (S)-3-amino-2-methylpropionate transaminase activity(GO:0047298) |
| 0.0 | 0.1 | GO:0015250 | water channel activity(GO:0015250) |
| 0.0 | 0.1 | GO:0008273 | calcium, potassium:sodium antiporter activity(GO:0008273) |
| 0.0 | 0.2 | GO:0004065 | arylsulfatase activity(GO:0004065) |
| 0.0 | 0.1 | GO:0043021 | ribonucleoprotein complex binding(GO:0043021) |
| 0.0 | 0.0 | GO:0015275 | stretch-activated, cation-selective, calcium channel activity(GO:0015275) |
| 0.0 | 0.2 | GO:0003796 | lysozyme activity(GO:0003796) |
| 0.0 | 0.0 | GO:0003872 | 6-phosphofructokinase activity(GO:0003872) |
| 0.0 | 0.0 | GO:0008097 | 5S rRNA binding(GO:0008097) |
Gene overrepresentation in C2:CP category:
| Log-likelihood per target | Total log-likelihood | Term | Description |
|---|---|---|---|
| 0.2 | 0.5 | PID S1P S1P4 PATHWAY | S1P4 pathway |
| 0.2 | 0.2 | PID NFKAPPAB CANONICAL PATHWAY | Canonical NF-kappaB pathway |
| 0.2 | 5.1 | SA B CELL RECEPTOR COMPLEXES | Antigen binding to B cell receptors activates protein tyrosine kinases, such as the Src family, which ultimate activate MAP kinases. |
| 0.2 | 4.8 | SA TRKA RECEPTOR | The TrkA receptor binds nerve growth factor to activate MAP kinase pathways and promote cell growth. |
| 0.1 | 0.3 | SIG BCR SIGNALING PATHWAY | Members of the BCR signaling pathway |
| 0.1 | 7.7 | PID RAS PATHWAY | Regulation of Ras family activation |
| 0.1 | 1.0 | PID FRA PATHWAY | Validated transcriptional targets of AP1 family members Fra1 and Fra2 |
| 0.1 | 3.2 | PID INTEGRIN4 PATHWAY | Alpha6 beta4 integrin-ligand interactions |
| 0.1 | 3.0 | PID ECADHERIN KERATINOCYTE PATHWAY | E-cadherin signaling in keratinocytes |
| 0.1 | 6.7 | PID MYC PATHWAY | C-MYC pathway |
| 0.1 | 0.9 | SA REG CASCADE OF CYCLIN EXPR | Expression of cyclins regulates progression through the cell cycle by activating cyclin-dependent kinases. |
| 0.1 | 4.4 | PID RAC1 PATHWAY | RAC1 signaling pathway |
| 0.1 | 4.6 | ST ERK1 ERK2 MAPK PATHWAY | ERK1/ERK2 MAPK Pathway |
| 0.1 | 0.2 | PID WNT NONCANONICAL PATHWAY | Noncanonical Wnt signaling pathway |
| 0.1 | 2.5 | PID IL8 CXCR1 PATHWAY | IL8- and CXCR1-mediated signaling events |
| 0.1 | 5.8 | PID ERBB1 RECEPTOR PROXIMAL PATHWAY | EGF receptor (ErbB1) signaling pathway |
| 0.1 | 24.5 | PID P53 DOWNSTREAM PATHWAY | Direct p53 effectors |
| 0.1 | 4.3 | PID IL3 PATHWAY | IL3-mediated signaling events |
| 0.1 | 1.0 | PID CERAMIDE PATHWAY | Ceramide signaling pathway |
| 0.1 | 3.6 | PID EPHA FWDPATHWAY | EPHA forward signaling |
| 0.1 | 4.1 | PID HIF1A PATHWAY | Hypoxic and oxygen homeostasis regulation of HIF-1-alpha |
| 0.1 | 2.3 | PID NEPHRIN NEPH1 PATHWAY | Nephrin/Neph1 signaling in the kidney podocyte |
| 0.1 | 3.8 | PID MAPK TRK PATHWAY | Trk receptor signaling mediated by the MAPK pathway |
| 0.1 | 1.6 | PID AJDISS 2PATHWAY | Posttranslational regulation of adherens junction stability and dissassembly |
| 0.1 | 1.4 | PID PDGFRA PATHWAY | PDGFR-alpha signaling pathway |
| 0.1 | 0.9 | PID RANBP2 PATHWAY | Sumoylation by RanBP2 regulates transcriptional repression |
| 0.1 | 0.8 | PID NFKAPPAB ATYPICAL PATHWAY | Atypical NF-kappaB pathway |
| 0.1 | 4.4 | PID FGF PATHWAY | FGF signaling pathway |
| 0.1 | 1.7 | SA G1 AND S PHASES | Cdk2, 4, and 6 bind cyclin D in G1, while cdk2/cyclin E promotes the G1/S transition. |
| 0.1 | 2.6 | PID RETINOIC ACID PATHWAY | Retinoic acid receptors-mediated signaling |
| 0.1 | 0.2 | PID SYNDECAN 3 PATHWAY | Syndecan-3-mediated signaling events |
| 0.1 | 0.3 | PID ERBB4 PATHWAY | ErbB4 signaling events |
| 0.1 | 2.8 | PID ECADHERIN STABILIZATION PATHWAY | Stabilization and expansion of the E-cadherin adherens junction |
| 0.1 | 1.4 | PID S1P S1P1 PATHWAY | S1P1 pathway |
| 0.1 | 1.6 | PID RET PATHWAY | Signaling events regulated by Ret tyrosine kinase |
| 0.1 | 1.2 | PID IL2 STAT5 PATHWAY | IL2 signaling events mediated by STAT5 |
| 0.1 | 3.0 | PID FOXO PATHWAY | FoxO family signaling |
| 0.1 | 1.9 | SIG PIP3 SIGNALING IN CARDIAC MYOCTES | Genes related to PIP3 signaling in cardiac myocytes |
| 0.1 | 1.2 | ST INTERLEUKIN 4 PATHWAY | Interleukin 4 (IL-4) Pathway |
| 0.1 | 0.5 | PID EPO PATHWAY | EPO signaling pathway |
| 0.1 | 1.8 | PID SMAD2 3PATHWAY | Regulation of cytoplasmic and nuclear SMAD2/3 signaling |
| 0.1 | 2.1 | PID TXA2PATHWAY | Thromboxane A2 receptor signaling |
| 0.1 | 4.8 | PID MTOR 4PATHWAY | mTOR signaling pathway |
| 0.1 | 2.8 | PID HES HEY PATHWAY | Notch-mediated HES/HEY network |
| 0.1 | 2.7 | PID NFAT 3PATHWAY | Role of Calcineurin-dependent NFAT signaling in lymphocytes |
| 0.1 | 2.3 | PID P38 ALPHA BETA DOWNSTREAM PATHWAY | Signaling mediated by p38-alpha and p38-beta |
| 0.1 | 0.8 | PID P38 ALPHA BETA PATHWAY | Regulation of p38-alpha and p38-beta |
| 0.1 | 0.1 | PID TRAIL PATHWAY | TRAIL signaling pathway |
| 0.1 | 4.0 | PID P73PATHWAY | p73 transcription factor network |
| 0.1 | 1.1 | PID IFNG PATHWAY | IFN-gamma pathway |
| 0.1 | 4.0 | PID ERBB1 DOWNSTREAM PATHWAY | ErbB1 downstream signaling |
| 0.1 | 0.7 | PID IL2 1PATHWAY | IL2-mediated signaling events |
| 0.1 | 0.4 | ST JNK MAPK PATHWAY | JNK MAPK Pathway |
| 0.1 | 1.3 | PID HDAC CLASSII PATHWAY | Signaling events mediated by HDAC Class II |
| 0.1 | 0.4 | PID TCPTP PATHWAY | Signaling events mediated by TCPTP |
| 0.1 | 0.7 | PID ERB GENOMIC PATHWAY | Validated nuclear estrogen receptor beta network |
| 0.1 | 1.7 | PID WNT SIGNALING PATHWAY | Wnt signaling network |
| 0.0 | 1.0 | PID TRKR PATHWAY | Neurotrophic factor-mediated Trk receptor signaling |
| 0.0 | 2.3 | PID IL12 2PATHWAY | IL12-mediated signaling events |
| 0.0 | 0.2 | PID PS1 PATHWAY | Presenilin action in Notch and Wnt signaling |
| 0.0 | 0.1 | PID LYMPH ANGIOGENESIS PATHWAY | VEGFR3 signaling in lymphatic endothelium |
| 0.0 | 0.3 | PID HIV NEF PATHWAY | HIV-1 Nef: Negative effector of Fas and TNF-alpha |
| 0.0 | 0.7 | ST P38 MAPK PATHWAY | p38 MAPK Pathway |
| 0.0 | 1.0 | PID ALPHA SYNUCLEIN PATHWAY | Alpha-synuclein signaling |
| 0.0 | 0.9 | PID ERBB2 ERBB3 PATHWAY | ErbB2/ErbB3 signaling events |
| 0.0 | 0.1 | ST DIFFERENTIATION PATHWAY IN PC12 CELLS | Differentiation Pathway in PC12 Cells; this is a specific case of PAC1 Receptor Pathway. |
| 0.0 | 2.6 | WNT SIGNALING | Genes related to Wnt-mediated signal transduction |
| 0.0 | 0.3 | PID IL27 PATHWAY | IL27-mediated signaling events |
| 0.0 | 0.7 | PID PTP1B PATHWAY | Signaling events mediated by PTP1B |
| 0.0 | 0.1 | SA PROGRAMMED CELL DEATH | Programmed cell death, or apoptosis, eliminates damaged or unneeded cells. |
| 0.0 | 2.2 | PID E2F PATHWAY | E2F transcription factor network |
| 0.0 | 0.7 | PID SHP2 PATHWAY | SHP2 signaling |
| 0.0 | 1.4 | PID REG GR PATHWAY | Glucocorticoid receptor regulatory network |
| 0.0 | 0.4 | PID INSULIN GLUCOSE PATHWAY | Insulin-mediated glucose transport |
| 0.0 | 0.5 | PID HEDGEHOG 2PATHWAY | Signaling events mediated by the Hedgehog family |
| 0.0 | 0.3 | PID A6B1 A6B4 INTEGRIN PATHWAY | a6b1 and a6b4 Integrin signaling |
| 0.0 | 0.1 | SA FAS SIGNALING | The TNF-type receptor Fas induces apoptosis on ligand binding. |
| 0.0 | 0.3 | PID WNT CANONICAL PATHWAY | Canonical Wnt signaling pathway |
| 0.0 | 0.4 | PID FAK PATHWAY | Signaling events mediated by focal adhesion kinase |
| 0.0 | 0.9 | ST TUMOR NECROSIS FACTOR PATHWAY | Tumor Necrosis Factor Pathway. |
| 0.0 | 0.3 | PID SYNDECAN 4 PATHWAY | Syndecan-4-mediated signaling events |
| 0.0 | 0.9 | PID INTEGRIN A4B1 PATHWAY | Alpha4 beta1 integrin signaling events |
| 0.0 | 0.7 | PID CD8 TCR PATHWAY | TCR signaling in naïve CD8+ T cells |
| 0.0 | 0.2 | PID ERBB NETWORK PATHWAY | ErbB receptor signaling network |
| 0.0 | 0.0 | ST STAT3 PATHWAY | STAT3 Pathway |
| 0.0 | 0.0 | PID REELIN PATHWAY | Reelin signaling pathway |
| 0.0 | 0.6 | PID HDAC CLASSI PATHWAY | Signaling events mediated by HDAC Class I |
| 0.0 | 0.7 | PID RHODOPSIN PATHWAY | Visual signal transduction: Rods |
| 0.0 | 1.2 | PID SMAD2 3NUCLEAR PATHWAY | Regulation of nuclear SMAD2/3 signaling |
| 0.0 | 0.3 | PID IL23 PATHWAY | IL23-mediated signaling events |
| 0.0 | 0.3 | PID IL6 7 PATHWAY | IL6-mediated signaling events |
| 0.0 | 1.0 | PID LKB1 PATHWAY | LKB1 signaling events |
| 0.0 | 0.8 | PID HNF3B PATHWAY | FOXA2 and FOXA3 transcription factor networks |
| 0.0 | 0.6 | PID CDC42 PATHWAY | CDC42 signaling events |
| 0.0 | 0.0 | PID IL5 PATHWAY | IL5-mediated signaling events |
| 0.0 | 1.4 | PID MYC ACTIV PATHWAY | Validated targets of C-MYC transcriptional activation |
| 0.0 | 0.2 | ST GA12 PATHWAY | G alpha 12 Pathway |
| 0.0 | 0.2 | PID MET PATHWAY | Signaling events mediated by Hepatocyte Growth Factor Receptor (c-Met) |
| 0.0 | 0.2 | PID TCR PATHWAY | TCR signaling in naïve CD4+ T cells |
| 0.0 | 0.3 | PID EPHRINB REV PATHWAY | Ephrin B reverse signaling |
| 0.0 | 0.2 | PID CXCR3 PATHWAY | CXCR3-mediated signaling events |
| 0.0 | 0.2 | PID TNF PATHWAY | TNF receptor signaling pathway |
| 0.0 | 2.5 | NABA ECM AFFILIATED | Genes encoding proteins affiliated structurally or functionally to extracellular matrix proteins |
| 0.0 | 0.2 | PID HIF2PATHWAY | HIF-2-alpha transcription factor network |
Gene overrepresentation in C2:CP:REACTOME category:
| Log-likelihood per target | Total log-likelihood | Term | Description |
|---|---|---|---|
| 0.3 | 0.3 | REACTOME ERK MAPK TARGETS | Genes involved in ERK/MAPK targets |
| 0.3 | 6.2 | REACTOME TGF BETA RECEPTOR SIGNALING IN EMT EPITHELIAL TO MESENCHYMAL TRANSITION | Genes involved in TGF-beta receptor signaling in EMT (epithelial to mesenchymal transition) |
| 0.3 | 3.6 | REACTOME RECEPTOR LIGAND BINDING INITIATES THE SECOND PROTEOLYTIC CLEAVAGE OF NOTCH RECEPTOR | Genes involved in Receptor-ligand binding initiates the second proteolytic cleavage of Notch receptor |
| 0.3 | 18.3 | REACTOME STRIATED MUSCLE CONTRACTION | Genes involved in Striated Muscle Contraction |
| 0.2 | 0.9 | REACTOME ACTIVATED TAK1 MEDIATES P38 MAPK ACTIVATION | Genes involved in activated TAK1 mediates p38 MAPK activation |
| 0.2 | 1.4 | REACTOME FGFR4 LIGAND BINDING AND ACTIVATION | Genes involved in FGFR4 ligand binding and activation |
| 0.2 | 0.5 | REACTOME VIF MEDIATED DEGRADATION OF APOBEC3G | Genes involved in Vif-mediated degradation of APOBEC3G |
| 0.2 | 6.2 | REACTOME P38MAPK EVENTS | Genes involved in p38MAPK events |
| 0.2 | 2.9 | REACTOME SIGNALING BY FGFR3 MUTANTS | Genes involved in Signaling by FGFR3 mutants |
| 0.2 | 2.2 | REACTOME NEGATIVE REGULATION OF THE PI3K AKT NETWORK | Genes involved in Negative regulation of the PI3K/AKT network |
| 0.2 | 3.7 | REACTOME APOPTOTIC CLEAVAGE OF CELL ADHESION PROTEINS | Genes involved in Apoptotic cleavage of cell adhesion proteins |
| 0.2 | 1.1 | REACTOME JNK C JUN KINASES PHOSPHORYLATION AND ACTIVATION MEDIATED BY ACTIVATED HUMAN TAK1 | Genes involved in JNK (c-Jun kinases) phosphorylation and activation mediated by activated human TAK1 |
| 0.2 | 9.0 | REACTOME SMAD2 SMAD3 SMAD4 HETEROTRIMER REGULATES TRANSCRIPTION | Genes involved in SMAD2/SMAD3:SMAD4 heterotrimer regulates transcription |
| 0.2 | 0.4 | REACTOME TRAFFICKING AND PROCESSING OF ENDOSOMAL TLR | Genes involved in Trafficking and processing of endosomal TLR |
| 0.2 | 4.2 | REACTOME RAS ACTIVATION UOPN CA2 INFUX THROUGH NMDA RECEPTOR | Genes involved in Ras activation uopn Ca2+ infux through NMDA receptor |
| 0.2 | 2.5 | REACTOME ACTIVATION OF THE AP1 FAMILY OF TRANSCRIPTION FACTORS | Genes involved in Activation of the AP-1 family of transcription factors |
| 0.2 | 3.9 | REACTOME RNA POL III CHAIN ELONGATION | Genes involved in RNA Polymerase III Chain Elongation |
| 0.2 | 5.3 | REACTOME SIGNAL REGULATORY PROTEIN SIRP FAMILY INTERACTIONS | Genes involved in Signal regulatory protein (SIRP) family interactions |
| 0.2 | 3.9 | REACTOME PURINE SALVAGE | Genes involved in Purine salvage |
| 0.1 | 5.5 | REACTOME KINESINS | Genes involved in Kinesins |
| 0.1 | 2.3 | REACTOME NEF MEDIATED DOWNREGULATION OF MHC CLASS I COMPLEX CELL SURFACE EXPRESSION | Genes involved in Nef mediated downregulation of MHC class I complex cell surface expression |
| 0.1 | 4.8 | REACTOME OXYGEN DEPENDENT PROLINE HYDROXYLATION OF HYPOXIA INDUCIBLE FACTOR ALPHA | Genes involved in Oxygen-dependent Proline Hydroxylation of Hypoxia-inducible Factor Alpha |
| 0.1 | 0.5 | REACTOME P75NTR RECRUITS SIGNALLING COMPLEXES | Genes involved in p75NTR recruits signalling complexes |
| 0.1 | 0.3 | REACTOME G ALPHA1213 SIGNALLING EVENTS | Genes involved in G alpha (12/13) signalling events |
| 0.1 | 1.4 | REACTOME REGULATION OF HYPOXIA INDUCIBLE FACTOR HIF BY OXYGEN | Genes involved in Regulation of Hypoxia-inducible Factor (HIF) by Oxygen |
| 0.1 | 3.1 | REACTOME ACTIVATION OF RAC | Genes involved in Activation of Rac |
| 0.1 | 0.6 | REACTOME DSCAM INTERACTIONS | Genes involved in DSCAM interactions |
| 0.1 | 0.6 | REACTOME ERKS ARE INACTIVATED | Genes involved in ERKs are inactivated |
| 0.1 | 0.4 | REACTOME DESTABILIZATION OF MRNA BY AUF1 HNRNP D0 | Genes involved in Destabilization of mRNA by AUF1 (hnRNP D0) |
| 0.1 | 0.2 | REACTOME GLUCAGON SIGNALING IN METABOLIC REGULATION | Genes involved in Glucagon signaling in metabolic regulation |
| 0.1 | 1.2 | REACTOME CELL JUNCTION ORGANIZATION | Genes involved in Cell junction organization |
| 0.1 | 0.6 | REACTOME RAF MAP KINASE CASCADE | Genes involved in RAF/MAP kinase cascade |
| 0.1 | 1.5 | REACTOME ABACAVIR TRANSPORT AND METABOLISM | Genes involved in Abacavir transport and metabolism |
| 0.1 | 2.6 | REACTOME ACTIVATION OF BH3 ONLY PROTEINS | Genes involved in Activation of BH3-only proteins |
| 0.1 | 2.4 | REACTOME CTNNB1 PHOSPHORYLATION CASCADE | Genes involved in Beta-catenin phosphorylation cascade |
| 0.1 | 0.5 | REACTOME RETROGRADE NEUROTROPHIN SIGNALLING | Genes involved in Retrograde neurotrophin signalling |
| 0.1 | 1.7 | REACTOME TANDEM PORE DOMAIN POTASSIUM CHANNELS | Genes involved in Tandem pore domain potassium channels |
| 0.1 | 3.2 | REACTOME AMINO ACID SYNTHESIS AND INTERCONVERSION TRANSAMINATION | Genes involved in Amino acid synthesis and interconversion (transamination) |
| 0.1 | 4.3 | REACTOME TIGHT JUNCTION INTERACTIONS | Genes involved in Tight junction interactions |
| 0.1 | 0.3 | REACTOME FGFR2C LIGAND BINDING AND ACTIVATION | Genes involved in FGFR2c ligand binding and activation |
| 0.1 | 1.3 | REACTOME RNA POL III TRANSCRIPTION INITIATION FROM TYPE 3 PROMOTER | Genes involved in RNA Polymerase III Transcription Initiation From Type 3 Promoter |
| 0.1 | 0.1 | REACTOME DEADENYLATION DEPENDENT MRNA DECAY | Genes involved in Deadenylation-dependent mRNA decay |
| 0.1 | 2.1 | REACTOME SIGNALING BY HIPPO | Genes involved in Signaling by Hippo |
| 0.1 | 1.4 | REACTOME ACTIVATION OF CHAPERONE GENES BY ATF6 ALPHA | Genes involved in Activation of Chaperone Genes by ATF6-alpha |
| 0.1 | 2.4 | REACTOME REGULATION OF SIGNALING BY CBL | Genes involved in Regulation of signaling by CBL |
| 0.1 | 2.0 | REACTOME MTORC1 MEDIATED SIGNALLING | Genes involved in mTORC1-mediated signalling |
| 0.1 | 0.5 | REACTOME CYCLIN E ASSOCIATED EVENTS DURING G1 S TRANSITION | Genes involved in Cyclin E associated events during G1/S transition |
| 0.1 | 2.6 | REACTOME MITOCHONDRIAL TRNA AMINOACYLATION | Genes involved in Mitochondrial tRNA aminoacylation |
| 0.1 | 4.2 | REACTOME G1 PHASE | Genes involved in G1 Phase |
| 0.1 | 2.1 | REACTOME N GLYCAN ANTENNAE ELONGATION | Genes involved in N-Glycan antennae elongation |
| 0.1 | 8.1 | REACTOME INTERFERON GAMMA SIGNALING | Genes involved in Interferon gamma signaling |
| 0.1 | 1.6 | REACTOME ACTIVATION OF NF KAPPAB IN B CELLS | Genes involved in Activation of NF-kappaB in B Cells |
| 0.1 | 1.0 | REACTOME ACTIVATION OF GENES BY ATF4 | Genes involved in Activation of Genes by ATF4 |
| 0.1 | 2.9 | REACTOME SYNTHESIS AND INTERCONVERSION OF NUCLEOTIDE DI AND TRIPHOSPHATES | Genes involved in Synthesis and interconversion of nucleotide di- and triphosphates |
| 0.1 | 0.2 | REACTOME P53 DEPENDENT G1 DNA DAMAGE RESPONSE | Genes involved in p53-Dependent G1 DNA Damage Response |
| 0.1 | 1.8 | REACTOME GAP JUNCTION ASSEMBLY | Genes involved in Gap junction assembly |
| 0.1 | 1.3 | REACTOME IONOTROPIC ACTIVITY OF KAINATE RECEPTORS | Genes involved in Ionotropic activity of Kainate Receptors |
| 0.1 | 0.7 | REACTOME PYRUVATE METABOLISM AND CITRIC ACID TCA CYCLE | Genes involved in Pyruvate metabolism and Citric Acid (TCA) cycle |
| 0.1 | 0.5 | REACTOME HORMONE SENSITIVE LIPASE HSL MEDIATED TRIACYLGLYCEROL HYDROLYSIS | Genes involved in Hormone-sensitive lipase (HSL)-mediated triacylglycerol hydrolysis |
| 0.1 | 3.1 | REACTOME RECYCLING PATHWAY OF L1 | Genes involved in Recycling pathway of L1 |
| 0.1 | 3.5 | REACTOME DARPP 32 EVENTS | Genes involved in DARPP-32 events |
| 0.1 | 0.4 | REACTOME SPRY REGULATION OF FGF SIGNALING | Genes involved in Spry regulation of FGF signaling |
| 0.1 | 5.0 | REACTOME MITOCHONDRIAL PROTEIN IMPORT | Genes involved in Mitochondrial Protein Import |
| 0.1 | 1.7 | REACTOME TIE2 SIGNALING | Genes involved in Tie2 Signaling |
| 0.1 | 2.0 | REACTOME DEADENYLATION OF MRNA | Genes involved in Deadenylation of mRNA |
| 0.1 | 1.0 | REACTOME REVERSIBLE HYDRATION OF CARBON DIOXIDE | Genes involved in Reversible Hydration of Carbon Dioxide |
| 0.1 | 1.8 | REACTOME REGULATION OF AMPK ACTIVITY VIA LKB1 | Genes involved in Regulation of AMPK activity via LKB1 |
| 0.1 | 2.0 | REACTOME RAP1 SIGNALLING | Genes involved in Rap1 signalling |
| 0.1 | 1.7 | REACTOME HS GAG DEGRADATION | Genes involved in HS-GAG degradation |
| 0.1 | 6.0 | REACTOME NUCLEAR RECEPTOR TRANSCRIPTION PATHWAY | Genes involved in Nuclear Receptor transcription pathway |
| 0.1 | 1.2 | REACTOME PRE NOTCH PROCESSING IN GOLGI | Genes involved in Pre-NOTCH Processing in Golgi |
| 0.1 | 2.9 | REACTOME CGMP EFFECTS | Genes involved in cGMP effects |
| 0.1 | 1.4 | REACTOME ABCA TRANSPORTERS IN LIPID HOMEOSTASIS | Genes involved in ABCA transporters in lipid homeostasis |
| 0.1 | 0.1 | REACTOME FORMATION OF TRANSCRIPTION COUPLED NER TC NER REPAIR COMPLEX | Genes involved in Formation of transcription-coupled NER (TC-NER) repair complex |
| 0.1 | 1.2 | REACTOME MRNA DECAY BY 5 TO 3 EXORIBONUCLEASE | Genes involved in mRNA Decay by 5' to 3' Exoribonuclease |
| 0.1 | 1.0 | REACTOME THE NLRP3 INFLAMMASOME | Genes involved in The NLRP3 inflammasome |
| 0.1 | 0.5 | REACTOME IRAK2 MEDIATED ACTIVATION OF TAK1 COMPLEX UPON TLR7 8 OR 9 STIMULATION | Genes involved in IRAK2 mediated activation of TAK1 complex upon TLR7/8 or 9 stimulation |
| 0.1 | 0.8 | REACTOME IRAK1 RECRUITS IKK COMPLEX | Genes involved in IRAK1 recruits IKK complex |
| 0.1 | 0.2 | REACTOME SIGNALING BY ERBB2 | Genes involved in Signaling by ERBB2 |
| 0.1 | 0.4 | REACTOME MAP KINASE ACTIVATION IN TLR CASCADE | Genes involved in MAP kinase activation in TLR cascade |
| 0.1 | 0.7 | REACTOME SYNTHESIS OF BILE ACIDS AND BILE SALTS VIA 24 HYDROXYCHOLESTEROL | Genes involved in Synthesis of bile acids and bile salts via 24-hydroxycholesterol |
| 0.1 | 1.1 | REACTOME G0 AND EARLY G1 | Genes involved in G0 and Early G1 |
| 0.1 | 0.5 | REACTOME RNA POL III TRANSCRIPTION INITIATION FROM TYPE 2 PROMOTER | Genes involved in RNA Polymerase III Transcription Initiation From Type 2 Promoter |
| 0.1 | 0.3 | REACTOME ADP SIGNALLING THROUGH P2RY12 | Genes involved in ADP signalling through P2Y purinoceptor 12 |
| 0.1 | 0.2 | REACTOME SYNTHESIS SECRETION AND DEACYLATION OF GHRELIN | Genes involved in Synthesis, Secretion, and Deacylation of Ghrelin |
| 0.1 | 1.6 | REACTOME METABOLISM OF PORPHYRINS | Genes involved in Metabolism of porphyrins |
| 0.1 | 0.4 | REACTOME PURINE CATABOLISM | Genes involved in Purine catabolism |
| 0.1 | 0.1 | REACTOME BOTULINUM NEUROTOXICITY | Genes involved in Botulinum neurotoxicity |
| 0.1 | 1.1 | REACTOME P2Y RECEPTORS | Genes involved in P2Y receptors |
| 0.1 | 0.2 | REACTOME CD28 DEPENDENT PI3K AKT SIGNALING | Genes involved in CD28 dependent PI3K/Akt signaling |
| 0.1 | 1.3 | REACTOME NA CL DEPENDENT NEUROTRANSMITTER TRANSPORTERS | Genes involved in Na+/Cl- dependent neurotransmitter transporters |
| 0.1 | 0.2 | REACTOME ADENYLATE CYCLASE INHIBITORY PATHWAY | Genes involved in Adenylate cyclase inhibitory pathway |
| 0.1 | 5.8 | REACTOME RESPIRATORY ELECTRON TRANSPORT ATP SYNTHESIS BY CHEMIOSMOTIC COUPLING AND HEAT PRODUCTION BY UNCOUPLING PROTEINS | Genes involved in Respiratory electron transport, ATP synthesis by chemiosmotic coupling, and heat production by uncoupling proteins. |
| 0.1 | 0.5 | REACTOME ELONGATION ARREST AND RECOVERY | Genes involved in Elongation arrest and recovery |
| 0.1 | 0.3 | REACTOME INFLAMMASOMES | Genes involved in Inflammasomes |
| 0.1 | 1.0 | REACTOME RIP MEDIATED NFKB ACTIVATION VIA DAI | Genes involved in RIP-mediated NFkB activation via DAI |
| 0.1 | 1.0 | REACTOME ACYL CHAIN REMODELLING OF PG | Genes involved in Acyl chain remodelling of PG |
| 0.0 | 0.8 | REACTOME DESTABILIZATION OF MRNA BY TRISTETRAPROLIN TTP | Genes involved in Destabilization of mRNA by Tristetraprolin (TTP) |
| 0.0 | 14.0 | REACTOME METABOLISM OF AMINO ACIDS AND DERIVATIVES | Genes involved in Metabolism of amino acids and derivatives |
| 0.0 | 0.8 | REACTOME PYRIMIDINE CATABOLISM | Genes involved in Pyrimidine catabolism |
| 0.0 | 0.4 | REACTOME ROLE OF SECOND MESSENGERS IN NETRIN1 SIGNALING | Genes involved in Role of second messengers in netrin-1 signaling |
| 0.0 | 1.1 | REACTOME SIGNALING BY ROBO RECEPTOR | Genes involved in Signaling by Robo receptor |
| 0.0 | 10.0 | REACTOME SIGNALING BY RHO GTPASES | Genes involved in Signaling by Rho GTPases |
| 0.0 | 1.4 | REACTOME ENDOSOMAL SORTING COMPLEX REQUIRED FOR TRANSPORT ESCRT | Genes involved in Endosomal Sorting Complex Required For Transport (ESCRT) |
| 0.0 | 1.5 | REACTOME ADHERENS JUNCTIONS INTERACTIONS | Genes involved in Adherens junctions interactions |
| 0.0 | 0.1 | REACTOME FRS2 MEDIATED CASCADE | Genes involved in FRS2-mediated cascade |
| 0.0 | 0.0 | REACTOME SIGNALING BY FGFR | Genes involved in Signaling by FGFR |
| 0.0 | 2.2 | REACTOME MRNA SPLICING MINOR PATHWAY | Genes involved in mRNA Splicing - Minor Pathway |
| 0.0 | 0.5 | REACTOME NEF MEDIATES DOWN MODULATION OF CELL SURFACE RECEPTORS BY RECRUITING THEM TO CLATHRIN ADAPTERS | Genes involved in Nef-mediates down modulation of cell surface receptors by recruiting them to clathrin adapters |
| 0.0 | 1.6 | REACTOME MYOGENESIS | Genes involved in Myogenesis |
| 0.0 | 0.4 | REACTOME INHIBITION OF INSULIN SECRETION BY ADRENALINE NORADRENALINE | Genes involved in Inhibition of Insulin Secretion by Adrenaline/Noradrenaline |
| 0.0 | 1.9 | REACTOME INTERFERON ALPHA BETA SIGNALING | Genes involved in Interferon alpha/beta signaling |
| 0.0 | 1.0 | REACTOME SIGNALING BY BMP | Genes involved in Signaling by BMP |
| 0.0 | 0.4 | REACTOME RNA POL I TRANSCRIPTION | Genes involved in RNA Polymerase I Transcription |
| 0.0 | 0.9 | REACTOME PYRIMIDINE METABOLISM | Genes involved in Pyrimidine metabolism |
| 0.0 | 0.7 | REACTOME DOWNREGULATION OF ERBB2 ERBB3 SIGNALING | Genes involved in Downregulation of ERBB2:ERBB3 signaling |
| 0.0 | 0.9 | REACTOME TERMINATION OF O GLYCAN BIOSYNTHESIS | Genes involved in Termination of O-glycan biosynthesis |
| 0.0 | 0.8 | REACTOME HDL MEDIATED LIPID TRANSPORT | Genes involved in HDL-mediated lipid transport |
| 0.0 | 0.7 | REACTOME TRANSPORT OF ORGANIC ANIONS | Genes involved in Transport of organic anions |
| 0.0 | 6.5 | REACTOME 3 UTR MEDIATED TRANSLATIONAL REGULATION | Genes involved in 3' -UTR-mediated translational regulation |
| 0.0 | 1.7 | REACTOME THROMBIN SIGNALLING THROUGH PROTEINASE ACTIVATED RECEPTORS PARS | Genes involved in Thrombin signalling through proteinase activated receptors (PARs) |
| 0.0 | 0.6 | REACTOME METABOLISM OF NON CODING RNA | Genes involved in Metabolism of non-coding RNA |
| 0.0 | 7.4 | REACTOME ANTIGEN PROCESSING UBIQUITINATION PROTEASOME DEGRADATION | Genes involved in Antigen processing: Ubiquitination & Proteasome degradation |
| 0.0 | 0.5 | REACTOME PROLACTIN RECEPTOR SIGNALING | Genes involved in Prolactin receptor signaling |
| 0.0 | 0.1 | REACTOME CELL DEATH SIGNALLING VIA NRAGE NRIF AND NADE | Genes involved in Cell death signalling via NRAGE, NRIF and NADE |
| 0.0 | 0.5 | REACTOME NITRIC OXIDE STIMULATES GUANYLATE CYCLASE | Genes involved in Nitric oxide stimulates guanylate cyclase |
| 0.0 | 0.4 | REACTOME GROWTH HORMONE RECEPTOR SIGNALING | Genes involved in Growth hormone receptor signaling |
| 0.0 | 0.6 | REACTOME INTRINSIC PATHWAY | Genes involved in Intrinsic Pathway |
| 0.0 | 0.7 | REACTOME REGULATION OF GENE EXPRESSION IN BETA CELLS | Genes involved in Regulation of gene expression in beta cells |
| 0.0 | 1.1 | REACTOME STEROID HORMONES | Genes involved in Steroid hormones |
| 0.0 | 0.8 | REACTOME SYNTHESIS OF GLYCOSYLPHOSPHATIDYLINOSITOL GPI | Genes involved in Synthesis of glycosylphosphatidylinositol (GPI) |
| 0.0 | 2.3 | REACTOME AMYLOIDS | Genes involved in Amyloids |
| 0.0 | 0.3 | REACTOME AKT PHOSPHORYLATES TARGETS IN THE CYTOSOL | Genes involved in AKT phosphorylates targets in the cytosol |
| 0.0 | 2.8 | REACTOME MRNA SPLICING | Genes involved in mRNA Splicing |
| 0.0 | 0.9 | REACTOME REGULATION OF WATER BALANCE BY RENAL AQUAPORINS | Genes involved in Regulation of Water Balance by Renal Aquaporins |
| 0.0 | 0.2 | REACTOME SIGNALING BY CONSTITUTIVELY ACTIVE EGFR | Genes involved in Signaling by constitutively active EGFR |
| 0.0 | 1.1 | REACTOME AMINE LIGAND BINDING RECEPTORS | Genes involved in Amine ligand-binding receptors |
| 0.0 | 0.5 | REACTOME INTRINSIC PATHWAY FOR APOPTOSIS | Genes involved in Intrinsic Pathway for Apoptosis |
| 0.0 | 0.1 | REACTOME CD28 DEPENDENT VAV1 PATHWAY | Genes involved in CD28 dependent Vav1 pathway |
| 0.0 | 0.5 | REACTOME GLYCOGEN BREAKDOWN GLYCOGENOLYSIS | Genes involved in Glycogen breakdown (glycogenolysis) |
| 0.0 | 1.1 | REACTOME RIG I MDA5 MEDIATED INDUCTION OF IFN ALPHA BETA PATHWAYS | Genes involved in RIG-I/MDA5 mediated induction of IFN-alpha/beta pathways |
| 0.0 | 0.5 | REACTOME IL1 SIGNALING | Genes involved in Interleukin-1 signaling |
| 0.0 | 0.2 | REACTOME TRANSLOCATION OF ZAP 70 TO IMMUNOLOGICAL SYNAPSE | Genes involved in Translocation of ZAP-70 to Immunological synapse |
| 0.0 | 0.5 | REACTOME SYNTHESIS OF PIPS AT THE GOLGI MEMBRANE | Genes involved in Synthesis of PIPs at the Golgi membrane |
| 0.0 | 0.3 | REACTOME PACKAGING OF TELOMERE ENDS | Genes involved in Packaging Of Telomere Ends |
| 0.0 | 0.1 | REACTOME NUCLEAR SIGNALING BY ERBB4 | Genes involved in Nuclear signaling by ERBB4 |
| 0.0 | 1.3 | REACTOME CHEMOKINE RECEPTORS BIND CHEMOKINES | Genes involved in Chemokine receptors bind chemokines |
| 0.0 | 0.3 | REACTOME G ALPHA Z SIGNALLING EVENTS | Genes involved in G alpha (z) signalling events |
| 0.0 | 0.1 | REACTOME ACTIVATED POINT MUTANTS OF FGFR2 | Genes involved in Activated point mutants of FGFR2 |
| 0.0 | 0.4 | REACTOME EXTRINSIC PATHWAY FOR APOPTOSIS | Genes involved in Extrinsic Pathway for Apoptosis |
| 0.0 | 0.1 | REACTOME G BETA GAMMA SIGNALLING THROUGH PLC BETA | Genes involved in G beta:gamma signalling through PLC beta |
| 0.0 | 1.4 | REACTOME GOLGI ASSOCIATED VESICLE BIOGENESIS | Genes involved in Golgi Associated Vesicle Biogenesis |
| 0.0 | 1.6 | REACTOME FACTORS INVOLVED IN MEGAKARYOCYTE DEVELOPMENT AND PLATELET PRODUCTION | Genes involved in Factors involved in megakaryocyte development and platelet production |
| 0.0 | 2.5 | REACTOME PEPTIDE LIGAND BINDING RECEPTORS | Genes involved in Peptide ligand-binding receptors |
| 0.0 | 0.2 | REACTOME HOST INTERACTIONS OF HIV FACTORS | Genes involved in Host Interactions of HIV factors |
| 0.0 | 0.3 | REACTOME MITOCHONDRIAL FATTY ACID BETA OXIDATION | Genes involved in Mitochondrial Fatty Acid Beta-Oxidation |
| 0.0 | 0.8 | REACTOME GLUCONEOGENESIS | Genes involved in Gluconeogenesis |
| 0.0 | 0.3 | REACTOME PURINE RIBONUCLEOSIDE MONOPHOSPHATE BIOSYNTHESIS | Genes involved in Purine ribonucleoside monophosphate biosynthesis |
| 0.0 | 0.0 | REACTOME SIGNALLING TO P38 VIA RIT AND RIN | Genes involved in Signalling to p38 via RIT and RIN |
| 0.0 | 0.1 | REACTOME PHOSPHORYLATION OF CD3 AND TCR ZETA CHAINS | Genes involved in Phosphorylation of CD3 and TCR zeta chains |
| 0.0 | 0.2 | REACTOME TRAFFICKING OF GLUR2 CONTAINING AMPA RECEPTORS | Genes involved in Trafficking of GluR2-containing AMPA receptors |
| 0.0 | 0.1 | REACTOME CITRIC ACID CYCLE TCA CYCLE | Genes involved in Citric acid cycle (TCA cycle) |
| 0.0 | 0.2 | REACTOME THE ACTIVATION OF ARYLSULFATASES | Genes involved in The activation of arylsulfatases |
| 0.0 | 0.0 | REACTOME APC CDC20 MEDIATED DEGRADATION OF NEK2A | Genes involved in APC-Cdc20 mediated degradation of Nek2A |
| 0.0 | 0.8 | REACTOME VOLTAGE GATED POTASSIUM CHANNELS | Genes involved in Voltage gated Potassium channels |
| 0.0 | 0.4 | REACTOME LATENT INFECTION OF HOMO SAPIENS WITH MYCOBACTERIUM TUBERCULOSIS | Genes involved in Latent infection of Homo sapiens with Mycobacterium tuberculosis |
| 0.0 | 0.2 | REACTOME EGFR DOWNREGULATION | Genes involved in EGFR downregulation |
| 0.0 | 0.1 | REACTOME TRAF6 MEDIATED INDUCTION OF NFKB AND MAP KINASES UPON TLR7 8 OR 9 ACTIVATION | Genes involved in TRAF6 mediated induction of NFkB and MAP kinases upon TLR7/8 or 9 activation |
| 0.0 | 0.2 | REACTOME REGULATION OF MRNA STABILITY BY PROTEINS THAT BIND AU RICH ELEMENTS | Genes involved in Regulation of mRNA Stability by Proteins that Bind AU-rich Elements |