Project
Epithelial-Mesenchymal Transition, human (Scheel, 2011)
Navigation
Downloads
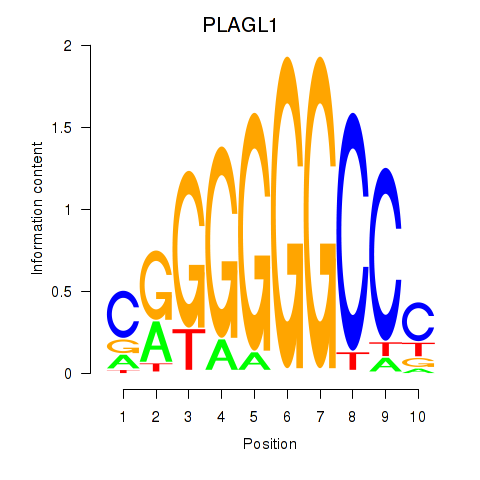
Results for PLAGL1
Z-value: 2.19
Motif logo
Transcription factors associated with PLAGL1
| Gene Symbol | Gene ID | Gene Info |
|---|---|---|
|
PLAGL1
|
ENSG00000118495.14 | PLAGL1 |
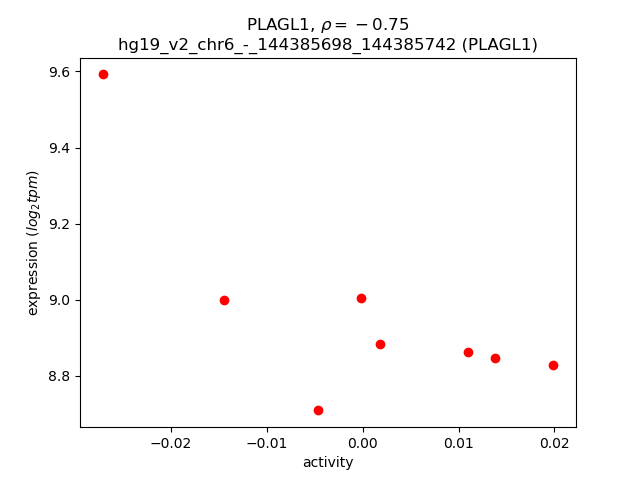
Activity-expression correlation:
| Gene | Promoter | Pearson corr. coef. | P-value | Plot |
|---|---|---|---|---|
| PLAGL1 | hg19_v2_chr6_-_144385698_144385742 | -0.75 | 3.2e-02 | Click! |
Activity profile of PLAGL1 motif
Sorted Z-values of PLAGL1 motif
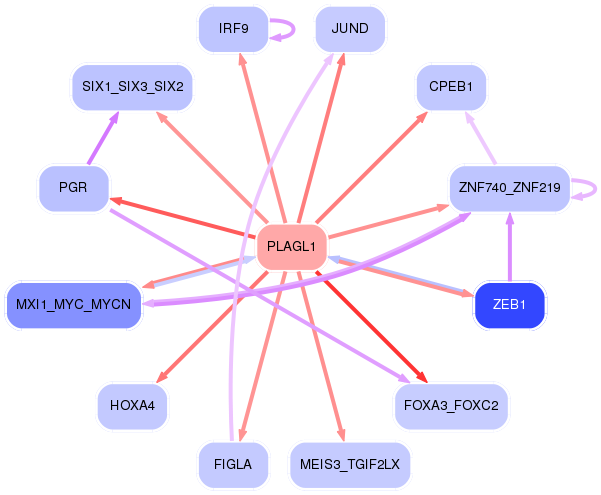
Network of associatons between targets according to the STRING database.

First level regulatory network of PLAGL1
| Promoter | Score | Transcript | Gene | Gene Info |
|---|---|---|---|---|
| chr19_-_3028354 | 2.62 |
ENST00000586422.1 |
TLE2 |
transducin-like enhancer of split 2 (E(sp1) homolog, Drosophila) |
| chr5_-_168727713 | 2.52 |
ENST00000404867.3 |
SLIT3 |
slit homolog 3 (Drosophila) |
| chr5_+_75699149 | 2.28 |
ENST00000379730.3 |
IQGAP2 |
IQ motif containing GTPase activating protein 2 |
| chr5_-_168727786 | 1.94 |
ENST00000332966.8 |
SLIT3 |
slit homolog 3 (Drosophila) |
| chr17_-_42276574 | 1.83 |
ENST00000589805.1 |
ATXN7L3 |
ataxin 7-like 3 |
| chr19_-_18653781 | 1.76 |
ENST00000596558.2 ENST00000453489.2 |
FKBP8 |
FK506 binding protein 8, 38kDa |
| chr5_+_75699040 | 1.76 |
ENST00000274364.6 |
IQGAP2 |
IQ motif containing GTPase activating protein 2 |
| chr9_+_90112767 | 1.66 |
ENST00000408954.3 |
DAPK1 |
death-associated protein kinase 1 |
| chr9_+_90112741 | 1.64 |
ENST00000469640.2 |
DAPK1 |
death-associated protein kinase 1 |
| chr11_-_3186494 | 1.62 |
ENST00000389989.3 ENST00000542243.1 |
OSBPL5 |
oxysterol binding protein-like 5 |
| chr11_+_64001962 | 1.61 |
ENST00000309422.2 |
VEGFB |
vascular endothelial growth factor B |
| chr19_+_46367518 | 1.58 |
ENST00000302177.2 |
FOXA3 |
forkhead box A3 |
| chr19_+_1104415 | 1.52 |
ENST00000585362.2 |
GPX4 |
glutathione peroxidase 4 |
| chr11_+_64002292 | 1.36 |
ENST00000426086.2 |
VEGFB |
vascular endothelial growth factor B |
| chr16_+_2880157 | 1.36 |
ENST00000382280.3 |
ZG16B |
zymogen granule protein 16B |
| chr1_-_1293904 | 1.35 |
ENST00000309212.6 ENST00000342753.4 ENST00000445648.2 |
MXRA8 |
matrix-remodelling associated 8 |
| chr9_+_133320301 | 1.34 |
ENST00000352480.5 |
ASS1 |
argininosuccinate synthase 1 |
| chr12_-_124457257 | 1.34 |
ENST00000545891.1 |
CCDC92 |
coiled-coil domain containing 92 |
| chrX_-_153707545 | 1.29 |
ENST00000357360.4 |
LAGE3 |
L antigen family, member 3 |
| chr19_-_3029011 | 1.27 |
ENST00000590536.1 ENST00000587137.1 ENST00000455444.2 ENST00000262953.6 |
TLE2 |
transducin-like enhancer of split 2 (E(sp1) homolog, Drosophila) |
| chr14_-_92414055 | 1.25 |
ENST00000342058.4 |
FBLN5 |
fibulin 5 |
| chr16_+_2880369 | 1.22 |
ENST00000572863.1 |
ZG16B |
zymogen granule protein 16B |
| chr20_+_62694461 | 1.22 |
ENST00000343484.5 ENST00000395053.3 |
TCEA2 |
transcription elongation factor A (SII), 2 |
| chr11_-_1780261 | 1.20 |
ENST00000427721.1 |
RP11-295K3.1 |
RP11-295K3.1 |
| chr9_+_133320339 | 1.18 |
ENST00000372394.1 ENST00000372393.3 ENST00000422569.1 |
ASS1 |
argininosuccinate synthase 1 |
| chr4_-_57522470 | 1.17 |
ENST00000503639.3 |
HOPX |
HOP homeobox |
| chr11_-_100999775 | 1.17 |
ENST00000263463.5 |
PGR |
progesterone receptor |
| chr19_+_17392672 | 1.16 |
ENST00000594072.1 ENST00000598347.1 |
ANKLE1 |
ankyrin repeat and LEM domain containing 1 |
| chr21_+_45161301 | 1.13 |
ENST00000467908.1 |
PDXK |
pyridoxal (pyridoxine, vitamin B6) kinase |
| chr8_-_41754231 | 1.13 |
ENST00000265709.8 |
ANK1 |
ankyrin 1, erythrocytic |
| chr9_-_95896550 | 1.12 |
ENST00000375446.4 |
NINJ1 |
ninjurin 1 |
| chr20_+_62697564 | 1.11 |
ENST00000458442.1 |
TCEA2 |
transcription elongation factor A (SII), 2 |
| chr22_+_45898712 | 1.10 |
ENST00000455233.1 ENST00000348697.2 ENST00000402984.3 ENST00000262722.7 ENST00000327858.6 ENST00000442170.2 ENST00000340923.5 ENST00000439835.1 |
FBLN1 |
fibulin 1 |
| chr11_-_3186576 | 1.10 |
ENST00000348039.5 ENST00000263650.7 |
OSBPL5 |
oxysterol binding protein-like 5 |
| chr1_-_3528034 | 1.09 |
ENST00000356575.4 |
MEGF6 |
multiple EGF-like-domains 6 |
| chr19_+_35630926 | 1.08 |
ENST00000588081.1 ENST00000589121.1 |
FXYD1 |
FXYD domain containing ion transport regulator 1 |
| chr4_-_57522598 | 1.08 |
ENST00000553379.2 |
HOPX |
HOP homeobox |
| chr17_-_42277203 | 1.08 |
ENST00000587097.1 |
ATXN7L3 |
ataxin 7-like 3 |
| chrX_-_107019181 | 1.07 |
ENST00000315660.4 ENST00000372384.2 ENST00000502650.1 ENST00000506724.1 |
TSC22D3 |
TSC22 domain family, member 3 |
| chr2_+_128175997 | 1.07 |
ENST00000234071.3 ENST00000429925.1 ENST00000442644.1 ENST00000453608.2 |
PROC |
protein C (inactivator of coagulation factors Va and VIIIa) |
| chr22_-_21387127 | 1.05 |
ENST00000426145.1 |
SLC7A4 |
solute carrier family 7, member 4 |
| chr12_-_124457371 | 1.05 |
ENST00000238156.3 ENST00000545037.1 |
CCDC92 |
coiled-coil domain containing 92 |
| chr21_+_47518011 | 1.03 |
ENST00000300527.4 ENST00000357838.4 ENST00000310645.5 |
COL6A2 |
collagen, type VI, alpha 2 |
| chr20_+_62694834 | 1.03 |
ENST00000415602.1 |
TCEA2 |
transcription elongation factor A (SII), 2 |
| chr14_-_92413727 | 1.03 |
ENST00000267620.10 |
FBLN5 |
fibulin 5 |
| chr19_-_3025614 | 1.02 |
ENST00000447365.2 |
TLE2 |
transducin-like enhancer of split 2 (E(sp1) homolog, Drosophila) |
| chr11_-_35547151 | 1.02 |
ENST00000378878.3 ENST00000529303.1 ENST00000278360.3 |
PAMR1 |
peptidase domain containing associated with muscle regeneration 1 |
| chr8_+_37654693 | 1.01 |
ENST00000412232.2 |
GPR124 |
G protein-coupled receptor 124 |
| chr1_+_26147319 | 0.97 |
ENST00000374300.3 |
MTFR1L |
mitochondrial fission regulator 1-like |
| chr3_-_141868357 | 0.97 |
ENST00000489671.1 ENST00000475734.1 ENST00000467072.1 ENST00000499676.2 |
TFDP2 |
transcription factor Dp-2 (E2F dimerization partner 2) |
| chr17_-_42200996 | 0.97 |
ENST00000587135.1 ENST00000225983.6 ENST00000393622.2 ENST00000588703.1 |
HDAC5 |
histone deacetylase 5 |
| chr1_-_3447967 | 0.97 |
ENST00000294599.4 |
MEGF6 |
multiple EGF-like-domains 6 |
| chr4_-_2264015 | 0.95 |
ENST00000337190.2 |
MXD4 |
MAX dimerization protein 4 |
| chr19_-_3062881 | 0.95 |
ENST00000586742.1 |
AES |
amino-terminal enhancer of split |
| chr16_-_31214051 | 0.94 |
ENST00000350605.4 |
PYCARD |
PYD and CARD domain containing |
| chr12_+_133264156 | 0.94 |
ENST00000317479.3 ENST00000543589.1 |
PXMP2 |
peroxisomal membrane protein 2, 22kDa |
| chr3_+_44903361 | 0.94 |
ENST00000302392.4 |
TMEM42 |
transmembrane protein 42 |
| chr19_-_59010565 | 0.94 |
ENST00000594786.1 |
SLC27A5 |
solute carrier family 27 (fatty acid transporter), member 5 |
| chr17_-_43045439 | 0.93 |
ENST00000253407.3 |
C1QL1 |
complement component 1, q subcomponent-like 1 |
| chr1_-_935361 | 0.93 |
ENST00000484667.2 |
HES4 |
hes family bHLH transcription factor 4 |
| chr16_+_23569021 | 0.92 |
ENST00000567212.1 ENST00000567264.1 |
UBFD1 |
ubiquitin family domain containing 1 |
| chr1_+_203274639 | 0.90 |
ENST00000290551.4 |
BTG2 |
BTG family, member 2 |
| chr9_-_130661916 | 0.90 |
ENST00000373142.1 ENST00000373146.1 ENST00000373144.3 |
ST6GALNAC6 |
ST6 (alpha-N-acetyl-neuraminyl-2,3-beta-galactosyl-1,3)-N-acetylgalactosaminide alpha-2,6-sialyltransferase 6 |
| chr11_+_117070904 | 0.90 |
ENST00000529792.1 |
TAGLN |
transgelin |
| chr22_+_25003606 | 0.90 |
ENST00000432867.1 |
GGT1 |
gamma-glutamyltransferase 1 |
| chr7_-_27169801 | 0.90 |
ENST00000511914.1 |
HOXA4 |
homeobox A4 |
| chr2_-_10220538 | 0.89 |
ENST00000381813.4 |
CYS1 |
cystin 1 |
| chr22_-_24622080 | 0.88 |
ENST00000425408.1 |
GGT5 |
gamma-glutamyltransferase 5 |
| chr19_-_39466396 | 0.88 |
ENST00000292852.4 |
FBXO17 |
F-box protein 17 |
| chr1_+_33722080 | 0.87 |
ENST00000483388.1 ENST00000539719.1 |
ZNF362 |
zinc finger protein 362 |
| chr14_-_22005018 | 0.87 |
ENST00000546363.1 |
SALL2 |
spalt-like transcription factor 2 |
| chrX_+_16964794 | 0.86 |
ENST00000357277.3 |
REPS2 |
RALBP1 associated Eps domain containing 2 |
| chr16_-_15149917 | 0.86 |
ENST00000287706.3 |
NTAN1 |
N-terminal asparagine amidase |
| chr5_-_168728103 | 0.85 |
ENST00000519560.1 |
SLIT3 |
slit homolog 3 (Drosophila) |
| chr11_-_2924720 | 0.85 |
ENST00000455942.2 |
SLC22A18AS |
solute carrier family 22 (organic cation transporter), member 18 antisense |
| chr14_+_105941118 | 0.85 |
ENST00000550577.1 ENST00000538259.2 |
CRIP2 |
cysteine-rich protein 2 |
| chrX_-_107018969 | 0.84 |
ENST00000372383.4 |
TSC22D3 |
TSC22 domain family, member 3 |
| chr1_+_6105974 | 0.83 |
ENST00000378083.3 |
KCNAB2 |
potassium voltage-gated channel, shaker-related subfamily, beta member 2 |
| chr2_-_219925189 | 0.83 |
ENST00000295731.6 |
IHH |
indian hedgehog |
| chr7_-_130353553 | 0.83 |
ENST00000330992.7 ENST00000445977.2 |
COPG2 |
coatomer protein complex, subunit gamma 2 |
| chr16_+_447226 | 0.82 |
ENST00000433358.1 |
NME4 |
NME/NM23 nucleoside diphosphate kinase 4 |
| chr1_+_6845497 | 0.82 |
ENST00000473578.1 ENST00000557126.1 |
CAMTA1 |
calmodulin binding transcription activator 1 |
| chr19_+_17337406 | 0.82 |
ENST00000597836.1 |
OCEL1 |
occludin/ELL domain containing 1 |
| chr19_-_18391708 | 0.81 |
ENST00000600972.1 |
JUND |
jun D proto-oncogene |
| chr4_-_140201333 | 0.81 |
ENST00000398955.1 |
MGARP |
mitochondria-localized glutamic acid-rich protein |
| chr16_+_2880254 | 0.81 |
ENST00000570670.1 |
ZG16B |
zymogen granule protein 16B |
| chr15_-_83316711 | 0.81 |
ENST00000568128.1 |
CPEB1 |
cytoplasmic polyadenylation element binding protein 1 |
| chr15_-_93616340 | 0.80 |
ENST00000557420.1 ENST00000542321.2 |
RGMA |
repulsive guidance molecule family member a |
| chrX_-_153707246 | 0.80 |
ENST00000407062.1 |
LAGE3 |
L antigen family, member 3 |
| chr20_+_62694590 | 0.80 |
ENST00000339217.4 |
TCEA2 |
transcription elongation factor A (SII), 2 |
| chr1_-_182360498 | 0.80 |
ENST00000417584.2 |
GLUL |
glutamate-ammonia ligase |
| chrX_-_3631635 | 0.79 |
ENST00000262848.5 |
PRKX |
protein kinase, X-linked |
| chr19_+_1104048 | 0.79 |
ENST00000593032.1 ENST00000588919.1 |
GPX4 |
glutathione peroxidase 4 |
| chr12_+_50355647 | 0.78 |
ENST00000293599.6 |
AQP5 |
aquaporin 5 |
| chr8_-_91657740 | 0.78 |
ENST00000422900.1 |
TMEM64 |
transmembrane protein 64 |
| chr17_-_30185971 | 0.78 |
ENST00000378634.2 |
COPRS |
coordinator of PRMT5, differentiation stimulator |
| chr5_-_132113036 | 0.78 |
ENST00000378706.1 |
SEPT8 |
septin 8 |
| chr19_+_1105110 | 0.78 |
ENST00000587648.1 |
GPX4 |
glutathione peroxidase 4 |
| chr19_+_1103936 | 0.78 |
ENST00000354171.8 ENST00000589115.1 |
GPX4 |
glutathione peroxidase 4 |
| chr16_+_2880296 | 0.78 |
ENST00000571723.1 |
ZG16B |
zymogen granule protein 16B |
| chrX_+_135229731 | 0.78 |
ENST00000420362.1 |
FHL1 |
four and a half LIM domains 1 |
| chr5_-_132113063 | 0.77 |
ENST00000378719.2 |
SEPT8 |
septin 8 |
| chr5_-_179780312 | 0.77 |
ENST00000253778.8 |
GFPT2 |
glutamine-fructose-6-phosphate transaminase 2 |
| chr3_-_141868293 | 0.77 |
ENST00000317104.7 ENST00000494358.1 |
TFDP2 |
transcription factor Dp-2 (E2F dimerization partner 2) |
| chr11_+_308143 | 0.77 |
ENST00000399817.4 |
IFITM2 |
interferon induced transmembrane protein 2 |
| chr2_-_175870085 | 0.77 |
ENST00000409156.3 |
CHN1 |
chimerin 1 |
| chr3_+_45071622 | 0.76 |
ENST00000428034.1 |
CLEC3B |
C-type lectin domain family 3, member B |
| chr19_-_44124019 | 0.76 |
ENST00000300811.3 |
ZNF428 |
zinc finger protein 428 |
| chr9_+_124062071 | 0.76 |
ENST00000373818.4 |
GSN |
gelsolin |
| chr19_-_49149553 | 0.76 |
ENST00000084798.4 |
CA11 |
carbonic anhydrase XI |
| chr14_-_92413353 | 0.76 |
ENST00000556154.1 |
FBLN5 |
fibulin 5 |
| chr2_+_85646054 | 0.76 |
ENST00000389938.2 |
SH2D6 |
SH2 domain containing 6 |
| chr3_-_71802760 | 0.76 |
ENST00000295612.3 |
EIF4E3 |
eukaryotic translation initiation factor 4E family member 3 |
| chr1_-_935491 | 0.75 |
ENST00000304952.6 |
HES4 |
hes family bHLH transcription factor 4 |
| chr17_-_30185946 | 0.75 |
ENST00000579741.1 |
COPRS |
coordinator of PRMT5, differentiation stimulator |
| chr16_-_15149828 | 0.75 |
ENST00000566419.1 ENST00000568320.1 |
NTAN1 |
N-terminal asparagine amidase |
| chr7_+_73082152 | 0.75 |
ENST00000324941.4 ENST00000451519.1 |
VPS37D |
vacuolar protein sorting 37 homolog D (S. cerevisiae) |
| chr19_-_14201776 | 0.75 |
ENST00000269724.5 |
SAMD1 |
sterile alpha motif domain containing 1 |
| chr11_+_64781575 | 0.74 |
ENST00000246747.4 ENST00000529384.1 |
ARL2 |
ADP-ribosylation factor-like 2 |
| chr19_-_48048518 | 0.74 |
ENST00000595558.1 ENST00000263351.5 |
ZNF541 |
zinc finger protein 541 |
| chr1_+_206680879 | 0.74 |
ENST00000355294.4 ENST00000367117.3 |
RASSF5 |
Ras association (RalGDS/AF-6) domain family member 5 |
| chr14_+_105939276 | 0.73 |
ENST00000483017.3 |
CRIP2 |
cysteine-rich protein 2 |
| chr7_-_1067968 | 0.73 |
ENST00000412051.1 |
C7orf50 |
chromosome 7 open reading frame 50 |
| chrX_-_101771645 | 0.73 |
ENST00000289373.4 |
TMSB15A |
thymosin beta 15a |
| chr22_-_24322019 | 0.73 |
ENST00000350608.3 |
DDT |
D-dopachrome tautomerase |
| chr19_-_4454081 | 0.73 |
ENST00000591919.1 |
UBXN6 |
UBX domain protein 6 |
| chrX_+_16964985 | 0.73 |
ENST00000303843.7 |
REPS2 |
RALBP1 associated Eps domain containing 2 |
| chr5_-_107717058 | 0.73 |
ENST00000359660.5 |
FBXL17 |
F-box and leucine-rich repeat protein 17 |
| chr16_+_447209 | 0.72 |
ENST00000382940.4 ENST00000219479.2 |
NME4 |
NME/NM23 nucleoside diphosphate kinase 4 |
| chr19_+_56152262 | 0.72 |
ENST00000325333.5 ENST00000590190.1 |
ZNF580 |
zinc finger protein 580 |
| chr9_-_120177342 | 0.72 |
ENST00000361209.2 |
ASTN2 |
astrotactin 2 |
| chr11_+_313503 | 0.72 |
ENST00000528780.1 ENST00000328221.5 |
IFITM1 |
interferon induced transmembrane protein 1 |
| chr19_+_4304632 | 0.72 |
ENST00000597590.1 |
FSD1 |
fibronectin type III and SPRY domain containing 1 |
| chrX_+_152760397 | 0.72 |
ENST00000331595.4 ENST00000431891.1 |
BGN |
biglycan |
| chr17_-_73178599 | 0.72 |
ENST00000578238.1 |
SUMO2 |
small ubiquitin-like modifier 2 |
| chr20_+_35169885 | 0.72 |
ENST00000279022.2 ENST00000346786.2 |
MYL9 |
myosin, light chain 9, regulatory |
| chr6_+_32821924 | 0.72 |
ENST00000374859.2 ENST00000453265.2 |
PSMB9 |
proteasome (prosome, macropain) subunit, beta type, 9 |
| chr16_-_30905263 | 0.71 |
ENST00000572628.1 |
BCL7C |
B-cell CLL/lymphoma 7C |
| chr1_-_153517473 | 0.71 |
ENST00000368715.1 |
S100A4 |
S100 calcium binding protein A4 |
| chr2_+_128180842 | 0.70 |
ENST00000402125.2 |
PROC |
protein C (inactivator of coagulation factors Va and VIIIa) |
| chr2_-_27294500 | 0.70 |
ENST00000447619.1 ENST00000429985.1 ENST00000456793.1 |
OST4 |
oligosaccharyltransferase 4 homolog (S. cerevisiae) |
| chr4_-_6675550 | 0.70 |
ENST00000513179.1 ENST00000515205.1 |
RP11-539L10.3 |
RP11-539L10.3 |
| chr21_-_46237959 | 0.70 |
ENST00000397898.3 ENST00000411651.2 |
SUMO3 |
small ubiquitin-like modifier 3 |
| chr21_+_27011899 | 0.70 |
ENST00000425221.2 |
JAM2 |
junctional adhesion molecule 2 |
| chr19_+_4304585 | 0.70 |
ENST00000221856.6 |
FSD1 |
fibronectin type III and SPRY domain containing 1 |
| chr15_-_83316087 | 0.69 |
ENST00000568757.1 |
CPEB1 |
cytoplasmic polyadenylation element binding protein 1 |
| chr1_-_38471156 | 0.69 |
ENST00000373016.3 |
FHL3 |
four and a half LIM domains 3 |
| chr22_-_39239987 | 0.69 |
ENST00000333039.2 |
NPTXR |
neuronal pentraxin receptor |
| chr11_-_57335280 | 0.69 |
ENST00000287156.4 |
UBE2L6 |
ubiquitin-conjugating enzyme E2L 6 |
| chr14_-_101034407 | 0.69 |
ENST00000443071.2 ENST00000557378.1 |
BEGAIN |
brain-enriched guanylate kinase-associated |
| chr1_-_236228403 | 0.69 |
ENST00000366595.3 |
NID1 |
nidogen 1 |
| chr17_-_19290483 | 0.69 |
ENST00000395592.2 ENST00000299610.4 |
MFAP4 |
microfibrillar-associated protein 4 |
| chr1_+_228327923 | 0.68 |
ENST00000391865.3 |
GUK1 |
guanylate kinase 1 |
| chr10_-_135171479 | 0.68 |
ENST00000447176.1 |
FUOM |
fucose mutarotase |
| chr17_+_6918064 | 0.68 |
ENST00000546760.1 ENST00000552402.1 |
C17orf49 |
chromosome 17 open reading frame 49 |
| chr10_+_111967345 | 0.68 |
ENST00000332674.5 ENST00000453116.1 |
MXI1 |
MAX interactor 1, dimerization protein |
| chr16_+_476379 | 0.68 |
ENST00000434585.1 |
RAB11FIP3 |
RAB11 family interacting protein 3 (class II) |
| chr17_+_73043301 | 0.67 |
ENST00000322444.6 |
KCTD2 |
potassium channel tetramerization domain containing 2 |
| chr1_-_204116078 | 0.67 |
ENST00000367198.2 ENST00000452983.1 |
ETNK2 |
ethanolamine kinase 2 |
| chr3_+_54156570 | 0.67 |
ENST00000415676.2 |
CACNA2D3 |
calcium channel, voltage-dependent, alpha 2/delta subunit 3 |
| chr12_-_48213568 | 0.67 |
ENST00000080059.7 ENST00000354334.3 ENST00000430670.1 ENST00000552960.1 ENST00000440293.1 |
HDAC7 |
histone deacetylase 7 |
| chr19_-_17414179 | 0.67 |
ENST00000594194.1 ENST00000247706.3 |
ABHD8 |
abhydrolase domain containing 8 |
| chr5_+_95066823 | 0.66 |
ENST00000506817.1 ENST00000379982.3 |
RHOBTB3 |
Rho-related BTB domain containing 3 |
| chr19_+_41107249 | 0.66 |
ENST00000396819.3 |
LTBP4 |
latent transforming growth factor beta binding protein 4 |
| chr21_-_44496441 | 0.66 |
ENST00000359624.3 ENST00000352178.5 |
CBS |
cystathionine-beta-synthase |
| chr2_+_30369807 | 0.66 |
ENST00000379520.3 ENST00000379519.3 ENST00000261353.4 |
YPEL5 |
yippee-like 5 (Drosophila) |
| chr8_+_37654424 | 0.66 |
ENST00000315215.7 |
GPR124 |
G protein-coupled receptor 124 |
| chr2_-_85641162 | 0.66 |
ENST00000447219.2 ENST00000409670.1 ENST00000409724.1 |
CAPG |
capping protein (actin filament), gelsolin-like |
| chr17_+_66509019 | 0.66 |
ENST00000585981.1 ENST00000589480.1 ENST00000585815.1 |
PRKAR1A |
protein kinase, cAMP-dependent, regulatory, type I, alpha |
| chr22_-_24303340 | 0.66 |
ENST00000404172.3 ENST00000290765.4 |
GSTT2B |
glutathione S-transferase theta 2B (gene/pseudogene) |
| chr2_+_30370382 | 0.65 |
ENST00000402708.1 |
YPEL5 |
yippee-like 5 (Drosophila) |
| chr16_-_4850471 | 0.65 |
ENST00000592019.1 ENST00000586153.1 |
ROGDI |
rogdi homolog (Drosophila) |
| chr12_-_110486348 | 0.65 |
ENST00000547573.1 ENST00000546651.2 ENST00000551185.2 |
C12orf76 |
chromosome 12 open reading frame 76 |
| chr11_+_77532155 | 0.65 |
ENST00000532481.1 ENST00000526415.1 ENST00000393427.2 ENST00000527134.1 ENST00000304716.8 |
AAMDC |
adipogenesis associated, Mth938 domain containing |
| chr11_-_63933504 | 0.65 |
ENST00000255681.6 |
MACROD1 |
MACRO domain containing 1 |
| chr3_-_196045127 | 0.65 |
ENST00000325318.5 |
TCTEX1D2 |
Tctex1 domain containing 2 |
| chr1_-_2126192 | 0.65 |
ENST00000378546.4 |
C1orf86 |
chromosome 1 open reading frame 86 |
| chr17_-_19281203 | 0.65 |
ENST00000487415.2 |
B9D1 |
B9 protein domain 1 |
| chr19_-_56092187 | 0.65 |
ENST00000325421.4 ENST00000592239.1 |
ZNF579 |
zinc finger protein 579 |
| chr19_+_56159362 | 0.65 |
ENST00000593069.1 ENST00000308964.3 |
CCDC106 |
coiled-coil domain containing 106 |
| chr17_-_42200958 | 0.65 |
ENST00000336057.5 |
HDAC5 |
histone deacetylase 5 |
| chr14_+_105886150 | 0.65 |
ENST00000331320.7 ENST00000406191.1 |
MTA1 |
metastasis associated 1 |
| chr17_-_76921459 | 0.64 |
ENST00000262768.7 |
TIMP2 |
TIMP metallopeptidase inhibitor 2 |
| chr15_-_93616892 | 0.64 |
ENST00000556658.1 ENST00000538818.1 ENST00000425933.2 |
RGMA |
repulsive guidance molecule family member a |
| chr19_+_47104553 | 0.64 |
ENST00000598871.1 ENST00000594523.1 |
CALM3 |
calmodulin 3 (phosphorylase kinase, delta) |
| chr12_+_53443680 | 0.64 |
ENST00000314250.6 ENST00000451358.1 |
TENC1 |
tensin like C1 domain containing phosphatase (tensin 2) |
| chr5_+_172483347 | 0.63 |
ENST00000522692.1 ENST00000296953.2 ENST00000540014.1 ENST00000520420.1 |
CREBRF |
CREB3 regulatory factor |
| chr19_-_47922750 | 0.63 |
ENST00000331559.5 |
MEIS3 |
Meis homeobox 3 |
| chr16_-_54963026 | 0.63 |
ENST00000560208.1 ENST00000557792.1 |
CRNDE |
colorectal neoplasia differentially expressed (non-protein coding) |
| chr17_+_80332153 | 0.63 |
ENST00000313135.2 |
UTS2R |
urotensin 2 receptor |
| chr11_-_65640325 | 0.63 |
ENST00000307998.6 |
EFEMP2 |
EGF containing fibulin-like extracellular matrix protein 2 |
| chr1_+_6845578 | 0.62 |
ENST00000467404.2 ENST00000439411.2 |
CAMTA1 |
calmodulin binding transcription activator 1 |
| chr19_+_45418067 | 0.62 |
ENST00000589078.1 ENST00000586638.1 |
APOC1 |
apolipoprotein C-I |
| chr15_+_25200108 | 0.62 |
ENST00000577949.1 ENST00000338094.6 ENST00000338327.4 ENST00000579070.1 ENST00000577565.1 |
SNURF SNRPN |
SNRPN upstream reading frame protein small nuclear ribonucleoprotein polypeptide N |
| chr17_+_6918093 | 0.62 |
ENST00000439424.2 |
C17orf49 |
chromosome 17 open reading frame 49 |
| chr19_+_35630022 | 0.62 |
ENST00000589209.1 |
FXYD1 |
FXYD domain containing ion transport regulator 1 |
| chr11_+_77532233 | 0.62 |
ENST00000525409.1 |
AAMDC |
adipogenesis associated, Mth938 domain containing |
| chrX_+_135229600 | 0.62 |
ENST00000370690.3 |
FHL1 |
four and a half LIM domains 1 |
| chr14_+_101302041 | 0.62 |
ENST00000522618.1 |
MEG3 |
maternally expressed 3 (non-protein coding) |
| chr6_+_52226897 | 0.61 |
ENST00000442253.2 |
PAQR8 |
progestin and adipoQ receptor family member VIII |
Gene Ontology Analysis
Gene overrepresentation in biological_process category:
| Log-likelihood per target | Total log-likelihood | Term | Description |
|---|---|---|---|
| 0.8 | 5.0 | GO:0021834 | chemorepulsion involved in embryonic olfactory bulb interneuron precursor migration(GO:0021834) |
| 0.6 | 1.8 | GO:0044537 | regulation of circulating fibrinogen levels(GO:0044537) |
| 0.4 | 1.3 | GO:0006535 | cysteine biosynthetic process from serine(GO:0006535) |
| 0.4 | 2.6 | GO:0010734 | protein glutathionylation(GO:0010731) regulation of protein glutathionylation(GO:0010732) negative regulation of protein glutathionylation(GO:0010734) |
| 0.4 | 1.3 | GO:0043095 | regulation of GTP cyclohydrolase I activity(GO:0043095) negative regulation of GTP cyclohydrolase I activity(GO:0043105) |
| 0.4 | 1.2 | GO:1903465 | vacuolar phosphate transport(GO:0007037) positive regulation of mitotic cell cycle DNA replication(GO:1903465) positive regulation of parathyroid hormone secretion(GO:2000830) |
| 0.4 | 1.2 | GO:0006542 | glutamine biosynthetic process(GO:0006542) |
| 0.4 | 1.6 | GO:0010900 | negative regulation of phosphatidylcholine catabolic process(GO:0010900) |
| 0.4 | 1.6 | GO:1902499 | positive regulation of protein autoubiquitination(GO:1902499) |
| 0.4 | 1.1 | GO:0009443 | pyridoxal 5'-phosphate salvage(GO:0009443) |
| 0.4 | 1.8 | GO:0044856 | plasma membrane raft distribution(GO:0044855) plasma membrane raft localization(GO:0044856) plasma membrane raft polarization(GO:0044858) regulation of plasma membrane raft polarization(GO:1903906) |
| 0.4 | 1.4 | GO:0009183 | purine deoxyribonucleoside diphosphate biosynthetic process(GO:0009183) |
| 0.4 | 0.4 | GO:0010039 | response to iron ion(GO:0010039) |
| 0.3 | 1.4 | GO:0060748 | tertiary branching involved in mammary gland duct morphogenesis(GO:0060748) |
| 0.3 | 1.3 | GO:0006850 | mitochondrial pyruvate transport(GO:0006850) mitochondrial pyruvate transmembrane transport(GO:1902361) |
| 0.3 | 1.0 | GO:0002588 | positive regulation of antigen processing and presentation of peptide or polysaccharide antigen via MHC class II(GO:0002582) positive regulation of antigen processing and presentation of peptide antigen(GO:0002585) positive regulation of antigen processing and presentation of peptide antigen via MHC class II(GO:0002588) |
| 0.3 | 1.3 | GO:0099552 | trans-synaptic signaling by lipid, modulating synaptic transmission(GO:0099552) trans-synaptic signaling by endocannabinoid, modulating synaptic transmission(GO:0099553) |
| 0.3 | 2.9 | GO:0070236 | negative regulation of activation-induced cell death of T cells(GO:0070236) |
| 0.3 | 0.3 | GO:1902263 | apoptotic process involved in embryonic digit morphogenesis(GO:1902263) |
| 0.3 | 0.9 | GO:1902824 | positive regulation of late endosome to lysosome transport(GO:1902824) |
| 0.3 | 0.6 | GO:0016574 | histone ubiquitination(GO:0016574) |
| 0.3 | 1.5 | GO:0009439 | cyanate metabolic process(GO:0009439) cyanate catabolic process(GO:0009440) |
| 0.3 | 2.7 | GO:0006526 | arginine biosynthetic process(GO:0006526) |
| 0.3 | 0.9 | GO:0071301 | cellular response to vitamin B1(GO:0071301) response to formaldehyde(GO:1904404) |
| 0.3 | 3.7 | GO:0048251 | elastic fiber assembly(GO:0048251) |
| 0.3 | 1.4 | GO:0035801 | adrenal cortex development(GO:0035801) adrenal cortex formation(GO:0035802) |
| 0.3 | 0.8 | GO:0016539 | intein-mediated protein splicing(GO:0016539) protein splicing(GO:0030908) |
| 0.3 | 1.6 | GO:1902766 | skeletal muscle satellite cell migration(GO:1902766) |
| 0.3 | 0.8 | GO:0003064 | regulation of heart rate by hormone(GO:0003064) |
| 0.3 | 5.7 | GO:0070493 | thrombin receptor signaling pathway(GO:0070493) |
| 0.3 | 0.8 | GO:0036446 | myofibroblast differentiation(GO:0036446) regulation of myofibroblast differentiation(GO:1904760) |
| 0.3 | 0.5 | GO:0090272 | negative regulation of fibroblast growth factor production(GO:0090272) |
| 0.3 | 1.3 | GO:1902728 | positive regulation of skeletal muscle cell proliferation(GO:0014858) positive regulation of skeletal muscle satellite cell proliferation(GO:1902724) positive regulation of growth factor dependent skeletal muscle satellite cell proliferation(GO:1902728) |
| 0.2 | 0.7 | GO:0051685 | maintenance of ER location(GO:0051685) |
| 0.2 | 2.2 | GO:0060754 | positive regulation of mast cell chemotaxis(GO:0060754) |
| 0.2 | 1.7 | GO:0019344 | cysteine biosynthetic process(GO:0019344) |
| 0.2 | 0.5 | GO:0019521 | aldonic acid metabolic process(GO:0019520) D-gluconate metabolic process(GO:0019521) |
| 0.2 | 1.0 | GO:0033173 | calcineurin-NFAT signaling cascade(GO:0033173) |
| 0.2 | 0.7 | GO:0044691 | tooth eruption(GO:0044691) |
| 0.2 | 1.4 | GO:0061518 | macrophage proliferation(GO:0061517) microglial cell proliferation(GO:0061518) regulation of neuronal signal transduction(GO:1902847) positive regulation of neurofibrillary tangle assembly(GO:1902998) |
| 0.2 | 0.9 | GO:0061743 | motor learning(GO:0061743) |
| 0.2 | 0.2 | GO:0060017 | parathyroid gland development(GO:0060017) |
| 0.2 | 0.9 | GO:0046110 | xanthine metabolic process(GO:0046110) |
| 0.2 | 1.4 | GO:0070458 | cellular detoxification of nitrogen compound(GO:0070458) |
| 0.2 | 0.2 | GO:1903903 | regulation of establishment of T cell polarity(GO:1903903) |
| 0.2 | 0.9 | GO:1903644 | regulation of chaperone-mediated protein folding(GO:1903644) |
| 0.2 | 0.7 | GO:0016561 | protein import into peroxisome matrix, translocation(GO:0016561) |
| 0.2 | 0.7 | GO:0035674 | tricarboxylic acid transmembrane transport(GO:0035674) |
| 0.2 | 0.4 | GO:0009051 | pentose-phosphate shunt, oxidative branch(GO:0009051) |
| 0.2 | 0.7 | GO:1903722 | regulation of centriole elongation(GO:1903722) |
| 0.2 | 1.5 | GO:0006642 | triglyceride mobilization(GO:0006642) |
| 0.2 | 2.0 | GO:0032510 | endosome to lysosome transport via multivesicular body sorting pathway(GO:0032510) |
| 0.2 | 0.6 | GO:0090290 | positive regulation of osteoclast proliferation(GO:0090290) |
| 0.2 | 1.3 | GO:0046208 | spermine catabolic process(GO:0046208) |
| 0.2 | 0.6 | GO:0016260 | selenocysteine biosynthetic process(GO:0016260) |
| 0.2 | 0.4 | GO:0072262 | metanephric glomerular mesangial cell proliferation involved in metanephros development(GO:0072262) |
| 0.2 | 0.6 | GO:1900169 | regulation of glucocorticoid mediated signaling pathway(GO:1900169) |
| 0.2 | 0.6 | GO:0046005 | positive regulation of circadian sleep/wake cycle, REM sleep(GO:0046005) |
| 0.2 | 0.8 | GO:0006408 | snRNA export from nucleus(GO:0006408) |
| 0.2 | 0.4 | GO:0060940 | epithelial to mesenchymal transition involved in cardiac fibroblast development(GO:0060940) |
| 0.2 | 0.6 | GO:0001544 | initiation of primordial ovarian follicle growth(GO:0001544) |
| 0.2 | 0.8 | GO:0089700 | protein kinase D signaling(GO:0089700) |
| 0.2 | 0.8 | GO:1904450 | negative regulation of gamma-aminobutyric acid secretion(GO:0014053) aspartate secretion(GO:0061528) regulation of aspartate secretion(GO:1904448) positive regulation of aspartate secretion(GO:1904450) |
| 0.2 | 0.2 | GO:1902916 | positive regulation of protein polyubiquitination(GO:1902916) |
| 0.2 | 1.2 | GO:1990822 | basic amino acid transmembrane transport(GO:1990822) |
| 0.2 | 1.4 | GO:0010756 | positive regulation of plasminogen activation(GO:0010756) |
| 0.2 | 0.8 | GO:0051490 | negative regulation of filopodium assembly(GO:0051490) |
| 0.2 | 2.6 | GO:0046051 | UTP metabolic process(GO:0046051) |
| 0.2 | 0.6 | GO:0045659 | regulation of neutrophil differentiation(GO:0045658) negative regulation of neutrophil differentiation(GO:0045659) |
| 0.2 | 1.4 | GO:0070995 | NADPH oxidation(GO:0070995) |
| 0.2 | 2.5 | GO:2000210 | positive regulation of anoikis(GO:2000210) |
| 0.2 | 0.6 | GO:0030505 | inorganic diphosphate transport(GO:0030505) |
| 0.2 | 0.2 | GO:0003169 | coronary vein morphogenesis(GO:0003169) |
| 0.2 | 0.9 | GO:2000671 | regulation of motor neuron apoptotic process(GO:2000671) |
| 0.2 | 0.6 | GO:0090310 | negative regulation of methylation-dependent chromatin silencing(GO:0090310) |
| 0.2 | 0.4 | GO:0015909 | long-chain fatty acid transport(GO:0015909) |
| 0.2 | 0.7 | GO:0030644 | cellular chloride ion homeostasis(GO:0030644) |
| 0.2 | 0.9 | GO:0002032 | desensitization of G-protein coupled receptor protein signaling pathway by arrestin(GO:0002032) |
| 0.2 | 0.6 | GO:0034552 | respiratory chain complex II assembly(GO:0034552) mitochondrial respiratory chain complex II assembly(GO:0034553) mitochondrial respiratory chain complex II biogenesis(GO:0097032) |
| 0.2 | 2.6 | GO:0060180 | female mating behavior(GO:0060180) |
| 0.2 | 1.5 | GO:0003065 | positive regulation of heart rate by epinephrine(GO:0003065) |
| 0.2 | 0.9 | GO:0019075 | virus maturation(GO:0019075) |
| 0.2 | 3.9 | GO:0019372 | lipoxygenase pathway(GO:0019372) |
| 0.2 | 0.6 | GO:0044240 | multicellular organism lipid catabolic process(GO:0044240) |
| 0.2 | 0.5 | GO:0045082 | positive regulation of interleukin-10 biosynthetic process(GO:0045082) |
| 0.2 | 0.2 | GO:1902498 | regulation of protein autoubiquitination(GO:1902498) |
| 0.2 | 1.1 | GO:0006021 | inositol biosynthetic process(GO:0006021) |
| 0.2 | 1.3 | GO:0040032 | post-embryonic body morphogenesis(GO:0040032) |
| 0.2 | 0.5 | GO:0045212 | negative regulation of synaptic transmission, cholinergic(GO:0032223) neurotransmitter receptor biosynthetic process(GO:0045212) |
| 0.2 | 3.8 | GO:0071447 | cellular response to hydroperoxide(GO:0071447) |
| 0.2 | 0.5 | GO:0009258 | 10-formyltetrahydrofolate catabolic process(GO:0009258) |
| 0.2 | 0.5 | GO:0035359 | negative regulation of peroxisome proliferator activated receptor signaling pathway(GO:0035359) |
| 0.2 | 1.2 | GO:0070164 | negative regulation of adiponectin secretion(GO:0070164) |
| 0.2 | 0.5 | GO:0048203 | vesicle targeting, trans-Golgi to endosome(GO:0048203) |
| 0.2 | 0.5 | GO:0006367 | transcription initiation from RNA polymerase II promoter(GO:0006367) |
| 0.2 | 0.5 | GO:0060139 | positive regulation by symbiont of host apoptotic process(GO:0052151) positive regulation of apoptotic process by virus(GO:0060139) |
| 0.2 | 1.9 | GO:0043985 | histone H4-R3 methylation(GO:0043985) |
| 0.2 | 1.0 | GO:0044339 | canonical Wnt signaling pathway involved in osteoblast differentiation(GO:0044339) |
| 0.2 | 0.5 | GO:0043418 | homocysteine catabolic process(GO:0043418) |
| 0.2 | 0.7 | GO:2001153 | regulation of renal water transport(GO:2001151) positive regulation of renal water transport(GO:2001153) |
| 0.2 | 1.0 | GO:0006651 | diacylglycerol biosynthetic process(GO:0006651) |
| 0.2 | 0.2 | GO:0031584 | activation of phospholipase D activity(GO:0031584) |
| 0.2 | 0.8 | GO:0055014 | atrial cardiac muscle cell differentiation(GO:0055011) atrial cardiac muscle cell development(GO:0055014) |
| 0.2 | 0.5 | GO:0015680 | intracellular copper ion transport(GO:0015680) |
| 0.2 | 0.3 | GO:0070814 | hydrogen sulfide biosynthetic process(GO:0070814) |
| 0.2 | 0.8 | GO:0097211 | response to gonadotropin-releasing hormone(GO:0097210) cellular response to gonadotropin-releasing hormone(GO:0097211) |
| 0.2 | 0.5 | GO:0045994 | positive regulation of translational initiation by iron(GO:0045994) |
| 0.2 | 0.5 | GO:1904886 | beta-catenin destruction complex disassembly(GO:1904886) |
| 0.2 | 0.3 | GO:0071963 | establishment or maintenance of cell polarity regulating cell shape(GO:0071963) |
| 0.2 | 1.0 | GO:0032377 | regulation of intracellular lipid transport(GO:0032377) regulation of intracellular sterol transport(GO:0032380) regulation of intracellular cholesterol transport(GO:0032383) |
| 0.2 | 0.3 | GO:0070813 | hydrogen sulfide metabolic process(GO:0070813) |
| 0.2 | 1.0 | GO:0090170 | regulation of Golgi inheritance(GO:0090170) |
| 0.2 | 0.3 | GO:0052255 | induction by symbiont of host defense response(GO:0044416) induction of host immune response by virus(GO:0046730) active induction of host immune response by virus(GO:0046732) modulation by symbiont of host defense response(GO:0052031) induction by organism of defense response of other organism involved in symbiotic interaction(GO:0052251) modulation by organism of defense response of other organism involved in symbiotic interaction(GO:0052255) positive regulation by symbiont of host defense response(GO:0052509) positive regulation by organism of defense response of other organism involved in symbiotic interaction(GO:0052510) modulation by organism of immune response of other organism involved in symbiotic interaction(GO:0052552) modulation by symbiont of host immune response(GO:0052553) modulation by virus of host immune response(GO:0075528) |
| 0.2 | 0.6 | GO:0050976 | detection of mechanical stimulus involved in sensory perception of touch(GO:0050976) |
| 0.2 | 1.3 | GO:0060355 | positive regulation of cell adhesion molecule production(GO:0060355) |
| 0.2 | 0.8 | GO:0018125 | peptidyl-cysteine methylation(GO:0018125) |
| 0.2 | 0.5 | GO:2001033 | negative regulation of double-strand break repair via nonhomologous end joining(GO:2001033) |
| 0.2 | 1.2 | GO:0007506 | gonadal mesoderm development(GO:0007506) |
| 0.2 | 0.9 | GO:0010133 | proline catabolic process to glutamate(GO:0010133) |
| 0.2 | 2.2 | GO:0006002 | fructose 6-phosphate metabolic process(GO:0006002) |
| 0.2 | 0.5 | GO:0060178 | regulation of exocyst assembly(GO:0001928) regulation of exocyst localization(GO:0060178) |
| 0.2 | 0.9 | GO:0045415 | negative regulation of interleukin-8 biosynthetic process(GO:0045415) |
| 0.2 | 0.6 | GO:0010266 | response to vitamin B1(GO:0010266) |
| 0.2 | 0.3 | GO:0046726 | positive regulation by virus of viral protein levels in host cell(GO:0046726) |
| 0.2 | 0.8 | GO:0006975 | DNA damage induced protein phosphorylation(GO:0006975) |
| 0.2 | 0.3 | GO:0021966 | corticospinal neuron axon guidance(GO:0021966) |
| 0.2 | 0.3 | GO:0005985 | sucrose metabolic process(GO:0005985) |
| 0.2 | 0.8 | GO:0071494 | cellular response to UV-C(GO:0071494) |
| 0.2 | 2.3 | GO:0034393 | positive regulation of smooth muscle cell apoptotic process(GO:0034393) |
| 0.2 | 0.6 | GO:0038089 | positive regulation of cell migration by vascular endothelial growth factor signaling pathway(GO:0038089) |
| 0.2 | 0.5 | GO:0021569 | rhombomere 3 development(GO:0021569) |
| 0.1 | 0.4 | GO:0061188 | negative regulation of chromatin silencing at rDNA(GO:0061188) |
| 0.1 | 0.7 | GO:0090135 | actin filament branching(GO:0090135) |
| 0.1 | 0.4 | GO:0061181 | regulation of chondrocyte development(GO:0061181) |
| 0.1 | 0.6 | GO:0030219 | megakaryocyte differentiation(GO:0030219) |
| 0.1 | 0.1 | GO:0045668 | negative regulation of osteoblast differentiation(GO:0045668) |
| 0.1 | 0.7 | GO:1904579 | response to thapsigargin(GO:1904578) cellular response to thapsigargin(GO:1904579) |
| 0.1 | 0.4 | GO:2000777 | positive regulation of proteasomal ubiquitin-dependent protein catabolic process involved in cellular response to hypoxia(GO:2000777) |
| 0.1 | 0.3 | GO:0010701 | positive regulation of norepinephrine secretion(GO:0010701) |
| 0.1 | 1.3 | GO:0097646 | calcitonin family receptor signaling pathway(GO:0097646) amylin receptor signaling pathway(GO:0097647) |
| 0.1 | 0.1 | GO:0003416 | endochondral bone growth(GO:0003416) |
| 0.1 | 0.8 | GO:0018094 | protein polyglycylation(GO:0018094) |
| 0.1 | 0.4 | GO:0032802 | low-density lipoprotein particle receptor catabolic process(GO:0032802) |
| 0.1 | 0.1 | GO:0072166 | posterior mesonephric tubule development(GO:0072166) |
| 0.1 | 0.1 | GO:0010726 | positive regulation of hydrogen peroxide metabolic process(GO:0010726) |
| 0.1 | 0.1 | GO:2000243 | positive regulation of reproductive process(GO:2000243) |
| 0.1 | 1.2 | GO:0007288 | sperm axoneme assembly(GO:0007288) |
| 0.1 | 0.5 | GO:0003219 | cardiac right ventricle formation(GO:0003219) |
| 0.1 | 0.1 | GO:1902725 | negative regulation of satellite cell differentiation(GO:1902725) |
| 0.1 | 1.0 | GO:0051388 | positive regulation of neurotrophin TRK receptor signaling pathway(GO:0051388) |
| 0.1 | 0.7 | GO:1902732 | positive regulation of chondrocyte proliferation(GO:1902732) |
| 0.1 | 0.4 | GO:0007176 | regulation of epidermal growth factor-activated receptor activity(GO:0007176) |
| 0.1 | 1.6 | GO:0006995 | cellular response to nitrogen starvation(GO:0006995) cellular response to nitrogen levels(GO:0043562) |
| 0.1 | 0.4 | GO:0071883 | activation of MAPK activity by adrenergic receptor signaling pathway(GO:0071883) |
| 0.1 | 0.5 | GO:0071344 | diphosphate metabolic process(GO:0071344) |
| 0.1 | 0.9 | GO:2000035 | regulation of stem cell division(GO:2000035) |
| 0.1 | 0.8 | GO:1901300 | positive regulation of hydrogen peroxide-mediated programmed cell death(GO:1901300) |
| 0.1 | 0.4 | GO:0021938 | ventral midline development(GO:0007418) smoothened signaling pathway involved in regulation of cerebellar granule cell precursor cell proliferation(GO:0021938) |
| 0.1 | 0.9 | GO:0043932 | ossification involved in bone remodeling(GO:0043932) |
| 0.1 | 0.1 | GO:0032290 | peripheral nervous system myelin formation(GO:0032290) |
| 0.1 | 0.4 | GO:0006579 | amino-acid betaine catabolic process(GO:0006579) |
| 0.1 | 0.1 | GO:1902041 | regulation of extrinsic apoptotic signaling pathway via death domain receptors(GO:1902041) |
| 0.1 | 1.0 | GO:0010606 | positive regulation of cytoplasmic mRNA processing body assembly(GO:0010606) |
| 0.1 | 2.4 | GO:0045199 | maintenance of apical/basal cell polarity(GO:0035090) maintenance of epithelial cell apical/basal polarity(GO:0045199) |
| 0.1 | 0.6 | GO:0044571 | [2Fe-2S] cluster assembly(GO:0044571) |
| 0.1 | 0.1 | GO:0021897 | forebrain astrocyte differentiation(GO:0021896) forebrain astrocyte development(GO:0021897) |
| 0.1 | 0.4 | GO:0050760 | negative regulation of thymidylate synthase biosynthetic process(GO:0050760) |
| 0.1 | 0.9 | GO:0055129 | L-proline biosynthetic process(GO:0055129) |
| 0.1 | 0.6 | GO:0006064 | glucuronate catabolic process(GO:0006064) glucuronate catabolic process to xylulose 5-phosphate(GO:0019640) xylulose 5-phosphate metabolic process(GO:0051167) xylulose 5-phosphate biosynthetic process(GO:1901159) |
| 0.1 | 0.1 | GO:0060081 | membrane hyperpolarization(GO:0060081) |
| 0.1 | 0.4 | GO:2001271 | negative regulation of cysteine-type endopeptidase activity involved in execution phase of apoptosis(GO:2001271) |
| 0.1 | 0.4 | GO:1902745 | positive regulation of lamellipodium organization(GO:1902745) positive regulation of lamellipodium morphogenesis(GO:2000394) |
| 0.1 | 0.4 | GO:0036072 | intramembranous ossification(GO:0001957) direct ossification(GO:0036072) |
| 0.1 | 1.3 | GO:0032020 | ISG15-protein conjugation(GO:0032020) |
| 0.1 | 0.4 | GO:0071418 | cellular response to amine stimulus(GO:0071418) |
| 0.1 | 0.8 | GO:2000382 | positive regulation of mesoderm development(GO:2000382) |
| 0.1 | 0.1 | GO:1904379 | protein localization to cytosolic proteasome complex(GO:1904327) protein localization to cytosolic proteasome complex involved in ERAD pathway(GO:1904379) |
| 0.1 | 0.6 | GO:0071492 | cellular response to UV-A(GO:0071492) |
| 0.1 | 1.5 | GO:1900028 | negative regulation of ruffle assembly(GO:1900028) |
| 0.1 | 0.1 | GO:0060623 | regulation of chromosome condensation(GO:0060623) |
| 0.1 | 0.6 | GO:0060154 | cellular process regulating host cell cycle in response to virus(GO:0060154) |
| 0.1 | 1.7 | GO:2000766 | negative regulation of cytoplasmic translation(GO:2000766) |
| 0.1 | 0.4 | GO:1904717 | excitatory chemical synaptic transmission(GO:0098976) regulation of AMPA glutamate receptor clustering(GO:1904717) positive regulation of AMPA glutamate receptor clustering(GO:1904719) |
| 0.1 | 0.7 | GO:0000432 | regulation of transcription from RNA polymerase II promoter by glucose(GO:0000430) positive regulation of transcription from RNA polymerase II promoter by glucose(GO:0000432) |
| 0.1 | 0.4 | GO:1902811 | tongue muscle cell differentiation(GO:0035981) positive regulation of skeletal muscle fiber differentiation(GO:1902811) regulation of tongue muscle cell differentiation(GO:2001035) positive regulation of tongue muscle cell differentiation(GO:2001037) |
| 0.1 | 0.2 | GO:0009093 | cysteine catabolic process(GO:0009093) L-cysteine catabolic process(GO:0019448) L-cysteine metabolic process(GO:0046439) |
| 0.1 | 0.2 | GO:1903772 | regulation of viral budding via host ESCRT complex(GO:1903772) |
| 0.1 | 1.7 | GO:0010891 | negative regulation of sequestering of triglyceride(GO:0010891) |
| 0.1 | 0.6 | GO:0010040 | response to iron(II) ion(GO:0010040) |
| 0.1 | 0.9 | GO:1903593 | regulation of histamine secretion by mast cell(GO:1903593) |
| 0.1 | 0.1 | GO:0042662 | negative regulation of mesodermal cell fate specification(GO:0042662) |
| 0.1 | 0.1 | GO:0044034 | negative stranded viral RNA replication(GO:0039689) multi-organism biosynthetic process(GO:0044034) |
| 0.1 | 1.1 | GO:0046618 | drug export(GO:0046618) |
| 0.1 | 0.2 | GO:1901491 | negative regulation of lymphangiogenesis(GO:1901491) |
| 0.1 | 0.7 | GO:0070086 | ubiquitin-dependent endocytosis(GO:0070086) |
| 0.1 | 1.6 | GO:0022417 | protein maturation by protein folding(GO:0022417) |
| 0.1 | 0.1 | GO:1900365 | positive regulation of mRNA polyadenylation(GO:1900365) positive regulation of apoptotic DNA fragmentation(GO:1902512) |
| 0.1 | 0.4 | GO:0016185 | synaptic vesicle budding from presynaptic endocytic zone membrane(GO:0016185) |
| 0.1 | 0.2 | GO:0030579 | ubiquitin-dependent SMAD protein catabolic process(GO:0030579) |
| 0.1 | 0.8 | GO:0050915 | sensory perception of sour taste(GO:0050915) |
| 0.1 | 0.2 | GO:0035898 | parathyroid hormone secretion(GO:0035898) |
| 0.1 | 1.4 | GO:2001028 | positive regulation of endothelial cell chemotaxis(GO:2001028) |
| 0.1 | 0.3 | GO:1900039 | positive regulation of cellular response to hypoxia(GO:1900039) |
| 0.1 | 0.3 | GO:2000661 | positive regulation of interleukin-1-mediated signaling pathway(GO:2000661) |
| 0.1 | 0.5 | GO:0051866 | general adaptation syndrome(GO:0051866) |
| 0.1 | 0.5 | GO:0030070 | insulin processing(GO:0030070) |
| 0.1 | 0.5 | GO:0042418 | epinephrine metabolic process(GO:0042414) epinephrine biosynthetic process(GO:0042418) |
| 0.1 | 0.3 | GO:0010621 | negative regulation of transcription by transcription factor localization(GO:0010621) |
| 0.1 | 0.3 | GO:0019364 | NADP catabolic process(GO:0006742) pyridine nucleotide catabolic process(GO:0019364) |
| 0.1 | 0.6 | GO:0018101 | protein citrullination(GO:0018101) histone citrullination(GO:0036414) |
| 0.1 | 0.1 | GO:1901205 | regulation of adrenergic receptor signaling pathway involved in heart process(GO:1901204) negative regulation of adrenergic receptor signaling pathway involved in heart process(GO:1901205) |
| 0.1 | 0.5 | GO:0097327 | response to antineoplastic agent(GO:0097327) |
| 0.1 | 0.8 | GO:0075044 | autophagy of host cells involved in interaction with symbiont(GO:0075044) autophagy involved in symbiotic interaction(GO:0075071) |
| 0.1 | 1.8 | GO:0090051 | negative regulation of cell migration involved in sprouting angiogenesis(GO:0090051) |
| 0.1 | 0.4 | GO:1903778 | protein localization to vacuolar membrane(GO:1903778) |
| 0.1 | 0.2 | GO:0033563 | dorsal/ventral axon guidance(GO:0033563) |
| 0.1 | 0.7 | GO:0000050 | urea cycle(GO:0000050) |
| 0.1 | 0.6 | GO:0042078 | germ-line stem cell division(GO:0042078) male germ-line stem cell asymmetric division(GO:0048133) germline stem cell asymmetric division(GO:0098728) |
| 0.1 | 0.4 | GO:0036496 | regulation of translational initiation by eIF2 alpha dephosphorylation(GO:0036496) |
| 0.1 | 0.2 | GO:0051414 | response to cortisol(GO:0051414) |
| 0.1 | 0.1 | GO:0009447 | putrescine catabolic process(GO:0009447) |
| 0.1 | 0.1 | GO:0044273 | sulfur compound catabolic process(GO:0044273) |
| 0.1 | 0.3 | GO:0006121 | mitochondrial electron transport, succinate to ubiquinone(GO:0006121) |
| 0.1 | 0.3 | GO:0090341 | negative regulation of secretion of lysosomal enzymes(GO:0090341) |
| 0.1 | 0.5 | GO:0030997 | regulation of centriole-centriole cohesion(GO:0030997) |
| 0.1 | 0.4 | GO:0090071 | negative regulation of ribosome biogenesis(GO:0090071) |
| 0.1 | 0.1 | GO:0030575 | nuclear body organization(GO:0030575) |
| 0.1 | 0.2 | GO:0006566 | threonine metabolic process(GO:0006566) |
| 0.1 | 0.2 | GO:0072034 | renal vesicle induction(GO:0072034) |
| 0.1 | 0.4 | GO:0070124 | mitochondrial translational initiation(GO:0070124) |
| 0.1 | 0.4 | GO:0035026 | leading edge cell differentiation(GO:0035026) |
| 0.1 | 1.5 | GO:0044351 | macropinocytosis(GO:0044351) |
| 0.1 | 1.2 | GO:0038007 | netrin-activated signaling pathway(GO:0038007) |
| 0.1 | 0.8 | GO:0035865 | cellular response to potassium ion(GO:0035865) |
| 0.1 | 1.1 | GO:0000052 | citrulline metabolic process(GO:0000052) |
| 0.1 | 0.3 | GO:0035811 | negative regulation of urine volume(GO:0035811) |
| 0.1 | 0.1 | GO:0030718 | germ-line stem cell population maintenance(GO:0030718) |
| 0.1 | 0.1 | GO:0035928 | rRNA import into mitochondrion(GO:0035928) |
| 0.1 | 0.2 | GO:0006059 | hexitol metabolic process(GO:0006059) |
| 0.1 | 0.3 | GO:0060666 | dichotomous subdivision of terminal units involved in salivary gland branching(GO:0060666) |
| 0.1 | 0.6 | GO:0015961 | diadenosine polyphosphate catabolic process(GO:0015961) diphosphoinositol polyphosphate metabolic process(GO:0071543) diadenosine pentaphosphate metabolic process(GO:1901906) diadenosine pentaphosphate catabolic process(GO:1901907) diadenosine hexaphosphate metabolic process(GO:1901908) diadenosine hexaphosphate catabolic process(GO:1901909) adenosine 5'-(hexahydrogen pentaphosphate) metabolic process(GO:1901910) adenosine 5'-(hexahydrogen pentaphosphate) catabolic process(GO:1901911) |
| 0.1 | 0.1 | GO:0035509 | negative regulation of myosin-light-chain-phosphatase activity(GO:0035509) negative regulation of bicellular tight junction assembly(GO:1903347) |
| 0.1 | 0.9 | GO:0010918 | positive regulation of mitochondrial membrane potential(GO:0010918) |
| 0.1 | 0.3 | GO:0033386 | geranylgeranyl diphosphate metabolic process(GO:0033385) geranylgeranyl diphosphate biosynthetic process(GO:0033386) |
| 0.1 | 0.4 | GO:0033277 | abortive mitotic cell cycle(GO:0033277) |
| 0.1 | 1.3 | GO:0006564 | L-serine biosynthetic process(GO:0006564) |
| 0.1 | 2.5 | GO:0001829 | trophectodermal cell differentiation(GO:0001829) |
| 0.1 | 0.4 | GO:0046061 | dATP catabolic process(GO:0046061) |
| 0.1 | 0.4 | GO:1900186 | negative regulation of clathrin-mediated endocytosis(GO:1900186) |
| 0.1 | 0.1 | GO:0034445 | regulation of plasma lipoprotein particle oxidation(GO:0034444) negative regulation of plasma lipoprotein particle oxidation(GO:0034445) |
| 0.1 | 0.4 | GO:0035262 | gonad morphogenesis(GO:0035262) |
| 0.1 | 0.2 | GO:0035696 | monocyte extravasation(GO:0035696) regulation of monocyte extravasation(GO:2000437) |
| 0.1 | 0.2 | GO:0045074 | interleukin-10 biosynthetic process(GO:0042091) regulation of interleukin-10 biosynthetic process(GO:0045074) |
| 0.1 | 0.7 | GO:0098881 | exocytic insertion of neurotransmitter receptor to plasma membrane(GO:0098881) exocytic insertion of neurotransmitter receptor to postsynaptic membrane(GO:0098967) |
| 0.1 | 0.2 | GO:0010922 | positive regulation of phosphatase activity(GO:0010922) |
| 0.1 | 0.1 | GO:0007052 | mitotic spindle organization(GO:0007052) |
| 0.1 | 0.5 | GO:0010609 | mRNA localization resulting in posttranscriptional regulation of gene expression(GO:0010609) |
| 0.1 | 0.1 | GO:0046666 | retinal cell programmed cell death(GO:0046666) regulation of retinal cell programmed cell death(GO:0046668) |
| 0.1 | 0.2 | GO:0000117 | regulation of transcription involved in G2/M transition of mitotic cell cycle(GO:0000117) |
| 0.1 | 0.8 | GO:0030578 | PML body organization(GO:0030578) |
| 0.1 | 1.4 | GO:0032836 | glomerular basement membrane development(GO:0032836) |
| 0.1 | 0.4 | GO:0061739 | protein lipidation involved in autophagosome assembly(GO:0061739) |
| 0.1 | 0.4 | GO:0060265 | positive regulation of respiratory burst involved in inflammatory response(GO:0060265) |
| 0.1 | 0.5 | GO:1902268 | negative regulation of polyamine transmembrane transport(GO:1902268) |
| 0.1 | 0.3 | GO:0070842 | aggresome assembly(GO:0070842) |
| 0.1 | 0.4 | GO:0042989 | sequestering of actin monomers(GO:0042989) |
| 0.1 | 0.5 | GO:1902109 | negative regulation of mitochondrial membrane permeability involved in apoptotic process(GO:1902109) |
| 0.1 | 0.3 | GO:0010157 | response to chlorate(GO:0010157) |
| 0.1 | 0.2 | GO:0010265 | SCF complex assembly(GO:0010265) |
| 0.1 | 0.8 | GO:0048050 | post-embryonic eye morphogenesis(GO:0048050) |
| 0.1 | 1.4 | GO:0014041 | regulation of neuron maturation(GO:0014041) |
| 0.1 | 0.8 | GO:0090050 | positive regulation of cell migration involved in sprouting angiogenesis(GO:0090050) |
| 0.1 | 0.1 | GO:0061162 | establishment of apical/basal cell polarity(GO:0035089) establishment of epithelial cell apical/basal polarity(GO:0045198) establishment of monopolar cell polarity(GO:0061162) establishment or maintenance of monopolar cell polarity(GO:0061339) |
| 0.1 | 0.3 | GO:0032571 | response to vitamin K(GO:0032571) |
| 0.1 | 0.3 | GO:0002326 | B cell lineage commitment(GO:0002326) |
| 0.1 | 0.1 | GO:1902938 | regulation of intracellular calcium activated chloride channel activity(GO:1902938) |
| 0.1 | 0.3 | GO:0034384 | high-density lipoprotein particle clearance(GO:0034384) |
| 0.1 | 0.4 | GO:0042631 | cellular response to water deprivation(GO:0042631) |
| 0.1 | 0.2 | GO:0090611 | ubiquitin-independent protein catabolic process via the multivesicular body sorting pathway(GO:0090611) |
| 0.1 | 0.9 | GO:0071493 | cellular response to UV-B(GO:0071493) |
| 0.1 | 0.2 | GO:0033591 | response to L-ascorbic acid(GO:0033591) |
| 0.1 | 0.4 | GO:1903976 | negative regulation of glial cell migration(GO:1903976) |
| 0.1 | 0.4 | GO:0035513 | oxidative RNA demethylation(GO:0035513) oxidative single-stranded RNA demethylation(GO:0035553) |
| 0.1 | 0.3 | GO:1903070 | negative regulation of ER-associated ubiquitin-dependent protein catabolic process(GO:1903070) |
| 0.1 | 0.5 | GO:0010796 | regulation of multivesicular body size(GO:0010796) |
| 0.1 | 0.6 | GO:0003190 | atrioventricular valve formation(GO:0003190) |
| 0.1 | 0.3 | GO:0071427 | mRNA export from nucleus(GO:0006406) mRNA-containing ribonucleoprotein complex export from nucleus(GO:0071427) |
| 0.1 | 0.7 | GO:0035583 | sequestering of TGFbeta in extracellular matrix(GO:0035583) |
| 0.1 | 0.7 | GO:0097577 | intracellular sequestering of iron ion(GO:0006880) sequestering of iron ion(GO:0097577) |
| 0.1 | 0.4 | GO:0035690 | cellular response to drug(GO:0035690) |
| 0.1 | 0.5 | GO:0015670 | carbon dioxide transport(GO:0015670) |
| 0.1 | 1.7 | GO:0043508 | negative regulation of JUN kinase activity(GO:0043508) |
| 0.1 | 0.6 | GO:0035845 | photoreceptor cell outer segment organization(GO:0035845) |
| 0.1 | 0.4 | GO:0070375 | ERK5 cascade(GO:0070375) |
| 0.1 | 0.1 | GO:0048146 | positive regulation of fibroblast proliferation(GO:0048146) |
| 0.1 | 0.7 | GO:0044211 | CTP salvage(GO:0044211) |
| 0.1 | 0.9 | GO:0045838 | positive regulation of membrane potential(GO:0045838) |
| 0.1 | 0.9 | GO:0043951 | negative regulation of cAMP-mediated signaling(GO:0043951) |
| 0.1 | 1.0 | GO:0060033 | anatomical structure regression(GO:0060033) |
| 0.1 | 2.5 | GO:1901687 | glutathione derivative metabolic process(GO:1901685) glutathione derivative biosynthetic process(GO:1901687) |
| 0.1 | 0.4 | GO:0034141 | positive regulation of toll-like receptor 3 signaling pathway(GO:0034141) |
| 0.1 | 0.3 | GO:0018153 | isopeptide cross-linking via N6-(L-isoglutamyl)-L-lysine(GO:0018153) isopeptide cross-linking(GO:0018262) |
| 0.1 | 0.5 | GO:1900273 | positive regulation of long-term synaptic potentiation(GO:1900273) |
| 0.1 | 1.6 | GO:0007021 | tubulin complex assembly(GO:0007021) |
| 0.1 | 0.3 | GO:1904529 | regulation of actin filament binding(GO:1904529) negative regulation of actin filament binding(GO:1904530) regulation of actin binding(GO:1904616) negative regulation of actin binding(GO:1904617) |
| 0.1 | 0.1 | GO:0046294 | formaldehyde catabolic process(GO:0046294) |
| 0.1 | 0.3 | GO:1903676 | regulation of cap-dependent translational initiation(GO:1903674) positive regulation of cap-dependent translational initiation(GO:1903676) |
| 0.1 | 1.0 | GO:0039702 | viral budding via host ESCRT complex(GO:0039702) |
| 0.1 | 0.1 | GO:1902617 | response to fluoride(GO:1902617) |
| 0.1 | 0.4 | GO:0071894 | histone H2B conserved C-terminal lysine ubiquitination(GO:0071894) |
| 0.1 | 0.6 | GO:0033210 | leptin-mediated signaling pathway(GO:0033210) |
| 0.1 | 0.4 | GO:0001976 | neurological system process involved in regulation of systemic arterial blood pressure(GO:0001976) |
| 0.1 | 0.8 | GO:0002414 | immunoglobulin transcytosis in epithelial cells(GO:0002414) |
| 0.1 | 0.3 | GO:1902995 | regulation of phospholipid efflux(GO:1902994) positive regulation of phospholipid efflux(GO:1902995) |
| 0.1 | 0.2 | GO:0072709 | cellular response to sorbitol(GO:0072709) |
| 0.1 | 0.5 | GO:0035407 | histone H3-T11 phosphorylation(GO:0035407) |
| 0.1 | 0.1 | GO:0016199 | axon midline choice point recognition(GO:0016199) |
| 0.1 | 0.3 | GO:0072757 | cellular response to camptothecin(GO:0072757) response to camptothecin(GO:1901563) |
| 0.1 | 0.3 | GO:0014859 | negative regulation of skeletal muscle cell proliferation(GO:0014859) negative regulation of skeletal muscle satellite cell proliferation(GO:1902723) |
| 0.1 | 0.6 | GO:0071670 | smooth muscle cell chemotaxis(GO:0071670) |
| 0.1 | 0.4 | GO:0071603 | endothelial cell-cell adhesion(GO:0071603) |
| 0.1 | 1.2 | GO:0001574 | ganglioside biosynthetic process(GO:0001574) |
| 0.1 | 0.3 | GO:0060830 | ciliary receptor clustering involved in smoothened signaling pathway(GO:0060830) |
| 0.1 | 0.3 | GO:0015800 | acidic amino acid transport(GO:0015800) L-glutamate transport(GO:0015813) |
| 0.1 | 0.4 | GO:0000720 | pyrimidine dimer repair by nucleotide-excision repair(GO:0000720) post-embryonic hemopoiesis(GO:0035166) |
| 0.1 | 0.6 | GO:0051725 | protein de-ADP-ribosylation(GO:0051725) |
| 0.1 | 0.3 | GO:0035494 | SNARE complex disassembly(GO:0035494) |
| 0.1 | 0.3 | GO:0043096 | purine nucleobase salvage(GO:0043096) |
| 0.1 | 0.8 | GO:0044130 | negative regulation of growth of symbiont in host(GO:0044130) |
| 0.1 | 0.3 | GO:2000537 | regulation of B cell chemotaxis(GO:2000537) positive regulation of B cell chemotaxis(GO:2000538) |
| 0.1 | 0.6 | GO:0072733 | response to staurosporine(GO:0072733) cellular response to staurosporine(GO:0072734) |
| 0.1 | 0.2 | GO:1900126 | negative regulation of hyaluronan biosynthetic process(GO:1900126) |
| 0.1 | 0.8 | GO:0033211 | adiponectin-activated signaling pathway(GO:0033211) |
| 0.1 | 0.2 | GO:1902949 | positive regulation of tau-protein kinase activity(GO:1902949) |
| 0.1 | 0.1 | GO:0006844 | acyl carnitine transport(GO:0006844) acyl carnitine transmembrane transport(GO:1902616) |
| 0.1 | 3.8 | GO:0070911 | global genome nucleotide-excision repair(GO:0070911) |
| 0.1 | 0.5 | GO:1901186 | positive regulation of ERBB signaling pathway(GO:1901186) |
| 0.1 | 0.2 | GO:0003340 | negative regulation of mesenchymal to epithelial transition involved in metanephros morphogenesis(GO:0003340) |
| 0.1 | 0.2 | GO:2001226 | negative regulation of chloride transport(GO:2001226) |
| 0.1 | 0.2 | GO:0015709 | thiosulfate transport(GO:0015709) oxaloacetate transport(GO:0015729) malate transport(GO:0015743) malate transmembrane transport(GO:0071423) oxaloacetate(2-) transmembrane transport(GO:1902356) |
| 0.1 | 2.6 | GO:0042776 | mitochondrial ATP synthesis coupled proton transport(GO:0042776) |
| 0.1 | 0.3 | GO:2000286 | receptor internalization involved in canonical Wnt signaling pathway(GO:2000286) |
| 0.1 | 0.2 | GO:0002276 | basophil activation involved in immune response(GO:0002276) |
| 0.1 | 0.9 | GO:0090168 | Golgi reassembly(GO:0090168) |
| 0.1 | 0.3 | GO:2000271 | positive regulation of fibroblast apoptotic process(GO:2000271) |
| 0.1 | 0.2 | GO:0060988 | lipid tube assembly(GO:0060988) |
| 0.1 | 0.2 | GO:0033499 | galactose catabolic process via UDP-galactose(GO:0033499) |
| 0.1 | 0.2 | GO:0021680 | cerebellar Purkinje cell layer development(GO:0021680) |
| 0.1 | 0.4 | GO:0034334 | adherens junction maintenance(GO:0034334) |
| 0.1 | 0.2 | GO:1902683 | regulation of receptor localization to synapse(GO:1902683) |
| 0.1 | 0.2 | GO:1902075 | cellular response to salt(GO:1902075) |
| 0.1 | 0.7 | GO:0050942 | positive regulation of pigment cell differentiation(GO:0050942) |
| 0.1 | 0.1 | GO:0070358 | actin polymerization-dependent cell motility(GO:0070358) |
| 0.1 | 0.4 | GO:0030043 | actin filament fragmentation(GO:0030043) |
| 0.1 | 0.6 | GO:0048104 | establishment of body hair or bristle planar orientation(GO:0048104) establishment of body hair planar orientation(GO:0048105) |
| 0.1 | 0.8 | GO:0045054 | constitutive secretory pathway(GO:0045054) |
| 0.1 | 0.3 | GO:0007468 | regulation of rhodopsin gene expression(GO:0007468) positive regulation of rhodopsin gene expression(GO:0045872) |
| 0.1 | 3.1 | GO:0035456 | response to interferon-beta(GO:0035456) |
| 0.1 | 0.5 | GO:0051198 | negative regulation of glycolytic process(GO:0045820) negative regulation of cofactor metabolic process(GO:0051195) negative regulation of coenzyme metabolic process(GO:0051198) |
| 0.1 | 0.5 | GO:0061083 | regulation of protein refolding(GO:0061083) negative regulation of protein refolding(GO:0061084) |
| 0.1 | 0.1 | GO:0002931 | response to ischemia(GO:0002931) |
| 0.1 | 0.2 | GO:0051835 | positive regulation of synapse structural plasticity(GO:0051835) |
| 0.1 | 1.6 | GO:1902857 | positive regulation of nonmotile primary cilium assembly(GO:1902857) |
| 0.1 | 0.2 | GO:0060994 | regulation of transcription from RNA polymerase II promoter involved in kidney development(GO:0060994) |
| 0.1 | 2.3 | GO:0051016 | barbed-end actin filament capping(GO:0051016) |
| 0.1 | 0.2 | GO:2001171 | positive regulation of ATP biosynthetic process(GO:2001171) |
| 0.1 | 0.5 | GO:0045602 | negative regulation of endothelial cell differentiation(GO:0045602) |
| 0.1 | 2.1 | GO:0016578 | histone deubiquitination(GO:0016578) |
| 0.1 | 0.2 | GO:0032286 | central nervous system myelin maintenance(GO:0032286) |
| 0.1 | 0.9 | GO:0048227 | plasma membrane to endosome transport(GO:0048227) |
| 0.1 | 0.1 | GO:0032499 | detection of peptidoglycan(GO:0032499) |
| 0.1 | 0.1 | GO:0043117 | positive regulation of vascular permeability(GO:0043117) |
| 0.1 | 0.4 | GO:0044208 | 'de novo' AMP biosynthetic process(GO:0044208) |
| 0.1 | 0.4 | GO:0019303 | D-ribose catabolic process(GO:0019303) |
| 0.1 | 1.7 | GO:0097034 | mitochondrial respiratory chain complex IV assembly(GO:0033617) mitochondrial respiratory chain complex IV biogenesis(GO:0097034) |
| 0.1 | 0.2 | GO:0061056 | sclerotome development(GO:0061056) |
| 0.1 | 0.5 | GO:1902897 | regulation of postsynaptic density protein 95 clustering(GO:1902897) |
| 0.1 | 0.9 | GO:2000576 | positive regulation of microtubule motor activity(GO:2000576) regulation of ATP-dependent microtubule motor activity, plus-end-directed(GO:2000580) positive regulation of ATP-dependent microtubule motor activity, plus-end-directed(GO:2000582) |
| 0.1 | 0.5 | GO:0021678 | third ventricle development(GO:0021678) |
| 0.1 | 4.5 | GO:0032784 | regulation of DNA-templated transcription, elongation(GO:0032784) |
| 0.1 | 0.3 | GO:0032487 | regulation of Rap protein signal transduction(GO:0032487) |
| 0.1 | 0.2 | GO:0032304 | negative regulation of icosanoid secretion(GO:0032304) |
| 0.1 | 0.1 | GO:1905244 | regulation of modification of synaptic structure(GO:1905244) |
| 0.1 | 0.3 | GO:0016240 | autophagosome docking(GO:0016240) |
| 0.1 | 0.2 | GO:1903546 | protein localization to photoreceptor outer segment(GO:1903546) |
| 0.1 | 0.1 | GO:0035634 | response to stilbenoid(GO:0035634) |
| 0.1 | 0.8 | GO:2000601 | positive regulation of Arp2/3 complex-mediated actin nucleation(GO:2000601) |
| 0.1 | 0.7 | GO:0097500 | receptor localization to nonmotile primary cilium(GO:0097500) |
| 0.1 | 0.2 | GO:0044029 | DNA hypomethylation(GO:0044028) hypomethylation of CpG island(GO:0044029) |
| 0.1 | 0.3 | GO:0046125 | thymidine metabolic process(GO:0046104) pyrimidine deoxyribonucleoside metabolic process(GO:0046125) |
| 0.1 | 0.7 | GO:0090315 | negative regulation of protein targeting to membrane(GO:0090315) |
| 0.1 | 1.6 | GO:0000028 | ribosomal small subunit assembly(GO:0000028) |
| 0.1 | 0.3 | GO:0071409 | cellular response to cycloheximide(GO:0071409) |
| 0.1 | 0.1 | GO:0090049 | regulation of cell migration involved in sprouting angiogenesis(GO:0090049) |
| 0.1 | 1.5 | GO:1900153 | regulation of nuclear-transcribed mRNA catabolic process, deadenylation-dependent decay(GO:1900151) positive regulation of nuclear-transcribed mRNA catabolic process, deadenylation-dependent decay(GO:1900153) |
| 0.1 | 0.2 | GO:0045124 | regulation of bone resorption(GO:0045124) |
| 0.1 | 0.6 | GO:0070269 | pyroptosis(GO:0070269) |
| 0.1 | 1.1 | GO:2001199 | negative regulation of dendritic cell differentiation(GO:2001199) |
| 0.1 | 0.1 | GO:0030913 | paranodal junction assembly(GO:0030913) |
| 0.1 | 0.8 | GO:0016576 | histone dephosphorylation(GO:0016576) |
| 0.1 | 0.5 | GO:1902455 | negative regulation of stem cell population maintenance(GO:1902455) |
| 0.1 | 0.6 | GO:0046836 | glycolipid transport(GO:0046836) |
| 0.1 | 0.4 | GO:0030242 | pexophagy(GO:0030242) |
| 0.1 | 0.1 | GO:1902563 | regulation of neutrophil degranulation(GO:0043313) regulation of neutrophil activation(GO:1902563) |
| 0.1 | 0.3 | GO:1901091 | regulation of protein tetramerization(GO:1901090) negative regulation of protein tetramerization(GO:1901091) regulation of protein homotetramerization(GO:1901093) negative regulation of protein homotetramerization(GO:1901094) |
| 0.1 | 0.1 | GO:0010807 | regulation of synaptic vesicle priming(GO:0010807) |
| 0.1 | 0.4 | GO:0035799 | ureter maturation(GO:0035799) |
| 0.1 | 0.2 | GO:1904636 | response to ionomycin(GO:1904636) cellular response to ionomycin(GO:1904637) |
| 0.1 | 0.9 | GO:1901750 | leukotriene D4 metabolic process(GO:1901748) leukotriene D4 biosynthetic process(GO:1901750) |
| 0.1 | 0.1 | GO:2000619 | negative regulation of histone H4-K16 acetylation(GO:2000619) |
| 0.1 | 0.7 | GO:0046078 | dUMP metabolic process(GO:0046078) |
| 0.1 | 0.1 | GO:0072014 | proximal tubule development(GO:0072014) |
| 0.1 | 0.4 | GO:0072364 | regulation of cellular ketone metabolic process by regulation of transcription from RNA polymerase II promoter(GO:0072364) |
| 0.1 | 0.1 | GO:0061051 | positive regulation of cell growth involved in cardiac muscle cell development(GO:0061051) |
| 0.1 | 0.2 | GO:0044805 | late nucleophagy(GO:0044805) |
| 0.1 | 0.1 | GO:0038091 | VEGF-activated platelet-derived growth factor receptor signaling pathway(GO:0038086) positive regulation of cell proliferation by VEGF-activated platelet derived growth factor receptor signaling pathway(GO:0038091) |
| 0.1 | 2.0 | GO:0097178 | ruffle assembly(GO:0097178) |
| 0.1 | 0.5 | GO:0015822 | ornithine transport(GO:0015822) |
| 0.1 | 0.3 | GO:0016480 | negative regulation of transcription from RNA polymerase III promoter(GO:0016480) |
| 0.1 | 1.5 | GO:0070208 | protein heterotrimerization(GO:0070208) |
| 0.1 | 0.2 | GO:0042416 | dopamine biosynthetic process(GO:0042416) |
| 0.1 | 0.2 | GO:0010936 | negative regulation of macrophage cytokine production(GO:0010936) |
| 0.1 | 0.1 | GO:1903225 | negative regulation of endodermal cell differentiation(GO:1903225) |
| 0.1 | 0.6 | GO:1900025 | negative regulation of substrate adhesion-dependent cell spreading(GO:1900025) |
| 0.1 | 0.2 | GO:0042853 | L-alanine metabolic process(GO:0042851) L-alanine catabolic process(GO:0042853) |
| 0.1 | 1.7 | GO:0036150 | phosphatidylserine acyl-chain remodeling(GO:0036150) |
| 0.1 | 0.6 | GO:0071798 | response to prostaglandin D(GO:0071798) cellular response to prostaglandin D stimulus(GO:0071799) |
| 0.1 | 0.9 | GO:2000696 | regulation of epithelial cell differentiation involved in kidney development(GO:2000696) |
| 0.1 | 0.1 | GO:0003402 | planar cell polarity pathway involved in axis elongation(GO:0003402) |
| 0.1 | 0.1 | GO:0042816 | vitamin B6 metabolic process(GO:0042816) |
| 0.1 | 0.1 | GO:0038003 | opioid receptor signaling pathway(GO:0038003) |
| 0.1 | 0.1 | GO:0010593 | negative regulation of lamellipodium assembly(GO:0010593) negative regulation of lamellipodium organization(GO:1902744) |
| 0.1 | 0.3 | GO:0021539 | subthalamus development(GO:0021539) |
| 0.1 | 3.6 | GO:1904837 | beta-catenin-TCF complex assembly(GO:1904837) |
| 0.1 | 0.1 | GO:0070781 | response to biotin(GO:0070781) |
| 0.1 | 0.3 | GO:0060800 | regulation of cell differentiation involved in embryonic placenta development(GO:0060800) |
| 0.1 | 0.3 | GO:0015722 | canalicular bile acid transport(GO:0015722) |
| 0.1 | 0.4 | GO:0090116 | C-5 methylation of cytosine(GO:0090116) |
| 0.1 | 0.2 | GO:0060392 | negative regulation of SMAD protein import into nucleus(GO:0060392) |
| 0.1 | 1.5 | GO:2000479 | regulation of cAMP-dependent protein kinase activity(GO:2000479) |
| 0.1 | 0.1 | GO:0038065 | collagen-activated signaling pathway(GO:0038065) |
| 0.1 | 0.1 | GO:0046457 | prostaglandin biosynthetic process(GO:0001516) prostanoid biosynthetic process(GO:0046457) |
| 0.1 | 0.6 | GO:0048280 | vesicle fusion with Golgi apparatus(GO:0048280) |
| 0.1 | 0.3 | GO:0070213 | protein auto-ADP-ribosylation(GO:0070213) |
| 0.1 | 0.7 | GO:0030091 | protein repair(GO:0030091) |
| 0.1 | 0.6 | GO:0046549 | retinal cone cell differentiation(GO:0042670) retinal cone cell development(GO:0046549) |
| 0.1 | 0.5 | GO:2000825 | positive regulation of androgen receptor activity(GO:2000825) |
| 0.1 | 0.5 | GO:0045950 | negative regulation of mitotic recombination(GO:0045950) |
| 0.1 | 0.6 | GO:1902746 | regulation of lens fiber cell differentiation(GO:1902746) |
| 0.1 | 0.1 | GO:0019418 | sulfide oxidation(GO:0019418) sulfide oxidation, using sulfide:quinone oxidoreductase(GO:0070221) |
| 0.1 | 0.4 | GO:0090625 | mRNA cleavage involved in gene silencing by siRNA(GO:0090625) |
| 0.1 | 0.3 | GO:0097089 | methyl-branched fatty acid metabolic process(GO:0097089) |
| 0.1 | 0.3 | GO:0061762 | CAMKK-AMPK signaling cascade(GO:0061762) |
| 0.1 | 0.6 | GO:0033235 | positive regulation of protein sumoylation(GO:0033235) |
| 0.1 | 0.1 | GO:0032070 | regulation of deoxyribonuclease activity(GO:0032070) |
| 0.1 | 0.2 | GO:1903862 | positive regulation of oxidative phosphorylation(GO:1903862) |
| 0.1 | 0.6 | GO:0043374 | CD8-positive, alpha-beta T cell differentiation(GO:0043374) |
| 0.1 | 0.4 | GO:0017196 | N-terminal peptidyl-methionine acetylation(GO:0017196) |
| 0.1 | 1.0 | GO:0090161 | Golgi ribbon formation(GO:0090161) |
| 0.1 | 1.1 | GO:0033141 | positive regulation of peptidyl-serine phosphorylation of STAT protein(GO:0033141) |
| 0.1 | 0.3 | GO:0000738 | DNA catabolic process, exonucleolytic(GO:0000738) |
| 0.1 | 0.1 | GO:0042822 | pyridoxal phosphate metabolic process(GO:0042822) |
| 0.1 | 0.3 | GO:0051970 | negative regulation of transmission of nerve impulse(GO:0051970) |
| 0.1 | 2.0 | GO:0042347 | negative regulation of NF-kappaB import into nucleus(GO:0042347) |
| 0.1 | 6.9 | GO:1902807 | negative regulation of cell cycle G1/S phase transition(GO:1902807) |
| 0.1 | 0.1 | GO:0031953 | negative regulation of protein autophosphorylation(GO:0031953) |
| 0.1 | 0.2 | GO:0046449 | creatinine metabolic process(GO:0046449) |
| 0.1 | 0.2 | GO:0014057 | positive regulation of acetylcholine secretion, neurotransmission(GO:0014057) |
| 0.1 | 0.3 | GO:0021553 | olfactory nerve development(GO:0021553) |
| 0.1 | 0.6 | GO:0009247 | glycolipid biosynthetic process(GO:0009247) |
| 0.1 | 0.4 | GO:0035609 | C-terminal protein deglutamylation(GO:0035609) |
| 0.1 | 1.3 | GO:0006646 | phosphatidylethanolamine biosynthetic process(GO:0006646) |
| 0.1 | 0.1 | GO:2000196 | positive regulation of female gonad development(GO:2000196) |
| 0.1 | 0.3 | GO:1902083 | negative regulation of peptidyl-cysteine S-nitrosylation(GO:1902083) |
| 0.1 | 0.4 | GO:0019626 | short-chain fatty acid catabolic process(GO:0019626) |
| 0.1 | 0.2 | GO:0052027 | modulation of signal transduction in other organism(GO:0044501) modulation by symbiont of host signal transduction pathway(GO:0052027) modulation of signal transduction in other organism involved in symbiotic interaction(GO:0052250) modulation by symbiont of host I-kappaB kinase/NF-kappaB cascade(GO:0085032) |
| 0.1 | 0.2 | GO:1901837 | negative regulation of transcription of nuclear large rRNA transcript from RNA polymerase I promoter(GO:1901837) |
| 0.1 | 0.1 | GO:0097049 | motor neuron apoptotic process(GO:0097049) |
| 0.1 | 0.7 | GO:0097396 | response to interleukin-17(GO:0097396) cellular response to interleukin-17(GO:0097398) |
| 0.1 | 0.2 | GO:0014816 | skeletal muscle satellite cell differentiation(GO:0014816) |
| 0.1 | 0.3 | GO:0003069 | age-dependent response to oxidative stress(GO:0001306) age-dependent response to reactive oxygen species(GO:0001315) regulation of systemic arterial blood pressure by acetylcholine(GO:0003068) vasodilation by acetylcholine involved in regulation of systemic arterial blood pressure(GO:0003069) regulation of systemic arterial blood pressure by neurotransmitter(GO:0003070) age-dependent general metabolic decline(GO:0007571) |
| 0.1 | 0.4 | GO:0010579 | regulation of adenylate cyclase activity involved in G-protein coupled receptor signaling pathway(GO:0010578) positive regulation of adenylate cyclase activity involved in G-protein coupled receptor signaling pathway(GO:0010579) |
| 0.1 | 0.4 | GO:0006537 | glutamate biosynthetic process(GO:0006537) |
| 0.1 | 0.1 | GO:1990785 | response to water-immersion restraint stress(GO:1990785) |
| 0.1 | 0.5 | GO:0071028 | nuclear RNA surveillance(GO:0071027) nuclear mRNA surveillance(GO:0071028) |
| 0.1 | 0.2 | GO:0031548 | regulation of brain-derived neurotrophic factor receptor signaling pathway(GO:0031548) |
| 0.1 | 0.2 | GO:0071442 | positive regulation of histone H3-K14 acetylation(GO:0071442) |
| 0.1 | 0.4 | GO:0006741 | NADP biosynthetic process(GO:0006741) |
| 0.1 | 0.4 | GO:0007258 | JUN phosphorylation(GO:0007258) |
| 0.1 | 0.2 | GO:0090204 | protein localization to nuclear pore(GO:0090204) |
| 0.1 | 0.5 | GO:0015889 | cobalamin transport(GO:0015889) |
| 0.1 | 0.2 | GO:0035754 | B cell chemotaxis(GO:0035754) |
| 0.1 | 0.2 | GO:0042357 | thiamine diphosphate metabolic process(GO:0042357) |
| 0.1 | 1.0 | GO:0044342 | type B pancreatic cell proliferation(GO:0044342) |
| 0.1 | 0.1 | GO:0048485 | sympathetic nervous system development(GO:0048485) |
| 0.1 | 0.2 | GO:0002644 | negative regulation of tolerance induction(GO:0002644) |
| 0.1 | 0.1 | GO:0033344 | cholesterol efflux(GO:0033344) |
| 0.1 | 0.1 | GO:1903378 | positive regulation of oxidative stress-induced neuron intrinsic apoptotic signaling pathway(GO:1903378) |
| 0.1 | 0.6 | GO:2000346 | negative regulation of hepatocyte proliferation(GO:2000346) |
| 0.1 | 0.4 | GO:0018095 | protein polyglutamylation(GO:0018095) |
| 0.1 | 0.5 | GO:0001661 | conditioned taste aversion(GO:0001661) |
| 0.1 | 0.1 | GO:0061300 | cerebellum vasculature development(GO:0061300) |
| 0.1 | 0.1 | GO:0050684 | regulation of mRNA processing(GO:0050684) |
| 0.1 | 0.2 | GO:0072236 | ascending thin limb development(GO:0072021) metanephric ascending thin limb development(GO:0072218) metanephric loop of Henle development(GO:0072236) |
| 0.1 | 0.5 | GO:0042473 | outer ear morphogenesis(GO:0042473) |
| 0.1 | 1.4 | GO:0006744 | ubiquinone biosynthetic process(GO:0006744) quinone biosynthetic process(GO:1901663) |
| 0.1 | 0.2 | GO:0070318 | positive regulation of G0 to G1 transition(GO:0070318) |
| 0.1 | 0.2 | GO:2000110 | negative regulation of macrophage apoptotic process(GO:2000110) |
| 0.1 | 0.5 | GO:0046325 | negative regulation of glucose import(GO:0046325) |
| 0.1 | 0.2 | GO:0010042 | response to manganese ion(GO:0010042) |
| 0.1 | 0.2 | GO:0019541 | acetate biosynthetic process(GO:0019413) acetyl-CoA biosynthetic process from acetate(GO:0019427) propionate metabolic process(GO:0019541) propionate biosynthetic process(GO:0019542) |
| 0.1 | 0.2 | GO:0097191 | extrinsic apoptotic signaling pathway(GO:0097191) |
| 0.1 | 0.5 | GO:0070934 | CRD-mediated mRNA stabilization(GO:0070934) |
| 0.1 | 0.3 | GO:0070272 | proton-transporting ATP synthase complex assembly(GO:0043461) proton-transporting ATP synthase complex biogenesis(GO:0070272) |
| 0.1 | 1.0 | GO:0045008 | depyrimidination(GO:0045008) |
| 0.1 | 0.3 | GO:0008626 | granzyme-mediated apoptotic signaling pathway(GO:0008626) |
| 0.1 | 0.2 | GO:0070885 | negative regulation of calcineurin-NFAT signaling cascade(GO:0070885) |
| 0.1 | 0.1 | GO:0072338 | cellular lactam metabolic process(GO:0072338) |
| 0.1 | 0.1 | GO:0002371 | dendritic cell cytokine production(GO:0002371) |
| 0.1 | 0.1 | GO:0042938 | dipeptide transport(GO:0042938) |
| 0.1 | 0.2 | GO:0071955 | recycling endosome to Golgi transport(GO:0071955) |
| 0.1 | 0.3 | GO:0090131 | mesenchyme migration(GO:0090131) |
| 0.1 | 0.1 | GO:0090182 | regulation of secretion of lysosomal enzymes(GO:0090182) |
| 0.1 | 0.4 | GO:0072592 | oxygen metabolic process(GO:0072592) |
| 0.1 | 0.3 | GO:0048625 | myoblast fate commitment(GO:0048625) |
| 0.1 | 0.2 | GO:0006293 | nucleotide-excision repair, preincision complex stabilization(GO:0006293) |
| 0.1 | 0.3 | GO:0007525 | somatic muscle development(GO:0007525) |
| 0.1 | 0.1 | GO:0090241 | negative regulation of histone H4 acetylation(GO:0090241) |
| 0.1 | 0.5 | GO:0034497 | protein localization to pre-autophagosomal structure(GO:0034497) |
| 0.1 | 0.3 | GO:0098707 | ferrous iron import into cell(GO:0097460) ferrous iron import across plasma membrane(GO:0098707) |
| 0.1 | 0.6 | GO:0008344 | adult locomotory behavior(GO:0008344) |
| 0.1 | 0.4 | GO:0070777 | D-aspartate transport(GO:0070777) D-aspartate import(GO:0070779) |
| 0.1 | 0.5 | GO:0032486 | Rap protein signal transduction(GO:0032486) |
| 0.1 | 0.2 | GO:1902630 | regulation of membrane hyperpolarization(GO:1902630) |
| 0.1 | 0.1 | GO:0072526 | pyridine-containing compound catabolic process(GO:0072526) |
| 0.1 | 0.3 | GO:0097428 | protein maturation by iron-sulfur cluster transfer(GO:0097428) |
| 0.1 | 0.1 | GO:2000049 | positive regulation of cell-cell adhesion mediated by cadherin(GO:2000049) |
| 0.1 | 0.7 | GO:0035518 | histone H2A monoubiquitination(GO:0035518) |
| 0.1 | 0.3 | GO:0030382 | sperm mitochondrion organization(GO:0030382) |
| 0.1 | 0.5 | GO:2001241 | positive regulation of extrinsic apoptotic signaling pathway in absence of ligand(GO:2001241) |
| 0.1 | 0.1 | GO:0034085 | establishment of sister chromatid cohesion(GO:0034085) cohesin loading(GO:0071921) regulation of cohesin loading(GO:0071922) |
| 0.1 | 0.3 | GO:0002322 | B cell proliferation involved in immune response(GO:0002322) |
| 0.1 | 0.2 | GO:0045348 | positive regulation of MHC class II biosynthetic process(GO:0045348) |
| 0.1 | 0.1 | GO:0009189 | deoxyribonucleoside diphosphate biosynthetic process(GO:0009189) |
| 0.1 | 1.0 | GO:0006853 | carnitine shuttle(GO:0006853) |
| 0.1 | 0.2 | GO:0051458 | corticotropin secretion(GO:0051458) |
| 0.1 | 0.2 | GO:1903300 | negative regulation of glucokinase activity(GO:0033132) negative regulation of hexokinase activity(GO:1903300) |
| 0.1 | 0.3 | GO:0071638 | negative regulation of monocyte chemotactic protein-1 production(GO:0071638) |
| 0.1 | 0.1 | GO:1901857 | positive regulation of cellular respiration(GO:1901857) |
| 0.1 | 0.3 | GO:0032782 | bile acid secretion(GO:0032782) |
| 0.1 | 0.2 | GO:0045743 | positive regulation of fibroblast growth factor receptor signaling pathway(GO:0045743) |
| 0.1 | 0.1 | GO:0036515 | serotonergic neuron axon guidance(GO:0036515) |
| 0.1 | 0.1 | GO:0060352 | cell adhesion molecule production(GO:0060352) |
| 0.1 | 0.1 | GO:1905206 | positive regulation of hydrogen peroxide-induced cell death(GO:1905206) |
| 0.1 | 0.7 | GO:0030032 | lamellipodium assembly(GO:0030032) |
| 0.1 | 0.2 | GO:0002925 | positive regulation of humoral immune response mediated by circulating immunoglobulin(GO:0002925) |
| 0.1 | 0.4 | GO:0046784 | viral mRNA export from host cell nucleus(GO:0046784) |
| 0.1 | 1.0 | GO:0006388 | tRNA splicing, via endonucleolytic cleavage and ligation(GO:0006388) |
| 0.1 | 0.5 | GO:0072189 | ureter development(GO:0072189) |
| 0.1 | 0.4 | GO:2000001 | regulation of DNA damage checkpoint(GO:2000001) |
| 0.1 | 0.5 | GO:0046324 | regulation of glucose import(GO:0046324) |
| 0.1 | 2.1 | GO:0034198 | cellular response to amino acid starvation(GO:0034198) |
| 0.1 | 0.3 | GO:0046340 | diacylglycerol catabolic process(GO:0046340) |
| 0.1 | 0.3 | GO:0098502 | DNA dephosphorylation(GO:0098502) |
| 0.1 | 0.3 | GO:0031017 | exocrine pancreas development(GO:0031017) |
| 0.0 | 0.3 | GO:2001184 | positive regulation of interleukin-12 secretion(GO:2001184) |
| 0.0 | 0.2 | GO:1902951 | negative regulation of dendritic spine maintenance(GO:1902951) |
| 0.0 | 0.1 | GO:0036023 | limb joint morphogenesis(GO:0036022) embryonic skeletal limb joint morphogenesis(GO:0036023) |
| 0.0 | 0.3 | GO:0048742 | regulation of skeletal muscle fiber development(GO:0048742) |
| 0.0 | 0.2 | GO:1901098 | positive regulation of autophagosome maturation(GO:1901098) |
| 0.0 | 0.1 | GO:0008215 | spermine metabolic process(GO:0008215) |
| 0.0 | 0.4 | GO:2001198 | regulation of dendritic cell differentiation(GO:2001198) |
| 0.0 | 1.0 | GO:0051255 | spindle midzone assembly(GO:0051255) |
| 0.0 | 0.3 | GO:0017062 | respiratory chain complex III assembly(GO:0017062) mitochondrial respiratory chain complex III assembly(GO:0034551) mitochondrial respiratory chain complex III biogenesis(GO:0097033) |
| 0.0 | 0.1 | GO:1901535 | regulation of DNA demethylation(GO:1901535) |
| 0.0 | 0.1 | GO:0002741 | positive regulation of cytokine secretion involved in immune response(GO:0002741) |
| 0.0 | 0.1 | GO:0009177 | dTMP biosynthetic process(GO:0006231) pyrimidine deoxyribonucleoside monophosphate biosynthetic process(GO:0009177) dTMP metabolic process(GO:0046073) response to tetrahydrofolate(GO:1904481) cellular response to tetrahydrofolate(GO:1904482) |
| 0.0 | 0.1 | GO:1900060 | negative regulation of sphingolipid biosynthetic process(GO:0090155) cellular sphingolipid homeostasis(GO:0090156) negative regulation of ceramide biosynthetic process(GO:1900060) |
| 0.0 | 0.0 | GO:2001012 | mesenchymal cell differentiation involved in kidney development(GO:0072161) mesenchymal cell differentiation involved in renal system development(GO:2001012) |
| 0.0 | 0.2 | GO:0042747 | circadian sleep/wake cycle, REM sleep(GO:0042747) |
| 0.0 | 0.1 | GO:0006434 | seryl-tRNA aminoacylation(GO:0006434) |
| 0.0 | 0.1 | GO:0018011 | N-terminal protein amino acid methylation(GO:0006480) N-terminal peptidyl-alanine methylation(GO:0018011) N-terminal peptidyl-alanine trimethylation(GO:0018012) N-terminal peptidyl-glycine methylation(GO:0018013) N-terminal peptidyl-proline dimethylation(GO:0018016) peptidyl-alanine modification(GO:0018194) N-terminal peptidyl-proline methylation(GO:0035568) N-terminal peptidyl-serine methylation(GO:0035570) N-terminal peptidyl-serine dimethylation(GO:0035572) N-terminal peptidyl-serine trimethylation(GO:0035573) |
| 0.0 | 0.2 | GO:0015870 | acetylcholine transport(GO:0015870) |
| 0.0 | 1.1 | GO:0019800 | peptide cross-linking via chondroitin 4-sulfate glycosaminoglycan(GO:0019800) |
| 0.0 | 0.1 | GO:0009298 | GDP-mannose biosynthetic process(GO:0009298) |
| 0.0 | 0.2 | GO:0060242 | contact inhibition(GO:0060242) |
| 0.0 | 0.6 | GO:0015074 | DNA integration(GO:0015074) |
| 0.0 | 0.2 | GO:0006104 | succinyl-CoA metabolic process(GO:0006104) |
| 0.0 | 0.3 | GO:1904381 | Golgi apparatus mannose trimming(GO:1904381) |
| 0.0 | 0.2 | GO:0007406 | negative regulation of neuroblast proliferation(GO:0007406) |
| 0.0 | 0.1 | GO:0048807 | female genitalia morphogenesis(GO:0048807) |
| 0.0 | 0.0 | GO:1900166 | glial cell-derived neurotrophic factor secretion(GO:0044467) regulation of glial cell-derived neurotrophic factor secretion(GO:1900166) positive regulation of glial cell-derived neurotrophic factor secretion(GO:1900168) |
| 0.0 | 0.2 | GO:0044565 | dendritic cell proliferation(GO:0044565) |
| 0.0 | 0.0 | GO:1990086 | lens fiber cell apoptotic process(GO:1990086) |
| 0.0 | 0.4 | GO:0008535 | respiratory chain complex IV assembly(GO:0008535) |
| 0.0 | 0.3 | GO:0003025 | regulation of systemic arterial blood pressure by baroreceptor feedback(GO:0003025) |
| 0.0 | 0.1 | GO:0045744 | negative regulation of G-protein coupled receptor protein signaling pathway(GO:0045744) |
| 0.0 | 0.1 | GO:0035106 | operant conditioning(GO:0035106) |
| 0.0 | 0.3 | GO:0001561 | fatty acid alpha-oxidation(GO:0001561) |
| 0.0 | 0.2 | GO:0060267 | positive regulation of respiratory burst(GO:0060267) |
| 0.0 | 0.0 | GO:0032048 | cardiolipin metabolic process(GO:0032048) |
| 0.0 | 0.7 | GO:0033539 | fatty acid beta-oxidation using acyl-CoA dehydrogenase(GO:0033539) |
| 0.0 | 0.9 | GO:2001275 | positive regulation of glucose import in response to insulin stimulus(GO:2001275) |
| 0.0 | 0.5 | GO:0051131 | chaperone-mediated protein complex assembly(GO:0051131) |
| 0.0 | 0.4 | GO:0061470 | T follicular helper cell differentiation(GO:0061470) |
| 0.0 | 0.5 | GO:0014722 | regulation of skeletal muscle contraction by calcium ion signaling(GO:0014722) |
| 0.0 | 0.3 | GO:0033148 | positive regulation of intracellular estrogen receptor signaling pathway(GO:0033148) |
| 0.0 | 0.2 | GO:0035860 | glial cell-derived neurotrophic factor receptor signaling pathway(GO:0035860) |
| 0.0 | 0.3 | GO:0007386 | compartment pattern specification(GO:0007386) |
| 0.0 | 0.2 | GO:0038169 | somatostatin receptor signaling pathway(GO:0038169) somatostatin signaling pathway(GO:0038170) |
| 0.0 | 0.1 | GO:0031116 | positive regulation of microtubule polymerization(GO:0031116) |
| 0.0 | 0.2 | GO:0072344 | rescue of stalled ribosome(GO:0072344) |
| 0.0 | 0.1 | GO:0035720 | intraciliary anterograde transport(GO:0035720) |
| 0.0 | 1.4 | GO:0021904 | dorsal/ventral neural tube patterning(GO:0021904) |
| 0.0 | 0.1 | GO:2000820 | negative regulation of transcription from RNA polymerase II promoter involved in smooth muscle cell differentiation(GO:2000820) |
| 0.0 | 0.4 | GO:0048296 | regulation of isotype switching to IgA isotypes(GO:0048296) positive regulation of isotype switching to IgA isotypes(GO:0048298) |
| 0.0 | 0.2 | GO:0048387 | negative regulation of retinoic acid receptor signaling pathway(GO:0048387) |
| 0.0 | 0.0 | GO:2001074 | regulation of metanephric ureteric bud development(GO:2001074) positive regulation of metanephric ureteric bud development(GO:2001076) |
| 0.0 | 0.2 | GO:1902510 | regulation of apoptotic DNA fragmentation(GO:1902510) |
| 0.0 | 0.4 | GO:0010917 | negative regulation of mitochondrial membrane potential(GO:0010917) |
| 0.0 | 0.9 | GO:0006479 | protein methylation(GO:0006479) protein alkylation(GO:0008213) |
| 0.0 | 0.7 | GO:0009313 | oligosaccharide catabolic process(GO:0009313) |
| 0.0 | 0.0 | GO:0045653 | negative regulation of megakaryocyte differentiation(GO:0045653) |
| 0.0 | 0.2 | GO:0035822 | gene conversion(GO:0035822) |
| 0.0 | 0.1 | GO:0031990 | mRNA export from nucleus in response to heat stress(GO:0031990) |
| 0.0 | 0.2 | GO:0046909 | intermembrane transport(GO:0046909) protein transport from ciliary membrane to plasma membrane(GO:1903445) |
| 0.0 | 0.3 | GO:0051290 | protein heterotetramerization(GO:0051290) |
| 0.0 | 0.3 | GO:0051823 | regulation of synapse structural plasticity(GO:0051823) |
| 0.0 | 0.1 | GO:0046271 | phenylpropanoid catabolic process(GO:0046271) |
| 0.0 | 0.1 | GO:0033564 | anterior/posterior axon guidance(GO:0033564) |
| 0.0 | 0.1 | GO:0097091 | synaptic vesicle clustering(GO:0097091) |
| 0.0 | 0.2 | GO:0045350 | interferon-beta biosynthetic process(GO:0045350) regulation of interferon-beta biosynthetic process(GO:0045357) |
| 0.0 | 0.2 | GO:0019856 | 'de novo' pyrimidine nucleobase biosynthetic process(GO:0006207) pyrimidine nucleobase biosynthetic process(GO:0019856) |
| 0.0 | 0.1 | GO:0002296 | T-helper 1 cell lineage commitment(GO:0002296) |
| 0.0 | 0.2 | GO:1902255 | positive regulation of intrinsic apoptotic signaling pathway by p53 class mediator(GO:1902255) |
| 0.0 | 0.1 | GO:0046416 | D-amino acid metabolic process(GO:0046416) |
| 0.0 | 0.4 | GO:0006307 | DNA dealkylation involved in DNA repair(GO:0006307) |
| 0.0 | 0.2 | GO:0036089 | cleavage furrow formation(GO:0036089) |
| 0.0 | 0.2 | GO:0051026 | chiasma assembly(GO:0051026) |
| 0.0 | 0.6 | GO:1901741 | positive regulation of myoblast fusion(GO:1901741) |
| 0.0 | 0.0 | GO:0006907 | pinocytosis(GO:0006907) |
| 0.0 | 3.8 | GO:0031146 | SCF-dependent proteasomal ubiquitin-dependent protein catabolic process(GO:0031146) |
| 0.0 | 1.0 | GO:0000185 | activation of MAPKKK activity(GO:0000185) |
| 0.0 | 0.5 | GO:0016926 | protein desumoylation(GO:0016926) |
| 0.0 | 0.1 | GO:0035411 | catenin import into nucleus(GO:0035411) |
| 0.0 | 2.6 | GO:0006120 | mitochondrial electron transport, NADH to ubiquinone(GO:0006120) |
| 0.0 | 0.1 | GO:0034969 | histone arginine methylation(GO:0034969) |
| 0.0 | 0.1 | GO:0043983 | histone H4-K12 acetylation(GO:0043983) |
| 0.0 | 0.2 | GO:0010536 | positive regulation of activation of Janus kinase activity(GO:0010536) |
| 0.0 | 0.0 | GO:0060591 | chondroblast differentiation(GO:0060591) |
| 0.0 | 1.5 | GO:0000266 | mitochondrial fission(GO:0000266) |
| 0.0 | 0.1 | GO:0018201 | peptidyl-glycine modification(GO:0018201) |
| 0.0 | 0.1 | GO:0034983 | peptidyl-lysine deacetylation(GO:0034983) |
| 0.0 | 0.2 | GO:0061358 | negative regulation of Wnt protein secretion(GO:0061358) |
| 0.0 | 0.2 | GO:0035965 | cardiolipin acyl-chain remodeling(GO:0035965) |
| 0.0 | 0.4 | GO:0098700 | neurotransmitter loading into synaptic vesicle(GO:0098700) |
| 0.0 | 0.1 | GO:0021940 | positive regulation of cerebellar granule cell precursor proliferation(GO:0021940) |
| 0.0 | 0.2 | GO:0034227 | tRNA thio-modification(GO:0034227) |
| 0.0 | 0.0 | GO:0006266 | DNA ligation(GO:0006266) |
| 0.0 | 0.3 | GO:1901376 | mycotoxin metabolic process(GO:0043385) aflatoxin metabolic process(GO:0046222) organic heteropentacyclic compound metabolic process(GO:1901376) |
| 0.0 | 0.4 | GO:0098877 | neurotransmitter receptor transport to plasma membrane(GO:0098877) neurotransmitter receptor transport to postsynaptic membrane(GO:0098969) establishment of protein localization to postsynaptic membrane(GO:1903540) |
| 0.0 | 0.7 | GO:0000715 | nucleotide-excision repair, DNA damage recognition(GO:0000715) |
| 0.0 | 0.0 | GO:0036090 | cleavage furrow ingression(GO:0036090) |
| 0.0 | 0.2 | GO:0060573 | ventral spinal cord interneuron specification(GO:0021521) cell fate specification involved in pattern specification(GO:0060573) |
| 0.0 | 0.1 | GO:0043457 | regulation of cellular respiration(GO:0043457) |
| 0.0 | 0.2 | GO:0098795 | mRNA cleavage involved in gene silencing by miRNA(GO:0035279) mRNA cleavage involved in gene silencing(GO:0098795) |
| 0.0 | 0.1 | GO:0006669 | sphinganine-1-phosphate biosynthetic process(GO:0006669) |
| 0.0 | 0.4 | GO:0035331 | negative regulation of hippo signaling(GO:0035331) |
| 0.0 | 0.2 | GO:0034378 | chylomicron assembly(GO:0034378) |
| 0.0 | 0.3 | GO:0005981 | regulation of glycogen catabolic process(GO:0005981) |
| 0.0 | 0.6 | GO:0018298 | protein-chromophore linkage(GO:0018298) |
| 0.0 | 0.2 | GO:1902659 | regulation of glucose mediated signaling pathway(GO:1902659) |
| 0.0 | 0.1 | GO:0001994 | norepinephrine-epinephrine vasoconstriction involved in regulation of systemic arterial blood pressure(GO:0001994) |
| 0.0 | 0.0 | GO:0006290 | pyrimidine dimer repair(GO:0006290) |
| 0.0 | 0.2 | GO:0051127 | positive regulation of actin nucleation(GO:0051127) |
| 0.0 | 0.1 | GO:0014054 | positive regulation of gamma-aminobutyric acid secretion(GO:0014054) |
| 0.0 | 0.1 | GO:0035377 | transepithelial water transport(GO:0035377) positive regulation of cyclic nucleotide-gated ion channel activity(GO:1902161) |
| 0.0 | 0.2 | GO:1902525 | regulation of protein monoubiquitination(GO:1902525) |
| 0.0 | 0.1 | GO:0019417 | sulfur oxidation(GO:0019417) |
| 0.0 | 0.3 | GO:0030643 | cellular phosphate ion homeostasis(GO:0030643) cellular trivalent inorganic anion homeostasis(GO:0072502) |
| 0.0 | 0.0 | GO:1900227 | positive regulation of NLRP3 inflammasome complex assembly(GO:1900227) |
| 0.0 | 0.0 | GO:0072054 | renal inner medulla development(GO:0072053) renal outer medulla development(GO:0072054) |
| 0.0 | 0.4 | GO:0071550 | death-inducing signaling complex assembly(GO:0071550) |
| 0.0 | 1.0 | GO:0071294 | cellular response to zinc ion(GO:0071294) |
| 0.0 | 0.2 | GO:0070307 | lens fiber cell development(GO:0070307) |
| 0.0 | 0.1 | GO:0016198 | axon choice point recognition(GO:0016198) |
| 0.0 | 0.7 | GO:0060765 | regulation of androgen receptor signaling pathway(GO:0060765) |
| 0.0 | 1.2 | GO:0032008 | positive regulation of TOR signaling(GO:0032008) |
| 0.0 | 0.1 | GO:1902019 | regulation of cilium movement involved in cell motility(GO:0060295) regulation of cilium beat frequency involved in ciliary motility(GO:0060296) regulation of cilium-dependent cell motility(GO:1902019) |
| 0.0 | 4.1 | GO:0070125 | mitochondrial translational elongation(GO:0070125) |
| 0.0 | 0.2 | GO:0033227 | T cell antigen processing and presentation(GO:0002457) dsRNA transport(GO:0033227) |
| 0.0 | 0.3 | GO:0033233 | regulation of protein sumoylation(GO:0033233) |
| 0.0 | 0.2 | GO:0090301 | regulation of neural crest formation(GO:0090299) negative regulation of neural crest formation(GO:0090301) negative regulation of fibroblast growth factor receptor signaling pathway involved in neural plate anterior/posterior pattern formation(GO:2000314) |
| 0.0 | 0.4 | GO:0010457 | centriole-centriole cohesion(GO:0010457) |
| 0.0 | 0.0 | GO:0051919 | positive regulation of fibrinolysis(GO:0051919) |
| 0.0 | 0.2 | GO:0045204 | MAPK export from nucleus(GO:0045204) |
| 0.0 | 2.0 | GO:0006635 | fatty acid beta-oxidation(GO:0006635) |
| 0.0 | 0.1 | GO:1901162 | primary amino compound biosynthetic process(GO:1901162) |
| 0.0 | 0.6 | GO:0006787 | porphyrin-containing compound catabolic process(GO:0006787) tetrapyrrole catabolic process(GO:0033015) heme catabolic process(GO:0042167) pigment catabolic process(GO:0046149) |
| 0.0 | 0.4 | GO:0000730 | DNA recombinase assembly(GO:0000730) double-strand break repair via synthesis-dependent strand annealing(GO:0045003) |
| 0.0 | 1.1 | GO:0009083 | branched-chain amino acid metabolic process(GO:0009081) branched-chain amino acid catabolic process(GO:0009083) |
| 0.0 | 0.1 | GO:0014850 | response to muscle activity(GO:0014850) |
| 0.0 | 0.0 | GO:0003220 | left ventricular cardiac muscle tissue morphogenesis(GO:0003220) |
| 0.0 | 1.4 | GO:0046710 | GDP metabolic process(GO:0046710) |
| 0.0 | 0.0 | GO:0003231 | cardiac ventricle development(GO:0003231) |
| 0.0 | 0.3 | GO:0090043 | tubulin deacetylation(GO:0090042) regulation of tubulin deacetylation(GO:0090043) |
| 0.0 | 0.1 | GO:0052330 | induction of programmed cell death(GO:0012502) positive regulation of apoptotic process in other organism(GO:0044533) positive regulation by symbiont of host programmed cell death(GO:0052042) positive regulation by organism of programmed cell death in other organism involved in symbiotic interaction(GO:0052330) positive regulation by organism of apoptotic process in other organism involved in symbiotic interaction(GO:0052501) |
| 0.0 | 0.4 | GO:0030903 | notochord development(GO:0030903) |
| 0.0 | 1.1 | GO:0006370 | 7-methylguanosine mRNA capping(GO:0006370) |
| 0.0 | 0.1 | GO:0006740 | NADPH regeneration(GO:0006740) |
| 0.0 | 0.3 | GO:0046146 | tetrahydrobiopterin biosynthetic process(GO:0006729) tetrahydrobiopterin metabolic process(GO:0046146) |
| 0.0 | 0.0 | GO:0034214 | protein hexamerization(GO:0034214) |
| 0.0 | 0.4 | GO:0061085 | regulation of histone H3-K27 methylation(GO:0061085) |
| 0.0 | 0.1 | GO:0003415 | chondrocyte hypertrophy(GO:0003415) |
| 0.0 | 0.2 | GO:0035493 | SNARE complex assembly(GO:0035493) |
| 0.0 | 0.1 | GO:1904562 | phosphatidylinositol 5-phosphate metabolic process(GO:1904562) |
| 0.0 | 0.1 | GO:0007256 | activation of JNKK activity(GO:0007256) |
| 0.0 | 0.1 | GO:0032972 | regulation of muscle filament sliding speed(GO:0032972) |
| 0.0 | 0.3 | GO:0033578 | protein glycosylation in Golgi(GO:0033578) |
| 0.0 | 0.2 | GO:0060478 | acrosomal vesicle exocytosis(GO:0060478) |
| 0.0 | 0.1 | GO:0001865 | NK T cell differentiation(GO:0001865) |
| 0.0 | 0.2 | GO:0006072 | glycerol-3-phosphate metabolic process(GO:0006072) |
| 0.0 | 0.6 | GO:0031440 | regulation of mRNA 3'-end processing(GO:0031440) |
| 0.0 | 0.3 | GO:0006750 | glutathione biosynthetic process(GO:0006750) |
| 0.0 | 0.2 | GO:0010724 | regulation of definitive erythrocyte differentiation(GO:0010724) |
| 0.0 | 0.1 | GO:1901552 | positive regulation of endothelial cell development(GO:1901552) positive regulation of establishment of endothelial barrier(GO:1903142) |
| 0.0 | 0.1 | GO:0010002 | cardioblast differentiation(GO:0010002) |
| 0.0 | 0.4 | GO:0039536 | negative regulation of RIG-I signaling pathway(GO:0039536) |
| 0.0 | 1.1 | GO:0022400 | regulation of rhodopsin mediated signaling pathway(GO:0022400) |
| 0.0 | 0.2 | GO:0060710 | chorio-allantoic fusion(GO:0060710) |
| 0.0 | 0.1 | GO:0010248 | establishment or maintenance of transmembrane electrochemical gradient(GO:0010248) |
| 0.0 | 0.3 | GO:1900017 | positive regulation of cytokine production involved in inflammatory response(GO:1900017) |
| 0.0 | 0.2 | GO:0038028 | insulin receptor signaling pathway via phosphatidylinositol 3-kinase(GO:0038028) positive regulation of glycogen (starch) synthase activity(GO:2000467) |
| 0.0 | 0.2 | GO:0042177 | negative regulation of protein catabolic process(GO:0042177) |
| 0.0 | 0.2 | GO:0021902 | commitment of neuronal cell to specific neuron type in forebrain(GO:0021902) |
| 0.0 | 0.1 | GO:1904479 | negative regulation of intestinal absorption(GO:1904479) |
| 0.0 | 0.4 | GO:1903054 | negative regulation of extracellular matrix organization(GO:1903054) |
| 0.0 | 0.1 | GO:1905123 | regulation of glucosylceramidase activity(GO:1905123) |
| 0.0 | 0.2 | GO:0030520 | intracellular estrogen receptor signaling pathway(GO:0030520) |
| 0.0 | 1.4 | GO:0061620 | NADH regeneration(GO:0006735) glycolytic process through fructose-6-phosphate(GO:0061615) glycolytic process through glucose-6-phosphate(GO:0061620) canonical glycolysis(GO:0061621) glucose catabolic process to pyruvate(GO:0061718) |
| 0.0 | 0.6 | GO:0006554 | lysine catabolic process(GO:0006554) |
| 0.0 | 0.1 | GO:0045603 | positive regulation of endothelial cell differentiation(GO:0045603) |
| 0.0 | 0.2 | GO:0018364 | peptidyl-glutamine methylation(GO:0018364) |
| 0.0 | 0.1 | GO:0042532 | negative regulation of tyrosine phosphorylation of STAT protein(GO:0042532) |
| 0.0 | 0.8 | GO:0010971 | positive regulation of G2/M transition of mitotic cell cycle(GO:0010971) |
| 0.0 | 0.1 | GO:1902267 | polyamine transmembrane transport(GO:1902047) regulation of polyamine transmembrane transport(GO:1902267) |
| 0.0 | 0.1 | GO:0031064 | negative regulation of histone deacetylation(GO:0031064) |
| 0.0 | 0.1 | GO:0060897 | neural plate regionalization(GO:0060897) |
| 0.0 | 0.2 | GO:0010459 | negative regulation of heart rate(GO:0010459) |
| 0.0 | 0.6 | GO:0046415 | urate metabolic process(GO:0046415) |
| 0.0 | 0.2 | GO:0044415 | evasion or tolerance of host defenses by virus(GO:0019049) transforming growth factor beta3 production(GO:0032907) regulation of transforming growth factor beta3 production(GO:0032910) positive regulation of transforming growth factor beta3 production(GO:0032916) avoidance of host defenses(GO:0044413) evasion or tolerance of host defenses(GO:0044415) avoidance of defenses of other organism involved in symbiotic interaction(GO:0051832) evasion or tolerance of defenses of other organism involved in symbiotic interaction(GO:0051834) negative regulation of lung blood pressure(GO:0061767) |
| 0.0 | 0.2 | GO:0044598 | polyketide metabolic process(GO:0030638) aminoglycoside antibiotic metabolic process(GO:0030647) daunorubicin metabolic process(GO:0044597) doxorubicin metabolic process(GO:0044598) |
| 0.0 | 0.3 | GO:0045048 | protein insertion into ER membrane(GO:0045048) |
| 0.0 | 0.2 | GO:0060340 | positive regulation of type I interferon-mediated signaling pathway(GO:0060340) |
| 0.0 | 0.3 | GO:2001224 | positive regulation of neuron migration(GO:2001224) |
| 0.0 | 0.0 | GO:0009397 | folic acid-containing compound catabolic process(GO:0009397) pteridine-containing compound catabolic process(GO:0042560) |
| 0.0 | 1.0 | GO:0030252 | growth hormone secretion(GO:0030252) |
| 0.0 | 0.3 | GO:1990440 | positive regulation of transcription from RNA polymerase II promoter in response to endoplasmic reticulum stress(GO:1990440) |
| 0.0 | 0.1 | GO:0032620 | interleukin-17 production(GO:0032620) |
| 0.0 | 0.2 | GO:0042984 | amyloid precursor protein biosynthetic process(GO:0042983) regulation of amyloid precursor protein biosynthetic process(GO:0042984) |
| 0.0 | 0.3 | GO:0060736 | prostate gland growth(GO:0060736) |
| 0.0 | 0.3 | GO:0097039 | protein linear polyubiquitination(GO:0097039) |
| 0.0 | 0.0 | GO:0007290 | spermatid nucleus elongation(GO:0007290) |
| 0.0 | 0.2 | GO:0048672 | positive regulation of collateral sprouting(GO:0048672) |
| 0.0 | 0.7 | GO:0030866 | cortical actin cytoskeleton organization(GO:0030866) |
| 0.0 | 4.5 | GO:0006614 | SRP-dependent cotranslational protein targeting to membrane(GO:0006614) |
| 0.0 | 0.1 | GO:0033080 | immature T cell proliferation in thymus(GO:0033080) |
| 0.0 | 0.0 | GO:0007521 | muscle cell fate determination(GO:0007521) |
| 0.0 | 1.1 | GO:0051123 | RNA polymerase II transcriptional preinitiation complex assembly(GO:0051123) |
| 0.0 | 0.2 | GO:0033031 | positive regulation of neutrophil apoptotic process(GO:0033031) |
| 0.0 | 0.2 | GO:1903232 | melanosome assembly(GO:1903232) |
| 0.0 | 0.2 | GO:0043507 | positive regulation of JUN kinase activity(GO:0043507) |
| 0.0 | 0.3 | GO:0050703 | interleukin-1 alpha secretion(GO:0050703) |
| 0.0 | 0.5 | GO:0007095 | mitotic G2 DNA damage checkpoint(GO:0007095) |
| 0.0 | 0.2 | GO:0097068 | response to thyroxine(GO:0097068) response to L-phenylalanine derivative(GO:1904386) |
| 0.0 | 0.1 | GO:1901096 | regulation of autophagosome maturation(GO:1901096) |
| 0.0 | 0.7 | GO:0000305 | response to oxygen radical(GO:0000305) |
| 0.0 | 0.1 | GO:0001507 | acetylcholine catabolic process in synaptic cleft(GO:0001507) acetylcholine catabolic process(GO:0006581) |
| 0.0 | 0.0 | GO:1900042 | positive regulation of interleukin-2 secretion(GO:1900042) |
| 0.0 | 0.5 | GO:0040015 | negative regulation of multicellular organism growth(GO:0040015) |
| 0.0 | 0.1 | GO:0033045 | regulation of sister chromatid segregation(GO:0033045) |
| 0.0 | 0.1 | GO:0010755 | regulation of plasminogen activation(GO:0010755) |
| 0.0 | 0.0 | GO:0015960 | diadenosine polyphosphate biosynthetic process(GO:0015960) diadenosine tetraphosphate metabolic process(GO:0015965) diadenosine tetraphosphate biosynthetic process(GO:0015966) |
| 0.0 | 2.3 | GO:0042147 | retrograde transport, endosome to Golgi(GO:0042147) |
| 0.0 | 0.1 | GO:0007566 | embryo implantation(GO:0007566) |
| 0.0 | 0.2 | GO:0045671 | negative regulation of osteoclast differentiation(GO:0045671) |
| 0.0 | 0.3 | GO:0002087 | regulation of respiratory gaseous exchange by neurological system process(GO:0002087) |
| 0.0 | 0.1 | GO:0032803 | regulation of low-density lipoprotein particle receptor catabolic process(GO:0032803) |
| 0.0 | 0.4 | GO:0097435 | fibril organization(GO:0097435) |
| 0.0 | 0.2 | GO:0009954 | proximal/distal pattern formation(GO:0009954) |
| 0.0 | 0.2 | GO:0030050 | vesicle transport along actin filament(GO:0030050) |
| 0.0 | 0.2 | GO:0006122 | mitochondrial electron transport, ubiquinol to cytochrome c(GO:0006122) |
| 0.0 | 0.0 | GO:0032288 | myelin assembly(GO:0032288) |
| 0.0 | 0.2 | GO:0086046 | membrane depolarization during SA node cell action potential(GO:0086046) |
| 0.0 | 0.3 | GO:2000114 | regulation of establishment of cell polarity(GO:2000114) |
| 0.0 | 0.3 | GO:0051775 | response to redox state(GO:0051775) |
| 0.0 | 0.1 | GO:0019482 | beta-alanine metabolic process(GO:0019482) |
| 0.0 | 0.3 | GO:0006682 | galactosylceramide biosynthetic process(GO:0006682) galactolipid biosynthetic process(GO:0019375) |
| 0.0 | 0.6 | GO:0045947 | negative regulation of translational initiation(GO:0045947) |
| 0.0 | 0.1 | GO:0001743 | optic placode formation(GO:0001743) optic placode formation involved in camera-type eye formation(GO:0046619) |
| 0.0 | 0.1 | GO:0044340 | canonical Wnt signaling pathway involved in regulation of cell proliferation(GO:0044340) |
| 0.0 | 0.2 | GO:0010591 | regulation of lamellipodium assembly(GO:0010591) |
| 0.0 | 0.1 | GO:0060235 | lens induction in camera-type eye(GO:0060235) |
| 0.0 | 0.0 | GO:0009128 | purine nucleoside monophosphate catabolic process(GO:0009128) |
| 0.0 | 0.5 | GO:0042775 | mitochondrial ATP synthesis coupled electron transport(GO:0042775) |
| 0.0 | 0.5 | GO:0015671 | gas transport(GO:0015669) oxygen transport(GO:0015671) |
| 0.0 | 0.1 | GO:0060441 | epithelial tube branching involved in lung morphogenesis(GO:0060441) |
| 0.0 | 0.2 | GO:0006540 | glutamate decarboxylation to succinate(GO:0006540) |
| 0.0 | 0.1 | GO:0032364 | oxygen homeostasis(GO:0032364) |
| 0.0 | 0.1 | GO:0015860 | purine nucleoside transmembrane transport(GO:0015860) |
| 0.0 | 0.1 | GO:0021861 | forebrain radial glial cell differentiation(GO:0021861) |
| 0.0 | 0.2 | GO:0021859 | pyramidal neuron differentiation(GO:0021859) pyramidal neuron development(GO:0021860) |
| 0.0 | 0.1 | GO:0097010 | eukaryotic translation initiation factor 4F complex assembly(GO:0097010) |
| 0.0 | 0.7 | GO:0097031 | NADH dehydrogenase complex assembly(GO:0010257) mitochondrial respiratory chain complex I assembly(GO:0032981) mitochondrial respiratory chain complex I biogenesis(GO:0097031) |
| 0.0 | 0.4 | GO:0060334 | regulation of interferon-gamma-mediated signaling pathway(GO:0060334) |
| 0.0 | 0.5 | GO:0043949 | regulation of cAMP-mediated signaling(GO:0043949) |
| 0.0 | 0.1 | GO:0046368 | GDP-L-fucose biosynthetic process(GO:0042350) GDP-L-fucose metabolic process(GO:0046368) |
| 0.0 | 0.7 | GO:0030834 | regulation of actin filament depolymerization(GO:0030834) |
| 0.0 | 0.5 | GO:0050873 | brown fat cell differentiation(GO:0050873) |
| 0.0 | 0.2 | GO:0050428 | purine ribonucleoside bisphosphate biosynthetic process(GO:0034036) 3'-phosphoadenosine 5'-phosphosulfate biosynthetic process(GO:0050428) |
| 0.0 | 0.2 | GO:0045176 | apical protein localization(GO:0045176) |
| 0.0 | 0.1 | GO:2000171 | negative regulation of dendrite development(GO:2000171) |
| 0.0 | 1.0 | GO:0043928 | exonucleolytic nuclear-transcribed mRNA catabolic process involved in deadenylation-dependent decay(GO:0043928) |
| 0.0 | 0.1 | GO:0014061 | regulation of norepinephrine secretion(GO:0014061) |
| 0.0 | 0.0 | GO:0046015 | regulation of transcription by glucose(GO:0046015) |
| 0.0 | 0.2 | GO:0035984 | response to trichostatin A(GO:0035983) cellular response to trichostatin A(GO:0035984) |
| 0.0 | 0.1 | GO:0033353 | S-adenosylmethionine cycle(GO:0033353) |
| 0.0 | 0.1 | GO:0048840 | otolith development(GO:0048840) |
| 0.0 | 0.1 | GO:0002325 | natural killer cell differentiation involved in immune response(GO:0002325) negative regulation of natural killer cell differentiation(GO:0032824) regulation of natural killer cell differentiation involved in immune response(GO:0032826) negative regulation of natural killer cell differentiation involved in immune response(GO:0032827) positive regulation of cytolysis in other organism(GO:0051714) |
| 0.0 | 0.1 | GO:0006041 | glucosamine metabolic process(GO:0006041) |
| 0.0 | 0.1 | GO:0048642 | negative regulation of skeletal muscle tissue development(GO:0048642) |
| 0.0 | 0.1 | GO:0006011 | UDP-glucose metabolic process(GO:0006011) |
| 0.0 | 0.4 | GO:0051503 | ATP transport(GO:0015867) adenine nucleotide transport(GO:0051503) |
| 0.0 | 0.3 | GO:0034356 | NAD biosynthesis via nicotinamide riboside salvage pathway(GO:0034356) |
| 0.0 | 0.1 | GO:0002730 | regulation of dendritic cell cytokine production(GO:0002730) negative regulation of dendritic cell cytokine production(GO:0002731) |
| 0.0 | 0.0 | GO:0030853 | negative regulation of granulocyte differentiation(GO:0030853) |
| 0.0 | 0.2 | GO:0002051 | osteoblast fate commitment(GO:0002051) |
| 0.0 | 0.3 | GO:0031274 | regulation of pseudopodium assembly(GO:0031272) positive regulation of pseudopodium assembly(GO:0031274) |
| 0.0 | 0.1 | GO:2000270 | negative regulation of fibroblast apoptotic process(GO:2000270) |
| 0.0 | 0.3 | GO:0043982 | histone H4-K5 acetylation(GO:0043981) histone H4-K8 acetylation(GO:0043982) |
| 0.0 | 0.1 | GO:0003339 | regulation of mesenchymal to epithelial transition involved in metanephros morphogenesis(GO:0003339) |
| 0.0 | 0.2 | GO:0060316 | positive regulation of ryanodine-sensitive calcium-release channel activity(GO:0060316) |
| 0.0 | 0.1 | GO:0036480 | neuron intrinsic apoptotic signaling pathway in response to oxidative stress(GO:0036480) regulation of oxidative stress-induced neuron intrinsic apoptotic signaling pathway(GO:1903376) |
| 0.0 | 0.1 | GO:0035021 | negative regulation of Rac protein signal transduction(GO:0035021) |
| 0.0 | 0.0 | GO:0098535 | de novo centriole assembly(GO:0098535) |
| 0.0 | 0.5 | GO:0007597 | blood coagulation, intrinsic pathway(GO:0007597) |
| 0.0 | 0.0 | GO:0000460 | maturation of 5.8S rRNA(GO:0000460) |
| 0.0 | 0.1 | GO:0034184 | positive regulation of maintenance of sister chromatid cohesion(GO:0034093) positive regulation of maintenance of mitotic sister chromatid cohesion(GO:0034184) |
| 0.0 | 0.2 | GO:0009249 | protein lipoylation(GO:0009249) |
| 0.0 | 0.3 | GO:0019371 | cyclooxygenase pathway(GO:0019371) |
| 0.0 | 0.1 | GO:0014886 | transition between slow and fast fiber(GO:0014886) |
| 0.0 | 0.0 | GO:1902564 | negative regulation of neutrophil activation(GO:1902564) |
| 0.0 | 0.0 | GO:0007501 | mesodermal cell fate specification(GO:0007501) |
| 0.0 | 0.2 | GO:0048147 | negative regulation of fibroblast proliferation(GO:0048147) |
| 0.0 | 0.0 | GO:0002215 | defense response to nematode(GO:0002215) |
| 0.0 | 0.0 | GO:0014004 | microglia differentiation(GO:0014004) microglia development(GO:0014005) |
| 0.0 | 0.2 | GO:0032717 | negative regulation of interleukin-8 production(GO:0032717) |
| 0.0 | 0.1 | GO:0016256 | N-glycan processing to lysosome(GO:0016256) |
| 0.0 | 0.1 | GO:0021849 | neuroblast division in subventricular zone(GO:0021849) |
| 0.0 | 0.1 | GO:1903525 | regulation of membrane tubulation(GO:1903525) |
| 0.0 | 0.1 | GO:0006206 | pyrimidine nucleobase metabolic process(GO:0006206) |
| 0.0 | 0.1 | GO:0060965 | negative regulation of gene silencing by miRNA(GO:0060965) |
| 0.0 | 0.9 | GO:0061418 | regulation of transcription from RNA polymerase II promoter in response to hypoxia(GO:0061418) |
| 0.0 | 0.3 | GO:0036152 | phosphatidylethanolamine acyl-chain remodeling(GO:0036152) |
| 0.0 | 0.2 | GO:0044375 | regulation of peroxisome size(GO:0044375) |
| 0.0 | 0.3 | GO:0043153 | entrainment of circadian clock by photoperiod(GO:0043153) |
| 0.0 | 0.1 | GO:0007512 | adult heart development(GO:0007512) |
| 0.0 | 0.1 | GO:0090009 | primitive streak formation(GO:0090009) |
| 0.0 | 0.1 | GO:0016598 | protein arginylation(GO:0016598) |
| 0.0 | 0.4 | GO:0042104 | positive regulation of activated T cell proliferation(GO:0042104) |
| 0.0 | 0.2 | GO:0031444 | slow-twitch skeletal muscle fiber contraction(GO:0031444) |
| 0.0 | 0.1 | GO:0090219 | negative regulation of lipid kinase activity(GO:0090219) |
| 0.0 | 0.1 | GO:0045079 | regulation of chemokine biosynthetic process(GO:0045073) negative regulation of chemokine biosynthetic process(GO:0045079) |
| 0.0 | 0.2 | GO:0045039 | protein import into mitochondrial inner membrane(GO:0045039) |
| 0.0 | 0.4 | GO:0036158 | outer dynein arm assembly(GO:0036158) |
| 0.0 | 0.1 | GO:1900745 | positive regulation of p38MAPK cascade(GO:1900745) |
| 0.0 | 0.0 | GO:0032849 | positive regulation of cellular pH reduction(GO:0032849) |
| 0.0 | 0.5 | GO:0072539 | T-helper 17 cell differentiation(GO:0072539) |
| 0.0 | 0.1 | GO:0006598 | polyamine catabolic process(GO:0006598) spermidine catabolic process(GO:0046203) |
| 0.0 | 0.1 | GO:0051451 | myoblast migration(GO:0051451) |
| 0.0 | 0.2 | GO:0032515 | negative regulation of phosphoprotein phosphatase activity(GO:0032515) |
| 0.0 | 0.3 | GO:2001014 | regulation of skeletal muscle cell differentiation(GO:2001014) |
| 0.0 | 0.0 | GO:0060753 | regulation of mast cell chemotaxis(GO:0060753) |
| 0.0 | 0.1 | GO:0060397 | JAK-STAT cascade involved in growth hormone signaling pathway(GO:0060397) |
| 0.0 | 0.0 | GO:0051177 | meiotic sister chromatid cohesion(GO:0051177) |
| 0.0 | 0.0 | GO:0060157 | urinary bladder development(GO:0060157) |
| 0.0 | 0.3 | GO:0050872 | white fat cell differentiation(GO:0050872) |
| 0.0 | 0.0 | GO:0043396 | corticotropin-releasing hormone secretion(GO:0043396) regulation of corticotropin-releasing hormone secretion(GO:0043397) |
| 0.0 | 0.0 | GO:0035562 | negative regulation of chromatin binding(GO:0035562) |
| 0.0 | 0.2 | GO:0007184 | SMAD protein import into nucleus(GO:0007184) |
| 0.0 | 0.1 | GO:1904424 | regulation of GTP binding(GO:1904424) |
| 0.0 | 0.1 | GO:0048669 | collateral sprouting in absence of injury(GO:0048669) |
| 0.0 | 0.6 | GO:0021522 | spinal cord motor neuron differentiation(GO:0021522) |
| 0.0 | 0.2 | GO:0043152 | induction of bacterial agglutination(GO:0043152) |
| 0.0 | 0.1 | GO:0030277 | maintenance of gastrointestinal epithelium(GO:0030277) |
| 0.0 | 0.0 | GO:0035426 | extracellular matrix-cell signaling(GO:0035426) |
| 0.0 | 0.0 | GO:0032764 | negative regulation of mast cell cytokine production(GO:0032764) |
| 0.0 | 0.1 | GO:0043032 | positive regulation of macrophage activation(GO:0043032) |
| 0.0 | 0.2 | GO:2000774 | positive regulation of cellular senescence(GO:2000774) |
| 0.0 | 0.0 | GO:0010880 | regulation of release of sequestered calcium ion into cytosol by sarcoplasmic reticulum(GO:0010880) |
| 0.0 | 0.2 | GO:0017182 | peptidyl-diphthamide metabolic process(GO:0017182) peptidyl-diphthamide biosynthetic process from peptidyl-histidine(GO:0017183) peptidyl-histidine modification(GO:0018202) |
| 0.0 | 0.2 | GO:0050771 | negative regulation of axonogenesis(GO:0050771) |
| 0.0 | 0.4 | GO:0034587 | piRNA metabolic process(GO:0034587) |
| 0.0 | 0.1 | GO:2000676 | positive regulation of type B pancreatic cell apoptotic process(GO:2000676) |
| 0.0 | 0.3 | GO:1904778 | regulation of protein localization to cell cortex(GO:1904776) positive regulation of protein localization to cell cortex(GO:1904778) |
| 0.0 | 0.1 | GO:0060729 | intestinal epithelial structure maintenance(GO:0060729) |
| 0.0 | 0.1 | GO:0048670 | regulation of collateral sprouting(GO:0048670) |
| 0.0 | 0.1 | GO:0090154 | positive regulation of sphingolipid biosynthetic process(GO:0090154) positive regulation of ceramide biosynthetic process(GO:2000304) |
| 0.0 | 0.1 | GO:1900016 | negative regulation of cytokine production involved in inflammatory response(GO:1900016) |
| 0.0 | 0.1 | GO:0008063 | Toll signaling pathway(GO:0008063) |
| 0.0 | 0.1 | GO:0046604 | positive regulation of mitotic centrosome separation(GO:0046604) |
| 0.0 | 0.3 | GO:0071688 | striated muscle myosin thick filament assembly(GO:0071688) |
| 0.0 | 0.0 | GO:0038162 | erythropoietin-mediated signaling pathway(GO:0038162) |
| 0.0 | 0.1 | GO:0030502 | negative regulation of bone mineralization(GO:0030502) |
| 0.0 | 0.2 | GO:0042994 | cytoplasmic sequestering of transcription factor(GO:0042994) |
| 0.0 | 0.2 | GO:0051715 | cytolysis in other organism(GO:0051715) |
| 0.0 | 0.0 | GO:0042415 | norepinephrine metabolic process(GO:0042415) |
| 0.0 | 0.2 | GO:0050860 | negative regulation of T cell receptor signaling pathway(GO:0050860) |
| 0.0 | 0.2 | GO:0003096 | renal sodium ion transport(GO:0003096) renal sodium ion absorption(GO:0070294) |
| 0.0 | 0.0 | GO:0051106 | regulation of DNA ligation(GO:0051105) positive regulation of DNA ligation(GO:0051106) |
| 0.0 | 0.1 | GO:0001812 | regulation of type I hypersensitivity(GO:0001810) positive regulation of type I hypersensitivity(GO:0001812) type I hypersensitivity(GO:0016068) |
| 0.0 | 0.0 | GO:0045824 | negative regulation of innate immune response(GO:0045824) |
| 0.0 | 0.1 | GO:0019323 | pentose catabolic process(GO:0019323) |
| 0.0 | 0.1 | GO:0061107 | seminal vesicle development(GO:0061107) |
| 0.0 | 0.0 | GO:0008625 | extrinsic apoptotic signaling pathway via death domain receptors(GO:0008625) |
| 0.0 | 0.0 | GO:0060219 | camera-type eye photoreceptor cell differentiation(GO:0060219) |
| 0.0 | 0.4 | GO:0007213 | G-protein coupled acetylcholine receptor signaling pathway(GO:0007213) |
| 0.0 | 0.0 | GO:0034101 | erythrocyte homeostasis(GO:0034101) |
| 0.0 | 0.2 | GO:0048739 | cardiac muscle fiber development(GO:0048739) |
| 0.0 | 1.5 | GO:0031338 | regulation of vesicle fusion(GO:0031338) |
| 0.0 | 0.1 | GO:0030920 | N-terminal peptidyl-serine acetylation(GO:0017198) N-terminal peptidyl-glutamic acid acetylation(GO:0018002) peptidyl-serine acetylation(GO:0030920) |
| 0.0 | 0.1 | GO:1901678 | iron coordination entity transport(GO:1901678) |
| 0.0 | 0.1 | GO:0010968 | regulation of microtubule nucleation(GO:0010968) |
| 0.0 | 0.2 | GO:0034242 | negative regulation of syncytium formation by plasma membrane fusion(GO:0034242) negative regulation of myoblast fusion(GO:1901740) regulation of hepatocyte apoptotic process(GO:1903943) negative regulation of hepatocyte apoptotic process(GO:1903944) |
| 0.0 | 0.2 | GO:0000395 | mRNA 5'-splice site recognition(GO:0000395) |
| 0.0 | 0.1 | GO:0006681 | galactosylceramide metabolic process(GO:0006681) galactolipid metabolic process(GO:0019374) |
| 0.0 | 0.6 | GO:0051496 | positive regulation of stress fiber assembly(GO:0051496) |
| 0.0 | 0.1 | GO:0051096 | regulation of helicase activity(GO:0051095) positive regulation of helicase activity(GO:0051096) |
| 0.0 | 0.1 | GO:0009438 | methylglyoxal metabolic process(GO:0009438) |
| 0.0 | 0.1 | GO:0035162 | embryonic hemopoiesis(GO:0035162) |
| 0.0 | 0.5 | GO:0048268 | clathrin coat assembly(GO:0048268) |
| 0.0 | 0.1 | GO:0071549 | cellular response to dexamethasone stimulus(GO:0071549) |
| 0.0 | 0.0 | GO:0002316 | follicular B cell differentiation(GO:0002316) |
| 0.0 | 0.1 | GO:0046952 | ketone body catabolic process(GO:0046952) |
| 0.0 | 0.1 | GO:0032466 | negative regulation of cytokinesis(GO:0032466) |
| 0.0 | 0.1 | GO:0030953 | astral microtubule organization(GO:0030953) |
| 0.0 | 0.1 | GO:0002528 | regulation of vascular permeability involved in acute inflammatory response(GO:0002528) |
| 0.0 | 0.1 | GO:0021796 | cerebral cortex regionalization(GO:0021796) |
| 0.0 | 0.2 | GO:0060155 | platelet dense granule organization(GO:0060155) |
| 0.0 | 0.1 | GO:0033683 | nucleotide-excision repair, DNA incision(GO:0033683) |
| 0.0 | 0.1 | GO:2000623 | regulation of nuclear-transcribed mRNA catabolic process, nonsense-mediated decay(GO:2000622) negative regulation of nuclear-transcribed mRNA catabolic process, nonsense-mediated decay(GO:2000623) |
| 0.0 | 0.1 | GO:0006641 | triglyceride metabolic process(GO:0006641) |
| 0.0 | 0.0 | GO:1900122 | positive regulation of receptor binding(GO:1900122) |
| 0.0 | 0.1 | GO:0001755 | neural crest cell migration(GO:0001755) |
| 0.0 | 0.0 | GO:0034145 | positive regulation of toll-like receptor 4 signaling pathway(GO:0034145) |
| 0.0 | 0.0 | GO:0072143 | renal interstitial fibroblast development(GO:0072141) mesangial cell development(GO:0072143) |
| 0.0 | 0.3 | GO:0006044 | N-acetylglucosamine metabolic process(GO:0006044) |
| 0.0 | 0.1 | GO:0045292 | mRNA cis splicing, via spliceosome(GO:0045292) |
| 0.0 | 0.1 | GO:0045836 | positive regulation of meiotic nuclear division(GO:0045836) |
| 0.0 | 0.1 | GO:0002679 | respiratory burst involved in defense response(GO:0002679) |
| 0.0 | 0.1 | GO:0052551 | response to defense-related nitric oxide production by other organism involved in symbiotic interaction(GO:0052551) response to defense-related host nitric oxide production(GO:0052565) |
| 0.0 | 0.1 | GO:0034058 | endosomal vesicle fusion(GO:0034058) |
| 0.0 | 0.0 | GO:2001205 | negative regulation of osteoclast development(GO:2001205) |
| 0.0 | 1.3 | GO:0006369 | termination of RNA polymerase II transcription(GO:0006369) |
| 0.0 | 0.1 | GO:0019720 | Mo-molybdopterin cofactor biosynthetic process(GO:0006777) Mo-molybdopterin cofactor metabolic process(GO:0019720) |
| 0.0 | 0.2 | GO:0001675 | acrosome assembly(GO:0001675) |
| 0.0 | 0.0 | GO:0043353 | enucleate erythrocyte differentiation(GO:0043353) |
| 0.0 | 0.1 | GO:0003050 | regulation of systemic arterial blood pressure by atrial natriuretic peptide(GO:0003050) |
| 0.0 | 0.4 | GO:0008045 | motor neuron axon guidance(GO:0008045) |
| 0.0 | 0.5 | GO:0014888 | striated muscle adaptation(GO:0014888) |
| 0.0 | 0.1 | GO:0038060 | nitric oxide-cGMP-mediated signaling pathway(GO:0038060) |
| 0.0 | 0.0 | GO:0003218 | cardiac left ventricle formation(GO:0003218) |
| 0.0 | 0.3 | GO:0046676 | negative regulation of insulin secretion(GO:0046676) |
| 0.0 | 0.0 | GO:0046677 | response to antibiotic(GO:0046677) |
| 0.0 | 0.0 | GO:0045654 | positive regulation of megakaryocyte differentiation(GO:0045654) |
| 0.0 | 0.1 | GO:0007320 | insemination(GO:0007320) |
| 0.0 | 0.1 | GO:0030950 | establishment or maintenance of actin cytoskeleton polarity(GO:0030950) |
| 0.0 | 0.0 | GO:0002265 | astrocyte activation involved in immune response(GO:0002265) |
| 0.0 | 0.1 | GO:0060051 | negative regulation of protein glycosylation(GO:0060051) |
| 0.0 | 0.0 | GO:0019896 | axonal transport of mitochondrion(GO:0019896) |
| 0.0 | 0.0 | GO:2001240 | negative regulation of signal transduction in absence of ligand(GO:1901099) negative regulation of extrinsic apoptotic signaling pathway in absence of ligand(GO:2001240) |
| 0.0 | 0.6 | GO:0045600 | positive regulation of fat cell differentiation(GO:0045600) |
| 0.0 | 0.4 | GO:0045010 | actin nucleation(GO:0045010) |
| 0.0 | 0.0 | GO:0035624 | receptor transactivation(GO:0035624) |
| 0.0 | 0.5 | GO:0070936 | protein K48-linked ubiquitination(GO:0070936) |
| 0.0 | 1.2 | GO:0016575 | histone deacetylation(GO:0016575) |
| 0.0 | 0.2 | GO:0019585 | uronic acid metabolic process(GO:0006063) glucuronate metabolic process(GO:0019585) cellular glucuronidation(GO:0052695) |
| 0.0 | 0.1 | GO:0008635 | activation of cysteine-type endopeptidase activity involved in apoptotic process by cytochrome c(GO:0008635) |
| 0.0 | 0.2 | GO:0051028 | mRNA transport(GO:0051028) |
| 0.0 | 0.1 | GO:0090331 | negative regulation of platelet aggregation(GO:0090331) |
| 0.0 | 0.1 | GO:0048512 | circadian behavior(GO:0048512) |
| 0.0 | 0.1 | GO:0070306 | lens fiber cell differentiation(GO:0070306) |
| 0.0 | 0.2 | GO:0097151 | positive regulation of inhibitory postsynaptic potential(GO:0097151) modulation of inhibitory postsynaptic potential(GO:0098828) |
| 0.0 | 0.1 | GO:0010994 | regulation of ubiquitin homeostasis(GO:0010993) free ubiquitin chain polymerization(GO:0010994) |
| 0.0 | 0.0 | GO:0030318 | melanocyte differentiation(GO:0030318) pigment cell differentiation(GO:0050931) |
| 0.0 | 0.1 | GO:0019509 | L-methionine biosynthetic process from methylthioadenosine(GO:0019509) |
| 0.0 | 0.0 | GO:2000503 | positive regulation of natural killer cell chemotaxis(GO:2000503) |
| 0.0 | 0.1 | GO:0046719 | regulation by virus of viral protein levels in host cell(GO:0046719) |
| 0.0 | 0.0 | GO:1903441 | protein localization to ciliary membrane(GO:1903441) |
| 0.0 | 0.1 | GO:0043537 | negative regulation of blood vessel endothelial cell migration(GO:0043537) |
| 0.0 | 0.0 | GO:0071651 | positive regulation of chemokine (C-C motif) ligand 5 production(GO:0071651) |
| 0.0 | 0.2 | GO:0003351 | epithelial cilium movement(GO:0003351) |
| 0.0 | 0.2 | GO:0007507 | heart development(GO:0007507) |
| 0.0 | 0.1 | GO:0035767 | endothelial cell chemotaxis(GO:0035767) |
| 0.0 | 0.0 | GO:0042036 | negative regulation of cytokine biosynthetic process(GO:0042036) |
| 0.0 | 0.1 | GO:0015742 | alpha-ketoglutarate transport(GO:0015742) |
| 0.0 | 0.1 | GO:0006956 | complement activation(GO:0006956) |
| 0.0 | 0.1 | GO:0031087 | nuclear-transcribed mRNA catabolic process, deadenylation-independent decay(GO:0031086) deadenylation-independent decapping of nuclear-transcribed mRNA(GO:0031087) |
| 0.0 | 0.2 | GO:0017121 | phospholipid scrambling(GO:0017121) |
| 0.0 | 0.1 | GO:2000574 | regulation of microtubule motor activity(GO:2000574) |
| 0.0 | 0.1 | GO:1901881 | positive regulation of protein depolymerization(GO:1901881) |
| 0.0 | 0.0 | GO:1903026 | negative regulation of RNA polymerase II regulatory region sequence-specific DNA binding(GO:1903026) |
| 0.0 | 0.7 | GO:0042795 | snRNA transcription(GO:0009301) snRNA transcription from RNA polymerase II promoter(GO:0042795) |
| 0.0 | 0.1 | GO:0045919 | positive regulation of cytolysis(GO:0045919) |
| 0.0 | 0.3 | GO:0038094 | Fc-gamma receptor signaling pathway(GO:0038094) |
| 0.0 | 0.0 | GO:0006094 | gluconeogenesis(GO:0006094) |
| 0.0 | 0.1 | GO:0046007 | negative regulation of activated T cell proliferation(GO:0046007) |
| 0.0 | 0.2 | GO:0030038 | contractile actin filament bundle assembly(GO:0030038) stress fiber assembly(GO:0043149) |
| 0.0 | 0.2 | GO:0045116 | protein neddylation(GO:0045116) |
| 0.0 | 0.0 | GO:0071875 | adrenergic receptor signaling pathway(GO:0071875) |
| 0.0 | 0.0 | GO:0060020 | Bergmann glial cell differentiation(GO:0060020) |
| 0.0 | 0.1 | GO:0010596 | negative regulation of endothelial cell migration(GO:0010596) |
| 0.0 | 0.0 | GO:0035357 | peroxisome proliferator activated receptor signaling pathway(GO:0035357) |
| 0.0 | 0.1 | GO:0019355 | nicotinamide nucleotide biosynthetic process from aspartate(GO:0019355) 'de novo' NAD biosynthetic process from aspartate(GO:0034628) |
| 0.0 | 0.1 | GO:0033008 | positive regulation of mast cell activation involved in immune response(GO:0033008) positive regulation of mast cell degranulation(GO:0043306) |
| 0.0 | 0.1 | GO:0060536 | cartilage morphogenesis(GO:0060536) |
| 0.0 | 0.0 | GO:2000310 | regulation of N-methyl-D-aspartate selective glutamate receptor activity(GO:2000310) |
| 0.0 | 0.1 | GO:0086024 | adrenergic receptor signaling pathway involved in positive regulation of heart rate(GO:0086024) |
| 0.0 | 0.1 | GO:0006688 | glycosphingolipid biosynthetic process(GO:0006688) |
| 0.0 | 0.3 | GO:0030308 | negative regulation of cell growth(GO:0030308) |
| 0.0 | 0.1 | GO:0045329 | carnitine biosynthetic process(GO:0045329) |
| 0.0 | 0.0 | GO:0007412 | axon target recognition(GO:0007412) |
| 0.0 | 0.1 | GO:0048246 | macrophage chemotaxis(GO:0048246) |
| 0.0 | 0.0 | GO:0044313 | protein K6-linked deubiquitination(GO:0044313) |
| 0.0 | 0.2 | GO:0015937 | coenzyme A biosynthetic process(GO:0015937) |
| 0.0 | 0.3 | GO:0006298 | mismatch repair(GO:0006298) |
| 0.0 | 0.0 | GO:0044314 | protein K27-linked ubiquitination(GO:0044314) |
| 0.0 | 0.0 | GO:0032484 | Ral protein signal transduction(GO:0032484) regulation of Ral protein signal transduction(GO:0032485) |
| 0.0 | 0.0 | GO:0050435 | beta-amyloid metabolic process(GO:0050435) |
| 0.0 | 0.0 | GO:0000294 | nuclear-transcribed mRNA catabolic process, endonucleolytic cleavage-dependent decay(GO:0000294) |
| 0.0 | 0.1 | GO:0006451 | selenocysteine incorporation(GO:0001514) translational readthrough(GO:0006451) |
| 0.0 | 0.0 | GO:1903265 | positive regulation of tumor necrosis factor-mediated signaling pathway(GO:1903265) |
| 0.0 | 0.0 | GO:1902626 | assembly of large subunit precursor of preribosome(GO:1902626) |
| 0.0 | 0.0 | GO:1903317 | regulation of protein maturation(GO:1903317) |
| 0.0 | 0.0 | GO:0090073 | positive regulation of protein homodimerization activity(GO:0090073) |
| 0.0 | 0.2 | GO:0006734 | NADH metabolic process(GO:0006734) |
| 0.0 | 0.1 | GO:0071354 | cellular response to interleukin-6(GO:0071354) |
| 0.0 | 0.1 | GO:0030397 | mitotic nuclear envelope disassembly(GO:0007077) membrane disassembly(GO:0030397) nuclear envelope disassembly(GO:0051081) |
| 0.0 | 0.2 | GO:0042424 | phenol-containing compound catabolic process(GO:0019336) catechol-containing compound catabolic process(GO:0019614) catecholamine catabolic process(GO:0042424) |
| 0.0 | 0.0 | GO:0043619 | regulation of transcription from RNA polymerase II promoter in response to oxidative stress(GO:0043619) |
| 0.0 | 0.2 | GO:0032897 | negative regulation of viral transcription(GO:0032897) |
| 0.0 | 0.0 | GO:2000417 | negative regulation of eosinophil migration(GO:2000417) |
| 0.0 | 0.3 | GO:0006513 | protein monoubiquitination(GO:0006513) |
| 0.0 | 0.0 | GO:0045948 | positive regulation of translational initiation(GO:0045948) |
| 0.0 | 0.1 | GO:0071926 | endocannabinoid signaling pathway(GO:0071926) regulation of endocannabinoid signaling pathway(GO:2000124) |
| 0.0 | 0.1 | GO:0016226 | iron-sulfur cluster assembly(GO:0016226) metallo-sulfur cluster assembly(GO:0031163) |
| 0.0 | 0.0 | GO:1903031 | regulation of microtubule plus-end binding(GO:1903031) positive regulation of microtubule plus-end binding(GO:1903033) |
| 0.0 | 0.0 | GO:1903392 | negative regulation of adherens junction organization(GO:1903392) |
| 0.0 | 0.1 | GO:0033194 | response to hydroperoxide(GO:0033194) |
| 0.0 | 0.3 | GO:0043392 | negative regulation of DNA binding(GO:0043392) |
| 0.0 | 0.1 | GO:0035601 | protein deacylation(GO:0035601) |
| 0.0 | 0.0 | GO:0032781 | positive regulation of ATPase activity(GO:0032781) |
| 0.0 | 0.1 | GO:0099550 | trans-synaptic signalling, modulating synaptic transmission(GO:0099550) |
| 0.0 | 0.2 | GO:0097320 | membrane tubulation(GO:0097320) |
| 0.0 | 0.1 | GO:0061298 | retina vasculature development in camera-type eye(GO:0061298) |
| 0.0 | 0.1 | GO:0045651 | positive regulation of macrophage differentiation(GO:0045651) |
| 0.0 | 0.0 | GO:0009182 | purine deoxyribonucleoside diphosphate metabolic process(GO:0009182) |
| 0.0 | 0.0 | GO:0060024 | rhythmic synaptic transmission(GO:0060024) |
| 0.0 | 0.1 | GO:0072663 | protein targeting to peroxisome(GO:0006625) peroxisomal transport(GO:0043574) protein localization to peroxisome(GO:0072662) establishment of protein localization to peroxisome(GO:0072663) |
| 0.0 | 0.0 | GO:0006427 | histidyl-tRNA aminoacylation(GO:0006427) |
| 0.0 | 0.0 | GO:0010667 | negative regulation of cardiac muscle cell apoptotic process(GO:0010667) |
| 0.0 | 0.1 | GO:0006338 | chromatin remodeling(GO:0006338) |
| 0.0 | 0.0 | GO:0071806 | protein transmembrane transport(GO:0071806) |
| 0.0 | 0.0 | GO:0032099 | negative regulation of response to food(GO:0032096) negative regulation of appetite(GO:0032099) |
| 0.0 | 0.1 | GO:0051013 | microtubule severing(GO:0051013) |
| 0.0 | 0.1 | GO:0061014 | positive regulation of mRNA catabolic process(GO:0061014) |
| 0.0 | 0.0 | GO:0002884 | regulation of type IV hypersensitivity(GO:0001807) negative regulation of type IV hypersensitivity(GO:0001808) negative regulation of hypersensitivity(GO:0002884) |
| 0.0 | 0.1 | GO:0000160 | phosphorelay signal transduction system(GO:0000160) |
| 0.0 | 0.1 | GO:1903432 | regulation of TORC1 signaling(GO:1903432) |
Gene overrepresentation in cellular_component category:
| Log-likelihood per target | Total log-likelihood | Term | Description |
|---|---|---|---|
| 0.5 | 5.3 | GO:0071953 | elastic fiber(GO:0071953) |
| 0.3 | 1.0 | GO:1902636 | kinociliary basal body(GO:1902636) |
| 0.3 | 1.3 | GO:1990031 | pinceau fiber(GO:1990031) |
| 0.3 | 2.1 | GO:0000408 | EKC/KEOPS complex(GO:0000408) |
| 0.3 | 0.9 | GO:0044753 | amphisome(GO:0044753) |
| 0.3 | 1.3 | GO:1990425 | ryanodine receptor complex(GO:1990425) |
| 0.3 | 4.2 | GO:0000124 | SAGA complex(GO:0000124) |
| 0.3 | 1.0 | GO:0060187 | cell pole(GO:0060187) |
| 0.2 | 0.7 | GO:0031021 | interphase microtubule organizing center(GO:0031021) |
| 0.2 | 0.9 | GO:0070288 | intracellular ferritin complex(GO:0008043) ferritin complex(GO:0070288) |
| 0.2 | 1.8 | GO:0098560 | cytoplasmic side of late endosome membrane(GO:0098560) |
| 0.2 | 1.5 | GO:1903439 | calcitonin family receptor complex(GO:1903439) amylin receptor complex(GO:1903440) |
| 0.2 | 0.8 | GO:0005846 | nuclear cap binding complex(GO:0005846) |
| 0.2 | 0.8 | GO:0032144 | 4-aminobutyrate transaminase complex(GO:0032144) |
| 0.2 | 1.2 | GO:0001652 | granular component(GO:0001652) |
| 0.2 | 1.2 | GO:0008537 | proteasome activator complex(GO:0008537) |
| 0.2 | 1.7 | GO:1990111 | spermatoproteasome complex(GO:1990111) |
| 0.2 | 0.7 | GO:0070044 | synaptobrevin 2-SNAP-25-syntaxin-1a complex(GO:0070044) |
| 0.2 | 0.7 | GO:1990796 | photoreceptor cell terminal bouton(GO:1990796) |
| 0.2 | 1.1 | GO:0072558 | NLRP1 inflammasome complex(GO:0072558) |
| 0.2 | 1.4 | GO:0035976 | AP1 complex(GO:0035976) |
| 0.2 | 0.7 | GO:0044301 | climbing fiber(GO:0044301) |
| 0.2 | 0.5 | GO:0005940 | septin ring(GO:0005940) septin collar(GO:0032173) |
| 0.2 | 1.1 | GO:1990393 | 3M complex(GO:1990393) |
| 0.2 | 0.6 | GO:0032798 | Swi5-Sfr1 complex(GO:0032798) |
| 0.2 | 0.2 | GO:0009331 | glycerol-3-phosphate dehydrogenase complex(GO:0009331) |
| 0.2 | 2.6 | GO:0008290 | F-actin capping protein complex(GO:0008290) |
| 0.2 | 0.6 | GO:0045160 | myosin I complex(GO:0045160) |
| 0.1 | 1.0 | GO:0030121 | AP-1 adaptor complex(GO:0030121) |
| 0.1 | 1.0 | GO:0000015 | phosphopyruvate hydratase complex(GO:0000015) |
| 0.1 | 2.1 | GO:0030478 | actin cap(GO:0030478) |
| 0.1 | 0.7 | GO:0005945 | 6-phosphofructokinase complex(GO:0005945) |
| 0.1 | 0.4 | GO:0070435 | Shc-EGFR complex(GO:0070435) |
| 0.1 | 0.1 | GO:0034681 | integrin alpha11-beta1 complex(GO:0034681) |
| 0.1 | 0.5 | GO:0019867 | outer membrane(GO:0019867) |
| 0.1 | 0.4 | GO:1990812 | growth cone filopodium(GO:1990812) |
| 0.1 | 0.6 | GO:0005594 | collagen type IX trimer(GO:0005594) |
| 0.1 | 1.8 | GO:0000813 | ESCRT I complex(GO:0000813) |
| 0.1 | 0.8 | GO:0070381 | endosome to plasma membrane transport vesicle(GO:0070381) |
| 0.1 | 0.5 | GO:0097629 | extrinsic component of omegasome membrane(GO:0097629) |
| 0.1 | 2.3 | GO:0005862 | muscle thin filament tropomyosin(GO:0005862) |
| 0.1 | 1.0 | GO:0030062 | mitochondrial tricarboxylic acid cycle enzyme complex(GO:0030062) |
| 0.1 | 0.5 | GO:0071149 | TEAD-2-YAP complex(GO:0071149) |
| 0.1 | 0.5 | GO:0097196 | Shu complex(GO:0097196) |
| 0.1 | 2.6 | GO:0031588 | nucleotide-activated protein kinase complex(GO:0031588) |
| 0.1 | 0.1 | GO:0034363 | intermediate-density lipoprotein particle(GO:0034363) |
| 0.1 | 1.1 | GO:0030015 | CCR4-NOT core complex(GO:0030015) |
| 0.1 | 0.4 | GO:0097179 | protease inhibitor complex(GO:0097179) |
| 0.1 | 1.0 | GO:0098845 | postsynaptic endosome(GO:0098845) |
| 0.1 | 2.3 | GO:0045263 | proton-transporting ATP synthase complex, coupling factor F(o)(GO:0045263) |
| 0.1 | 1.9 | GO:0005687 | U4 snRNP(GO:0005687) |
| 0.1 | 0.5 | GO:0009368 | endopeptidase Clp complex(GO:0009368) |
| 0.1 | 0.3 | GO:0097233 | lamellar body membrane(GO:0097232) alveolar lamellar body membrane(GO:0097233) |
| 0.1 | 2.4 | GO:0014731 | spectrin-associated cytoskeleton(GO:0014731) |
| 0.1 | 0.3 | GO:0031372 | UBC13-MMS2 complex(GO:0031372) |
| 0.1 | 1.2 | GO:0043190 | ATP-binding cassette (ABC) transporter complex(GO:0043190) |
| 0.1 | 1.0 | GO:0012510 | trans-Golgi network transport vesicle membrane(GO:0012510) |
| 0.1 | 1.8 | GO:0000815 | ESCRT III complex(GO:0000815) |
| 0.1 | 4.3 | GO:0000421 | autophagosome membrane(GO:0000421) |
| 0.1 | 0.3 | GO:0036195 | muscle cell projection(GO:0036194) muscle cell projection membrane(GO:0036195) |
| 0.1 | 2.4 | GO:0045495 | P granule(GO:0043186) pole plasm(GO:0045495) germ plasm(GO:0060293) |
| 0.1 | 2.6 | GO:0097440 | apical dendrite(GO:0097440) |
| 0.1 | 0.3 | GO:0070557 | PCNA-p21 complex(GO:0070557) |
| 0.1 | 0.6 | GO:0032444 | activin responsive factor complex(GO:0032444) |
| 0.1 | 0.4 | GO:0032437 | cuticular plate(GO:0032437) |
| 0.1 | 2.0 | GO:0031105 | septin complex(GO:0031105) |
| 0.1 | 0.8 | GO:0071986 | Ragulator complex(GO:0071986) |
| 0.1 | 0.1 | GO:0033185 | dolichol-phosphate-mannose synthase complex(GO:0033185) |
| 0.1 | 0.3 | GO:0031084 | BLOC-2 complex(GO:0031084) |
| 0.1 | 1.0 | GO:0044292 | dendrite terminus(GO:0044292) |
| 0.1 | 0.3 | GO:0031467 | Cul7-RING ubiquitin ligase complex(GO:0031467) |
| 0.1 | 0.3 | GO:0031838 | haptoglobin-hemoglobin complex(GO:0031838) |
| 0.1 | 0.5 | GO:1990131 | Gtr1-Gtr2 GTPase complex(GO:1990131) |
| 0.1 | 0.3 | GO:0045281 | mitochondrial respiratory chain complex II, succinate dehydrogenase complex (ubiquinone)(GO:0005749) succinate dehydrogenase complex (ubiquinone)(GO:0045257) respiratory chain complex II(GO:0045273) succinate dehydrogenase complex(GO:0045281) fumarate reductase complex(GO:0045283) |
| 0.1 | 0.4 | GO:0000308 | cytoplasmic cyclin-dependent protein kinase holoenzyme complex(GO:0000308) |
| 0.1 | 0.6 | GO:0016272 | prefoldin complex(GO:0016272) |
| 0.1 | 0.2 | GO:0005683 | U7 snRNP(GO:0005683) |
| 0.1 | 1.0 | GO:0016600 | flotillin complex(GO:0016600) |
| 0.1 | 1.1 | GO:0030126 | COPI vesicle coat(GO:0030126) |
| 0.1 | 1.2 | GO:0031209 | SCAR complex(GO:0031209) |
| 0.1 | 0.2 | GO:0000814 | ESCRT II complex(GO:0000814) |
| 0.1 | 0.4 | GO:0030906 | retromer, cargo-selective complex(GO:0030906) |
| 0.1 | 1.7 | GO:0005890 | sodium:potassium-exchanging ATPase complex(GO:0005890) |
| 0.1 | 0.4 | GO:1990130 | Iml1 complex(GO:1990130) |
| 0.1 | 1.9 | GO:0031307 | integral component of mitochondrial outer membrane(GO:0031307) |
| 0.1 | 4.5 | GO:0008023 | transcription elongation factor complex(GO:0008023) |
| 0.1 | 0.4 | GO:0071797 | LUBAC complex(GO:0071797) |
| 0.1 | 0.1 | GO:0000346 | transcription export complex(GO:0000346) |
| 0.1 | 2.2 | GO:0005665 | DNA-directed RNA polymerase II, core complex(GO:0005665) |
| 0.1 | 1.1 | GO:0031462 | Cul2-RING ubiquitin ligase complex(GO:0031462) |
| 0.1 | 1.9 | GO:0031083 | BLOC-1 complex(GO:0031083) |
| 0.1 | 3.2 | GO:0031941 | filamentous actin(GO:0031941) |
| 0.1 | 0.2 | GO:0070195 | growth hormone receptor complex(GO:0070195) |
| 0.1 | 0.6 | GO:0019774 | proteasome core complex, beta-subunit complex(GO:0019774) |
| 0.1 | 0.6 | GO:0030905 | retromer, tubulation complex(GO:0030905) |
| 0.1 | 1.1 | GO:0035102 | PRC1 complex(GO:0035102) |
| 0.1 | 1.0 | GO:0097136 | Bcl-2 family protein complex(GO:0097136) |
| 0.1 | 0.2 | GO:0042587 | glycogen granule(GO:0042587) |
| 0.1 | 0.9 | GO:0005845 | mRNA cap binding complex(GO:0005845) RNA cap binding complex(GO:0034518) |
| 0.1 | 1.0 | GO:0005589 | collagen type VI trimer(GO:0005589) collagen beaded filament(GO:0098647) |
| 0.1 | 0.3 | GO:0014802 | terminal cisterna(GO:0014802) |
| 0.1 | 1.4 | GO:0097386 | glial cell projection(GO:0097386) |
| 0.1 | 0.2 | GO:0019008 | molybdopterin synthase complex(GO:0019008) |
| 0.1 | 0.2 | GO:0034657 | GID complex(GO:0034657) |
| 0.1 | 0.2 | GO:0070852 | cell body fiber(GO:0070852) |
| 0.1 | 0.2 | GO:0098559 | cytoplasmic side of early endosome membrane(GO:0098559) |
| 0.1 | 0.3 | GO:0000444 | MIS12/MIND type complex(GO:0000444) |
| 0.1 | 1.1 | GO:0000164 | protein phosphatase type 1 complex(GO:0000164) |
| 0.1 | 0.3 | GO:1902937 | inward rectifier potassium channel complex(GO:1902937) |
| 0.1 | 0.2 | GO:0042585 | germinal vesicle(GO:0042585) |
| 0.1 | 0.4 | GO:0042406 | extrinsic component of endoplasmic reticulum membrane(GO:0042406) |
| 0.1 | 0.8 | GO:0035985 | senescence-associated heterochromatin focus(GO:0035985) |
| 0.1 | 0.2 | GO:1990716 | axonemal central apparatus(GO:1990716) |
| 0.1 | 0.2 | GO:0097442 | CA3 pyramidal cell dendrite(GO:0097442) |
| 0.1 | 1.1 | GO:1990124 | messenger ribonucleoprotein complex(GO:1990124) |
| 0.1 | 0.2 | GO:0000125 | PCAF complex(GO:0000125) |
| 0.1 | 0.5 | GO:0005688 | U6 snRNP(GO:0005688) |
| 0.1 | 0.2 | GO:0005608 | laminin-3 complex(GO:0005608) |
| 0.1 | 0.4 | GO:1990769 | proximal neuron projection(GO:1990769) |
| 0.1 | 0.4 | GO:1990584 | cardiac Troponin complex(GO:1990584) |
| 0.1 | 0.2 | GO:0048787 | presynaptic active zone membrane(GO:0048787) |
| 0.1 | 0.2 | GO:0005742 | mitochondrial outer membrane translocase complex(GO:0005742) |
| 0.1 | 0.4 | GO:0071204 | histone pre-mRNA 3'end processing complex(GO:0071204) |
| 0.1 | 0.5 | GO:0045180 | basal cortex(GO:0045180) |
| 0.1 | 0.6 | GO:0030991 | intraciliary transport particle A(GO:0030991) |
| 0.1 | 0.1 | GO:0061673 | mitotic spindle astral microtubule(GO:0061673) |
| 0.1 | 5.8 | GO:0005758 | mitochondrial intermembrane space(GO:0005758) |
| 0.1 | 0.5 | GO:0031314 | extrinsic component of mitochondrial inner membrane(GO:0031314) |
| 0.1 | 0.4 | GO:0000110 | nucleotide-excision repair factor 1 complex(GO:0000110) |
| 0.1 | 0.1 | GO:0002199 | zona pellucida receptor complex(GO:0002199) |
| 0.1 | 0.6 | GO:0043083 | synaptic cleft(GO:0043083) |
| 0.1 | 0.2 | GO:0045259 | proton-transporting ATP synthase complex(GO:0045259) |
| 0.1 | 0.9 | GO:0045009 | melanosome membrane(GO:0033162) chitosome(GO:0045009) |
| 0.1 | 0.2 | GO:0020005 | symbiont-containing vacuole(GO:0020003) symbiont-containing vacuole membrane(GO:0020005) |
| 0.1 | 9.4 | GO:0090575 | RNA polymerase II transcription factor complex(GO:0090575) |
| 0.1 | 6.4 | GO:0000118 | histone deacetylase complex(GO:0000118) |
| 0.1 | 0.5 | GO:0031931 | TORC1 complex(GO:0031931) |
| 0.1 | 0.3 | GO:0070876 | SOSS complex(GO:0070876) |
| 0.1 | 0.2 | GO:0034365 | discoidal high-density lipoprotein particle(GO:0034365) |
| 0.1 | 0.7 | GO:0030014 | CCR4-NOT complex(GO:0030014) |
| 0.1 | 1.2 | GO:0043205 | microfibril(GO:0001527) fibril(GO:0043205) |
| 0.1 | 0.4 | GO:0097413 | Lewy body(GO:0097413) |
| 0.1 | 0.2 | GO:0043293 | apoptosome(GO:0043293) |
| 0.1 | 1.6 | GO:0097381 | photoreceptor disc membrane(GO:0097381) |
| 0.1 | 0.3 | GO:0005684 | U2-type spliceosomal complex(GO:0005684) |
| 0.1 | 6.4 | GO:0016605 | PML body(GO:0016605) |
| 0.1 | 0.9 | GO:0034045 | pre-autophagosomal structure membrane(GO:0034045) |
| 0.1 | 0.2 | GO:0097057 | TRAF2-GSTP1 complex(GO:0097057) |
| 0.1 | 0.4 | GO:1990712 | HFE-transferrin receptor complex(GO:1990712) |
| 0.1 | 1.9 | GO:0009925 | basal plasma membrane(GO:0009925) |
| 0.0 | 1.2 | GO:0005614 | interstitial matrix(GO:0005614) |
| 0.0 | 0.3 | GO:0097361 | CIA complex(GO:0097361) |
| 0.0 | 3.5 | GO:0005762 | organellar large ribosomal subunit(GO:0000315) mitochondrial large ribosomal subunit(GO:0005762) |
| 0.0 | 1.9 | GO:0005859 | muscle myosin complex(GO:0005859) |
| 0.0 | 0.2 | GO:0002193 | MAML1-RBP-Jkappa- ICN1 complex(GO:0002193) |
| 0.0 | 0.3 | GO:0089701 | U2AF(GO:0089701) |
| 0.0 | 0.6 | GO:0005750 | mitochondrial respiratory chain complex III(GO:0005750) respiratory chain complex III(GO:0045275) |
| 0.0 | 0.6 | GO:0042622 | photoreceptor outer segment membrane(GO:0042622) |
| 0.0 | 0.1 | GO:0036398 | TCR signalosome(GO:0036398) |
| 0.0 | 3.0 | GO:0005747 | mitochondrial respiratory chain complex I(GO:0005747) NADH dehydrogenase complex(GO:0030964) respiratory chain complex I(GO:0045271) |
| 0.0 | 0.9 | GO:0031143 | pseudopodium(GO:0031143) |
| 0.0 | 2.8 | GO:0045171 | intercellular bridge(GO:0045171) |
| 0.0 | 2.5 | GO:0005834 | heterotrimeric G-protein complex(GO:0005834) |
| 0.0 | 1.1 | GO:0005942 | phosphatidylinositol 3-kinase complex(GO:0005942) |
| 0.0 | 0.1 | GO:0005588 | collagen type V trimer(GO:0005588) |
| 0.0 | 0.2 | GO:0031466 | Cul5-RING ubiquitin ligase complex(GO:0031466) |
| 0.0 | 1.4 | GO:0031304 | intrinsic component of mitochondrial inner membrane(GO:0031304) integral component of mitochondrial inner membrane(GO:0031305) |
| 0.0 | 0.6 | GO:0034464 | BBSome(GO:0034464) |
| 0.0 | 0.7 | GO:0030008 | TRAPP complex(GO:0030008) |
| 0.0 | 0.3 | GO:0035371 | microtubule plus-end(GO:0035371) |
| 0.0 | 0.3 | GO:0032311 | angiogenin-PRI complex(GO:0032311) |
| 0.0 | 0.8 | GO:0030125 | clathrin vesicle coat(GO:0030125) |
| 0.0 | 0.2 | GO:0017146 | NMDA selective glutamate receptor complex(GO:0017146) |
| 0.0 | 0.3 | GO:0032133 | chromosome passenger complex(GO:0032133) |
| 0.0 | 0.2 | GO:0001940 | male pronucleus(GO:0001940) |
| 0.0 | 0.3 | GO:0005744 | mitochondrial inner membrane presequence translocase complex(GO:0005744) |
| 0.0 | 0.1 | GO:0031415 | NatA complex(GO:0031415) |
| 0.0 | 0.0 | GO:0043564 | Ku70:Ku80 complex(GO:0043564) |
| 0.0 | 0.0 | GO:0070938 | contractile ring(GO:0070938) |
| 0.0 | 0.2 | GO:0097425 | smooth endoplasmic reticulum membrane(GO:0030868) smooth endoplasmic reticulum part(GO:0097425) |
| 0.0 | 0.6 | GO:0030877 | beta-catenin destruction complex(GO:0030877) |
| 0.0 | 0.3 | GO:0044327 | dendritic spine head(GO:0044327) |
| 0.0 | 0.4 | GO:0005853 | eukaryotic translation elongation factor 1 complex(GO:0005853) |
| 0.0 | 2.6 | GO:0019005 | SCF ubiquitin ligase complex(GO:0019005) |
| 0.0 | 0.8 | GO:0001891 | phagocytic cup(GO:0001891) |
| 0.0 | 4.5 | GO:0022625 | cytosolic large ribosomal subunit(GO:0022625) |
| 0.0 | 0.1 | GO:0042720 | mitochondrial inner membrane peptidase complex(GO:0042720) |
| 0.0 | 0.2 | GO:0016035 | zeta DNA polymerase complex(GO:0016035) |
| 0.0 | 0.1 | GO:0030915 | Smc5-Smc6 complex(GO:0030915) |
| 0.0 | 1.0 | GO:0005779 | integral component of peroxisomal membrane(GO:0005779) intrinsic component of peroxisomal membrane(GO:0031231) |
| 0.0 | 0.2 | GO:0030981 | cortical microtubule cytoskeleton(GO:0030981) |
| 0.0 | 0.2 | GO:0032280 | symmetric synapse(GO:0032280) |
| 0.0 | 0.3 | GO:0001740 | Barr body(GO:0001740) |
| 0.0 | 0.1 | GO:0005713 | recombination nodule(GO:0005713) |
| 0.0 | 0.3 | GO:0000445 | THO complex(GO:0000347) THO complex part of transcription export complex(GO:0000445) |
| 0.0 | 0.4 | GO:0000801 | central element(GO:0000801) |
| 0.0 | 0.3 | GO:0034451 | centriolar satellite(GO:0034451) |
| 0.0 | 0.3 | GO:0042567 | insulin-like growth factor ternary complex(GO:0042567) |
| 0.0 | 0.2 | GO:0097129 | cyclin D2-CDK4 complex(GO:0097129) |
| 0.0 | 0.2 | GO:0071818 | BAT3 complex(GO:0071818) ER membrane insertion complex(GO:0072379) |
| 0.0 | 0.2 | GO:0051233 | spindle midzone(GO:0051233) |
| 0.0 | 2.4 | GO:0097517 | stress fiber(GO:0001725) contractile actin filament bundle(GO:0097517) |
| 0.0 | 2.6 | GO:0022627 | cytosolic small ribosomal subunit(GO:0022627) |
| 0.0 | 0.3 | GO:0035686 | sperm fibrous sheath(GO:0035686) |
| 0.0 | 0.3 | GO:0035859 | Seh1-associated complex(GO:0035859) |
| 0.0 | 0.6 | GO:0036038 | MKS complex(GO:0036038) |
| 0.0 | 2.3 | GO:0031903 | peroxisomal membrane(GO:0005778) microbody membrane(GO:0031903) |
| 0.0 | 0.2 | GO:0071144 | SMAD2-SMAD3 protein complex(GO:0071144) |
| 0.0 | 0.1 | GO:0000178 | exosome (RNase complex)(GO:0000178) |
| 0.0 | 1.1 | GO:0080008 | Cul4-RING E3 ubiquitin ligase complex(GO:0080008) |
| 0.0 | 0.5 | GO:0005869 | dynactin complex(GO:0005869) |
| 0.0 | 0.2 | GO:0005952 | cAMP-dependent protein kinase complex(GO:0005952) |
| 0.0 | 0.5 | GO:0008385 | IkappaB kinase complex(GO:0008385) |
| 0.0 | 0.2 | GO:0070436 | Grb2-EGFR complex(GO:0070436) |
| 0.0 | 1.1 | GO:0034364 | high-density lipoprotein particle(GO:0034364) |
| 0.0 | 0.1 | GO:0010370 | perinucleolar chromocenter(GO:0010370) |
| 0.0 | 1.3 | GO:0044298 | neuronal cell body membrane(GO:0032809) cell body membrane(GO:0044298) |
| 0.0 | 2.3 | GO:0097610 | cleavage furrow(GO:0032154) cell surface furrow(GO:0097610) |
| 0.0 | 0.6 | GO:0005682 | U5 snRNP(GO:0005682) |
| 0.0 | 0.3 | GO:0016013 | syntrophin complex(GO:0016013) |
| 0.0 | 0.9 | GO:0005868 | cytoplasmic dynein complex(GO:0005868) |
| 0.0 | 1.1 | GO:0031430 | M band(GO:0031430) |
| 0.0 | 1.4 | GO:0044438 | microbody part(GO:0044438) peroxisomal part(GO:0044439) |
| 0.0 | 0.2 | GO:0044218 | other organism cell membrane(GO:0044218) other organism membrane(GO:0044279) |
| 0.0 | 0.1 | GO:0097208 | alveolar lamellar body(GO:0097208) |
| 0.0 | 0.5 | GO:0001518 | voltage-gated sodium channel complex(GO:0001518) |
| 0.0 | 0.2 | GO:0000275 | mitochondrial proton-transporting ATP synthase complex, catalytic core F(1)(GO:0000275) |
| 0.0 | 1.1 | GO:0005844 | polysome(GO:0005844) |
| 0.0 | 0.1 | GO:0070761 | pre-snoRNP complex(GO:0070761) |
| 0.0 | 0.1 | GO:0016342 | catenin complex(GO:0016342) |
| 0.0 | 0.2 | GO:0005964 | phosphorylase kinase complex(GO:0005964) |
| 0.0 | 0.3 | GO:0048188 | Set1C/COMPASS complex(GO:0048188) |
| 0.0 | 0.1 | GO:0000777 | condensed chromosome kinetochore(GO:0000777) |
| 0.0 | 0.1 | GO:0000502 | proteasome complex(GO:0000502) |
| 0.0 | 0.4 | GO:0005885 | Arp2/3 protein complex(GO:0005885) |
| 0.0 | 0.1 | GO:0002177 | manchette(GO:0002177) |
| 0.0 | 0.1 | GO:0030934 | anchoring collagen complex(GO:0030934) |
| 0.0 | 0.2 | GO:0061574 | ASAP complex(GO:0061574) |
| 0.0 | 0.1 | GO:0008282 | ATP-sensitive potassium channel complex(GO:0008282) |
| 0.0 | 0.1 | GO:0005956 | protein kinase CK2 complex(GO:0005956) |
| 0.0 | 0.2 | GO:0033268 | node of Ranvier(GO:0033268) |
| 0.0 | 0.2 | GO:0017059 | serine C-palmitoyltransferase complex(GO:0017059) endoplasmic reticulum palmitoyltransferase complex(GO:0031211) |
| 0.0 | 0.1 | GO:0035370 | UBC13-UEV1A complex(GO:0035370) |
| 0.0 | 0.4 | GO:0005839 | proteasome core complex(GO:0005839) |
| 0.0 | 0.3 | GO:0005833 | hemoglobin complex(GO:0005833) |
| 0.0 | 1.2 | GO:0031201 | SNARE complex(GO:0031201) |
| 0.0 | 0.8 | GO:0005761 | organellar ribosome(GO:0000313) mitochondrial ribosome(GO:0005761) |
| 0.0 | 0.1 | GO:0030897 | HOPS complex(GO:0030897) |
| 0.0 | 0.1 | GO:0060199 | clathrin-sculpted glutamate transport vesicle(GO:0060199) clathrin-sculpted glutamate transport vesicle membrane(GO:0060203) |
| 0.0 | 0.3 | GO:0097025 | MPP7-DLG1-LIN7 complex(GO:0097025) |
| 0.0 | 0.6 | GO:0032839 | dendrite cytoplasm(GO:0032839) |
| 0.0 | 0.1 | GO:0031616 | spindle pole centrosome(GO:0031616) |
| 0.0 | 0.2 | GO:0030904 | retromer complex(GO:0030904) |
| 0.0 | 0.1 | GO:0030678 | mitochondrial ribonuclease P complex(GO:0030678) |
| 0.0 | 0.3 | GO:0044295 | axonal growth cone(GO:0044295) |
| 0.0 | 0.2 | GO:0005854 | nascent polypeptide-associated complex(GO:0005854) |
| 0.0 | 0.4 | GO:0005938 | cell cortex(GO:0005938) |
| 0.0 | 0.0 | GO:0005899 | insulin receptor complex(GO:0005899) |
| 0.0 | 0.2 | GO:0000812 | Swr1 complex(GO:0000812) |
| 0.0 | 0.2 | GO:0060091 | kinocilium(GO:0060091) |
| 0.0 | 1.2 | GO:0016235 | aggresome(GO:0016235) |
| 0.0 | 0.0 | GO:0000805 | X chromosome(GO:0000805) |
| 0.0 | 0.2 | GO:0031904 | endosome lumen(GO:0031904) |
| 0.0 | 0.1 | GO:0044305 | calyx of Held(GO:0044305) |
| 0.0 | 0.1 | GO:1902560 | GMP reductase complex(GO:1902560) |
| 0.0 | 1.7 | GO:0031463 | Cul3-RING ubiquitin ligase complex(GO:0031463) |
| 0.0 | 0.5 | GO:0016591 | DNA-directed RNA polymerase II, holoenzyme(GO:0016591) |
| 0.0 | 0.1 | GO:0005638 | lamin filament(GO:0005638) |
| 0.0 | 0.2 | GO:0071141 | SMAD protein complex(GO:0071141) |
| 0.0 | 0.2 | GO:0033165 | interphotoreceptor matrix(GO:0033165) |
| 0.0 | 0.1 | GO:0000229 | cytoplasmic chromosome(GO:0000229) |
| 0.0 | 0.2 | GO:0035145 | exon-exon junction complex(GO:0035145) |
| 0.0 | 0.3 | GO:0005689 | U12-type spliceosomal complex(GO:0005689) |
| 0.0 | 0.6 | GO:0070469 | respiratory chain(GO:0070469) |
| 0.0 | 0.2 | GO:0000137 | Golgi cis cisterna(GO:0000137) |
| 0.0 | 0.0 | GO:0097169 | AIM2 inflammasome complex(GO:0097169) |
| 0.0 | 0.5 | GO:0030286 | dynein complex(GO:0030286) |
| 0.0 | 0.0 | GO:0032432 | actin filament bundle(GO:0032432) |
| 0.0 | 0.0 | GO:0000939 | condensed chromosome inner kinetochore(GO:0000939) |
| 0.0 | 0.6 | GO:0005581 | collagen trimer(GO:0005581) |
| 0.0 | 0.1 | GO:0000407 | pre-autophagosomal structure(GO:0000407) |
| 0.0 | 0.1 | GO:0005889 | hydrogen:potassium-exchanging ATPase complex(GO:0005889) |
| 0.0 | 0.8 | GO:0005776 | autophagosome(GO:0005776) |
| 0.0 | 0.1 | GO:0032299 | ribonuclease H2 complex(GO:0032299) |
| 0.0 | 0.0 | GO:0034751 | aryl hydrocarbon receptor complex(GO:0034751) |
| 0.0 | 0.1 | GO:0000782 | telomere cap complex(GO:0000782) nuclear telomere cap complex(GO:0000783) |
| 0.0 | 1.8 | GO:0000932 | cytoplasmic mRNA processing body(GO:0000932) |
| 0.0 | 0.0 | GO:0002178 | palmitoyltransferase complex(GO:0002178) |
| 0.0 | 0.2 | GO:0000788 | nuclear nucleosome(GO:0000788) |
| 0.0 | 0.2 | GO:0005671 | Ada2/Gcn5/Ada3 transcription activator complex(GO:0005671) |
| 0.0 | 0.0 | GO:0097228 | sperm principal piece(GO:0097228) |
| 0.0 | 0.3 | GO:0031264 | death-inducing signaling complex(GO:0031264) |
| 0.0 | 1.2 | GO:0034704 | calcium channel complex(GO:0034704) |
| 0.0 | 0.1 | GO:0033179 | proton-transporting V-type ATPase, V0 domain(GO:0033179) |
| 0.0 | 0.1 | GO:0031094 | platelet dense tubular network(GO:0031094) |
| 0.0 | 0.1 | GO:0070069 | cytochrome complex(GO:0070069) |
| 0.0 | 0.7 | GO:0030016 | myofibril(GO:0030016) |
| 0.0 | 0.1 | GO:0033588 | Elongator holoenzyme complex(GO:0033588) |
| 0.0 | 1.3 | GO:0031093 | platelet alpha granule lumen(GO:0031093) |
| 0.0 | 0.1 | GO:0022626 | cytosolic ribosome(GO:0022626) |
| 0.0 | 0.3 | GO:0033202 | Ino80 complex(GO:0031011) DNA helicase complex(GO:0033202) |
| 0.0 | 0.1 | GO:0033263 | CORVET complex(GO:0033263) |
| 0.0 | 6.4 | GO:0005759 | mitochondrial matrix(GO:0005759) |
| 0.0 | 0.1 | GO:0042584 | chromaffin granule membrane(GO:0042584) |
| 0.0 | 1.0 | GO:1904724 | tertiary granule lumen(GO:1904724) |
| 0.0 | 0.1 | GO:0072669 | tRNA-splicing ligase complex(GO:0072669) |
| 0.0 | 0.3 | GO:0035327 | transcriptionally active chromatin(GO:0035327) |
| 0.0 | 0.0 | GO:0005790 | smooth endoplasmic reticulum(GO:0005790) |
| 0.0 | 0.4 | GO:0071565 | nBAF complex(GO:0071565) |
| 0.0 | 0.1 | GO:0032777 | Piccolo NuA4 histone acetyltransferase complex(GO:0032777) |
| 0.0 | 0.1 | GO:0070937 | CRD-mediated mRNA stability complex(GO:0070937) |
| 0.0 | 1.8 | GO:0032587 | ruffle membrane(GO:0032587) |
| 0.0 | 0.2 | GO:0035869 | ciliary transition zone(GO:0035869) |
| 0.0 | 0.0 | GO:1990622 | CHOP-ATF3 complex(GO:1990622) |
| 0.0 | 0.1 | GO:0045178 | basal part of cell(GO:0045178) |
| 0.0 | 17.9 | GO:0005739 | mitochondrion(GO:0005739) |
| 0.0 | 0.1 | GO:0033257 | Bcl3/NF-kappaB2 complex(GO:0033257) |
| 0.0 | 0.4 | GO:0016592 | mediator complex(GO:0016592) |
| 0.0 | 0.4 | GO:0030027 | lamellipodium(GO:0030027) |
| 0.0 | 0.4 | GO:0030672 | synaptic vesicle membrane(GO:0030672) exocytic vesicle membrane(GO:0099501) |
| 0.0 | 0.5 | GO:0031519 | PcG protein complex(GO:0031519) |
| 0.0 | 0.5 | GO:0043198 | dendritic shaft(GO:0043198) |
| 0.0 | 0.5 | GO:0030863 | cortical cytoskeleton(GO:0030863) |
| 0.0 | 0.0 | GO:0034719 | SMN-Sm protein complex(GO:0034719) |
| 0.0 | 0.0 | GO:0090665 | dystrophin-associated glycoprotein complex(GO:0016010) glycoprotein complex(GO:0090665) |
| 0.0 | 0.1 | GO:0046581 | intercellular canaliculus(GO:0046581) |
| 0.0 | 0.1 | GO:0033063 | Rad51B-Rad51C-Rad51D-XRCC2 complex(GO:0033063) |
| 0.0 | 1.7 | GO:0015629 | actin cytoskeleton(GO:0015629) |
| 0.0 | 0.0 | GO:1990604 | IRE1-TRAF2-ASK1 complex(GO:1990604) |
| 0.0 | 0.0 | GO:0016460 | myosin II complex(GO:0016460) |
| 0.0 | 0.1 | GO:0097433 | dense body(GO:0097433) |
| 0.0 | 0.0 | GO:0071564 | npBAF complex(GO:0071564) |
| 0.0 | 0.3 | GO:0000791 | euchromatin(GO:0000791) |
| 0.0 | 0.3 | GO:0000922 | spindle pole(GO:0000922) |
| 0.0 | 0.1 | GO:0097486 | multivesicular body lumen(GO:0097486) |
| 0.0 | 0.1 | GO:0098839 | postsynaptic density membrane(GO:0098839) |
| 0.0 | 0.1 | GO:0042643 | actomyosin, actin portion(GO:0042643) |
Gene overrepresentation in molecular_function category:
| Log-likelihood per target | Total log-likelihood | Term | Description |
|---|---|---|---|
| 1.0 | 3.9 | GO:0047066 | phospholipid-hydroperoxide glutathione peroxidase activity(GO:0047066) |
| 0.6 | 5.3 | GO:0048495 | Roundabout binding(GO:0048495) |
| 0.4 | 1.3 | GO:0016662 | cystathionine beta-synthase activity(GO:0004122) oxidoreductase activity, acting on other nitrogenous compounds as donors, cytochrome as acceptor(GO:0016662) nitrite reductase (NO-forming) activity(GO:0050421) carbon monoxide binding(GO:0070025) nitrite reductase activity(GO:0098809) |
| 0.4 | 1.3 | GO:0044549 | GTP cyclohydrolase binding(GO:0044549) |
| 0.4 | 1.2 | GO:0016880 | glutamate-ammonia ligase activity(GO:0004356) ammonia ligase activity(GO:0016211) acid-ammonia (or amide) ligase activity(GO:0016880) |
| 0.4 | 4.5 | GO:0071933 | Arp2/3 complex binding(GO:0071933) |
| 0.4 | 2.3 | GO:0043183 | vascular endothelial growth factor receptor 1 binding(GO:0043183) |
| 0.4 | 1.1 | GO:0008478 | pyridoxal kinase activity(GO:0008478) lithium ion binding(GO:0031403) |
| 0.4 | 3.3 | GO:0008142 | oxysterol binding(GO:0008142) |
| 0.3 | 0.9 | GO:0032090 | Pyrin domain binding(GO:0032090) |
| 0.3 | 1.2 | GO:0016784 | 3-mercaptopyruvate sulfurtransferase activity(GO:0016784) |
| 0.3 | 0.9 | GO:0052895 | norspermine:oxygen oxidoreductase activity(GO:0052894) N1-acetylspermine:oxygen oxidoreductase (N1-acetylspermidine-forming) activity(GO:0052895) |
| 0.3 | 0.9 | GO:0061663 | NEDD8 ligase activity(GO:0061663) |
| 0.3 | 1.1 | GO:0033981 | D-dopachrome decarboxylase activity(GO:0033981) |
| 0.3 | 1.4 | GO:0001025 | RNA polymerase III transcription factor binding(GO:0001025) |
| 0.3 | 0.8 | GO:0031859 | platelet activating factor receptor binding(GO:0031859) |
| 0.3 | 0.8 | GO:0004324 | ferredoxin-NADP+ reductase activity(GO:0004324) NADPH-adrenodoxin reductase activity(GO:0015039) oxidoreductase activity, acting on iron-sulfur proteins as donors(GO:0016730) oxidoreductase activity, acting on iron-sulfur proteins as donors, NAD or NADP as acceptor(GO:0016731) |
| 0.3 | 3.2 | GO:0031386 | protein tag(GO:0031386) |
| 0.2 | 1.0 | GO:0031692 | alpha-1B adrenergic receptor binding(GO:0031692) |
| 0.2 | 2.0 | GO:1901612 | cardiolipin binding(GO:1901612) |
| 0.2 | 0.7 | GO:0032427 | GBD domain binding(GO:0032427) |
| 0.2 | 1.2 | GO:0018479 | benzaldehyde dehydrogenase (NAD+) activity(GO:0018479) |
| 0.2 | 0.2 | GO:0003696 | satellite DNA binding(GO:0003696) |
| 0.2 | 1.7 | GO:0001665 | alpha-N-acetylgalactosaminide alpha-2,6-sialyltransferase activity(GO:0001665) |
| 0.2 | 1.4 | GO:0042806 | fucose binding(GO:0042806) |
| 0.2 | 0.9 | GO:0016404 | 15-hydroxyprostaglandin dehydrogenase (NAD+) activity(GO:0016404) |
| 0.2 | 0.9 | GO:0070051 | fibrinogen binding(GO:0070051) |
| 0.2 | 0.2 | GO:0051990 | (R)-2-hydroxyglutarate dehydrogenase activity(GO:0051990) |
| 0.2 | 1.5 | GO:0097643 | amylin receptor activity(GO:0097643) |
| 0.2 | 1.3 | GO:0004735 | pyrroline-5-carboxylate reductase activity(GO:0004735) |
| 0.2 | 0.6 | GO:0016781 | selenide, water dikinase activity(GO:0004756) phosphotransferase activity, paired acceptors(GO:0016781) |
| 0.2 | 1.1 | GO:0044729 | hemi-methylated DNA-binding(GO:0044729) |
| 0.2 | 0.6 | GO:0098782 | mechanically-gated potassium channel activity(GO:0098782) |
| 0.2 | 1.0 | GO:0002046 | opsin binding(GO:0002046) |
| 0.2 | 0.8 | GO:0008670 | 2,4-dienoyl-CoA reductase (NADPH) activity(GO:0008670) |
| 0.2 | 0.8 | GO:0003867 | 4-aminobutyrate transaminase activity(GO:0003867) succinate-semialdehyde dehydrogenase binding(GO:0032145) (S)-3-amino-2-methylpropionate transaminase activity(GO:0047298) |
| 0.2 | 0.6 | GO:0034353 | RNA pyrophosphohydrolase activity(GO:0034353) |
| 0.2 | 0.4 | GO:0016641 | oxidoreductase activity, acting on the CH-NH2 group of donors, oxygen as acceptor(GO:0016641) |
| 0.2 | 0.8 | GO:0005017 | platelet-derived growth factor-activated receptor activity(GO:0005017) |
| 0.2 | 0.6 | GO:0004958 | prostaglandin F receptor activity(GO:0004958) |
| 0.2 | 0.6 | GO:0003863 | alpha-ketoacid dehydrogenase activity(GO:0003826) 3-methyl-2-oxobutanoate dehydrogenase (2-methylpropanoyl-transferring) activity(GO:0003863) |
| 0.2 | 0.2 | GO:0004345 | glucose-6-phosphate dehydrogenase activity(GO:0004345) |
| 0.2 | 0.4 | GO:0016638 | oxidoreductase activity, acting on the CH-NH2 group of donors(GO:0016638) |
| 0.2 | 1.8 | GO:0043426 | MRF binding(GO:0043426) |
| 0.2 | 1.2 | GO:0003998 | acylphosphatase activity(GO:0003998) |
| 0.2 | 1.2 | GO:0004647 | phosphoserine phosphatase activity(GO:0004647) |
| 0.2 | 0.6 | GO:0035034 | histone acetyltransferase regulator activity(GO:0035034) |
| 0.2 | 0.8 | GO:0019770 | IgG receptor activity(GO:0019770) |
| 0.2 | 0.6 | GO:0031751 | D4 dopamine receptor binding(GO:0031751) |
| 0.2 | 0.9 | GO:0052834 | inositol monophosphate 1-phosphatase activity(GO:0008934) inositol monophosphate 3-phosphatase activity(GO:0052832) inositol monophosphate 4-phosphatase activity(GO:0052833) inositol monophosphate phosphatase activity(GO:0052834) |
| 0.2 | 0.2 | GO:0003955 | NAD(P)H dehydrogenase (quinone) activity(GO:0003955) |
| 0.2 | 0.5 | GO:0031780 | corticotropin hormone receptor binding(GO:0031780) type 5 melanocortin receptor binding(GO:0031783) |
| 0.2 | 1.1 | GO:0015307 | drug:proton antiporter activity(GO:0015307) |
| 0.2 | 0.5 | GO:0016155 | formyltetrahydrofolate dehydrogenase activity(GO:0016155) |
| 0.2 | 0.9 | GO:0070095 | fructose-6-phosphate binding(GO:0070095) |
| 0.2 | 1.7 | GO:0034485 | phosphatidylinositol-3,4,5-trisphosphate 5-phosphatase activity(GO:0034485) |
| 0.2 | 0.5 | GO:0086062 | voltage-gated sodium channel activity involved in Purkinje myocyte action potential(GO:0086062) |
| 0.2 | 0.7 | GO:0042903 | tubulin deacetylase activity(GO:0042903) |
| 0.2 | 1.6 | GO:0070739 | protein-glutamic acid ligase activity(GO:0070739) |
| 0.2 | 0.7 | GO:0004874 | aryl hydrocarbon receptor activity(GO:0004874) |
| 0.2 | 0.7 | GO:0071209 | U7 snRNA binding(GO:0071209) |
| 0.2 | 0.2 | GO:0019166 | trans-2-enoyl-CoA reductase (NADPH) activity(GO:0019166) |
| 0.2 | 1.0 | GO:0033743 | peptide-methionine (R)-S-oxide reductase activity(GO:0033743) |
| 0.2 | 1.3 | GO:0050833 | pyruvate transmembrane transporter activity(GO:0050833) |
| 0.2 | 0.6 | GO:0017089 | glycolipid transporter activity(GO:0017089) |
| 0.2 | 1.3 | GO:0043237 | laminin-1 binding(GO:0043237) |
| 0.2 | 1.0 | GO:0008597 | calcium-dependent protein serine/threonine phosphatase regulator activity(GO:0008597) |
| 0.2 | 1.1 | GO:0016403 | dimethylargininase activity(GO:0016403) |
| 0.2 | 2.1 | GO:0045159 | myosin II binding(GO:0045159) |
| 0.2 | 0.8 | GO:0008453 | alanine-glyoxylate transaminase activity(GO:0008453) |
| 0.2 | 1.1 | GO:0061133 | endopeptidase activator activity(GO:0061133) |
| 0.2 | 0.5 | GO:0017057 | 6-phosphogluconolactonase activity(GO:0017057) |
| 0.2 | 1.5 | GO:0004305 | ethanolamine kinase activity(GO:0004305) |
| 0.2 | 1.5 | GO:0060228 | phosphatidylcholine-sterol O-acyltransferase activator activity(GO:0060228) |
| 0.2 | 0.5 | GO:0070579 | methylcytosine dioxygenase activity(GO:0070579) |
| 0.2 | 0.5 | GO:0035033 | histone deacetylase regulator activity(GO:0035033) |
| 0.2 | 0.3 | GO:0004792 | thiosulfate sulfurtransferase activity(GO:0004792) |
| 0.2 | 0.6 | GO:0051022 | GDP-dissociation inhibitor binding(GO:0051021) Rho GDP-dissociation inhibitor binding(GO:0051022) |
| 0.1 | 0.4 | GO:0008969 | phosphohistidine phosphatase activity(GO:0008969) |
| 0.1 | 1.0 | GO:0004634 | phosphopyruvate hydratase activity(GO:0004634) |
| 0.1 | 0.7 | GO:0004949 | cannabinoid receptor activity(GO:0004949) |
| 0.1 | 2.6 | GO:0036374 | glutathione hydrolase activity(GO:0036374) |
| 0.1 | 0.1 | GO:0016401 | palmitoyl-CoA oxidase activity(GO:0016401) |
| 0.1 | 0.8 | GO:0070735 | protein-glycine ligase activity(GO:0070735) |
| 0.1 | 0.4 | GO:0005173 | stem cell factor receptor binding(GO:0005173) |
| 0.1 | 0.1 | GO:0030169 | low-density lipoprotein particle binding(GO:0030169) |
| 0.1 | 0.4 | GO:0097493 | structural molecule activity conferring elasticity(GO:0097493) |
| 0.1 | 1.8 | GO:0097371 | MDM2/MDM4 family protein binding(GO:0097371) |
| 0.1 | 0.5 | GO:0035651 | AP-3 adaptor complex binding(GO:0035651) |
| 0.1 | 0.4 | GO:0031071 | cysteine desulfurase activity(GO:0031071) |
| 0.1 | 1.1 | GO:0042296 | ISG15 transferase activity(GO:0042296) |
| 0.1 | 0.5 | GO:0004104 | cholinesterase activity(GO:0004104) |
| 0.1 | 1.2 | GO:0008420 | CTD phosphatase activity(GO:0008420) |
| 0.1 | 0.4 | GO:0004794 | L-threonine ammonia-lyase activity(GO:0004794) |
| 0.1 | 2.0 | GO:0019855 | calcium channel inhibitor activity(GO:0019855) |
| 0.1 | 0.1 | GO:0004532 | exoribonuclease activity(GO:0004532) |
| 0.1 | 0.5 | GO:0004427 | inorganic diphosphatase activity(GO:0004427) |
| 0.1 | 0.7 | GO:0008665 | 2'-phosphotransferase activity(GO:0008665) |
| 0.1 | 0.5 | GO:0047391 | alkylglycerophosphoethanolamine phosphodiesterase activity(GO:0047391) |
| 0.1 | 0.5 | GO:0004667 | prostaglandin-D synthase activity(GO:0004667) |
| 0.1 | 0.1 | GO:0008269 | JAK pathway signal transduction adaptor activity(GO:0008269) |
| 0.1 | 0.4 | GO:0019912 | cyclin-dependent protein kinase activating kinase activity(GO:0019912) |
| 0.1 | 0.4 | GO:0004019 | adenylosuccinate synthase activity(GO:0004019) |
| 0.1 | 1.7 | GO:0015038 | glutathione disulfide oxidoreductase activity(GO:0015038) |
| 0.1 | 1.1 | GO:0008158 | hedgehog receptor activity(GO:0008158) |
| 0.1 | 0.4 | GO:0008332 | low voltage-gated calcium channel activity(GO:0008332) |
| 0.1 | 0.5 | GO:0004111 | creatine kinase activity(GO:0004111) |
| 0.1 | 0.1 | GO:0030170 | pyridoxal phosphate binding(GO:0030170) |
| 0.1 | 0.4 | GO:0004852 | uroporphyrinogen-III synthase activity(GO:0004852) |
| 0.1 | 0.1 | GO:0032089 | NACHT domain binding(GO:0032089) |
| 0.1 | 1.0 | GO:0005087 | Ran guanyl-nucleotide exchange factor activity(GO:0005087) |
| 0.1 | 0.2 | GO:0070742 | C2H2 zinc finger domain binding(GO:0070742) |
| 0.1 | 0.5 | GO:0004886 | 9-cis retinoic acid receptor activity(GO:0004886) |
| 0.1 | 0.4 | GO:0050698 | proteoglycan sulfotransferase activity(GO:0050698) |
| 0.1 | 1.2 | GO:0051430 | corticotropin-releasing hormone receptor 1 binding(GO:0051430) |
| 0.1 | 0.7 | GO:0016531 | copper chaperone activity(GO:0016531) |
| 0.1 | 0.4 | GO:0030572 | cardiolipin synthase activity(GO:0008808) phosphatidyltransferase activity(GO:0030572) CDP-diacylglycerol-phosphatidylglycerol phosphatidyltransferase activity(GO:0043337) |
| 0.1 | 0.3 | GO:0008859 | exoribonuclease II activity(GO:0008859) |
| 0.1 | 2.4 | GO:0004861 | cyclin-dependent protein serine/threonine kinase inhibitor activity(GO:0004861) |
| 0.1 | 0.5 | GO:0001727 | lipid kinase activity(GO:0001727) |
| 0.1 | 0.3 | GO:0050291 | sphingosine N-acyltransferase activity(GO:0050291) |
| 0.1 | 0.6 | GO:0004668 | protein-arginine deiminase activity(GO:0004668) |
| 0.1 | 1.0 | GO:0019992 | diacylglycerol binding(GO:0019992) |
| 0.1 | 0.6 | GO:0050436 | microfibril binding(GO:0050436) |
| 0.1 | 0.6 | GO:0004906 | interferon-gamma receptor activity(GO:0004906) |
| 0.1 | 0.6 | GO:0001733 | galactosylceramide sulfotransferase activity(GO:0001733) galactose 3-O-sulfotransferase activity(GO:0050694) |
| 0.1 | 0.3 | GO:0043423 | 3-phosphoinositide-dependent protein kinase binding(GO:0043423) |
| 0.1 | 0.7 | GO:0015142 | citrate transmembrane transporter activity(GO:0015137) tricarboxylic acid transmembrane transporter activity(GO:0015142) |
| 0.1 | 0.2 | GO:0052901 | polyamine oxidase activity(GO:0046592) spermine:oxygen oxidoreductase (spermidine-forming) activity(GO:0052901) |
| 0.1 | 0.3 | GO:0032440 | 2-alkenal reductase [NAD(P)] activity(GO:0032440) |
| 0.1 | 0.4 | GO:0004031 | aldehyde oxidase activity(GO:0004031) |
| 0.1 | 0.4 | GO:1904492 | Ac-Asp-Glu binding(GO:1904492) tetrahydrofolyl-poly(glutamate) polymer binding(GO:1904493) |
| 0.1 | 0.4 | GO:0000702 | oxidized base lesion DNA N-glycosylase activity(GO:0000702) |
| 0.1 | 0.1 | GO:0044388 | small protein activating enzyme binding(GO:0044388) |
| 0.1 | 0.5 | GO:0052740 | 1-acyl-2-lysophosphatidylserine acylhydrolase activity(GO:0052740) |
| 0.1 | 0.4 | GO:0004074 | biliverdin reductase activity(GO:0004074) |
| 0.1 | 6.0 | GO:0004683 | calmodulin-dependent protein kinase activity(GO:0004683) |
| 0.1 | 0.3 | GO:0047631 | ADP-ribose diphosphatase activity(GO:0047631) |
| 0.1 | 0.5 | GO:0004306 | ethanolamine-phosphate cytidylyltransferase activity(GO:0004306) |
| 0.1 | 1.2 | GO:0004969 | histamine receptor activity(GO:0004969) |
| 0.1 | 0.4 | GO:0004165 | dodecenoyl-CoA delta-isomerase activity(GO:0004165) |
| 0.1 | 0.5 | GO:0005315 | inorganic phosphate transmembrane transporter activity(GO:0005315) |
| 0.1 | 3.0 | GO:0008093 | cytoskeletal adaptor activity(GO:0008093) |
| 0.1 | 0.6 | GO:0052844 | endopolyphosphatase activity(GO:0000298) diphosphoinositol-polyphosphate diphosphatase activity(GO:0008486) bis(5'-adenosyl)-hexaphosphatase activity(GO:0034431) bis(5'-adenosyl)-pentaphosphatase activity(GO:0034432) inositol diphosphate tetrakisphosphate diphosphatase activity(GO:0052840) inositol bisdiphosphate tetrakisphosphate diphosphatase activity(GO:0052841) inositol diphosphate pentakisphosphate diphosphatase activity(GO:0052842) inositol-1-diphosphate-2,3,4,5,6-pentakisphosphate diphosphatase activity(GO:0052843) inositol-3-diphosphate-1,2,4,5,6-pentakisphosphate diphosphatase activity(GO:0052844) inositol-5-diphosphate-1,2,3,4,6-pentakisphosphate diphosphatase activity(GO:0052845) inositol-1,5-bisdiphosphate-2,3,4,6-tetrakisphosphate 1-diphosphatase activity(GO:0052846) inositol-1,5-bisdiphosphate-2,3,4,6-tetrakisphosphate 5-diphosphatase activity(GO:0052847) inositol-3,5-bisdiphosphate-2,3,4,6-tetrakisphosphate 5-diphosphatase activity(GO:0052848) |
| 0.1 | 0.3 | GO:0003988 | acetyl-CoA C-acyltransferase activity(GO:0003988) |
| 0.1 | 0.3 | GO:0004574 | oligo-1,6-glucosidase activity(GO:0004574) |
| 0.1 | 0.3 | GO:0046848 | hydroxyapatite binding(GO:0046848) |
| 0.1 | 1.1 | GO:0004849 | uridine kinase activity(GO:0004849) |
| 0.1 | 0.6 | GO:0004719 | protein-L-isoaspartate (D-aspartate) O-methyltransferase activity(GO:0004719) |
| 0.1 | 0.3 | GO:0010309 | acireductone dioxygenase [iron(II)-requiring] activity(GO:0010309) |
| 0.1 | 0.2 | GO:0016655 | oxidoreductase activity, acting on NAD(P)H, quinone or similar compound as acceptor(GO:0016655) |
| 0.1 | 0.5 | GO:0008073 | ornithine decarboxylase inhibitor activity(GO:0008073) |
| 0.1 | 0.3 | GO:0004797 | thymidine kinase activity(GO:0004797) |
| 0.1 | 1.2 | GO:0008603 | cAMP-dependent protein kinase regulator activity(GO:0008603) |
| 0.1 | 1.1 | GO:0050544 | arachidonic acid binding(GO:0050544) |
| 0.1 | 0.2 | GO:0035662 | Toll-like receptor 4 binding(GO:0035662) |
| 0.1 | 1.3 | GO:0016290 | palmitoyl-CoA hydrolase activity(GO:0016290) |
| 0.1 | 0.3 | GO:0033878 | hormone-sensitive lipase activity(GO:0033878) |
| 0.1 | 0.8 | GO:0009008 | DNA-methyltransferase activity(GO:0009008) |
| 0.1 | 0.4 | GO:0005275 | amine transmembrane transporter activity(GO:0005275) |
| 0.1 | 0.6 | GO:0008853 | exodeoxyribonuclease III activity(GO:0008853) |
| 0.1 | 0.9 | GO:0004028 | 3-chloroallyl aldehyde dehydrogenase activity(GO:0004028) |
| 0.1 | 0.4 | GO:0035515 | oxidative RNA demethylase activity(GO:0035515) |
| 0.1 | 1.5 | GO:0004679 | AMP-activated protein kinase activity(GO:0004679) |
| 0.1 | 0.4 | GO:0042132 | fructose 1,6-bisphosphate 1-phosphatase activity(GO:0042132) |
| 0.1 | 1.5 | GO:1990459 | transferrin receptor binding(GO:1990459) |
| 0.1 | 1.9 | GO:0035925 | mRNA 3'-UTR AU-rich region binding(GO:0035925) |
| 0.1 | 1.5 | GO:0010314 | phosphatidylinositol-5-phosphate binding(GO:0010314) |
| 0.1 | 0.3 | GO:0030375 | thyroid hormone receptor activator activity(GO:0010861) thyroid hormone receptor coactivator activity(GO:0030375) |
| 0.1 | 0.2 | GO:0051998 | carboxyl-O-methyltransferase activity(GO:0010340) protein carboxyl O-methyltransferase activity(GO:0051998) |
| 0.1 | 1.3 | GO:0001206 | transcriptional repressor activity, RNA polymerase II distal enhancer sequence-specific binding(GO:0001206) |
| 0.1 | 1.8 | GO:0008349 | MAP kinase kinase kinase kinase activity(GO:0008349) |
| 0.1 | 0.2 | GO:0016230 | sphingomyelin phosphodiesterase activator activity(GO:0016230) |
| 0.1 | 0.4 | GO:0005000 | vasopressin receptor activity(GO:0005000) |
| 0.1 | 1.1 | GO:0004691 | cAMP-dependent protein kinase activity(GO:0004691) |
| 0.1 | 0.6 | GO:0015057 | thrombin receptor activity(GO:0015057) |
| 0.1 | 1.6 | GO:0070513 | death domain binding(GO:0070513) |
| 0.1 | 0.5 | GO:0035402 | histone kinase activity (H3-T11 specific)(GO:0035402) |
| 0.1 | 0.3 | GO:0004909 | interleukin-1, Type I, activating receptor activity(GO:0004909) |
| 0.1 | 0.3 | GO:0052836 | inositol 5-diphosphate pentakisphosphate 5-kinase activity(GO:0052836) inositol diphosphate tetrakisphosphate kinase activity(GO:0052839) |
| 0.1 | 0.6 | GO:0008121 | ubiquinol-cytochrome-c reductase activity(GO:0008121) oxidoreductase activity, acting on diphenols and related substances as donors, cytochrome as acceptor(GO:0016681) |
| 0.1 | 0.3 | GO:0004450 | isocitrate dehydrogenase (NADP+) activity(GO:0004450) |
| 0.1 | 1.7 | GO:0098748 | clathrin adaptor activity(GO:0035615) endocytic adaptor activity(GO:0098748) |
| 0.1 | 2.7 | GO:0070003 | threonine-type endopeptidase activity(GO:0004298) threonine-type peptidase activity(GO:0070003) |
| 0.1 | 0.8 | GO:0000155 | phosphorelay sensor kinase activity(GO:0000155) |
| 0.1 | 0.5 | GO:0017077 | oxidative phosphorylation uncoupler activity(GO:0017077) |
| 0.1 | 0.4 | GO:0034617 | tetrahydrobiopterin binding(GO:0034617) |
| 0.1 | 0.6 | GO:0005497 | androgen binding(GO:0005497) |
| 0.1 | 1.9 | GO:0008656 | cysteine-type endopeptidase activator activity involved in apoptotic process(GO:0008656) |
| 0.1 | 0.3 | GO:0000253 | 3-keto sterol reductase activity(GO:0000253) |
| 0.1 | 0.4 | GO:0097016 | L27 domain binding(GO:0097016) |
| 0.1 | 0.3 | GO:0005471 | ATP:ADP antiporter activity(GO:0005471) adenine transmembrane transporter activity(GO:0015207) |
| 0.1 | 0.3 | GO:0005150 | interleukin-1, Type I receptor binding(GO:0005150) |
| 0.1 | 0.1 | GO:0015227 | acyl carnitine transmembrane transporter activity(GO:0015227) |
| 0.1 | 0.2 | GO:0015131 | thiosulfate transmembrane transporter activity(GO:0015117) oxaloacetate transmembrane transporter activity(GO:0015131) succinate transmembrane transporter activity(GO:0015141) |
| 0.1 | 0.2 | GO:0042577 | lipid phosphatase activity(GO:0042577) |
| 0.1 | 0.6 | GO:0032051 | clathrin light chain binding(GO:0032051) |
| 0.1 | 1.1 | GO:0005131 | growth hormone receptor binding(GO:0005131) |
| 0.1 | 0.3 | GO:0000104 | succinate dehydrogenase activity(GO:0000104) |
| 0.1 | 0.6 | GO:0050693 | LBD domain binding(GO:0050693) |
| 0.1 | 0.2 | GO:0047025 | 3-oxoacyl-[acyl-carrier-protein] reductase (NADH) activity(GO:0047025) |
| 0.1 | 1.3 | GO:0047429 | nucleoside-triphosphate diphosphatase activity(GO:0047429) |
| 0.1 | 1.7 | GO:0042609 | CD4 receptor binding(GO:0042609) |
| 0.1 | 0.2 | GO:0050613 | delta14-sterol reductase activity(GO:0050613) |
| 0.1 | 0.8 | GO:0005113 | patched binding(GO:0005113) |
| 0.1 | 0.7 | GO:0030020 | extracellular matrix structural constituent conferring tensile strength(GO:0030020) |
| 0.1 | 0.5 | GO:0016812 | hydrolase activity, acting on carbon-nitrogen (but not peptide) bonds, in cyclic amides(GO:0016812) |
| 0.1 | 0.2 | GO:0031752 | D5 dopamine receptor binding(GO:0031752) |
| 0.1 | 0.5 | GO:0004096 | catalase activity(GO:0004096) |
| 0.1 | 0.4 | GO:0003774 | motor activity(GO:0003774) |
| 0.1 | 1.5 | GO:0004535 | poly(A)-specific ribonuclease activity(GO:0004535) |
| 0.1 | 1.2 | GO:0031489 | myosin V binding(GO:0031489) |
| 0.1 | 0.2 | GO:0044390 | ubiquitin-like protein conjugating enzyme binding(GO:0044390) |
| 0.1 | 0.2 | GO:0070026 | nitric oxide binding(GO:0070026) |
| 0.1 | 0.8 | GO:0004300 | enoyl-CoA hydratase activity(GO:0004300) |
| 0.1 | 1.4 | GO:0050786 | RAGE receptor binding(GO:0050786) |
| 0.1 | 3.4 | GO:0005484 | SNAP receptor activity(GO:0005484) |
| 0.1 | 1.0 | GO:0001222 | transcription corepressor binding(GO:0001222) |
| 0.1 | 1.3 | GO:0031957 | very long-chain fatty acid-CoA ligase activity(GO:0031957) |
| 0.1 | 0.1 | GO:0016634 | oxidoreductase activity, acting on the CH-CH group of donors, oxygen as acceptor(GO:0016634) |
| 0.1 | 3.5 | GO:0004364 | glutathione transferase activity(GO:0004364) |
| 0.1 | 0.2 | GO:0008124 | 4-alpha-hydroxytetrahydrobiopterin dehydratase activity(GO:0008124) |
| 0.1 | 0.2 | GO:0016453 | C-acetyltransferase activity(GO:0016453) |
| 0.1 | 1.1 | GO:0005132 | type I interferon receptor binding(GO:0005132) |
| 0.1 | 0.1 | GO:0016312 | inositol bisphosphate phosphatase activity(GO:0016312) |
| 0.1 | 0.2 | GO:0045182 | translation regulator activity(GO:0045182) |
| 0.1 | 0.8 | GO:0046935 | 1-phosphatidylinositol-3-kinase regulator activity(GO:0046935) |
| 0.1 | 0.3 | GO:0097677 | STAT family protein binding(GO:0097677) |
| 0.1 | 5.7 | GO:0019003 | GDP binding(GO:0019003) |
| 0.1 | 1.5 | GO:0045504 | dynein heavy chain binding(GO:0045504) |
| 0.1 | 0.2 | GO:0004779 | adenylylsulfate kinase activity(GO:0004020) sulfate adenylyltransferase activity(GO:0004779) sulfate adenylyltransferase (ATP) activity(GO:0004781) |
| 0.1 | 0.4 | GO:0001602 | pancreatic polypeptide receptor activity(GO:0001602) |
| 0.1 | 0.2 | GO:0005330 | dopamine:sodium symporter activity(GO:0005330) |
| 0.1 | 0.1 | GO:1904455 | ubiquitin-specific protease activity involved in negative regulation of ERAD pathway(GO:1904455) |
| 0.1 | 0.4 | GO:0019784 | NEDD8-specific protease activity(GO:0019784) |
| 0.1 | 0.2 | GO:0004507 | steroid 11-beta-monooxygenase activity(GO:0004507) corticosterone 18-monooxygenase activity(GO:0047783) |
| 0.1 | 0.2 | GO:0033867 | Fas-activated serine/threonine kinase activity(GO:0033867) |
| 0.1 | 1.6 | GO:0004707 | MAP kinase activity(GO:0004707) |
| 0.1 | 0.1 | GO:0052739 | phosphatidylserine 1-acylhydrolase activity(GO:0052739) |
| 0.1 | 1.3 | GO:0008307 | structural constituent of muscle(GO:0008307) |
| 0.1 | 0.3 | GO:0070411 | I-SMAD binding(GO:0070411) |
| 0.1 | 4.5 | GO:0004407 | histone deacetylase activity(GO:0004407) |
| 0.1 | 0.3 | GO:0004359 | glutaminase activity(GO:0004359) |
| 0.1 | 0.7 | GO:0005168 | neurotrophin TRKA receptor binding(GO:0005168) |
| 0.1 | 1.4 | GO:0001055 | RNA polymerase II activity(GO:0001055) |
| 0.1 | 0.6 | GO:0043533 | inositol 1,3,4,5 tetrakisphosphate binding(GO:0043533) |
| 0.1 | 0.2 | GO:0015439 | heme-transporting ATPase activity(GO:0015439) |
| 0.1 | 0.6 | GO:0030368 | interleukin-17 receptor activity(GO:0030368) |
| 0.1 | 0.5 | GO:0031730 | CCR5 chemokine receptor binding(GO:0031730) |
| 0.1 | 0.3 | GO:0030760 | nicotinamide N-methyltransferase activity(GO:0008112) pyridine N-methyltransferase activity(GO:0030760) |
| 0.1 | 1.1 | GO:0097602 | cullin family protein binding(GO:0097602) |
| 0.1 | 1.7 | GO:0016922 | ligand-dependent nuclear receptor binding(GO:0016922) |
| 0.1 | 0.3 | GO:0004690 | cyclic nucleotide-dependent protein kinase activity(GO:0004690) |
| 0.1 | 2.2 | GO:0004435 | phosphatidylinositol phospholipase C activity(GO:0004435) |
| 0.1 | 0.3 | GO:0005289 | high-affinity basic amino acid transmembrane transporter activity(GO:0005287) high-affinity arginine transmembrane transporter activity(GO:0005289) high-affinity lysine transmembrane transporter activity(GO:0005292) |
| 0.1 | 0.3 | GO:0051765 | inositol tetrakisphosphate kinase activity(GO:0051765) |
| 0.1 | 0.9 | GO:0008140 | cAMP response element binding protein binding(GO:0008140) |
| 0.1 | 0.4 | GO:0003680 | AT DNA binding(GO:0003680) |
| 0.1 | 0.4 | GO:0016721 | superoxide dismutase activity(GO:0004784) oxidoreductase activity, acting on superoxide radicals as acceptor(GO:0016721) |
| 0.1 | 2.6 | GO:0003785 | actin monomer binding(GO:0003785) |
| 0.1 | 0.4 | GO:0070891 | lipoteichoic acid binding(GO:0070891) |
| 0.1 | 1.1 | GO:0043522 | leucine zipper domain binding(GO:0043522) |
| 0.1 | 0.3 | GO:0004337 | dimethylallyltranstransferase activity(GO:0004161) geranyltranstransferase activity(GO:0004337) |
| 0.1 | 0.2 | GO:0004882 | androgen receptor activity(GO:0004882) |
| 0.1 | 1.5 | GO:0031210 | phosphatidylcholine binding(GO:0031210) |
| 0.1 | 0.5 | GO:0004499 | N,N-dimethylaniline monooxygenase activity(GO:0004499) |
| 0.1 | 0.6 | GO:0000340 | RNA 7-methylguanosine cap binding(GO:0000340) |
| 0.1 | 0.8 | GO:0003707 | steroid hormone receptor activity(GO:0003707) |
| 0.1 | 0.4 | GO:0001515 | opioid peptide activity(GO:0001515) |
| 0.1 | 0.2 | GO:0070180 | large ribosomal subunit rRNA binding(GO:0070180) |
| 0.1 | 0.4 | GO:0016618 | hydroxypyruvate reductase activity(GO:0016618) glyoxylate reductase (NADP) activity(GO:0030267) |
| 0.1 | 0.1 | GO:0016639 | oxidoreductase activity, acting on the CH-NH2 group of donors, NAD or NADP as acceptor(GO:0016639) |
| 0.1 | 1.4 | GO:0017166 | vinculin binding(GO:0017166) |
| 0.1 | 0.5 | GO:0050072 | m7G(5')pppN diphosphatase activity(GO:0050072) |
| 0.1 | 0.4 | GO:0048039 | ubiquinone binding(GO:0048039) |
| 0.1 | 0.2 | GO:0035326 | enhancer binding(GO:0035326) |
| 0.1 | 0.7 | GO:0004708 | MAP kinase kinase activity(GO:0004708) |
| 0.1 | 0.3 | GO:0071535 | RING-like zinc finger domain binding(GO:0071535) |
| 0.1 | 0.2 | GO:0030272 | 5-formyltetrahydrofolate cyclo-ligase activity(GO:0030272) |
| 0.1 | 0.2 | GO:0008079 | translation release factor activity(GO:0003747) translation termination factor activity(GO:0008079) |
| 0.1 | 2.4 | GO:0004385 | guanylate kinase activity(GO:0004385) |
| 0.1 | 0.2 | GO:0047696 | beta-adrenergic receptor kinase activity(GO:0047696) |
| 0.1 | 0.7 | GO:0048156 | tau protein binding(GO:0048156) |
| 0.1 | 0.3 | GO:0044736 | acid-sensing ion channel activity(GO:0044736) |
| 0.1 | 1.0 | GO:0070273 | phosphatidylinositol-4-phosphate binding(GO:0070273) |
| 0.1 | 0.1 | GO:0035673 | oligopeptide transporter activity(GO:0015198) oligopeptide transmembrane transporter activity(GO:0035673) |
| 0.1 | 0.4 | GO:0004887 | thyroid hormone receptor activity(GO:0004887) |
| 0.1 | 0.2 | GO:0035379 | carbon dioxide transmembrane transporter activity(GO:0035379) |
| 0.1 | 0.3 | GO:0070182 | DNA polymerase binding(GO:0070182) |
| 0.1 | 0.6 | GO:0031995 | insulin-like growth factor II binding(GO:0031995) |
| 0.1 | 0.8 | GO:0030618 | transforming growth factor beta receptor, pathway-specific cytoplasmic mediator activity(GO:0030618) |
| 0.1 | 0.3 | GO:0032810 | sterol response element binding(GO:0032810) |
| 0.1 | 0.1 | GO:0004938 | alpha2-adrenergic receptor activity(GO:0004938) |
| 0.1 | 0.5 | GO:0051371 | muscle alpha-actinin binding(GO:0051371) |
| 0.1 | 0.1 | GO:0043734 | DNA demethylase activity(GO:0035514) DNA-N1-methyladenine dioxygenase activity(GO:0043734) |
| 0.1 | 0.2 | GO:0052857 | NADHX epimerase activity(GO:0052856) NADPHX epimerase activity(GO:0052857) |
| 0.1 | 0.1 | GO:0008184 | glycogen phosphorylase activity(GO:0008184) |
| 0.1 | 0.4 | GO:0015501 | glutamate:sodium symporter activity(GO:0015501) |
| 0.1 | 0.1 | GO:0030229 | very-low-density lipoprotein particle receptor activity(GO:0030229) |
| 0.1 | 1.0 | GO:0008253 | 5'-nucleotidase activity(GO:0008253) |
| 0.1 | 0.4 | GO:1990599 | 3' overhang single-stranded DNA endodeoxyribonuclease activity(GO:1990599) |
| 0.1 | 0.2 | GO:0032795 | heterotrimeric G-protein binding(GO:0032795) |
| 0.1 | 2.5 | GO:0061631 | ubiquitin conjugating enzyme activity(GO:0061631) |
| 0.1 | 0.6 | GO:0016208 | AMP binding(GO:0016208) |
| 0.1 | 0.1 | GO:0009041 | uridylate kinase activity(GO:0009041) |
| 0.1 | 0.1 | GO:0005026 | transforming growth factor beta receptor activity, type II(GO:0005026) |
| 0.1 | 0.8 | GO:0031435 | mitogen-activated protein kinase kinase kinase binding(GO:0031435) |
| 0.1 | 0.2 | GO:0005483 | soluble NSF attachment protein activity(GO:0005483) |
| 0.1 | 0.3 | GO:0004301 | epoxide hydrolase activity(GO:0004301) |
| 0.1 | 0.2 | GO:0098518 | polynucleotide phosphatase activity(GO:0098518) |
| 0.1 | 0.1 | GO:0035473 | lipase binding(GO:0035473) |
| 0.1 | 0.5 | GO:0004322 | ferroxidase activity(GO:0004322) oxidoreductase activity, oxidizing metal ions, oxygen as acceptor(GO:0016724) |
| 0.1 | 0.3 | GO:0097100 | supercoiled DNA binding(GO:0097100) |
| 0.1 | 2.4 | GO:0031624 | ubiquitin conjugating enzyme binding(GO:0031624) |
| 0.1 | 0.8 | GO:0043325 | phosphatidylinositol-3,4-bisphosphate binding(GO:0043325) |
| 0.1 | 0.3 | GO:0004995 | tachykinin receptor activity(GO:0004995) |
| 0.1 | 0.3 | GO:0003997 | acyl-CoA oxidase activity(GO:0003997) |
| 0.1 | 0.2 | GO:0035373 | chondroitin sulfate proteoglycan binding(GO:0035373) |
| 0.0 | 0.5 | GO:0004652 | polynucleotide adenylyltransferase activity(GO:0004652) |
| 0.0 | 0.3 | GO:0004471 | malate dehydrogenase (decarboxylating) (NAD+) activity(GO:0004471) malate dehydrogenase (decarboxylating) (NADP+) activity(GO:0004473) |
| 0.0 | 0.1 | GO:0004603 | phenylethanolamine N-methyltransferase activity(GO:0004603) |
| 0.0 | 0.6 | GO:0016861 | intramolecular oxidoreductase activity, interconverting aldoses and ketoses(GO:0016861) |
| 0.0 | 1.3 | GO:0005527 | macrolide binding(GO:0005527) FK506 binding(GO:0005528) |
| 0.0 | 0.5 | GO:0005044 | scavenger receptor activity(GO:0005044) |
| 0.0 | 15.6 | GO:0003714 | transcription corepressor activity(GO:0003714) |
| 0.0 | 0.1 | GO:0016309 | 1-phosphatidylinositol-5-phosphate 4-kinase activity(GO:0016309) |
| 0.0 | 0.1 | GO:0010698 | acetyltransferase activator activity(GO:0010698) |
| 0.0 | 0.6 | GO:0031433 | telethonin binding(GO:0031433) |
| 0.0 | 0.5 | GO:0042731 | PH domain binding(GO:0042731) |
| 0.0 | 0.3 | GO:0001165 | RNA polymerase I upstream control element sequence-specific DNA binding(GO:0001165) |
| 0.0 | 0.1 | GO:0017082 | mineralocorticoid receptor activity(GO:0017082) |
| 0.0 | 0.2 | GO:0070402 | NADPH binding(GO:0070402) |
| 0.0 | 0.1 | GO:0004828 | serine-tRNA ligase activity(GO:0004828) |
| 0.0 | 0.7 | GO:0043225 | anion transmembrane-transporting ATPase activity(GO:0043225) |
| 0.0 | 0.1 | GO:0071885 | N-terminal protein N-methyltransferase activity(GO:0071885) |
| 0.0 | 0.2 | GO:1990050 | phosphatidic acid transporter activity(GO:1990050) |
| 0.0 | 0.6 | GO:0019201 | nucleotide kinase activity(GO:0019201) |
| 0.0 | 0.3 | GO:0016941 | natriuretic peptide receptor activity(GO:0016941) |
| 0.0 | 0.1 | GO:0004090 | carbonyl reductase (NADPH) activity(GO:0004090) |
| 0.0 | 0.2 | GO:0047134 | protein-disulfide reductase activity(GO:0047134) |
| 0.0 | 11.6 | GO:0003735 | structural constituent of ribosome(GO:0003735) |
| 0.0 | 0.1 | GO:0016899 | oxidoreductase activity, acting on the CH-OH group of donors, oxygen as acceptor(GO:0016899) |
| 0.0 | 0.3 | GO:0003846 | 2-acylglycerol O-acyltransferase activity(GO:0003846) |
| 0.0 | 0.3 | GO:0039552 | RIG-I binding(GO:0039552) |
| 0.0 | 0.1 | GO:0061629 | RNA polymerase II sequence-specific DNA binding transcription factor binding(GO:0061629) |
| 0.0 | 0.2 | GO:0061676 | importin-alpha family protein binding(GO:0061676) |
| 0.0 | 0.3 | GO:0004045 | aminoacyl-tRNA hydrolase activity(GO:0004045) |
| 0.0 | 0.3 | GO:0030060 | L-malate dehydrogenase activity(GO:0030060) |
| 0.0 | 0.2 | GO:0004994 | somatostatin receptor activity(GO:0004994) |
| 0.0 | 0.1 | GO:0070538 | oleic acid binding(GO:0070538) |
| 0.0 | 0.2 | GO:0004657 | proline dehydrogenase activity(GO:0004657) |
| 0.0 | 0.0 | GO:0004699 | calcium-independent protein kinase C activity(GO:0004699) |
| 0.0 | 0.4 | GO:0008379 | thioredoxin peroxidase activity(GO:0008379) |
| 0.0 | 0.8 | GO:0030306 | ADP-ribosylation factor binding(GO:0030306) |
| 0.0 | 0.6 | GO:0005068 | transmembrane receptor protein tyrosine kinase adaptor activity(GO:0005068) |
| 0.0 | 1.2 | GO:0017160 | Ral GTPase binding(GO:0017160) |
| 0.0 | 0.5 | GO:0035259 | glucocorticoid receptor binding(GO:0035259) |
| 0.0 | 0.5 | GO:0016929 | SUMO-specific protease activity(GO:0016929) |
| 0.0 | 2.4 | GO:0030374 | ligand-dependent nuclear receptor transcription coactivator activity(GO:0030374) |
| 0.0 | 0.1 | GO:0019107 | glycylpeptide N-tetradecanoyltransferase activity(GO:0004379) myristoyltransferase activity(GO:0019107) |
| 0.0 | 0.2 | GO:0038047 | beta-endorphin receptor activity(GO:0004979) morphine receptor activity(GO:0038047) |
| 0.0 | 0.3 | GO:0000285 | 1-phosphatidylinositol-3-phosphate 5-kinase activity(GO:0000285) |
| 0.0 | 0.3 | GO:0030628 | pre-mRNA 3'-splice site binding(GO:0030628) |
| 0.0 | 0.6 | GO:0008020 | G-protein coupled photoreceptor activity(GO:0008020) |
| 0.0 | 0.2 | GO:0051032 | nucleic acid transmembrane transporter activity(GO:0051032) RNA transmembrane transporter activity(GO:0051033) |
| 0.0 | 0.3 | GO:0034452 | dynactin binding(GO:0034452) |
| 0.0 | 0.2 | GO:0000213 | tRNA-intron endonuclease activity(GO:0000213) |
| 0.0 | 0.2 | GO:0048030 | disaccharide binding(GO:0048030) |
| 0.0 | 0.1 | GO:0004666 | prostaglandin-endoperoxide synthase activity(GO:0004666) |
| 0.0 | 1.0 | GO:0001965 | G-protein alpha-subunit binding(GO:0001965) |
| 0.0 | 0.3 | GO:0001849 | complement component C1q binding(GO:0001849) |
| 0.0 | 0.2 | GO:0003854 | 3-beta-hydroxy-delta5-steroid dehydrogenase activity(GO:0003854) |
| 0.0 | 0.9 | GO:0050811 | GABA receptor binding(GO:0050811) |
| 0.0 | 1.3 | GO:0070888 | E-box binding(GO:0070888) |
| 0.0 | 0.1 | GO:0031716 | calcitonin receptor binding(GO:0031716) |
| 0.0 | 0.2 | GO:0070290 | N-acylphosphatidylethanolamine-specific phospholipase D activity(GO:0070290) |
| 0.0 | 0.2 | GO:0033906 | hyaluronoglucuronidase activity(GO:0033906) |
| 0.0 | 0.1 | GO:0051185 | coenzyme transporter activity(GO:0051185) |
| 0.0 | 0.6 | GO:0005024 | transforming growth factor beta-activated receptor activity(GO:0005024) |
| 0.0 | 1.3 | GO:0016676 | cytochrome-c oxidase activity(GO:0004129) heme-copper terminal oxidase activity(GO:0015002) oxidoreductase activity, acting on a heme group of donors, oxygen as acceptor(GO:0016676) |
| 0.0 | 1.5 | GO:0043425 | bHLH transcription factor binding(GO:0043425) |
| 0.0 | 2.3 | GO:0008138 | protein tyrosine/serine/threonine phosphatase activity(GO:0008138) |
| 0.0 | 0.5 | GO:0035198 | miRNA binding(GO:0035198) |
| 0.0 | 0.2 | GO:0047288 | monosialoganglioside sialyltransferase activity(GO:0047288) |
| 0.0 | 0.2 | GO:0010465 | nerve growth factor receptor activity(GO:0010465) |
| 0.0 | 0.2 | GO:0050815 | phosphoserine binding(GO:0050815) |
| 0.0 | 0.2 | GO:0097027 | ubiquitin-protein transferase activator activity(GO:0097027) |
| 0.0 | 0.3 | GO:0008732 | glycine hydroxymethyltransferase activity(GO:0004372) threonine aldolase activity(GO:0004793) L-allo-threonine aldolase activity(GO:0008732) |
| 0.0 | 0.8 | GO:0015078 | hydrogen ion transmembrane transporter activity(GO:0015078) |
| 0.0 | 0.1 | GO:0008410 | CoA-transferase activity(GO:0008410) |
| 0.0 | 0.4 | GO:0043024 | ribosomal small subunit binding(GO:0043024) |
| 0.0 | 0.4 | GO:0009374 | biotin binding(GO:0009374) |
| 0.0 | 0.7 | GO:0000062 | fatty-acyl-CoA binding(GO:0000062) |
| 0.0 | 0.1 | GO:0034191 | apolipoprotein A-I receptor binding(GO:0034191) |
| 0.0 | 0.8 | GO:0050750 | low-density lipoprotein particle receptor binding(GO:0050750) |
| 0.0 | 0.1 | GO:0005277 | acetylcholine transmembrane transporter activity(GO:0005277) acetate ester transmembrane transporter activity(GO:1901375) |
| 0.0 | 0.1 | GO:0032184 | SUMO polymer binding(GO:0032184) |
| 0.0 | 2.3 | GO:0003954 | NADH dehydrogenase activity(GO:0003954) |
| 0.0 | 0.4 | GO:0005007 | fibroblast growth factor-activated receptor activity(GO:0005007) |
| 0.0 | 0.2 | GO:0030021 | extracellular matrix structural constituent conferring compression resistance(GO:0030021) structural constituent of tooth enamel(GO:0030345) |
| 0.0 | 1.0 | GO:0005092 | GDP-dissociation inhibitor activity(GO:0005092) |
| 0.0 | 0.2 | GO:0004972 | NMDA glutamate receptor activity(GO:0004972) |
| 0.0 | 0.1 | GO:0061665 | SUMO ligase activity(GO:0061665) |
| 0.0 | 0.2 | GO:0004551 | nucleotide diphosphatase activity(GO:0004551) |
| 0.0 | 0.1 | GO:0008426 | protein kinase C inhibitor activity(GO:0008426) |
| 0.0 | 0.2 | GO:0003996 | acyl-CoA ligase activity(GO:0003996) |
| 0.0 | 0.7 | GO:0031005 | filamin binding(GO:0031005) |
| 0.0 | 0.8 | GO:0080025 | phosphatidylinositol-3,5-bisphosphate binding(GO:0080025) |
| 0.0 | 1.0 | GO:0016702 | oxidoreductase activity, acting on single donors with incorporation of molecular oxygen, incorporation of two atoms of oxygen(GO:0016702) |
| 0.0 | 0.2 | GO:0015321 | sodium-dependent phosphate transmembrane transporter activity(GO:0015321) |
| 0.0 | 0.1 | GO:0015140 | malate transmembrane transporter activity(GO:0015140) |
| 0.0 | 0.6 | GO:0004791 | thioredoxin-disulfide reductase activity(GO:0004791) |
| 0.0 | 0.1 | GO:0004803 | transposase activity(GO:0004803) |
| 0.0 | 0.2 | GO:0016934 | extracellular-glycine-gated ion channel activity(GO:0016933) extracellular-glycine-gated chloride channel activity(GO:0016934) |
| 0.0 | 0.1 | GO:0046997 | oxidoreductase activity, acting on the CH-NH group of donors, flavin as acceptor(GO:0046997) |
| 0.0 | 0.1 | GO:0031697 | beta-1 adrenergic receptor binding(GO:0031697) |
| 0.0 | 0.3 | GO:0070883 | pre-miRNA binding(GO:0070883) |
| 0.0 | 0.3 | GO:1990380 | Lys48-specific deubiquitinase activity(GO:1990380) |
| 0.0 | 0.3 | GO:0032183 | SUMO binding(GO:0032183) |
| 0.0 | 0.7 | GO:0008266 | poly(U) RNA binding(GO:0008266) |
| 0.0 | 0.1 | GO:0004047 | aminomethyltransferase activity(GO:0004047) |
| 0.0 | 0.1 | GO:0004771 | sterol esterase activity(GO:0004771) |
| 0.0 | 0.3 | GO:0008536 | Ran GTPase binding(GO:0008536) |
| 0.0 | 0.1 | GO:0070984 | SET domain binding(GO:0070984) |
| 0.0 | 0.7 | GO:0046966 | thyroid hormone receptor binding(GO:0046966) |
| 0.0 | 0.2 | GO:0016778 | diphosphotransferase activity(GO:0016778) |
| 0.0 | 0.2 | GO:0048403 | brain-derived neurotrophic factor binding(GO:0048403) |
| 0.0 | 0.2 | GO:0016802 | adenosylhomocysteinase activity(GO:0004013) trialkylsulfonium hydrolase activity(GO:0016802) |
| 0.0 | 0.5 | GO:0004000 | adenosine deaminase activity(GO:0004000) |
| 0.0 | 0.3 | GO:0003960 | NADPH:quinone reductase activity(GO:0003960) |
| 0.0 | 0.1 | GO:0004370 | glycerol kinase activity(GO:0004370) |
| 0.0 | 0.2 | GO:0005052 | peroxisome matrix targeting signal-1 binding(GO:0005052) |
| 0.0 | 0.1 | GO:0016813 | hydrolase activity, acting on carbon-nitrogen (but not peptide) bonds, in linear amidines(GO:0016813) |
| 0.0 | 0.5 | GO:0005522 | profilin binding(GO:0005522) |
| 0.0 | 0.1 | GO:0051379 | epinephrine binding(GO:0051379) |
| 0.0 | 0.1 | GO:0001530 | lipopolysaccharide binding(GO:0001530) |
| 0.0 | 0.1 | GO:0020037 | heme binding(GO:0020037) |
| 0.0 | 0.2 | GO:0019863 | IgE binding(GO:0019863) |
| 0.0 | 0.4 | GO:0005344 | oxygen transporter activity(GO:0005344) |
| 0.0 | 0.2 | GO:0032396 | inhibitory MHC class I receptor activity(GO:0032396) |
| 0.0 | 0.1 | GO:0004739 | pyruvate dehydrogenase (acetyl-transferring) activity(GO:0004739) |
| 0.0 | 0.1 | GO:0004132 | dCMP deaminase activity(GO:0004132) |
| 0.0 | 0.8 | GO:0010485 | H4 histone acetyltransferase activity(GO:0010485) |
| 0.0 | 0.1 | GO:0047708 | biotinidase activity(GO:0047708) |
| 0.0 | 0.1 | GO:0004609 | phosphatidylserine decarboxylase activity(GO:0004609) |
| 0.0 | 0.5 | GO:0071837 | HMG box domain binding(GO:0071837) |
| 0.0 | 0.8 | GO:0001221 | transcription cofactor binding(GO:0001221) |
| 0.0 | 0.3 | GO:0043047 | single-stranded telomeric DNA binding(GO:0043047) G-rich strand telomeric DNA binding(GO:0098505) |
| 0.0 | 0.1 | GO:0047661 | racemase and epimerase activity, acting on amino acids and derivatives(GO:0016855) racemase activity, acting on amino acids and derivatives(GO:0036361) amino-acid racemase activity(GO:0047661) |
| 0.0 | 0.3 | GO:0008553 | hydrogen-exporting ATPase activity, phosphorylative mechanism(GO:0008553) |
| 0.0 | 0.2 | GO:0003956 | NAD(P)+-protein-arginine ADP-ribosyltransferase activity(GO:0003956) |
| 0.0 | 0.1 | GO:0030171 | voltage-gated proton channel activity(GO:0030171) |
| 0.0 | 0.1 | GO:0004351 | glutamate decarboxylase activity(GO:0004351) |
| 0.0 | 0.0 | GO:0070698 | type I activin receptor binding(GO:0070698) |
| 0.0 | 0.9 | GO:0004115 | 3',5'-cyclic-AMP phosphodiesterase activity(GO:0004115) |
| 0.0 | 0.2 | GO:0035612 | AP-2 adaptor complex binding(GO:0035612) |
| 0.0 | 0.4 | GO:0008061 | chitin binding(GO:0008061) |
| 0.0 | 0.1 | GO:0000064 | L-ornithine transmembrane transporter activity(GO:0000064) |
| 0.0 | 0.2 | GO:0042979 | ornithine decarboxylase regulator activity(GO:0042979) |
| 0.0 | 12.5 | GO:0019001 | guanyl nucleotide binding(GO:0019001) |
| 0.0 | 0.5 | GO:0042043 | neurexin family protein binding(GO:0042043) |
| 0.0 | 0.5 | GO:0016646 | oxidoreductase activity, acting on the CH-NH group of donors, NAD or NADP as acceptor(GO:0016646) |
| 0.0 | 0.0 | GO:0019763 | immunoglobulin receptor activity(GO:0019763) |
| 0.0 | 0.1 | GO:0097108 | hedgehog family protein binding(GO:0097108) |
| 0.0 | 0.1 | GO:0031735 | CCR10 chemokine receptor binding(GO:0031735) |
| 0.0 | 0.6 | GO:0019213 | deacetylase activity(GO:0019213) |
| 0.0 | 1.1 | GO:0004712 | protein serine/threonine/tyrosine kinase activity(GO:0004712) |
| 0.0 | 0.1 | GO:0051499 | D-aminoacyl-tRNA deacylase activity(GO:0051499) D-tyrosyl-tRNA(Tyr) deacylase activity(GO:0051500) |
| 0.0 | 0.1 | GO:0050211 | procollagen galactosyltransferase activity(GO:0050211) |
| 0.0 | 1.5 | GO:0001190 | transcriptional activator activity, RNA polymerase II transcription factor binding(GO:0001190) transcriptional repressor activity, RNA polymerase II activating transcription factor binding(GO:0098811) |
| 0.0 | 0.2 | GO:0004465 | lipoprotein lipase activity(GO:0004465) |
| 0.0 | 0.3 | GO:0004550 | nucleoside diphosphate kinase activity(GO:0004550) |
| 0.0 | 0.4 | GO:0017049 | GTP-Rho binding(GO:0017049) |
| 0.0 | 0.1 | GO:0004528 | phosphodiesterase I activity(GO:0004528) |
| 0.0 | 0.2 | GO:0030023 | extracellular matrix constituent conferring elasticity(GO:0030023) |
| 0.0 | 0.1 | GO:0016744 | transferase activity, transferring aldehyde or ketonic groups(GO:0016744) |
| 0.0 | 0.2 | GO:0001594 | trace-amine receptor activity(GO:0001594) |
| 0.0 | 0.1 | GO:0050253 | retinyl-palmitate esterase activity(GO:0050253) |
| 0.0 | 1.4 | GO:0017080 | sodium channel regulator activity(GO:0017080) |
| 0.0 | 0.1 | GO:0008431 | vitamin E binding(GO:0008431) |
| 0.0 | 0.3 | GO:0004726 | non-membrane spanning protein tyrosine phosphatase activity(GO:0004726) |
| 0.0 | 2.4 | GO:0003730 | mRNA 3'-UTR binding(GO:0003730) |
| 0.0 | 0.3 | GO:0015035 | protein disulfide oxidoreductase activity(GO:0015035) |
| 0.0 | 0.2 | GO:0004032 | alditol:NADP+ 1-oxidoreductase activity(GO:0004032) |
| 0.0 | 0.7 | GO:0046933 | proton-transporting ATP synthase activity, rotational mechanism(GO:0046933) |
| 0.0 | 0.2 | GO:1902444 | riboflavin binding(GO:1902444) |
| 0.0 | 0.0 | GO:0005078 | MAP-kinase scaffold activity(GO:0005078) |
| 0.0 | 0.2 | GO:0016167 | glial cell-derived neurotrophic factor receptor activity(GO:0016167) |
| 0.0 | 0.1 | GO:0004936 | alpha-adrenergic receptor activity(GO:0004936) |
| 0.0 | 0.1 | GO:0004743 | pyruvate kinase activity(GO:0004743) |
| 0.0 | 0.4 | GO:0005123 | death receptor binding(GO:0005123) |
| 0.0 | 0.0 | GO:0032552 | deoxyribonucleotide binding(GO:0032552) purine deoxyribonucleotide binding(GO:0032554) adenyl deoxyribonucleotide binding(GO:0032558) dATP binding(GO:0032564) |
| 0.0 | 0.2 | GO:0001517 | N-acetylglucosamine 6-O-sulfotransferase activity(GO:0001517) |
| 0.0 | 0.2 | GO:0016783 | sulfurtransferase activity(GO:0016783) |
| 0.0 | 0.4 | GO:0001104 | RNA polymerase II transcription cofactor activity(GO:0001104) |
| 0.0 | 0.2 | GO:0004602 | glutathione peroxidase activity(GO:0004602) |
| 0.0 | 0.6 | GO:0097200 | cysteine-type endopeptidase activity involved in execution phase of apoptosis(GO:0097200) |
| 0.0 | 0.1 | GO:0050998 | nitric-oxide synthase binding(GO:0050998) |
| 0.0 | 0.3 | GO:0003746 | translation elongation factor activity(GO:0003746) |
| 0.0 | 0.1 | GO:0004365 | glyceraldehyde-3-phosphate dehydrogenase (NAD+) (phosphorylating) activity(GO:0004365) glyceraldehyde-3-phosphate dehydrogenase (NAD(P)+) (phosphorylating) activity(GO:0043891) |
| 0.0 | 0.8 | GO:0004709 | MAP kinase kinase kinase activity(GO:0004709) |
| 0.0 | 0.1 | GO:0016652 | NAD(P)+ transhydrogenase activity(GO:0008746) oxidoreductase activity, acting on NAD(P)H, NAD(P) as acceptor(GO:0016652) |
| 0.0 | 0.5 | GO:0019104 | DNA N-glycosylase activity(GO:0019104) |
| 0.0 | 0.4 | GO:0005549 | odorant binding(GO:0005549) |
| 0.0 | 0.9 | GO:0043539 | protein serine/threonine kinase activator activity(GO:0043539) |
| 0.0 | 0.1 | GO:0004057 | arginyltransferase activity(GO:0004057) |
| 0.0 | 0.3 | GO:0050700 | CARD domain binding(GO:0050700) |
| 0.0 | 0.1 | GO:0016286 | small conductance calcium-activated potassium channel activity(GO:0016286) |
| 0.0 | 0.1 | GO:0008479 | queuine tRNA-ribosyltransferase activity(GO:0008479) |
| 0.0 | 0.1 | GO:0034038 | deoxyhypusine synthase activity(GO:0034038) |
| 0.0 | 0.1 | GO:0004999 | vasoactive intestinal polypeptide receptor activity(GO:0004999) |
| 0.0 | 0.1 | GO:0015173 | aromatic amino acid transmembrane transporter activity(GO:0015173) |
| 0.0 | 0.0 | GO:0008494 | translation activator activity(GO:0008494) |
| 0.0 | 0.1 | GO:0008336 | gamma-butyrobetaine dioxygenase activity(GO:0008336) |
| 0.0 | 0.1 | GO:0004449 | isocitrate dehydrogenase (NAD+) activity(GO:0004449) |
| 0.0 | 9.6 | GO:0008134 | transcription factor binding(GO:0008134) |
| 0.0 | 0.2 | GO:0016594 | glycine binding(GO:0016594) |
| 0.0 | 0.2 | GO:0051213 | dioxygenase activity(GO:0051213) |
| 0.0 | 0.3 | GO:0017134 | fibroblast growth factor binding(GO:0017134) |
| 0.0 | 0.1 | GO:0035005 | 1-phosphatidylinositol-4-phosphate 3-kinase activity(GO:0035005) |
| 0.0 | 0.1 | GO:0032393 | MHC class I receptor activity(GO:0032393) |
| 0.0 | 0.4 | GO:0008483 | transaminase activity(GO:0008483) |
| 0.0 | 0.1 | GO:0050254 | rhodopsin kinase activity(GO:0050254) |
| 0.0 | 0.1 | GO:0043208 | glycosphingolipid binding(GO:0043208) |
| 0.0 | 0.1 | GO:0036435 | K48-linked polyubiquitin binding(GO:0036435) |
| 0.0 | 0.1 | GO:0003920 | GMP reductase activity(GO:0003920) oxidoreductase activity, acting on NAD(P)H, nitrogenous group as acceptor(GO:0016657) |
| 0.0 | 0.1 | GO:0004957 | prostaglandin E receptor activity(GO:0004957) |
| 0.0 | 0.1 | GO:0031996 | thioesterase binding(GO:0031996) |
| 0.0 | 0.2 | GO:0032036 | myosin heavy chain binding(GO:0032036) |
| 0.0 | 0.1 | GO:0004430 | 1-phosphatidylinositol 4-kinase activity(GO:0004430) |
| 0.0 | 0.0 | GO:0050733 | RS domain binding(GO:0050733) |
| 0.0 | 0.3 | GO:0008331 | high voltage-gated calcium channel activity(GO:0008331) |
| 0.0 | 0.1 | GO:0016019 | N-acetylmuramoyl-L-alanine amidase activity(GO:0008745) peptidoglycan receptor activity(GO:0016019) |
| 0.0 | 0.3 | GO:0004721 | phosphoprotein phosphatase activity(GO:0004721) |
| 0.0 | 0.4 | GO:0031490 | chromatin DNA binding(GO:0031490) |
| 0.0 | 0.1 | GO:1904599 | advanced glycation end-product binding(GO:1904599) |
| 0.0 | 0.2 | GO:1990446 | U1 snRNP binding(GO:1990446) |
| 0.0 | 0.1 | GO:0031685 | adenosine receptor binding(GO:0031685) |
| 0.0 | 0.1 | GO:0004461 | lactose synthase activity(GO:0004461) |
| 0.0 | 0.5 | GO:0008191 | metalloendopeptidase inhibitor activity(GO:0008191) |
| 0.0 | 0.9 | GO:0000979 | RNA polymerase II core promoter sequence-specific DNA binding(GO:0000979) |
| 0.0 | 0.1 | GO:0038036 | sphingosine-1-phosphate receptor activity(GO:0038036) |
| 0.0 | 0.6 | GO:0005547 | phosphatidylinositol-3,4,5-trisphosphate binding(GO:0005547) |
| 0.0 | 0.1 | GO:0043023 | ribosomal large subunit binding(GO:0043023) |
| 0.0 | 0.0 | GO:0030160 | GKAP/Homer scaffold activity(GO:0030160) |
| 0.0 | 0.5 | GO:0003924 | GTPase activity(GO:0003924) |
| 0.0 | 4.9 | GO:0001077 | transcriptional activator activity, RNA polymerase II core promoter proximal region sequence-specific binding(GO:0001077) |
| 0.0 | 0.0 | GO:1990405 | protein antigen binding(GO:1990405) |
| 0.0 | 0.2 | GO:0005250 | A-type (transient outward) potassium channel activity(GO:0005250) |
| 0.0 | 0.1 | GO:1990189 | peptide-serine-N-acetyltransferase activity(GO:1990189) peptide-glutamate-N-acetyltransferase activity(GO:1990190) |
| 0.0 | 0.6 | GO:0046875 | ephrin receptor binding(GO:0046875) |
| 0.0 | 0.1 | GO:0097157 | pre-mRNA intronic binding(GO:0097157) |
| 0.0 | 0.1 | GO:0030274 | LIM domain binding(GO:0030274) |
| 0.0 | 0.0 | GO:0044715 | 8-oxo-dGDP phosphatase activity(GO:0044715) |
| 0.0 | 0.5 | GO:0016805 | dipeptidase activity(GO:0016805) |
| 0.0 | 0.1 | GO:0048487 | beta-tubulin binding(GO:0048487) |
| 0.0 | 0.3 | GO:0051537 | 2 iron, 2 sulfur cluster binding(GO:0051537) |
| 0.0 | 0.0 | GO:0016838 | carbon-oxygen lyase activity, acting on phosphates(GO:0016838) |
| 0.0 | 0.3 | GO:0001046 | core promoter sequence-specific DNA binding(GO:0001046) |
| 0.0 | 0.7 | GO:0004198 | calcium-dependent cysteine-type endopeptidase activity(GO:0004198) |
| 0.0 | 0.1 | GO:0052659 | inositol-1,3,4,5-tetrakisphosphate 5-phosphatase activity(GO:0052659) inositol tetrakisphosphate phosphatase activity(GO:0052743) |
| 0.0 | 0.5 | GO:0005080 | protein kinase C binding(GO:0005080) |
| 0.0 | 0.1 | GO:0003829 | beta-1,3-galactosyl-O-glycosyl-glycoprotein beta-1,6-N-acetylglucosaminyltransferase activity(GO:0003829) |
| 0.0 | 0.2 | GO:0019864 | IgG binding(GO:0019864) |
| 0.0 | 0.6 | GO:0003899 | DNA-directed RNA polymerase activity(GO:0003899) |
| 0.0 | 0.1 | GO:0031681 | G-protein beta-subunit binding(GO:0031681) |
| 0.0 | 0.2 | GO:0031419 | cobalamin binding(GO:0031419) |
| 0.0 | 0.0 | GO:0016653 | cytochrome-b5 reductase activity, acting on NAD(P)H(GO:0004128) oxidoreductase activity, acting on NAD(P)H, heme protein as acceptor(GO:0016653) |
| 0.0 | 0.6 | GO:0005212 | structural constituent of eye lens(GO:0005212) |
| 0.0 | 0.2 | GO:0097109 | neuroligin family protein binding(GO:0097109) |
| 0.0 | 0.3 | GO:0004185 | serine-type carboxypeptidase activity(GO:0004185) |
| 0.0 | 0.2 | GO:0019531 | oxalate transmembrane transporter activity(GO:0019531) |
| 0.0 | 0.1 | GO:0004616 | phosphogluconate dehydrogenase (decarboxylating) activity(GO:0004616) |
| 0.0 | 0.1 | GO:0004523 | RNA-DNA hybrid ribonuclease activity(GO:0004523) |
| 0.0 | 0.1 | GO:0003917 | DNA topoisomerase type I activity(GO:0003917) |
| 0.0 | 3.1 | GO:0008022 | protein C-terminus binding(GO:0008022) |
| 0.0 | 0.1 | GO:0000983 | transcription factor activity, RNA polymerase II core promoter sequence-specific(GO:0000983) |
| 0.0 | 0.4 | GO:0000993 | RNA polymerase II core binding(GO:0000993) |
| 0.0 | 0.4 | GO:0001671 | ATPase activator activity(GO:0001671) |
| 0.0 | 0.1 | GO:0016206 | catechol O-methyltransferase activity(GO:0016206) |
| 0.0 | 0.1 | GO:0005157 | macrophage colony-stimulating factor receptor binding(GO:0005157) |
| 0.0 | 0.1 | GO:0004022 | alcohol dehydrogenase (NAD) activity(GO:0004022) |
| 0.0 | 3.2 | GO:0051015 | actin filament binding(GO:0051015) |
| 0.0 | 0.1 | GO:0004800 | thyroxine 5'-deiodinase activity(GO:0004800) |
| 0.0 | 0.6 | GO:0042826 | histone deacetylase binding(GO:0042826) |
| 0.0 | 0.4 | GO:0035255 | ionotropic glutamate receptor binding(GO:0035255) |
| 0.0 | 0.1 | GO:0048407 | platelet-derived growth factor binding(GO:0048407) |
| 0.0 | 0.4 | GO:0030676 | Rac guanyl-nucleotide exchange factor activity(GO:0030676) |
| 0.0 | 0.2 | GO:0004571 | mannosyl-oligosaccharide 1,2-alpha-mannosidase activity(GO:0004571) |
| 0.0 | 0.1 | GO:0034597 | phosphatidylinositol-4,5-bisphosphate 4-phosphatase activity(GO:0034597) |
| 0.0 | 0.0 | GO:0033858 | N-acetylgalactosamine kinase activity(GO:0033858) |
| 0.0 | 0.3 | GO:0071949 | FAD binding(GO:0071949) |
| 0.0 | 0.1 | GO:0047555 | 3',5'-cyclic-GMP phosphodiesterase activity(GO:0047555) |
| 0.0 | 0.1 | GO:0070008 | serine-type exopeptidase activity(GO:0070008) |
| 0.0 | 0.2 | GO:0030983 | mismatched DNA binding(GO:0030983) |
| 0.0 | 0.0 | GO:0005134 | interleukin-2 receptor binding(GO:0005134) |
| 0.0 | 0.3 | GO:0042800 | histone methyltransferase activity (H3-K4 specific)(GO:0042800) |
| 0.0 | 0.0 | GO:0004935 | adrenergic receptor activity(GO:0004935) |
| 0.0 | 0.1 | GO:0004112 | cyclic-nucleotide phosphodiesterase activity(GO:0004112) |
| 0.0 | 0.0 | GO:0008466 | glycogenin glucosyltransferase activity(GO:0008466) |
| 0.0 | 0.1 | GO:0004515 | nicotinamide-nucleotide adenylyltransferase activity(GO:0000309) nicotinate-nucleotide adenylyltransferase activity(GO:0004515) |
| 0.0 | 0.0 | GO:0016774 | phosphotransferase activity, carboxyl group as acceptor(GO:0016774) |
| 0.0 | 0.0 | GO:0031694 | alpha-2A adrenergic receptor binding(GO:0031694) |
| 0.0 | 0.2 | GO:0016888 | endodeoxyribonuclease activity, producing 5'-phosphomonoesters(GO:0016888) |
| 0.0 | 0.0 | GO:0097258 | tocopherol omega-hydroxylase activity(GO:0052870) alpha-tocopherol omega-hydroxylase activity(GO:0052871) 20-hydroxy-leukotriene B4 omega oxidase activity(GO:0097258) 20-aldehyde-leukotriene B4 20-monooxygenase activity(GO:0097259) |
| 0.0 | 0.4 | GO:0019706 | protein-cysteine S-palmitoyltransferase activity(GO:0019706) protein-cysteine S-acyltransferase activity(GO:0019707) |
| 0.0 | 0.0 | GO:0034236 | protein kinase A catalytic subunit binding(GO:0034236) |
| 0.0 | 0.0 | GO:0000386 | second spliceosomal transesterification activity(GO:0000386) |
| 0.0 | 0.0 | GO:0004768 | stearoyl-CoA 9-desaturase activity(GO:0004768) acyl-CoA desaturase activity(GO:0016215) |
| 0.0 | 0.5 | GO:0004693 | cyclin-dependent protein serine/threonine kinase activity(GO:0004693) |
| 0.0 | 0.0 | GO:0098639 | collagen binding involved in cell-matrix adhesion(GO:0098639) |
| 0.0 | 0.1 | GO:0000978 | RNA polymerase II core promoter proximal region sequence-specific DNA binding(GO:0000978) |
| 0.0 | 0.1 | GO:1990226 | histone methyltransferase binding(GO:1990226) |
| 0.0 | 0.1 | GO:1990825 | sequence-specific mRNA binding(GO:1990825) |
| 0.0 | 0.1 | GO:0004758 | serine C-palmitoyltransferase activity(GO:0004758) C-palmitoyltransferase activity(GO:0016454) |
| 0.0 | 0.0 | GO:0008200 | ion channel inhibitor activity(GO:0008200) channel inhibitor activity(GO:0016248) |
| 0.0 | 0.1 | GO:0000989 | transcription factor activity, transcription factor binding(GO:0000989) |
| 0.0 | 0.1 | GO:0033192 | calmodulin-dependent protein phosphatase activity(GO:0033192) |
| 0.0 | 0.0 | GO:0004392 | heme oxygenase (decyclizing) activity(GO:0004392) |
| 0.0 | 0.1 | GO:0004806 | triglyceride lipase activity(GO:0004806) |
| 0.0 | 0.3 | GO:0042162 | telomeric DNA binding(GO:0042162) |
| 0.0 | 0.1 | GO:0030291 | protein serine/threonine kinase inhibitor activity(GO:0030291) |
| 0.0 | 0.0 | GO:0015616 | DNA translocase activity(GO:0015616) |
| 0.0 | 0.1 | GO:0032454 | histone demethylase activity (H3-K9 specific)(GO:0032454) |
| 0.0 | 0.1 | GO:0004594 | pantothenate kinase activity(GO:0004594) |
| 0.0 | 0.1 | GO:0005047 | signal recognition particle binding(GO:0005047) |
| 0.0 | 0.2 | GO:0004033 | aldo-keto reductase (NADP) activity(GO:0004033) |
| 0.0 | 0.0 | GO:0008113 | peptide-methionine (S)-S-oxide reductase activity(GO:0008113) |
| 0.0 | 0.0 | GO:0004821 | histidine-tRNA ligase activity(GO:0004821) |
| 0.0 | 0.1 | GO:0017091 | AU-rich element binding(GO:0017091) |
| 0.0 | 0.1 | GO:0004873 | asialoglycoprotein receptor activity(GO:0004873) |
| 0.0 | 0.1 | GO:0016842 | amidine-lyase activity(GO:0016842) |
| 0.0 | 0.1 | GO:0016868 | intramolecular transferase activity, phosphotransferases(GO:0016868) |
| 0.0 | 0.0 | GO:0098847 | sequence-specific single stranded DNA binding(GO:0098847) |
Gene overrepresentation in C2:CP category:
| Log-likelihood per target | Total log-likelihood | Term | Description |
|---|---|---|---|
| 0.2 | 0.2 | PID TCPTP PATHWAY | Signaling events mediated by TCPTP |
| 0.1 | 0.1 | ST T CELL SIGNAL TRANSDUCTION | T Cell Signal Transduction |
| 0.1 | 2.1 | PID ALK2 PATHWAY | ALK2 signaling events |
| 0.1 | 7.3 | PID IFNG PATHWAY | IFN-gamma pathway |
| 0.1 | 3.9 | SA G1 AND S PHASES | Cdk2, 4, and 6 bind cyclin D in G1, while cdk2/cyclin E promotes the G1/S transition. |
| 0.1 | 0.1 | PID RANBP2 PATHWAY | Sumoylation by RanBP2 regulates transcriptional repression |
| 0.1 | 1.7 | PID P38 GAMMA DELTA PATHWAY | Signaling mediated by p38-gamma and p38-delta |
| 0.1 | 4.4 | PID NCADHERIN PATHWAY | N-cadherin signaling events |
| 0.1 | 0.8 | PID ERBB4 PATHWAY | ErbB4 signaling events |
| 0.1 | 0.3 | PID ERB GENOMIC PATHWAY | Validated nuclear estrogen receptor beta network |
| 0.1 | 0.5 | PID WNT CANONICAL PATHWAY | Canonical Wnt signaling pathway |
| 0.1 | 1.1 | PID INSULIN GLUCOSE PATHWAY | Insulin-mediated glucose transport |
| 0.1 | 1.0 | PID TRKR PATHWAY | Neurotrophic factor-mediated Trk receptor signaling |
| 0.1 | 1.9 | SA PROGRAMMED CELL DEATH | Programmed cell death, or apoptosis, eliminates damaged or unneeded cells. |
| 0.1 | 1.9 | PID SMAD2 3PATHWAY | Regulation of cytoplasmic and nuclear SMAD2/3 signaling |
| 0.1 | 0.1 | SA B CELL RECEPTOR COMPLEXES | Antigen binding to B cell receptors activates protein tyrosine kinases, such as the Src family, which ultimate activate MAP kinases. |
| 0.1 | 0.1 | PID S1P S1P2 PATHWAY | S1P2 pathway |
| 0.1 | 1.4 | PID VEGF VEGFR PATHWAY | VEGF and VEGFR signaling network |
| 0.1 | 0.6 | SA PTEN PATHWAY | PTEN is a tumor suppressor that dephosphorylates the lipid messenger phosphatidylinositol triphosphate. |
| 0.1 | 3.0 | PID P38 MK2 PATHWAY | p38 signaling mediated by MAPKAP kinases |
| 0.1 | 2.1 | PID HDAC CLASSIII PATHWAY | Signaling events mediated by HDAC Class III |
| 0.1 | 2.6 | PID RET PATHWAY | Signaling events regulated by Ret tyrosine kinase |
| 0.1 | 0.2 | PID NFKAPPAB ATYPICAL PATHWAY | Atypical NF-kappaB pathway |
| 0.1 | 0.9 | PID EPO PATHWAY | EPO signaling pathway |
| 0.1 | 7.7 | PID BETA CATENIN NUC PATHWAY | Regulation of nuclear beta catenin signaling and target gene transcription |
| 0.1 | 2.3 | PID RXR VDR PATHWAY | RXR and RAR heterodimerization with other nuclear receptor |
| 0.1 | 2.3 | SIG INSULIN RECEPTOR PATHWAY IN CARDIAC MYOCYTES | Genes related to the insulin receptor pathway |
| 0.1 | 1.5 | PID PI3K PLC TRK PATHWAY | Trk receptor signaling mediated by PI3K and PLC-gamma |
| 0.1 | 1.6 | PID IL3 PATHWAY | IL3-mediated signaling events |
| 0.1 | 1.9 | PID MYC PATHWAY | C-MYC pathway |
| 0.1 | 0.6 | PID INTEGRIN1 PATHWAY | Beta1 integrin cell surface interactions |
| 0.1 | 0.2 | PID IL5 PATHWAY | IL5-mediated signaling events |
| 0.1 | 1.3 | PID TNF PATHWAY | TNF receptor signaling pathway |
| 0.1 | 1.1 | PID PRL SIGNALING EVENTS PATHWAY | Signaling events mediated by PRL |
| 0.0 | 1.8 | PID IL8 CXCR1 PATHWAY | IL8- and CXCR1-mediated signaling events |
| 0.0 | 0.9 | PID ECADHERIN KERATINOCYTE PATHWAY | E-cadherin signaling in keratinocytes |
| 0.0 | 0.8 | PID BMP PATHWAY | BMP receptor signaling |
| 0.0 | 2.8 | PID ILK PATHWAY | Integrin-linked kinase signaling |
| 0.0 | 1.5 | PID HDAC CLASSII PATHWAY | Signaling events mediated by HDAC Class II |
| 0.0 | 0.9 | PID MAPK TRK PATHWAY | Trk receptor signaling mediated by the MAPK pathway |
| 0.0 | 1.5 | ST DIFFERENTIATION PATHWAY IN PC12 CELLS | Differentiation Pathway in PC12 Cells; this is a specific case of PAC1 Receptor Pathway. |
| 0.0 | 2.4 | PID MTOR 4PATHWAY | mTOR signaling pathway |
| 0.0 | 1.5 | PID RHODOPSIN PATHWAY | Visual signal transduction: Rods |
| 0.0 | 2.5 | PID ERBB1 INTERNALIZATION PATHWAY | Internalization of ErbB1 |
| 0.0 | 0.4 | PID TCR RAS PATHWAY | Ras signaling in the CD4+ TCR pathway |
| 0.0 | 0.2 | PID IL23 PATHWAY | IL23-mediated signaling events |
| 0.0 | 3.4 | PID AVB3 INTEGRIN PATHWAY | Integrins in angiogenesis |
| 0.0 | 2.4 | PID RAC1 PATHWAY | RAC1 signaling pathway |
| 0.0 | 0.8 | PID CERAMIDE PATHWAY | Ceramide signaling pathway |
| 0.0 | 0.0 | PID REELIN PATHWAY | Reelin signaling pathway |
| 0.0 | 1.6 | PID INTEGRIN A4B1 PATHWAY | Alpha4 beta1 integrin signaling events |
| 0.0 | 2.3 | NABA PROTEOGLYCANS | Genes encoding proteoglycans |
| 0.0 | 0.9 | PID PTP1B PATHWAY | Signaling events mediated by PTP1B |
| 0.0 | 1.6 | PID HES HEY PATHWAY | Notch-mediated HES/HEY network |
| 0.0 | 4.0 | PID SMAD2 3NUCLEAR PATHWAY | Regulation of nuclear SMAD2/3 signaling |
| 0.0 | 2.5 | PID HNF3A PATHWAY | FOXA1 transcription factor network |
| 0.0 | 1.2 | PID ATF2 PATHWAY | ATF-2 transcription factor network |
| 0.0 | 0.8 | PID ARF 3PATHWAY | Arf1 pathway |
| 0.0 | 3.2 | PID MYC REPRESS PATHWAY | Validated targets of C-MYC transcriptional repression |
| 0.0 | 2.0 | PID ERA GENOMIC PATHWAY | Validated nuclear estrogen receptor alpha network |
| 0.0 | 0.4 | PID INTEGRIN A9B1 PATHWAY | Alpha9 beta1 integrin signaling events |
| 0.0 | 9.4 | NABA ECM GLYCOPROTEINS | Genes encoding structural ECM glycoproteins |
| 0.0 | 0.3 | PID MET PATHWAY | Signaling events mediated by Hepatocyte Growth Factor Receptor (c-Met) |
| 0.0 | 0.3 | PID NETRIN PATHWAY | Netrin-mediated signaling events |
| 0.0 | 0.1 | ST INTERFERON GAMMA PATHWAY | Interferon gamma pathway. |
| 0.0 | 0.8 | ST WNT BETA CATENIN PATHWAY | Wnt/beta-catenin Pathway |
| 0.0 | 2.1 | PID E2F PATHWAY | E2F transcription factor network |
| 0.0 | 0.1 | PID S1P S1P4 PATHWAY | S1P4 pathway |
| 0.0 | 0.2 | SA G2 AND M PHASES | Cdc25 activates the cdc2/cyclin B complex to induce the G2/M transition. |
| 0.0 | 0.1 | SIG PIP3 SIGNALING IN B LYMPHOCYTES | Genes related to PIP3 signaling in B lymphocytes |
| 0.0 | 0.4 | PID ANTHRAX PATHWAY | Cellular roles of Anthrax toxin |
| 0.0 | 0.9 | PID HIF1A PATHWAY | Hypoxic and oxygen homeostasis regulation of HIF-1-alpha |
| 0.0 | 4.0 | PID P53 DOWNSTREAM PATHWAY | Direct p53 effectors |
| 0.0 | 0.9 | PID FOXO PATHWAY | FoxO family signaling |
| 0.0 | 0.3 | PID INSULIN PATHWAY | Insulin Pathway |
| 0.0 | 0.8 | PID REG GR PATHWAY | Glucocorticoid receptor regulatory network |
| 0.0 | 0.7 | PID AURORA A PATHWAY | Aurora A signaling |
| 0.0 | 0.3 | PID TCR CALCIUM PATHWAY | Calcium signaling in the CD4+ TCR pathway |
| 0.0 | 0.5 | PID THROMBIN PAR1 PATHWAY | PAR1-mediated thrombin signaling events |
| 0.0 | 0.2 | SIG IL4RECEPTOR IN B LYPHOCYTES | Genes related to IL4 rceptor signaling in B lymphocytes |
| 0.0 | 0.5 | PID AP1 PATHWAY | AP-1 transcription factor network |
| 0.0 | 0.6 | PID CDC42 PATHWAY | CDC42 signaling events |
| 0.0 | 0.3 | PID ECADHERIN NASCENT AJ PATHWAY | E-cadherin signaling in the nascent adherens junction |
| 0.0 | 0.4 | PID HEDGEHOG GLI PATHWAY | Hedgehog signaling events mediated by Gli proteins |
| 0.0 | 0.1 | PID IL8 CXCR2 PATHWAY | IL8- and CXCR2-mediated signaling events |
| 0.0 | 0.1 | PID IL12 STAT4 PATHWAY | IL12 signaling mediated by STAT4 |
| 0.0 | 0.6 | PID IL4 2PATHWAY | IL4-mediated signaling events |
| 0.0 | 1.0 | PID CASPASE PATHWAY | Caspase cascade in apoptosis |
| 0.0 | 0.2 | PID FAK PATHWAY | Signaling events mediated by focal adhesion kinase |
| 0.0 | 0.1 | ST INTERLEUKIN 4 PATHWAY | Interleukin 4 (IL-4) Pathway |
| 0.0 | 0.3 | PID P38 MKK3 6PATHWAY | p38 MAPK signaling pathway |
| 0.0 | 0.1 | PID P38 ALPHA BETA PATHWAY | Regulation of p38-alpha and p38-beta |
| 0.0 | 0.3 | PID ANGIOPOIETIN RECEPTOR PATHWAY | Angiopoietin receptor Tie2-mediated signaling |
| 0.0 | 0.4 | PID CXCR4 PATHWAY | CXCR4-mediated signaling events |
| 0.0 | 0.5 | PID CD8 TCR DOWNSTREAM PATHWAY | Downstream signaling in naïve CD8+ T cells |
| 0.0 | 0.4 | PID LYSOPHOSPHOLIPID PATHWAY | LPA receptor mediated events |
| 0.0 | 0.4 | PID INTEGRIN2 PATHWAY | Beta2 integrin cell surface interactions |
| 0.0 | 0.2 | PID ARF6 DOWNSTREAM PATHWAY | Arf6 downstream pathway |
| 0.0 | 0.0 | ST GRANULE CELL SURVIVAL PATHWAY | Granule Cell Survival Pathway is a specific case of more general PAC1 Receptor Pathway. |
| 0.0 | 0.6 | ST FAS SIGNALING PATHWAY | Fas Signaling Pathway |
| 0.0 | 0.4 | PID NFAT 3PATHWAY | Role of Calcineurin-dependent NFAT signaling in lymphocytes |
Gene overrepresentation in C2:CP:REACTOME category:
| Log-likelihood per target | Total log-likelihood | Term | Description |
|---|---|---|---|
| 0.3 | 4.6 | REACTOME ROLE OF DCC IN REGULATING APOPTOSIS | Genes involved in Role of DCC in regulating apoptosis |
| 0.2 | 0.2 | REACTOME REGULATION OF GLUCOKINASE BY GLUCOKINASE REGULATORY PROTEIN | Genes involved in Regulation of Glucokinase by Glucokinase Regulatory Protein |
| 0.2 | 2.1 | REACTOME SYNTHESIS OF BILE ACIDS AND BILE SALTS VIA 24 HYDROXYCHOLESTEROL | Genes involved in Synthesis of bile acids and bile salts via 24-hydroxycholesterol |
| 0.1 | 4.3 | REACTOME AMINO ACID SYNTHESIS AND INTERCONVERSION TRANSAMINATION | Genes involved in Amino acid synthesis and interconversion (transamination) |
| 0.1 | 1.1 | REACTOME PROSTACYCLIN SIGNALLING THROUGH PROSTACYCLIN RECEPTOR | Genes involved in Prostacyclin signalling through prostacyclin receptor |
| 0.1 | 4.9 | REACTOME SYNTHESIS AND INTERCONVERSION OF NUCLEOTIDE DI AND TRIPHOSPHATES | Genes involved in Synthesis and interconversion of nucleotide di- and triphosphates |
| 0.1 | 2.3 | REACTOME AKT PHOSPHORYLATES TARGETS IN THE CYTOSOL | Genes involved in AKT phosphorylates targets in the cytosol |
| 0.1 | 5.4 | REACTOME GLUTATHIONE CONJUGATION | Genes involved in Glutathione conjugation |
| 0.1 | 0.9 | REACTOME MEMBRANE BINDING AND TARGETTING OF GAG PROTEINS | Genes involved in Membrane binding and targetting of GAG proteins |
| 0.1 | 1.7 | REACTOME GAMMA CARBOXYLATION TRANSPORT AND AMINO TERMINAL CLEAVAGE OF PROTEINS | Genes involved in Gamma-carboxylation, transport, and amino-terminal cleavage of proteins |
| 0.1 | 9.2 | REACTOME NOTCH1 INTRACELLULAR DOMAIN REGULATES TRANSCRIPTION | Genes involved in NOTCH1 Intracellular Domain Regulates Transcription |
| 0.1 | 2.2 | REACTOME MITOCHONDRIAL FATTY ACID BETA OXIDATION | Genes involved in Mitochondrial Fatty Acid Beta-Oxidation |
| 0.1 | 2.0 | REACTOME PROLACTIN RECEPTOR SIGNALING | Genes involved in Prolactin receptor signaling |
| 0.1 | 0.1 | REACTOME NOREPINEPHRINE NEUROTRANSMITTER RELEASE CYCLE | Genes involved in Norepinephrine Neurotransmitter Release Cycle |
| 0.1 | 6.6 | REACTOME NETRIN1 SIGNALING | Genes involved in Netrin-1 signaling |
| 0.1 | 1.5 | REACTOME SIGNALING BY ACTIVATED POINT MUTANTS OF FGFR1 | Genes involved in Signaling by activated point mutants of FGFR1 |
| 0.1 | 2.5 | REACTOME REGULATION OF AMPK ACTIVITY VIA LKB1 | Genes involved in Regulation of AMPK activity via LKB1 |
| 0.1 | 2.5 | REACTOME PROTEOLYTIC CLEAVAGE OF SNARE COMPLEX PROTEINS | Genes involved in Proteolytic cleavage of SNARE complex proteins |
| 0.1 | 4.0 | REACTOME SMAD2 SMAD3 SMAD4 HETEROTRIMER REGULATES TRANSCRIPTION | Genes involved in SMAD2/SMAD3:SMAD4 heterotrimer regulates transcription |
| 0.1 | 1.5 | REACTOME SLBP DEPENDENT PROCESSING OF REPLICATION DEPENDENT HISTONE PRE MRNAS | Genes involved in SLBP Dependent Processing of Replication-Dependent Histone Pre-mRNAs |
| 0.1 | 2.3 | REACTOME METABOLISM OF POLYAMINES | Genes involved in Metabolism of polyamines |
| 0.1 | 0.9 | REACTOME COPI MEDIATED TRANSPORT | Genes involved in COPI Mediated Transport |
| 0.1 | 2.0 | REACTOME SULFUR AMINO ACID METABOLISM | Genes involved in Sulfur amino acid metabolism |
| 0.1 | 1.3 | REACTOME ERKS ARE INACTIVATED | Genes involved in ERKs are inactivated |
| 0.1 | 2.6 | REACTOME YAP1 AND WWTR1 TAZ STIMULATED GENE EXPRESSION | Genes involved in YAP1- and WWTR1 (TAZ)-stimulated gene expression |
| 0.1 | 1.8 | REACTOME FORMATION OF ATP BY CHEMIOSMOTIC COUPLING | Genes involved in Formation of ATP by chemiosmotic coupling |
| 0.1 | 5.0 | REACTOME SMOOTH MUSCLE CONTRACTION | Genes involved in Smooth Muscle Contraction |
| 0.1 | 1.7 | REACTOME RETROGRADE NEUROTROPHIN SIGNALLING | Genes involved in Retrograde neurotrophin signalling |
| 0.1 | 3.0 | REACTOME PI3K AKT ACTIVATION | Genes involved in PI3K/AKT activation |
| 0.1 | 0.6 | REACTOME APOBEC3G MEDIATED RESISTANCE TO HIV1 INFECTION | Genes involved in APOBEC3G mediated resistance to HIV-1 infection |
| 0.1 | 1.7 | REACTOME ENDOSOMAL SORTING COMPLEX REQUIRED FOR TRANSPORT ESCRT | Genes involved in Endosomal Sorting Complex Required For Transport (ESCRT) |
| 0.1 | 1.4 | REACTOME VEGF LIGAND RECEPTOR INTERACTIONS | Genes involved in VEGF ligand-receptor interactions |
| 0.1 | 2.8 | REACTOME THROMBIN SIGNALLING THROUGH PROTEINASE ACTIVATED RECEPTORS PARS | Genes involved in Thrombin signalling through proteinase activated receptors (PARs) |
| 0.1 | 0.7 | REACTOME DIGESTION OF DIETARY CARBOHYDRATE | Genes involved in Digestion of dietary carbohydrate |
| 0.1 | 0.5 | REACTOME GAP JUNCTION DEGRADATION | Genes involved in Gap junction degradation |
| 0.1 | 0.6 | REACTOME REGULATION OF IFNG SIGNALING | Genes involved in Regulation of IFNG signaling |
| 0.1 | 0.9 | REACTOME SIGNAL ATTENUATION | Genes involved in Signal attenuation |
| 0.1 | 1.4 | REACTOME VIRAL MESSENGER RNA SYNTHESIS | Genes involved in Viral Messenger RNA Synthesis |
| 0.1 | 1.4 | REACTOME REGULATION OF INSULIN LIKE GROWTH FACTOR IGF ACTIVITY BY INSULIN LIKE GROWTH FACTOR BINDING PROTEINS IGFBPS | Genes involved in Regulation of Insulin-like Growth Factor (IGF) Activity by Insulin-like Growth Factor Binding Proteins (IGFBPs) |
| 0.1 | 2.6 | REACTOME DARPP 32 EVENTS | Genes involved in DARPP-32 events |
| 0.1 | 4.9 | REACTOME INTERFERON ALPHA BETA SIGNALING | Genes involved in Interferon alpha/beta signaling |
| 0.1 | 5.0 | REACTOME RESPIRATORY ELECTRON TRANSPORT ATP SYNTHESIS BY CHEMIOSMOTIC COUPLING AND HEAT PRODUCTION BY UNCOUPLING PROTEINS | Genes involved in Respiratory electron transport, ATP synthesis by chemiosmotic coupling, and heat production by uncoupling proteins. |
| 0.1 | 0.7 | REACTOME OPSINS | Genes involved in Opsins |
| 0.1 | 0.4 | REACTOME IL 6 SIGNALING | Genes involved in Interleukin-6 signaling |
| 0.1 | 2.2 | REACTOME REGULATION OF HYPOXIA INDUCIBLE FACTOR HIF BY OXYGEN | Genes involved in Regulation of Hypoxia-inducible Factor (HIF) by Oxygen |
| 0.0 | 1.0 | REACTOME GLUTAMATE NEUROTRANSMITTER RELEASE CYCLE | Genes involved in Glutamate Neurotransmitter Release Cycle |
| 0.0 | 0.8 | REACTOME CTNNB1 PHOSPHORYLATION CASCADE | Genes involved in Beta-catenin phosphorylation cascade |
| 0.0 | 0.7 | REACTOME NEF MEDIATED DOWNREGULATION OF MHC CLASS I COMPLEX CELL SURFACE EXPRESSION | Genes involved in Nef mediated downregulation of MHC class I complex cell surface expression |
| 0.0 | 3.4 | REACTOME REGULATION OF ORNITHINE DECARBOXYLASE ODC | Genes involved in Regulation of ornithine decarboxylase (ODC) |
| 0.0 | 0.0 | REACTOME VIF MEDIATED DEGRADATION OF APOBEC3G | Genes involved in Vif-mediated degradation of APOBEC3G |
| 0.0 | 7.2 | REACTOME PEPTIDE CHAIN ELONGATION | Genes involved in Peptide chain elongation |
| 0.0 | 1.2 | REACTOME P38MAPK EVENTS | Genes involved in p38MAPK events |
| 0.0 | 0.5 | REACTOME ACTIVATION OF THE AP1 FAMILY OF TRANSCRIPTION FACTORS | Genes involved in Activation of the AP-1 family of transcription factors |
| 0.0 | 1.2 | REACTOME MRNA SPLICING MINOR PATHWAY | Genes involved in mRNA Splicing - Minor Pathway |
| 0.0 | 0.4 | REACTOME ACTIVATED AMPK STIMULATES FATTY ACID OXIDATION IN MUSCLE | Genes involved in Activated AMPK stimulates fatty-acid oxidation in muscle |
| 0.0 | 1.7 | REACTOME RAP1 SIGNALLING | Genes involved in Rap1 signalling |
| 0.0 | 1.8 | REACTOME PYRIMIDINE METABOLISM | Genes involved in Pyrimidine metabolism |
| 0.0 | 1.1 | REACTOME REGULATION OF GENE EXPRESSION IN BETA CELLS | Genes involved in Regulation of gene expression in beta cells |
| 0.0 | 0.6 | REACTOME ACTIVATION OF CHAPERONE GENES BY ATF6 ALPHA | Genes involved in Activation of Chaperone Genes by ATF6-alpha |
| 0.0 | 0.4 | REACTOME SEMA3A PLEXIN REPULSION SIGNALING BY INHIBITING INTEGRIN ADHESION | Genes involved in SEMA3A-Plexin repulsion signaling by inhibiting Integrin adhesion |
| 0.0 | 1.8 | REACTOME GLYCOLYSIS | Genes involved in Glycolysis |
| 0.0 | 0.7 | REACTOME SYNTHESIS OF SUBSTRATES IN N GLYCAN BIOSYTHESIS | Genes involved in Synthesis of substrates in N-glycan biosythesis |
| 0.0 | 6.0 | REACTOME METABOLISM OF AMINO ACIDS AND DERIVATIVES | Genes involved in Metabolism of amino acids and derivatives |
| 0.0 | 0.2 | REACTOME G BETA GAMMA SIGNALLING THROUGH PLC BETA | Genes involved in G beta:gamma signalling through PLC beta |
| 0.0 | 0.4 | REACTOME CIRCADIAN REPRESSION OF EXPRESSION BY REV ERBA | Genes involved in Circadian Repression of Expression by REV-ERBA |
| 0.0 | 1.4 | REACTOME INTERACTION BETWEEN L1 AND ANKYRINS | Genes involved in Interaction between L1 and Ankyrins |
| 0.0 | 0.9 | REACTOME CITRIC ACID CYCLE TCA CYCLE | Genes involved in Citric acid cycle (TCA cycle) |
| 0.0 | 1.8 | REACTOME INTRINSIC PATHWAY FOR APOPTOSIS | Genes involved in Intrinsic Pathway for Apoptosis |
| 0.0 | 0.9 | REACTOME SYNTHESIS OF PE | Genes involved in Synthesis of PE |
| 0.0 | 0.9 | REACTOME ABCA TRANSPORTERS IN LIPID HOMEOSTASIS | Genes involved in ABCA transporters in lipid homeostasis |
| 0.0 | 1.1 | REACTOME CELL EXTRACELLULAR MATRIX INTERACTIONS | Genes involved in Cell-extracellular matrix interactions |
| 0.0 | 0.5 | REACTOME CRMPS IN SEMA3A SIGNALING | Genes involved in CRMPs in Sema3A signaling |
| 0.0 | 2.0 | REACTOME IL1 SIGNALING | Genes involved in Interleukin-1 signaling |
| 0.0 | 0.3 | REACTOME SEMA3A PAK DEPENDENT AXON REPULSION | Genes involved in Sema3A PAK dependent Axon repulsion |
| 0.0 | 0.9 | REACTOME RNA POL II TRANSCRIPTION PRE INITIATION AND PROMOTER OPENING | Genes involved in RNA Polymerase II Transcription Pre-Initiation And Promoter Opening |
| 0.0 | 0.6 | REACTOME CREB PHOSPHORYLATION THROUGH THE ACTIVATION OF CAMKII | Genes involved in CREB phosphorylation through the activation of CaMKII |
| 0.0 | 0.7 | REACTOME HORMONE SENSITIVE LIPASE HSL MEDIATED TRIACYLGLYCEROL HYDROLYSIS | Genes involved in Hormone-sensitive lipase (HSL)-mediated triacylglycerol hydrolysis |
| 0.0 | 0.6 | REACTOME INTRINSIC PATHWAY | Genes involved in Intrinsic Pathway |
| 0.0 | 0.6 | REACTOME BMAL1 CLOCK NPAS2 ACTIVATES CIRCADIAN EXPRESSION | Genes involved in BMAL1:CLOCK/NPAS2 Activates Circadian Expression |
| 0.0 | 1.0 | REACTOME METABOLISM OF PORPHYRINS | Genes involved in Metabolism of porphyrins |
| 0.0 | 2.9 | REACTOME NUCLEAR RECEPTOR TRANSCRIPTION PATHWAY | Genes involved in Nuclear Receptor transcription pathway |
| 0.0 | 0.3 | REACTOME PROSTANOID LIGAND RECEPTORS | Genes involved in Prostanoid ligand receptors |
| 0.0 | 0.3 | REACTOME PURINE CATABOLISM | Genes involved in Purine catabolism |
| 0.0 | 0.7 | REACTOME OTHER SEMAPHORIN INTERACTIONS | Genes involved in Other semaphorin interactions |
| 0.0 | 1.0 | REACTOME CS DS DEGRADATION | Genes involved in CS/DS degradation |
| 0.0 | 0.7 | REACTOME GABA SYNTHESIS RELEASE REUPTAKE AND DEGRADATION | Genes involved in GABA synthesis, release, reuptake and degradation |
| 0.0 | 0.5 | REACTOME PASSIVE TRANSPORT BY AQUAPORINS | Genes involved in Passive Transport by Aquaporins |
| 0.0 | 0.4 | REACTOME NGF SIGNALLING VIA TRKA FROM THE PLASMA MEMBRANE | Genes involved in NGF signalling via TRKA from the plasma membrane |
| 0.0 | 1.0 | REACTOME SEMA4D INDUCED CELL MIGRATION AND GROWTH CONE COLLAPSE | Genes involved in Sema4D induced cell migration and growth-cone collapse |
| 0.0 | 0.7 | REACTOME PURINE SALVAGE | Genes involved in Purine salvage |
| 0.0 | 1.1 | REACTOME G1 PHASE | Genes involved in G1 Phase |
| 0.0 | 0.4 | REACTOME TETRAHYDROBIOPTERIN BH4 SYNTHESIS RECYCLING SALVAGE AND REGULATION | Genes involved in Tetrahydrobiopterin (BH4) synthesis, recycling, salvage and regulation |
| 0.0 | 0.1 | REACTOME CONVERSION FROM APC C CDC20 TO APC C CDH1 IN LATE ANAPHASE | Genes involved in Conversion from APC/C:Cdc20 to APC/C:Cdh1 in late anaphase |
| 0.0 | 1.0 | REACTOME SYNTHESIS OF PIPS AT THE PLASMA MEMBRANE | Genes involved in Synthesis of PIPs at the plasma membrane |
| 0.0 | 0.2 | REACTOME FORMATION OF INCISION COMPLEX IN GG NER | Genes involved in Formation of incision complex in GG-NER |
| 0.0 | 0.0 | REACTOME ELEVATION OF CYTOSOLIC CA2 LEVELS | Genes involved in Elevation of cytosolic Ca2+ levels |
| 0.0 | 0.4 | REACTOME BASE FREE SUGAR PHOSPHATE REMOVAL VIA THE SINGLE NUCLEOTIDE REPLACEMENT PATHWAY | Genes involved in Base-free sugar-phosphate removal via the single-nucleotide replacement pathway |
| 0.0 | 1.0 | REACTOME SIGNALING BY ROBO RECEPTOR | Genes involved in Signaling by Robo receptor |
| 0.0 | 0.0 | REACTOME ACTIVATION OF THE PRE REPLICATIVE COMPLEX | Genes involved in Activation of the pre-replicative complex |
| 0.0 | 0.4 | REACTOME FORMATION OF TRANSCRIPTION COUPLED NER TC NER REPAIR COMPLEX | Genes involved in Formation of transcription-coupled NER (TC-NER) repair complex |
| 0.0 | 0.1 | REACTOME P53 INDEPENDENT G1 S DNA DAMAGE CHECKPOINT | Genes involved in p53-Independent G1/S DNA damage checkpoint |
| 0.0 | 0.4 | REACTOME ACTIVATED TLR4 SIGNALLING | Genes involved in Activated TLR4 signalling |
| 0.0 | 0.5 | REACTOME ABC FAMILY PROTEINS MEDIATED TRANSPORT | Genes involved in ABC-family proteins mediated transport |
| 0.0 | 0.0 | REACTOME CDK MEDIATED PHOSPHORYLATION AND REMOVAL OF CDC6 | Genes involved in CDK-mediated phosphorylation and removal of Cdc6 |
| 0.0 | 0.1 | REACTOME ABORTIVE ELONGATION OF HIV1 TRANSCRIPT IN THE ABSENCE OF TAT | Genes involved in Abortive elongation of HIV-1 transcript in the absence of Tat |
| 0.0 | 0.4 | REACTOME SYNTHESIS OF PIPS AT THE GOLGI MEMBRANE | Genes involved in Synthesis of PIPs at the Golgi membrane |
| 0.0 | 0.1 | REACTOME AUTODEGRADATION OF THE E3 UBIQUITIN LIGASE COP1 | Genes involved in Autodegradation of the E3 ubiquitin ligase COP1 |
| 0.0 | 0.0 | REACTOME MITOTIC M M G1 PHASES | Genes involved in Mitotic M-M/G1 phases |
| 0.0 | 0.5 | REACTOME RNA POL III TRANSCRIPTION INITIATION FROM TYPE 3 PROMOTER | Genes involved in RNA Polymerase III Transcription Initiation From Type 3 Promoter |
| 0.0 | 0.3 | REACTOME MRNA DECAY BY 5 TO 3 EXORIBONUCLEASE | Genes involved in mRNA Decay by 5' to 3' Exoribonuclease |
| 0.0 | 0.1 | REACTOME IL 3 5 AND GM CSF SIGNALING | Genes involved in Interleukin-3, 5 and GM-CSF signaling |
| 0.0 | 0.3 | REACTOME GLUCONEOGENESIS | Genes involved in Gluconeogenesis |
| 0.0 | 0.4 | REACTOME INFLAMMASOMES | Genes involved in Inflammasomes |
| 0.0 | 1.1 | REACTOME TRANSCRIPTIONAL REGULATION OF WHITE ADIPOCYTE DIFFERENTIATION | Genes involved in Transcriptional Regulation of White Adipocyte Differentiation |
| 0.0 | 1.3 | REACTOME AMYLOIDS | Genes involved in Amyloids |
| 0.0 | 0.2 | REACTOME SYNTHESIS OF BILE ACIDS AND BILE SALTS | Genes involved in Synthesis of bile acids and bile salts |
| 0.0 | 0.1 | REACTOME MTORC1 MEDIATED SIGNALLING | Genes involved in mTORC1-mediated signalling |
| 0.0 | 0.1 | REACTOME IKK COMPLEX RECRUITMENT MEDIATED BY RIP1 | Genes involved in IKK complex recruitment mediated by RIP1 |
| 0.0 | 1.2 | REACTOME SIGNALING BY PDGF | Genes involved in Signaling by PDGF |
| 0.0 | 3.1 | REACTOME ANTIGEN PROCESSING UBIQUITINATION PROTEASOME DEGRADATION | Genes involved in Antigen processing: Ubiquitination & Proteasome degradation |
| 0.0 | 0.3 | REACTOME PROCESSING OF CAPPED INTRONLESS PRE MRNA | Genes involved in Processing of Capped Intronless Pre-mRNA |
| 0.0 | 0.2 | REACTOME REGULATION OF KIT SIGNALING | Genes involved in Regulation of KIT signaling |
| 0.0 | 0.3 | REACTOME SIGNALING BY SCF KIT | Genes involved in Signaling by SCF-KIT |
| 0.0 | 0.5 | REACTOME STEROID HORMONES | Genes involved in Steroid hormones |
| 0.0 | 0.2 | REACTOME ETHANOL OXIDATION | Genes involved in Ethanol oxidation |
| 0.0 | 0.3 | REACTOME MRNA 3 END PROCESSING | Genes involved in mRNA 3'-end processing |
| 0.0 | 0.1 | REACTOME METABOLISM OF STEROID HORMONES AND VITAMINS A AND D | Genes involved in Metabolism of steroid hormones and vitamins A and D |
| 0.0 | 0.1 | REACTOME LATE PHASE OF HIV LIFE CYCLE | Genes involved in Late Phase of HIV Life Cycle |
| 0.0 | 0.3 | REACTOME ORGANIC CATION ANION ZWITTERION TRANSPORT | Genes involved in Organic cation/anion/zwitterion transport |
| 0.0 | 0.1 | REACTOME SEMA4D IN SEMAPHORIN SIGNALING | Genes involved in Sema4D in semaphorin signaling |