Project
Epithelial-Mesenchymal Transition, human (Scheel, 2011)
Navigation
Downloads
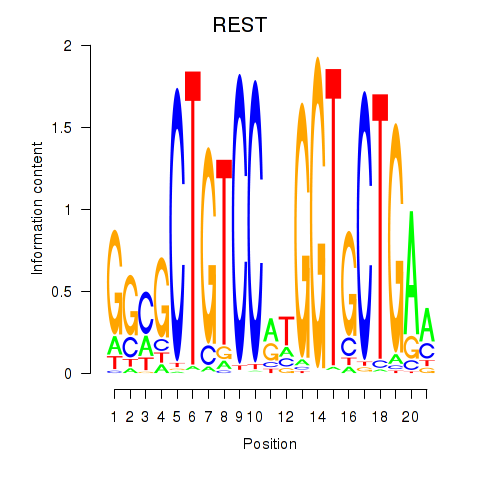
Results for REST
Z-value: 0.46
Motif logo
Transcription factors associated with REST
| Gene Symbol | Gene ID | Gene Info |
|---|---|---|
|
REST
|
ENSG00000084093.11 | REST |
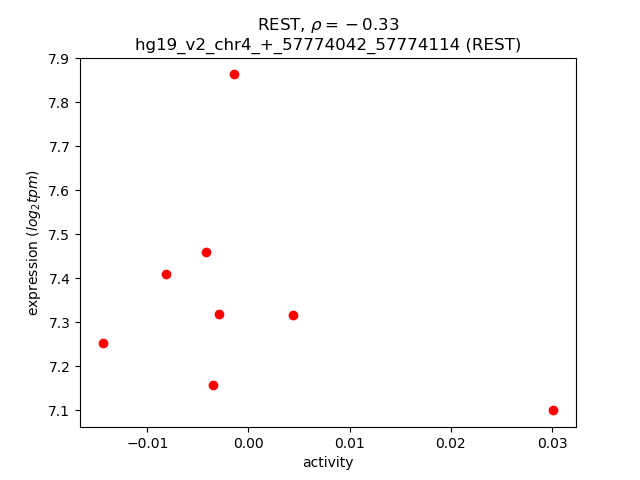
Activity-expression correlation:
| Gene | Promoter | Pearson corr. coef. | P-value | Plot |
|---|---|---|---|---|
| REST | hg19_v2_chr4_+_57774042_57774114 | -0.33 | 4.3e-01 | Click! |
Activity profile of REST motif
Sorted Z-values of REST motif
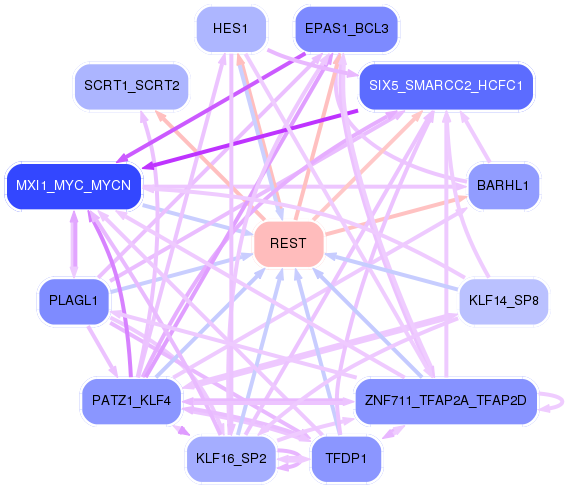
Network of associatons between targets according to the STRING database.

First level regulatory network of REST
| Promoter | Score | Transcript | Gene | Gene Info |
|---|---|---|---|---|
| chrX_-_153141302 | 0.77 |
ENST00000361699.4 ENST00000543994.1 ENST00000370057.3 ENST00000538883.1 ENST00000361981.3 |
L1CAM |
L1 cell adhesion molecule |
| chr7_+_145813453 | 0.38 |
ENST00000361727.3 |
CNTNAP2 |
contactin associated protein-like 2 |
| chr20_+_62327996 | 0.38 |
ENST00000369996.1 |
TNFRSF6B |
tumor necrosis factor receptor superfamily, member 6b, decoy |
| chr8_-_91095099 | 0.33 |
ENST00000265431.3 |
CALB1 |
calbindin 1, 28kDa |
| chr17_+_30813576 | 0.32 |
ENST00000313401.3 |
CDK5R1 |
cyclin-dependent kinase 5, regulatory subunit 1 (p35) |
| chr15_-_72612470 | 0.30 |
ENST00000287202.5 |
CELF6 |
CUGBP, Elav-like family member 6 |
| chr11_-_72492878 | 0.26 |
ENST00000535054.1 ENST00000545082.1 |
STARD10 |
StAR-related lipid transfer (START) domain containing 10 |
| chr10_-_50970382 | 0.25 |
ENST00000419399.1 ENST00000432695.1 |
OGDHL |
oxoglutarate dehydrogenase-like |
| chr10_-_50970322 | 0.25 |
ENST00000374103.4 |
OGDHL |
oxoglutarate dehydrogenase-like |
| chr7_+_154862028 | 0.24 |
ENST00000287907.2 |
HTR5A |
5-hydroxytryptamine (serotonin) receptor 5A, G protein-coupled |
| chr3_+_193853927 | 0.24 |
ENST00000232424.3 |
HES1 |
hes family bHLH transcription factor 1 |
| chr8_-_145559943 | 0.23 |
ENST00000332135.4 |
SCRT1 |
scratch family zinc finger 1 |
| chr20_-_62284766 | 0.23 |
ENST00000370053.1 |
STMN3 |
stathmin-like 3 |
| chr9_+_138606400 | 0.21 |
ENST00000486577.2 |
KCNT1 |
potassium channel, subfamily T, member 1 |
| chr2_+_46524537 | 0.20 |
ENST00000263734.3 |
EPAS1 |
endothelial PAS domain protein 1 |
| chrX_-_49056635 | 0.19 |
ENST00000472598.1 ENST00000538567.1 ENST00000479808.1 ENST00000263233.4 |
SYP |
synaptophysin |
| chr9_+_135457530 | 0.18 |
ENST00000263610.2 |
BARHL1 |
BarH-like homeobox 1 |
| chr10_-_44880491 | 0.18 |
ENST00000374426.2 ENST00000395795.4 ENST00000395794.2 ENST00000374429.2 ENST00000395793.3 ENST00000343575.6 |
CXCL12 |
chemokine (C-X-C motif) ligand 12 |
| chr8_+_6565854 | 0.17 |
ENST00000285518.6 |
AGPAT5 |
1-acylglycerol-3-phosphate O-acyltransferase 5 |
| chr17_-_3337135 | 0.16 |
ENST00000248384.1 |
OR1E2 |
olfactory receptor, family 1, subfamily E, member 2 |
| chr2_-_47798044 | 0.15 |
ENST00000327876.4 |
KCNK12 |
potassium channel, subfamily K, member 12 |
| chr2_-_51259528 | 0.14 |
ENST00000404971.1 |
NRXN1 |
neurexin 1 |
| chr3_+_120626919 | 0.14 |
ENST00000273666.6 ENST00000471454.1 ENST00000472879.1 ENST00000497029.1 ENST00000492541.1 |
STXBP5L |
syntaxin binding protein 5-like |
| chr4_+_96012614 | 0.13 |
ENST00000264568.4 |
BMPR1B |
bone morphogenetic protein receptor, type IB |
| chr2_-_51259641 | 0.13 |
ENST00000406316.2 ENST00000405581.1 |
NRXN1 |
neurexin 1 |
| chr11_-_125773085 | 0.12 |
ENST00000227474.3 ENST00000534158.1 ENST00000529801.1 |
PUS3 |
pseudouridylate synthase 3 |
| chr2_-_51259229 | 0.12 |
ENST00000405472.3 |
NRXN1 |
neurexin 1 |
| chr2_-_51259292 | 0.12 |
ENST00000401669.2 |
NRXN1 |
neurexin 1 |
| chr20_+_5892037 | 0.11 |
ENST00000378961.4 |
CHGB |
chromogranin B (secretogranin 1) |
| chr19_-_3971050 | 0.11 |
ENST00000545797.2 ENST00000596311.1 |
DAPK3 |
death-associated protein kinase 3 |
| chr14_-_106781017 | 0.10 |
ENST00000390612.2 |
IGHV4-28 |
immunoglobulin heavy variable 4-28 |
| chr3_-_113897899 | 0.09 |
ENST00000383673.2 ENST00000295881.7 |
DRD3 |
dopamine receptor D3 |
| chr11_-_92931098 | 0.08 |
ENST00000326402.4 |
SLC36A4 |
solute carrier family 36 (proton/amino acid symporter), member 4 |
| chr15_-_83378526 | 0.08 |
ENST00000535348.1 ENST00000535359.1 |
AP3B2 |
adaptor-related protein complex 3, beta 2 subunit |
| chr12_+_113229543 | 0.08 |
ENST00000447659.2 |
RPH3A |
rabphilin 3A homolog (mouse) |
| chr14_+_93389425 | 0.08 |
ENST00000216492.5 ENST00000334654.4 |
CHGA |
chromogranin A (parathyroid secretory protein 1) |
| chr12_+_175930 | 0.08 |
ENST00000538872.1 ENST00000326261.4 |
IQSEC3 |
IQ motif and Sec7 domain 3 |
| chr19_-_11639910 | 0.07 |
ENST00000588998.1 ENST00000586149.1 |
ECSIT |
ECSIT signalling integrator |
| chr12_+_113229452 | 0.07 |
ENST00000389385.4 |
RPH3A |
rabphilin 3A homolog (mouse) |
| chr1_+_212606219 | 0.07 |
ENST00000366988.3 |
NENF |
neudesin neurotrophic factor |
| chr16_+_335680 | 0.07 |
ENST00000435833.1 |
PDIA2 |
protein disulfide isomerase family A, member 2 |
| chr15_-_83378638 | 0.07 |
ENST00000261722.3 |
AP3B2 |
adaptor-related protein complex 3, beta 2 subunit |
| chrX_-_153237258 | 0.07 |
ENST00000310441.7 |
HCFC1 |
host cell factor C1 (VP16-accessory protein) |
| chr5_+_175298573 | 0.07 |
ENST00000512824.1 |
CPLX2 |
complexin 2 |
| chr6_+_158957431 | 0.07 |
ENST00000367090.3 |
TMEM181 |
transmembrane protein 181 |
| chr1_-_102462565 | 0.07 |
ENST00000370103.4 |
OLFM3 |
olfactomedin 3 |
| chr15_-_83378611 | 0.06 |
ENST00000542200.1 |
AP3B2 |
adaptor-related protein complex 3, beta 2 subunit |
| chr2_+_115199876 | 0.06 |
ENST00000436732.1 ENST00000410059.1 |
DPP10 |
dipeptidyl-peptidase 10 (non-functional) |
| chr17_-_27333311 | 0.06 |
ENST00000317338.12 ENST00000585644.1 |
SEZ6 |
seizure related 6 homolog (mouse) |
| chr13_-_111214015 | 0.06 |
ENST00000267328.3 |
RAB20 |
RAB20, member RAS oncogene family |
| chr6_+_35773070 | 0.06 |
ENST00000373853.1 ENST00000360215.1 |
LHFPL5 |
lipoma HMGIC fusion partner-like 5 |
| chr1_+_210111570 | 0.06 |
ENST00000367019.1 ENST00000472886.1 |
SYT14 |
synaptotagmin XIV |
| chr20_+_36012051 | 0.06 |
ENST00000373567.2 |
SRC |
v-src avian sarcoma (Schmidt-Ruppin A-2) viral oncogene homolog |
| chr3_-_113897545 | 0.06 |
ENST00000467632.1 |
DRD3 |
dopamine receptor D3 |
| chr17_-_27332931 | 0.06 |
ENST00000442608.3 ENST00000335960.6 |
SEZ6 |
seizure related 6 homolog (mouse) |
| chr17_-_27333163 | 0.05 |
ENST00000360295.9 |
SEZ6 |
seizure related 6 homolog (mouse) |
| chr17_+_42385927 | 0.05 |
ENST00000426726.3 ENST00000590941.1 ENST00000225441.7 |
RUNDC3A |
RUN domain containing 3A |
| chr19_-_11639931 | 0.05 |
ENST00000592312.1 ENST00000590480.1 ENST00000585318.1 ENST00000252440.7 ENST00000417981.2 ENST00000270517.7 |
ECSIT |
ECSIT signalling integrator |
| chr5_+_63802109 | 0.05 |
ENST00000334025.2 |
RGS7BP |
regulator of G-protein signaling 7 binding protein |
| chr12_+_113229737 | 0.05 |
ENST00000551052.1 ENST00000415485.3 |
RPH3A |
rabphilin 3A homolog (mouse) |
| chr14_+_93897199 | 0.05 |
ENST00000553484.1 |
UNC79 |
unc-79 homolog (C. elegans) |
| chr14_+_93897272 | 0.05 |
ENST00000393151.2 |
UNC79 |
unc-79 homolog (C. elegans) |
| chr1_+_154540246 | 0.05 |
ENST00000368476.3 |
CHRNB2 |
cholinergic receptor, nicotinic, beta 2 (neuronal) |
| chr15_+_75287861 | 0.05 |
ENST00000425597.3 ENST00000562327.1 ENST00000568018.1 ENST00000562212.1 ENST00000567920.1 ENST00000566872.1 ENST00000361900.6 ENST00000545456.1 |
SCAMP5 |
secretory carrier membrane protein 5 |
| chr5_+_175298487 | 0.05 |
ENST00000393745.3 |
CPLX2 |
complexin 2 |
| chr16_+_3019246 | 0.05 |
ENST00000318782.8 ENST00000293978.8 |
PAQR4 |
progestin and adipoQ receptor family member IV |
| chrX_+_153237740 | 0.04 |
ENST00000369982.4 |
TMEM187 |
transmembrane protein 187 |
| chr1_-_40105617 | 0.04 |
ENST00000372852.3 |
HEYL |
hes-related family bHLH transcription factor with YRPW motif-like |
| chr20_-_60795296 | 0.04 |
ENST00000340177.5 |
HRH3 |
histamine receptor H3 |
| chr20_-_44144249 | 0.04 |
ENST00000217428.6 |
SPINT3 |
serine peptidase inhibitor, Kunitz type, 3 |
| chr16_+_5008290 | 0.04 |
ENST00000251170.7 |
SEC14L5 |
SEC14-like 5 (S. cerevisiae) |
| chr6_+_43603552 | 0.03 |
ENST00000372171.4 |
MAD2L1BP |
MAD2L1 binding protein |
| chr1_+_171750776 | 0.03 |
ENST00000458517.1 ENST00000362019.3 ENST00000367737.5 ENST00000361735.3 |
METTL13 |
methyltransferase like 13 |
| chr11_+_637246 | 0.03 |
ENST00000176183.5 |
DRD4 |
dopamine receptor D4 |
| chr6_+_154360357 | 0.03 |
ENST00000330432.7 ENST00000360422.4 |
OPRM1 |
opioid receptor, mu 1 |
| chr14_+_96039882 | 0.03 |
ENST00000556346.1 ENST00000553785.1 |
RP11-1070N10.4 |
RP11-1070N10.4 |
| chr14_-_106478603 | 0.03 |
ENST00000390596.2 |
IGHV4-4 |
immunoglobulin heavy variable 4-4 |
| chr4_+_158141806 | 0.02 |
ENST00000393815.2 |
GRIA2 |
glutamate receptor, ionotropic, AMPA 2 |
| chr5_+_175298674 | 0.02 |
ENST00000514150.1 |
CPLX2 |
complexin 2 |
| chr4_+_158141843 | 0.02 |
ENST00000509417.1 ENST00000296526.7 |
GRIA2 |
glutamate receptor, ionotropic, AMPA 2 |
| chr14_-_51561784 | 0.02 |
ENST00000360392.4 |
TRIM9 |
tripartite motif containing 9 |
| chr19_+_4769117 | 0.01 |
ENST00000540211.1 ENST00000317292.3 ENST00000586721.1 ENST00000592709.1 ENST00000588711.1 ENST00000589639.1 ENST00000591008.1 ENST00000592663.1 ENST00000588758.1 |
MIR7-3HG |
MIR7-3 host gene (non-protein coding) |
| chr3_+_9745487 | 0.01 |
ENST00000383832.3 |
CPNE9 |
copine family member IX |
| chr4_+_8582287 | 0.01 |
ENST00000382487.4 |
GPR78 |
G protein-coupled receptor 78 |
| chr14_-_74892805 | 0.01 |
ENST00000331628.3 ENST00000554953.1 |
SYNDIG1L |
synapse differentiation inducing 1-like |
| chr1_+_210111534 | 0.01 |
ENST00000422431.1 ENST00000534859.1 ENST00000399639.2 ENST00000537238.1 |
SYT14 |
synaptotagmin XIV |
| chr20_-_60795316 | 0.01 |
ENST00000317393.6 |
HRH3 |
histamine receptor H3 |
| chr12_+_119419294 | 0.01 |
ENST00000267260.4 |
SRRM4 |
serine/arginine repetitive matrix 4 |
| chr3_-_131753830 | 0.01 |
ENST00000429747.1 |
CPNE4 |
copine IV |
| chr22_+_23054174 | 0.01 |
ENST00000390308.2 |
IGLV3-21 |
immunoglobulin lambda variable 3-21 |
| chr10_+_99609996 | 0.01 |
ENST00000370602.1 |
GOLGA7B |
golgin A7 family, member B |
| chr12_+_113796347 | 0.01 |
ENST00000545182.2 ENST00000280800.3 |
PLBD2 |
phospholipase B domain containing 2 |
| chrX_-_47479246 | 0.01 |
ENST00000295987.7 ENST00000340666.4 |
SYN1 |
synapsin I |
| chr7_+_150748288 | 0.01 |
ENST00000490540.1 |
ASIC3 |
acid-sensing (proton-gated) ion channel 3 |
| chr10_+_26505179 | 0.00 |
ENST00000376261.3 |
GAD2 |
glutamate decarboxylase 2 (pancreatic islets and brain, 65kDa) |
| chr1_-_151689259 | 0.00 |
ENST00000420342.1 ENST00000290583.4 |
CELF3 |
CUGBP, Elav-like family member 3 |
| chr5_-_176037105 | 0.00 |
ENST00000303991.4 |
GPRIN1 |
G protein regulated inducer of neurite outgrowth 1 |
| chr18_-_40857493 | 0.00 |
ENST00000255224.3 |
SYT4 |
synaptotagmin IV |
Gene Ontology Analysis
Gene overrepresentation in biological_process category:
| Log-likelihood per target | Total log-likelihood | Term | Description |
|---|---|---|---|
| 0.1 | 0.4 | GO:0071109 | superior temporal gyrus development(GO:0071109) |
| 0.1 | 0.3 | GO:0021722 | superior olivary nucleus development(GO:0021718) superior olivary nucleus maturation(GO:0021722) |
| 0.1 | 0.2 | GO:2000974 | trochlear nerve development(GO:0021558) auditory receptor cell fate determination(GO:0042668) negative regulation of auditory receptor cell differentiation(GO:0045608) regulation of timing of neuron differentiation(GO:0060164) negative regulation of pro-B cell differentiation(GO:2000974) |
| 0.1 | 0.2 | GO:0007198 | adenylate cyclase-inhibiting serotonin receptor signaling pathway(GO:0007198) |
| 0.1 | 0.5 | GO:0097116 | gephyrin clustering involved in postsynaptic density assembly(GO:0097116) |
| 0.1 | 0.2 | GO:0050883 | musculoskeletal movement, spinal reflex action(GO:0050883) |
| 0.0 | 0.3 | GO:0035502 | metanephric part of ureteric bud development(GO:0035502) |
| 0.0 | 0.2 | GO:1903237 | negative regulation of leukocyte tethering or rolling(GO:1903237) |
| 0.0 | 0.2 | GO:0035021 | negative regulation of Rac protein signal transduction(GO:0035021) |
| 0.0 | 0.1 | GO:0001550 | ovarian cumulus expansion(GO:0001550) fused antrum stage(GO:0048165) |
| 0.0 | 0.1 | GO:0061110 | dense core granule biogenesis(GO:0061110) positive regulation of relaxation of cardiac muscle(GO:1901899) regulation of dense core granule biogenesis(GO:2000705) |
| 0.0 | 0.2 | GO:0043129 | surfactant homeostasis(GO:0043129) |
| 0.0 | 0.1 | GO:0009405 | pathogenesis(GO:0009405) |
| 0.0 | 0.3 | GO:0032782 | bile acid secretion(GO:0032782) |
| 0.0 | 0.1 | GO:1990481 | mRNA pseudouridine synthesis(GO:1990481) |
| 0.0 | 0.1 | GO:0019046 | release from viral latency(GO:0019046) |
| 0.0 | 0.0 | GO:2000824 | negative regulation of androgen receptor activity(GO:2000824) |
| 0.0 | 0.1 | GO:0071393 | cellular response to progesterone stimulus(GO:0071393) |
| 0.0 | 0.1 | GO:0015808 | L-alanine transport(GO:0015808) |
| 0.0 | 0.2 | GO:0016188 | synaptic vesicle maturation(GO:0016188) |
| 0.0 | 0.0 | GO:0060084 | synaptic transmission involved in micturition(GO:0060084) |
| 0.0 | 0.5 | GO:0006099 | tricarboxylic acid cycle(GO:0006099) |
| 0.0 | 0.8 | GO:0045773 | positive regulation of axon extension(GO:0045773) |
Gene overrepresentation in cellular_component category:
| Log-likelihood per target | Total log-likelihood | Term | Description |
|---|---|---|---|
| 0.1 | 0.3 | GO:0016533 | cyclin-dependent protein kinase 5 holoenzyme complex(GO:0016533) |
| 0.0 | 0.5 | GO:0045252 | oxoglutarate dehydrogenase complex(GO:0045252) |
| 0.0 | 0.6 | GO:0044295 | axonal growth cone(GO:0044295) |
| 0.0 | 0.4 | GO:0033010 | paranodal junction(GO:0033010) |
| 0.0 | 0.3 | GO:0046581 | intercellular canaliculus(GO:0046581) |
| 0.0 | 0.1 | GO:0070554 | synaptobrevin 2-SNAP-25-syntaxin-3-complexin complex(GO:0070554) |
| 0.0 | 0.2 | GO:0030123 | AP-3 adaptor complex(GO:0030123) |
Gene overrepresentation in molecular_function category:
| Log-likelihood per target | Total log-likelihood | Term | Description |
|---|---|---|---|
| 0.1 | 0.3 | GO:0016534 | cyclin-dependent protein kinase 5 activator activity(GO:0016534) |
| 0.1 | 0.5 | GO:0004591 | oxoglutarate dehydrogenase (succinyl-transferring) activity(GO:0004591) |
| 0.1 | 0.3 | GO:0005499 | vitamin D binding(GO:0005499) |
| 0.0 | 0.5 | GO:0097109 | neuroligin family protein binding(GO:0097109) |
| 0.0 | 0.1 | GO:0015173 | aromatic amino acid transmembrane transporter activity(GO:0015173) |
| 0.0 | 0.2 | GO:0001591 | dopamine neurotransmitter receptor activity, coupled via Gi/Go(GO:0001591) |
| 0.0 | 0.2 | GO:0043176 | amine binding(GO:0043176) serotonin binding(GO:0051378) |
| 0.0 | 0.2 | GO:0008430 | selenium binding(GO:0008430) |
| 0.0 | 0.1 | GO:0005025 | transforming growth factor beta receptor activity, type I(GO:0005025) |
| 0.0 | 0.2 | GO:0045236 | CXCR chemokine receptor binding(GO:0045236) |
| 0.0 | 0.0 | GO:0035939 | microsatellite binding(GO:0035939) |
Gene overrepresentation in C2:CP category:
| Log-likelihood per target | Total log-likelihood | Term | Description |
|---|---|---|---|
| 0.0 | 0.8 | PID INTEGRIN3 PATHWAY | Beta3 integrin cell surface interactions |
Gene overrepresentation in C2:CP:REACTOME category:
| Log-likelihood per target | Total log-likelihood | Term | Description |
|---|---|---|---|
| 0.0 | 0.7 | REACTOME INTERACTION BETWEEN L1 AND ANKYRINS | Genes involved in Interaction between L1 and Ankyrins |
| 0.0 | 0.2 | REACTOME SEROTONIN RECEPTORS | Genes involved in Serotonin receptors |
| 0.0 | 0.3 | REACTOME CRMPS IN SEMA3A SIGNALING | Genes involved in CRMPs in Sema3A signaling |