Project
Epithelial-Mesenchymal Transition, human (Scheel, 2011)
Navigation
Downloads
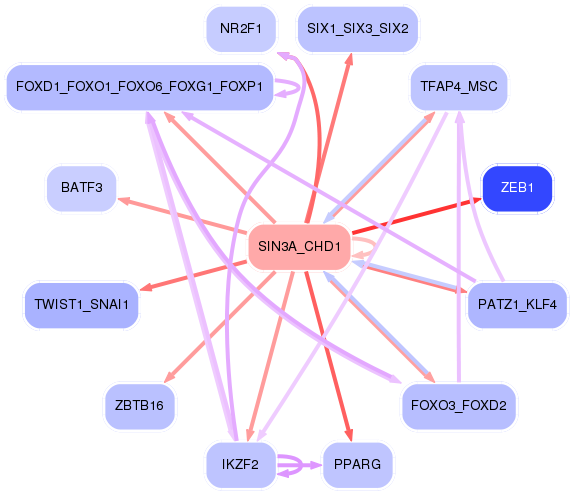
Results for SIN3A_CHD1
Z-value: 2.14
Motif logo
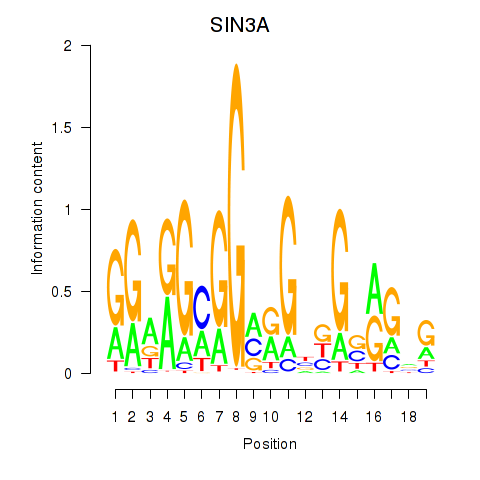
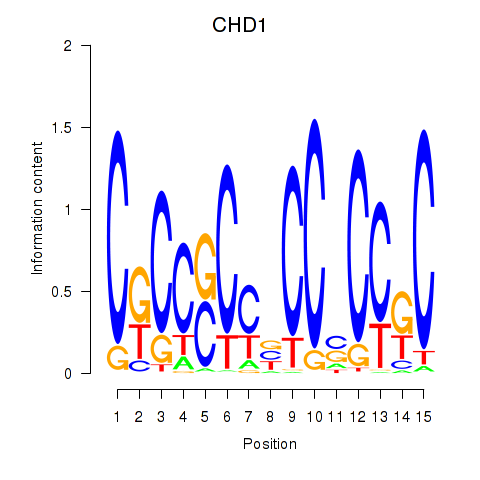
Transcription factors associated with SIN3A_CHD1
| Gene Symbol | Gene ID | Gene Info |
|---|---|---|
|
SIN3A
|
ENSG00000169375.11 | SIN3A |
|
CHD1
|
ENSG00000153922.6 | CHD1 |
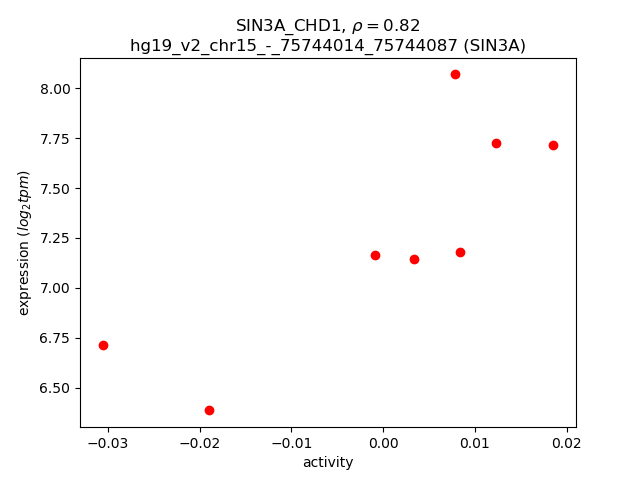
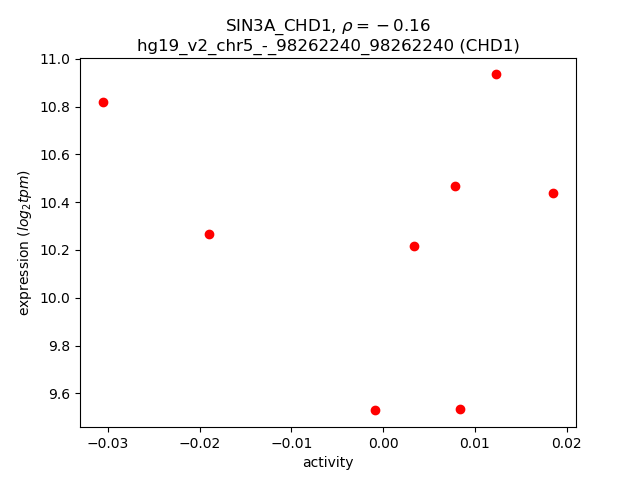
Activity-expression correlation:
| Gene | Promoter | Pearson corr. coef. | P-value | Plot |
|---|---|---|---|---|
| SIN3A | hg19_v2_chr15_-_75744014_75744087 | 0.82 | 1.4e-02 | Click! |
| CHD1 | hg19_v2_chr5_-_98262240_98262240 | -0.16 | 7.1e-01 | Click! |
Activity profile of SIN3A_CHD1 motif
Sorted Z-values of SIN3A_CHD1 motif
Network of associatons between targets according to the STRING database.

First level regulatory network of SIN3A_CHD1
| Promoter | Score | Transcript | Gene | Gene Info |
|---|---|---|---|---|
| chrX_+_16964794 | 6.34 |
ENST00000357277.3 |
REPS2 |
RALBP1 associated Eps domain containing 2 |
| chrX_+_16964985 | 6.13 |
ENST00000303843.7 |
REPS2 |
RALBP1 associated Eps domain containing 2 |
| chr4_+_145567297 | 4.50 |
ENST00000434550.2 |
HHIP |
hedgehog interacting protein |
| chr10_-_79397479 | 4.34 |
ENST00000404771.3 |
KCNMA1 |
potassium large conductance calcium-activated channel, subfamily M, alpha member 1 |
| chr4_+_145567173 | 3.94 |
ENST00000296575.3 |
HHIP |
hedgehog interacting protein |
| chr10_-_79397202 | 3.78 |
ENST00000372437.1 ENST00000372408.2 ENST00000372403.4 |
KCNMA1 |
potassium large conductance calcium-activated channel, subfamily M, alpha member 1 |
| chr10_+_31608054 | 3.67 |
ENST00000320985.10 ENST00000361642.5 ENST00000560721.2 ENST00000558440.1 ENST00000424869.1 ENST00000542815.3 |
ZEB1 |
zinc finger E-box binding homeobox 1 |
| chr10_-_79397316 | 3.59 |
ENST00000372421.5 ENST00000457953.1 |
KCNMA1 |
potassium large conductance calcium-activated channel, subfamily M, alpha member 1 |
| chr10_-_79397391 | 3.52 |
ENST00000286628.8 ENST00000406533.3 ENST00000354353.5 ENST00000404857.1 |
KCNMA1 |
potassium large conductance calcium-activated channel, subfamily M, alpha member 1 |
| chr12_-_58131931 | 3.51 |
ENST00000547588.1 |
AGAP2 |
ArfGAP with GTPase domain, ankyrin repeat and PH domain 2 |
| chr10_-_79397740 | 3.38 |
ENST00000372440.1 ENST00000480683.1 |
KCNMA1 |
potassium large conductance calcium-activated channel, subfamily M, alpha member 1 |
| chr6_-_46459099 | 3.22 |
ENST00000371374.1 |
RCAN2 |
regulator of calcineurin 2 |
| chrX_+_152760397 | 3.04 |
ENST00000331595.4 ENST00000431891.1 |
BGN |
biglycan |
| chr8_-_60031762 | 2.83 |
ENST00000361421.1 |
TOX |
thymocyte selection-associated high mobility group box |
| chr5_+_71403061 | 2.75 |
ENST00000512974.1 ENST00000296755.7 |
MAP1B |
microtubule-associated protein 1B |
| chr3_+_12329358 | 2.63 |
ENST00000309576.6 |
PPARG |
peroxisome proliferator-activated receptor gamma |
| chr3_+_12329397 | 2.59 |
ENST00000397015.2 |
PPARG |
peroxisome proliferator-activated receptor gamma |
| chr2_+_23608064 | 2.55 |
ENST00000486442.1 |
KLHL29 |
kelch-like family member 29 |
| chr2_+_33172221 | 2.54 |
ENST00000354476.3 |
LTBP1 |
latent transforming growth factor beta binding protein 1 |
| chr8_+_97506033 | 2.50 |
ENST00000518385.1 |
SDC2 |
syndecan 2 |
| chr5_+_92919043 | 2.39 |
ENST00000327111.3 |
NR2F1 |
nuclear receptor subfamily 2, group F, member 1 |
| chr2_-_200323414 | 2.39 |
ENST00000443023.1 |
SATB2 |
SATB homeobox 2 |
| chr14_-_30396802 | 2.33 |
ENST00000415220.2 |
PRKD1 |
protein kinase D1 |
| chr8_+_17434689 | 2.32 |
ENST00000398074.3 |
PDGFRL |
platelet-derived growth factor receptor-like |
| chr2_-_200322723 | 2.28 |
ENST00000417098.1 |
SATB2 |
SATB homeobox 2 |
| chr1_+_215256467 | 2.27 |
ENST00000391894.2 ENST00000444842.2 |
KCNK2 |
potassium channel, subfamily K, member 2 |
| chr7_+_100199800 | 2.16 |
ENST00000223061.5 |
PCOLCE |
procollagen C-endopeptidase enhancer |
| chr7_-_19157248 | 2.06 |
ENST00000242261.5 |
TWIST1 |
twist family bHLH transcription factor 1 |
| chr5_-_14871866 | 2.06 |
ENST00000284268.6 |
ANKH |
ANKH inorganic pyrophosphate transport regulator |
| chrX_+_153672468 | 2.05 |
ENST00000393600.3 |
FAM50A |
family with sequence similarity 50, member A |
| chr1_+_201617450 | 2.00 |
ENST00000295624.6 ENST00000367297.4 ENST00000367300.3 |
NAV1 |
neuron navigator 1 |
| chr14_-_61116168 | 1.97 |
ENST00000247182.6 |
SIX1 |
SIX homeobox 1 |
| chr3_+_20081515 | 1.93 |
ENST00000263754.4 |
KAT2B |
K(lysine) acetyltransferase 2B |
| chr5_-_107717058 | 1.90 |
ENST00000359660.5 |
FBXL17 |
F-box and leucine-rich repeat protein 17 |
| chr22_-_31741757 | 1.82 |
ENST00000215919.3 |
PATZ1 |
POZ (BTB) and AT hook containing zinc finger 1 |
| chr18_-_70535177 | 1.81 |
ENST00000327305.6 |
NETO1 |
neuropilin (NRP) and tolloid (TLL)-like 1 |
| chr16_+_12995614 | 1.79 |
ENST00000423335.2 |
SHISA9 |
shisa family member 9 |
| chr8_-_38325219 | 1.75 |
ENST00000533668.1 ENST00000413133.2 ENST00000397108.4 ENST00000526742.1 ENST00000525001.1 ENST00000425967.3 ENST00000529552.1 ENST00000397113.2 |
FGFR1 |
fibroblast growth factor receptor 1 |
| chr8_+_37654693 | 1.71 |
ENST00000412232.2 |
GPR124 |
G protein-coupled receptor 124 |
| chr5_+_172068232 | 1.71 |
ENST00000520919.1 ENST00000522853.1 ENST00000369800.5 |
NEURL1B |
neuralized E3 ubiquitin protein ligase 1B |
| chr5_+_95066823 | 1.70 |
ENST00000506817.1 ENST00000379982.3 |
RHOBTB3 |
Rho-related BTB domain containing 3 |
| chr9_-_120177342 | 1.69 |
ENST00000361209.2 |
ASTN2 |
astrotactin 2 |
| chr12_-_29936731 | 1.60 |
ENST00000552618.1 ENST00000539277.1 ENST00000551659.1 |
TMTC1 |
transmembrane and tetratricopeptide repeat containing 1 |
| chr17_+_78234625 | 1.59 |
ENST00000508628.2 ENST00000582970.1 ENST00000456466.1 ENST00000319921.4 |
RNF213 |
ring finger protein 213 |
| chr8_+_37654424 | 1.59 |
ENST00000315215.7 |
GPR124 |
G protein-coupled receptor 124 |
| chr17_+_64298944 | 1.57 |
ENST00000413366.3 |
PRKCA |
protein kinase C, alpha |
| chr1_+_159141397 | 1.57 |
ENST00000368124.4 ENST00000368125.4 ENST00000416746.1 |
CADM3 |
cell adhesion molecule 3 |
| chr9_-_120177216 | 1.56 |
ENST00000373996.3 ENST00000313400.4 ENST00000361477.3 |
ASTN2 |
astrotactin 2 |
| chr2_+_148778570 | 1.55 |
ENST00000407073.1 |
MBD5 |
methyl-CpG binding domain protein 5 |
| chr13_-_44361025 | 1.55 |
ENST00000261488.6 |
ENOX1 |
ecto-NOX disulfide-thiol exchanger 1 |
| chr7_-_50861129 | 1.54 |
ENST00000439044.1 ENST00000402497.1 ENST00000335866.3 |
GRB10 |
growth factor receptor-bound protein 10 |
| chr4_+_15004165 | 1.54 |
ENST00000538197.1 ENST00000541112.1 ENST00000442003.2 |
CPEB2 |
cytoplasmic polyadenylation element binding protein 2 |
| chr4_+_15005391 | 1.54 |
ENST00000507071.1 ENST00000345451.3 ENST00000259997.5 ENST00000382395.3 ENST00000382401.3 |
CPEB2 |
cytoplasmic polyadenylation element binding protein 2 |
| chr13_+_88324870 | 1.46 |
ENST00000325089.6 |
SLITRK5 |
SLIT and NTRK-like family, member 5 |
| chr5_-_9546180 | 1.45 |
ENST00000382496.5 |
SEMA5A |
sema domain, seven thrombospondin repeats (type 1 and type 1-like), transmembrane domain (TM) and short cytoplasmic domain, (semaphorin) 5A |
| chr5_-_168727786 | 1.44 |
ENST00000332966.8 |
SLIT3 |
slit homolog 3 (Drosophila) |
| chr19_-_31840438 | 1.44 |
ENST00000240587.4 |
TSHZ3 |
teashirt zinc finger homeobox 3 |
| chr1_+_201617264 | 1.44 |
ENST00000367296.4 |
NAV1 |
neuron navigator 1 |
| chr6_-_153452356 | 1.44 |
ENST00000206262.1 |
RGS17 |
regulator of G-protein signaling 17 |
| chr5_+_139027877 | 1.43 |
ENST00000302517.3 |
CXXC5 |
CXXC finger protein 5 |
| chr11_-_2160180 | 1.43 |
ENST00000381406.4 |
IGF2 |
insulin-like growth factor 2 (somatomedin A) |
| chr17_+_38599693 | 1.43 |
ENST00000542955.1 ENST00000269593.4 |
IGFBP4 |
insulin-like growth factor binding protein 4 |
| chr2_-_68547061 | 1.42 |
ENST00000263655.3 |
CNRIP1 |
cannabinoid receptor interacting protein 1 |
| chr12_+_90102729 | 1.41 |
ENST00000605386.1 |
LINC00936 |
long intergenic non-protein coding RNA 936 |
| chr11_-_2160611 | 1.40 |
ENST00000416167.2 |
IGF2 |
insulin-like growth factor 2 (somatomedin A) |
| chr2_-_225907150 | 1.37 |
ENST00000258390.7 |
DOCK10 |
dedicator of cytokinesis 10 |
| chr5_-_111093759 | 1.37 |
ENST00000509979.1 ENST00000513100.1 ENST00000508161.1 ENST00000455559.2 |
NREP |
neuronal regeneration related protein |
| chr1_+_210406121 | 1.37 |
ENST00000367012.3 |
SERTAD4 |
SERTA domain containing 4 |
| chr13_-_77460525 | 1.35 |
ENST00000377474.2 ENST00000317765.2 |
KCTD12 |
potassium channel tetramerization domain containing 12 |
| chr10_+_76585303 | 1.35 |
ENST00000372725.1 |
KAT6B |
K(lysine) acetyltransferase 6B |
| chr19_+_14544099 | 1.34 |
ENST00000242783.6 ENST00000586557.1 ENST00000590097.1 |
PKN1 |
protein kinase N1 |
| chr5_-_127873659 | 1.34 |
ENST00000262464.4 |
FBN2 |
fibrillin 2 |
| chr9_+_36036430 | 1.33 |
ENST00000377966.3 |
RECK |
reversion-inducing-cysteine-rich protein with kazal motifs |
| chr21_+_47401650 | 1.33 |
ENST00000361866.3 |
COL6A1 |
collagen, type VI, alpha 1 |
| chr20_+_34742650 | 1.31 |
ENST00000373945.1 ENST00000338074.2 |
EPB41L1 |
erythrocyte membrane protein band 4.1-like 1 |
| chr1_+_183605200 | 1.30 |
ENST00000304685.4 |
RGL1 |
ral guanine nucleotide dissociation stimulator-like 1 |
| chr1_-_32403903 | 1.30 |
ENST00000344035.6 ENST00000356536.3 |
PTP4A2 |
protein tyrosine phosphatase type IVA, member 2 |
| chr12_+_53440753 | 1.28 |
ENST00000379902.3 |
TENC1 |
tensin like C1 domain containing phosphatase (tensin 2) |
| chr16_+_2039946 | 1.27 |
ENST00000248121.2 ENST00000568896.1 |
SYNGR3 |
synaptogyrin 3 |
| chr8_+_16884740 | 1.27 |
ENST00000318063.5 |
MICU3 |
mitochondrial calcium uptake family, member 3 |
| chr1_+_78354297 | 1.26 |
ENST00000334785.7 |
NEXN |
nexilin (F actin binding protein) |
| chr14_-_30396948 | 1.24 |
ENST00000331968.5 |
PRKD1 |
protein kinase D1 |
| chr9_-_113800341 | 1.24 |
ENST00000358883.4 |
LPAR1 |
lysophosphatidic acid receptor 1 |
| chr5_-_81046841 | 1.24 |
ENST00000509013.2 ENST00000505980.1 ENST00000509053.1 |
SSBP2 |
single-stranded DNA binding protein 2 |
| chr2_-_160919112 | 1.23 |
ENST00000283243.7 ENST00000392771.1 |
PLA2R1 |
phospholipase A2 receptor 1, 180kDa |
| chr19_+_36359341 | 1.22 |
ENST00000221891.4 |
APLP1 |
amyloid beta (A4) precursor-like protein 1 |
| chr1_-_212873267 | 1.22 |
ENST00000243440.1 |
BATF3 |
basic leucine zipper transcription factor, ATF-like 3 |
| chr7_+_8008418 | 1.22 |
ENST00000223145.5 |
GLCCI1 |
glucocorticoid induced transcript 1 |
| chr1_-_72748417 | 1.22 |
ENST00000357731.5 |
NEGR1 |
neuronal growth regulator 1 |
| chr2_-_145090035 | 1.21 |
ENST00000542155.1 ENST00000241391.5 ENST00000463875.2 |
GTDC1 |
glycosyltransferase-like domain containing 1 |
| chr11_-_70507901 | 1.21 |
ENST00000449833.2 ENST00000357171.3 ENST00000449116.2 |
SHANK2 |
SH3 and multiple ankyrin repeat domains 2 |
| chr4_-_7044657 | 1.18 |
ENST00000310085.4 |
CCDC96 |
coiled-coil domain containing 96 |
| chr7_+_94023873 | 1.18 |
ENST00000297268.6 |
COL1A2 |
collagen, type I, alpha 2 |
| chr5_+_110559784 | 1.17 |
ENST00000282356.4 |
CAMK4 |
calcium/calmodulin-dependent protein kinase IV |
| chr1_+_211432775 | 1.16 |
ENST00000419091.2 |
RCOR3 |
REST corepressor 3 |
| chr8_-_72756667 | 1.16 |
ENST00000325509.4 |
MSC |
musculin |
| chr2_-_214014959 | 1.16 |
ENST00000442445.1 ENST00000457361.1 ENST00000342002.2 |
IKZF2 |
IKAROS family zinc finger 2 (Helios) |
| chr5_-_81046904 | 1.15 |
ENST00000515395.1 |
SSBP2 |
single-stranded DNA binding protein 2 |
| chr9_-_95186739 | 1.15 |
ENST00000375550.4 |
OMD |
osteomodulin |
| chr11_+_113930291 | 1.15 |
ENST00000335953.4 |
ZBTB16 |
zinc finger and BTB domain containing 16 |
| chr5_+_60628074 | 1.14 |
ENST00000252744.5 |
ZSWIM6 |
zinc finger, SWIM-type containing 6 |
| chr7_+_44143925 | 1.14 |
ENST00000223357.3 |
AEBP1 |
AE binding protein 1 |
| chr7_-_131241361 | 1.13 |
ENST00000378555.3 ENST00000322985.9 ENST00000541194.1 ENST00000537928.1 |
PODXL |
podocalyxin-like |
| chr12_-_63328817 | 1.13 |
ENST00000228705.6 |
PPM1H |
protein phosphatase, Mg2+/Mn2+ dependent, 1H |
| chr14_+_29236269 | 1.12 |
ENST00000313071.4 |
FOXG1 |
forkhead box G1 |
| chr17_-_46115122 | 1.11 |
ENST00000006101.4 |
COPZ2 |
coatomer protein complex, subunit zeta 2 |
| chr3_-_15901278 | 1.10 |
ENST00000399451.2 |
ANKRD28 |
ankyrin repeat domain 28 |
| chr12_+_7023735 | 1.10 |
ENST00000538763.1 ENST00000544774.1 ENST00000545045.2 |
ENO2 |
enolase 2 (gamma, neuronal) |
| chr10_-_21463116 | 1.10 |
ENST00000417816.2 |
NEBL |
nebulette |
| chr11_-_63381925 | 1.09 |
ENST00000415826.1 |
PLA2G16 |
phospholipase A2, group XVI |
| chr1_+_78354175 | 1.09 |
ENST00000401035.3 ENST00000457030.1 ENST00000330010.8 |
NEXN |
nexilin (F actin binding protein) |
| chr1_-_182361327 | 1.08 |
ENST00000331872.6 ENST00000311223.5 |
GLUL |
glutamate-ammonia ligase |
| chr20_+_34894247 | 1.08 |
ENST00000373913.3 |
DLGAP4 |
discs, large (Drosophila) homolog-associated protein 4 |
| chr2_-_145275228 | 1.05 |
ENST00000427902.1 ENST00000409487.3 ENST00000470879.1 ENST00000435831.1 |
ZEB2 |
zinc finger E-box binding homeobox 2 |
| chr4_-_57522470 | 1.05 |
ENST00000503639.3 |
HOPX |
HOP homeobox |
| chrX_+_149531524 | 1.05 |
ENST00000370401.2 |
MAMLD1 |
mastermind-like domain containing 1 |
| chr6_+_108882069 | 1.05 |
ENST00000406360.1 |
FOXO3 |
forkhead box O3 |
| chr8_-_95907423 | 1.05 |
ENST00000396133.3 ENST00000308108.4 |
CCNE2 |
cyclin E2 |
| chr7_-_139477500 | 1.04 |
ENST00000406875.3 ENST00000428878.2 |
HIPK2 |
homeodomain interacting protein kinase 2 |
| chr14_-_60337684 | 1.04 |
ENST00000267484.5 |
RTN1 |
reticulon 1 |
| chr2_+_33172012 | 1.03 |
ENST00000404816.2 |
LTBP1 |
latent transforming growth factor beta binding protein 1 |
| chrX_-_107018969 | 1.03 |
ENST00000372383.4 |
TSC22D3 |
TSC22 domain family, member 3 |
| chr5_+_67511524 | 1.02 |
ENST00000521381.1 ENST00000521657.1 |
PIK3R1 |
phosphoinositide-3-kinase, regulatory subunit 1 (alpha) |
| chr16_+_55512742 | 1.02 |
ENST00000568715.1 ENST00000219070.4 |
MMP2 |
matrix metallopeptidase 2 (gelatinase A, 72kDa gelatinase, 72kDa type IV collagenase) |
| chr10_+_72972281 | 1.02 |
ENST00000335350.6 |
UNC5B |
unc-5 homolog B (C. elegans) |
| chr19_+_16435625 | 1.01 |
ENST00000248071.5 ENST00000592003.1 |
KLF2 |
Kruppel-like factor 2 |
| chr5_+_156693091 | 1.01 |
ENST00000318218.6 ENST00000442283.2 ENST00000522463.1 ENST00000521420.1 |
CYFIP2 |
cytoplasmic FMR1 interacting protein 2 |
| chr11_-_74109422 | 1.00 |
ENST00000298198.4 |
PGM2L1 |
phosphoglucomutase 2-like 1 |
| chr7_+_90893783 | 1.00 |
ENST00000287934.2 |
FZD1 |
frizzled family receptor 1 |
| chr5_+_82767583 | 0.99 |
ENST00000512590.2 ENST00000513960.1 ENST00000513984.1 ENST00000502527.2 |
VCAN |
versican |
| chr19_+_49458107 | 0.99 |
ENST00000539787.1 ENST00000345358.7 ENST00000391871.3 ENST00000415969.2 ENST00000354470.3 ENST00000506183.1 ENST00000293288.8 |
BAX |
BCL2-associated X protein |
| chr19_+_36631867 | 0.99 |
ENST00000588780.1 |
CAPNS1 |
calpain, small subunit 1 |
| chr17_+_68165657 | 0.98 |
ENST00000243457.3 |
KCNJ2 |
potassium inwardly-rectifying channel, subfamily J, member 2 |
| chr12_+_53443963 | 0.98 |
ENST00000546602.1 ENST00000552570.1 ENST00000549700.1 |
TENC1 |
tensin like C1 domain containing phosphatase (tensin 2) |
| chrX_+_9433048 | 0.97 |
ENST00000217964.7 |
TBL1X |
transducin (beta)-like 1X-linked |
| chr11_-_77184739 | 0.97 |
ENST00000524847.1 |
PAK1 |
p21 protein (Cdc42/Rac)-activated kinase 1 |
| chr11_-_9286921 | 0.96 |
ENST00000328194.3 |
DENND5A |
DENN/MADD domain containing 5A |
| chr9_-_96213828 | 0.95 |
ENST00000423591.1 |
FAM120AOS |
family with sequence similarity 120A opposite strand |
| chr1_+_211432700 | 0.95 |
ENST00000452621.2 |
RCOR3 |
REST corepressor 3 |
| chrX_-_107019181 | 0.94 |
ENST00000315660.4 ENST00000372384.2 ENST00000502650.1 ENST00000506724.1 |
TSC22D3 |
TSC22 domain family, member 3 |
| chr5_-_81046922 | 0.94 |
ENST00000514493.1 ENST00000320672.4 |
SSBP2 |
single-stranded DNA binding protein 2 |
| chr13_-_80915059 | 0.93 |
ENST00000377104.3 |
SPRY2 |
sprouty homolog 2 (Drosophila) |
| chr20_-_30458491 | 0.93 |
ENST00000339738.5 |
DUSP15 |
dual specificity phosphatase 15 |
| chr5_+_82767487 | 0.93 |
ENST00000343200.5 ENST00000342785.4 |
VCAN |
versican |
| chr1_+_145477060 | 0.93 |
ENST00000369308.3 |
LIX1L |
Lix1 homolog (mouse)-like |
| chr5_+_172261228 | 0.92 |
ENST00000393784.3 |
ERGIC1 |
endoplasmic reticulum-golgi intermediate compartment (ERGIC) 1 |
| chr2_+_10442993 | 0.92 |
ENST00000423674.1 ENST00000307845.3 |
HPCAL1 |
hippocalcin-like 1 |
| chr18_+_2655849 | 0.92 |
ENST00000261598.8 |
SMCHD1 |
structural maintenance of chromosomes flexible hinge domain containing 1 |
| chr6_+_36164487 | 0.91 |
ENST00000357641.6 |
BRPF3 |
bromodomain and PHD finger containing, 3 |
| chr13_+_35516390 | 0.91 |
ENST00000540320.1 ENST00000400445.3 ENST00000310336.4 |
NBEA |
neurobeachin |
| chr5_-_168728103 | 0.91 |
ENST00000519560.1 |
SLIT3 |
slit homolog 3 (Drosophila) |
| chr12_+_53443680 | 0.91 |
ENST00000314250.6 ENST00000451358.1 |
TENC1 |
tensin like C1 domain containing phosphatase (tensin 2) |
| chr4_-_119274121 | 0.91 |
ENST00000296498.3 |
PRSS12 |
protease, serine, 12 (neurotrypsin, motopsin) |
| chr1_+_183774240 | 0.90 |
ENST00000360851.3 |
RGL1 |
ral guanine nucleotide dissociation stimulator-like 1 |
| chr6_-_88876058 | 0.90 |
ENST00000369501.2 |
CNR1 |
cannabinoid receptor 1 (brain) |
| chr11_-_27722021 | 0.90 |
ENST00000356660.4 ENST00000418212.1 ENST00000533246.1 |
BDNF |
brain-derived neurotrophic factor |
| chr17_+_55333876 | 0.90 |
ENST00000284073.2 |
MSI2 |
musashi RNA-binding protein 2 |
| chr5_-_171711061 | 0.89 |
ENST00000393792.2 |
UBTD2 |
ubiquitin domain containing 2 |
| chr4_-_125633876 | 0.89 |
ENST00000504087.1 ENST00000515641.1 |
ANKRD50 |
ankyrin repeat domain 50 |
| chr1_+_43148625 | 0.89 |
ENST00000436427.1 |
YBX1 |
Y box binding protein 1 |
| chr1_+_178063271 | 0.88 |
ENST00000367649.3 |
RASAL2 |
RAS protein activator like 2 |
| chr20_-_39946237 | 0.88 |
ENST00000441102.2 ENST00000559234.1 |
ZHX3 |
zinc fingers and homeoboxes 3 |
| chr1_+_211432593 | 0.88 |
ENST00000367006.4 |
RCOR3 |
REST corepressor 3 |
| chr1_-_11751665 | 0.88 |
ENST00000376667.3 ENST00000235310.3 |
MAD2L2 |
MAD2 mitotic arrest deficient-like 2 (yeast) |
| chr2_-_19558373 | 0.87 |
ENST00000272223.2 |
OSR1 |
odd-skipped related transciption factor 1 |
| chr9_-_89562104 | 0.87 |
ENST00000298743.7 |
GAS1 |
growth arrest-specific 1 |
| chr20_+_44462481 | 0.87 |
ENST00000491381.1 ENST00000342644.5 ENST00000372542.1 |
SNX21 |
sorting nexin family member 21 |
| chr6_-_167040731 | 0.87 |
ENST00000265678.4 |
RPS6KA2 |
ribosomal protein S6 kinase, 90kDa, polypeptide 2 |
| chrX_-_142722897 | 0.87 |
ENST00000338017.4 |
SLITRK4 |
SLIT and NTRK-like family, member 4 |
| chr12_-_96794143 | 0.86 |
ENST00000543119.2 |
CDK17 |
cyclin-dependent kinase 17 |
| chr5_+_82767284 | 0.86 |
ENST00000265077.3 |
VCAN |
versican |
| chr16_+_29818857 | 0.86 |
ENST00000567444.1 |
MAZ |
MYC-associated zinc finger protein (purine-binding transcription factor) |
| chr6_+_45390222 | 0.86 |
ENST00000359524.5 |
RUNX2 |
runt-related transcription factor 2 |
| chr18_-_60987220 | 0.86 |
ENST00000398117.1 |
BCL2 |
B-cell CLL/lymphoma 2 |
| chr1_-_182360498 | 0.86 |
ENST00000417584.2 |
GLUL |
glutamate-ammonia ligase |
| chr15_+_100347228 | 0.85 |
ENST00000559714.1 ENST00000560059.1 |
CTD-2054N24.2 |
Uncharacterized protein |
| chr10_+_12391481 | 0.85 |
ENST00000378847.3 |
CAMK1D |
calcium/calmodulin-dependent protein kinase ID |
| chr1_-_85930823 | 0.85 |
ENST00000284031.8 ENST00000539042.1 |
DDAH1 |
dimethylarginine dimethylaminohydrolase 1 |
| chr3_+_105086056 | 0.84 |
ENST00000472644.2 |
ALCAM |
activated leukocyte cell adhesion molecule |
| chr1_-_236228403 | 0.84 |
ENST00000366595.3 |
NID1 |
nidogen 1 |
| chr10_+_31610064 | 0.84 |
ENST00000446923.2 ENST00000559476.1 |
ZEB1 |
zinc finger E-box binding homeobox 1 |
| chr5_+_148521381 | 0.84 |
ENST00000504238.1 |
ABLIM3 |
actin binding LIM protein family, member 3 |
| chr2_-_230135937 | 0.83 |
ENST00000392054.3 ENST00000409462.1 ENST00000392055.3 |
PID1 |
phosphotyrosine interaction domain containing 1 |
| chr4_-_39640513 | 0.83 |
ENST00000511809.1 ENST00000505729.1 |
SMIM14 |
small integral membrane protein 14 |
| chrX_-_19140575 | 0.83 |
ENST00000357991.3 ENST00000356606.4 |
GPR64 |
G protein-coupled receptor 64 |
| chr6_+_72596604 | 0.83 |
ENST00000348717.5 ENST00000517960.1 ENST00000518273.1 ENST00000522291.1 ENST00000521978.1 ENST00000520567.1 ENST00000264839.7 |
RIMS1 |
regulating synaptic membrane exocytosis 1 |
| chr5_+_139028510 | 0.82 |
ENST00000502336.1 ENST00000520967.1 ENST00000511048.1 |
CXXC5 |
CXXC finger protein 5 |
| chr3_-_45267760 | 0.81 |
ENST00000503771.1 |
TMEM158 |
transmembrane protein 158 (gene/pseudogene) |
| chr6_-_85474219 | 0.81 |
ENST00000369663.5 |
TBX18 |
T-box 18 |
| chr5_-_59189545 | 0.81 |
ENST00000340635.6 |
PDE4D |
phosphodiesterase 4D, cAMP-specific |
| chr2_+_8822113 | 0.81 |
ENST00000396290.1 ENST00000331129.3 |
ID2 |
inhibitor of DNA binding 2, dominant negative helix-loop-helix protein |
| chr3_+_141121164 | 0.81 |
ENST00000510338.1 ENST00000504673.1 |
ZBTB38 |
zinc finger and BTB domain containing 38 |
| chr11_-_67888881 | 0.81 |
ENST00000356135.5 |
CHKA |
choline kinase alpha |
| chr9_+_91605778 | 0.80 |
ENST00000375851.2 ENST00000375850.3 ENST00000334490.5 |
C9orf47 |
chromosome 9 open reading frame 47 |
| chr14_+_100259666 | 0.80 |
ENST00000262233.6 ENST00000334192.4 |
EML1 |
echinoderm microtubule associated protein like 1 |
| chrX_-_135849484 | 0.80 |
ENST00000370620.1 ENST00000535227.1 |
ARHGEF6 |
Rac/Cdc42 guanine nucleotide exchange factor (GEF) 6 |
| chr17_-_42276574 | 0.80 |
ENST00000589805.1 |
ATXN7L3 |
ataxin 7-like 3 |
| chr1_+_89990431 | 0.80 |
ENST00000330947.2 ENST00000358200.4 |
LRRC8B |
leucine rich repeat containing 8 family, member B |
| chr11_+_77532233 | 0.79 |
ENST00000525409.1 |
AAMDC |
adipogenesis associated, Mth938 domain containing |
| chr8_-_91657740 | 0.79 |
ENST00000422900.1 |
TMEM64 |
transmembrane protein 64 |
Gene Ontology Analysis
Gene overrepresentation in biological_process category:
| Log-likelihood per target | Total log-likelihood | Term | Description |
|---|---|---|---|
| 1.7 | 18.6 | GO:0034465 | response to carbon monoxide(GO:0034465) |
| 1.3 | 5.2 | GO:2000230 | negative regulation of pancreatic stellate cell proliferation(GO:2000230) |
| 0.9 | 2.6 | GO:0006542 | glutamine biosynthetic process(GO:0006542) |
| 0.9 | 2.6 | GO:1903465 | vacuolar phosphate transport(GO:0007037) positive regulation of mitotic cell cycle DNA replication(GO:1903465) positive regulation of parathyroid hormone secretion(GO:2000830) |
| 0.9 | 2.6 | GO:0030505 | inorganic diphosphate transport(GO:0030505) |
| 0.8 | 2.5 | GO:0035359 | negative regulation of peroxisome proliferator activated receptor signaling pathway(GO:0035359) |
| 0.8 | 3.2 | GO:0048016 | inositol phosphate-mediated signaling(GO:0048016) |
| 0.8 | 3.1 | GO:1900247 | cytoplasmic translational elongation(GO:0002182) regulation of cytoplasmic translational elongation(GO:1900247) negative regulation of cytoplasmic translational elongation(GO:1900248) |
| 0.8 | 0.8 | GO:0060251 | regulation of glial cell proliferation(GO:0060251) positive regulation of glial cell proliferation(GO:0060252) |
| 0.8 | 2.3 | GO:1900039 | positive regulation of cellular response to hypoxia(GO:1900039) |
| 0.6 | 0.6 | GO:0097374 | sensory neuron axon guidance(GO:0097374) |
| 0.6 | 2.4 | GO:1904565 | response to 1-oleoyl-sn-glycerol 3-phosphate(GO:1904565) cellular response to 1-oleoyl-sn-glycerol 3-phosphate(GO:1904566) |
| 0.6 | 5.9 | GO:0035583 | sequestering of TGFbeta in extracellular matrix(GO:0035583) |
| 0.5 | 4.8 | GO:0061551 | trigeminal ganglion development(GO:0061551) |
| 0.5 | 1.6 | GO:2000705 | dense core granule biogenesis(GO:0061110) regulation of dense core granule biogenesis(GO:2000705) |
| 0.5 | 2.1 | GO:0042412 | taurine biosynthetic process(GO:0042412) |
| 0.5 | 2.5 | GO:2000312 | regulation of kainate selective glutamate receptor activity(GO:2000312) |
| 0.5 | 3.5 | GO:0051414 | response to cortisol(GO:0051414) |
| 0.5 | 4.5 | GO:0045602 | negative regulation of endothelial cell differentiation(GO:0045602) |
| 0.4 | 1.8 | GO:0035948 | positive regulation of gluconeogenesis by positive regulation of transcription from RNA polymerase II promoter(GO:0035948) |
| 0.4 | 2.5 | GO:0008218 | bioluminescence(GO:0008218) |
| 0.4 | 1.2 | GO:0032304 | negative regulation of icosanoid secretion(GO:0032304) |
| 0.4 | 2.5 | GO:0044339 | canonical Wnt signaling pathway involved in osteoblast differentiation(GO:0044339) |
| 0.4 | 0.4 | GO:0010159 | specification of organ position(GO:0010159) |
| 0.4 | 0.4 | GO:0090402 | oncogene-induced cell senescence(GO:0090402) |
| 0.4 | 1.5 | GO:0099552 | trans-synaptic signaling by lipid, modulating synaptic transmission(GO:0099552) trans-synaptic signaling by endocannabinoid, modulating synaptic transmission(GO:0099553) |
| 0.4 | 3.2 | GO:0038028 | insulin receptor signaling pathway via phosphatidylinositol 3-kinase(GO:0038028) |
| 0.3 | 1.0 | GO:0001544 | initiation of primordial ovarian follicle growth(GO:0001544) |
| 0.3 | 1.7 | GO:0071409 | cellular response to cycloheximide(GO:0071409) |
| 0.3 | 1.4 | GO:0051387 | negative regulation of neurotrophin TRK receptor signaling pathway(GO:0051387) |
| 0.3 | 1.0 | GO:0031548 | regulation of brain-derived neurotrophic factor receptor signaling pathway(GO:0031548) |
| 0.3 | 2.0 | GO:0060399 | positive regulation of growth hormone receptor signaling pathway(GO:0060399) |
| 0.3 | 0.3 | GO:0060599 | lateral sprouting involved in mammary gland duct morphogenesis(GO:0060599) |
| 0.3 | 0.3 | GO:0071461 | cellular response to redox state(GO:0071461) |
| 0.3 | 1.0 | GO:0002904 | B cell negative selection(GO:0002352) positive regulation of B cell apoptotic process(GO:0002904) post-embryonic camera-type eye morphogenesis(GO:0048597) |
| 0.3 | 1.0 | GO:0090076 | relaxation of skeletal muscle(GO:0090076) |
| 0.3 | 4.6 | GO:1901725 | regulation of histone deacetylase activity(GO:1901725) |
| 0.3 | 1.0 | GO:0014707 | branchiomeric skeletal muscle development(GO:0014707) |
| 0.3 | 1.8 | GO:0035407 | histone H3-T11 phosphorylation(GO:0035407) |
| 0.3 | 0.9 | GO:0090094 | metanephric cap development(GO:0072185) metanephric cap morphogenesis(GO:0072186) metanephric cap mesenchymal cell proliferation involved in metanephros development(GO:0090094) |
| 0.3 | 0.6 | GO:0060355 | positive regulation of cell adhesion molecule production(GO:0060355) |
| 0.3 | 1.7 | GO:0070086 | ubiquitin-dependent endocytosis(GO:0070086) |
| 0.3 | 0.3 | GO:0051495 | positive regulation of cytoskeleton organization(GO:0051495) |
| 0.3 | 1.4 | GO:0098728 | germ-line stem cell division(GO:0042078) male germ-line stem cell asymmetric division(GO:0048133) germline stem cell asymmetric division(GO:0098728) |
| 0.3 | 1.1 | GO:0033634 | positive regulation of cell-cell adhesion mediated by integrin(GO:0033634) |
| 0.3 | 1.4 | GO:0046898 | response to cycloheximide(GO:0046898) |
| 0.3 | 2.4 | GO:0070236 | negative regulation of activation-induced cell death of T cells(GO:0070236) |
| 0.3 | 0.8 | GO:0006535 | cysteine biosynthetic process from serine(GO:0006535) |
| 0.3 | 1.3 | GO:0048842 | positive regulation of axon extension involved in axon guidance(GO:0048842) |
| 0.3 | 2.4 | GO:0060235 | lens induction in camera-type eye(GO:0060235) |
| 0.3 | 0.3 | GO:0045005 | DNA-dependent DNA replication maintenance of fidelity(GO:0045005) |
| 0.3 | 1.0 | GO:0072137 | condensed mesenchymal cell proliferation(GO:0072137) |
| 0.3 | 0.8 | GO:0043418 | homocysteine catabolic process(GO:0043418) |
| 0.2 | 1.5 | GO:1902748 | positive regulation of lens fiber cell differentiation(GO:1902748) |
| 0.2 | 2.0 | GO:0001955 | blood vessel maturation(GO:0001955) |
| 0.2 | 1.9 | GO:0006848 | pyruvate transport(GO:0006848) pyruvate transmembrane transport(GO:1901475) |
| 0.2 | 0.5 | GO:0044028 | DNA hypomethylation(GO:0044028) hypomethylation of CpG island(GO:0044029) |
| 0.2 | 2.1 | GO:0035898 | parathyroid hormone secretion(GO:0035898) |
| 0.2 | 0.9 | GO:0009956 | radial pattern formation(GO:0009956) |
| 0.2 | 1.2 | GO:0001554 | luteolysis(GO:0001554) |
| 0.2 | 1.4 | GO:2000048 | negative regulation of cell-cell adhesion mediated by cadherin(GO:2000048) |
| 0.2 | 0.2 | GO:1902954 | regulation of early endosome to recycling endosome transport(GO:1902954) |
| 0.2 | 0.9 | GO:0046671 | negative regulation of cellular pH reduction(GO:0032848) CD8-positive, alpha-beta T cell lineage commitment(GO:0043375) negative regulation of retinal cell programmed cell death(GO:0046671) |
| 0.2 | 1.8 | GO:0032000 | positive regulation of fatty acid beta-oxidation(GO:0032000) |
| 0.2 | 0.2 | GO:0071879 | positive regulation of adrenergic receptor signaling pathway(GO:0071879) |
| 0.2 | 0.9 | GO:1903566 | positive regulation of protein localization to cilium(GO:1903566) |
| 0.2 | 1.1 | GO:0071874 | cellular response to norepinephrine stimulus(GO:0071874) |
| 0.2 | 0.7 | GO:1990927 | calcium ion regulated lysosome exocytosis(GO:1990927) |
| 0.2 | 3.2 | GO:0046325 | negative regulation of glucose import(GO:0046325) |
| 0.2 | 0.9 | GO:0086021 | SA node cell to atrial cardiac muscle cell communication by electrical coupling(GO:0086021) |
| 0.2 | 1.9 | GO:0070934 | CRD-mediated mRNA stabilization(GO:0070934) |
| 0.2 | 0.6 | GO:0036333 | hepatocyte homeostasis(GO:0036333) response to tetrachloromethane(GO:1904772) |
| 0.2 | 0.2 | GO:0002025 | vasodilation by norepinephrine-epinephrine involved in regulation of systemic arterial blood pressure(GO:0002025) |
| 0.2 | 1.3 | GO:1900748 | positive regulation of vascular endothelial growth factor signaling pathway(GO:1900748) |
| 0.2 | 0.4 | GO:0021966 | corticospinal neuron axon guidance(GO:0021966) |
| 0.2 | 1.5 | GO:2000542 | negative regulation of gastrulation(GO:2000542) |
| 0.2 | 0.2 | GO:0036215 | response to stem cell factor(GO:0036215) cellular response to stem cell factor stimulus(GO:0036216) Kit signaling pathway(GO:0038109) |
| 0.2 | 2.4 | GO:0033227 | dsRNA transport(GO:0033227) |
| 0.2 | 0.2 | GO:0010265 | SCF complex assembly(GO:0010265) |
| 0.2 | 0.4 | GO:0007162 | negative regulation of cell adhesion(GO:0007162) |
| 0.2 | 2.0 | GO:0002051 | osteoblast fate commitment(GO:0002051) |
| 0.2 | 0.4 | GO:0031640 | killing of cells of other organism(GO:0031640) disruption of cells of other organism(GO:0044364) |
| 0.2 | 0.2 | GO:0044415 | evasion or tolerance of host defenses by virus(GO:0019049) avoidance of host defenses(GO:0044413) evasion or tolerance of host defenses(GO:0044415) avoidance of defenses of other organism involved in symbiotic interaction(GO:0051832) evasion or tolerance of defenses of other organism involved in symbiotic interaction(GO:0051834) |
| 0.2 | 1.3 | GO:2000795 | negative regulation of epithelial cell proliferation involved in lung morphogenesis(GO:2000795) |
| 0.2 | 0.9 | GO:2001222 | regulation of neuron migration(GO:2001222) |
| 0.2 | 0.6 | GO:0036058 | filtration diaphragm assembly(GO:0036058) slit diaphragm assembly(GO:0036060) negative regulation of retinal ganglion cell axon guidance(GO:0090260) |
| 0.2 | 0.5 | GO:0045212 | negative regulation of synaptic transmission, cholinergic(GO:0032223) neurotransmitter receptor biosynthetic process(GO:0045212) |
| 0.2 | 0.7 | GO:0019322 | pentose biosynthetic process(GO:0019322) |
| 0.2 | 0.4 | GO:0072197 | ureter morphogenesis(GO:0072197) |
| 0.2 | 5.0 | GO:0030208 | dermatan sulfate biosynthetic process(GO:0030208) |
| 0.2 | 1.1 | GO:2001038 | regulation of cellular response to drug(GO:2001038) |
| 0.2 | 0.4 | GO:0061762 | CAMKK-AMPK signaling cascade(GO:0061762) |
| 0.2 | 0.7 | GO:0035441 | cell migration involved in vasculogenesis(GO:0035441) |
| 0.2 | 0.7 | GO:0070507 | regulation of microtubule cytoskeleton organization(GO:0070507) |
| 0.2 | 1.2 | GO:2000124 | regulation of endocannabinoid signaling pathway(GO:2000124) |
| 0.2 | 8.0 | GO:0045879 | negative regulation of smoothened signaling pathway(GO:0045879) |
| 0.2 | 0.7 | GO:1904978 | regulation of endosome organization(GO:1904978) |
| 0.2 | 0.5 | GO:1902949 | positive regulation of tau-protein kinase activity(GO:1902949) |
| 0.2 | 0.5 | GO:0050760 | negative regulation of thymidylate synthase biosynthetic process(GO:0050760) |
| 0.2 | 1.7 | GO:0051388 | positive regulation of neurotrophin TRK receptor signaling pathway(GO:0051388) |
| 0.2 | 0.7 | GO:0000103 | sulfate assimilation(GO:0000103) |
| 0.2 | 1.7 | GO:0002371 | dendritic cell cytokine production(GO:0002371) |
| 0.2 | 0.5 | GO:0016260 | selenocysteine biosynthetic process(GO:0016260) |
| 0.2 | 0.3 | GO:0035108 | appendage morphogenesis(GO:0035107) limb morphogenesis(GO:0035108) |
| 0.2 | 0.7 | GO:0060979 | vasculogenesis involved in coronary vascular morphogenesis(GO:0060979) |
| 0.2 | 0.5 | GO:0031064 | negative regulation of histone deacetylation(GO:0031064) |
| 0.2 | 0.7 | GO:0009447 | putrescine catabolic process(GO:0009447) |
| 0.2 | 1.3 | GO:2000601 | positive regulation of Arp2/3 complex-mediated actin nucleation(GO:2000601) |
| 0.2 | 0.2 | GO:0031443 | fast-twitch skeletal muscle fiber contraction(GO:0031443) |
| 0.2 | 0.6 | GO:0019413 | acetate biosynthetic process(GO:0019413) acetyl-CoA biosynthetic process from acetate(GO:0019427) propionate metabolic process(GO:0019541) propionate biosynthetic process(GO:0019542) |
| 0.2 | 0.3 | GO:0048286 | lung alveolus development(GO:0048286) |
| 0.2 | 0.5 | GO:0019417 | sulfur oxidation(GO:0019417) |
| 0.2 | 0.6 | GO:0061030 | epithelial cell differentiation involved in mammary gland alveolus development(GO:0061030) |
| 0.2 | 2.0 | GO:0019695 | choline metabolic process(GO:0019695) |
| 0.2 | 0.3 | GO:0034971 | histone H3-R17 methylation(GO:0034971) |
| 0.2 | 0.2 | GO:1900745 | positive regulation of p38MAPK cascade(GO:1900745) |
| 0.2 | 0.9 | GO:0051684 | maintenance of Golgi location(GO:0051684) |
| 0.2 | 0.5 | GO:0046167 | glycerol-3-phosphate biosynthetic process(GO:0046167) |
| 0.2 | 0.2 | GO:0014016 | neuroblast differentiation(GO:0014016) |
| 0.2 | 1.5 | GO:0060267 | positive regulation of respiratory burst(GO:0060267) |
| 0.2 | 0.3 | GO:0031630 | regulation of synaptic vesicle fusion to presynaptic membrane(GO:0031630) |
| 0.2 | 1.4 | GO:0021902 | commitment of neuronal cell to specific neuron type in forebrain(GO:0021902) |
| 0.2 | 2.7 | GO:0006527 | arginine catabolic process(GO:0006527) |
| 0.1 | 1.9 | GO:0048739 | cardiac muscle fiber development(GO:0048739) |
| 0.1 | 0.6 | GO:0043567 | regulation of insulin-like growth factor receptor signaling pathway(GO:0043567) |
| 0.1 | 2.8 | GO:0061162 | establishment of monopolar cell polarity(GO:0061162) establishment or maintenance of monopolar cell polarity(GO:0061339) |
| 0.1 | 1.0 | GO:0021540 | corpus callosum morphogenesis(GO:0021540) |
| 0.1 | 0.6 | GO:2000314 | regulation of neural crest formation(GO:0090299) negative regulation of neural crest formation(GO:0090301) negative regulation of fibroblast growth factor receptor signaling pathway involved in neural plate anterior/posterior pattern formation(GO:2000314) |
| 0.1 | 0.9 | GO:0060754 | positive regulation of mast cell chemotaxis(GO:0060754) |
| 0.1 | 0.4 | GO:0042091 | interleukin-10 biosynthetic process(GO:0042091) regulation of interleukin-10 biosynthetic process(GO:0045074) |
| 0.1 | 0.4 | GO:0035674 | tricarboxylic acid transmembrane transport(GO:0035674) |
| 0.1 | 0.4 | GO:1904617 | negative regulation of actin filament binding(GO:1904530) negative regulation of actin binding(GO:1904617) |
| 0.1 | 0.7 | GO:0015015 | heparan sulfate proteoglycan biosynthetic process, enzymatic modification(GO:0015015) |
| 0.1 | 0.4 | GO:0044691 | tooth eruption(GO:0044691) |
| 0.1 | 0.3 | GO:0010165 | response to X-ray(GO:0010165) |
| 0.1 | 0.4 | GO:0031990 | mRNA export from nucleus in response to heat stress(GO:0031990) |
| 0.1 | 0.4 | GO:0044313 | protein K6-linked deubiquitination(GO:0044313) |
| 0.1 | 0.1 | GO:2001226 | negative regulation of chloride transport(GO:2001226) |
| 0.1 | 0.1 | GO:0006333 | chromatin assembly or disassembly(GO:0006333) |
| 0.1 | 0.1 | GO:0033363 | secretory granule organization(GO:0033363) |
| 0.1 | 0.8 | GO:1902766 | skeletal muscle satellite cell migration(GO:1902766) |
| 0.1 | 0.4 | GO:0010845 | positive regulation of reciprocal meiotic recombination(GO:0010845) |
| 0.1 | 0.4 | GO:0090427 | activation of meiosis(GO:0090427) |
| 0.1 | 0.1 | GO:0061386 | closure of optic fissure(GO:0061386) |
| 0.1 | 1.2 | GO:0010891 | negative regulation of sequestering of triglyceride(GO:0010891) |
| 0.1 | 1.4 | GO:1904177 | regulation of adipose tissue development(GO:1904177) |
| 0.1 | 0.8 | GO:0006499 | N-terminal protein myristoylation(GO:0006499) |
| 0.1 | 0.3 | GO:1904783 | positive regulation of NMDA glutamate receptor activity(GO:1904783) |
| 0.1 | 0.4 | GO:0097676 | histone H3-K36 dimethylation(GO:0097676) |
| 0.1 | 0.9 | GO:2000286 | receptor internalization involved in canonical Wnt signaling pathway(GO:2000286) |
| 0.1 | 0.4 | GO:0061188 | negative regulation of chromatin silencing at rDNA(GO:0061188) |
| 0.1 | 0.4 | GO:0009957 | epidermal cell fate specification(GO:0009957) positive regulation of ephrin receptor signaling pathway(GO:1901189) positive regulation of canonical Wnt signaling pathway involved in cardiac muscle cell fate commitment(GO:1901297) positive regulation of canonical Wnt signaling pathway involved in heart development(GO:1905068) |
| 0.1 | 0.4 | GO:0060823 | canonical Wnt signaling pathway involved in neural plate anterior/posterior pattern formation(GO:0060823) |
| 0.1 | 3.0 | GO:0070208 | protein heterotrimerization(GO:0070208) |
| 0.1 | 0.4 | GO:0097120 | receptor localization to synapse(GO:0097120) |
| 0.1 | 0.1 | GO:0070914 | UV-damage excision repair(GO:0070914) |
| 0.1 | 0.9 | GO:1901552 | positive regulation of endothelial cell development(GO:1901552) positive regulation of establishment of endothelial barrier(GO:1903142) |
| 0.1 | 2.7 | GO:2000009 | negative regulation of protein localization to cell surface(GO:2000009) |
| 0.1 | 0.7 | GO:0061086 | negative regulation of histone H3-K27 methylation(GO:0061086) |
| 0.1 | 0.4 | GO:2000342 | negative regulation of chemokine (C-X-C motif) ligand 2 production(GO:2000342) |
| 0.1 | 0.5 | GO:0043376 | regulation of CD8-positive, alpha-beta T cell differentiation(GO:0043376) |
| 0.1 | 0.6 | GO:0061052 | negative regulation of cell growth involved in cardiac muscle cell development(GO:0061052) |
| 0.1 | 0.5 | GO:0070375 | ERK5 cascade(GO:0070375) |
| 0.1 | 0.7 | GO:0051643 | endoplasmic reticulum localization(GO:0051643) |
| 0.1 | 0.7 | GO:2001184 | positive regulation of interleukin-12 secretion(GO:2001184) |
| 0.1 | 0.8 | GO:0070562 | regulation of vitamin D receptor signaling pathway(GO:0070562) |
| 0.1 | 0.9 | GO:0043402 | glucocorticoid mediated signaling pathway(GO:0043402) |
| 0.1 | 0.3 | GO:2000297 | negative regulation of synapse maturation(GO:2000297) |
| 0.1 | 0.3 | GO:0034241 | macrophage fusion(GO:0034238) regulation of macrophage fusion(GO:0034239) positive regulation of macrophage fusion(GO:0034241) |
| 0.1 | 0.3 | GO:1902414 | protein localization to cell junction(GO:1902414) |
| 0.1 | 0.2 | GO:0097195 | pilomotor reflex(GO:0097195) |
| 0.1 | 0.5 | GO:1901675 | negative regulation of histone H3-K27 acetylation(GO:1901675) |
| 0.1 | 0.1 | GO:0010726 | positive regulation of hydrogen peroxide metabolic process(GO:0010726) |
| 0.1 | 0.6 | GO:0032474 | otolith morphogenesis(GO:0032474) |
| 0.1 | 0.6 | GO:0030047 | actin modification(GO:0030047) |
| 0.1 | 0.6 | GO:0090135 | actin filament branching(GO:0090135) |
| 0.1 | 0.6 | GO:0009439 | cyanate metabolic process(GO:0009439) cyanate catabolic process(GO:0009440) |
| 0.1 | 0.5 | GO:1902613 | regulation of anti-Mullerian hormone signaling pathway(GO:1902612) negative regulation of anti-Mullerian hormone signaling pathway(GO:1902613) anti-Mullerian hormone signaling pathway(GO:1990262) |
| 0.1 | 0.6 | GO:0099590 | neurotransmitter receptor internalization(GO:0099590) |
| 0.1 | 0.6 | GO:0046449 | creatinine metabolic process(GO:0046449) |
| 0.1 | 0.2 | GO:0015012 | heparan sulfate proteoglycan biosynthetic process(GO:0015012) |
| 0.1 | 0.2 | GO:0043951 | negative regulation of cAMP-mediated signaling(GO:0043951) |
| 0.1 | 0.3 | GO:0035470 | positive regulation of vascular wound healing(GO:0035470) |
| 0.1 | 0.4 | GO:0032687 | negative regulation of interferon-alpha production(GO:0032687) |
| 0.1 | 0.4 | GO:0021648 | vestibulocochlear nerve morphogenesis(GO:0021648) |
| 0.1 | 0.4 | GO:0003366 | cell-matrix adhesion involved in ameboidal cell migration(GO:0003366) |
| 0.1 | 1.6 | GO:0002315 | marginal zone B cell differentiation(GO:0002315) |
| 0.1 | 0.4 | GO:0045875 | negative regulation of sister chromatid cohesion(GO:0045875) |
| 0.1 | 0.1 | GO:0046108 | uridine metabolic process(GO:0046108) |
| 0.1 | 0.2 | GO:1904016 | response to Thyroglobulin triiodothyronine(GO:1904016) |
| 0.1 | 0.1 | GO:0051220 | cytoplasmic sequestering of protein(GO:0051220) |
| 0.1 | 0.1 | GO:0007521 | muscle cell fate determination(GO:0007521) |
| 0.1 | 0.4 | GO:2000051 | negative regulation of non-canonical Wnt signaling pathway(GO:2000051) |
| 0.1 | 0.5 | GO:0021766 | hippocampus development(GO:0021766) |
| 0.1 | 1.1 | GO:0097350 | neutrophil clearance(GO:0097350) |
| 0.1 | 0.1 | GO:0071878 | negative regulation of adrenergic receptor signaling pathway(GO:0071878) |
| 0.1 | 0.5 | GO:0001502 | cartilage condensation(GO:0001502) |
| 0.1 | 0.1 | GO:0038003 | opioid receptor signaling pathway(GO:0038003) |
| 0.1 | 0.3 | GO:2000417 | negative regulation of eosinophil migration(GO:2000417) |
| 0.1 | 0.5 | GO:0033615 | mitochondrial proton-transporting ATP synthase complex assembly(GO:0033615) |
| 0.1 | 0.7 | GO:0010624 | regulation of Schwann cell proliferation(GO:0010624) negative regulation of Schwann cell proliferation(GO:0010626) |
| 0.1 | 0.7 | GO:0070278 | extracellular matrix constituent secretion(GO:0070278) |
| 0.1 | 1.6 | GO:0048172 | regulation of short-term neuronal synaptic plasticity(GO:0048172) |
| 0.1 | 0.4 | GO:0034436 | glycoprotein transport(GO:0034436) |
| 0.1 | 0.9 | GO:0002414 | immunoglobulin transcytosis in epithelial cells(GO:0002414) |
| 0.1 | 0.1 | GO:0002184 | cytoplasmic translational termination(GO:0002184) |
| 0.1 | 0.3 | GO:2000661 | positive regulation of interleukin-1-mediated signaling pathway(GO:2000661) |
| 0.1 | 0.3 | GO:1900042 | positive regulation of interleukin-2 secretion(GO:1900042) |
| 0.1 | 0.9 | GO:0086024 | adrenergic receptor signaling pathway involved in positive regulation of heart rate(GO:0086024) |
| 0.1 | 0.3 | GO:2001245 | regulation of phosphatidylcholine biosynthetic process(GO:2001245) |
| 0.1 | 0.2 | GO:0060160 | negative regulation of dopamine receptor signaling pathway(GO:0060160) |
| 0.1 | 0.3 | GO:0033364 | mast cell secretory granule organization(GO:0033364) |
| 0.1 | 0.2 | GO:0017157 | regulation of exocytosis(GO:0017157) |
| 0.1 | 0.3 | GO:1990108 | protein linear deubiquitination(GO:1990108) |
| 0.1 | 0.3 | GO:0021793 | chemorepulsion of branchiomotor axon(GO:0021793) |
| 0.1 | 0.3 | GO:0014876 | response to injury involved in regulation of muscle adaptation(GO:0014876) |
| 0.1 | 1.2 | GO:1902659 | regulation of glucose mediated signaling pathway(GO:1902659) |
| 0.1 | 0.7 | GO:0060136 | embryonic process involved in female pregnancy(GO:0060136) |
| 0.1 | 0.4 | GO:0051549 | positive regulation of keratinocyte migration(GO:0051549) |
| 0.1 | 0.3 | GO:0006427 | histidyl-tRNA aminoacylation(GO:0006427) |
| 0.1 | 0.5 | GO:0071386 | cellular response to corticosterone stimulus(GO:0071386) |
| 0.1 | 0.9 | GO:0001672 | regulation of chromatin assembly or disassembly(GO:0001672) |
| 0.1 | 0.3 | GO:0010701 | positive regulation of norepinephrine secretion(GO:0010701) |
| 0.1 | 0.3 | GO:0035668 | TRAM-dependent toll-like receptor signaling pathway(GO:0035668) TRAM-dependent toll-like receptor 4 signaling pathway(GO:0035669) |
| 0.1 | 0.5 | GO:0048496 | maintenance of organ identity(GO:0048496) |
| 0.1 | 0.3 | GO:0097032 | respiratory chain complex II assembly(GO:0034552) mitochondrial respiratory chain complex II assembly(GO:0034553) mitochondrial respiratory chain complex II biogenesis(GO:0097032) |
| 0.1 | 0.1 | GO:0044872 | lipoprotein transport(GO:0042953) lipoprotein localization(GO:0044872) |
| 0.1 | 0.7 | GO:0021521 | ventral spinal cord interneuron specification(GO:0021521) cell fate specification involved in pattern specification(GO:0060573) |
| 0.1 | 0.1 | GO:0016340 | calcium-dependent cell-matrix adhesion(GO:0016340) |
| 0.1 | 0.1 | GO:1904321 | response to forskolin(GO:1904321) cellular response to forskolin(GO:1904322) |
| 0.1 | 1.5 | GO:0007253 | cytoplasmic sequestering of NF-kappaB(GO:0007253) |
| 0.1 | 0.8 | GO:0007258 | JUN phosphorylation(GO:0007258) |
| 0.1 | 0.2 | GO:0006694 | steroid biosynthetic process(GO:0006694) |
| 0.1 | 0.1 | GO:0035026 | leading edge cell differentiation(GO:0035026) |
| 0.1 | 0.3 | GO:0060178 | regulation of exocyst assembly(GO:0001928) regulation of exocyst localization(GO:0060178) |
| 0.1 | 0.1 | GO:0061441 | renal artery morphogenesis(GO:0061441) |
| 0.1 | 0.1 | GO:0051923 | sulfation(GO:0051923) |
| 0.1 | 0.4 | GO:0036496 | regulation of translational initiation by eIF2 alpha dephosphorylation(GO:0036496) |
| 0.1 | 0.6 | GO:0035624 | receptor transactivation(GO:0035624) |
| 0.1 | 0.1 | GO:0051146 | striated muscle cell differentiation(GO:0051146) |
| 0.1 | 0.3 | GO:0046416 | D-amino acid metabolic process(GO:0046416) |
| 0.1 | 0.4 | GO:0034959 | substance P catabolic process(GO:0010814) calcitonin catabolic process(GO:0010816) endothelin maturation(GO:0034959) |
| 0.1 | 0.3 | GO:0035022 | positive regulation of Rac protein signal transduction(GO:0035022) |
| 0.1 | 0.4 | GO:0090263 | positive regulation of canonical Wnt signaling pathway(GO:0090263) |
| 0.1 | 0.1 | GO:0003166 | bundle of His development(GO:0003166) |
| 0.1 | 1.1 | GO:0006044 | N-acetylglucosamine metabolic process(GO:0006044) |
| 0.1 | 0.4 | GO:1902626 | assembly of large subunit precursor of preribosome(GO:1902626) |
| 0.1 | 0.5 | GO:0097327 | response to antineoplastic agent(GO:0097327) |
| 0.1 | 1.4 | GO:0044342 | type B pancreatic cell proliferation(GO:0044342) |
| 0.1 | 0.4 | GO:0090034 | regulation of chaperone-mediated protein complex assembly(GO:0090034) positive regulation of chaperone-mediated protein complex assembly(GO:0090035) |
| 0.1 | 1.0 | GO:0030091 | protein repair(GO:0030091) |
| 0.1 | 0.1 | GO:1902669 | positive regulation of axon guidance(GO:1902669) |
| 0.1 | 0.3 | GO:0000415 | negative regulation of histone H3-K36 methylation(GO:0000415) |
| 0.1 | 0.6 | GO:0043932 | ossification involved in bone remodeling(GO:0043932) |
| 0.1 | 0.4 | GO:1904059 | regulation of locomotor rhythm(GO:1904059) |
| 0.1 | 1.1 | GO:0009048 | dosage compensation by inactivation of X chromosome(GO:0009048) |
| 0.1 | 1.1 | GO:0090385 | phagosome-lysosome fusion(GO:0090385) |
| 0.1 | 0.2 | GO:0045085 | negative regulation of interleukin-2 biosynthetic process(GO:0045085) |
| 0.1 | 0.4 | GO:0046726 | positive regulation by virus of viral protein levels in host cell(GO:0046726) |
| 0.1 | 0.3 | GO:0001954 | positive regulation of cell-matrix adhesion(GO:0001954) |
| 0.1 | 0.2 | GO:0021938 | ventral midline development(GO:0007418) smoothened signaling pathway involved in regulation of cerebellar granule cell precursor cell proliferation(GO:0021938) |
| 0.1 | 0.5 | GO:0035811 | negative regulation of urine volume(GO:0035811) |
| 0.1 | 0.3 | GO:2001271 | negative regulation of cysteine-type endopeptidase activity involved in execution phase of apoptosis(GO:2001271) |
| 0.1 | 0.1 | GO:0006679 | glucosylceramide biosynthetic process(GO:0006679) |
| 0.1 | 0.3 | GO:0033031 | positive regulation of neutrophil apoptotic process(GO:0033031) |
| 0.1 | 1.1 | GO:0006048 | UDP-N-acetylglucosamine biosynthetic process(GO:0006048) |
| 0.1 | 0.1 | GO:0048850 | hypophysis morphogenesis(GO:0048850) |
| 0.1 | 0.3 | GO:0046543 | development of secondary female sexual characteristics(GO:0046543) |
| 0.1 | 0.1 | GO:0034143 | regulation of toll-like receptor 4 signaling pathway(GO:0034143) |
| 0.1 | 0.8 | GO:0061087 | positive regulation of histone H3-K27 methylation(GO:0061087) |
| 0.1 | 0.4 | GO:0071596 | ubiquitin-dependent protein catabolic process via the N-end rule pathway(GO:0071596) |
| 0.1 | 0.2 | GO:0071930 | negative regulation of transcription involved in G1/S transition of mitotic cell cycle(GO:0071930) |
| 0.1 | 0.3 | GO:2000643 | positive regulation of early endosome to late endosome transport(GO:2000643) |
| 0.1 | 0.6 | GO:0097056 | selenocysteinyl-tRNA(Sec) biosynthetic process(GO:0097056) |
| 0.1 | 0.3 | GO:0046061 | dATP catabolic process(GO:0046061) |
| 0.1 | 0.4 | GO:0050729 | positive regulation of inflammatory response(GO:0050729) |
| 0.1 | 0.6 | GO:0090625 | mRNA cleavage involved in gene silencing by siRNA(GO:0090625) |
| 0.1 | 0.4 | GO:0008065 | establishment of blood-nerve barrier(GO:0008065) |
| 0.1 | 0.7 | GO:0033631 | cell-cell adhesion mediated by integrin(GO:0033631) |
| 0.1 | 0.2 | GO:2000110 | negative regulation of macrophage apoptotic process(GO:2000110) |
| 0.1 | 0.2 | GO:2000535 | regulation of entry of bacterium into host cell(GO:2000535) |
| 0.1 | 0.1 | GO:0015870 | acetylcholine transport(GO:0015870) |
| 0.1 | 0.4 | GO:0032962 | regulation of inositol trisphosphate biosynthetic process(GO:0032960) positive regulation of inositol trisphosphate biosynthetic process(GO:0032962) |
| 0.1 | 0.5 | GO:0015798 | myo-inositol transport(GO:0015798) |
| 0.1 | 0.3 | GO:0002265 | astrocyte activation involved in immune response(GO:0002265) |
| 0.1 | 0.3 | GO:0006172 | ADP biosynthetic process(GO:0006172) purine deoxyribonucleoside diphosphate biosynthetic process(GO:0009183) |
| 0.1 | 0.2 | GO:0031666 | positive regulation of lipopolysaccharide-mediated signaling pathway(GO:0031666) |
| 0.1 | 0.3 | GO:0075044 | autophagy of host cells involved in interaction with symbiont(GO:0075044) autophagy involved in symbiotic interaction(GO:0075071) |
| 0.1 | 0.7 | GO:1901164 | negative regulation of trophoblast cell migration(GO:1901164) |
| 0.1 | 0.2 | GO:0014009 | glial cell proliferation(GO:0014009) |
| 0.1 | 0.2 | GO:0097368 | establishment of Sertoli cell barrier(GO:0097368) |
| 0.1 | 1.1 | GO:0032968 | positive regulation of transcription elongation from RNA polymerase II promoter(GO:0032968) |
| 0.1 | 0.5 | GO:0033210 | leptin-mediated signaling pathway(GO:0033210) |
| 0.1 | 1.0 | GO:2001275 | positive regulation of glucose import in response to insulin stimulus(GO:2001275) |
| 0.1 | 0.7 | GO:0008090 | retrograde axonal transport(GO:0008090) |
| 0.1 | 1.3 | GO:0044458 | motile cilium assembly(GO:0044458) |
| 0.1 | 0.7 | GO:0061470 | T follicular helper cell differentiation(GO:0061470) |
| 0.1 | 0.3 | GO:0051490 | negative regulation of filopodium assembly(GO:0051490) |
| 0.1 | 0.2 | GO:1902951 | negative regulation of dendritic spine maintenance(GO:1902951) |
| 0.1 | 0.3 | GO:0003219 | cardiac right ventricle formation(GO:0003219) |
| 0.1 | 0.1 | GO:0051493 | regulation of cytoskeleton organization(GO:0051493) |
| 0.1 | 0.3 | GO:2001034 | positive regulation of double-strand break repair via nonhomologous end joining(GO:2001034) |
| 0.1 | 0.9 | GO:0072189 | ureter development(GO:0072189) |
| 0.1 | 0.2 | GO:0097212 | lysosomal membrane organization(GO:0097212) |
| 0.1 | 1.0 | GO:0032836 | glomerular basement membrane development(GO:0032836) |
| 0.1 | 2.5 | GO:0051131 | chaperone-mediated protein complex assembly(GO:0051131) |
| 0.1 | 0.9 | GO:1900028 | negative regulation of ruffle assembly(GO:1900028) |
| 0.1 | 0.4 | GO:0002032 | desensitization of G-protein coupled receptor protein signaling pathway by arrestin(GO:0002032) |
| 0.1 | 0.2 | GO:0098976 | excitatory chemical synaptic transmission(GO:0098976) regulation of AMPA glutamate receptor clustering(GO:1904717) positive regulation of AMPA glutamate receptor clustering(GO:1904719) |
| 0.1 | 0.3 | GO:0071894 | histone H2B conserved C-terminal lysine ubiquitination(GO:0071894) |
| 0.1 | 0.4 | GO:0050916 | sensory perception of sweet taste(GO:0050916) |
| 0.1 | 0.8 | GO:2000786 | positive regulation of autophagosome assembly(GO:2000786) |
| 0.1 | 0.1 | GO:0030644 | cellular chloride ion homeostasis(GO:0030644) |
| 0.1 | 0.4 | GO:0034497 | protein localization to pre-autophagosomal structure(GO:0034497) |
| 0.1 | 0.2 | GO:0032696 | negative regulation of interleukin-13 production(GO:0032696) |
| 0.1 | 0.3 | GO:0097498 | endothelial tube lumen extension(GO:0097498) |
| 0.1 | 0.1 | GO:0002314 | germinal center B cell differentiation(GO:0002314) |
| 0.1 | 0.2 | GO:0016094 | polyprenol biosynthetic process(GO:0016094) |
| 0.1 | 0.3 | GO:0045766 | positive regulation of angiogenesis(GO:0045766) |
| 0.1 | 0.4 | GO:0061034 | olfactory bulb mitral cell layer development(GO:0061034) |
| 0.1 | 0.3 | GO:0015960 | diadenosine polyphosphate biosynthetic process(GO:0015960) diadenosine tetraphosphate metabolic process(GO:0015965) diadenosine tetraphosphate biosynthetic process(GO:0015966) |
| 0.1 | 0.1 | GO:1900454 | positive regulation of long term synaptic depression(GO:1900454) |
| 0.1 | 0.1 | GO:1902564 | negative regulation of neutrophil activation(GO:1902564) |
| 0.1 | 0.6 | GO:0051013 | microtubule severing(GO:0051013) |
| 0.1 | 0.2 | GO:0070681 | glutaminyl-tRNAGln biosynthesis via transamidation(GO:0070681) |
| 0.1 | 0.5 | GO:0072592 | oxygen metabolic process(GO:0072592) |
| 0.1 | 0.2 | GO:0010643 | cell communication by chemical coupling(GO:0010643) |
| 0.1 | 0.3 | GO:0042158 | lipoprotein biosynthetic process(GO:0042158) |
| 0.1 | 0.1 | GO:0032792 | negative regulation of CREB transcription factor activity(GO:0032792) |
| 0.1 | 0.3 | GO:1903644 | regulation of chaperone-mediated protein folding(GO:1903644) |
| 0.1 | 0.5 | GO:0000710 | meiotic mismatch repair(GO:0000710) |
| 0.1 | 1.7 | GO:0006646 | phosphatidylethanolamine biosynthetic process(GO:0006646) |
| 0.1 | 0.5 | GO:0032482 | Rab protein signal transduction(GO:0032482) |
| 0.1 | 0.1 | GO:0070213 | protein auto-ADP-ribosylation(GO:0070213) |
| 0.1 | 0.1 | GO:0019521 | aldonic acid metabolic process(GO:0019520) D-gluconate metabolic process(GO:0019521) |
| 0.1 | 3.3 | GO:0030866 | cortical actin cytoskeleton organization(GO:0030866) |
| 0.1 | 0.4 | GO:0016476 | regulation of embryonic cell shape(GO:0016476) |
| 0.1 | 0.4 | GO:0010269 | response to selenium ion(GO:0010269) |
| 0.1 | 2.0 | GO:0046856 | phosphatidylinositol dephosphorylation(GO:0046856) |
| 0.1 | 0.3 | GO:0007614 | short-term memory(GO:0007614) |
| 0.1 | 0.2 | GO:1903862 | positive regulation of oxidative phosphorylation(GO:1903862) |
| 0.1 | 0.8 | GO:0006451 | selenocysteine incorporation(GO:0001514) translational readthrough(GO:0006451) |
| 0.1 | 1.2 | GO:0042340 | keratan sulfate catabolic process(GO:0042340) |
| 0.1 | 0.5 | GO:0010459 | negative regulation of heart rate(GO:0010459) |
| 0.1 | 0.4 | GO:2000852 | corticosterone secretion(GO:0035934) regulation of corticosterone secretion(GO:2000852) |
| 0.1 | 0.1 | GO:0035507 | regulation of myosin-light-chain-phosphatase activity(GO:0035507) |
| 0.1 | 0.2 | GO:1900275 | negative regulation of phospholipase C activity(GO:1900275) regulation of proteinase activated receptor activity(GO:1900276) negative regulation of phospholipase C-activating G-protein coupled receptor signaling pathway(GO:1900737) |
| 0.1 | 0.3 | GO:1903846 | positive regulation of transforming growth factor beta receptor signaling pathway(GO:0030511) positive regulation of cellular response to transforming growth factor beta stimulus(GO:1903846) |
| 0.1 | 0.2 | GO:0021503 | neural fold bending(GO:0021503) |
| 0.1 | 0.3 | GO:0007356 | thorax and anterior abdomen determination(GO:0007356) regulation of metanephric ureteric bud development(GO:2001074) positive regulation of metanephric ureteric bud development(GO:2001076) |
| 0.1 | 0.4 | GO:0090336 | positive regulation of brown fat cell differentiation(GO:0090336) |
| 0.1 | 0.5 | GO:0048743 | positive regulation of skeletal muscle fiber development(GO:0048743) |
| 0.1 | 1.8 | GO:0016578 | histone deubiquitination(GO:0016578) |
| 0.1 | 0.1 | GO:0000278 | mitotic cell cycle(GO:0000278) |
| 0.1 | 0.4 | GO:0070345 | negative regulation of fat cell proliferation(GO:0070345) |
| 0.1 | 0.8 | GO:0019388 | galactose catabolic process(GO:0019388) |
| 0.1 | 0.2 | GO:0048102 | autophagic cell death(GO:0048102) |
| 0.1 | 0.2 | GO:0097484 | dendrite extension(GO:0097484) |
| 0.1 | 0.6 | GO:0035973 | aggrephagy(GO:0035973) |
| 0.1 | 0.4 | GO:0019086 | late viral transcription(GO:0019086) |
| 0.1 | 1.1 | GO:2000480 | negative regulation of cAMP-dependent protein kinase activity(GO:2000480) |
| 0.1 | 0.5 | GO:0014052 | regulation of gamma-aminobutyric acid secretion(GO:0014052) |
| 0.1 | 0.2 | GO:0009236 | cobalamin biosynthetic process(GO:0009236) |
| 0.1 | 0.9 | GO:0034243 | regulation of transcription elongation from RNA polymerase II promoter(GO:0034243) |
| 0.1 | 0.5 | GO:0060613 | fat pad development(GO:0060613) |
| 0.1 | 0.2 | GO:0003190 | atrioventricular valve formation(GO:0003190) |
| 0.1 | 0.3 | GO:0018095 | protein polyglutamylation(GO:0018095) |
| 0.1 | 0.2 | GO:0060988 | lipid tube assembly(GO:0060988) |
| 0.1 | 0.5 | GO:0006880 | intracellular sequestering of iron ion(GO:0006880) sequestering of iron ion(GO:0097577) |
| 0.1 | 0.9 | GO:0033630 | positive regulation of cell adhesion mediated by integrin(GO:0033630) |
| 0.1 | 0.3 | GO:0045876 | positive regulation of sister chromatid cohesion(GO:0045876) |
| 0.1 | 0.1 | GO:0000189 | MAPK import into nucleus(GO:0000189) |
| 0.1 | 0.2 | GO:0000412 | histone peptidyl-prolyl isomerization(GO:0000412) |
| 0.1 | 1.3 | GO:0043011 | myeloid dendritic cell differentiation(GO:0043011) |
| 0.1 | 0.7 | GO:0090331 | negative regulation of platelet aggregation(GO:0090331) |
| 0.1 | 0.4 | GO:1903361 | protein localization to basolateral plasma membrane(GO:1903361) |
| 0.1 | 0.1 | GO:1903377 | negative regulation of oxidative stress-induced neuron intrinsic apoptotic signaling pathway(GO:1903377) |
| 0.1 | 0.4 | GO:0000101 | sulfur amino acid transport(GO:0000101) |
| 0.1 | 0.6 | GO:0035791 | platelet-derived growth factor receptor-beta signaling pathway(GO:0035791) |
| 0.1 | 0.2 | GO:2001045 | negative regulation of integrin-mediated signaling pathway(GO:2001045) |
| 0.1 | 0.3 | GO:0030101 | natural killer cell activation(GO:0030101) |
| 0.1 | 0.4 | GO:0051534 | negative regulation of NFAT protein import into nucleus(GO:0051534) |
| 0.1 | 1.0 | GO:0031935 | regulation of chromatin silencing(GO:0031935) |
| 0.1 | 1.1 | GO:0002087 | regulation of respiratory gaseous exchange by neurological system process(GO:0002087) |
| 0.1 | 0.1 | GO:2000468 | regulation of peroxidase activity(GO:2000468) |
| 0.1 | 0.2 | GO:0021849 | neuroblast division in subventricular zone(GO:0021849) |
| 0.1 | 0.5 | GO:0048280 | vesicle fusion with Golgi apparatus(GO:0048280) |
| 0.1 | 0.2 | GO:0089709 | acyl carnitine transport(GO:0006844) histidine transport(GO:0015817) L-histidine transmembrane transport(GO:0089709) L-histidine transport(GO:1902024) acyl carnitine transmembrane transport(GO:1902616) |
| 0.1 | 0.9 | GO:0030043 | actin filament fragmentation(GO:0030043) |
| 0.1 | 0.6 | GO:0010606 | positive regulation of cytoplasmic mRNA processing body assembly(GO:0010606) |
| 0.1 | 0.4 | GO:0006116 | NADH oxidation(GO:0006116) |
| 0.1 | 0.2 | GO:0090271 | positive regulation of fibroblast growth factor production(GO:0090271) |
| 0.1 | 0.7 | GO:0034332 | adherens junction organization(GO:0034332) |
| 0.1 | 0.2 | GO:0032847 | regulation of cellular pH reduction(GO:0032847) |
| 0.1 | 0.3 | GO:2001106 | regulation of Rho guanyl-nucleotide exchange factor activity(GO:2001106) |
| 0.1 | 0.3 | GO:0006311 | meiotic gene conversion(GO:0006311) |
| 0.1 | 2.2 | GO:0045599 | negative regulation of fat cell differentiation(GO:0045599) |
| 0.1 | 0.1 | GO:0036146 | cellular response to mycotoxin(GO:0036146) |
| 0.1 | 0.5 | GO:0000395 | mRNA 5'-splice site recognition(GO:0000395) |
| 0.1 | 0.4 | GO:0023021 | termination of signal transduction(GO:0023021) |
| 0.1 | 1.4 | GO:0006851 | mitochondrial calcium ion transport(GO:0006851) |
| 0.1 | 0.6 | GO:0051775 | response to redox state(GO:0051775) |
| 0.1 | 0.5 | GO:0071798 | response to prostaglandin D(GO:0071798) cellular response to prostaglandin D stimulus(GO:0071799) |
| 0.1 | 0.3 | GO:0072675 | multinuclear osteoclast differentiation(GO:0072674) osteoclast fusion(GO:0072675) |
| 0.1 | 0.4 | GO:1903593 | regulation of histamine secretion by mast cell(GO:1903593) |
| 0.1 | 0.1 | GO:0006491 | N-glycan processing(GO:0006491) |
| 0.1 | 0.2 | GO:1900242 | regulation of synaptic vesicle endocytosis(GO:1900242) |
| 0.1 | 0.2 | GO:0060148 | positive regulation of posttranscriptional gene silencing(GO:0060148) positive regulation of gene silencing by miRNA(GO:2000637) |
| 0.1 | 0.3 | GO:0014816 | skeletal muscle satellite cell differentiation(GO:0014816) |
| 0.1 | 0.5 | GO:1903943 | regulation of hepatocyte apoptotic process(GO:1903943) negative regulation of hepatocyte apoptotic process(GO:1903944) |
| 0.1 | 0.3 | GO:0045204 | MAPK export from nucleus(GO:0045204) |
| 0.1 | 0.1 | GO:0007512 | adult heart development(GO:0007512) |
| 0.1 | 0.3 | GO:0035672 | oligopeptide transmembrane transport(GO:0035672) |
| 0.1 | 0.2 | GO:0006740 | NADPH regeneration(GO:0006740) |
| 0.1 | 0.1 | GO:0071947 | protein deubiquitination involved in ubiquitin-dependent protein catabolic process(GO:0071947) |
| 0.1 | 0.4 | GO:2000096 | positive regulation of Wnt signaling pathway, planar cell polarity pathway(GO:2000096) |
| 0.1 | 0.2 | GO:0035751 | regulation of lysosomal lumen pH(GO:0035751) |
| 0.1 | 0.3 | GO:0090630 | activation of GTPase activity(GO:0090630) |
| 0.1 | 0.3 | GO:0015961 | diadenosine polyphosphate metabolic process(GO:0015959) diadenosine polyphosphate catabolic process(GO:0015961) diphosphoinositol polyphosphate metabolic process(GO:0071543) diadenosine pentaphosphate metabolic process(GO:1901906) diadenosine pentaphosphate catabolic process(GO:1901907) diadenosine hexaphosphate metabolic process(GO:1901908) diadenosine hexaphosphate catabolic process(GO:1901909) adenosine 5'-(hexahydrogen pentaphosphate) metabolic process(GO:1901910) adenosine 5'-(hexahydrogen pentaphosphate) catabolic process(GO:1901911) |
| 0.1 | 0.3 | GO:0071279 | cellular response to cobalt ion(GO:0071279) |
| 0.1 | 0.1 | GO:0048813 | dendrite morphogenesis(GO:0048813) |
| 0.1 | 0.1 | GO:2000192 | negative regulation of fatty acid transport(GO:2000192) |
| 0.1 | 0.2 | GO:0090341 | negative regulation of secretion of lysosomal enzymes(GO:0090341) |
| 0.1 | 0.2 | GO:0045356 | positive regulation of interferon-alpha biosynthetic process(GO:0045356) |
| 0.1 | 0.1 | GO:0045647 | negative regulation of erythrocyte differentiation(GO:0045647) |
| 0.1 | 0.2 | GO:0048319 | mesoderm migration involved in gastrulation(GO:0007509) axial mesoderm morphogenesis(GO:0048319) |
| 0.1 | 0.3 | GO:2000781 | positive regulation of double-strand break repair(GO:2000781) |
| 0.0 | 0.5 | GO:0046598 | positive regulation of viral entry into host cell(GO:0046598) |
| 0.0 | 0.2 | GO:1905098 | negative regulation of guanyl-nucleotide exchange factor activity(GO:1905098) |
| 0.0 | 0.6 | GO:0035020 | regulation of Rac protein signal transduction(GO:0035020) |
| 0.0 | 0.2 | GO:1901857 | positive regulation of cellular respiration(GO:1901857) |
| 0.0 | 0.1 | GO:0071418 | cellular response to amine stimulus(GO:0071418) |
| 0.0 | 0.1 | GO:0048681 | negative regulation of axon regeneration(GO:0048681) negative regulation of neuron projection regeneration(GO:0070571) |
| 0.0 | 0.2 | GO:0019852 | L-ascorbic acid metabolic process(GO:0019852) |
| 0.0 | 0.7 | GO:0051382 | kinetochore assembly(GO:0051382) |
| 0.0 | 0.1 | GO:1900186 | negative regulation of clathrin-mediated endocytosis(GO:1900186) |
| 0.0 | 0.1 | GO:0030240 | skeletal muscle thin filament assembly(GO:0030240) |
| 0.0 | 0.2 | GO:2000170 | positive regulation of peptidyl-cysteine S-nitrosylation(GO:2000170) |
| 0.0 | 0.1 | GO:0010216 | maintenance of DNA methylation(GO:0010216) |
| 0.0 | 0.3 | GO:0048733 | sebaceous gland development(GO:0048733) |
| 0.0 | 0.7 | GO:0018214 | peptidyl-glutamic acid carboxylation(GO:0017187) protein carboxylation(GO:0018214) |
| 0.0 | 0.4 | GO:2000210 | positive regulation of anoikis(GO:2000210) |
| 0.0 | 0.1 | GO:0010735 | positive regulation of transcription via serum response element binding(GO:0010735) |
| 0.0 | 0.2 | GO:0042494 | detection of bacterial lipoprotein(GO:0042494) |
| 0.0 | 0.3 | GO:0035278 | miRNA mediated inhibition of translation(GO:0035278) negative regulation of translation, ncRNA-mediated(GO:0040033) regulation of translation, ncRNA-mediated(GO:0045974) |
| 0.0 | 0.1 | GO:0060708 | spongiotrophoblast differentiation(GO:0060708) |
| 0.0 | 0.1 | GO:1902109 | negative regulation of mitochondrial membrane permeability involved in apoptotic process(GO:1902109) |
| 0.0 | 0.3 | GO:0010608 | posttranscriptional regulation of gene expression(GO:0010608) |
| 0.0 | 0.1 | GO:0036292 | DNA rewinding(GO:0036292) |
| 0.0 | 0.1 | GO:0002036 | regulation of L-glutamate transport(GO:0002036) |
| 0.0 | 0.1 | GO:0051126 | negative regulation of Arp2/3 complex-mediated actin nucleation(GO:0034316) negative regulation of actin nucleation(GO:0051126) |
| 0.0 | 0.1 | GO:0048009 | insulin-like growth factor receptor signaling pathway(GO:0048009) |
| 0.0 | 0.2 | GO:0021517 | ventral spinal cord development(GO:0021517) |
| 0.0 | 0.3 | GO:0000414 | regulation of histone H3-K36 methylation(GO:0000414) |
| 0.0 | 0.1 | GO:0002572 | pro-T cell differentiation(GO:0002572) |
| 0.0 | 0.5 | GO:0048251 | elastic fiber assembly(GO:0048251) |
| 0.0 | 0.0 | GO:0090647 | modulation of age-related behavioral decline(GO:0090647) |
| 0.0 | 0.1 | GO:2000381 | negative regulation of mesoderm development(GO:2000381) |
| 0.0 | 0.0 | GO:0031954 | positive regulation of protein autophosphorylation(GO:0031954) |
| 0.0 | 0.4 | GO:0070212 | protein poly-ADP-ribosylation(GO:0070212) |
| 0.0 | 0.2 | GO:0033387 | putrescine biosynthetic process from ornithine(GO:0033387) |
| 0.0 | 0.2 | GO:0006537 | glutamate biosynthetic process(GO:0006537) |
| 0.0 | 0.0 | GO:0001743 | optic placode formation(GO:0001743) optic placode formation involved in camera-type eye formation(GO:0046619) |
| 0.0 | 0.3 | GO:0007494 | midgut development(GO:0007494) |
| 0.0 | 0.2 | GO:0034063 | stress granule assembly(GO:0034063) |
| 0.0 | 0.4 | GO:0006975 | DNA damage induced protein phosphorylation(GO:0006975) |
| 0.0 | 0.1 | GO:0070781 | response to biotin(GO:0070781) |
| 0.0 | 0.1 | GO:0050994 | regulation of lipid catabolic process(GO:0050994) |
| 0.0 | 0.1 | GO:0021562 | vestibulocochlear nerve development(GO:0021562) |
| 0.0 | 0.0 | GO:0003274 | endocardial cushion fusion(GO:0003274) |
| 0.0 | 0.1 | GO:0010936 | negative regulation of macrophage cytokine production(GO:0010936) |
| 0.0 | 0.9 | GO:0045116 | protein neddylation(GO:0045116) |
| 0.0 | 0.0 | GO:0051646 | mitochondrion localization(GO:0051646) |
| 0.0 | 0.1 | GO:0051598 | meiotic DNA double-strand break formation(GO:0042138) meiotic recombination checkpoint(GO:0051598) |
| 0.0 | 0.4 | GO:0002158 | osteoclast proliferation(GO:0002158) |
| 0.0 | 0.5 | GO:0019221 | cytokine-mediated signaling pathway(GO:0019221) |
| 0.0 | 0.2 | GO:2000671 | regulation of motor neuron apoptotic process(GO:2000671) negative regulation of motor neuron apoptotic process(GO:2000672) |
| 0.0 | 0.7 | GO:0070493 | thrombin receptor signaling pathway(GO:0070493) |
| 0.0 | 0.1 | GO:0035494 | SNARE complex disassembly(GO:0035494) |
| 0.0 | 0.9 | GO:0000042 | protein targeting to Golgi(GO:0000042) |
| 0.0 | 0.5 | GO:0016926 | protein desumoylation(GO:0016926) |
| 0.0 | 0.8 | GO:0007021 | tubulin complex assembly(GO:0007021) |
| 0.0 | 0.2 | GO:0035356 | cellular triglyceride homeostasis(GO:0035356) |
| 0.0 | 0.1 | GO:0010390 | histone monoubiquitination(GO:0010390) |
| 0.0 | 0.2 | GO:0070885 | negative regulation of calcineurin-NFAT signaling cascade(GO:0070885) |
| 0.0 | 0.1 | GO:0021812 | neuronal-glial interaction involved in cerebral cortex radial glia guided migration(GO:0021812) |
| 0.0 | 0.2 | GO:0090116 | C-5 methylation of cytosine(GO:0090116) |
| 0.0 | 0.6 | GO:1990118 | sodium ion import across plasma membrane(GO:0098719) sodium ion import into cell(GO:1990118) |
| 0.0 | 2.0 | GO:0061620 | NADH regeneration(GO:0006735) glycolytic process through fructose-6-phosphate(GO:0061615) glycolytic process through glucose-6-phosphate(GO:0061620) canonical glycolysis(GO:0061621) glucose catabolic process to pyruvate(GO:0061718) |
| 0.0 | 0.8 | GO:0007100 | mitotic centrosome separation(GO:0007100) |
| 0.0 | 0.2 | GO:0045656 | negative regulation of monocyte differentiation(GO:0045656) |
| 0.0 | 0.1 | GO:0014049 | positive regulation of glutamate secretion(GO:0014049) |
| 0.0 | 0.5 | GO:0051231 | mitotic spindle elongation(GO:0000022) spindle elongation(GO:0051231) mitotic spindle midzone assembly(GO:0051256) |
| 0.0 | 1.6 | GO:0006607 | NLS-bearing protein import into nucleus(GO:0006607) |
| 0.0 | 0.1 | GO:0015882 | L-ascorbic acid transport(GO:0015882) molecular hydrogen transport(GO:0015993) transepithelial L-ascorbic acid transport(GO:0070904) |
| 0.0 | 0.4 | GO:0035162 | embryonic hemopoiesis(GO:0035162) |
| 0.0 | 0.4 | GO:0060155 | platelet dense granule organization(GO:0060155) |
| 0.0 | 0.2 | GO:0000973 | posttranscriptional tethering of RNA polymerase II gene DNA at nuclear periphery(GO:0000973) |
| 0.0 | 0.6 | GO:0010759 | positive regulation of macrophage chemotaxis(GO:0010759) |
| 0.0 | 0.2 | GO:0016240 | autophagosome docking(GO:0016240) |
| 0.0 | 0.3 | GO:0010603 | regulation of cytoplasmic mRNA processing body assembly(GO:0010603) |
| 0.0 | 0.2 | GO:1903772 | regulation of viral budding via host ESCRT complex(GO:1903772) |
| 0.0 | 0.1 | GO:1904579 | response to thapsigargin(GO:1904578) cellular response to thapsigargin(GO:1904579) response to hypobaric hypoxia(GO:1990910) |
| 0.0 | 0.5 | GO:0090141 | positive regulation of mitochondrial fission(GO:0090141) |
| 0.0 | 3.6 | GO:0042147 | retrograde transport, endosome to Golgi(GO:0042147) |
| 0.0 | 0.3 | GO:1902514 | regulation of calcium ion transmembrane transport via high voltage-gated calcium channel(GO:1902514) |
| 0.0 | 0.6 | GO:0014002 | astrocyte development(GO:0014002) |
| 0.0 | 0.2 | GO:0046086 | adenosine biosynthetic process(GO:0046086) |
| 0.0 | 0.2 | GO:0006556 | S-adenosylmethionine biosynthetic process(GO:0006556) |
| 0.0 | 0.2 | GO:0007041 | lysosomal transport(GO:0007041) |
| 0.0 | 0.0 | GO:1903061 | positive regulation of protein lipidation(GO:1903061) |
| 0.0 | 0.2 | GO:0034201 | response to oleic acid(GO:0034201) |
| 0.0 | 0.2 | GO:0071468 | cellular response to acidic pH(GO:0071468) |
| 0.0 | 0.1 | GO:0006597 | spermine biosynthetic process(GO:0006597) |
| 0.0 | 0.2 | GO:0030070 | insulin processing(GO:0030070) |
| 0.0 | 0.2 | GO:0099563 | modification of synaptic structure(GO:0099563) |
| 0.0 | 3.8 | GO:0001578 | microtubule bundle formation(GO:0001578) |
| 0.0 | 0.2 | GO:0038031 | non-canonical Wnt signaling pathway via JNK cascade(GO:0038031) |
| 0.0 | 0.2 | GO:0006269 | DNA replication, synthesis of RNA primer(GO:0006269) |
| 0.0 | 0.1 | GO:0010796 | regulation of multivesicular body size(GO:0010796) |
| 0.0 | 0.2 | GO:1903715 | regulation of aerobic respiration(GO:1903715) |
| 0.0 | 0.3 | GO:0036150 | phosphatidylserine acyl-chain remodeling(GO:0036150) |
| 0.0 | 0.0 | GO:0033024 | mast cell homeostasis(GO:0033023) mast cell apoptotic process(GO:0033024) regulation of mast cell apoptotic process(GO:0033025) |
| 0.0 | 0.2 | GO:1900047 | negative regulation of blood coagulation(GO:0030195) negative regulation of hemostasis(GO:1900047) |
| 0.0 | 0.7 | GO:0045669 | positive regulation of osteoblast differentiation(GO:0045669) |
| 0.0 | 0.7 | GO:1990126 | retrograde transport, endosome to plasma membrane(GO:1990126) |
| 0.0 | 0.2 | GO:2000691 | negative regulation of cardioblast differentiation(GO:0051892) regulation of cardiac muscle cell myoblast differentiation(GO:2000690) negative regulation of cardiac muscle cell myoblast differentiation(GO:2000691) |
| 0.0 | 0.1 | GO:0036071 | N-glycan fucosylation(GO:0036071) |
| 0.0 | 0.2 | GO:0046833 | positive regulation of nucleobase-containing compound transport(GO:0032241) positive regulation of RNA export from nucleus(GO:0046833) |
| 0.0 | 0.8 | GO:0007084 | mitotic nuclear envelope reassembly(GO:0007084) |
| 0.0 | 0.1 | GO:0043317 | negative regulation of dendritic cell antigen processing and presentation(GO:0002605) regulation of cytotoxic T cell degranulation(GO:0043317) negative regulation of cytotoxic T cell degranulation(GO:0043318) |
| 0.0 | 0.6 | GO:0097150 | neuronal stem cell population maintenance(GO:0097150) |
| 0.0 | 0.0 | GO:0051568 | histone H3-K4 methylation(GO:0051568) |
| 0.0 | 0.0 | GO:0007181 | transforming growth factor beta receptor complex assembly(GO:0007181) |
| 0.0 | 0.2 | GO:0034446 | substrate adhesion-dependent cell spreading(GO:0034446) |
| 0.0 | 0.0 | GO:0021535 | cell migration in hindbrain(GO:0021535) |
| 0.0 | 0.2 | GO:1990822 | basic amino acid transmembrane transport(GO:1990822) |
| 0.0 | 0.0 | GO:0035563 | positive regulation of chromatin binding(GO:0035563) |
| 0.0 | 0.3 | GO:0060710 | chorio-allantoic fusion(GO:0060710) |
| 0.0 | 1.0 | GO:0060216 | definitive hemopoiesis(GO:0060216) |
| 0.0 | 2.0 | GO:0035329 | hippo signaling(GO:0035329) |
| 0.0 | 0.3 | GO:1904417 | regulation of xenophagy(GO:1904415) positive regulation of xenophagy(GO:1904417) |
| 0.0 | 0.9 | GO:0043476 | pigment accumulation(GO:0043476) cellular pigment accumulation(GO:0043482) |
| 0.0 | 0.1 | GO:0023016 | signal transduction by trans-phosphorylation(GO:0023016) |
| 0.0 | 0.1 | GO:0019287 | isopentenyl diphosphate biosynthetic process, mevalonate pathway(GO:0019287) |
| 0.0 | 1.1 | GO:0042276 | error-prone translesion synthesis(GO:0042276) |
| 0.0 | 0.5 | GO:0031570 | DNA integrity checkpoint(GO:0031570) |
| 0.0 | 0.1 | GO:0046666 | retinal cell programmed cell death(GO:0046666) |
| 0.0 | 0.3 | GO:1904354 | negative regulation of telomere capping(GO:1904354) |
| 0.0 | 0.1 | GO:0010387 | COP9 signalosome assembly(GO:0010387) |
| 0.0 | 0.1 | GO:0034334 | adherens junction maintenance(GO:0034334) |
| 0.0 | 0.3 | GO:0018103 | protein C-linked glycosylation(GO:0018103) peptidyl-tryptophan modification(GO:0018211) protein C-linked glycosylation via tryptophan(GO:0018317) protein C-linked glycosylation via 2'-alpha-mannosyl-L-tryptophan(GO:0018406) |
| 0.0 | 0.4 | GO:0033962 | cytoplasmic mRNA processing body assembly(GO:0033962) |
| 0.0 | 0.1 | GO:0045648 | positive regulation of erythrocyte differentiation(GO:0045648) |
| 0.0 | 0.4 | GO:0031274 | positive regulation of pseudopodium assembly(GO:0031274) |
| 0.0 | 0.2 | GO:0019303 | D-ribose catabolic process(GO:0019303) |
| 0.0 | 0.2 | GO:0006651 | diacylglycerol biosynthetic process(GO:0006651) |
| 0.0 | 0.0 | GO:0030836 | positive regulation of actin filament depolymerization(GO:0030836) |
| 0.0 | 0.1 | GO:2000987 | positive regulation of fear response(GO:1903367) positive regulation of behavioral fear response(GO:2000987) |
| 0.0 | 2.2 | GO:0021762 | substantia nigra development(GO:0021762) |
| 0.0 | 0.2 | GO:0032528 | microvillus organization(GO:0032528) |
| 0.0 | 0.6 | GO:0006590 | thyroid hormone generation(GO:0006590) |
| 0.0 | 0.2 | GO:1904153 | negative regulation of protein exit from endoplasmic reticulum(GO:0070862) negative regulation of retrograde protein transport, ER to cytosol(GO:1904153) |
| 0.0 | 0.4 | GO:0048013 | ephrin receptor signaling pathway(GO:0048013) |
| 0.0 | 0.1 | GO:0036003 | positive regulation of transcription from RNA polymerase II promoter in response to stress(GO:0036003) |
| 0.0 | 0.1 | GO:0001983 | regulation of systemic arterial blood pressure by carotid sinus baroreceptor feedback(GO:0001978) baroreceptor response to increased systemic arterial blood pressure(GO:0001983) |
| 0.0 | 2.3 | GO:0043966 | histone H3 acetylation(GO:0043966) |
| 0.0 | 0.1 | GO:0030953 | astral microtubule organization(GO:0030953) |
| 0.0 | 0.2 | GO:0048227 | plasma membrane to endosome transport(GO:0048227) |
| 0.0 | 0.1 | GO:0009240 | isopentenyl diphosphate biosynthetic process(GO:0009240) isopentenyl diphosphate metabolic process(GO:0046490) |
| 0.0 | 0.4 | GO:0051560 | mitochondrial calcium ion homeostasis(GO:0051560) |
| 0.0 | 0.4 | GO:0038007 | netrin-activated signaling pathway(GO:0038007) |
| 0.0 | 0.1 | GO:0061343 | cell adhesion involved in heart morphogenesis(GO:0061343) |
| 0.0 | 0.1 | GO:0060292 | long term synaptic depression(GO:0060292) |
| 0.0 | 0.0 | GO:0034508 | centromere complex assembly(GO:0034508) |
| 0.0 | 0.0 | GO:0036091 | positive regulation of transcription from RNA polymerase II promoter in response to oxidative stress(GO:0036091) |
| 0.0 | 0.7 | GO:0007625 | grooming behavior(GO:0007625) |
| 0.0 | 0.1 | GO:0032288 | myelin assembly(GO:0032288) |
| 0.0 | 0.0 | GO:0080135 | regulation of cellular response to stress(GO:0080135) |
| 0.0 | 0.1 | GO:0090107 | regulation of high-density lipoprotein particle assembly(GO:0090107) |
| 0.0 | 0.5 | GO:0040015 | negative regulation of multicellular organism growth(GO:0040015) |
| 0.0 | 0.2 | GO:0016191 | synaptic vesicle uncoating(GO:0016191) |
| 0.0 | 0.2 | GO:0000972 | transcription-dependent tethering of RNA polymerase II gene DNA at nuclear periphery(GO:0000972) |
| 0.0 | 0.2 | GO:0071104 | response to interleukin-9(GO:0071104) |
| 0.0 | 0.2 | GO:0035519 | protein K29-linked ubiquitination(GO:0035519) |
| 0.0 | 0.3 | GO:0031120 | snRNA pseudouridine synthesis(GO:0031120) |
| 0.0 | 0.3 | GO:0048793 | pronephros development(GO:0048793) |
| 0.0 | 0.7 | GO:0071108 | protein K48-linked deubiquitination(GO:0071108) |
| 0.0 | 0.3 | GO:0061158 | 3'-UTR-mediated mRNA destabilization(GO:0061158) |
| 0.0 | 0.3 | GO:0045048 | protein insertion into ER membrane(GO:0045048) |
| 0.0 | 0.0 | GO:0048845 | venous blood vessel morphogenesis(GO:0048845) |
| 0.0 | 0.1 | GO:0035553 | oxidative RNA demethylation(GO:0035513) oxidative single-stranded RNA demethylation(GO:0035553) |
| 0.0 | 0.7 | GO:0070935 | 3'-UTR-mediated mRNA stabilization(GO:0070935) |
| 0.0 | 0.7 | GO:0039702 | viral budding via host ESCRT complex(GO:0039702) |
| 0.0 | 0.5 | GO:0042789 | mRNA transcription from RNA polymerase II promoter(GO:0042789) |
| 0.0 | 0.0 | GO:0045053 | protein retention in Golgi apparatus(GO:0045053) |
| 0.0 | 0.0 | GO:0048668 | collateral sprouting(GO:0048668) |
| 0.0 | 0.2 | GO:0050955 | thermoception(GO:0050955) detection of chemical stimulus involved in sensory perception of pain(GO:0050968) |
| 0.0 | 0.1 | GO:0060666 | dichotomous subdivision of terminal units involved in salivary gland branching(GO:0060666) |
| 0.0 | 0.6 | GO:2000114 | regulation of establishment of cell polarity(GO:2000114) |
| 0.0 | 0.1 | GO:0061056 | sclerotome development(GO:0061056) |
| 0.0 | 0.0 | GO:1901837 | negative regulation of transcription of nuclear large rRNA transcript from RNA polymerase I promoter(GO:1901837) |
| 0.0 | 0.3 | GO:0009855 | specification of symmetry(GO:0009799) determination of bilateral symmetry(GO:0009855) |
| 0.0 | 0.1 | GO:0036166 | phenotypic switching(GO:0036166) regulation of phenotypic switching(GO:1900239) |
| 0.0 | 3.1 | GO:0006369 | termination of RNA polymerase II transcription(GO:0006369) |
| 0.0 | 0.1 | GO:0048213 | Golgi vesicle prefusion complex stabilization(GO:0048213) |
| 0.0 | 0.1 | GO:0032075 | positive regulation of nuclease activity(GO:0032075) |
| 0.0 | 0.3 | GO:0010457 | centriole-centriole cohesion(GO:0010457) |
| 0.0 | 0.0 | GO:0021644 | vagus nerve morphogenesis(GO:0021644) |
| 0.0 | 0.1 | GO:0030225 | macrophage differentiation(GO:0030225) |
| 0.0 | 0.2 | GO:0045629 | negative regulation of T-helper 2 cell differentiation(GO:0045629) |
| 0.0 | 1.0 | GO:0070911 | global genome nucleotide-excision repair(GO:0070911) |
| 0.0 | 0.0 | GO:0009051 | pentose-phosphate shunt, oxidative branch(GO:0009051) |
| 0.0 | 1.3 | GO:0031572 | G2 DNA damage checkpoint(GO:0031572) |
| 0.0 | 0.5 | GO:0045600 | positive regulation of fat cell differentiation(GO:0045600) |
| 0.0 | 0.1 | GO:0050859 | negative regulation of B cell receptor signaling pathway(GO:0050859) |
| 0.0 | 0.0 | GO:0001562 | response to protozoan(GO:0001562) defense response to protozoan(GO:0042832) |
| 0.0 | 0.5 | GO:0071420 | cellular response to histamine(GO:0071420) |
| 0.0 | 0.1 | GO:0035766 | cell chemotaxis to fibroblast growth factor(GO:0035766) endothelial cell chemotaxis to fibroblast growth factor(GO:0035768) regulation of cell chemotaxis to fibroblast growth factor(GO:1904847) regulation of endothelial cell chemotaxis to fibroblast growth factor(GO:2000544) |
| 0.0 | 0.2 | GO:0072367 | regulation of lipid transport by regulation of transcription from RNA polymerase II promoter(GO:0072367) |
| 0.0 | 1.6 | GO:0030032 | lamellipodium assembly(GO:0030032) |
| 0.0 | 0.2 | GO:0007144 | female meiosis I(GO:0007144) |
| 0.0 | 0.3 | GO:2000574 | regulation of microtubule motor activity(GO:2000574) positive regulation of microtubule motor activity(GO:2000576) regulation of ATP-dependent microtubule motor activity, plus-end-directed(GO:2000580) positive regulation of ATP-dependent microtubule motor activity, plus-end-directed(GO:2000582) |
| 0.0 | 0.2 | GO:2000042 | negative regulation of double-strand break repair via homologous recombination(GO:2000042) |
| 0.0 | 0.1 | GO:2000622 | regulation of nuclear-transcribed mRNA catabolic process, nonsense-mediated decay(GO:2000622) negative regulation of nuclear-transcribed mRNA catabolic process, nonsense-mediated decay(GO:2000623) |
| 0.0 | 0.2 | GO:2000425 | regulation of apoptotic cell clearance(GO:2000425) positive regulation of apoptotic cell clearance(GO:2000427) |
| 0.0 | 0.4 | GO:0060628 | regulation of ER to Golgi vesicle-mediated transport(GO:0060628) |
| 0.0 | 0.1 | GO:0019626 | short-chain fatty acid catabolic process(GO:0019626) |
| 0.0 | 0.2 | GO:0009181 | purine nucleoside diphosphate catabolic process(GO:0009137) purine ribonucleoside diphosphate catabolic process(GO:0009181) |
| 0.0 | 0.3 | GO:0030422 | production of siRNA involved in RNA interference(GO:0030422) |
| 0.0 | 0.2 | GO:1990416 | cellular response to brain-derived neurotrophic factor stimulus(GO:1990416) |
| 0.0 | 0.2 | GO:0032380 | regulation of intracellular lipid transport(GO:0032377) regulation of intracellular sterol transport(GO:0032380) regulation of intracellular cholesterol transport(GO:0032383) |
| 0.0 | 0.2 | GO:1990539 | fructose transport(GO:0015755) fructose import(GO:0032445) cellular response to fructose stimulus(GO:0071332) carbohydrate import into cell(GO:0097319) carbohydrate import across plasma membrane(GO:0098704) fructose import across plasma membrane(GO:1990539) |
| 0.0 | 0.2 | GO:1902969 | mitotic DNA replication(GO:1902969) |
| 0.0 | 0.1 | GO:1900226 | negative regulation of NLRP3 inflammasome complex assembly(GO:1900226) |
| 0.0 | 0.2 | GO:0055129 | L-proline biosynthetic process(GO:0055129) |
| 0.0 | 0.1 | GO:2000189 | positive regulation of cholesterol homeostasis(GO:2000189) |
| 0.0 | 0.1 | GO:1902047 | polyamine transmembrane transport(GO:1902047) regulation of polyamine transmembrane transport(GO:1902267) negative regulation of polyamine transmembrane transport(GO:1902268) |
| 0.0 | 0.2 | GO:0051451 | myoblast migration(GO:0051451) |
| 0.0 | 0.4 | GO:0070050 | neuron cellular homeostasis(GO:0070050) |
| 0.0 | 0.4 | GO:0061635 | regulation of protein complex stability(GO:0061635) |
| 0.0 | 0.1 | GO:1902412 | regulation of mitotic cytokinesis(GO:1902412) |
| 0.0 | 2.3 | GO:0031338 | regulation of vesicle fusion(GO:0031338) |
| 0.0 | 0.1 | GO:0002793 | positive regulation of peptide secretion(GO:0002793) |
| 0.0 | 0.9 | GO:0046676 | negative regulation of insulin secretion(GO:0046676) |
| 0.0 | 0.2 | GO:0030199 | collagen fibril organization(GO:0030199) |
| 0.0 | 0.1 | GO:0071361 | cellular response to ethanol(GO:0071361) |
| 0.0 | 0.4 | GO:1902222 | L-phenylalanine metabolic process(GO:0006558) L-phenylalanine catabolic process(GO:0006559) erythrose 4-phosphate/phosphoenolpyruvate family amino acid metabolic process(GO:1902221) erythrose 4-phosphate/phosphoenolpyruvate family amino acid catabolic process(GO:1902222) |
| 0.0 | 0.1 | GO:0032963 | collagen metabolic process(GO:0032963) |
| 0.0 | 0.1 | GO:0000733 | DNA strand renaturation(GO:0000733) |
| 0.0 | 0.8 | GO:0006376 | mRNA splice site selection(GO:0006376) |
| 0.0 | 0.1 | GO:0003050 | regulation of systemic arterial blood pressure by atrial natriuretic peptide(GO:0003050) |
| 0.0 | 0.2 | GO:2000825 | positive regulation of androgen receptor activity(GO:2000825) |
| 0.0 | 0.0 | GO:0060541 | respiratory system development(GO:0060541) |
| 0.0 | 0.1 | GO:0097084 | vascular smooth muscle cell development(GO:0097084) |
| 0.0 | 0.1 | GO:0017004 | cytochrome complex assembly(GO:0017004) |
| 0.0 | 0.1 | GO:0021882 | regulation of transcription from RNA polymerase II promoter involved in forebrain neuron fate commitment(GO:0021882) cerebral cortex GABAergic interneuron fate commitment(GO:0021893) positive regulation of neural retina development(GO:0061075) positive regulation of retina development in camera-type eye(GO:1902868) regulation of amacrine cell differentiation(GO:1902869) positive regulation of amacrine cell differentiation(GO:1902871) |
| 0.0 | 0.1 | GO:0006278 | RNA-dependent DNA biosynthetic process(GO:0006278) telomere maintenance via telomerase(GO:0007004) |
| 0.0 | 0.1 | GO:0090080 | positive regulation of MAPKKK cascade by fibroblast growth factor receptor signaling pathway(GO:0090080) |
| 0.0 | 0.1 | GO:1903070 | negative regulation of ER-associated ubiquitin-dependent protein catabolic process(GO:1903070) |
| 0.0 | 0.6 | GO:0051764 | actin crosslink formation(GO:0051764) |
| 0.0 | 0.0 | GO:0002644 | negative regulation of tolerance induction(GO:0002644) |
| 0.0 | 0.3 | GO:0098828 | positive regulation of inhibitory postsynaptic potential(GO:0097151) modulation of inhibitory postsynaptic potential(GO:0098828) |
| 0.0 | 0.1 | GO:0070898 | RNA polymerase III transcriptional preinitiation complex assembly(GO:0070898) |
| 0.0 | 0.5 | GO:0044804 | nucleophagy(GO:0044804) |
| 0.0 | 0.1 | GO:0071529 | cementum mineralization(GO:0071529) |
| 0.0 | 0.3 | GO:0070072 | proton-transporting V-type ATPase complex assembly(GO:0070070) vacuolar proton-transporting V-type ATPase complex assembly(GO:0070072) |
| 0.0 | 0.1 | GO:0036010 | protein localization to endosome(GO:0036010) |
| 0.0 | 0.8 | GO:0015985 | energy coupled proton transport, down electrochemical gradient(GO:0015985) ATP synthesis coupled proton transport(GO:0015986) |
| 0.0 | 0.1 | GO:0071157 | negative regulation of cell cycle arrest(GO:0071157) |
| 0.0 | 1.1 | GO:0097352 | autophagosome maturation(GO:0097352) |
| 0.0 | 0.4 | GO:0031146 | SCF-dependent proteasomal ubiquitin-dependent protein catabolic process(GO:0031146) |
| 0.0 | 0.1 | GO:0045945 | positive regulation of transcription from RNA polymerase III promoter(GO:0045945) |
| 0.0 | 0.3 | GO:0051016 | barbed-end actin filament capping(GO:0051016) |
| 0.0 | 1.0 | GO:0050690 | regulation of defense response to virus by virus(GO:0050690) |
| 0.0 | 0.1 | GO:0060158 | phospholipase C-activating dopamine receptor signaling pathway(GO:0060158) |
| 0.0 | 0.1 | GO:0031116 | positive regulation of microtubule polymerization(GO:0031116) |
| 0.0 | 0.3 | GO:0042420 | dopamine catabolic process(GO:0042420) |
| 0.0 | 0.2 | GO:0045662 | negative regulation of myoblast differentiation(GO:0045662) |
| 0.0 | 1.6 | GO:0007157 | heterophilic cell-cell adhesion via plasma membrane cell adhesion molecules(GO:0007157) |
| 0.0 | 0.1 | GO:0045897 | positive regulation of transcription during mitosis(GO:0045897) |
| 0.0 | 0.1 | GO:0038162 | erythropoietin-mediated signaling pathway(GO:0038162) |
| 0.0 | 0.2 | GO:2000311 | regulation of alpha-amino-3-hydroxy-5-methyl-4-isoxazole propionate selective glutamate receptor activity(GO:2000311) |
| 0.0 | 0.0 | GO:1900119 | positive regulation of execution phase of apoptosis(GO:1900119) |
| 0.0 | 0.8 | GO:0043968 | histone H2A acetylation(GO:0043968) |
| 0.0 | 0.3 | GO:0006228 | UTP biosynthetic process(GO:0006228) |
| 0.0 | 0.1 | GO:0031087 | nuclear-transcribed mRNA catabolic process, deadenylation-independent decay(GO:0031086) deadenylation-independent decapping of nuclear-transcribed mRNA(GO:0031087) |
| 0.0 | 0.1 | GO:0090155 | negative regulation of sphingolipid biosynthetic process(GO:0090155) cellular sphingolipid homeostasis(GO:0090156) negative regulation of ceramide biosynthetic process(GO:1900060) |
| 0.0 | 0.0 | GO:0017055 | negative regulation of RNA polymerase II transcriptional preinitiation complex assembly(GO:0017055) positive regulation of female receptivity(GO:0045925) |
| 0.0 | 0.5 | GO:0034643 | establishment of mitochondrion localization, microtubule-mediated(GO:0034643) mitochondrion transport along microtubule(GO:0047497) |
| 0.0 | 0.5 | GO:0071236 | cellular response to antibiotic(GO:0071236) |
| 0.0 | 0.1 | GO:0014040 | positive regulation of Schwann cell differentiation(GO:0014040) |
| 0.0 | 0.1 | GO:0015670 | carbon dioxide transport(GO:0015670) |
| 0.0 | 0.2 | GO:0036438 | maintenance of lens transparency(GO:0036438) |
| 0.0 | 0.1 | GO:0045743 | positive regulation of fibroblast growth factor receptor signaling pathway(GO:0045743) |
| 0.0 | 0.6 | GO:0048713 | regulation of oligodendrocyte differentiation(GO:0048713) |
| 0.0 | 0.0 | GO:0036475 | neuron death in response to oxidative stress(GO:0036475) |
| 0.0 | 0.3 | GO:0030214 | hyaluronan catabolic process(GO:0030214) |
| 0.0 | 0.4 | GO:0007191 | adenylate cyclase-activating dopamine receptor signaling pathway(GO:0007191) |
| 0.0 | 0.1 | GO:0033084 | regulation of immature T cell proliferation in thymus(GO:0033084) |
| 0.0 | 0.2 | GO:0006983 | ER overload response(GO:0006983) |
| 0.0 | 0.0 | GO:1900122 | positive regulation of receptor binding(GO:1900122) |
| 0.0 | 1.6 | GO:0007588 | excretion(GO:0007588) |
| 0.0 | 0.5 | GO:0030834 | regulation of actin filament depolymerization(GO:0030834) |
| 0.0 | 0.2 | GO:0003065 | positive regulation of heart rate by epinephrine(GO:0003065) |
| 0.0 | 0.1 | GO:0031145 | anaphase-promoting complex-dependent catabolic process(GO:0031145) |
| 0.0 | 0.1 | GO:0006549 | isoleucine metabolic process(GO:0006549) isoleucine catabolic process(GO:0006550) |
| 0.0 | 0.0 | GO:0000492 | box C/D snoRNP assembly(GO:0000492) |
| 0.0 | 0.2 | GO:0031468 | nuclear envelope reassembly(GO:0031468) |
| 0.0 | 0.0 | GO:0034776 | response to histamine(GO:0034776) |
| 0.0 | 0.5 | GO:0021542 | dentate gyrus development(GO:0021542) |
| 0.0 | 0.2 | GO:0032025 | response to cobalt ion(GO:0032025) |
| 0.0 | 0.0 | GO:1901660 | calcium ion export(GO:1901660) calcium ion export from cell(GO:1990034) |
| 0.0 | 0.1 | GO:0001542 | ovulation from ovarian follicle(GO:0001542) |
| 0.0 | 0.1 | GO:0039532 | negative regulation of viral-induced cytoplasmic pattern recognition receptor signaling pathway(GO:0039532) negative regulation of RIG-I signaling pathway(GO:0039536) |
| 0.0 | 0.0 | GO:1902525 | regulation of protein monoubiquitination(GO:1902525) |
| 0.0 | 0.1 | GO:0008589 | regulation of smoothened signaling pathway(GO:0008589) |
| 0.0 | 0.1 | GO:0061370 | testosterone biosynthetic process(GO:0061370) |
| 0.0 | 0.1 | GO:0034983 | peptidyl-lysine deacetylation(GO:0034983) |
| 0.0 | 0.1 | GO:0032057 | negative regulation of translational initiation in response to stress(GO:0032057) |
| 0.0 | 0.3 | GO:0032098 | regulation of appetite(GO:0032098) |
| 0.0 | 0.2 | GO:0098535 | de novo centriole assembly(GO:0098535) |
| 0.0 | 0.1 | GO:1901165 | positive regulation of trophoblast cell migration(GO:1901165) |
| 0.0 | 0.1 | GO:0001957 | intramembranous ossification(GO:0001957) direct ossification(GO:0036072) |
| 0.0 | 0.2 | GO:0035372 | protein localization to microtubule(GO:0035372) |
| 0.0 | 0.1 | GO:0097369 | sodium ion import(GO:0097369) |
| 0.0 | 0.2 | GO:0006552 | leucine catabolic process(GO:0006552) |
| 0.0 | 0.1 | GO:0042984 | amyloid precursor protein biosynthetic process(GO:0042983) regulation of amyloid precursor protein biosynthetic process(GO:0042984) |
| 0.0 | 0.1 | GO:0098707 | ferrous iron import into cell(GO:0097460) ferrous iron import across plasma membrane(GO:0098707) |
| 0.0 | 0.5 | GO:0032012 | regulation of ARF protein signal transduction(GO:0032012) |
| 0.0 | 0.1 | GO:0018032 | protein amidation(GO:0018032) |
| 0.0 | 0.1 | GO:0019336 | phenol-containing compound catabolic process(GO:0019336) |
| 0.0 | 0.2 | GO:0045739 | positive regulation of DNA repair(GO:0045739) |
| 0.0 | 0.3 | GO:0061154 | endothelial tube morphogenesis(GO:0061154) |
| 0.0 | 0.1 | GO:0061624 | fructose catabolic process(GO:0006001) fructose catabolic process to hydroxyacetone phosphate and glyceraldehyde-3-phosphate(GO:0061624) |
| 0.0 | 0.2 | GO:0030050 | vesicle transport along actin filament(GO:0030050) actin filament-based transport(GO:0099515) |
| 0.0 | 0.1 | GO:0007613 | memory(GO:0007613) |
| 0.0 | 0.0 | GO:0006114 | glycerol biosynthetic process(GO:0006114) |
| 0.0 | 0.1 | GO:0002175 | protein localization to paranode region of axon(GO:0002175) |
| 0.0 | 0.3 | GO:1903204 | negative regulation of oxidative stress-induced neuron death(GO:1903204) |
| 0.0 | 0.1 | GO:0061314 | Notch signaling involved in heart development(GO:0061314) |
| 0.0 | 0.1 | GO:0045065 | cytotoxic T cell differentiation(GO:0045065) |
| 0.0 | 0.4 | GO:0097435 | fibril organization(GO:0097435) |
| 0.0 | 0.1 | GO:1900364 | negative regulation of mRNA polyadenylation(GO:1900364) |
| 0.0 | 0.3 | GO:0051642 | centrosome localization(GO:0051642) |
| 0.0 | 0.0 | GO:0051138 | positive regulation of NK T cell differentiation(GO:0051138) |
| 0.0 | 0.1 | GO:0070306 | lens fiber cell differentiation(GO:0070306) |
| 0.0 | 0.1 | GO:1904672 | regulation of somatic stem cell population maintenance(GO:1904672) positive regulation of somatic stem cell population maintenance(GO:1904674) |
| 0.0 | 0.1 | GO:0050434 | positive regulation of viral transcription(GO:0050434) |
| 0.0 | 0.2 | GO:0046185 | aldehyde catabolic process(GO:0046185) |
| 0.0 | 0.7 | GO:0043928 | exonucleolytic nuclear-transcribed mRNA catabolic process involved in deadenylation-dependent decay(GO:0043928) |
| 0.0 | 0.1 | GO:0046116 | queuosine biosynthetic process(GO:0008616) queuosine metabolic process(GO:0046116) |
| 0.0 | 0.1 | GO:0006663 | platelet activating factor biosynthetic process(GO:0006663) |
| 0.0 | 0.2 | GO:0046323 | glucose import(GO:0046323) |
| 0.0 | 0.1 | GO:0035864 | response to potassium ion(GO:0035864) cellular response to potassium ion(GO:0035865) |
| 0.0 | 0.1 | GO:0035562 | negative regulation of chromatin binding(GO:0035562) |
| 0.0 | 0.4 | GO:0034587 | piRNA metabolic process(GO:0034587) |
| 0.0 | 0.0 | GO:0046069 | cGMP catabolic process(GO:0046069) |
| 0.0 | 0.1 | GO:2000109 | regulation of macrophage apoptotic process(GO:2000109) |
| 0.0 | 0.2 | GO:0006268 | DNA unwinding involved in DNA replication(GO:0006268) |
| 0.0 | 0.1 | GO:0046452 | dihydrofolate metabolic process(GO:0046452) |
| 0.0 | 0.1 | GO:0019255 | glucose 1-phosphate metabolic process(GO:0019255) |
| 0.0 | 0.7 | GO:0032418 | lysosome localization(GO:0032418) |
| 0.0 | 0.1 | GO:2000196 | positive regulation of female gonad development(GO:2000196) |
| 0.0 | 0.3 | GO:2000352 | negative regulation of endothelial cell apoptotic process(GO:2000352) |
| 0.0 | 0.1 | GO:1903608 | protein localization to cytoplasmic stress granule(GO:1903608) |
| 0.0 | 0.0 | GO:0050720 | interleukin-1 beta biosynthetic process(GO:0050720) |
| 0.0 | 0.0 | GO:0043449 | cellular alkene metabolic process(GO:0043449) |
| 0.0 | 0.5 | GO:0033120 | positive regulation of RNA splicing(GO:0033120) |
| 0.0 | 0.0 | GO:1902850 | microtubule cytoskeleton organization involved in mitosis(GO:1902850) |
| 0.0 | 0.1 | GO:1901897 | regulation of relaxation of cardiac muscle(GO:1901897) |
| 0.0 | 0.1 | GO:0051342 | regulation of cyclic-nucleotide phosphodiesterase activity(GO:0051342) negative regulation of cyclic-nucleotide phosphodiesterase activity(GO:0051344) |
| 0.0 | 0.1 | GO:0035457 | cellular response to interferon-alpha(GO:0035457) |
| 0.0 | 0.1 | GO:0086046 | membrane depolarization during SA node cell action potential(GO:0086046) |
| 0.0 | 0.2 | GO:0010569 | regulation of double-strand break repair via homologous recombination(GO:0010569) |
| 0.0 | 0.1 | GO:0006669 | sphinganine-1-phosphate biosynthetic process(GO:0006669) |
| 0.0 | 0.3 | GO:0090110 | cargo loading into COPII-coated vesicle(GO:0090110) |
| 0.0 | 0.4 | GO:0046677 | response to antibiotic(GO:0046677) |
| 0.0 | 0.0 | GO:0070253 | somatostatin secretion(GO:0070253) |
| 0.0 | 0.1 | GO:0030011 | maintenance of cell polarity(GO:0030011) |
| 0.0 | 0.0 | GO:0043323 | regulation of natural killer cell degranulation(GO:0043321) positive regulation of natural killer cell degranulation(GO:0043323) |
| 0.0 | 0.1 | GO:0032074 | negative regulation of nuclease activity(GO:0032074) |
| 0.0 | 0.2 | GO:0000055 | ribosomal large subunit export from nucleus(GO:0000055) ribosomal small subunit export from nucleus(GO:0000056) |
| 0.0 | 0.2 | GO:1902857 | positive regulation of nonmotile primary cilium assembly(GO:1902857) |
| 0.0 | 0.2 | GO:0032703 | negative regulation of interleukin-2 production(GO:0032703) |
| 0.0 | 0.1 | GO:1903525 | regulation of membrane tubulation(GO:1903525) |
| 0.0 | 0.1 | GO:2000504 | positive regulation of blood vessel remodeling(GO:2000504) |
| 0.0 | 0.0 | GO:0038178 | complement component C5a signaling pathway(GO:0038178) negative regulation of granulocyte chemotaxis(GO:0071623) negative regulation of neutrophil chemotaxis(GO:0090024) negative regulation of neutrophil migration(GO:1902623) |
| 0.0 | 0.2 | GO:0015939 | pantothenate metabolic process(GO:0015939) |
| 0.0 | 0.3 | GO:0006379 | mRNA cleavage(GO:0006379) |
| 0.0 | 0.1 | GO:0050655 | dermatan sulfate proteoglycan metabolic process(GO:0050655) |
| 0.0 | 0.0 | GO:2000562 | negative regulation of CD4-positive, alpha-beta T cell proliferation(GO:2000562) |
| 0.0 | 0.1 | GO:0006616 | SRP-dependent cotranslational protein targeting to membrane, translocation(GO:0006616) |
| 0.0 | 3.4 | GO:0006888 | ER to Golgi vesicle-mediated transport(GO:0006888) |
| 0.0 | 0.2 | GO:0035268 | protein mannosylation(GO:0035268) |
| 0.0 | 0.1 | GO:0060134 | prepulse inhibition(GO:0060134) |
| 0.0 | 0.2 | GO:0045793 | positive regulation of cell size(GO:0045793) |
| 0.0 | 0.0 | GO:0043587 | tongue morphogenesis(GO:0043587) |
| 0.0 | 0.0 | GO:1990834 | response to odorant(GO:1990834) |
| 0.0 | 0.1 | GO:0044208 | 'de novo' AMP biosynthetic process(GO:0044208) |
| 0.0 | 0.1 | GO:0035617 | stress granule disassembly(GO:0035617) |
| 0.0 | 0.0 | GO:0043922 | negative regulation by host of viral transcription(GO:0043922) |
| 0.0 | 0.0 | GO:0072600 | establishment of protein localization to Golgi(GO:0072600) |
| 0.0 | 0.1 | GO:0090557 | establishment of endothelial intestinal barrier(GO:0090557) |
| 0.0 | 0.2 | GO:0061157 | mRNA destabilization(GO:0061157) |
| 0.0 | 1.5 | GO:0006501 | C-terminal protein lipidation(GO:0006501) |
| 0.0 | 1.8 | GO:0009267 | cellular response to starvation(GO:0009267) |
| 0.0 | 2.3 | GO:0007173 | epidermal growth factor receptor signaling pathway(GO:0007173) |
| 0.0 | 0.1 | GO:2000270 | negative regulation of fibroblast apoptotic process(GO:2000270) |
| 0.0 | 0.1 | GO:0051457 | maintenance of protein location in nucleus(GO:0051457) |
| 0.0 | 0.1 | GO:0007257 | activation of JUN kinase activity(GO:0007257) |
| 0.0 | 0.0 | GO:0039694 | viral RNA genome replication(GO:0039694) RNA replication(GO:0039703) |
| 0.0 | 0.1 | GO:2000255 | negative regulation of male germ cell proliferation(GO:2000255) |
| 0.0 | 0.1 | GO:1904381 | Golgi apparatus mannose trimming(GO:1904381) |
| 0.0 | 0.2 | GO:0043982 | histone H4-K5 acetylation(GO:0043981) histone H4-K8 acetylation(GO:0043982) |
| 0.0 | 0.1 | GO:0042045 | epithelial fluid transport(GO:0042045) |
| 0.0 | 0.1 | GO:0031987 | locomotion involved in locomotory behavior(GO:0031987) |
| 0.0 | 0.3 | GO:0048266 | behavioral response to pain(GO:0048266) |
| 0.0 | 0.1 | GO:2000774 | positive regulation of cellular senescence(GO:2000774) |
| 0.0 | 0.5 | GO:0097340 | inhibition of cysteine-type endopeptidase activity(GO:0097340) zymogen inhibition(GO:0097341) |
| 0.0 | 0.2 | GO:0070816 | phosphorylation of RNA polymerase II C-terminal domain(GO:0070816) |
| 0.0 | 0.1 | GO:0044375 | regulation of peroxisome size(GO:0044375) |
| 0.0 | 0.1 | GO:1903861 | positive regulation of dendrite extension(GO:1903861) |
| 0.0 | 0.1 | GO:0010934 | macrophage cytokine production(GO:0010934) |
| 0.0 | 0.2 | GO:0035773 | insulin secretion involved in cellular response to glucose stimulus(GO:0035773) |
| 0.0 | 0.1 | GO:0034472 | snRNA 3'-end processing(GO:0034472) |
| 0.0 | 0.1 | GO:0097190 | apoptotic signaling pathway(GO:0097190) |
| 0.0 | 0.0 | GO:0034698 | response to gonadotropin(GO:0034698) |
| 0.0 | 0.0 | GO:0003139 | secondary heart field specification(GO:0003139) |
| 0.0 | 0.0 | GO:0042989 | sequestering of actin monomers(GO:0042989) |
| 0.0 | 0.1 | GO:1902916 | positive regulation of protein polyubiquitination(GO:1902916) |
| 0.0 | 0.1 | GO:0070901 | mitochondrial tRNA methylation(GO:0070901) |
| 0.0 | 0.1 | GO:0051205 | protein insertion into membrane(GO:0051205) |
| 0.0 | 0.0 | GO:0060830 | ciliary receptor clustering involved in smoothened signaling pathway(GO:0060830) |
| 0.0 | 0.4 | GO:1901099 | negative regulation of signal transduction in absence of ligand(GO:1901099) negative regulation of extrinsic apoptotic signaling pathway in absence of ligand(GO:2001240) |
| 0.0 | 0.1 | GO:0045292 | mRNA cis splicing, via spliceosome(GO:0045292) |
| 0.0 | 0.0 | GO:1900449 | regulation of glutamate receptor signaling pathway(GO:1900449) |
| 0.0 | 0.1 | GO:2000001 | regulation of DNA damage checkpoint(GO:2000001) |
| 0.0 | 0.0 | GO:0048478 | replication fork protection(GO:0048478) |
| 0.0 | 0.2 | GO:0051601 | exocyst localization(GO:0051601) |
| 0.0 | 0.4 | GO:1990090 | cellular response to nerve growth factor stimulus(GO:1990090) |
| 0.0 | 0.1 | GO:0070294 | renal sodium ion transport(GO:0003096) renal sodium ion absorption(GO:0070294) |
| 0.0 | 0.0 | GO:2000078 | glandular epithelial cell maturation(GO:0002071) type B pancreatic cell maturation(GO:0072560) positive regulation of type B pancreatic cell development(GO:2000078) |
| 0.0 | 0.2 | GO:0015816 | glycine transport(GO:0015816) |
| 0.0 | 0.1 | GO:0050684 | regulation of mRNA processing(GO:0050684) |
| 0.0 | 0.1 | GO:0071364 | response to epidermal growth factor(GO:0070849) cellular response to epidermal growth factor stimulus(GO:0071364) |
| 0.0 | 0.2 | GO:0043488 | regulation of mRNA stability(GO:0043488) |
| 0.0 | 0.1 | GO:0090201 | negative regulation of release of cytochrome c from mitochondria(GO:0090201) |
| 0.0 | 0.0 | GO:0048852 | diencephalon morphogenesis(GO:0048852) |
| 0.0 | 0.0 | GO:0048484 | enteric nervous system development(GO:0048484) |
| 0.0 | 0.2 | GO:0006754 | ATP biosynthetic process(GO:0006754) |
| 0.0 | 0.5 | GO:0097503 | sialylation(GO:0097503) |
| 0.0 | 0.1 | GO:0018094 | protein polyglycylation(GO:0018094) |
| 0.0 | 0.2 | GO:0006564 | L-serine biosynthetic process(GO:0006564) |
| 0.0 | 0.1 | GO:0042758 | long-chain fatty acid catabolic process(GO:0042758) |
| 0.0 | 0.2 | GO:0000045 | autophagosome assembly(GO:0000045) |
| 0.0 | 0.0 | GO:0018201 | N-terminal protein amino acid methylation(GO:0006480) N-terminal peptidyl-alanine methylation(GO:0018011) N-terminal peptidyl-alanine trimethylation(GO:0018012) N-terminal peptidyl-glycine methylation(GO:0018013) N-terminal peptidyl-proline dimethylation(GO:0018016) peptidyl-alanine modification(GO:0018194) peptidyl-glycine modification(GO:0018201) N-terminal peptidyl-proline methylation(GO:0035568) N-terminal peptidyl-serine methylation(GO:0035570) N-terminal peptidyl-serine dimethylation(GO:0035572) N-terminal peptidyl-serine trimethylation(GO:0035573) |
| 0.0 | 0.0 | GO:0044803 | multi-organism membrane organization(GO:0044803) |
| 0.0 | 0.2 | GO:0006541 | glutamine metabolic process(GO:0006541) |
| 0.0 | 0.2 | GO:0035518 | histone H2A monoubiquitination(GO:0035518) |
| 0.0 | 0.4 | GO:0007129 | synapsis(GO:0007129) |
| 0.0 | 0.0 | GO:0006404 | RNA import into nucleus(GO:0006404) |
| 0.0 | 0.0 | GO:0002154 | thyroid hormone mediated signaling pathway(GO:0002154) |
| 0.0 | 1.7 | GO:0006334 | nucleosome assembly(GO:0006334) |
| 0.0 | 0.0 | GO:0016051 | carbohydrate biosynthetic process(GO:0016051) |
| 0.0 | 0.1 | GO:0040014 | regulation of multicellular organism growth(GO:0040014) |
| 0.0 | 0.1 | GO:0060316 | positive regulation of ryanodine-sensitive calcium-release channel activity(GO:0060316) |
| 0.0 | 0.1 | GO:0006104 | succinyl-CoA metabolic process(GO:0006104) |
| 0.0 | 0.2 | GO:0032008 | positive regulation of TOR signaling(GO:0032008) |
| 0.0 | 0.2 | GO:0033539 | fatty acid beta-oxidation using acyl-CoA dehydrogenase(GO:0033539) |
| 0.0 | 0.1 | GO:0006574 | valine catabolic process(GO:0006574) |
| 0.0 | 0.1 | GO:0052651 | monoacylglycerol metabolic process(GO:0046462) monoacylglycerol catabolic process(GO:0052651) |
| 0.0 | 0.1 | GO:0010642 | negative regulation of platelet-derived growth factor receptor signaling pathway(GO:0010642) |
| 0.0 | 0.1 | GO:0006226 | dUMP biosynthetic process(GO:0006226) |
| 0.0 | 0.2 | GO:0006388 | RNA splicing, via endonucleolytic cleavage and ligation(GO:0000394) tRNA splicing, via endonucleolytic cleavage and ligation(GO:0006388) |
| 0.0 | 0.2 | GO:0015886 | heme transport(GO:0015886) |
| 0.0 | 0.1 | GO:1900383 | regulation of synaptic plasticity by receptor localization to synapse(GO:1900383) |
| 0.0 | 0.0 | GO:1900109 | regulation of histone H3-K9 dimethylation(GO:1900109) positive regulation of histone H3-K9 dimethylation(GO:1900111) |
| 0.0 | 0.6 | GO:0043171 | peptide catabolic process(GO:0043171) |
| 0.0 | 0.1 | GO:0010499 | proteasomal ubiquitin-independent protein catabolic process(GO:0010499) |
| 0.0 | 0.0 | GO:0030205 | dermatan sulfate metabolic process(GO:0030205) |
| 0.0 | 0.3 | GO:0030828 | positive regulation of cGMP biosynthetic process(GO:0030828) |
| 0.0 | 0.5 | GO:0010501 | RNA secondary structure unwinding(GO:0010501) |
| 0.0 | 0.0 | GO:0006213 | pyrimidine nucleoside metabolic process(GO:0006213) |
| 0.0 | 0.1 | GO:0031053 | primary miRNA processing(GO:0031053) |
| 0.0 | 0.2 | GO:0007183 | SMAD protein complex assembly(GO:0007183) |
| 0.0 | 0.1 | GO:0090669 | telomerase RNA stabilization(GO:0090669) |
| 0.0 | 0.1 | GO:0043486 | histone exchange(GO:0043486) |
| 0.0 | 0.0 | GO:0061010 | gall bladder development(GO:0061010) |
| 0.0 | 0.1 | GO:0033005 | positive regulation of mast cell activation(GO:0033005) positive regulation of mast cell activation involved in immune response(GO:0033008) positive regulation of mast cell degranulation(GO:0043306) |
| 0.0 | 0.0 | GO:0030951 | establishment or maintenance of microtubule cytoskeleton polarity(GO:0030951) establishment or maintenance of cytoskeleton polarity(GO:0030952) |
| 0.0 | 0.0 | GO:0060612 | adipose tissue development(GO:0060612) |
| 0.0 | 0.0 | GO:0034315 | regulation of Arp2/3 complex-mediated actin nucleation(GO:0034315) |
| 0.0 | 0.2 | GO:0016601 | Rac protein signal transduction(GO:0016601) |
| 0.0 | 0.0 | GO:0060478 | acrosomal vesicle exocytosis(GO:0060478) |
| 0.0 | 0.0 | GO:0016185 | synaptic vesicle budding from presynaptic endocytic zone membrane(GO:0016185) synaptic vesicle budding(GO:0070142) |
| 0.0 | 0.0 | GO:1903215 | negative regulation of protein targeting to mitochondrion(GO:1903215) |
| 0.0 | 0.0 | GO:0038193 | thromboxane A2 signaling pathway(GO:0038193) |
| 0.0 | 0.1 | GO:0048641 | regulation of skeletal muscle tissue development(GO:0048641) |
| 0.0 | 0.1 | GO:0021854 | hypothalamus development(GO:0021854) |
| 0.0 | 0.1 | GO:0040016 | embryonic cleavage(GO:0040016) |
| 0.0 | 0.0 | GO:0001507 | acetylcholine catabolic process in synaptic cleft(GO:0001507) acetylcholine catabolic process(GO:0006581) |
| 0.0 | 0.2 | GO:0060219 | camera-type eye photoreceptor cell differentiation(GO:0060219) |
| 0.0 | 0.3 | GO:0034755 | iron ion transmembrane transport(GO:0034755) |
| 0.0 | 0.0 | GO:0097010 | eukaryotic translation initiation factor 4F complex assembly(GO:0097010) |
| 0.0 | 0.3 | GO:0048512 | circadian behavior(GO:0048512) |
| 0.0 | 0.1 | GO:0006702 | androgen biosynthetic process(GO:0006702) |
| 0.0 | 0.1 | GO:0007520 | myoblast fusion(GO:0007520) |
| 0.0 | 0.1 | GO:0006107 | oxaloacetate metabolic process(GO:0006107) |
| 0.0 | 0.1 | GO:0045838 | positive regulation of membrane potential(GO:0045838) |
| 0.0 | 0.0 | GO:0006419 | alanyl-tRNA aminoacylation(GO:0006419) |
| 0.0 | 0.2 | GO:0018298 | protein-chromophore linkage(GO:0018298) |
| 0.0 | 0.1 | GO:0031848 | protection from non-homologous end joining at telomere(GO:0031848) |
| 0.0 | 0.1 | GO:0070828 | heterochromatin organization(GO:0070828) |
| 0.0 | 0.1 | GO:0043401 | steroid hormone mediated signaling pathway(GO:0043401) |
| 0.0 | 0.1 | GO:0035520 | monoubiquitinated protein deubiquitination(GO:0035520) |
| 0.0 | 0.7 | GO:0007229 | integrin-mediated signaling pathway(GO:0007229) |
| 0.0 | 0.1 | GO:0051152 | positive regulation of smooth muscle cell differentiation(GO:0051152) |
| 0.0 | 0.0 | GO:0000280 | nuclear division(GO:0000280) |
| 0.0 | 0.0 | GO:0016576 | histone dephosphorylation(GO:0016576) |
| 0.0 | 0.2 | GO:2000778 | positive regulation of interleukin-6 secretion(GO:2000778) |
| 0.0 | 0.0 | GO:0000291 | nuclear-transcribed mRNA catabolic process, exonucleolytic(GO:0000291) |
| 0.0 | 0.2 | GO:0031665 | negative regulation of lipopolysaccharide-mediated signaling pathway(GO:0031665) |
| 0.0 | 0.7 | GO:0006120 | mitochondrial electron transport, NADH to ubiquinone(GO:0006120) |
| 0.0 | 0.0 | GO:0018307 | enzyme active site formation(GO:0018307) |
| 0.0 | 0.0 | GO:1901355 | response to rapamycin(GO:1901355) |
| 0.0 | 0.1 | GO:0090168 | Golgi reassembly(GO:0090168) |
| 0.0 | 0.1 | GO:0048295 | positive regulation of isotype switching to IgE isotypes(GO:0048295) |
| 0.0 | 0.0 | GO:0034616 | response to laminar fluid shear stress(GO:0034616) |
| 0.0 | 0.0 | GO:0007093 | mitotic cell cycle checkpoint(GO:0007093) |
| 0.0 | 0.5 | GO:0051865 | protein autoubiquitination(GO:0051865) |
| 0.0 | 0.0 | GO:0006972 | hyperosmotic response(GO:0006972) |
| 0.0 | 0.1 | GO:1990403 | embryonic brain development(GO:1990403) |
| 0.0 | 0.1 | GO:0061099 | negative regulation of protein tyrosine kinase activity(GO:0061099) |
| 0.0 | 0.0 | GO:0060005 | vestibular reflex(GO:0060005) |
| 0.0 | 0.1 | GO:0030210 | heparin metabolic process(GO:0030202) heparin biosynthetic process(GO:0030210) |
Gene overrepresentation in cellular_component category:
| Log-likelihood per target | Total log-likelihood | Term | Description |
|---|---|---|---|
| 0.5 | 2.3 | GO:0044305 | calyx of Held(GO:0044305) |
| 0.4 | 2.1 | GO:0016035 | zeta DNA polymerase complex(GO:0016035) |
| 0.3 | 1.4 | GO:0097224 | sperm connecting piece(GO:0097224) |
| 0.3 | 1.2 | GO:0045160 | myosin I complex(GO:0045160) |
| 0.3 | 0.9 | GO:0032173 | septin ring(GO:0005940) septin collar(GO:0032173) |
| 0.3 | 1.2 | GO:0060187 | cell pole(GO:0060187) |
| 0.3 | 1.1 | GO:0097135 | cyclin E2-CDK2 complex(GO:0097135) |
| 0.3 | 1.0 | GO:1990578 | perinuclear endoplasmic reticulum membrane(GO:1990578) |
| 0.3 | 1.8 | GO:0000015 | phosphopyruvate hydratase complex(GO:0000015) |
| 0.2 | 2.2 | GO:0000125 | PCAF complex(GO:0000125) |
| 0.2 | 6.1 | GO:0001527 | microfibril(GO:0001527) fibril(GO:0043205) |
| 0.2 | 2.8 | GO:0098839 | postsynaptic density membrane(GO:0098839) |
| 0.2 | 2.7 | GO:0070775 | H3 histone acetyltransferase complex(GO:0070775) MOZ/MORF histone acetyltransferase complex(GO:0070776) |
| 0.2 | 0.6 | GO:0005873 | plus-end kinesin complex(GO:0005873) |
| 0.2 | 0.6 | GO:0034680 | integrin alpha10-beta1 complex(GO:0034680) |
| 0.2 | 2.2 | GO:0097443 | sorting endosome(GO:0097443) |
| 0.2 | 2.7 | GO:0098647 | collagen type VI trimer(GO:0005589) collagen beaded filament(GO:0098647) |
| 0.2 | 0.8 | GO:0097629 | extrinsic component of omegasome membrane(GO:0097629) |
| 0.2 | 0.8 | GO:0097442 | CA3 pyramidal cell dendrite(GO:0097442) |
| 0.2 | 0.7 | GO:0031673 | H zone(GO:0031673) |
| 0.2 | 1.9 | GO:0070937 | CRD-mediated mRNA stability complex(GO:0070937) |
| 0.2 | 0.5 | GO:1990812 | growth cone filopodium(GO:1990812) |
| 0.2 | 0.5 | GO:0005588 | collagen type V trimer(GO:0005588) |
| 0.2 | 0.8 | GO:0005726 | perichromatin fibrils(GO:0005726) |
| 0.2 | 1.2 | GO:0001740 | Barr body(GO:0001740) |
| 0.2 | 0.2 | GO:0060053 | neurofilament cytoskeleton(GO:0060053) |
| 0.2 | 1.9 | GO:0000124 | SAGA complex(GO:0000124) |
| 0.2 | 3.2 | GO:0032591 | dendritic spine membrane(GO:0032591) |
| 0.2 | 0.5 | GO:0044753 | amphisome(GO:0044753) |
| 0.1 | 0.4 | GO:0035189 | Rb-E2F complex(GO:0035189) |
| 0.1 | 0.9 | GO:0032777 | Piccolo NuA4 histone acetyltransferase complex(GO:0032777) |
| 0.1 | 16.5 | GO:0005901 | caveola(GO:0005901) |
| 0.1 | 2.7 | GO:0097386 | glial cell projection(GO:0097386) |
| 0.1 | 0.5 | GO:0071062 | alphav-beta3 integrin-vitronectin complex(GO:0071062) |
| 0.1 | 0.5 | GO:0030934 | anchoring collagen complex(GO:0030934) |
| 0.1 | 0.4 | GO:0097058 | CRLF-CLCF1 complex(GO:0097058) |
| 0.1 | 1.8 | GO:0097136 | Bcl-2 family protein complex(GO:0097136) |
| 0.1 | 1.5 | GO:0043083 | synaptic cleft(GO:0043083) |
| 0.1 | 1.1 | GO:0036056 | filtration diaphragm(GO:0036056) slit diaphragm(GO:0036057) |
| 0.1 | 0.7 | GO:0034274 | Atg12-Atg5-Atg16 complex(GO:0034274) |
| 0.1 | 0.5 | GO:0008043 | intracellular ferritin complex(GO:0008043) ferritin complex(GO:0070288) |
| 0.1 | 2.8 | GO:1990124 | messenger ribonucleoprotein complex(GO:1990124) |
| 0.1 | 2.5 | GO:0043194 | axon initial segment(GO:0043194) |
| 0.1 | 0.3 | GO:0030915 | Smc5-Smc6 complex(GO:0030915) |
| 0.1 | 0.4 | GO:0034669 | integrin alpha4-beta7 complex(GO:0034669) |
| 0.1 | 0.3 | GO:0070195 | growth hormone receptor complex(GO:0070195) |
| 0.1 | 0.1 | GO:0005943 | phosphatidylinositol 3-kinase complex, class IA(GO:0005943) |
| 0.1 | 0.8 | GO:0002102 | podosome(GO:0002102) |
| 0.1 | 0.4 | GO:0005791 | rough endoplasmic reticulum(GO:0005791) |
| 0.1 | 0.5 | GO:0044294 | dendritic growth cone(GO:0044294) |
| 0.1 | 0.5 | GO:0071148 | TEAD-1-YAP complex(GO:0071148) |
| 0.1 | 4.0 | GO:0000421 | autophagosome membrane(GO:0000421) |
| 0.1 | 0.5 | GO:0000308 | cytoplasmic cyclin-dependent protein kinase holoenzyme complex(GO:0000308) |
| 0.1 | 0.4 | GO:0031302 | intrinsic component of endosome membrane(GO:0031302) |
| 0.1 | 0.9 | GO:0098651 | basement membrane collagen trimer(GO:0098651) |
| 0.1 | 0.8 | GO:0032593 | insulin-responsive compartment(GO:0032593) |
| 0.1 | 1.2 | GO:0008091 | spectrin(GO:0008091) |
| 0.1 | 0.7 | GO:0030868 | smooth endoplasmic reticulum membrane(GO:0030868) smooth endoplasmic reticulum part(GO:0097425) |
| 0.1 | 0.3 | GO:0002945 | cyclin K-CDK13 complex(GO:0002945) |
| 0.1 | 0.6 | GO:0033503 | HULC complex(GO:0033503) |
| 0.1 | 0.8 | GO:0005883 | neurofilament(GO:0005883) |
| 0.1 | 0.2 | GO:0005862 | muscle thin filament tropomyosin(GO:0005862) |
| 0.1 | 1.2 | GO:0031209 | SCAR complex(GO:0031209) |
| 0.1 | 1.0 | GO:0008290 | F-actin capping protein complex(GO:0008290) |
| 0.1 | 1.1 | GO:0030126 | COPI vesicle coat(GO:0030126) |
| 0.1 | 0.2 | GO:0043291 | RAVE complex(GO:0043291) |
| 0.1 | 1.3 | GO:0035102 | PRC1 complex(GO:0035102) |
| 0.1 | 0.7 | GO:0005638 | lamin filament(GO:0005638) |
| 0.1 | 0.2 | GO:0036194 | muscle cell projection(GO:0036194) muscle cell projection membrane(GO:0036195) |
| 0.1 | 0.5 | GO:0089701 | U2AF(GO:0089701) |
| 0.1 | 1.1 | GO:0033643 | host cell part(GO:0033643) |
| 0.1 | 0.7 | GO:1990909 | Wnt signalosome(GO:1990909) |
| 0.1 | 1.2 | GO:0008385 | IkappaB kinase complex(GO:0008385) |
| 0.1 | 0.4 | GO:0030891 | VCB complex(GO:0030891) |
| 0.1 | 0.6 | GO:0071203 | WASH complex(GO:0071203) |
| 0.1 | 0.6 | GO:0051286 | cell tip(GO:0051286) |
| 0.1 | 0.2 | GO:0031933 | telomeric heterochromatin(GO:0031933) |
| 0.1 | 0.2 | GO:0032002 | interleukin-28 receptor complex(GO:0032002) |
| 0.1 | 0.8 | GO:0070765 | gamma-secretase complex(GO:0070765) |
| 0.1 | 1.6 | GO:0031588 | nucleotide-activated protein kinase complex(GO:0031588) |
| 0.1 | 0.1 | GO:1990761 | growth cone lamellipodium(GO:1990761) |
| 0.1 | 0.2 | GO:0030956 | glutamyl-tRNA(Gln) amidotransferase complex(GO:0030956) |
| 0.1 | 0.6 | GO:0071546 | pi-body(GO:0071546) |
| 0.1 | 0.9 | GO:0031464 | Cul4A-RING E3 ubiquitin ligase complex(GO:0031464) |
| 0.1 | 0.2 | GO:0000333 | telomerase catalytic core complex(GO:0000333) |
| 0.1 | 0.5 | GO:0000110 | nucleotide-excision repair factor 1 complex(GO:0000110) |
| 0.1 | 0.3 | GO:0032133 | chromosome passenger complex(GO:0032133) |
| 0.1 | 0.2 | GO:0030289 | protein phosphatase 4 complex(GO:0030289) |
| 0.1 | 0.3 | GO:0005594 | collagen type IX trimer(GO:0005594) |
| 0.1 | 3.8 | GO:0031941 | filamentous actin(GO:0031941) |
| 0.1 | 0.6 | GO:0016589 | NURF complex(GO:0016589) |
| 0.1 | 0.2 | GO:0009330 | DNA topoisomerase complex (ATP-hydrolyzing)(GO:0009330) |
| 0.1 | 1.3 | GO:0031265 | CD95 death-inducing signaling complex(GO:0031265) |
| 0.1 | 0.1 | GO:0019907 | cyclin-dependent protein kinase activating kinase holoenzyme complex(GO:0019907) |
| 0.1 | 0.6 | GO:0005913 | cell-cell adherens junction(GO:0005913) |
| 0.1 | 0.6 | GO:0032059 | bleb(GO:0032059) |
| 0.1 | 0.3 | GO:0090498 | extrinsic component of Golgi membrane(GO:0090498) |
| 0.1 | 0.2 | GO:0070044 | synaptobrevin 2-SNAP-25-syntaxin-1a complex(GO:0070044) |
| 0.1 | 0.3 | GO:0008537 | proteasome activator complex(GO:0008537) |
| 0.1 | 0.3 | GO:0065010 | extracellular membrane-bounded organelle(GO:0065010) |
| 0.1 | 0.4 | GO:0043203 | axon hillock(GO:0043203) |
| 0.1 | 0.2 | GO:0031021 | interphase microtubule organizing center(GO:0031021) |
| 0.1 | 0.2 | GO:0048179 | activin receptor complex(GO:0048179) |
| 0.1 | 0.2 | GO:0000126 | transcription factor TFIIIB complex(GO:0000126) |
| 0.1 | 0.2 | GO:0031527 | filopodium membrane(GO:0031527) |
| 0.1 | 0.2 | GO:0017146 | NMDA selective glutamate receptor complex(GO:0017146) |
| 0.1 | 6.0 | GO:0060170 | ciliary membrane(GO:0060170) |
| 0.1 | 0.5 | GO:0032009 | early phagosome(GO:0032009) |
| 0.1 | 1.0 | GO:0097431 | mitotic spindle pole(GO:0097431) |
| 0.1 | 0.7 | GO:0035068 | micro-ribonucleoprotein complex(GO:0035068) |
| 0.1 | 0.6 | GO:0035985 | senescence-associated heterochromatin focus(GO:0035985) |
| 0.1 | 0.8 | GO:0044300 | cerebellar mossy fiber(GO:0044300) |
| 0.1 | 0.3 | GO:0097440 | apical dendrite(GO:0097440) |
| 0.1 | 0.5 | GO:0072357 | PTW/PP1 phosphatase complex(GO:0072357) |
| 0.1 | 0.2 | GO:0048269 | methionine adenosyltransferase complex(GO:0048269) |
| 0.1 | 0.7 | GO:0000813 | ESCRT I complex(GO:0000813) |
| 0.1 | 1.0 | GO:0097539 | ciliary transition fiber(GO:0097539) |
| 0.1 | 7.5 | GO:0016605 | PML body(GO:0016605) |
| 0.1 | 0.4 | GO:0005818 | astral microtubule(GO:0000235) aster(GO:0005818) |
| 0.1 | 1.1 | GO:0046930 | pore complex(GO:0046930) |
| 0.1 | 1.4 | GO:0030904 | retromer complex(GO:0030904) |
| 0.1 | 1.3 | GO:0005605 | basal lamina(GO:0005605) |
| 0.1 | 1.4 | GO:0031307 | integral component of mitochondrial outer membrane(GO:0031307) |
| 0.1 | 1.3 | GO:0030132 | clathrin coat of coated pit(GO:0030132) |
| 0.0 | 0.5 | GO:0033268 | node of Ranvier(GO:0033268) |
| 0.0 | 0.6 | GO:0097487 | multivesicular body, internal vesicle(GO:0097487) |
| 0.0 | 0.4 | GO:0001940 | male pronucleus(GO:0001940) |
| 0.0 | 7.1 | GO:0043202 | lysosomal lumen(GO:0043202) |
| 0.0 | 0.5 | GO:0098644 | complex of collagen trimers(GO:0098644) |
| 0.0 | 0.4 | GO:0098559 | cytoplasmic side of early endosome membrane(GO:0098559) |
| 0.0 | 0.4 | GO:0071953 | elastic fiber(GO:0071953) |
| 0.0 | 3.5 | GO:0017053 | transcriptional repressor complex(GO:0017053) |
| 0.0 | 0.5 | GO:0060091 | kinocilium(GO:0060091) |
| 0.0 | 0.0 | GO:0071001 | U4/U6 snRNP(GO:0071001) |
| 0.0 | 3.7 | GO:0032154 | cleavage furrow(GO:0032154) cell surface furrow(GO:0097610) |
| 0.0 | 0.6 | GO:0097025 | MPP7-DLG1-LIN7 complex(GO:0097025) |
| 0.0 | 1.3 | GO:0035327 | transcriptionally active chromatin(GO:0035327) |
| 0.0 | 0.3 | GO:0072589 | box H/ACA scaRNP complex(GO:0072589) box H/ACA telomerase RNP complex(GO:0090661) |
| 0.0 | 0.3 | GO:0044614 | nuclear pore cytoplasmic filaments(GO:0044614) |
| 0.0 | 0.2 | GO:0097413 | Lewy body(GO:0097413) |
| 0.0 | 1.1 | GO:0031083 | BLOC-1 complex(GO:0031083) |
| 0.0 | 0.1 | GO:0097129 | cyclin D2-CDK4 complex(GO:0097129) |
| 0.0 | 4.4 | GO:0032432 | actin filament bundle(GO:0032432) |
| 0.0 | 0.2 | GO:0031233 | intrinsic component of external side of plasma membrane(GO:0031233) |
| 0.0 | 0.7 | GO:0042641 | actomyosin(GO:0042641) |
| 0.0 | 0.4 | GO:0030015 | CCR4-NOT core complex(GO:0030015) |
| 0.0 | 0.7 | GO:0010369 | chromocenter(GO:0010369) |
| 0.0 | 0.2 | GO:1902560 | GMP reductase complex(GO:1902560) |
| 0.0 | 0.2 | GO:0031618 | nuclear pericentric heterochromatin(GO:0031618) |
| 0.0 | 4.3 | GO:0000118 | histone deacetylase complex(GO:0000118) |
| 0.0 | 0.2 | GO:0005671 | Ada2/Gcn5/Ada3 transcription activator complex(GO:0005671) |
| 0.0 | 1.1 | GO:0035098 | ESC/E(Z) complex(GO:0035098) |
| 0.0 | 0.4 | GO:0035686 | sperm fibrous sheath(GO:0035686) |
| 0.0 | 0.1 | GO:0016461 | unconventional myosin complex(GO:0016461) |
| 0.0 | 0.2 | GO:0032301 | MutSalpha complex(GO:0032301) |
| 0.0 | 2.1 | GO:0005834 | heterotrimeric G-protein complex(GO:0005834) |
| 0.0 | 2.3 | GO:0001750 | photoreceptor outer segment(GO:0001750) |
| 0.0 | 0.4 | GO:0032584 | growth cone membrane(GO:0032584) |
| 0.0 | 3.1 | GO:0034704 | calcium channel complex(GO:0034704) |
| 0.0 | 0.1 | GO:0030689 | Noc complex(GO:0030689) |
| 0.0 | 3.5 | GO:0030672 | synaptic vesicle membrane(GO:0030672) exocytic vesicle membrane(GO:0099501) |
| 0.0 | 0.8 | GO:0035145 | exon-exon junction complex(GO:0035145) |
| 0.0 | 0.7 | GO:0097225 | sperm midpiece(GO:0097225) |
| 0.0 | 0.0 | GO:0034518 | mRNA cap binding complex(GO:0005845) RNA cap binding complex(GO:0034518) |
| 0.0 | 0.1 | GO:0030914 | STAGA complex(GO:0030914) |
| 0.0 | 0.2 | GO:1990131 | Gtr1-Gtr2 GTPase complex(GO:1990131) |
| 0.0 | 0.1 | GO:0043198 | dendritic shaft(GO:0043198) |
| 0.0 | 0.1 | GO:0045323 | interleukin-1 receptor complex(GO:0045323) |
| 0.0 | 0.0 | GO:0000109 | nucleotide-excision repair complex(GO:0000109) |
| 0.0 | 0.2 | GO:0070852 | cell body fiber(GO:0070852) |
| 0.0 | 0.8 | GO:0071339 | MLL1/2 complex(GO:0044665) MLL1 complex(GO:0071339) |
| 0.0 | 0.1 | GO:0034751 | aryl hydrocarbon receptor complex(GO:0034751) |
| 0.0 | 1.1 | GO:0042101 | T cell receptor complex(GO:0042101) |
| 0.0 | 1.8 | GO:0043596 | nuclear replication fork(GO:0043596) |
| 0.0 | 0.2 | GO:0031462 | Cul2-RING ubiquitin ligase complex(GO:0031462) |
| 0.0 | 0.8 | GO:0000145 | exocyst(GO:0000145) |
| 0.0 | 0.1 | GO:0031467 | Cul7-RING ubiquitin ligase complex(GO:0031467) |
| 0.0 | 2.4 | GO:0005905 | clathrin-coated pit(GO:0005905) |
| 0.0 | 0.5 | GO:0035371 | microtubule plus-end(GO:0035371) |
| 0.0 | 0.5 | GO:0030008 | TRAPP complex(GO:0030008) |
| 0.0 | 0.3 | GO:0005964 | phosphorylase kinase complex(GO:0005964) |
| 0.0 | 0.6 | GO:0031235 | intrinsic component of the cytoplasmic side of the plasma membrane(GO:0031235) |
| 0.0 | 0.1 | GO:0035749 | myelin sheath adaxonal region(GO:0035749) |
| 0.0 | 0.1 | GO:1990907 | beta-catenin-TCF complex(GO:1990907) |
| 0.0 | 0.0 | GO:0071564 | npBAF complex(GO:0071564) |
| 0.0 | 0.3 | GO:0030014 | CCR4-NOT complex(GO:0030014) |
| 0.0 | 0.4 | GO:0043220 | Schmidt-Lanterman incisure(GO:0043220) |
| 0.0 | 0.7 | GO:0031519 | PcG protein complex(GO:0031519) |
| 0.0 | 0.8 | GO:0080008 | Cul4-RING E3 ubiquitin ligase complex(GO:0080008) |
| 0.0 | 0.6 | GO:0005922 | connexon complex(GO:0005922) |
| 0.0 | 0.1 | GO:0030981 | cortical microtubule cytoskeleton(GO:0030981) |
| 0.0 | 0.9 | GO:0005868 | cytoplasmic dynein complex(GO:0005868) |
| 0.0 | 0.2 | GO:0033165 | interphotoreceptor matrix(GO:0033165) |
| 0.0 | 1.6 | GO:0005776 | autophagosome(GO:0005776) |
| 0.0 | 3.1 | GO:0005814 | centriole(GO:0005814) |
| 0.0 | 0.1 | GO:0032299 | ribonuclease H2 complex(GO:0032299) |
| 0.0 | 0.7 | GO:1902711 | GABA-A receptor complex(GO:1902711) |
| 0.0 | 2.3 | GO:0031463 | Cul3-RING ubiquitin ligase complex(GO:0031463) |
| 0.0 | 0.1 | GO:0045261 | mitochondrial proton-transporting ATP synthase complex, catalytic core F(1)(GO:0000275) proton-transporting ATP synthase complex, catalytic core F(1)(GO:0045261) |
| 0.0 | 0.2 | GO:0030061 | mitochondrial crista(GO:0030061) |
| 0.0 | 0.5 | GO:0000276 | mitochondrial proton-transporting ATP synthase complex, coupling factor F(o)(GO:0000276) |
| 0.0 | 0.1 | GO:0044615 | nuclear pore nuclear basket(GO:0044615) |
| 0.0 | 0.2 | GO:0043190 | ATP-binding cassette (ABC) transporter complex(GO:0043190) |
| 0.0 | 0.4 | GO:0005942 | phosphatidylinositol 3-kinase complex(GO:0005942) |
| 0.0 | 0.2 | GO:0042382 | paraspeckles(GO:0042382) |
| 0.0 | 0.2 | GO:0036157 | outer dynein arm(GO:0036157) |
| 0.0 | 0.2 | GO:0033269 | internode region of axon(GO:0033269) |
| 0.0 | 0.1 | GO:0045263 | proton-transporting ATP synthase complex, coupling factor F(o)(GO:0045263) |
| 0.0 | 0.1 | GO:0031232 | extrinsic component of external side of plasma membrane(GO:0031232) |
| 0.0 | 0.1 | GO:0001673 | male germ cell nucleus(GO:0001673) |
| 0.0 | 0.3 | GO:0033270 | paranode region of axon(GO:0033270) |
| 0.0 | 0.2 | GO:0016602 | CCAAT-binding factor complex(GO:0016602) |
| 0.0 | 0.9 | GO:0030315 | T-tubule(GO:0030315) |
| 0.0 | 0.2 | GO:0000243 | commitment complex(GO:0000243) |
| 0.0 | 0.7 | GO:0005719 | nuclear euchromatin(GO:0005719) |
| 0.0 | 0.3 | GO:0034451 | centriolar satellite(GO:0034451) |
| 0.0 | 0.2 | GO:0031371 | ubiquitin conjugating enzyme complex(GO:0031371) |
| 0.0 | 0.1 | GO:0044233 | ER-mitochondrion membrane contact site(GO:0044233) |
| 0.0 | 2.8 | GO:0030496 | midbody(GO:0030496) |
| 0.0 | 0.1 | GO:0005652 | nuclear lamina(GO:0005652) |
| 0.0 | 1.4 | GO:0030670 | phagocytic vesicle membrane(GO:0030670) |
| 0.0 | 0.2 | GO:0016593 | Cdc73/Paf1 complex(GO:0016593) |
| 0.0 | 0.3 | GO:0032045 | guanyl-nucleotide exchange factor complex(GO:0032045) |
| 0.0 | 1.3 | GO:0015030 | Cajal body(GO:0015030) |
| 0.0 | 0.1 | GO:0070436 | Grb2-EGFR complex(GO:0070436) |
| 0.0 | 0.0 | GO:0071437 | invadopodium(GO:0071437) |
| 0.0 | 0.6 | GO:0098827 | endoplasmic reticulum tubular network(GO:0071782) endoplasmic reticulum subcompartment(GO:0098827) |
| 0.0 | 0.2 | GO:0072669 | tRNA-splicing ligase complex(GO:0072669) |
| 0.0 | 0.1 | GO:0019773 | proteasome core complex, alpha-subunit complex(GO:0019773) |
| 0.0 | 0.0 | GO:0016328 | lateral plasma membrane(GO:0016328) |
| 0.0 | 0.1 | GO:0071565 | nBAF complex(GO:0071565) |
| 0.0 | 1.5 | GO:0005581 | collagen trimer(GO:0005581) |
| 0.0 | 0.4 | GO:0001891 | phagocytic cup(GO:0001891) |
| 0.0 | 0.7 | GO:0008023 | transcription elongation factor complex(GO:0008023) |
| 0.0 | 0.1 | GO:0035339 | SPOTS complex(GO:0035339) |
| 0.0 | 0.1 | GO:0002169 | 3-methylcrotonyl-CoA carboxylase complex, mitochondrial(GO:0002169) methylcrotonoyl-CoA carboxylase complex(GO:1905202) |
| 0.0 | 0.3 | GO:0005665 | DNA-directed RNA polymerase II, core complex(GO:0005665) |
| 0.0 | 0.1 | GO:0000791 | euchromatin(GO:0000791) |
| 0.0 | 0.2 | GO:0070652 | HAUS complex(GO:0070652) |
| 0.0 | 0.2 | GO:0000445 | THO complex(GO:0000347) THO complex part of transcription export complex(GO:0000445) |
| 0.0 | 0.1 | GO:0032444 | activin responsive factor complex(GO:0032444) |
| 0.0 | 0.1 | GO:0043293 | apoptosome(GO:0043293) |
| 0.0 | 1.3 | GO:0042734 | presynaptic membrane(GO:0042734) |
| 0.0 | 0.3 | GO:0005795 | Golgi stack(GO:0005795) |
| 0.0 | 0.3 | GO:0030127 | COPII vesicle coat(GO:0030127) |
| 0.0 | 0.1 | GO:0044232 | organelle membrane contact site(GO:0044232) |
| 0.0 | 0.1 | GO:0070552 | BRISC complex(GO:0070552) |
| 0.0 | 0.0 | GO:0051233 | spindle midzone(GO:0051233) |
| 0.0 | 0.1 | GO:0070531 | BRCA1-A complex(GO:0070531) |
| 0.0 | 0.5 | GO:0031305 | intrinsic component of mitochondrial inner membrane(GO:0031304) integral component of mitochondrial inner membrane(GO:0031305) |
| 0.0 | 1.5 | GO:0043197 | dendritic spine(GO:0043197) |
| 0.0 | 6.6 | GO:0005667 | transcription factor complex(GO:0005667) |
| 0.0 | 0.1 | GO:1990635 | proximal dendrite(GO:1990635) |
| 0.0 | 0.1 | GO:0005851 | eukaryotic translation initiation factor 2B complex(GO:0005851) |
| 0.0 | 0.1 | GO:0032144 | 4-aminobutyrate transaminase complex(GO:0032144) |
| 0.0 | 0.1 | GO:0000242 | pericentriolar material(GO:0000242) |
| 0.0 | 0.4 | GO:0016471 | vacuolar proton-transporting V-type ATPase complex(GO:0016471) |
| 0.0 | 0.1 | GO:1990730 | VCP-NSFL1C complex(GO:1990730) |
| 0.0 | 0.0 | GO:0070761 | pre-snoRNP complex(GO:0070761) |
| 0.0 | 1.5 | GO:0042470 | melanosome(GO:0042470) pigment granule(GO:0048770) |
| 0.0 | 0.0 | GO:0033597 | mitotic checkpoint complex(GO:0033597) bub1-bub3 complex(GO:1990298) |
| 0.0 | 0.4 | GO:0032421 | stereocilium bundle(GO:0032421) |
| 0.0 | 0.5 | GO:0044298 | neuronal cell body membrane(GO:0032809) cell body membrane(GO:0044298) |
| 0.0 | 0.0 | GO:0001652 | granular component(GO:0001652) |
| 0.0 | 0.7 | GO:0010494 | cytoplasmic stress granule(GO:0010494) |
| 0.0 | 1.8 | GO:0000932 | cytoplasmic mRNA processing body(GO:0000932) |
| 0.0 | 0.3 | GO:0008540 | proteasome regulatory particle, base subcomplex(GO:0008540) |
| 0.0 | 0.4 | GO:0005892 | acetylcholine-gated channel complex(GO:0005892) |
| 0.0 | 0.0 | GO:0097255 | R2TP complex(GO:0097255) |
| 0.0 | 0.1 | GO:0071011 | precatalytic spliceosome(GO:0071011) |
| 0.0 | 0.1 | GO:0002081 | outer acrosomal membrane(GO:0002081) |
| 0.0 | 0.2 | GO:0030478 | actin cap(GO:0030478) |
| 0.0 | 0.4 | GO:0016592 | mediator complex(GO:0016592) |
| 0.0 | 0.0 | GO:0005960 | glycine cleavage complex(GO:0005960) |
| 0.0 | 0.3 | GO:0044447 | axoneme part(GO:0044447) |
| 0.0 | 0.1 | GO:0071986 | Ragulator complex(GO:0071986) |
| 0.0 | 0.0 | GO:1904115 | axon cytoplasm(GO:1904115) |
| 0.0 | 0.0 | GO:0031415 | NatA complex(GO:0031415) |
| 0.0 | 0.3 | GO:0005849 | mRNA cleavage factor complex(GO:0005849) |
| 0.0 | 0.1 | GO:0044327 | dendritic spine head(GO:0044327) |
| 0.0 | 0.3 | GO:0019897 | extrinsic component of plasma membrane(GO:0019897) |
| 0.0 | 0.7 | GO:0030864 | cortical actin cytoskeleton(GO:0030864) |
| 0.0 | 0.1 | GO:0032798 | Swi5-Sfr1 complex(GO:0032798) |
| 0.0 | 0.3 | GO:0035861 | site of double-strand break(GO:0035861) |
| 0.0 | 0.6 | GO:0005801 | cis-Golgi network(GO:0005801) |
| 0.0 | 0.8 | GO:0070382 | exocytic vesicle(GO:0070382) |
| 0.0 | 0.2 | GO:0005833 | hemoglobin complex(GO:0005833) |
| 0.0 | 0.3 | GO:0008074 | guanylate cyclase complex, soluble(GO:0008074) |
| 0.0 | 0.1 | GO:0000812 | Swr1 complex(GO:0000812) |
| 0.0 | 0.0 | GO:0032590 | dendrite membrane(GO:0032590) |
| 0.0 | 0.3 | GO:0035770 | ribonucleoprotein granule(GO:0035770) |
| 0.0 | 0.3 | GO:0045335 | phagocytic vesicle(GO:0045335) |
| 0.0 | 0.1 | GO:0097452 | GAIT complex(GO:0097452) |
| 0.0 | 0.2 | GO:0000307 | cyclin-dependent protein kinase holoenzyme complex(GO:0000307) |
| 0.0 | 0.1 | GO:0061700 | GATOR2 complex(GO:0061700) |
| 0.0 | 0.4 | GO:0008180 | COP9 signalosome(GO:0008180) |
| 0.0 | 0.1 | GO:0000803 | sex chromosome(GO:0000803) |
| 0.0 | 0.1 | GO:0030678 | mitochondrial ribonuclease P complex(GO:0030678) |
| 0.0 | 0.4 | GO:0097546 | ciliary base(GO:0097546) |
| 0.0 | 0.1 | GO:0000164 | protein phosphatase type 1 complex(GO:0000164) |
| 0.0 | 0.0 | GO:0031264 | death-inducing signaling complex(GO:0031264) |
| 0.0 | 0.1 | GO:0071439 | clathrin complex(GO:0071439) |
| 0.0 | 0.1 | GO:0030062 | mitochondrial tricarboxylic acid cycle enzyme complex(GO:0030062) |
| 0.0 | 0.1 | GO:1990682 | CSF1-CSF1R complex(GO:1990682) |
| 0.0 | 0.1 | GO:0097433 | dense body(GO:0097433) |
| 0.0 | 0.3 | GO:0045171 | intercellular bridge(GO:0045171) |
| 0.0 | 0.1 | GO:0017119 | Golgi transport complex(GO:0017119) |
Gene overrepresentation in molecular_function category:
| Log-likelihood per target | Total log-likelihood | Term | Description |
|---|---|---|---|
| 2.3 | 18.6 | GO:0060072 | large conductance calcium-activated potassium channel activity(GO:0060072) |
| 1.2 | 8.3 | GO:0097108 | hedgehog family protein binding(GO:0097108) |
| 0.9 | 2.6 | GO:0016211 | glutamate-ammonia ligase activity(GO:0004356) ammonia ligase activity(GO:0016211) acid-ammonia (or amide) ligase activity(GO:0016880) |
| 0.7 | 3.5 | GO:0050436 | microfibril binding(GO:0050436) |
| 0.7 | 2.7 | GO:0005017 | platelet-derived growth factor-activated receptor activity(GO:0005017) |
| 0.6 | 3.3 | GO:0008597 | calcium-dependent protein serine/threonine phosphatase regulator activity(GO:0008597) |
| 0.5 | 4.8 | GO:0050692 | DBD domain binding(GO:0050692) |
| 0.5 | 2.0 | GO:0004782 | sulfinoalanine decarboxylase activity(GO:0004782) |
| 0.5 | 1.4 | GO:0004103 | choline kinase activity(GO:0004103) |
| 0.4 | 1.7 | GO:0004727 | prenylated protein tyrosine phosphatase activity(GO:0004727) |
| 0.4 | 2.1 | GO:0005315 | inorganic phosphate transmembrane transporter activity(GO:0005315) |
| 0.4 | 2.4 | GO:0044323 | retinoic acid-responsive element binding(GO:0044323) |
| 0.4 | 2.2 | GO:0008321 | Ral guanyl-nucleotide exchange factor activity(GO:0008321) |
| 0.4 | 1.1 | GO:0005169 | neurotrophin TRKB receptor binding(GO:0005169) |
| 0.4 | 2.6 | GO:0016403 | dimethylargininase activity(GO:0016403) |
| 0.4 | 1.4 | GO:0005477 | pyruvate secondary active transmembrane transporter activity(GO:0005477) |
| 0.3 | 3.1 | GO:0048495 | Roundabout binding(GO:0048495) |
| 0.3 | 1.0 | GO:0035403 | histone kinase activity (H3-T6 specific)(GO:0035403) |
| 0.3 | 3.4 | GO:0043023 | ribosomal large subunit binding(GO:0043023) |
| 0.3 | 1.0 | GO:0032427 | GBD domain binding(GO:0032427) |
| 0.3 | 1.6 | GO:0004306 | ethanolamine-phosphate cytidylyltransferase activity(GO:0004306) |
| 0.3 | 1.3 | GO:0031694 | alpha-2A adrenergic receptor binding(GO:0031694) |
| 0.3 | 1.8 | GO:0035402 | histone kinase activity (H3-T11 specific)(GO:0035402) |
| 0.3 | 2.1 | GO:0038085 | vascular endothelial growth factor binding(GO:0038085) |
| 0.3 | 3.3 | GO:0051434 | BH3 domain binding(GO:0051434) |
| 0.3 | 2.6 | GO:0043533 | inositol 1,3,4,5 tetrakisphosphate binding(GO:0043533) |
| 0.3 | 1.5 | GO:0004949 | cannabinoid receptor activity(GO:0004949) |
| 0.3 | 0.9 | GO:0034189 | very-low-density lipoprotein particle binding(GO:0034189) |
| 0.3 | 2.5 | GO:0030023 | extracellular matrix constituent conferring elasticity(GO:0030023) |
| 0.3 | 0.8 | GO:0098809 | cystathionine beta-synthase activity(GO:0004122) oxidoreductase activity, acting on other nitrogenous compounds as donors, cytochrome as acceptor(GO:0016662) nitrite reductase (NO-forming) activity(GO:0050421) carbon monoxide binding(GO:0070025) nitrite reductase activity(GO:0098809) |
| 0.3 | 2.6 | GO:0035727 | lysophosphatidic acid binding(GO:0035727) |
| 0.3 | 1.8 | GO:0001165 | RNA polymerase I upstream control element sequence-specific DNA binding(GO:0001165) |
| 0.3 | 1.8 | GO:0004634 | phosphopyruvate hydratase activity(GO:0004634) |
| 0.3 | 1.3 | GO:0052740 | 1-acyl-2-lysophosphatidylserine acylhydrolase activity(GO:0052740) |
| 0.3 | 1.0 | GO:0019770 | IgG receptor activity(GO:0019770) |
| 0.2 | 0.2 | GO:0031402 | sodium ion binding(GO:0031402) |
| 0.2 | 0.2 | GO:0004720 | protein-lysine 6-oxidase activity(GO:0004720) |
| 0.2 | 0.7 | GO:0004781 | adenylylsulfate kinase activity(GO:0004020) sulfate adenylyltransferase activity(GO:0004779) sulfate adenylyltransferase (ATP) activity(GO:0004781) |
| 0.2 | 0.7 | GO:0005173 | stem cell factor receptor binding(GO:0005173) |
| 0.2 | 0.2 | GO:0061629 | RNA polymerase II sequence-specific DNA binding transcription factor binding(GO:0061629) |
| 0.2 | 0.7 | GO:0016309 | 1-phosphatidylinositol-5-phosphate 4-kinase activity(GO:0016309) |
| 0.2 | 0.4 | GO:0042813 | Wnt-activated receptor activity(GO:0042813) |
| 0.2 | 1.9 | GO:0043426 | MRF binding(GO:0043426) |
| 0.2 | 0.9 | GO:0086020 | gap junction channel activity involved in SA node cell-atrial cardiac muscle cell electrical coupling(GO:0086020) |
| 0.2 | 1.7 | GO:0004468 | lysine N-acetyltransferase activity, acting on acetyl phosphate as donor(GO:0004468) |
| 0.2 | 2.5 | GO:0019871 | sodium channel inhibitor activity(GO:0019871) |
| 0.2 | 0.6 | GO:0031780 | corticotropin hormone receptor binding(GO:0031780) type 5 melanocortin receptor binding(GO:0031783) |
| 0.2 | 0.6 | GO:0004958 | prostaglandin F receptor activity(GO:0004958) |
| 0.2 | 2.2 | GO:0031995 | insulin-like growth factor II binding(GO:0031995) |
| 0.2 | 0.2 | GO:0005005 | transmembrane-ephrin receptor activity(GO:0005005) |
| 0.2 | 0.6 | GO:0045322 | unmethylated CpG binding(GO:0045322) |
| 0.2 | 0.2 | GO:1901611 | phosphatidylglycerol binding(GO:1901611) |
| 0.2 | 1.1 | GO:0033743 | peptide-methionine (R)-S-oxide reductase activity(GO:0033743) |
| 0.2 | 0.6 | GO:0004345 | glucose-6-phosphate dehydrogenase activity(GO:0004345) |
| 0.2 | 0.7 | GO:0043812 | phosphatidylinositol-4-phosphate phosphatase activity(GO:0043812) |
| 0.2 | 0.5 | GO:0035033 | histone deacetylase regulator activity(GO:0035033) |
| 0.2 | 0.7 | GO:0047391 | alkylglycerophosphoethanolamine phosphodiesterase activity(GO:0047391) |
| 0.2 | 0.5 | GO:0008427 | calcium-dependent protein kinase inhibitor activity(GO:0008427) |
| 0.2 | 1.0 | GO:0038049 | transcription factor activity, ligand-activated RNA polymerase II transcription factor binding(GO:0038049) |
| 0.2 | 0.5 | GO:0016781 | selenide, water dikinase activity(GO:0004756) phosphotransferase activity, paired acceptors(GO:0016781) |
| 0.2 | 1.0 | GO:0004800 | thyroxine 5'-deiodinase activity(GO:0004800) |
| 0.2 | 0.5 | GO:0004370 | glycerol kinase activity(GO:0004370) |
| 0.1 | 0.3 | GO:0001076 | transcription factor activity, RNA polymerase II transcription factor binding(GO:0001076) |
| 0.1 | 0.4 | GO:0004613 | phosphoenolpyruvate carboxykinase activity(GO:0004611) phosphoenolpyruvate carboxykinase (GTP) activity(GO:0004613) |
| 0.1 | 2.5 | GO:0031698 | beta-2 adrenergic receptor binding(GO:0031698) |
| 0.1 | 0.7 | GO:0001010 | transcription factor activity, sequence-specific DNA binding transcription factor recruiting(GO:0001010) |
| 0.1 | 0.9 | GO:0051032 | nucleic acid transmembrane transporter activity(GO:0051032) RNA transmembrane transporter activity(GO:0051033) |
| 0.1 | 0.6 | GO:0043398 | HLH domain binding(GO:0043398) |
| 0.1 | 0.1 | GO:0008373 | beta-galactoside alpha-2,6-sialyltransferase activity(GO:0003835) sialyltransferase activity(GO:0008373) |
| 0.1 | 1.0 | GO:0043559 | insulin binding(GO:0043559) |
| 0.1 | 0.5 | GO:0003990 | acetylcholinesterase activity(GO:0003990) |
| 0.1 | 0.3 | GO:0046906 | heme binding(GO:0020037) tetrapyrrole binding(GO:0046906) |
| 0.1 | 0.4 | GO:0004676 | 3-phosphoinositide-dependent protein kinase activity(GO:0004676) |
| 0.1 | 0.5 | GO:0050833 | pyruvate transmembrane transporter activity(GO:0050833) |
| 0.1 | 0.9 | GO:0070513 | death domain binding(GO:0070513) |
| 0.1 | 0.3 | GO:1990841 | promoter-specific chromatin binding(GO:1990841) |
| 0.1 | 0.9 | GO:0004614 | phosphoglucomutase activity(GO:0004614) |
| 0.1 | 0.8 | GO:0031491 | nucleosome binding(GO:0031491) |
| 0.1 | 0.8 | GO:0050815 | phosphoserine binding(GO:0050815) |
| 0.1 | 7.8 | GO:0070888 | E-box binding(GO:0070888) |
| 0.1 | 1.4 | GO:0048407 | platelet-derived growth factor binding(GO:0048407) |
| 0.1 | 0.4 | GO:0000150 | recombinase activity(GO:0000150) |
| 0.1 | 0.6 | GO:0003987 | acetate-CoA ligase activity(GO:0003987) |
| 0.1 | 0.4 | GO:0042799 | histone methyltransferase activity (H4-K20 specific)(GO:0042799) |
| 0.1 | 0.6 | GO:0046592 | polyamine oxidase activity(GO:0046592) spermine:oxygen oxidoreductase (spermidine-forming) activity(GO:0052901) |
| 0.1 | 1.8 | GO:0042975 | peroxisome proliferator activated receptor binding(GO:0042975) |
| 0.1 | 0.2 | GO:0005001 | transmembrane receptor protein tyrosine phosphatase activity(GO:0005001) transmembrane receptor protein phosphatase activity(GO:0019198) |
| 0.1 | 6.0 | GO:0005158 | insulin receptor binding(GO:0005158) |
| 0.1 | 0.4 | GO:0031859 | platelet activating factor receptor binding(GO:0031859) |
| 0.1 | 0.1 | GO:0070506 | high-density lipoprotein particle receptor activity(GO:0070506) |
| 0.1 | 2.0 | GO:0015271 | outward rectifier potassium channel activity(GO:0015271) |
| 0.1 | 0.4 | GO:0070051 | fibrinogen binding(GO:0070051) |
| 0.1 | 0.7 | GO:0072320 | volume-sensitive chloride channel activity(GO:0072320) |
| 0.1 | 0.1 | GO:0031692 | alpha-1B adrenergic receptor binding(GO:0031692) |
| 0.1 | 1.4 | GO:0017154 | semaphorin receptor activity(GO:0017154) |
| 0.1 | 0.6 | GO:0004095 | carnitine O-palmitoyltransferase activity(GO:0004095) |
| 0.1 | 1.3 | GO:0032027 | myosin light chain binding(GO:0032027) |
| 0.1 | 2.6 | GO:0017160 | Ral GTPase binding(GO:0017160) |
| 0.1 | 0.3 | GO:0070538 | oleic acid binding(GO:0070538) |
| 0.1 | 0.5 | GO:0008081 | phosphoric diester hydrolase activity(GO:0008081) |
| 0.1 | 0.2 | GO:0031750 | D3 dopamine receptor binding(GO:0031750) |
| 0.1 | 0.6 | GO:0001594 | trace-amine receptor activity(GO:0001594) |
| 0.1 | 0.1 | GO:0005119 | smoothened binding(GO:0005119) |
| 0.1 | 0.8 | GO:0043237 | laminin-1 binding(GO:0043237) |
| 0.1 | 2.1 | GO:0031005 | filamin binding(GO:0031005) |
| 0.1 | 1.0 | GO:0043560 | insulin receptor substrate binding(GO:0043560) |
| 0.1 | 0.3 | GO:0004821 | histidine-tRNA ligase activity(GO:0004821) |
| 0.1 | 0.6 | GO:0004792 | thiosulfate sulfurtransferase activity(GO:0004792) |
| 0.1 | 1.0 | GO:0004415 | hyalurononglucosaminidase activity(GO:0004415) |
| 0.1 | 1.4 | GO:0031681 | G-protein beta-subunit binding(GO:0031681) |
| 0.1 | 0.3 | GO:0036361 | racemase and epimerase activity, acting on amino acids and derivatives(GO:0016855) racemase activity, acting on amino acids and derivatives(GO:0036361) amino-acid racemase activity(GO:0047661) |
| 0.1 | 0.1 | GO:0047288 | monosialoganglioside sialyltransferase activity(GO:0047288) |
| 0.1 | 1.0 | GO:0046790 | virion binding(GO:0046790) |
| 0.1 | 0.5 | GO:0019776 | Atg8 ligase activity(GO:0019776) |
| 0.1 | 0.3 | GO:0004874 | aryl hydrocarbon receptor activity(GO:0004874) |
| 0.1 | 1.6 | GO:0004697 | protein kinase C activity(GO:0004697) |
| 0.1 | 0.2 | GO:0015235 | cobalamin transporter activity(GO:0015235) |
| 0.1 | 0.5 | GO:0004471 | malate dehydrogenase (decarboxylating) (NAD+) activity(GO:0004471) malate dehydrogenase (decarboxylating) (NADP+) activity(GO:0004473) |
| 0.1 | 0.3 | GO:1904288 | BAT3 complex binding(GO:1904288) |
| 0.1 | 0.3 | GO:0002094 | polyprenyltransferase activity(GO:0002094) |
| 0.1 | 0.9 | GO:0034485 | phosphatidylinositol-3,4,5-trisphosphate 5-phosphatase activity(GO:0034485) |
| 0.1 | 0.8 | GO:0033218 | amide binding(GO:0033218) |
| 0.1 | 0.5 | GO:0070139 | ubiquitin-like protein-specific endopeptidase activity(GO:0070137) SUMO-specific endopeptidase activity(GO:0070139) |
| 0.1 | 0.6 | GO:0047522 | 13-prostaglandin reductase activity(GO:0036132) 15-oxoprostaglandin 13-oxidase activity(GO:0047522) |
| 0.1 | 2.2 | GO:0043425 | bHLH transcription factor binding(GO:0043425) |
| 0.1 | 0.8 | GO:0002162 | dystroglycan binding(GO:0002162) |
| 0.1 | 0.1 | GO:0044729 | hemi-methylated DNA-binding(GO:0044729) |
| 0.1 | 0.3 | GO:0050698 | proteoglycan sulfotransferase activity(GO:0050698) |
| 0.1 | 0.4 | GO:0047057 | oxidoreductase activity, acting on the CH-OH group of donors, disulfide as acceptor(GO:0016900) vitamin-K-epoxide reductase (warfarin-sensitive) activity(GO:0047057) |
| 0.1 | 1.4 | GO:0004185 | serine-type carboxypeptidase activity(GO:0004185) |
| 0.1 | 0.2 | GO:0097493 | structural molecule activity conferring elasticity(GO:0097493) |
| 0.1 | 1.5 | GO:0043274 | phospholipase binding(GO:0043274) |
| 0.1 | 0.3 | GO:0004803 | transposase activity(GO:0004803) |
| 0.1 | 1.4 | GO:0008140 | cAMP response element binding protein binding(GO:0008140) |
| 0.1 | 0.5 | GO:0035252 | UDP-xylosyltransferase activity(GO:0035252) xylosyltransferase activity(GO:0042285) |
| 0.1 | 1.0 | GO:0097100 | supercoiled DNA binding(GO:0097100) |
| 0.1 | 0.1 | GO:0034739 | histone deacetylase activity (H4-K16 specific)(GO:0034739) |
| 0.1 | 0.3 | GO:0004909 | interleukin-1, Type I, activating receptor activity(GO:0004909) |
| 0.1 | 0.2 | GO:0008798 | beta-aspartyl-peptidase activity(GO:0008798) |
| 0.1 | 0.4 | GO:0015056 | corticotrophin-releasing factor receptor activity(GO:0015056) |
| 0.1 | 0.9 | GO:0034056 | estrogen response element binding(GO:0034056) |
| 0.1 | 1.1 | GO:0001206 | transcriptional repressor activity, RNA polymerase II distal enhancer sequence-specific binding(GO:0001206) |
| 0.1 | 0.7 | GO:0070739 | protein-glutamic acid ligase activity(GO:0070739) |
| 0.1 | 1.7 | GO:0004535 | poly(A)-specific ribonuclease activity(GO:0004535) |
| 0.1 | 0.6 | GO:0015277 | kainate selective glutamate receptor activity(GO:0015277) |
| 0.1 | 0.1 | GO:0016801 | epoxide hydrolase activity(GO:0004301) hydrolase activity, acting on ether bonds(GO:0016801) ether hydrolase activity(GO:0016803) |
| 0.1 | 0.5 | GO:0070573 | metallodipeptidase activity(GO:0070573) |
| 0.1 | 1.3 | GO:0015467 | G-protein activated inward rectifier potassium channel activity(GO:0015467) |
| 0.1 | 0.2 | GO:0010861 | thyroid hormone receptor activator activity(GO:0010861) thyroid hormone receptor coactivator activity(GO:0030375) |
| 0.1 | 0.3 | GO:0008431 | vitamin E binding(GO:0008431) |
| 0.1 | 0.4 | GO:0015142 | citrate transmembrane transporter activity(GO:0015137) tricarboxylic acid transmembrane transporter activity(GO:0015142) |
| 0.1 | 0.2 | GO:0071535 | RING-like zinc finger domain binding(GO:0071535) |
| 0.1 | 0.2 | GO:0000026 | alpha-1,2-mannosyltransferase activity(GO:0000026) |
| 0.1 | 1.3 | GO:0047372 | acylglycerol lipase activity(GO:0047372) |
| 0.1 | 0.4 | GO:0097016 | L27 domain binding(GO:0097016) |
| 0.1 | 0.1 | GO:0004886 | 9-cis retinoic acid receptor activity(GO:0004886) |
| 0.1 | 0.6 | GO:0005534 | galactose binding(GO:0005534) |
| 0.1 | 1.9 | GO:0008191 | metalloendopeptidase inhibitor activity(GO:0008191) |
| 0.1 | 1.0 | GO:0048156 | tau protein binding(GO:0048156) |
| 0.1 | 0.1 | GO:0098640 | integrin binding involved in cell-matrix adhesion(GO:0098640) |
| 0.1 | 0.2 | GO:0016652 | NAD(P)+ transhydrogenase activity(GO:0008746) oxidoreductase activity, acting on NAD(P)H, NAD(P) as acceptor(GO:0016652) |
| 0.1 | 0.2 | GO:0050567 | glutaminyl-tRNA synthase (glutamine-hydrolyzing) activity(GO:0050567) |
| 0.1 | 0.2 | GO:0001147 | transcription termination site sequence-specific DNA binding(GO:0001147) transcription termination site DNA binding(GO:0001160) |
| 0.1 | 0.4 | GO:0098639 | protein binding involved in cell-matrix adhesion(GO:0098634) collagen binding involved in cell-matrix adhesion(GO:0098639) |
| 0.1 | 0.5 | GO:0030628 | pre-mRNA 3'-splice site binding(GO:0030628) |
| 0.1 | 0.9 | GO:0003836 | beta-galactoside (CMP) alpha-2,3-sialyltransferase activity(GO:0003836) |
| 0.1 | 0.3 | GO:0042954 | lipoprotein transporter activity(GO:0042954) |
| 0.1 | 1.4 | GO:0008432 | JUN kinase binding(GO:0008432) |
| 0.1 | 0.5 | GO:0061133 | endopeptidase activator activity(GO:0061133) |
| 0.1 | 0.2 | GO:0032422 | purine-rich negative regulatory element binding(GO:0032422) |
| 0.1 | 0.1 | GO:0008269 | JAK pathway signal transduction adaptor activity(GO:0008269) |
| 0.1 | 0.4 | GO:0005127 | ciliary neurotrophic factor receptor binding(GO:0005127) |
| 0.1 | 4.9 | GO:0035064 | methylated histone binding(GO:0035064) |
| 0.1 | 1.0 | GO:0043522 | leucine zipper domain binding(GO:0043522) |
| 0.1 | 0.1 | GO:0004445 | inositol-polyphosphate 5-phosphatase activity(GO:0004445) |
| 0.1 | 0.2 | GO:0070579 | methylcytosine dioxygenase activity(GO:0070579) |
| 0.1 | 2.0 | GO:0005540 | hyaluronic acid binding(GO:0005540) |
| 0.1 | 0.1 | GO:0001228 | transcriptional activator activity, RNA polymerase II transcription regulatory region sequence-specific binding(GO:0001228) |
| 0.1 | 1.1 | GO:0035497 | cAMP response element binding(GO:0035497) |
| 0.1 | 0.2 | GO:0043813 | phosphatidylinositol-3,5-bisphosphate 5-phosphatase activity(GO:0043813) |
| 0.1 | 0.5 | GO:0045159 | myosin II binding(GO:0045159) |
| 0.1 | 4.8 | GO:0004402 | histone acetyltransferase activity(GO:0004402) |
| 0.1 | 0.4 | GO:0016941 | natriuretic peptide receptor activity(GO:0016941) |
| 0.1 | 1.4 | GO:0004707 | MAP kinase activity(GO:0004707) |
| 0.1 | 0.7 | GO:0071933 | Arp2/3 complex binding(GO:0071933) |
| 0.1 | 0.4 | GO:0004882 | androgen receptor activity(GO:0004882) |
| 0.1 | 1.7 | GO:0070742 | C2H2 zinc finger domain binding(GO:0070742) |
| 0.1 | 1.2 | GO:0008603 | cAMP-dependent protein kinase regulator activity(GO:0008603) |
| 0.1 | 0.2 | GO:0003896 | DNA primase activity(GO:0003896) |
| 0.1 | 0.1 | GO:0000822 | inositol hexakisphosphate binding(GO:0000822) |
| 0.1 | 1.6 | GO:0001223 | transcription coactivator binding(GO:0001223) |
| 0.1 | 0.2 | GO:0004174 | electron-transferring-flavoprotein dehydrogenase activity(GO:0004174) oxidoreductase activity, acting on the CH-NH group of donors, quinone or similar compound as acceptor(GO:0016649) |
| 0.1 | 1.0 | GO:0005522 | profilin binding(GO:0005522) |
| 0.1 | 0.4 | GO:0008109 | N-acetyllactosaminide beta-1,6-N-acetylglucosaminyltransferase activity(GO:0008109) |
| 0.1 | 0.3 | GO:0004594 | pantothenate kinase activity(GO:0004594) |
| 0.1 | 0.3 | GO:0046976 | histone methyltransferase activity (H3-K27 specific)(GO:0046976) |
| 0.1 | 0.2 | GO:0015227 | acyl carnitine transmembrane transporter activity(GO:0015227) |
| 0.1 | 0.2 | GO:0005330 | dopamine:sodium symporter activity(GO:0005330) |
| 0.1 | 0.2 | GO:0001026 | TFIIIB-type transcription factor activity(GO:0001026) |
| 0.1 | 0.1 | GO:0004998 | transferrin receptor activity(GO:0004998) |
| 0.1 | 0.3 | GO:0031752 | D5 dopamine receptor binding(GO:0031752) |
| 0.1 | 0.4 | GO:0008568 | microtubule-severing ATPase activity(GO:0008568) |
| 0.1 | 0.8 | GO:0043422 | protein kinase B binding(GO:0043422) |
| 0.1 | 0.4 | GO:0030020 | extracellular matrix structural constituent conferring tensile strength(GO:0030020) |
| 0.1 | 0.3 | GO:1990050 | phosphatidic acid transporter activity(GO:1990050) |
| 0.1 | 0.1 | GO:0071253 | connexin binding(GO:0071253) |
| 0.1 | 0.6 | GO:0015386 | potassium:proton antiporter activity(GO:0015386) |
| 0.1 | 1.5 | GO:0070064 | proline-rich region binding(GO:0070064) |
| 0.1 | 0.2 | GO:1990380 | Lys48-specific deubiquitinase activity(GO:1990380) |
| 0.1 | 0.9 | GO:0008301 | DNA binding, bending(GO:0008301) |
| 0.1 | 0.9 | GO:0032036 | myosin heavy chain binding(GO:0032036) |
| 0.1 | 0.1 | GO:0048487 | beta-tubulin binding(GO:0048487) |
| 0.1 | 0.4 | GO:0003828 | alpha-N-acetylneuraminate alpha-2,8-sialyltransferase activity(GO:0003828) |
| 0.1 | 0.3 | GO:0052843 | endopolyphosphatase activity(GO:0000298) diphosphoinositol-polyphosphate diphosphatase activity(GO:0008486) bis(5'-adenosyl)-hexaphosphatase activity(GO:0034431) bis(5'-adenosyl)-pentaphosphatase activity(GO:0034432) inositol diphosphate tetrakisphosphate diphosphatase activity(GO:0052840) inositol bisdiphosphate tetrakisphosphate diphosphatase activity(GO:0052841) inositol diphosphate pentakisphosphate diphosphatase activity(GO:0052842) inositol-1-diphosphate-2,3,4,5,6-pentakisphosphate diphosphatase activity(GO:0052843) inositol-3-diphosphate-1,2,4,5,6-pentakisphosphate diphosphatase activity(GO:0052844) inositol-5-diphosphate-1,2,3,4,6-pentakisphosphate diphosphatase activity(GO:0052845) inositol-1,5-bisdiphosphate-2,3,4,6-tetrakisphosphate 1-diphosphatase activity(GO:0052846) inositol-1,5-bisdiphosphate-2,3,4,6-tetrakisphosphate 5-diphosphatase activity(GO:0052847) inositol-3,5-bisdiphosphate-2,3,4,6-tetrakisphosphate 5-diphosphatase activity(GO:0052848) |
| 0.1 | 0.4 | GO:0009008 | DNA-methyltransferase activity(GO:0009008) |
| 0.1 | 0.2 | GO:0015439 | heme-transporting ATPase activity(GO:0015439) |
| 0.1 | 0.2 | GO:0032810 | sterol response element binding(GO:0032810) |
| 0.1 | 0.3 | GO:0004999 | vasoactive intestinal polypeptide receptor activity(GO:0004999) |
| 0.1 | 0.2 | GO:0005275 | amine transmembrane transporter activity(GO:0005275) |
| 0.1 | 0.3 | GO:0061676 | importin-alpha family protein binding(GO:0061676) |
| 0.1 | 0.4 | GO:0001517 | N-acetylglucosamine 6-O-sulfotransferase activity(GO:0001517) |
| 0.0 | 2.6 | GO:0035255 | ionotropic glutamate receptor binding(GO:0035255) |
| 0.0 | 1.2 | GO:0001221 | transcription cofactor binding(GO:0001221) |
| 0.0 | 0.1 | GO:0005042 | netrin receptor activity(GO:0005042) |
| 0.0 | 0.2 | GO:0001849 | complement component C1q binding(GO:0001849) |
| 0.0 | 0.3 | GO:0001727 | lipid kinase activity(GO:0001727) |
| 0.0 | 0.3 | GO:0008454 | alpha-1,3-mannosylglycoprotein 4-beta-N-acetylglucosaminyltransferase activity(GO:0008454) |
| 0.0 | 0.0 | GO:0036041 | long-chain fatty acid binding(GO:0036041) |
| 0.0 | 0.1 | GO:0004852 | uroporphyrinogen-III synthase activity(GO:0004852) |
| 0.0 | 0.5 | GO:0016176 | superoxide-generating NADPH oxidase activator activity(GO:0016176) |
| 0.0 | 0.5 | GO:0061578 | Lys63-specific deubiquitinase activity(GO:0061578) |
| 0.0 | 0.4 | GO:0016724 | ferroxidase activity(GO:0004322) oxidoreductase activity, oxidizing metal ions, oxygen as acceptor(GO:0016724) |
| 0.0 | 0.4 | GO:0004969 | histamine receptor activity(GO:0004969) |
| 0.0 | 1.2 | GO:0097602 | cullin family protein binding(GO:0097602) |
| 0.0 | 0.1 | GO:0001716 | L-amino-acid oxidase activity(GO:0001716) |
| 0.0 | 0.4 | GO:0034597 | phosphatidylinositol-4,5-bisphosphate 4-phosphatase activity(GO:0034597) |
| 0.0 | 0.4 | GO:0032554 | purine deoxyribonucleotide binding(GO:0032554) |
| 0.0 | 1.3 | GO:0043325 | phosphatidylinositol-3,4-bisphosphate binding(GO:0043325) |
| 0.0 | 0.1 | GO:0031826 | type 2A serotonin receptor binding(GO:0031826) |
| 0.0 | 0.4 | GO:0000099 | sulfur amino acid transmembrane transporter activity(GO:0000099) |
| 0.0 | 0.3 | GO:1990599 | 3' overhang single-stranded DNA endodeoxyribonuclease activity(GO:1990599) |
| 0.0 | 0.8 | GO:0005520 | insulin-like growth factor binding(GO:0005520) |
| 0.0 | 0.0 | GO:0035035 | histone acetyltransferase binding(GO:0035035) |
| 0.0 | 0.2 | GO:0016639 | oxidoreductase activity, acting on the CH-NH2 group of donors, NAD or NADP as acceptor(GO:0016639) |
| 0.0 | 0.4 | GO:0042731 | PH domain binding(GO:0042731) |
| 0.0 | 0.5 | GO:0070181 | small ribosomal subunit rRNA binding(GO:0070181) |
| 0.0 | 0.2 | GO:0042610 | CD8 receptor binding(GO:0042610) |
| 0.0 | 0.2 | GO:0016295 | oleoyl-[acyl-carrier-protein] hydrolase activity(GO:0004320) myristoyl-[acyl-carrier-protein] hydrolase activity(GO:0016295) palmitoyl-[acyl-carrier-protein] hydrolase activity(GO:0016296) acyl-[acyl-carrier-protein] hydrolase activity(GO:0016297) |
| 0.0 | 0.1 | GO:1904455 | ubiquitin-specific protease activity involved in negative regulation of ERAD pathway(GO:1904455) |
| 0.0 | 0.1 | GO:0017002 | activin-activated receptor activity(GO:0017002) |
| 0.0 | 0.2 | GO:0032184 | SUMO polymer binding(GO:0032184) |
| 0.0 | 0.3 | GO:0004679 | AMP-activated protein kinase activity(GO:0004679) |
| 0.0 | 1.7 | GO:0030291 | protein serine/threonine kinase inhibitor activity(GO:0030291) |
| 0.0 | 0.3 | GO:0019784 | NEDD8-specific protease activity(GO:0019784) |
| 0.0 | 1.3 | GO:0005092 | GDP-dissociation inhibitor activity(GO:0005092) |
| 0.0 | 0.3 | GO:0004741 | [pyruvate dehydrogenase (lipoamide)] phosphatase activity(GO:0004741) |
| 0.0 | 3.5 | GO:0019003 | GDP binding(GO:0019003) |
| 0.0 | 0.1 | GO:0008386 | cholesterol monooxygenase (side-chain-cleaving) activity(GO:0008386) |
| 0.0 | 0.2 | GO:0008112 | nicotinamide N-methyltransferase activity(GO:0008112) pyridine N-methyltransferase activity(GO:0030760) |
| 0.0 | 0.2 | GO:0050693 | LBD domain binding(GO:0050693) |
| 0.0 | 0.3 | GO:1901612 | cardiolipin binding(GO:1901612) |
| 0.0 | 0.2 | GO:0030618 | transforming growth factor beta receptor, pathway-specific cytoplasmic mediator activity(GO:0030618) |
| 0.0 | 0.1 | GO:0070890 | L-ascorbate:sodium symporter activity(GO:0008520) L-ascorbic acid transporter activity(GO:0015229) sodium-dependent L-ascorbate transmembrane transporter activity(GO:0070890) |
| 0.0 | 0.2 | GO:0003920 | GMP reductase activity(GO:0003920) oxidoreductase activity, acting on NAD(P)H, nitrogenous group as acceptor(GO:0016657) |
| 0.0 | 1.6 | GO:0003950 | NAD+ ADP-ribosyltransferase activity(GO:0003950) |
| 0.0 | 0.2 | GO:0016744 | transferase activity, transferring aldehyde or ketonic groups(GO:0016744) |
| 0.0 | 0.2 | GO:0004359 | glutaminase activity(GO:0004359) |
| 0.0 | 0.2 | GO:0042289 | MHC class II protein binding(GO:0042289) |
| 0.0 | 0.2 | GO:0019237 | centromeric DNA binding(GO:0019237) |
| 0.0 | 0.0 | GO:0051425 | PTB domain binding(GO:0051425) |
| 0.0 | 0.2 | GO:0003998 | acylphosphatase activity(GO:0003998) |
| 0.0 | 0.2 | GO:0004735 | pyrroline-5-carboxylate reductase activity(GO:0004735) |
| 0.0 | 0.2 | GO:0046975 | histone methyltransferase activity (H3-K36 specific)(GO:0046975) |
| 0.0 | 2.0 | GO:0004693 | cyclin-dependent protein serine/threonine kinase activity(GO:0004693) |
| 0.0 | 0.3 | GO:1904315 | neurotransmitter receptor activity involved in regulation of postsynaptic membrane potential(GO:0099529) transmitter-gated ion channel activity involved in regulation of postsynaptic membrane potential(GO:1904315) |
| 0.0 | 0.5 | GO:1990247 | N6-methyladenosine-containing RNA binding(GO:1990247) |
| 0.0 | 0.3 | GO:0005068 | transmembrane receptor protein tyrosine kinase adaptor activity(GO:0005068) |
| 0.0 | 0.2 | GO:0004348 | glucosylceramidase activity(GO:0004348) |
| 0.0 | 0.1 | GO:0070991 | medium-chain-acyl-CoA dehydrogenase activity(GO:0070991) |
| 0.0 | 0.8 | GO:0042169 | SH2 domain binding(GO:0042169) |
| 0.0 | 0.1 | GO:0036487 | nitric-oxide synthase inhibitor activity(GO:0036487) |
| 0.0 | 0.9 | GO:0070530 | K63-linked polyubiquitin binding(GO:0070530) |
| 0.0 | 0.2 | GO:0015189 | L-lysine transmembrane transporter activity(GO:0015189) |
| 0.0 | 0.1 | GO:0008424 | glycoprotein 6-alpha-L-fucosyltransferase activity(GO:0008424) alpha-(1->6)-fucosyltransferase activity(GO:0046921) |
| 0.0 | 0.2 | GO:0004118 | cGMP-stimulated cyclic-nucleotide phosphodiesterase activity(GO:0004118) |
| 0.0 | 0.1 | GO:0031690 | adrenergic receptor binding(GO:0031690) |
| 0.0 | 0.2 | GO:0032089 | NACHT domain binding(GO:0032089) |
| 0.0 | 0.0 | GO:0035034 | histone acetyltransferase regulator activity(GO:0035034) |
| 0.0 | 2.1 | GO:0030374 | ligand-dependent nuclear receptor transcription coactivator activity(GO:0030374) |
| 0.0 | 1.2 | GO:0008327 | methyl-CpG binding(GO:0008327) |
| 0.0 | 0.2 | GO:1902444 | riboflavin binding(GO:1902444) |
| 0.0 | 0.7 | GO:0004385 | guanylate kinase activity(GO:0004385) |
| 0.0 | 1.5 | GO:0004198 | calcium-dependent cysteine-type endopeptidase activity(GO:0004198) |
| 0.0 | 0.5 | GO:0008494 | translation activator activity(GO:0008494) |
| 0.0 | 0.9 | GO:0016538 | cyclin-dependent protein serine/threonine kinase regulator activity(GO:0016538) |
| 0.0 | 0.2 | GO:0015288 | porin activity(GO:0015288) |
| 0.0 | 0.2 | GO:0072542 | protein phosphatase activator activity(GO:0072542) |
| 0.0 | 0.4 | GO:0015166 | polyol transmembrane transporter activity(GO:0015166) |
| 0.0 | 0.1 | GO:0016230 | sphingomyelin phosphodiesterase activator activity(GO:0016230) |
| 0.0 | 0.1 | GO:0031716 | calcitonin receptor binding(GO:0031716) |
| 0.0 | 0.9 | GO:0000062 | fatty-acyl-CoA binding(GO:0000062) |
| 0.0 | 0.2 | GO:0016361 | activin receptor activity, type I(GO:0016361) |
| 0.0 | 0.2 | GO:0098811 | transcriptional activator activity, RNA polymerase II transcription factor binding(GO:0001190) transcriptional repressor activity, RNA polymerase II activating transcription factor binding(GO:0098811) |
| 0.0 | 0.2 | GO:0010859 | calcium-dependent cysteine-type endopeptidase inhibitor activity(GO:0010859) |
| 0.0 | 0.2 | GO:0098519 | nucleotide phosphatase activity, acting on free nucleotides(GO:0098519) |
| 0.0 | 0.1 | GO:0008466 | glycogenin glucosyltransferase activity(GO:0008466) |
| 0.0 | 0.7 | GO:0004709 | MAP kinase kinase kinase activity(GO:0004709) |
| 0.0 | 0.1 | GO:0033867 | Fas-activated serine/threonine kinase activity(GO:0033867) |
| 0.0 | 0.1 | GO:0050254 | rhodopsin kinase activity(GO:0050254) |
| 0.0 | 0.0 | GO:0005150 | interleukin-1, Type I receptor binding(GO:0005150) |
| 0.0 | 0.9 | GO:0008266 | poly(U) RNA binding(GO:0008266) |
| 0.0 | 0.1 | GO:0035515 | oxidative RNA demethylase activity(GO:0035515) |
| 0.0 | 0.2 | GO:0004430 | 1-phosphatidylinositol 4-kinase activity(GO:0004430) |
| 0.0 | 0.3 | GO:0004550 | nucleoside diphosphate kinase activity(GO:0004550) |
| 0.0 | 0.2 | GO:0046912 | transferase activity, transferring acyl groups, acyl groups converted into alkyl on transfer(GO:0046912) |
| 0.0 | 0.2 | GO:0008422 | beta-glucosidase activity(GO:0008422) |
| 0.0 | 0.2 | GO:0032051 | clathrin light chain binding(GO:0032051) |
| 0.0 | 0.2 | GO:0031871 | proteinase activated receptor binding(GO:0031871) |
| 0.0 | 0.0 | GO:0052642 | lysophosphatidic acid phosphatase activity(GO:0052642) |
| 0.0 | 0.3 | GO:0004957 | prostaglandin E receptor activity(GO:0004957) |
| 0.0 | 0.1 | GO:0050998 | nitric-oxide synthase binding(GO:0050998) |
| 0.0 | 0.1 | GO:0031531 | thyrotropin-releasing hormone receptor binding(GO:0031531) |
| 0.0 | 0.9 | GO:0051010 | microtubule plus-end binding(GO:0051010) |
| 0.0 | 0.3 | GO:0070569 | uridylyltransferase activity(GO:0070569) |
| 0.0 | 2.4 | GO:0005201 | extracellular matrix structural constituent(GO:0005201) |
| 0.0 | 4.1 | GO:0003697 | single-stranded DNA binding(GO:0003697) |
| 0.0 | 0.0 | GO:0017057 | 6-phosphogluconolactonase activity(GO:0017057) |
| 0.0 | 0.1 | GO:0008969 | phosphohistidine phosphatase activity(GO:0008969) |
| 0.0 | 0.3 | GO:0008467 | [heparan sulfate]-glucosamine 3-sulfotransferase 1 activity(GO:0008467) |
| 0.0 | 0.2 | GO:0015174 | basic amino acid transmembrane transporter activity(GO:0015174) |
| 0.0 | 0.3 | GO:0004689 | phosphorylase kinase activity(GO:0004689) |
| 0.0 | 0.1 | GO:0034714 | type III transforming growth factor beta receptor binding(GO:0034714) |
| 0.0 | 1.3 | GO:0001106 | RNA polymerase II transcription corepressor activity(GO:0001106) |
| 0.0 | 0.1 | GO:0005137 | interleukin-5 receptor binding(GO:0005137) |
| 0.0 | 0.6 | GO:0045504 | dynein heavy chain binding(GO:0045504) |
| 0.0 | 0.2 | GO:0005353 | fructose transmembrane transporter activity(GO:0005353) |
| 0.0 | 0.1 | GO:0016899 | oxidoreductase activity, acting on the CH-OH group of donors, oxygen as acceptor(GO:0016899) |
| 0.0 | 0.3 | GO:0035877 | death effector domain binding(GO:0035877) |
| 0.0 | 0.3 | GO:0016805 | dipeptidase activity(GO:0016805) |
| 0.0 | 0.1 | GO:0005499 | vitamin D binding(GO:0005499) |
| 0.0 | 4.2 | GO:0008565 | protein transporter activity(GO:0008565) |
| 0.0 | 0.1 | GO:0008073 | ornithine decarboxylase inhibitor activity(GO:0008073) |
| 0.0 | 1.0 | GO:0000993 | RNA polymerase II core binding(GO:0000993) |
| 0.0 | 1.2 | GO:0030371 | translation repressor activity(GO:0030371) |
| 0.0 | 1.3 | GO:0000979 | RNA polymerase II core promoter sequence-specific DNA binding(GO:0000979) |
| 0.0 | 0.3 | GO:0034513 | box H/ACA snoRNA binding(GO:0034513) |
| 0.0 | 0.3 | GO:0033592 | RNA strand annealing activity(GO:0033592) |
| 0.0 | 0.4 | GO:0004723 | calcium-dependent protein serine/threonine phosphatase activity(GO:0004723) |
| 0.0 | 0.1 | GO:0005000 | vasopressin receptor activity(GO:0005000) |
| 0.0 | 0.1 | GO:0004887 | thyroid hormone receptor activity(GO:0004887) |
| 0.0 | 0.4 | GO:0016671 | oxidoreductase activity, acting on a sulfur group of donors, disulfide as acceptor(GO:0016671) |
| 0.0 | 0.2 | GO:0097157 | pre-mRNA intronic binding(GO:0097157) |
| 0.0 | 0.2 | GO:0008449 | N-acetylglucosamine-6-sulfatase activity(GO:0008449) |
| 0.0 | 0.6 | GO:0008253 | 5'-nucleotidase activity(GO:0008253) |
| 0.0 | 1.8 | GO:0005546 | phosphatidylinositol-4,5-bisphosphate binding(GO:0005546) |
| 0.0 | 0.1 | GO:0008192 | RNA guanylyltransferase activity(GO:0008192) |
| 0.0 | 0.0 | GO:0016312 | inositol bisphosphate phosphatase activity(GO:0016312) |
| 0.0 | 0.2 | GO:0015307 | drug:proton antiporter activity(GO:0015307) |
| 0.0 | 0.1 | GO:0055131 | C3HC4-type RING finger domain binding(GO:0055131) |
| 0.0 | 0.1 | GO:0019911 | structural constituent of myelin sheath(GO:0019911) |
| 0.0 | 0.1 | GO:0004667 | prostaglandin-D synthase activity(GO:0004667) |
| 0.0 | 0.8 | GO:0036002 | pre-mRNA binding(GO:0036002) |
| 0.0 | 5.8 | GO:0017137 | Rab GTPase binding(GO:0017137) |
| 0.0 | 0.1 | GO:0001733 | galactosylceramide sulfotransferase activity(GO:0001733) galactose 3-O-sulfotransferase activity(GO:0050694) |
| 0.0 | 0.4 | GO:0016798 | hydrolase activity, acting on glycosyl bonds(GO:0016798) |
| 0.0 | 0.3 | GO:0017166 | vinculin binding(GO:0017166) |
| 0.0 | 0.2 | GO:0004656 | procollagen-proline 4-dioxygenase activity(GO:0004656) procollagen-proline dioxygenase activity(GO:0019798) |
| 0.0 | 0.4 | GO:0035198 | miRNA binding(GO:0035198) |
| 0.0 | 0.1 | GO:0003678 | DNA helicase activity(GO:0003678) |
| 0.0 | 0.1 | GO:0047708 | biotinidase activity(GO:0047708) |
| 0.0 | 0.3 | GO:0016884 | carbon-nitrogen ligase activity, with glutamine as amido-N-donor(GO:0016884) |
| 0.0 | 0.0 | GO:0070878 | primary miRNA binding(GO:0070878) |
| 0.0 | 1.1 | GO:0016504 | peptidase activator activity(GO:0016504) |
| 0.0 | 0.9 | GO:0001786 | phosphatidylserine binding(GO:0001786) |
| 0.0 | 0.3 | GO:0051371 | muscle alpha-actinin binding(GO:0051371) |
| 0.0 | 1.0 | GO:0003700 | nucleic acid binding transcription factor activity(GO:0001071) transcription factor activity, sequence-specific DNA binding(GO:0003700) |
| 0.0 | 0.1 | GO:0036033 | mediator complex binding(GO:0036033) |
| 0.0 | 1.6 | GO:0008138 | protein tyrosine/serine/threonine phosphatase activity(GO:0008138) |
| 0.0 | 0.1 | GO:0042007 | interleukin-18 binding(GO:0042007) |
| 0.0 | 0.3 | GO:0008179 | adenylate cyclase binding(GO:0008179) |
| 0.0 | 0.1 | GO:0008948 | oxaloacetate decarboxylase activity(GO:0008948) |
| 0.0 | 0.4 | GO:0010857 | calcium-dependent protein serine/threonine kinase activity(GO:0009931) calcium-dependent protein kinase activity(GO:0010857) |
| 0.0 | 0.4 | GO:0042609 | CD4 receptor binding(GO:0042609) |
| 0.0 | 0.8 | GO:0043015 | gamma-tubulin binding(GO:0043015) |
| 0.0 | 0.0 | GO:0034186 | apolipoprotein A-I binding(GO:0034186) |
| 0.0 | 0.6 | GO:0097200 | cysteine-type endopeptidase activity involved in execution phase of apoptosis(GO:0097200) |
| 0.0 | 0.0 | GO:0015018 | galactosylgalactosylxylosylprotein 3-beta-glucuronosyltransferase activity(GO:0015018) |
| 0.0 | 0.1 | GO:0035197 | siRNA binding(GO:0035197) |
| 0.0 | 0.5 | GO:0070006 | metalloaminopeptidase activity(GO:0070006) |
| 0.0 | 0.1 | GO:0004677 | DNA-dependent protein kinase activity(GO:0004677) |
| 0.0 | 0.1 | GO:0097027 | ubiquitin-protein transferase activator activity(GO:0097027) |
| 0.0 | 0.1 | GO:0004647 | phosphoserine phosphatase activity(GO:0004647) |
| 0.0 | 1.9 | GO:0030165 | PDZ domain binding(GO:0030165) |
| 0.0 | 0.2 | GO:0019789 | SUMO transferase activity(GO:0019789) |
| 0.0 | 0.1 | GO:0039552 | RIG-I binding(GO:0039552) |
| 0.0 | 0.4 | GO:0043295 | glutathione binding(GO:0043295) |
| 0.0 | 0.7 | GO:0005212 | structural constituent of eye lens(GO:0005212) |
| 0.0 | 0.1 | GO:0005412 | glucose:sodium symporter activity(GO:0005412) |
| 0.0 | 0.0 | GO:0016500 | protein-hormone receptor activity(GO:0016500) |
| 0.0 | 0.2 | GO:0016715 | oxidoreductase activity, acting on paired donors, with incorporation or reduction of molecular oxygen, reduced ascorbate as one donor, and incorporation of one atom of oxygen(GO:0016715) |
| 0.0 | 0.1 | GO:0060002 | plus-end directed microfilament motor activity(GO:0060002) |
| 0.0 | 0.1 | GO:0048030 | disaccharide binding(GO:0048030) |
| 0.0 | 0.1 | GO:0004768 | stearoyl-CoA 9-desaturase activity(GO:0004768) acyl-CoA desaturase activity(GO:0016215) |
| 0.0 | 0.2 | GO:0003777 | microtubule motor activity(GO:0003777) |
| 0.0 | 0.1 | GO:0051373 | FATZ binding(GO:0051373) |
| 0.0 | 0.1 | GO:0030957 | Tat protein binding(GO:0030957) |
| 0.0 | 0.2 | GO:0001671 | ATPase activator activity(GO:0001671) |
| 0.0 | 0.5 | GO:0046966 | thyroid hormone receptor binding(GO:0046966) |
| 0.0 | 2.9 | GO:0004222 | metalloendopeptidase activity(GO:0004222) |
| 0.0 | 0.5 | GO:0070412 | R-SMAD binding(GO:0070412) |
| 0.0 | 0.1 | GO:0004694 | eukaryotic translation initiation factor 2alpha kinase activity(GO:0004694) |
| 0.0 | 0.1 | GO:0004793 | glycine hydroxymethyltransferase activity(GO:0004372) threonine aldolase activity(GO:0004793) L-allo-threonine aldolase activity(GO:0008732) |
| 0.0 | 0.4 | GO:0015035 | protein disulfide oxidoreductase activity(GO:0015035) |
| 0.0 | 0.4 | GO:0005547 | phosphatidylinositol-3,4,5-trisphosphate binding(GO:0005547) |
| 0.0 | 1.0 | GO:0005544 | calcium-dependent phospholipid binding(GO:0005544) |
| 0.0 | 1.2 | GO:0001104 | RNA polymerase II transcription cofactor activity(GO:0001104) |
| 0.0 | 0.1 | GO:0005277 | acetylcholine transmembrane transporter activity(GO:0005277) acetate ester transmembrane transporter activity(GO:1901375) |
| 0.0 | 0.7 | GO:0004180 | carboxypeptidase activity(GO:0004180) |
| 0.0 | 0.2 | GO:0001135 | transcription factor activity, RNA polymerase II transcription factor recruiting(GO:0001135) |
| 0.0 | 1.0 | GO:0051539 | 4 iron, 4 sulfur cluster binding(GO:0051539) |
| 0.0 | 0.1 | GO:0004132 | dCMP deaminase activity(GO:0004132) |
| 0.0 | 0.1 | GO:0005220 | inositol 1,4,5-trisphosphate-sensitive calcium-release channel activity(GO:0005220) |
| 0.0 | 0.2 | GO:0016208 | AMP binding(GO:0016208) |
| 0.0 | 0.1 | GO:0050119 | N-acetylglucosamine deacetylase activity(GO:0050119) |
| 0.0 | 0.1 | GO:0004485 | methylcrotonoyl-CoA carboxylase activity(GO:0004485) |
| 0.0 | 0.1 | GO:0031996 | thioesterase binding(GO:0031996) |
| 0.0 | 0.1 | GO:0004365 | glyceraldehyde-3-phosphate dehydrogenase (NAD+) (phosphorylating) activity(GO:0004365) glyceraldehyde-3-phosphate dehydrogenase (NAD(P)+) (phosphorylating) activity(GO:0043891) |
| 0.0 | 0.3 | GO:0005432 | calcium:sodium antiporter activity(GO:0005432) |
| 0.0 | 0.1 | GO:0031435 | mitogen-activated protein kinase kinase kinase binding(GO:0031435) |
| 0.0 | 0.1 | GO:0004828 | serine-tRNA ligase activity(GO:0004828) |
| 0.0 | 0.7 | GO:0042162 | telomeric DNA binding(GO:0042162) |
| 0.0 | 0.0 | GO:0030172 | troponin C binding(GO:0030172) |
| 0.0 | 0.1 | GO:0034452 | dynactin binding(GO:0034452) |
| 0.0 | 4.7 | GO:0003714 | transcription corepressor activity(GO:0003714) |
| 0.0 | 0.2 | GO:0030898 | actin-dependent ATPase activity(GO:0030898) |
| 0.0 | 0.1 | GO:0004878 | complement component C5a receptor activity(GO:0004878) |
| 0.0 | 0.1 | GO:0071987 | WD40-repeat domain binding(GO:0071987) |
| 0.0 | 0.2 | GO:0004332 | fructose-bisphosphate aldolase activity(GO:0004332) |
| 0.0 | 0.1 | GO:0042030 | ATPase inhibitor activity(GO:0042030) |
| 0.0 | 0.1 | GO:0034236 | protein kinase A catalytic subunit binding(GO:0034236) |
| 0.0 | 0.2 | GO:0052744 | phosphatidylinositol-3-phosphatase activity(GO:0004438) phosphatidylinositol monophosphate phosphatase activity(GO:0052744) |
| 0.0 | 0.1 | GO:0004704 | NF-kappaB-inducing kinase activity(GO:0004704) |
| 0.0 | 0.2 | GO:0050811 | GABA receptor binding(GO:0050811) |
| 0.0 | 0.1 | GO:0035925 | mRNA 3'-UTR AU-rich region binding(GO:0035925) |
| 0.0 | 0.1 | GO:0017077 | oxidative phosphorylation uncoupler activity(GO:0017077) |
| 0.0 | 0.7 | GO:0048365 | Rac GTPase binding(GO:0048365) |
| 0.0 | 0.1 | GO:0048039 | ubiquinone binding(GO:0048039) |
| 0.0 | 0.1 | GO:0050262 | ribosylnicotinamide kinase activity(GO:0050262) ribosylnicotinate kinase activity(GO:0061769) |
| 0.0 | 0.1 | GO:0008198 | ferrous iron binding(GO:0008198) |
| 0.0 | 0.6 | GO:0031492 | nucleosomal DNA binding(GO:0031492) |
| 0.0 | 0.1 | GO:0051733 | ATP-dependent polydeoxyribonucleotide 5'-hydroxyl-kinase activity(GO:0046404) polydeoxyribonucleotide kinase activity(GO:0051733) ATP-dependent polynucleotide kinase activity(GO:0051734) |
| 0.0 | 0.1 | GO:0098641 | cadherin binding involved in cell-cell adhesion(GO:0098641) |
| 0.0 | 0.2 | GO:0046870 | cadmium ion binding(GO:0046870) |
| 0.0 | 0.4 | GO:0043395 | heparan sulfate proteoglycan binding(GO:0043395) |
| 0.0 | 0.1 | GO:0017025 | TBP-class protein binding(GO:0017025) |
| 0.0 | 0.2 | GO:0004716 | receptor signaling protein tyrosine kinase activity(GO:0004716) |
| 0.0 | 1.5 | GO:0008307 | structural constituent of muscle(GO:0008307) |
| 0.0 | 5.4 | GO:0005096 | GTPase activator activity(GO:0005096) |
| 0.0 | 0.1 | GO:0008479 | queuine tRNA-ribosyltransferase activity(GO:0008479) |
| 0.0 | 1.1 | GO:0005044 | scavenger receptor activity(GO:0005044) |
| 0.0 | 0.5 | GO:0005528 | macrolide binding(GO:0005527) FK506 binding(GO:0005528) |
| 0.0 | 0.4 | GO:0005086 | ARF guanyl-nucleotide exchange factor activity(GO:0005086) |
| 0.0 | 0.1 | GO:0008420 | CTD phosphatase activity(GO:0008420) |
| 0.0 | 0.1 | GO:0098748 | clathrin adaptor activity(GO:0035615) endocytic adaptor activity(GO:0098748) |
| 0.0 | 0.0 | GO:0015361 | low-affinity sodium:dicarboxylate symporter activity(GO:0015361) sodium:dicarboxylate symporter activity(GO:0017153) |
| 0.0 | 1.9 | GO:0031072 | heat shock protein binding(GO:0031072) |
| 0.0 | 0.1 | GO:0032145 | 4-aminobutyrate transaminase activity(GO:0003867) succinate-semialdehyde dehydrogenase binding(GO:0032145) (S)-3-amino-2-methylpropionate transaminase activity(GO:0047298) |
| 0.0 | 0.1 | GO:0035091 | phosphatidylinositol binding(GO:0035091) |
| 0.0 | 0.2 | GO:0005159 | insulin-like growth factor receptor binding(GO:0005159) |
| 0.0 | 0.4 | GO:0001046 | core promoter sequence-specific DNA binding(GO:0001046) |
| 0.0 | 0.1 | GO:0004972 | NMDA glutamate receptor activity(GO:0004972) |
| 0.0 | 0.0 | GO:0034595 | phosphatidylinositol phosphate 5-phosphatase activity(GO:0034595) |
| 0.0 | 0.2 | GO:0003906 | DNA-(apurinic or apyrimidinic site) lyase activity(GO:0003906) |
| 0.0 | 0.0 | GO:0008430 | selenium binding(GO:0008430) |
| 0.0 | 0.0 | GO:0004019 | adenylosuccinate synthase activity(GO:0004019) |
| 0.0 | 0.7 | GO:0004712 | protein serine/threonine/tyrosine kinase activity(GO:0004712) |
| 0.0 | 0.4 | GO:0019206 | nucleoside kinase activity(GO:0019206) |
| 0.0 | 0.1 | GO:0016846 | carbon-sulfur lyase activity(GO:0016846) |
| 0.0 | 0.1 | GO:0016018 | cyclosporin A binding(GO:0016018) |
| 0.0 | 1.1 | GO:0008186 | ATP-dependent RNA helicase activity(GO:0004004) RNA-dependent ATPase activity(GO:0008186) |
| 0.0 | 0.0 | GO:0071885 | N-terminal protein N-methyltransferase activity(GO:0071885) |
| 0.0 | 0.1 | GO:0071208 | histone pre-mRNA DCP binding(GO:0071208) U7 snRNA binding(GO:0071209) |
| 0.0 | 0.1 | GO:0008559 | xenobiotic-transporting ATPase activity(GO:0008559) |
| 0.0 | 0.1 | GO:0035312 | 5'-3' exodeoxyribonuclease activity(GO:0035312) |
| 0.0 | 0.1 | GO:0031849 | olfactory receptor binding(GO:0031849) |
| 0.0 | 0.1 | GO:0047045 | testosterone 17-beta-dehydrogenase (NADP+) activity(GO:0047045) |
| 0.0 | 0.1 | GO:0004035 | alkaline phosphatase activity(GO:0004035) |
| 0.0 | 0.1 | GO:0001515 | opioid peptide activity(GO:0001515) |
| 0.0 | 0.1 | GO:0035173 | histone kinase activity(GO:0035173) |
| 0.0 | 0.1 | GO:0004910 | interleukin-1, Type II, blocking receptor activity(GO:0004910) |
| 0.0 | 0.1 | GO:0000990 | transcription factor activity, core RNA polymerase binding(GO:0000990) |
| 0.0 | 0.1 | GO:0008508 | bile acid:sodium symporter activity(GO:0008508) |
| 0.0 | 4.5 | GO:0001077 | transcriptional activator activity, RNA polymerase II core promoter proximal region sequence-specific binding(GO:0001077) |
| 0.0 | 0.1 | GO:0000213 | tRNA-intron endonuclease activity(GO:0000213) |
| 0.0 | 0.1 | GO:0016428 | tRNA (cytosine-5-)-methyltransferase activity(GO:0016428) |
| 0.0 | 0.2 | GO:0004030 | aldehyde dehydrogenase [NAD(P)+] activity(GO:0004030) |
| 0.0 | 0.1 | GO:0003988 | acetyl-CoA C-acyltransferase activity(GO:0003988) |
| 0.0 | 0.3 | GO:0008331 | high voltage-gated calcium channel activity(GO:0008331) |
| 0.0 | 0.8 | GO:0048306 | calcium-dependent protein binding(GO:0048306) |
| 0.0 | 0.0 | GO:0008440 | inositol-1,4,5-trisphosphate 3-kinase activity(GO:0008440) |
| 0.0 | 0.0 | GO:0043008 | ATP-dependent protein binding(GO:0043008) |
| 0.0 | 0.1 | GO:0031728 | CCR3 chemokine receptor binding(GO:0031728) |
| 0.0 | 0.0 | GO:0004416 | hydroxyacylglutathione hydrolase activity(GO:0004416) |
| 0.0 | 0.1 | GO:0070008 | serine-type exopeptidase activity(GO:0070008) |
| 0.0 | 0.2 | GO:0070577 | lysine-acetylated histone binding(GO:0070577) |
| 0.0 | 0.7 | GO:0050136 | NADH dehydrogenase (ubiquinone) activity(GO:0008137) NADH dehydrogenase (quinone) activity(GO:0050136) |
| 0.0 | 0.1 | GO:0035251 | UDP-glucosyltransferase activity(GO:0035251) |
| 0.0 | 0.0 | GO:0050291 | sphingosine N-acyltransferase activity(GO:0050291) |
| 0.0 | 0.1 | GO:0031386 | protein tag(GO:0031386) |
| 0.0 | 0.0 | GO:0004961 | thromboxane receptor activity(GO:0004960) thromboxane A2 receptor activity(GO:0004961) |
| 0.0 | 0.1 | GO:0022851 | GABA-gated chloride ion channel activity(GO:0022851) |
| 0.0 | 0.1 | GO:0005384 | manganese ion transmembrane transporter activity(GO:0005384) |
| 0.0 | 0.1 | GO:0004687 | myosin light chain kinase activity(GO:0004687) |
| 0.0 | 0.9 | GO:0001618 | virus receptor activity(GO:0001618) |
| 0.0 | 0.0 | GO:0016418 | S-acetyltransferase activity(GO:0016418) |
| 0.0 | 0.1 | GO:0004551 | nucleotide diphosphatase activity(GO:0004551) |
| 0.0 | 0.0 | GO:0034713 | type I transforming growth factor beta receptor binding(GO:0034713) |
| 0.0 | 0.0 | GO:0004813 | alanine-tRNA ligase activity(GO:0004813) |
| 0.0 | 0.2 | GO:0017048 | Rho GTPase binding(GO:0017048) |
| 0.0 | 0.0 | GO:0019763 | immunoglobulin receptor activity(GO:0019763) |
| 0.0 | 0.3 | GO:0004383 | guanylate cyclase activity(GO:0004383) |
| 0.0 | 0.0 | GO:0016842 | amidine-lyase activity(GO:0016842) |
| 0.0 | 0.1 | GO:0048019 | receptor antagonist activity(GO:0048019) |
| 0.0 | 0.1 | GO:0004873 | asialoglycoprotein receptor activity(GO:0004873) |
| 0.0 | 0.1 | GO:0004499 | N,N-dimethylaniline monooxygenase activity(GO:0004499) |
| 0.0 | 0.1 | GO:0035613 | RNA stem-loop binding(GO:0035613) |
| 0.0 | 0.0 | GO:0034041 | sterol-transporting ATPase activity(GO:0034041) |
| 0.0 | 0.1 | GO:0004719 | protein-L-isoaspartate (D-aspartate) O-methyltransferase activity(GO:0004719) |
| 0.0 | 0.5 | GO:0017112 | Rab guanyl-nucleotide exchange factor activity(GO:0017112) |
| 0.0 | 0.1 | GO:0003707 | steroid hormone receptor activity(GO:0003707) |
| 0.0 | 0.2 | GO:0008574 | ATP-dependent microtubule motor activity, plus-end-directed(GO:0008574) |
| 0.0 | 0.1 | GO:0004722 | protein serine/threonine phosphatase activity(GO:0004722) |
| 0.0 | 0.2 | GO:0004602 | glutathione peroxidase activity(GO:0004602) |
| 0.0 | 0.1 | GO:0001091 | RNA polymerase II basal transcription factor binding(GO:0001091) |
| 0.0 | 0.1 | GO:0016832 | aldehyde-lyase activity(GO:0016832) |
Gene overrepresentation in C2:CP category:
| Log-likelihood per target | Total log-likelihood | Term | Description |
|---|---|---|---|
| 0.2 | 0.2 | PID S1P S1P1 PATHWAY | S1P1 pathway |
| 0.2 | 6.4 | PID HEDGEHOG 2PATHWAY | Signaling events mediated by the Hedgehog family |
| 0.2 | 6.2 | PID TOLL ENDOGENOUS PATHWAY | Endogenous TLR signaling |
| 0.1 | 0.3 | ST GRANULE CELL SURVIVAL PATHWAY | Granule Cell Survival Pathway is a specific case of more general PAC1 Receptor Pathway. |
| 0.1 | 2.8 | PID RETINOIC ACID PATHWAY | Retinoic acid receptors-mediated signaling |
| 0.1 | 2.2 | PID P38 GAMMA DELTA PATHWAY | Signaling mediated by p38-gamma and p38-delta |
| 0.1 | 8.9 | PID PI3K PLC TRK PATHWAY | Trk receptor signaling mediated by PI3K and PLC-gamma |
| 0.1 | 2.8 | SA PROGRAMMED CELL DEATH | Programmed cell death, or apoptosis, eliminates damaged or unneeded cells. |
| 0.1 | 4.3 | PID IGF1 PATHWAY | IGF1 pathway |
| 0.1 | 2.4 | PID PRL SIGNALING EVENTS PATHWAY | Signaling events mediated by PRL |
| 0.1 | 0.1 | PID VEGFR1 PATHWAY | VEGFR1 specific signals |
| 0.1 | 3.9 | PID SYNDECAN 4 PATHWAY | Syndecan-4-mediated signaling events |
| 0.1 | 1.5 | PID VEGF VEGFR PATHWAY | VEGF and VEGFR signaling network |
| 0.1 | 1.4 | PID LYMPH ANGIOGENESIS PATHWAY | VEGFR3 signaling in lymphatic endothelium |
| 0.1 | 1.0 | SA REG CASCADE OF CYCLIN EXPR | Expression of cyclins regulates progression through the cell cycle by activating cyclin-dependent kinases. |
| 0.1 | 5.3 | PID SYNDECAN 2 PATHWAY | Syndecan-2-mediated signaling events |
| 0.1 | 3.8 | PID RXR VDR PATHWAY | RXR and RAR heterodimerization with other nuclear receptor |
| 0.1 | 7.9 | PID AVB3 INTEGRIN PATHWAY | Integrins in angiogenesis |
| 0.1 | 3.5 | PID NETRIN PATHWAY | Netrin-mediated signaling events |
| 0.1 | 6.3 | PID ILK PATHWAY | Integrin-linked kinase signaling |
| 0.1 | 5.5 | PID HES HEY PATHWAY | Notch-mediated HES/HEY network |
| 0.1 | 1.1 | PID THROMBIN PAR4 PATHWAY | PAR4-mediated thrombin signaling events |
| 0.1 | 0.2 | PID NFAT 3PATHWAY | Role of Calcineurin-dependent NFAT signaling in lymphocytes |
| 0.1 | 3.8 | SIG INSULIN RECEPTOR PATHWAY IN CARDIAC MYOCYTES | Genes related to the insulin receptor pathway |
| 0.1 | 0.1 | PID PI3KCI AKT PATHWAY | Class I PI3K signaling events mediated by Akt |
| 0.1 | 4.3 | PID ERBB1 INTERNALIZATION PATHWAY | Internalization of ErbB1 |
| 0.1 | 3.8 | PID AR TF PATHWAY | Regulation of Androgen receptor activity |
| 0.1 | 3.4 | PID TCR CALCIUM PATHWAY | Calcium signaling in the CD4+ TCR pathway |
| 0.1 | 0.6 | PID NECTIN PATHWAY | Nectin adhesion pathway |
| 0.1 | 17.1 | NABA ECM GLYCOPROTEINS | Genes encoding structural ECM glycoproteins |
| 0.1 | 0.9 | PID INSULIN GLUCOSE PATHWAY | Insulin-mediated glucose transport |
| 0.0 | 1.5 | PID AURORA A PATHWAY | Aurora A signaling |
| 0.0 | 2.5 | PID HNF3A PATHWAY | FOXA1 transcription factor network |
| 0.0 | 1.7 | PID ECADHERIN NASCENT AJ PATHWAY | E-cadherin signaling in the nascent adherens junction |
| 0.0 | 3.2 | ST FAS SIGNALING PATHWAY | Fas Signaling Pathway |
| 0.0 | 2.2 | PID ATF2 PATHWAY | ATF-2 transcription factor network |
| 0.0 | 0.2 | PID ERBB4 PATHWAY | ErbB4 signaling events |
| 0.0 | 0.6 | PID P73PATHWAY | p73 transcription factor network |
| 0.0 | 1.6 | PID AJDISS 2PATHWAY | Posttranslational regulation of adherens junction stability and dissassembly |
| 0.0 | 1.5 | PID IL1 PATHWAY | IL1-mediated signaling events |
| 0.0 | 1.3 | PID NCADHERIN PATHWAY | N-cadherin signaling events |
| 0.0 | 0.6 | PID CIRCADIAN PATHWAY | Circadian rhythm pathway |
| 0.0 | 0.8 | ST GA12 PATHWAY | G alpha 12 Pathway |
| 0.0 | 2.1 | PID CDC42 REG PATHWAY | Regulation of CDC42 activity |
| 0.0 | 3.2 | PID CMYB PATHWAY | C-MYB transcription factor network |
| 0.0 | 1.5 | PID KIT PATHWAY | Signaling events mediated by Stem cell factor receptor (c-Kit) |
| 0.0 | 0.5 | PID FAS PATHWAY | FAS (CD95) signaling pathway |
| 0.0 | 1.1 | ST WNT BETA CATENIN PATHWAY | Wnt/beta-catenin Pathway |
| 0.0 | 0.5 | PID PS1 PATHWAY | Presenilin action in Notch and Wnt signaling |
| 0.0 | 0.7 | PID SYNDECAN 3 PATHWAY | Syndecan-3-mediated signaling events |
| 0.0 | 1.1 | PID LYSOPHOSPHOLIPID PATHWAY | LPA receptor mediated events |
| 0.0 | 0.6 | PID INTEGRIN A9B1 PATHWAY | Alpha9 beta1 integrin signaling events |
| 0.0 | 1.4 | PID HNF3B PATHWAY | FOXA2 and FOXA3 transcription factor networks |
| 0.0 | 0.8 | PID RHOA PATHWAY | RhoA signaling pathway |
| 0.0 | 0.3 | PID FOXM1 PATHWAY | FOXM1 transcription factor network |
| 0.0 | 0.1 | SA PTEN PATHWAY | PTEN is a tumor suppressor that dephosphorylates the lipid messenger phosphatidylinositol triphosphate. |
| 0.0 | 0.6 | PID HDAC CLASSIII PATHWAY | Signaling events mediated by HDAC Class III |
| 0.0 | 0.8 | PID UPA UPAR PATHWAY | Urokinase-type plasminogen activator (uPA) and uPAR-mediated signaling |
| 0.0 | 0.5 | PID HDAC CLASSII PATHWAY | Signaling events mediated by HDAC Class II |
| 0.0 | 0.1 | SA B CELL RECEPTOR COMPLEXES | Antigen binding to B cell receptors activates protein tyrosine kinases, such as the Src family, which ultimate activate MAP kinases. |
| 0.0 | 0.1 | PID IL2 STAT5 PATHWAY | IL2 signaling events mediated by STAT5 |
| 0.0 | 1.3 | PID CASPASE PATHWAY | Caspase cascade in apoptosis |
| 0.0 | 0.2 | ST IL 13 PATHWAY | Interleukin 13 (IL-13) Pathway |
| 0.0 | 0.1 | PID S1P S1P2 PATHWAY | S1P2 pathway |
| 0.0 | 0.3 | PID SMAD2 3PATHWAY | Regulation of cytoplasmic and nuclear SMAD2/3 signaling |
| 0.0 | 0.1 | PID TCPTP PATHWAY | Signaling events mediated by TCPTP |
| 0.0 | 0.9 | PID RB 1PATHWAY | Regulation of retinoblastoma protein |
| 0.0 | 0.1 | PID MAPK TRK PATHWAY | Trk receptor signaling mediated by the MAPK pathway |
| 0.0 | 1.2 | PID SMAD2 3NUCLEAR PATHWAY | Regulation of nuclear SMAD2/3 signaling |
| 0.0 | 0.1 | NABA BASEMENT MEMBRANES | Genes encoding structural components of basement membranes |
| 0.0 | 0.8 | PID IL4 2PATHWAY | IL4-mediated signaling events |
| 0.0 | 0.3 | PID ARF 3PATHWAY | Arf1 pathway |
| 0.0 | 0.4 | PID INTEGRIN A4B1 PATHWAY | Alpha4 beta1 integrin signaling events |
| 0.0 | 0.6 | PID CXCR4 PATHWAY | CXCR4-mediated signaling events |
| 0.0 | 0.6 | PID CDC42 PATHWAY | CDC42 signaling events |
| 0.0 | 0.0 | PID EPHA2 FWD PATHWAY | EPHA2 forward signaling |
| 0.0 | 0.4 | PID TNF PATHWAY | TNF receptor signaling pathway |
| 0.0 | 0.4 | PID FRA PATHWAY | Validated transcriptional targets of AP1 family members Fra1 and Fra2 |
| 0.0 | 0.4 | PID PTP1B PATHWAY | Signaling events mediated by PTP1B |
| 0.0 | 0.1 | PID ER NONGENOMIC PATHWAY | Plasma membrane estrogen receptor signaling |
Gene overrepresentation in C2:CP:REACTOME category:
| Log-likelihood per target | Total log-likelihood | Term | Description |
|---|---|---|---|
| 0.2 | 6.3 | REACTOME REGULATION OF INSULIN LIKE GROWTH FACTOR IGF ACTIVITY BY INSULIN LIKE GROWTH FACTOR BINDING PROTEINS IGFBPS | Genes involved in Regulation of Insulin-like Growth Factor (IGF) Activity by Insulin-like Growth Factor Binding Proteins (IGFBPs) |
| 0.2 | 3.1 | REACTOME NOTCH HLH TRANSCRIPTION PATHWAY | Genes involved in Notch-HLH transcription pathway |
| 0.2 | 5.3 | REACTOME CS DS DEGRADATION | Genes involved in CS/DS degradation |
| 0.2 | 3.4 | REACTOME SIGNAL ATTENUATION | Genes involved in Signal attenuation |
| 0.2 | 3.1 | REACTOME SEMA3A PLEXIN REPULSION SIGNALING BY INHIBITING INTEGRIN ADHESION | Genes involved in SEMA3A-Plexin repulsion signaling by inhibiting Integrin adhesion |
| 0.2 | 4.9 | REACTOME RORA ACTIVATES CIRCADIAN EXPRESSION | Genes involved in RORA Activates Circadian Expression |
| 0.1 | 0.6 | REACTOME SIGNALING BY EGFR IN CANCER | Genes involved in Signaling by EGFR in Cancer |
| 0.1 | 1.7 | REACTOME REGULATION OF INSULIN SECRETION BY ACETYLCHOLINE | Genes involved in Regulation of Insulin Secretion by Acetylcholine |
| 0.1 | 1.3 | REACTOME APOBEC3G MEDIATED RESISTANCE TO HIV1 INFECTION | Genes involved in APOBEC3G mediated resistance to HIV-1 infection |
| 0.1 | 0.1 | REACTOME THROMBOXANE SIGNALLING THROUGH TP RECEPTOR | Genes involved in Thromboxane signalling through TP receptor |
| 0.1 | 2.9 | REACTOME SYNTHESIS OF PE | Genes involved in Synthesis of PE |
| 0.1 | 2.6 | REACTOME YAP1 AND WWTR1 TAZ STIMULATED GENE EXPRESSION | Genes involved in YAP1- and WWTR1 (TAZ)-stimulated gene expression |
| 0.1 | 1.9 | REACTOME SIGNALING BY ACTIVATED POINT MUTANTS OF FGFR1 | Genes involved in Signaling by activated point mutants of FGFR1 |
| 0.1 | 3.2 | REACTOME AMINO ACID SYNTHESIS AND INTERCONVERSION TRANSAMINATION | Genes involved in Amino acid synthesis and interconversion (transamination) |
| 0.1 | 1.5 | REACTOME ROLE OF DCC IN REGULATING APOPTOSIS | Genes involved in Role of DCC in regulating apoptosis |
| 0.1 | 1.3 | REACTOME PLATELET ADHESION TO EXPOSED COLLAGEN | Genes involved in Platelet Adhesion to exposed collagen |
| 0.1 | 1.3 | REACTOME KERATAN SULFATE DEGRADATION | Genes involved in Keratan sulfate degradation |
| 0.1 | 7.5 | REACTOME TRANSCRIPTIONAL REGULATION OF WHITE ADIPOCYTE DIFFERENTIATION | Genes involved in Transcriptional Regulation of White Adipocyte Differentiation |
| 0.1 | 0.9 | REACTOME G PROTEIN BETA GAMMA SIGNALLING | Genes involved in G-protein beta:gamma signalling |
| 0.1 | 0.8 | REACTOME PROSTANOID LIGAND RECEPTORS | Genes involved in Prostanoid ligand receptors |
| 0.1 | 1.7 | REACTOME OTHER SEMAPHORIN INTERACTIONS | Genes involved in Other semaphorin interactions |
| 0.1 | 0.9 | REACTOME SOS MEDIATED SIGNALLING | Genes involved in SOS-mediated signalling |
| 0.1 | 3.7 | REACTOME SYNTHESIS OF PIPS AT THE PLASMA MEMBRANE | Genes involved in Synthesis of PIPs at the plasma membrane |
| 0.1 | 2.6 | REACTOME PROSTACYCLIN SIGNALLING THROUGH PROSTACYCLIN RECEPTOR | Genes involved in Prostacyclin signalling through prostacyclin receptor |
| 0.1 | 1.9 | REACTOME A TETRASACCHARIDE LINKER SEQUENCE IS REQUIRED FOR GAG SYNTHESIS | Genes involved in A tetrasaccharide linker sequence is required for GAG synthesis |
| 0.1 | 1.1 | REACTOME PRE NOTCH TRANSCRIPTION AND TRANSLATION | Genes involved in Pre-NOTCH Transcription and Translation |
| 0.1 | 1.3 | REACTOME ACYL CHAIN REMODELLING OF PI | Genes involved in Acyl chain remodelling of PI |
| 0.1 | 2.2 | REACTOME INFLAMMASOMES | Genes involved in Inflammasomes |
| 0.1 | 1.0 | REACTOME CD28 DEPENDENT VAV1 PATHWAY | Genes involved in CD28 dependent Vav1 pathway |
| 0.1 | 1.1 | REACTOME BILE SALT AND ORGANIC ANION SLC TRANSPORTERS | Genes involved in Bile salt and organic anion SLC transporters |
| 0.1 | 2.5 | REACTOME SULFUR AMINO ACID METABOLISM | Genes involved in Sulfur amino acid metabolism |
| 0.1 | 2.9 | REACTOME POST NMDA RECEPTOR ACTIVATION EVENTS | Genes involved in Post NMDA receptor activation events |
| 0.1 | 1.0 | REACTOME FORMATION OF INCISION COMPLEX IN GG NER | Genes involved in Formation of incision complex in GG-NER |
| 0.1 | 1.6 | REACTOME HORMONE SENSITIVE LIPASE HSL MEDIATED TRIACYLGLYCEROL HYDROLYSIS | Genes involved in Hormone-sensitive lipase (HSL)-mediated triacylglycerol hydrolysis |
| 0.1 | 1.2 | REACTOME ACETYLCHOLINE NEUROTRANSMITTER RELEASE CYCLE | Genes involved in Acetylcholine Neurotransmitter Release Cycle |
| 0.1 | 1.2 | REACTOME INHIBITION OF VOLTAGE GATED CA2 CHANNELS VIA GBETA GAMMA SUBUNITS | Genes involved in Inhibition of voltage gated Ca2+ channels via Gbeta/gamma subunits |
| 0.1 | 0.9 | REACTOME METABOLISM OF POLYAMINES | Genes involved in Metabolism of polyamines |
| 0.1 | 3.3 | REACTOME NCAM1 INTERACTIONS | Genes involved in NCAM1 interactions |
| 0.1 | 2.0 | REACTOME REGULATION OF INSULIN SECRETION BY GLUCAGON LIKE PEPTIDE1 | Genes involved in Regulation of Insulin Secretion by Glucagon-like Peptide-1 |
| 0.1 | 1.0 | REACTOME NRIF SIGNALS CELL DEATH FROM THE NUCLEUS | Genes involved in NRIF signals cell death from the nucleus |
| 0.1 | 1.2 | REACTOME RNA POL III TRANSCRIPTION TERMINATION | Genes involved in RNA Polymerase III Transcription Termination |
| 0.1 | 0.6 | REACTOME MEMBRANE BINDING AND TARGETTING OF GAG PROTEINS | Genes involved in Membrane binding and targetting of GAG proteins |
| 0.1 | 0.3 | REACTOME TRANSMISSION ACROSS CHEMICAL SYNAPSES | Genes involved in Transmission across Chemical Synapses |
| 0.0 | 2.5 | REACTOME GLYCOLYSIS | Genes involved in Glycolysis |
| 0.0 | 0.7 | REACTOME SYNTHESIS OF SUBSTRATES IN N GLYCAN BIOSYTHESIS | Genes involved in Synthesis of substrates in N-glycan biosythesis |
| 0.0 | 0.6 | REACTOME ETHANOL OXIDATION | Genes involved in Ethanol oxidation |
| 0.0 | 1.5 | REACTOME EGFR DOWNREGULATION | Genes involved in EGFR downregulation |
| 0.0 | 0.3 | REACTOME NEPHRIN INTERACTIONS | Genes involved in Nephrin interactions |
| 0.0 | 1.2 | REACTOME INSULIN SYNTHESIS AND PROCESSING | Genes involved in Insulin Synthesis and Processing |
| 0.0 | 0.1 | REACTOME DOPAMINE NEUROTRANSMITTER RELEASE CYCLE | Genes involved in Dopamine Neurotransmitter Release Cycle |
| 0.0 | 0.6 | REACTOME TANDEM PORE DOMAIN POTASSIUM CHANNELS | Genes involved in Tandem pore domain potassium channels |
| 0.0 | 0.9 | REACTOME AMINE DERIVED HORMONES | Genes involved in Amine-derived hormones |
| 0.0 | 0.1 | REACTOME AUTODEGRADATION OF THE E3 UBIQUITIN LIGASE COP1 | Genes involved in Autodegradation of the E3 ubiquitin ligase COP1 |
| 0.0 | 0.1 | REACTOME 3 UTR MEDIATED TRANSLATIONAL REGULATION | Genes involved in 3' -UTR-mediated translational regulation |
| 0.0 | 1.5 | REACTOME RNA POL I TRANSCRIPTION INITIATION | Genes involved in RNA Polymerase I Transcription Initiation |
| 0.0 | 0.5 | REACTOME TRAF6 MEDIATED IRF7 ACTIVATION IN TLR7 8 OR 9 SIGNALING | Genes involved in TRAF6 mediated IRF7 activation in TLR7/8 or 9 signaling |
| 0.0 | 0.9 | REACTOME CELL EXTRACELLULAR MATRIX INTERACTIONS | Genes involved in Cell-extracellular matrix interactions |
| 0.0 | 0.3 | REACTOME INHIBITION OF REPLICATION INITIATION OF DAMAGED DNA BY RB1 E2F1 | Genes involved in Inhibition of replication initiation of damaged DNA by RB1/E2F1 |
| 0.0 | 0.5 | REACTOME PURINE CATABOLISM | Genes involved in Purine catabolism |
| 0.0 | 1.4 | REACTOME NUCLEOTIDE BINDING DOMAIN LEUCINE RICH REPEAT CONTAINING RECEPTOR NLR SIGNALING PATHWAYS | Genes involved in Nucleotide-binding domain, leucine rich repeat containing receptor (NLR) signaling pathways |
| 0.0 | 1.0 | REACTOME CASPASE MEDIATED CLEAVAGE OF CYTOSKELETAL PROTEINS | Genes involved in Caspase-mediated cleavage of cytoskeletal proteins |
| 0.0 | 0.6 | REACTOME IL 6 SIGNALING | Genes involved in Interleukin-6 signaling |
| 0.0 | 1.3 | REACTOME TRAFFICKING OF AMPA RECEPTORS | Genes involved in Trafficking of AMPA receptors |
| 0.0 | 0.2 | REACTOME INITIAL TRIGGERING OF COMPLEMENT | Genes involved in Initial triggering of complement |
| 0.0 | 0.9 | REACTOME GABA A RECEPTOR ACTIVATION | Genes involved in GABA A receptor activation |
| 0.0 | 0.6 | REACTOME SYNTHESIS OF PC | Genes involved in Synthesis of PC |
| 0.0 | 0.6 | REACTOME GAP JUNCTION ASSEMBLY | Genes involved in Gap junction assembly |
| 0.0 | 0.7 | REACTOME DARPP 32 EVENTS | Genes involved in DARPP-32 events |
| 0.0 | 0.5 | REACTOME PROLACTIN RECEPTOR SIGNALING | Genes involved in Prolactin receptor signaling |
| 0.0 | 0.4 | REACTOME GAMMA CARBOXYLATION TRANSPORT AND AMINO TERMINAL CLEAVAGE OF PROTEINS | Genes involved in Gamma-carboxylation, transport, and amino-terminal cleavage of proteins |
| 0.0 | 0.1 | REACTOME NEF MEDIATED DOWNREGULATION OF MHC CLASS I COMPLEX CELL SURFACE EXPRESSION | Genes involved in Nef mediated downregulation of MHC class I complex cell surface expression |
| 0.0 | 1.7 | REACTOME NETRIN1 SIGNALING | Genes involved in Netrin-1 signaling |
| 0.0 | 3.0 | REACTOME DNA REPAIR | Genes involved in DNA Repair |
| 0.0 | 0.5 | REACTOME GLUCONEOGENESIS | Genes involved in Gluconeogenesis |
| 0.0 | 0.3 | REACTOME SYNTHESIS OF PIPS AT THE LATE ENDOSOME MEMBRANE | Genes involved in Synthesis of PIPs at the late endosome membrane |
| 0.0 | 0.7 | REACTOME POST CHAPERONIN TUBULIN FOLDING PATHWAY | Genes involved in Post-chaperonin tubulin folding pathway |
| 0.0 | 1.4 | REACTOME SMOOTH MUSCLE CONTRACTION | Genes involved in Smooth Muscle Contraction |
| 0.0 | 0.2 | REACTOME NGF SIGNALLING VIA TRKA FROM THE PLASMA MEMBRANE | Genes involved in NGF signalling via TRKA from the plasma membrane |
| 0.0 | 0.2 | REACTOME REGULATION OF ORNITHINE DECARBOXYLASE ODC | Genes involved in Regulation of ornithine decarboxylase (ODC) |
| 0.0 | 0.3 | REACTOME SEMA3A PAK DEPENDENT AXON REPULSION | Genes involved in Sema3A PAK dependent Axon repulsion |
| 0.0 | 0.8 | REACTOME ADHERENS JUNCTIONS INTERACTIONS | Genes involved in Adherens junctions interactions |
| 0.0 | 0.1 | REACTOME KERATAN SULFATE BIOSYNTHESIS | Genes involved in Keratan sulfate biosynthesis |
| 0.0 | 0.6 | REACTOME CYTOSOLIC SULFONATION OF SMALL MOLECULES | Genes involved in Cytosolic sulfonation of small molecules |
| 0.0 | 0.5 | REACTOME FORMATION OF ATP BY CHEMIOSMOTIC COUPLING | Genes involved in Formation of ATP by chemiosmotic coupling |
| 0.0 | 0.3 | REACTOME THROMBIN SIGNALLING THROUGH PROTEINASE ACTIVATED RECEPTORS PARS | Genes involved in Thrombin signalling through proteinase activated receptors (PARs) |
| 0.0 | 0.4 | REACTOME REGULATION OF RHEB GTPASE ACTIVITY BY AMPK | Genes involved in Regulation of Rheb GTPase activity by AMPK |
| 0.0 | 1.5 | REACTOME NUCLEAR RECEPTOR TRANSCRIPTION PATHWAY | Genes involved in Nuclear Receptor transcription pathway |
| 0.0 | 0.3 | REACTOME SYNTHESIS OF PIPS AT THE GOLGI MEMBRANE | Genes involved in Synthesis of PIPs at the Golgi membrane |
| 0.0 | 0.1 | REACTOME G ALPHA Z SIGNALLING EVENTS | Genes involved in G alpha (z) signalling events |
| 0.0 | 0.2 | REACTOME ANDROGEN BIOSYNTHESIS | Genes involved in Androgen biosynthesis |
| 0.0 | 0.2 | REACTOME AQUAPORIN MEDIATED TRANSPORT | Genes involved in Aquaporin-mediated transport |
| 0.0 | 0.3 | REACTOME APOPTOSIS INDUCED DNA FRAGMENTATION | Genes involved in Apoptosis induced DNA fragmentation |
| 0.0 | 0.2 | REACTOME VITAMIN B5 PANTOTHENATE METABOLISM | Genes involved in Vitamin B5 (pantothenate) metabolism |
| 0.0 | 0.5 | REACTOME BRANCHED CHAIN AMINO ACID CATABOLISM | Genes involved in Branched-chain amino acid catabolism |
| 0.0 | 0.2 | REACTOME OPSINS | Genes involved in Opsins |
| 0.0 | 0.7 | REACTOME DOWNREGULATION OF SMAD2 3 SMAD4 TRANSCRIPTIONAL ACTIVITY | Genes involved in Downregulation of SMAD2/3:SMAD4 transcriptional activity |
| 0.0 | 0.0 | REACTOME NEP NS2 INTERACTS WITH THE CELLULAR EXPORT MACHINERY | Genes involved in NEP/NS2 Interacts with the Cellular Export Machinery |
| 0.0 | 0.3 | REACTOME SIGNALING BY NODAL | Genes involved in Signaling by NODAL |
| 0.0 | 0.3 | REACTOME GLYCOGEN BREAKDOWN GLYCOGENOLYSIS | Genes involved in Glycogen breakdown (glycogenolysis) |
| 0.0 | 0.4 | REACTOME DEGRADATION OF THE EXTRACELLULAR MATRIX | Genes involved in Degradation of the extracellular matrix |
| 0.0 | 0.1 | REACTOME G0 AND EARLY G1 | Genes involved in G0 and Early G1 |
| 0.0 | 2.8 | REACTOME SIGNALING BY RHO GTPASES | Genes involved in Signaling by Rho GTPases |
| 0.0 | 0.6 | REACTOME TRANSPORT OF RIBONUCLEOPROTEINS INTO THE HOST NUCLEUS | Genes involved in Transport of Ribonucleoproteins into the Host Nucleus |
| 0.0 | 0.3 | REACTOME CITRIC ACID CYCLE TCA CYCLE | Genes involved in Citric acid cycle (TCA cycle) |
| 0.0 | 0.2 | REACTOME CYCLIN A B1 ASSOCIATED EVENTS DURING G2 M TRANSITION | Genes involved in Cyclin A/B1 associated events during G2/M transition |
| 0.0 | 0.4 | REACTOME TERMINATION OF O GLYCAN BIOSYNTHESIS | Genes involved in Termination of O-glycan biosynthesis |
| 0.0 | 1.2 | REACTOME MITOTIC PROMETAPHASE | Genes involved in Mitotic Prometaphase |
| 0.0 | 1.2 | REACTOME CYCLIN E ASSOCIATED EVENTS DURING G1 S TRANSITION | Genes involved in Cyclin E associated events during G1/S transition |
| 0.0 | 1.7 | REACTOME MRNA SPLICING | Genes involved in mRNA Splicing |
| 0.0 | 0.0 | REACTOME RETROGRADE NEUROTROPHIN SIGNALLING | Genes involved in Retrograde neurotrophin signalling |
| 0.0 | 0.4 | REACTOME SYNTHESIS AND INTERCONVERSION OF NUCLEOTIDE DI AND TRIPHOSPHATES | Genes involved in Synthesis and interconversion of nucleotide di- and triphosphates |
| 0.0 | 0.2 | REACTOME FACILITATIVE NA INDEPENDENT GLUCOSE TRANSPORTERS | Genes involved in Facilitative Na+-independent glucose transporters |
| 0.0 | 1.0 | REACTOME MEIOTIC SYNAPSIS | Genes involved in Meiotic Synapsis |
| 0.0 | 0.3 | REACTOME INTRINSIC PATHWAY FOR APOPTOSIS | Genes involved in Intrinsic Pathway for Apoptosis |
| 0.0 | 1.0 | REACTOME RESPIRATORY ELECTRON TRANSPORT ATP SYNTHESIS BY CHEMIOSMOTIC COUPLING AND HEAT PRODUCTION BY UNCOUPLING PROTEINS | Genes involved in Respiratory electron transport, ATP synthesis by chemiosmotic coupling, and heat production by uncoupling proteins. |