Project
Epithelial-Mesenchymal Transition, human (Scheel, 2011)
Navigation
Downloads
Results for SRF
Z-value: 1.31
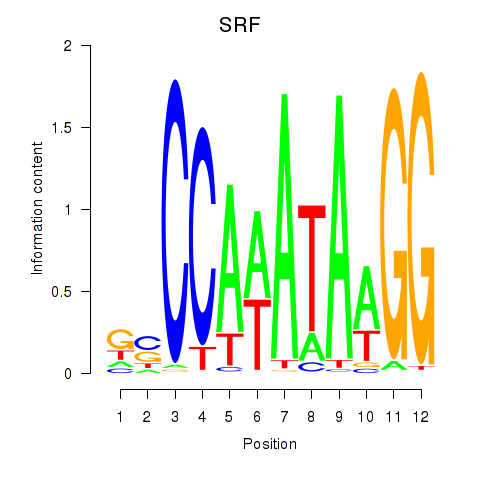
Motif logo
Transcription factors associated with SRF
| Gene Symbol | Gene ID | Gene Info |
|---|---|---|
|
SRF
|
ENSG00000112658.6 | SRF |
Activity-expression correlation:
| Gene | Promoter | Pearson corr. coef. | P-value | Plot |
|---|---|---|---|---|
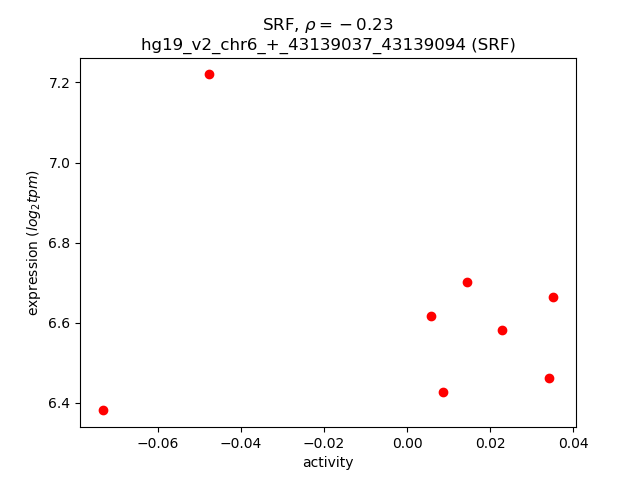
| SRF | hg19_v2_chr6_+_43139037_43139094 | -0.23 | 5.9e-01 | Click! |
Activity profile of SRF motif
Sorted Z-values of SRF motif
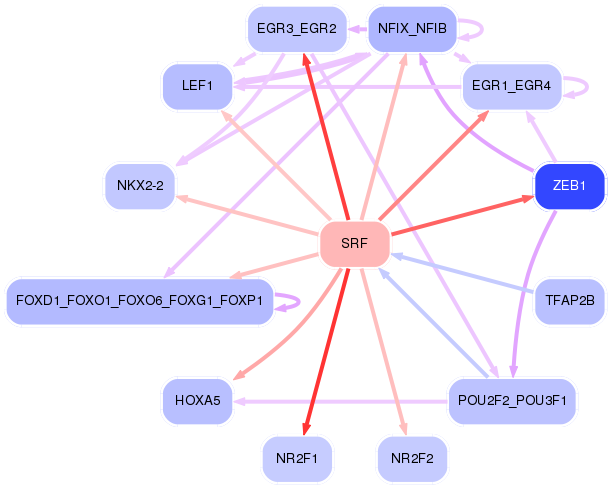
Network of associatons between targets according to the STRING database.

First level regulatory network of SRF
| Promoter | Score | Transcript | Gene | Gene Info |
|---|---|---|---|---|
| chr20_+_35169885 | 4.51 |
ENST00000279022.2 ENST00000346786.2 |
MYL9 |
myosin, light chain 9, regulatory |
| chr8_+_97597148 | 3.22 |
ENST00000521590.1 |
SDC2 |
syndecan 2 |
| chr5_+_92919043 | 2.89 |
ENST00000327111.3 |
NR2F1 |
nuclear receptor subfamily 2, group F, member 1 |
| chr10_-_64576105 | 2.67 |
ENST00000242480.3 ENST00000411732.1 |
EGR2 |
early growth response 2 |
| chr10_+_31610064 | 1.99 |
ENST00000446923.2 ENST00000559476.1 |
ZEB1 |
zinc finger E-box binding homeobox 1 |
| chr19_+_2476116 | 1.64 |
ENST00000215631.4 ENST00000587345.1 |
GADD45B |
growth arrest and DNA-damage-inducible, beta |
| chr5_+_40679584 | 1.48 |
ENST00000302472.3 |
PTGER4 |
prostaglandin E receptor 4 (subtype EP4) |
| chr9_-_79520989 | 1.46 |
ENST00000376713.3 ENST00000376718.3 ENST00000428286.1 |
PRUNE2 |
prune homolog 2 (Drosophila) |
| chr5_-_111093167 | 1.44 |
ENST00000446294.2 ENST00000419114.2 |
NREP |
neuronal regeneration related protein |
| chr9_+_36136700 | 1.40 |
ENST00000396613.3 ENST00000377959.1 ENST00000377960.4 |
GLIPR2 |
GLI pathogenesis-related 2 |
| chr16_-_3350614 | 1.35 |
ENST00000268674.2 |
TIGD7 |
tigger transposable element derived 7 |
| chr5_+_137801160 | 1.33 |
ENST00000239938.4 |
EGR1 |
early growth response 1 |
| chr9_+_92219919 | 1.17 |
ENST00000252506.6 ENST00000375769.1 |
GADD45G |
growth arrest and DNA-damage-inducible, gamma |
| chr14_+_74034310 | 1.16 |
ENST00000538782.1 |
ACOT2 |
acyl-CoA thioesterase 2 |
| chr1_-_86043921 | 1.11 |
ENST00000535924.2 |
DDAH1 |
dimethylarginine dimethylaminohydrolase 1 |
| chr5_-_124080203 | 0.93 |
ENST00000504926.1 |
ZNF608 |
zinc finger protein 608 |
| chr11_+_117070037 | 0.90 |
ENST00000392951.4 ENST00000525531.1 ENST00000278968.6 |
TAGLN |
transgelin |
| chr2_-_106054952 | 0.85 |
ENST00000336660.5 ENST00000393352.3 ENST00000607522.1 |
FHL2 |
four and a half LIM domains 2 |
| chrX_+_22056165 | 0.83 |
ENST00000535894.1 |
PHEX |
phosphate regulating endopeptidase homolog, X-linked |
| chr5_+_137774706 | 0.79 |
ENST00000378339.2 ENST00000254901.5 ENST00000506158.1 |
REEP2 |
receptor accessory protein 2 |
| chr3_+_49027308 | 0.76 |
ENST00000383729.4 ENST00000343546.4 |
P4HTM |
prolyl 4-hydroxylase, transmembrane (endoplasmic reticulum) |
| chr11_-_65626753 | 0.74 |
ENST00000526975.1 ENST00000531413.1 |
CFL1 |
cofilin 1 (non-muscle) |
| chr2_-_106015491 | 0.72 |
ENST00000408995.1 ENST00000393353.3 ENST00000322142.8 |
FHL2 |
four and a half LIM domains 2 |
| chr12_+_59989791 | 0.71 |
ENST00000552432.1 |
SLC16A7 |
solute carrier family 16 (monocarboxylate transporter), member 7 |
| chr9_+_124088860 | 0.71 |
ENST00000373806.1 |
GSN |
gelsolin |
| chr4_+_87928413 | 0.71 |
ENST00000544085.1 |
AFF1 |
AF4/FMR2 family, member 1 |
| chr12_+_59989918 | 0.70 |
ENST00000547379.1 ENST00000549465.1 |
SLC16A7 |
solute carrier family 16 (monocarboxylate transporter), member 7 |
| chr6_+_151561085 | 0.70 |
ENST00000402676.2 |
AKAP12 |
A kinase (PRKA) anchor protein 12 |
| chr2_-_106015527 | 0.69 |
ENST00000344213.4 ENST00000358129.4 |
FHL2 |
four and a half LIM domains 2 |
| chr7_-_27183263 | 0.68 |
ENST00000222726.3 |
HOXA5 |
homeobox A5 |
| chr5_-_176923803 | 0.64 |
ENST00000506161.1 |
PDLIM7 |
PDZ and LIM domain 7 (enigma) |
| chr10_-_90712520 | 0.64 |
ENST00000224784.6 |
ACTA2 |
actin, alpha 2, smooth muscle, aorta |
| chr3_-_46904946 | 0.62 |
ENST00000292327.4 |
MYL3 |
myosin, light chain 3, alkali; ventricular, skeletal, slow |
| chr5_-_176923846 | 0.62 |
ENST00000506537.1 |
PDLIM7 |
PDZ and LIM domain 7 (enigma) |
| chr3_-_46904918 | 0.62 |
ENST00000395869.1 |
MYL3 |
myosin, light chain 3, alkali; ventricular, skeletal, slow |
| chr3_+_187930719 | 0.57 |
ENST00000312675.4 |
LPP |
LIM domain containing preferred translocation partner in lipoma |
| chr15_+_83776324 | 0.56 |
ENST00000379390.6 ENST00000379386.4 ENST00000565774.1 ENST00000565982.1 |
TM6SF1 |
transmembrane 6 superfamily member 1 |
| chr2_-_128432639 | 0.56 |
ENST00000545738.2 ENST00000355119.4 ENST00000409808.2 |
LIMS2 |
LIM and senescent cell antigen-like domains 2 |
| chr6_-_111804905 | 0.50 |
ENST00000358835.3 ENST00000435970.1 |
REV3L |
REV3-like, polymerase (DNA directed), zeta, catalytic subunit |
| chr22_-_36357671 | 0.49 |
ENST00000408983.2 |
RBFOX2 |
RNA binding protein, fox-1 homolog (C. elegans) 2 |
| chr2_+_74120094 | 0.48 |
ENST00000409731.3 ENST00000345517.3 ENST00000409918.1 ENST00000442912.1 ENST00000409624.1 |
ACTG2 |
actin, gamma 2, smooth muscle, enteric |
| chr3_-_99594948 | 0.48 |
ENST00000471562.1 ENST00000495625.2 |
FILIP1L |
filamin A interacting protein 1-like |
| chr2_+_56179262 | 0.48 |
ENST00000606639.1 |
RP11-481J13.1 |
RP11-481J13.1 |
| chr1_-_89531041 | 0.47 |
ENST00000370473.4 |
GBP1 |
guanylate binding protein 1, interferon-inducible |
| chr6_+_151561506 | 0.45 |
ENST00000253332.1 |
AKAP12 |
A kinase (PRKA) anchor protein 12 |
| chr15_-_35088340 | 0.45 |
ENST00000290378.4 |
ACTC1 |
actin, alpha, cardiac muscle 1 |
| chr11_-_65626797 | 0.43 |
ENST00000525451.2 |
CFL1 |
cofilin 1 (non-muscle) |
| chr11_-_57282349 | 0.42 |
ENST00000528450.1 |
SLC43A1 |
solute carrier family 43 (amino acid system L transporter), member 1 |
| chr2_-_172087824 | 0.42 |
ENST00000521943.1 |
TLK1 |
tousled-like kinase 1 |
| chr12_+_75874460 | 0.39 |
ENST00000266659.3 |
GLIPR1 |
GLI pathogenesis-related 1 |
| chr15_+_74218787 | 0.37 |
ENST00000261921.7 |
LOXL1 |
lysyl oxidase-like 1 |
| chr3_-_99595037 | 0.36 |
ENST00000383694.2 |
FILIP1L |
filamin A interacting protein 1-like |
| chr17_-_72358001 | 0.36 |
ENST00000375366.3 |
BTBD17 |
BTB (POZ) domain containing 17 |
| chr19_+_16178317 | 0.34 |
ENST00000344824.6 ENST00000538887.1 |
TPM4 |
tropomyosin 4 |
| chr7_+_143078652 | 0.34 |
ENST00000354434.4 ENST00000449423.2 |
ZYX |
zyxin |
| chr15_-_55581954 | 0.32 |
ENST00000336787.1 |
RAB27A |
RAB27A, member RAS oncogene family |
| chr12_-_6772303 | 0.31 |
ENST00000396807.4 ENST00000446105.2 ENST00000341550.4 |
ING4 |
inhibitor of growth family, member 4 |
| chr12_+_75874580 | 0.31 |
ENST00000456650.3 |
GLIPR1 |
GLI pathogenesis-related 1 |
| chr1_+_223889285 | 0.31 |
ENST00000433674.2 |
CAPN2 |
calpain 2, (m/II) large subunit |
| chr5_-_58295712 | 0.31 |
ENST00000317118.8 |
PDE4D |
phosphodiesterase 4D, cAMP-specific |
| chr1_-_208084729 | 0.30 |
ENST00000310833.7 ENST00000356522.4 |
CD34 |
CD34 molecule |
| chr1_-_89591749 | 0.30 |
ENST00000370466.3 |
GBP2 |
guanylate binding protein 2, interferon-inducible |
| chr19_+_13135386 | 0.29 |
ENST00000360105.4 ENST00000588228.1 ENST00000591028.1 |
NFIX |
nuclear factor I/X (CCAAT-binding transcription factor) |
| chr3_-_121379739 | 0.29 |
ENST00000428394.2 ENST00000314583.3 |
HCLS1 |
hematopoietic cell-specific Lyn substrate 1 |
| chr1_-_91487770 | 0.28 |
ENST00000337393.5 |
ZNF644 |
zinc finger protein 644 |
| chr15_+_96873921 | 0.27 |
ENST00000394166.3 |
NR2F2 |
nuclear receptor subfamily 2, group F, member 2 |
| chr17_-_4890649 | 0.26 |
ENST00000361571.5 |
CAMTA2 |
calmodulin binding transcription activator 2 |
| chr19_-_36247910 | 0.25 |
ENST00000587965.1 ENST00000004982.3 |
HSPB6 |
heat shock protein, alpha-crystallin-related, B6 |
| chr17_-_79481666 | 0.25 |
ENST00000575659.1 |
ACTG1 |
actin, gamma 1 |
| chr10_-_17659234 | 0.24 |
ENST00000466335.1 |
PTPLA |
protein tyrosine phosphatase-like (proline instead of catalytic arginine), member A |
| chr6_-_159466042 | 0.24 |
ENST00000338313.5 |
TAGAP |
T-cell activation RhoGTPase activating protein |
| chr11_-_2162468 | 0.23 |
ENST00000434045.2 |
IGF2 |
insulin-like growth factor 2 (somatomedin A) |
| chr2_+_219283815 | 0.23 |
ENST00000248444.5 ENST00000454069.1 ENST00000392114.2 |
VIL1 |
villin 1 |
| chr18_-_3219847 | 0.23 |
ENST00000261606.7 |
MYOM1 |
myomesin 1 |
| chr3_-_71294304 | 0.23 |
ENST00000498215.1 |
FOXP1 |
forkhead box P1 |
| chr11_-_2162162 | 0.22 |
ENST00000381389.1 |
IGF2 |
insulin-like growth factor 2 (somatomedin A) |
| chr1_+_28099683 | 0.21 |
ENST00000373943.4 |
STX12 |
syntaxin 12 |
| chr11_+_59807748 | 0.21 |
ENST00000278855.2 ENST00000532905.1 |
PLAC1L |
oocyte secreted protein 2 |
| chr1_+_223889310 | 0.20 |
ENST00000434648.1 |
CAPN2 |
calpain 2, (m/II) large subunit |
| chr1_+_50574585 | 0.20 |
ENST00000371824.1 ENST00000371823.4 |
ELAVL4 |
ELAV like neuron-specific RNA binding protein 4 |
| chr3_-_157221380 | 0.20 |
ENST00000468233.1 |
VEPH1 |
ventricular zone expressed PH domain-containing 1 |
| chr10_+_88428206 | 0.19 |
ENST00000429277.2 ENST00000458213.2 ENST00000352360.5 |
LDB3 |
LIM domain binding 3 |
| chr3_+_9834758 | 0.19 |
ENST00000485273.1 ENST00000433034.1 ENST00000397256.1 |
ARPC4 ARPC4-TTLL3 |
actin related protein 2/3 complex, subunit 4, 20kDa ARPC4-TTLL3 readthrough |
| chr19_+_35861831 | 0.19 |
ENST00000454971.1 |
GPR42 |
G protein-coupled receptor 42 (gene/pseudogene) |
| chr3_-_157221357 | 0.19 |
ENST00000494677.1 |
VEPH1 |
ventricular zone expressed PH domain-containing 1 |
| chr10_-_16859361 | 0.18 |
ENST00000377921.3 |
RSU1 |
Ras suppressor protein 1 |
| chr20_-_21494654 | 0.18 |
ENST00000377142.4 |
NKX2-2 |
NK2 homeobox 2 |
| chr4_+_87928140 | 0.18 |
ENST00000307808.6 |
AFF1 |
AF4/FMR2 family, member 1 |
| chr9_-_35691017 | 0.18 |
ENST00000378292.3 |
TPM2 |
tropomyosin 2 (beta) |
| chr9_-_98269481 | 0.17 |
ENST00000418258.1 ENST00000553011.1 ENST00000551845.1 |
PTCH1 |
patched 1 |
| chr10_-_16859442 | 0.17 |
ENST00000602389.1 ENST00000345264.5 |
RSU1 |
Ras suppressor protein 1 |
| chr1_+_219347186 | 0.17 |
ENST00000366928.5 |
LYPLAL1 |
lysophospholipase-like 1 |
| chr9_-_98269699 | 0.17 |
ENST00000429896.2 |
PTCH1 |
patched 1 |
| chr10_+_88428370 | 0.17 |
ENST00000372066.3 ENST00000263066.6 ENST00000372056.4 ENST00000310944.6 ENST00000361373.4 ENST00000542786.1 |
LDB3 |
LIM domain binding 3 |
| chrX_-_153602991 | 0.17 |
ENST00000369850.3 ENST00000422373.1 |
FLNA |
filamin A, alpha |
| chr19_-_35166604 | 0.17 |
ENST00000601241.1 |
SCGB2B2 |
secretoglobin, family 2B, member 2 |
| chr2_+_87769459 | 0.16 |
ENST00000414030.1 ENST00000437561.1 |
LINC00152 |
long intergenic non-protein coding RNA 152 |
| chr3_-_9834375 | 0.16 |
ENST00000343450.2 ENST00000301964.2 |
TADA3 |
transcriptional adaptor 3 |
| chr1_-_229569834 | 0.16 |
ENST00000366684.3 ENST00000366683.2 |
ACTA1 |
actin, alpha 1, skeletal muscle |
| chr10_-_17659357 | 0.16 |
ENST00000326961.6 ENST00000361271.3 |
PTPLA |
protein tyrosine phosphatase-like (proline instead of catalytic arginine), member A |
| chr1_-_152332480 | 0.16 |
ENST00000388718.5 |
FLG2 |
filaggrin family member 2 |
| chr1_+_6105974 | 0.16 |
ENST00000378083.3 |
KCNAB2 |
potassium voltage-gated channel, shaker-related subfamily, beta member 2 |
| chr16_+_30077055 | 0.16 |
ENST00000564595.2 ENST00000569798.1 |
ALDOA |
aldolase A, fructose-bisphosphate |
| chr1_+_219347203 | 0.15 |
ENST00000366927.3 |
LYPLAL1 |
lysophospholipase-like 1 |
| chr17_-_41132010 | 0.15 |
ENST00000409103.1 ENST00000360221.4 |
PTGES3L-AARSD1 |
PTGES3L-AARSD1 readthrough |
| chr16_+_30077098 | 0.15 |
ENST00000395240.3 ENST00000566846.1 |
ALDOA |
aldolase A, fructose-bisphosphate |
| chr3_+_9834179 | 0.14 |
ENST00000498623.2 |
ARPC4 |
actin related protein 2/3 complex, subunit 4, 20kDa |
| chr19_+_57901208 | 0.13 |
ENST00000366197.5 ENST00000596282.1 ENST00000597400.1 ENST00000598895.1 ENST00000336128.7 ENST00000596617.1 |
ZNF548 AC003002.6 |
zinc finger protein 548 Uncharacterized protein |
| chr16_+_30383613 | 0.13 |
ENST00000568749.1 |
MYLPF |
myosin light chain, phosphorylatable, fast skeletal muscle |
| chr17_+_3379284 | 0.13 |
ENST00000263080.2 |
ASPA |
aspartoacylase |
| chr2_-_73520667 | 0.12 |
ENST00000545030.1 ENST00000436467.2 |
EGR4 |
early growth response 4 |
| chr4_-_10118469 | 0.12 |
ENST00000499869.2 |
WDR1 |
WD repeat domain 1 |
| chr10_-_29923893 | 0.12 |
ENST00000355867.4 |
SVIL |
supervillin |
| chr3_+_63953415 | 0.12 |
ENST00000484332.1 |
ATXN7 |
ataxin 7 |
| chr10_+_96162242 | 0.12 |
ENST00000225235.4 |
TBC1D12 |
TBC1 domain family, member 12 |
| chr2_-_112237835 | 0.11 |
ENST00000442293.1 ENST00000439494.1 |
MIR4435-1HG |
MIR4435-1 host gene (non-protein coding) |
| chr8_-_101321584 | 0.11 |
ENST00000523167.1 |
RNF19A |
ring finger protein 19A, RBR E3 ubiquitin protein ligase |
| chr17_+_33474826 | 0.10 |
ENST00000268876.5 ENST00000433649.1 ENST00000378449.1 |
UNC45B |
unc-45 homolog B (C. elegans) |
| chr17_-_4871085 | 0.10 |
ENST00000575142.1 ENST00000206020.3 |
SPAG7 |
sperm associated antigen 7 |
| chr17_+_33474860 | 0.10 |
ENST00000394570.2 |
UNC45B |
unc-45 homolog B (C. elegans) |
| chr4_-_109087872 | 0.10 |
ENST00000510624.1 |
LEF1 |
lymphoid enhancer-binding factor 1 |
| chr6_+_158402860 | 0.10 |
ENST00000367122.2 ENST00000367121.3 ENST00000355585.4 ENST00000367113.4 |
SYNJ2 |
synaptojanin 2 |
| chr11_-_71823796 | 0.10 |
ENST00000545680.1 ENST00000543587.1 ENST00000538393.1 ENST00000535234.1 ENST00000227618.4 ENST00000535503.1 |
ANAPC15 |
anaphase promoting complex subunit 15 |
| chr4_-_10118573 | 0.10 |
ENST00000382452.2 ENST00000382451.2 |
WDR1 |
WD repeat domain 1 |
| chr3_-_185641681 | 0.09 |
ENST00000259043.7 |
TRA2B |
transformer 2 beta homolog (Drosophila) |
| chr2_+_139259324 | 0.09 |
ENST00000280098.4 |
SPOPL |
speckle-type POZ protein-like |
| chr2_-_209118974 | 0.08 |
ENST00000415913.1 ENST00000415282.1 ENST00000446179.1 |
IDH1 |
isocitrate dehydrogenase 1 (NADP+), soluble |
| chr2_-_31030277 | 0.07 |
ENST00000534090.2 ENST00000295055.8 |
CAPN13 |
calpain 13 |
| chr2_-_161264385 | 0.06 |
ENST00000409972.1 |
RBMS1 |
RNA binding motif, single stranded interacting protein 1 |
| chr17_-_4890919 | 0.06 |
ENST00000572543.1 ENST00000381311.5 ENST00000348066.3 ENST00000358183.4 |
CAMTA2 |
calmodulin binding transcription activator 2 |
| chr7_+_88388628 | 0.06 |
ENST00000333190.4 |
ZNF804B |
zinc finger protein 804B |
| chr14_-_94443105 | 0.05 |
ENST00000555019.1 |
ASB2 |
ankyrin repeat and SOCS box containing 2 |
| chr19_+_45971246 | 0.05 |
ENST00000585836.1 ENST00000417353.2 ENST00000353609.3 ENST00000591858.1 ENST00000443841.2 ENST00000590335.1 |
FOSB |
FBJ murine osteosarcoma viral oncogene homolog B |
| chr11_-_71823715 | 0.05 |
ENST00000545944.1 ENST00000502597.2 |
ANAPC15 |
anaphase promoting complex subunit 15 |
| chr17_-_55911970 | 0.05 |
ENST00000581805.1 ENST00000580960.1 |
RP11-60A24.3 |
RP11-60A24.3 |
| chr3_+_9834227 | 0.05 |
ENST00000287613.7 ENST00000397261.3 |
ARPC4 |
actin related protein 2/3 complex, subunit 4, 20kDa |
| chr11_-_47374246 | 0.04 |
ENST00000545968.1 ENST00000399249.2 ENST00000256993.4 |
MYBPC3 |
myosin binding protein C, cardiac |
| chr12_-_125398850 | 0.03 |
ENST00000535859.1 ENST00000546271.1 ENST00000540700.1 ENST00000546120.1 |
UBC |
ubiquitin C |
| chrX_-_103499602 | 0.03 |
ENST00000372588.4 |
ESX1 |
ESX homeobox 1 |
| chr1_+_11994715 | 0.03 |
ENST00000449038.1 ENST00000376369.3 ENST00000429000.2 ENST00000196061.4 |
PLOD1 |
procollagen-lysine, 2-oxoglutarate 5-dioxygenase 1 |
| chr11_-_71823266 | 0.03 |
ENST00000538919.1 ENST00000539395.1 ENST00000542531.1 |
ANAPC15 |
anaphase promoting complex subunit 15 |
| chr18_+_54318566 | 0.03 |
ENST00000589935.1 ENST00000357574.3 |
WDR7 |
WD repeat domain 7 |
| chr1_-_23340400 | 0.02 |
ENST00000440767.2 |
C1orf234 |
chromosome 1 open reading frame 234 |
| chr4_+_186064395 | 0.02 |
ENST00000281456.6 |
SLC25A4 |
solute carrier family 25 (mitochondrial carrier; adenine nucleotide translocator), member 4 |
| chr7_+_114055052 | 0.02 |
ENST00000462331.1 ENST00000408937.3 ENST00000403559.4 ENST00000350908.4 ENST00000393498.2 ENST00000393495.3 ENST00000378237.3 ENST00000393489.3 |
FOXP2 |
forkhead box P2 |
| chr18_-_3220106 | 0.02 |
ENST00000356443.4 ENST00000400569.3 |
MYOM1 |
myomesin 1 |
| chr7_-_94285402 | 0.02 |
ENST00000428696.2 ENST00000445866.2 |
SGCE |
sarcoglycan, epsilon |
| chr7_+_107531580 | 0.01 |
ENST00000537148.1 ENST00000440410.1 ENST00000437604.2 |
DLD |
dihydrolipoamide dehydrogenase |
| chr4_-_54930790 | 0.01 |
ENST00000263921.3 |
CHIC2 |
cysteine-rich hydrophobic domain 2 |
| chr11_+_34073195 | 0.01 |
ENST00000341394.4 |
CAPRIN1 |
cell cycle associated protein 1 |
| chr5_-_169816638 | 0.00 |
ENST00000521859.1 ENST00000274629.4 |
KCNMB1 |
potassium large conductance calcium-activated channel, subfamily M, beta member 1 |
| chr11_+_17281900 | 0.00 |
ENST00000530527.1 |
NUCB2 |
nucleobindin 2 |
| chr7_-_5570229 | 0.00 |
ENST00000331789.5 |
ACTB |
actin, beta |
| chr2_+_191792376 | 0.00 |
ENST00000409428.1 ENST00000409215.1 |
GLS |
glutaminase |
Gene Ontology Analysis
Gene overrepresentation in biological_process category:
| Log-likelihood per target | Total log-likelihood | Term | Description |
|---|---|---|---|
| 0.9 | 2.7 | GO:0035284 | rhombomere 3 development(GO:0021569) rhombomere 5 development(GO:0021571) central nervous system segmentation(GO:0035283) brain segmentation(GO:0035284) |
| 0.5 | 3.2 | GO:0008218 | bioluminescence(GO:0008218) |
| 0.5 | 1.5 | GO:2000417 | negative regulation of eosinophil migration(GO:2000417) |
| 0.5 | 2.3 | GO:0055011 | atrial cardiac muscle cell differentiation(GO:0055011) atrial cardiac muscle cell development(GO:0055014) |
| 0.4 | 1.3 | GO:0050720 | regulation of interleukin-1 biosynthetic process(GO:0045360) positive regulation of interleukin-1 biosynthetic process(GO:0045362) interleukin-1 beta biosynthetic process(GO:0050720) response to interleukin-8(GO:0098758) cellular response to interleukin-8(GO:0098759) |
| 0.3 | 1.7 | GO:0090131 | mesenchyme migration(GO:0090131) |
| 0.2 | 0.7 | GO:0060435 | bronchiole development(GO:0060435) |
| 0.2 | 2.0 | GO:0045602 | negative regulation of endothelial cell differentiation(GO:0045602) |
| 0.2 | 1.4 | GO:0006848 | pyruvate transport(GO:0006848) pyruvate transmembrane transport(GO:1901475) |
| 0.2 | 1.2 | GO:2000771 | regulation of unidimensional cell growth(GO:0051510) negative regulation of unidimensional cell growth(GO:0051511) establishment of cell polarity regulating cell shape(GO:0071964) regulation of establishment or maintenance of cell polarity regulating cell shape(GO:2000769) positive regulation of establishment or maintenance of cell polarity regulating cell shape(GO:2000771) regulation of establishment of cell polarity regulating cell shape(GO:2000782) positive regulation of establishment of cell polarity regulating cell shape(GO:2000784) positive regulation of barbed-end actin filament capping(GO:2000814) |
| 0.2 | 0.8 | GO:1904383 | response to sodium phosphate(GO:1904383) |
| 0.2 | 0.8 | GO:0050916 | sensory perception of sweet taste(GO:0050916) |
| 0.2 | 0.8 | GO:1900041 | negative regulation of interleukin-2 secretion(GO:1900041) |
| 0.1 | 0.7 | GO:0044858 | plasma membrane raft distribution(GO:0044855) plasma membrane raft localization(GO:0044856) plasma membrane raft polarization(GO:0044858) regulation of plasma membrane raft polarization(GO:1903906) |
| 0.1 | 2.8 | GO:1900745 | positive regulation of p38MAPK cascade(GO:1900745) |
| 0.1 | 0.3 | GO:0010157 | response to chlorate(GO:0010157) |
| 0.1 | 1.1 | GO:1900038 | negative regulation of cellular response to hypoxia(GO:1900038) |
| 0.1 | 0.3 | GO:0043983 | histone H4-K12 acetylation(GO:0043983) |
| 0.1 | 0.2 | GO:1902896 | terminal web assembly(GO:1902896) |
| 0.1 | 1.1 | GO:0010739 | positive regulation of protein kinase A signaling(GO:0010739) |
| 0.1 | 0.5 | GO:0010724 | regulation of definitive erythrocyte differentiation(GO:0010724) |
| 0.1 | 0.3 | GO:0009956 | radial pattern formation(GO:0009956) |
| 0.1 | 0.4 | GO:0045214 | sarcomere organization(GO:0045214) |
| 0.1 | 0.2 | GO:0021530 | spinal cord oligodendrocyte cell differentiation(GO:0021529) spinal cord oligodendrocyte cell fate specification(GO:0021530) |
| 0.1 | 0.5 | GO:2000467 | positive regulation of glycogen (starch) synthase activity(GO:2000467) |
| 0.1 | 4.5 | GO:0045652 | regulation of megakaryocyte differentiation(GO:0045652) |
| 0.1 | 0.2 | GO:0016334 | morphogenesis of follicular epithelium(GO:0016333) establishment or maintenance of polarity of follicular epithelium(GO:0016334) establishment of planar polarity of follicular epithelium(GO:0042247) |
| 0.1 | 0.3 | GO:1903435 | positive regulation of constitutive secretory pathway(GO:1903435) |
| 0.1 | 0.6 | GO:2000346 | negative regulation of hepatocyte proliferation(GO:2000346) |
| 0.0 | 0.3 | GO:0002084 | protein depalmitoylation(GO:0002084) |
| 0.0 | 0.2 | GO:0032625 | interleukin-21 production(GO:0032625) interleukin-21 secretion(GO:0072619) |
| 0.0 | 0.1 | GO:0006533 | aspartate catabolic process(GO:0006533) |
| 0.0 | 0.4 | GO:0030854 | positive regulation of granulocyte differentiation(GO:0030854) |
| 0.0 | 0.4 | GO:0001672 | regulation of chromatin assembly or disassembly(GO:0001672) |
| 0.0 | 0.3 | GO:0086024 | adrenergic receptor signaling pathway involved in positive regulation of heart rate(GO:0086024) |
| 0.0 | 0.2 | GO:0021943 | formation of radial glial scaffolds(GO:0021943) |
| 0.0 | 0.2 | GO:0018094 | protein polyglycylation(GO:0018094) |
| 0.0 | 1.2 | GO:0000038 | very long-chain fatty acid metabolic process(GO:0000038) |
| 0.0 | 0.1 | GO:0006097 | glyoxylate cycle(GO:0006097) |
| 0.0 | 1.2 | GO:0002026 | regulation of the force of heart contraction(GO:0002026) |
| 0.0 | 0.2 | GO:0090043 | regulation of tubulin deacetylation(GO:0090043) |
| 0.0 | 0.5 | GO:0016540 | protein autoprocessing(GO:0016540) |
| 0.0 | 0.2 | GO:0070995 | NADPH oxidation(GO:0070995) |
| 0.0 | 1.4 | GO:0010718 | positive regulation of epithelial to mesenchymal transition(GO:0010718) |
| 0.0 | 0.3 | GO:0030388 | fructose 1,6-bisphosphate metabolic process(GO:0030388) |
| 0.0 | 0.5 | GO:0042276 | error-prone translesion synthesis(GO:0042276) |
| 0.0 | 0.8 | GO:0045646 | regulation of erythrocyte differentiation(GO:0045646) |
| 0.0 | 2.9 | GO:0010977 | negative regulation of neuron projection development(GO:0010977) |
| 0.0 | 0.1 | GO:0021796 | cerebral cortex regionalization(GO:0021796) |
| 0.0 | 1.3 | GO:0045669 | positive regulation of osteoblast differentiation(GO:0045669) |
| 0.0 | 0.1 | GO:0043569 | negative regulation of insulin-like growth factor receptor signaling pathway(GO:0043569) |
| 0.0 | 0.0 | GO:0046947 | hydroxylysine metabolic process(GO:0046946) hydroxylysine biosynthetic process(GO:0046947) |
Gene overrepresentation in cellular_component category:
| Log-likelihood per target | Total log-likelihood | Term | Description |
|---|---|---|---|
| 0.1 | 0.7 | GO:0042643 | actomyosin, actin portion(GO:0042643) |
| 0.1 | 5.1 | GO:0005859 | muscle myosin complex(GO:0005859) |
| 0.1 | 0.6 | GO:0030485 | smooth muscle contractile fiber(GO:0030485) |
| 0.1 | 0.5 | GO:0016035 | zeta DNA polymerase complex(GO:0016035) |
| 0.1 | 0.5 | GO:0032982 | myosin filament(GO:0032982) |
| 0.1 | 0.2 | GO:0031523 | Myb complex(GO:0031523) |
| 0.1 | 2.6 | GO:0031430 | M band(GO:0031430) |
| 0.0 | 0.7 | GO:0030478 | actin cap(GO:0030478) |
| 0.0 | 0.3 | GO:0044294 | dendritic growth cone(GO:0044294) |
| 0.0 | 0.2 | GO:1990031 | pinceau fiber(GO:1990031) |
| 0.0 | 0.9 | GO:0031143 | pseudopodium(GO:0031143) |
| 0.0 | 1.2 | GO:0031258 | lamellipodium membrane(GO:0031258) |
| 0.0 | 0.5 | GO:0005862 | muscle thin filament tropomyosin(GO:0005862) |
| 0.0 | 0.3 | GO:0033093 | Weibel-Palade body(GO:0033093) |
| 0.0 | 3.2 | GO:0005796 | Golgi lumen(GO:0005796) |
| 0.0 | 0.4 | GO:0005885 | Arp2/3 protein complex(GO:0005885) |
| 0.0 | 0.9 | GO:0008023 | transcription elongation factor complex(GO:0008023) |
| 0.0 | 0.1 | GO:0036449 | microtubule minus-end(GO:0036449) |
| 0.0 | 0.3 | GO:0046930 | pore complex(GO:0046930) |
| 0.0 | 0.2 | GO:0032433 | filopodium tip(GO:0032433) |
| 0.0 | 0.1 | GO:0097433 | dense body(GO:0097433) |
| 0.0 | 0.8 | GO:0005881 | cytoplasmic microtubule(GO:0005881) |
| 0.0 | 0.2 | GO:0000124 | SAGA complex(GO:0000124) |
Gene overrepresentation in molecular_function category:
| Log-likelihood per target | Total log-likelihood | Term | Description |
|---|---|---|---|
| 0.4 | 2.9 | GO:0044323 | retinoic acid-responsive element binding(GO:0044323) |
| 0.4 | 1.4 | GO:0005477 | pyruvate secondary active transmembrane transporter activity(GO:0005477) |
| 0.3 | 5.8 | GO:0032036 | myosin heavy chain binding(GO:0032036) |
| 0.3 | 1.3 | GO:0044729 | hemi-methylated DNA-binding(GO:0044729) |
| 0.2 | 1.5 | GO:0004957 | prostaglandin E receptor activity(GO:0004957) |
| 0.2 | 1.1 | GO:0016403 | dimethylargininase activity(GO:0016403) |
| 0.1 | 2.7 | GO:0071837 | HMG box domain binding(GO:0071837) |
| 0.1 | 1.2 | GO:0016290 | palmitoyl-CoA hydrolase activity(GO:0016290) |
| 0.1 | 0.7 | GO:0045159 | myosin II binding(GO:0045159) |
| 0.1 | 1.1 | GO:0008179 | adenylate cyclase binding(GO:0008179) |
| 0.1 | 0.3 | GO:0005119 | smoothened binding(GO:0005119) |
| 0.0 | 0.2 | GO:0034988 | Fc-gamma receptor I complex binding(GO:0034988) |
| 0.0 | 0.2 | GO:0035727 | lysophosphatidic acid binding(GO:0035727) |
| 0.0 | 2.0 | GO:0070888 | E-box binding(GO:0070888) |
| 0.0 | 0.3 | GO:0008474 | palmitoyl-(protein) hydrolase activity(GO:0008474) palmitoyl hydrolase activity(GO:0098599) |
| 0.0 | 0.2 | GO:0070735 | protein-glycine ligase activity(GO:0070735) |
| 0.0 | 2.5 | GO:0050681 | androgen receptor binding(GO:0050681) |
| 0.0 | 0.3 | GO:0004332 | fructose-bisphosphate aldolase activity(GO:0004332) |
| 0.0 | 0.8 | GO:0031418 | L-ascorbic acid binding(GO:0031418) |
| 0.0 | 0.1 | GO:0004450 | isocitrate dehydrogenase (NADP+) activity(GO:0004450) (R)-2-hydroxyglutarate dehydrogenase activity(GO:0051990) |
| 0.0 | 3.2 | GO:0030165 | PDZ domain binding(GO:0030165) |
| 0.0 | 0.3 | GO:0043199 | sulfate binding(GO:0043199) |
| 0.0 | 0.4 | GO:0016641 | oxidoreductase activity, acting on the CH-NH2 group of donors, oxygen as acceptor(GO:0016641) |
| 0.0 | 0.3 | GO:0031698 | beta-2 adrenergic receptor binding(GO:0031698) |
| 0.0 | 0.1 | GO:0004046 | aminoacylase activity(GO:0004046) |
| 0.0 | 0.6 | GO:0004198 | calcium-dependent cysteine-type endopeptidase activity(GO:0004198) |
| 0.0 | 0.5 | GO:0003887 | DNA-directed DNA polymerase activity(GO:0003887) |
| 0.0 | 0.1 | GO:0043813 | phosphatidylinositol-3,5-bisphosphate 5-phosphatase activity(GO:0043813) |
| 0.0 | 0.5 | GO:0005159 | insulin-like growth factor receptor binding(GO:0005159) |
| 0.0 | 0.7 | GO:0051879 | Hsp90 protein binding(GO:0051879) |
| 0.0 | 0.9 | GO:0017022 | myosin binding(GO:0017022) |
| 0.0 | 0.8 | GO:0004177 | aminopeptidase activity(GO:0004177) |
| 0.0 | 0.9 | GO:0003700 | nucleic acid binding transcription factor activity(GO:0001071) transcription factor activity, sequence-specific DNA binding(GO:0003700) |
Gene overrepresentation in C2:CP category:
| Log-likelihood per target | Total log-likelihood | Term | Description |
|---|---|---|---|
| 0.1 | 7.1 | PID ILK PATHWAY | Integrin-linked kinase signaling |
| 0.1 | 2.8 | PID P38 MKK3 6PATHWAY | p38 MAPK signaling pathway |
| 0.1 | 3.2 | PID SYNDECAN 2 PATHWAY | Syndecan-2-mediated signaling events |
| 0.1 | 2.3 | PID HDAC CLASSIII PATHWAY | Signaling events mediated by HDAC Class III |
| 0.1 | 3.3 | ST DIFFERENTIATION PATHWAY IN PC12 CELLS | Differentiation Pathway in PC12 Cells; this is a specific case of PAC1 Receptor Pathway. |
| 0.0 | 1.2 | SA FAS SIGNALING | The TNF-type receptor Fas induces apoptosis on ligand binding. |
| 0.0 | 1.3 | PID RET PATHWAY | Signaling events regulated by Ret tyrosine kinase |
| 0.0 | 0.7 | PID ERBB1 RECEPTOR PROXIMAL PATHWAY | EGF receptor (ErbB1) signaling pathway |
| 0.0 | 0.6 | PID FAK PATHWAY | Signaling events mediated by focal adhesion kinase |
| 0.0 | 0.3 | PID HEDGEHOG 2PATHWAY | Signaling events mediated by the Hedgehog family |
Gene overrepresentation in C2:CP:REACTOME category:
| Log-likelihood per target | Total log-likelihood | Term | Description |
|---|---|---|---|
| 0.1 | 1.5 | REACTOME PROSTANOID LIGAND RECEPTORS | Genes involved in Prostanoid ligand receptors |
| 0.1 | 3.2 | REACTOME HS GAG DEGRADATION | Genes involved in HS-GAG degradation |
| 0.1 | 4.1 | REACTOME SEMA4D INDUCED CELL MIGRATION AND GROWTH CONE COLLAPSE | Genes involved in Sema4D induced cell migration and growth-cone collapse |
| 0.1 | 1.4 | REACTOME BILE SALT AND ORGANIC ANION SLC TRANSPORTERS | Genes involved in Bile salt and organic anion SLC transporters |
| 0.0 | 3.0 | REACTOME PPARA ACTIVATES GENE EXPRESSION | Genes involved in PPARA Activates Gene Expression |
| 0.0 | 0.9 | REACTOME SEMA3A PAK DEPENDENT AXON REPULSION | Genes involved in Sema3A PAK dependent Axon repulsion |
| 0.0 | 2.2 | REACTOME NUCLEAR RECEPTOR TRANSCRIPTION PATHWAY | Genes involved in Nuclear Receptor transcription pathway |
| 0.0 | 2.9 | REACTOME TRANSCRIPTIONAL REGULATION OF WHITE ADIPOCYTE DIFFERENTIATION | Genes involved in Transcriptional Regulation of White Adipocyte Differentiation |
| 0.0 | 1.3 | REACTOME STRIATED MUSCLE CONTRACTION | Genes involved in Striated Muscle Contraction |
| 0.0 | 0.7 | REACTOME CASPASE MEDIATED CLEAVAGE OF CYTOSKELETAL PROTEINS | Genes involved in Caspase-mediated cleavage of cytoskeletal proteins |
| 0.0 | 1.6 | REACTOME INTERFERON ALPHA BETA SIGNALING | Genes involved in Interferon alpha/beta signaling |
| 0.0 | 0.5 | REACTOME REGULATION OF INSULIN LIKE GROWTH FACTOR IGF ACTIVITY BY INSULIN LIKE GROWTH FACTOR BINDING PROTEINS IGFBPS | Genes involved in Regulation of Insulin-like Growth Factor (IGF) Activity by Insulin-like Growth Factor Binding Proteins (IGFBPs) |