Project
Epithelial-Mesenchymal Transition, human (Scheel, 2011)
Navigation
Downloads
Results for STAT1_STAT3_BCL6
Z-value: 1.37
Motif logo
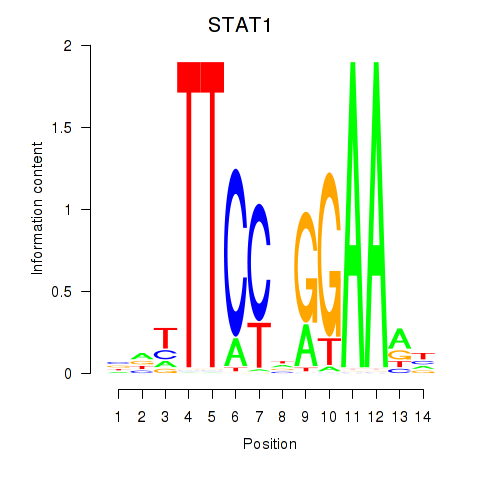
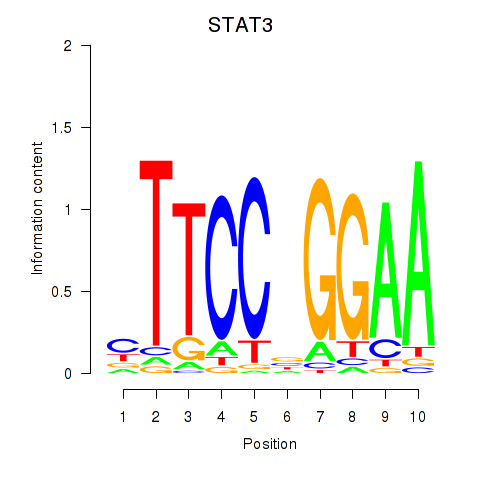
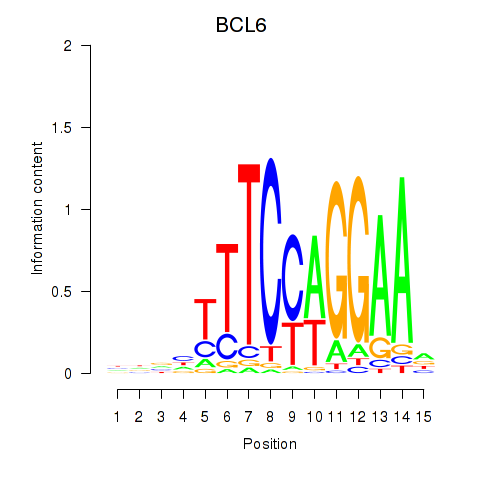
Transcription factors associated with STAT1_STAT3_BCL6
| Gene Symbol | Gene ID | Gene Info |
|---|---|---|
|
STAT1
|
ENSG00000115415.14 | STAT1 |
|
STAT3
|
ENSG00000168610.10 | STAT3 |
|
BCL6
|
ENSG00000113916.13 | BCL6 |
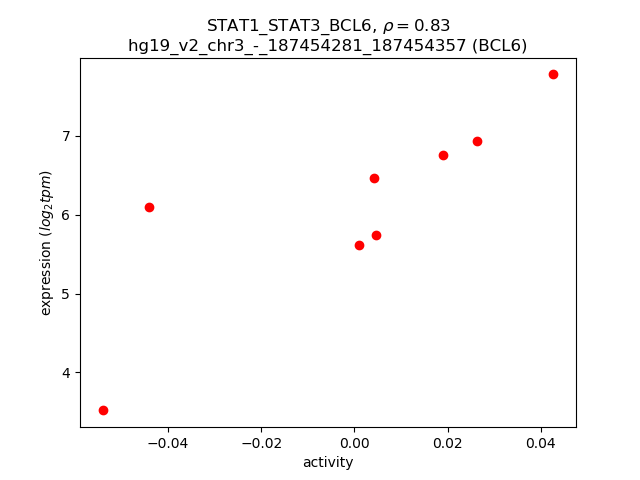
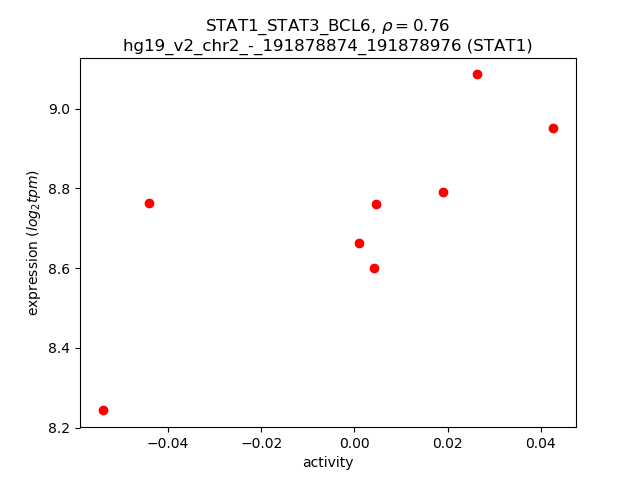
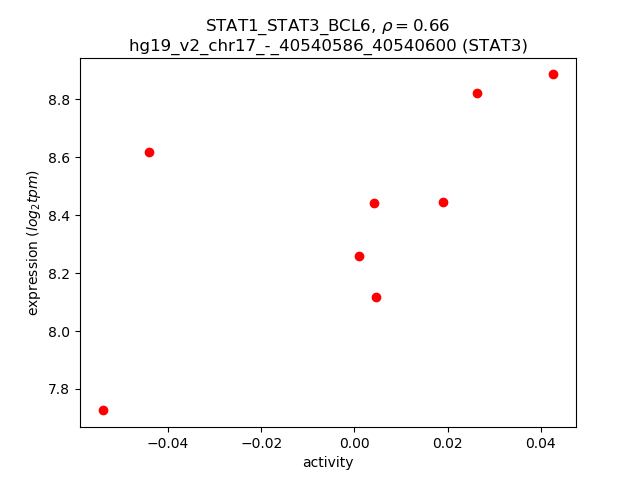
Activity-expression correlation:
| Gene | Promoter | Pearson corr. coef. | P-value | Plot |
|---|---|---|---|---|
| BCL6 | hg19_v2_chr3_-_187454281_187454357 | 0.83 | 1.0e-02 | Click! |
| STAT1 | hg19_v2_chr2_-_191878874_191878976 | 0.76 | 2.9e-02 | Click! |
| STAT3 | hg19_v2_chr17_-_40540586_40540600 | 0.66 | 7.7e-02 | Click! |
Activity profile of STAT1_STAT3_BCL6 motif
Sorted Z-values of STAT1_STAT3_BCL6 motif
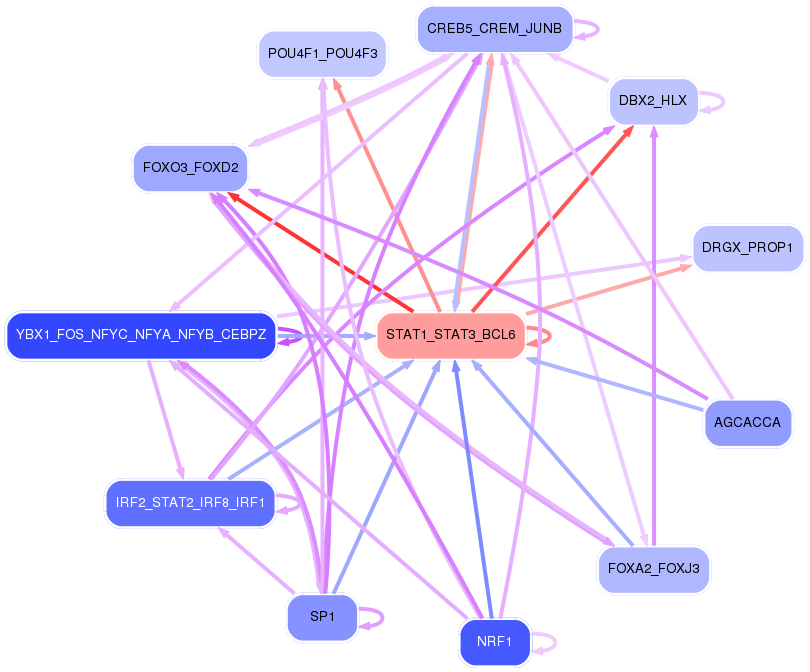
Network of associatons between targets according to the STRING database.

First level regulatory network of STAT1_STAT3_BCL6
| Promoter | Score | Transcript | Gene | Gene Info |
|---|---|---|---|---|
| chr14_-_30396948 | 2.99 |
ENST00000331968.5 |
PRKD1 |
protein kinase D1 |
| chr8_-_120651020 | 2.90 |
ENST00000522826.1 ENST00000520066.1 ENST00000259486.6 ENST00000075322.6 |
ENPP2 |
ectonucleotide pyrophosphatase/phosphodiesterase 2 |
| chr1_+_163038565 | 2.81 |
ENST00000421743.2 |
RGS4 |
regulator of G-protein signaling 4 |
| chr12_+_53443963 | 2.76 |
ENST00000546602.1 ENST00000552570.1 ENST00000549700.1 |
TENC1 |
tensin like C1 domain containing phosphatase (tensin 2) |
| chr12_-_91539918 | 2.46 |
ENST00000548218.1 |
DCN |
decorin |
| chr12_+_53443680 | 2.45 |
ENST00000314250.6 ENST00000451358.1 |
TENC1 |
tensin like C1 domain containing phosphatase (tensin 2) |
| chr1_+_163039143 | 2.42 |
ENST00000531057.1 ENST00000527809.1 ENST00000367908.4 |
RGS4 |
regulator of G-protein signaling 4 |
| chr3_-_93692781 | 2.22 |
ENST00000394236.3 |
PROS1 |
protein S (alpha) |
| chr5_-_111092873 | 2.14 |
ENST00000509025.1 ENST00000515855.1 |
NREP |
neuronal regeneration related protein |
| chr2_-_190044480 | 2.06 |
ENST00000374866.3 |
COL5A2 |
collagen, type V, alpha 2 |
| chr8_-_27469196 | 1.92 |
ENST00000546343.1 ENST00000560566.1 |
CLU |
clusterin |
| chr6_+_108977520 | 1.86 |
ENST00000540898.1 |
FOXO3 |
forkhead box O3 |
| chr3_+_45067659 | 1.81 |
ENST00000296130.4 |
CLEC3B |
C-type lectin domain family 3, member B |
| chr9_-_89562104 | 1.80 |
ENST00000298743.7 |
GAS1 |
growth arrest-specific 1 |
| chr1_-_144994909 | 1.61 |
ENST00000369347.4 ENST00000369354.3 |
PDE4DIP |
phosphodiesterase 4D interacting protein |
| chr14_-_92414055 | 1.53 |
ENST00000342058.4 |
FBLN5 |
fibulin 5 |
| chr1_+_221051699 | 1.44 |
ENST00000366903.6 |
HLX |
H2.0-like homeobox |
| chr5_-_146781153 | 1.39 |
ENST00000520473.1 |
DPYSL3 |
dihydropyrimidinase-like 3 |
| chr5_-_111093081 | 1.32 |
ENST00000453526.2 ENST00000509427.1 |
NREP |
neuronal regeneration related protein |
| chr8_-_27468945 | 1.31 |
ENST00000405140.3 |
CLU |
clusterin |
| chr22_-_31503490 | 1.26 |
ENST00000400299.2 |
SELM |
Selenoprotein M |
| chr5_-_111093340 | 1.24 |
ENST00000508870.1 |
NREP |
neuronal regeneration related protein |
| chr5_-_111093167 | 1.14 |
ENST00000446294.2 ENST00000419114.2 |
NREP |
neuronal regeneration related protein |
| chr8_-_27468842 | 1.14 |
ENST00000523500.1 |
CLU |
clusterin |
| chr19_-_58864848 | 1.11 |
ENST00000263100.3 |
A1BG |
alpha-1-B glycoprotein |
| chr5_-_111093406 | 1.10 |
ENST00000379671.3 |
NREP |
neuronal regeneration related protein |
| chr5_-_111092930 | 1.09 |
ENST00000257435.7 |
NREP |
neuronal regeneration related protein |
| chr6_+_84222220 | 1.08 |
ENST00000369700.3 |
PRSS35 |
protease, serine, 35 |
| chrX_-_48931648 | 1.01 |
ENST00000376386.3 ENST00000376390.4 |
PRAF2 |
PRA1 domain family, member 2 |
| chr2_-_128399706 | 0.99 |
ENST00000426981.1 |
LIMS2 |
LIM and senescent cell antigen-like domains 2 |
| chr8_-_120685608 | 0.98 |
ENST00000427067.2 |
ENPP2 |
ectonucleotide pyrophosphatase/phosphodiesterase 2 |
| chr19_-_45927622 | 0.97 |
ENST00000300853.3 ENST00000589165.1 |
ERCC1 |
excision repair cross-complementing rodent repair deficiency, complementation group 1 (includes overlapping antisense sequence) |
| chr22_-_50699701 | 0.97 |
ENST00000395780.1 |
MAPK12 |
mitogen-activated protein kinase 12 |
| chr2_-_175499294 | 0.93 |
ENST00000392547.2 |
WIPF1 |
WAS/WASL interacting protein family, member 1 |
| chr19_+_10197463 | 0.90 |
ENST00000590378.1 ENST00000397881.3 |
C19orf66 |
chromosome 19 open reading frame 66 |
| chr10_-_90751038 | 0.90 |
ENST00000458159.1 ENST00000415557.1 ENST00000458208.1 |
ACTA2 |
actin, alpha 2, smooth muscle, aorta |
| chr1_-_144995074 | 0.88 |
ENST00000534536.1 |
PDE4DIP |
phosphodiesterase 4D interacting protein |
| chr4_+_126237554 | 0.86 |
ENST00000394329.3 |
FAT4 |
FAT atypical cadherin 4 |
| chr3_-_187455680 | 0.83 |
ENST00000438077.1 |
BCL6 |
B-cell CLL/lymphoma 6 |
| chr10_-_33625154 | 0.82 |
ENST00000265371.4 |
NRP1 |
neuropilin 1 |
| chr17_-_76356148 | 0.82 |
ENST00000587578.1 ENST00000330871.2 |
SOCS3 |
suppressor of cytokine signaling 3 |
| chr4_-_175443943 | 0.82 |
ENST00000296522.6 |
HPGD |
hydroxyprostaglandin dehydrogenase 15-(NAD) |
| chr1_-_31845914 | 0.81 |
ENST00000373713.2 |
FABP3 |
fatty acid binding protein 3, muscle and heart (mammary-derived growth inhibitor) |
| chr9_-_139891165 | 0.75 |
ENST00000494426.1 |
CLIC3 |
chloride intracellular channel 3 |
| chr7_-_74267836 | 0.74 |
ENST00000361071.5 ENST00000453619.2 ENST00000417115.2 ENST00000405086.2 |
GTF2IRD2 |
GTF2I repeat domain containing 2 |
| chr19_-_40324255 | 0.74 |
ENST00000593685.1 ENST00000600611.1 |
DYRK1B |
dual-specificity tyrosine-(Y)-phosphorylation regulated kinase 1B |
| chr1_+_213123915 | 0.73 |
ENST00000366968.4 ENST00000490792.1 |
VASH2 |
vasohibin 2 |
| chr5_+_145718587 | 0.73 |
ENST00000230732.4 |
POU4F3 |
POU class 4 homeobox 3 |
| chr1_-_144994840 | 0.71 |
ENST00000369351.3 ENST00000369349.3 |
PDE4DIP |
phosphodiesterase 4D interacting protein |
| chr1_+_154300217 | 0.70 |
ENST00000368489.3 |
ATP8B2 |
ATPase, aminophospholipid transporter, class I, type 8B, member 2 |
| chr3_+_183894566 | 0.69 |
ENST00000439647.1 |
AP2M1 |
adaptor-related protein complex 2, mu 1 subunit |
| chr14_-_106406090 | 0.68 |
ENST00000390593.2 |
IGHV6-1 |
immunoglobulin heavy variable 6-1 |
| chr1_-_144995002 | 0.67 |
ENST00000369356.4 |
PDE4DIP |
phosphodiesterase 4D interacting protein |
| chr2_+_87754887 | 0.67 |
ENST00000409054.1 ENST00000331944.6 ENST00000409139.1 |
LINC00152 |
long intergenic non-protein coding RNA 152 |
| chr2_+_87755054 | 0.67 |
ENST00000423846.1 |
LINC00152 |
long intergenic non-protein coding RNA 152 |
| chr2_+_87754989 | 0.66 |
ENST00000409898.2 ENST00000419680.2 ENST00000414584.1 ENST00000455131.1 |
LINC00152 |
long intergenic non-protein coding RNA 152 |
| chr19_+_35225060 | 0.65 |
ENST00000599244.1 ENST00000392232.3 |
ZNF181 |
zinc finger protein 181 |
| chr10_+_95848824 | 0.65 |
ENST00000371385.3 ENST00000371375.1 |
PLCE1 |
phospholipase C, epsilon 1 |
| chr17_+_6347761 | 0.65 |
ENST00000250056.8 ENST00000571373.1 ENST00000570337.2 ENST00000572595.2 ENST00000576056.1 |
FAM64A |
family with sequence similarity 64, member A |
| chr1_+_202431859 | 0.65 |
ENST00000391959.3 ENST00000367270.4 |
PPP1R12B |
protein phosphatase 1, regulatory subunit 12B |
| chr7_+_74508372 | 0.64 |
ENST00000356115.5 ENST00000430511.2 ENST00000312575.7 |
GTF2IRD2B |
GTF2I repeat domain containing 2B |
| chr8_+_104384616 | 0.64 |
ENST00000520337.1 |
CTHRC1 |
collagen triple helix repeat containing 1 |
| chr19_+_15218180 | 0.63 |
ENST00000342784.2 ENST00000597977.1 ENST00000600440.1 |
SYDE1 |
synapse defective 1, Rho GTPase, homolog 1 (C. elegans) |
| chr17_+_6347729 | 0.62 |
ENST00000572447.1 |
FAM64A |
family with sequence similarity 64, member A |
| chr8_+_38586068 | 0.60 |
ENST00000443286.2 ENST00000520340.1 ENST00000518415.1 |
TACC1 |
transforming, acidic coiled-coil containing protein 1 |
| chr2_-_167232484 | 0.59 |
ENST00000375387.4 ENST00000303354.6 ENST00000409672.1 |
SCN9A |
sodium channel, voltage-gated, type IX, alpha subunit |
| chr6_+_32821924 | 0.58 |
ENST00000374859.2 ENST00000453265.2 |
PSMB9 |
proteasome (prosome, macropain) subunit, beta type, 9 |
| chr3_-_112329110 | 0.58 |
ENST00000479368.1 |
CCDC80 |
coiled-coil domain containing 80 |
| chr11_+_5710919 | 0.55 |
ENST00000379965.3 ENST00000425490.1 |
TRIM22 |
tripartite motif containing 22 |
| chr5_+_148521381 | 0.55 |
ENST00000504238.1 |
ABLIM3 |
actin binding LIM protein family, member 3 |
| chr16_+_30996502 | 0.54 |
ENST00000353250.5 ENST00000262520.6 ENST00000297679.5 ENST00000562932.1 ENST00000574447.1 |
HSD3B7 |
hydroxy-delta-5-steroid dehydrogenase, 3 beta- and steroid delta-isomerase 7 |
| chr3_-_112356944 | 0.53 |
ENST00000461431.1 |
CCDC80 |
coiled-coil domain containing 80 |
| chr19_-_51875894 | 0.53 |
ENST00000600427.1 ENST00000595217.1 ENST00000221978.5 |
NKG7 |
natural killer cell group 7 sequence |
| chrX_+_103031421 | 0.52 |
ENST00000433491.1 ENST00000418604.1 ENST00000443502.1 |
PLP1 |
proteolipid protein 1 |
| chr1_-_68299130 | 0.51 |
ENST00000370982.3 |
GNG12 |
guanine nucleotide binding protein (G protein), gamma 12 |
| chr5_+_140625147 | 0.50 |
ENST00000231173.3 |
PCDHB15 |
protocadherin beta 15 |
| chr19_+_35168567 | 0.50 |
ENST00000457781.2 ENST00000505163.1 ENST00000505242.1 ENST00000423823.2 ENST00000507959.1 ENST00000446502.2 |
ZNF302 |
zinc finger protein 302 |
| chrX_-_70473957 | 0.49 |
ENST00000373984.3 ENST00000314425.5 ENST00000373982.1 |
ZMYM3 |
zinc finger, MYM-type 3 |
| chr19_+_2476116 | 0.49 |
ENST00000215631.4 ENST00000587345.1 |
GADD45B |
growth arrest and DNA-damage-inducible, beta |
| chr17_-_76274572 | 0.48 |
ENST00000374945.1 |
RP11-219G17.4 |
RP11-219G17.4 |
| chr19_-_44405941 | 0.48 |
ENST00000587128.1 |
RP11-15A1.3 |
RP11-15A1.3 |
| chr19_+_35168633 | 0.48 |
ENST00000505365.2 |
ZNF302 |
zinc finger protein 302 |
| chr1_+_153631130 | 0.47 |
ENST00000368685.5 |
SNAPIN |
SNAP-associated protein |
| chr3_+_185000729 | 0.47 |
ENST00000448876.1 ENST00000446828.1 ENST00000447637.1 ENST00000424227.1 ENST00000454237.1 |
MAP3K13 |
mitogen-activated protein kinase kinase kinase 13 |
| chr19_-_40324767 | 0.46 |
ENST00000601972.1 ENST00000430012.2 ENST00000323039.5 ENST00000348817.3 |
DYRK1B |
dual-specificity tyrosine-(Y)-phosphorylation regulated kinase 1B |
| chr16_-_67260691 | 0.46 |
ENST00000447579.1 ENST00000393992.1 ENST00000424285.1 |
LRRC29 |
leucine rich repeat containing 29 |
| chr15_+_63340775 | 0.46 |
ENST00000559281.1 ENST00000317516.7 |
TPM1 |
tropomyosin 1 (alpha) |
| chr2_-_224467093 | 0.46 |
ENST00000305409.2 |
SCG2 |
secretogranin II |
| chr7_+_134464376 | 0.45 |
ENST00000454108.1 ENST00000361675.2 |
CALD1 |
caldesmon 1 |
| chr3_+_45927994 | 0.45 |
ENST00000357632.2 ENST00000395963.2 |
CCR9 |
chemokine (C-C motif) receptor 9 |
| chr19_+_10196981 | 0.44 |
ENST00000591813.1 |
C19orf66 |
chromosome 19 open reading frame 66 |
| chr7_-_38670957 | 0.44 |
ENST00000325590.5 ENST00000428293.2 |
AMPH |
amphiphysin |
| chr19_+_55281260 | 0.44 |
ENST00000336077.6 ENST00000291633.7 |
KIR2DL1 |
killer cell immunoglobulin-like receptor, two domains, long cytoplasmic tail, 1 |
| chr9_-_123239632 | 0.43 |
ENST00000416449.1 |
CDK5RAP2 |
CDK5 regulatory subunit associated protein 2 |
| chr7_-_38671098 | 0.43 |
ENST00000356264.2 |
AMPH |
amphiphysin |
| chr17_+_36858694 | 0.43 |
ENST00000563897.1 |
CTB-58E17.1 |
CTB-58E17.1 |
| chr10_+_35484793 | 0.42 |
ENST00000488741.1 ENST00000474931.1 ENST00000468236.1 ENST00000344351.5 ENST00000490511.1 |
CREM |
cAMP responsive element modulator |
| chr3_-_42744312 | 0.42 |
ENST00000416756.1 ENST00000441594.1 |
HHATL |
hedgehog acyltransferase-like |
| chr16_+_53133070 | 0.42 |
ENST00000565832.1 |
CHD9 |
chromodomain helicase DNA binding protein 9 |
| chr5_-_177423243 | 0.42 |
ENST00000308304.2 |
PROP1 |
PROP paired-like homeobox 1 |
| chr4_-_140005443 | 0.42 |
ENST00000510408.1 ENST00000420916.2 ENST00000358635.3 |
ELF2 |
E74-like factor 2 (ets domain transcription factor) |
| chr19_+_35168547 | 0.42 |
ENST00000502743.1 ENST00000509528.1 ENST00000506901.1 |
ZNF302 |
zinc finger protein 302 |
| chr19_-_44809121 | 0.41 |
ENST00000591609.1 ENST00000589799.1 ENST00000291182.4 ENST00000589248.1 |
ZNF235 |
zinc finger protein 235 |
| chr19_-_44405623 | 0.40 |
ENST00000591815.1 |
RP11-15A1.3 |
RP11-15A1.3 |
| chr21_+_26934165 | 0.40 |
ENST00000456917.1 |
MIR155HG |
MIR155 host gene (non-protein coding) |
| chr9_-_123812542 | 0.40 |
ENST00000223642.1 |
C5 |
complement component 5 |
| chr4_-_159094194 | 0.40 |
ENST00000592057.1 ENST00000585682.1 ENST00000393807.5 |
FAM198B |
family with sequence similarity 198, member B |
| chr5_+_172483347 | 0.40 |
ENST00000522692.1 ENST00000296953.2 ENST00000540014.1 ENST00000520420.1 |
CREBRF |
CREB3 regulatory factor |
| chr1_+_155146318 | 0.40 |
ENST00000368385.4 ENST00000545012.1 ENST00000392451.2 ENST00000368383.3 ENST00000368382.1 ENST00000334634.4 |
TRIM46 |
tripartite motif containing 46 |
| chr4_-_140005341 | 0.40 |
ENST00000379549.2 ENST00000512627.1 |
ELF2 |
E74-like factor 2 (ets domain transcription factor) |
| chr11_-_111782484 | 0.38 |
ENST00000533971.1 |
CRYAB |
crystallin, alpha B |
| chr12_+_21679220 | 0.38 |
ENST00000256969.2 |
C12orf39 |
chromosome 12 open reading frame 39 |
| chr6_-_52859046 | 0.38 |
ENST00000457564.1 ENST00000541324.1 ENST00000370960.1 |
GSTA4 |
glutathione S-transferase alpha 4 |
| chr1_+_59775752 | 0.37 |
ENST00000371212.1 |
FGGY |
FGGY carbohydrate kinase domain containing |
| chr15_+_63340734 | 0.37 |
ENST00000560959.1 |
TPM1 |
tropomyosin 1 (alpha) |
| chr6_-_56707943 | 0.37 |
ENST00000370769.4 ENST00000421834.2 ENST00000312431.6 ENST00000361203.3 ENST00000523817.1 |
DST |
dystonin |
| chr7_-_130353553 | 0.37 |
ENST00000330992.7 ENST00000445977.2 |
COPG2 |
coatomer protein complex, subunit gamma 2 |
| chr17_+_2699697 | 0.36 |
ENST00000254695.8 ENST00000366401.4 ENST00000542807.1 |
RAP1GAP2 |
RAP1 GTPase activating protein 2 |
| chr11_-_111782696 | 0.36 |
ENST00000227251.3 ENST00000526180.1 |
CRYAB |
crystallin, alpha B |
| chr1_+_65775204 | 0.36 |
ENST00000371069.4 |
DNAJC6 |
DnaJ (Hsp40) homolog, subfamily C, member 6 |
| chr19_+_44081344 | 0.35 |
ENST00000599207.1 |
PINLYP |
phospholipase A2 inhibitor and LY6/PLAUR domain containing |
| chr18_+_6729698 | 0.35 |
ENST00000383472.4 |
ARHGAP28 |
Rho GTPase activating protein 28 |
| chr5_-_121413974 | 0.35 |
ENST00000231004.4 |
LOX |
lysyl oxidase |
| chr3_-_114866084 | 0.35 |
ENST00000357258.3 |
ZBTB20 |
zinc finger and BTB domain containing 20 |
| chr14_+_76452090 | 0.35 |
ENST00000314067.6 ENST00000238628.6 ENST00000556742.1 |
IFT43 |
intraflagellar transport 43 homolog (Chlamydomonas) |
| chr1_+_162602244 | 0.35 |
ENST00000367922.3 ENST00000367921.3 |
DDR2 |
discoidin domain receptor tyrosine kinase 2 |
| chr12_-_88974236 | 0.35 |
ENST00000228280.5 ENST00000552044.1 ENST00000357116.4 |
KITLG |
KIT ligand |
| chrX_-_139866723 | 0.34 |
ENST00000370532.2 |
CDR1 |
cerebellar degeneration-related protein 1, 34kDa |
| chr17_+_32582293 | 0.34 |
ENST00000580907.1 ENST00000225831.4 |
CCL2 |
chemokine (C-C motif) ligand 2 |
| chr12_-_7261772 | 0.33 |
ENST00000545280.1 ENST00000543933.1 ENST00000545337.1 ENST00000544702.1 ENST00000266542.4 |
C1RL |
complement component 1, r subcomponent-like |
| chr15_-_93616892 | 0.33 |
ENST00000556658.1 ENST00000538818.1 ENST00000425933.2 |
RGMA |
repulsive guidance molecule family member a |
| chr2_-_175547571 | 0.33 |
ENST00000409415.3 ENST00000359761.3 ENST00000272746.5 |
WIPF1 |
WAS/WASL interacting protein family, member 1 |
| chr7_+_134464414 | 0.33 |
ENST00000361901.2 |
CALD1 |
caldesmon 1 |
| chr15_-_60690163 | 0.33 |
ENST00000558998.1 ENST00000560165.1 ENST00000557986.1 ENST00000559780.1 ENST00000559467.1 ENST00000559956.1 ENST00000332680.4 ENST00000396024.3 ENST00000421017.2 ENST00000560466.1 ENST00000558132.1 ENST00000559113.1 ENST00000557906.1 ENST00000558558.1 ENST00000560468.1 ENST00000559370.1 ENST00000558169.1 ENST00000559725.1 ENST00000558985.1 ENST00000451270.2 |
ANXA2 |
annexin A2 |
| chr11_+_61197572 | 0.32 |
ENST00000542074.1 ENST00000534878.1 ENST00000537782.1 ENST00000543265.1 |
SDHAF2 |
succinate dehydrogenase complex assembly factor 2 |
| chr5_+_140723601 | 0.32 |
ENST00000253812.6 |
PCDHGA3 |
protocadherin gamma subfamily A, 3 |
| chr2_-_28113217 | 0.32 |
ENST00000444339.2 |
RBKS |
ribokinase |
| chr17_+_32683456 | 0.32 |
ENST00000225844.2 |
CCL13 |
chemokine (C-C motif) ligand 13 |
| chrX_+_106045891 | 0.31 |
ENST00000357242.5 ENST00000310452.2 ENST00000481617.2 ENST00000276175.3 |
TBC1D8B |
TBC1 domain family, member 8B (with GRAM domain) |
| chr10_-_25010795 | 0.31 |
ENST00000416305.1 ENST00000376410.2 |
ARHGAP21 |
Rho GTPase activating protein 21 |
| chr1_+_6845578 | 0.31 |
ENST00000467404.2 ENST00000439411.2 |
CAMTA1 |
calmodulin binding transcription activator 1 |
| chr7_-_87936195 | 0.31 |
ENST00000414498.1 ENST00000301959.5 ENST00000380079.4 |
STEAP4 |
STEAP family member 4 |
| chr2_-_106013400 | 0.31 |
ENST00000409807.1 |
FHL2 |
four and a half LIM domains 2 |
| chr17_-_1619535 | 0.31 |
ENST00000573075.1 ENST00000574306.1 |
MIR22HG |
MIR22 host gene (non-protein coding) |
| chr16_+_70332956 | 0.31 |
ENST00000288071.6 ENST00000393657.2 ENST00000355992.3 ENST00000567706.1 |
DDX19B RP11-529K1.3 |
DEAD (Asp-Glu-Ala-Asp) box polypeptide 19B Uncharacterized protein |
| chr19_+_49977466 | 0.31 |
ENST00000596435.1 ENST00000344019.3 ENST00000597551.1 ENST00000204637.2 ENST00000600429.1 |
FLT3LG |
fms-related tyrosine kinase 3 ligand |
| chr8_+_71485681 | 0.30 |
ENST00000391684.1 |
AC120194.1 |
AC120194.1 |
| chr17_-_1619491 | 0.30 |
ENST00000570416.1 ENST00000575626.1 ENST00000610106.1 ENST00000608198.1 ENST00000609442.1 ENST00000334146.3 ENST00000576489.1 ENST00000608245.1 ENST00000609398.1 ENST00000608913.1 ENST00000574016.1 ENST00000571091.1 ENST00000573127.1 ENST00000609990.1 ENST00000576749.1 |
MIR22HG |
MIR22 host gene (non-protein coding) |
| chr5_-_132113083 | 0.29 |
ENST00000296873.7 |
SEPT8 |
septin 8 |
| chr14_-_24977457 | 0.29 |
ENST00000250378.3 ENST00000206446.4 |
CMA1 |
chymase 1, mast cell |
| chr1_+_6845497 | 0.27 |
ENST00000473578.1 ENST00000557126.1 |
CAMTA1 |
calmodulin binding transcription activator 1 |
| chr14_-_24806588 | 0.27 |
ENST00000555591.1 ENST00000554569.1 |
RP11-934B9.3 RIPK3 |
Uncharacterized protein receptor-interacting serine-threonine kinase 3 |
| chr21_-_31744557 | 0.27 |
ENST00000399889.2 |
KRTAP13-2 |
keratin associated protein 13-2 |
| chr19_+_49977818 | 0.27 |
ENST00000594009.1 ENST00000595510.1 |
FLT3LG |
fms-related tyrosine kinase 3 ligand |
| chr19_+_44764031 | 0.27 |
ENST00000592581.1 ENST00000590668.1 ENST00000588489.1 ENST00000391958.2 |
ZNF233 |
zinc finger protein 233 |
| chr15_+_63340647 | 0.27 |
ENST00000404484.4 |
TPM1 |
tropomyosin 1 (alpha) |
| chr16_-_8955570 | 0.27 |
ENST00000567554.1 |
CARHSP1 |
calcium regulated heat stable protein 1, 24kDa |
| chr3_+_185046676 | 0.27 |
ENST00000428617.1 ENST00000443863.1 |
MAP3K13 |
mitogen-activated protein kinase kinase kinase 13 |
| chr16_-_8955601 | 0.26 |
ENST00000569398.1 ENST00000568968.1 |
CARHSP1 |
calcium regulated heat stable protein 1, 24kDa |
| chr19_+_39786962 | 0.26 |
ENST00000333625.2 |
IFNL1 |
interferon, lambda 1 |
| chr10_+_104535994 | 0.26 |
ENST00000369889.4 |
WBP1L |
WW domain binding protein 1-like |
| chr7_-_138386097 | 0.26 |
ENST00000421622.1 |
SVOPL |
SVOP-like |
| chr1_-_201476274 | 0.26 |
ENST00000340006.2 |
CSRP1 |
cysteine and glycine-rich protein 1 |
| chr1_+_197881592 | 0.26 |
ENST00000367391.1 ENST00000367390.3 |
LHX9 |
LIM homeobox 9 |
| chr12_-_42877726 | 0.25 |
ENST00000548696.1 |
PRICKLE1 |
prickle homolog 1 (Drosophila) |
| chr14_+_22458631 | 0.25 |
ENST00000390444.1 |
TRAV16 |
T cell receptor alpha variable 16 |
| chr7_-_38398721 | 0.25 |
ENST00000390346.2 |
TRGV3 |
T cell receptor gamma variable 3 |
| chr11_-_65793948 | 0.25 |
ENST00000312106.5 |
CATSPER1 |
cation channel, sperm associated 1 |
| chr1_-_157670528 | 0.25 |
ENST00000368186.5 ENST00000496769.1 |
FCRL3 |
Fc receptor-like 3 |
| chr6_+_35995488 | 0.25 |
ENST00000229795.3 |
MAPK14 |
mitogen-activated protein kinase 14 |
| chr1_-_150780757 | 0.25 |
ENST00000271651.3 |
CTSK |
cathepsin K |
| chr19_+_44669280 | 0.25 |
ENST00000590089.1 ENST00000454662.2 |
ZNF226 |
zinc finger protein 226 |
| chr12_-_56120838 | 0.25 |
ENST00000548160.1 |
CD63 |
CD63 molecule |
| chr4_+_166300084 | 0.25 |
ENST00000402744.4 |
CPE |
carboxypeptidase E |
| chr6_-_105307711 | 0.25 |
ENST00000519645.1 ENST00000262903.4 ENST00000369125.2 |
HACE1 |
HECT domain and ankyrin repeat containing E3 ubiquitin protein ligase 1 |
| chr14_-_20881579 | 0.25 |
ENST00000556935.1 ENST00000262715.5 ENST00000556549.1 |
TEP1 |
telomerase-associated protein 1 |
| chr16_+_29973351 | 0.25 |
ENST00000602948.1 ENST00000279396.6 ENST00000575829.2 ENST00000561899.2 |
TMEM219 |
transmembrane protein 219 |
| chr6_+_151561085 | 0.25 |
ENST00000402676.2 |
AKAP12 |
A kinase (PRKA) anchor protein 12 |
| chr9_+_18474204 | 0.25 |
ENST00000276935.6 |
ADAMTSL1 |
ADAMTS-like 1 |
| chr6_+_35995531 | 0.24 |
ENST00000229794.4 |
MAPK14 |
mitogen-activated protein kinase 14 |
| chr16_-_89785777 | 0.24 |
ENST00000561976.1 |
VPS9D1 |
VPS9 domain containing 1 |
| chr16_-_66952779 | 0.24 |
ENST00000570262.1 ENST00000394055.3 ENST00000299752.4 |
CDH16 |
cadherin 16, KSP-cadherin |
| chr5_-_132113036 | 0.24 |
ENST00000378706.1 |
SEPT8 |
septin 8 |
| chr11_-_9781068 | 0.24 |
ENST00000500698.1 |
RP11-540A21.2 |
RP11-540A21.2 |
| chr5_-_132112921 | 0.23 |
ENST00000378721.4 ENST00000378701.1 |
SEPT8 |
septin 8 |
| chr5_+_118691706 | 0.23 |
ENST00000415806.2 |
TNFAIP8 |
tumor necrosis factor, alpha-induced protein 8 |
| chr10_-_102089729 | 0.23 |
ENST00000465680.2 |
PKD2L1 |
polycystic kidney disease 2-like 1 |
| chr16_-_66952742 | 0.23 |
ENST00000565235.2 ENST00000568632.1 ENST00000565796.1 |
CDH16 |
cadherin 16, KSP-cadherin |
| chr2_+_28113583 | 0.23 |
ENST00000344773.2 ENST00000379624.1 ENST00000342045.2 ENST00000379632.2 ENST00000361704.2 |
BRE |
brain and reproductive organ-expressed (TNFRSF1A modulator) |
| chr14_+_88471468 | 0.23 |
ENST00000267549.3 |
GPR65 |
G protein-coupled receptor 65 |
| chr2_-_224702257 | 0.23 |
ENST00000409375.1 |
AP1S3 |
adaptor-related protein complex 1, sigma 3 subunit |
| chr1_-_241803679 | 0.23 |
ENST00000331838.5 |
OPN3 |
opsin 3 |
| chr6_+_35995552 | 0.22 |
ENST00000468133.1 |
MAPK14 |
mitogen-activated protein kinase 14 |
| chr19_+_56905024 | 0.22 |
ENST00000591172.1 ENST00000589888.1 ENST00000587979.1 ENST00000585659.1 ENST00000593109.1 |
ZNF582-AS1 |
ZNF582 antisense RNA 1 (head to head) |
| chr14_+_65381079 | 0.22 |
ENST00000549115.1 ENST00000607599.1 ENST00000548752.2 ENST00000359118.2 ENST00000552002.2 ENST00000551947.1 ENST00000551093.1 ENST00000542227.1 ENST00000447296.2 ENST00000549987.1 |
CHURC1 FNTB CHURC1-FNTB |
churchill domain containing 1 farnesyltransferase, CAAX box, beta CHURC1-FNTB readthrough |
| chr8_+_28196157 | 0.22 |
ENST00000522209.1 |
PNOC |
prepronociceptin |
| chr17_+_77021702 | 0.22 |
ENST00000392445.2 ENST00000354124.3 |
C1QTNF1 |
C1q and tumor necrosis factor related protein 1 |
| chr17_-_19265982 | 0.22 |
ENST00000268841.6 ENST00000261499.4 ENST00000575478.1 |
B9D1 |
B9 protein domain 1 |
| chr3_-_160117301 | 0.22 |
ENST00000326448.7 ENST00000498409.1 ENST00000475677.1 ENST00000478536.1 |
IFT80 |
intraflagellar transport 80 homolog (Chlamydomonas) |
| chr14_-_25519095 | 0.22 |
ENST00000419632.2 ENST00000358326.2 ENST00000396700.1 ENST00000548724.1 |
STXBP6 |
syntaxin binding protein 6 (amisyn) |
Gene Ontology Analysis
Gene overrepresentation in biological_process category:
| Log-likelihood per target | Total log-likelihood | Term | Description |
|---|---|---|---|
| 0.7 | 4.4 | GO:1902847 | macrophage proliferation(GO:0061517) microglial cell proliferation(GO:0061518) regulation of neuronal signal transduction(GO:1902847) positive regulation of neurofibrillary tangle assembly(GO:1902998) |
| 0.7 | 2.1 | GO:1903225 | negative regulation of endodermal cell differentiation(GO:1903225) |
| 0.6 | 1.9 | GO:0001544 | initiation of primordial ovarian follicle growth(GO:0001544) |
| 0.4 | 3.0 | GO:0089700 | protein kinase D signaling(GO:0089700) |
| 0.3 | 2.3 | GO:0045629 | negative regulation of T-helper 2 cell differentiation(GO:0045629) |
| 0.3 | 0.8 | GO:2001245 | regulation of phosphatidylcholine biosynthetic process(GO:2001245) |
| 0.3 | 1.8 | GO:0010756 | positive regulation of plasminogen activation(GO:0010756) |
| 0.2 | 3.7 | GO:0034638 | phosphatidylcholine catabolic process(GO:0034638) |
| 0.2 | 0.9 | GO:0072137 | condensed mesenchymal cell proliferation(GO:0072137) |
| 0.2 | 0.8 | GO:0060708 | spongiotrophoblast differentiation(GO:0060708) |
| 0.2 | 1.2 | GO:0000720 | pyrimidine dimer repair by nucleotide-excision repair(GO:0000720) |
| 0.2 | 0.6 | GO:0090290 | positive regulation of osteoclast proliferation(GO:0090290) |
| 0.2 | 0.6 | GO:1904425 | negative regulation of GTP binding(GO:1904425) |
| 0.2 | 0.5 | GO:1902824 | positive regulation of late endosome to lysosome transport(GO:1902824) |
| 0.2 | 0.5 | GO:0034553 | respiratory chain complex II assembly(GO:0034552) mitochondrial respiratory chain complex II assembly(GO:0034553) mitochondrial respiratory chain complex II biogenesis(GO:0097032) |
| 0.2 | 0.5 | GO:0032804 | negative regulation of low-density lipoprotein particle receptor catabolic process(GO:0032804) |
| 0.2 | 0.2 | GO:0060545 | positive regulation of necroptotic process(GO:0060545) |
| 0.2 | 0.8 | GO:1902336 | vestibulocochlear nerve structural organization(GO:0021649) neuropilin signaling pathway(GO:0038189) VEGF-activated neuropilin signaling pathway(GO:0038190) positive regulation of cytokine activity(GO:0060301) ganglion morphogenesis(GO:0061552) positive regulation of retinal ganglion cell axon guidance(GO:1902336) VEGF-activated neuropilin signaling pathway involved in axon guidance(GO:1902378) dorsal root ganglion morphogenesis(GO:1904835) otic placode development(GO:1905040) |
| 0.2 | 2.5 | GO:1900747 | negative regulation of vascular endothelial growth factor signaling pathway(GO:1900747) |
| 0.2 | 0.6 | GO:1901165 | positive regulation of trophoblast cell migration(GO:1901165) |
| 0.2 | 0.9 | GO:0072683 | T cell extravasation(GO:0072683) |
| 0.2 | 0.9 | GO:0090131 | mesenchyme migration(GO:0090131) |
| 0.1 | 1.9 | GO:0048251 | elastic fiber assembly(GO:0048251) |
| 0.1 | 0.7 | GO:0014835 | myoblast differentiation involved in skeletal muscle regeneration(GO:0014835) |
| 0.1 | 0.4 | GO:0006500 | N-terminal protein palmitoylation(GO:0006500) |
| 0.1 | 1.1 | GO:0003065 | positive regulation of heart rate by epinephrine(GO:0003065) |
| 0.1 | 0.4 | GO:1900169 | regulation of glucocorticoid mediated signaling pathway(GO:1900169) |
| 0.1 | 0.5 | GO:2000690 | negative regulation of cardioblast differentiation(GO:0051892) regulation of cardiac muscle cell myoblast differentiation(GO:2000690) negative regulation of cardiac muscle cell myoblast differentiation(GO:2000691) |
| 0.1 | 0.2 | GO:0002436 | immune complex clearance(GO:0002434) immune complex clearance by monocytes and macrophages(GO:0002436) regulation of immune complex clearance by monocytes and macrophages(GO:0090264) |
| 0.1 | 1.8 | GO:0060628 | regulation of ER to Golgi vesicle-mediated transport(GO:0060628) |
| 0.1 | 5.2 | GO:0000188 | inactivation of MAPK activity(GO:0000188) |
| 0.1 | 0.3 | GO:0033025 | mast cell homeostasis(GO:0033023) mast cell apoptotic process(GO:0033024) regulation of mast cell apoptotic process(GO:0033025) regulation of mast cell proliferation(GO:0070666) positive regulation of mast cell proliferation(GO:0070668) |
| 0.1 | 0.8 | GO:0043932 | ossification involved in bone remodeling(GO:0043932) |
| 0.1 | 0.6 | GO:0006651 | diacylglycerol biosynthetic process(GO:0006651) |
| 0.1 | 0.7 | GO:0021562 | vestibulocochlear nerve development(GO:0021562) |
| 0.1 | 0.3 | GO:0051685 | maintenance of ER location(GO:0051685) |
| 0.1 | 0.3 | GO:0050720 | interleukin-1 beta biosynthetic process(GO:0050720) |
| 0.1 | 0.2 | GO:2001183 | negative regulation of interleukin-10 secretion(GO:2001180) negative regulation of interleukin-12 secretion(GO:2001183) |
| 0.1 | 0.3 | GO:0006756 | dADP phosphorylation(GO:0006174) dGDP phosphorylation(GO:0006186) AMP phosphorylation(GO:0006756) CDP phosphorylation(GO:0061508) dAMP phosphorylation(GO:0061565) CMP phosphorylation(GO:0061566) dCMP phosphorylation(GO:0061567) GDP phosphorylation(GO:0061568) UDP phosphorylation(GO:0061569) dCDP phosphorylation(GO:0061570) TDP phosphorylation(GO:0061571) |
| 0.1 | 1.6 | GO:0017187 | peptidyl-glutamic acid carboxylation(GO:0017187) protein carboxylation(GO:0018214) |
| 0.1 | 0.8 | GO:2001300 | lipoxin metabolic process(GO:2001300) |
| 0.1 | 0.4 | GO:0048850 | hypophysis morphogenesis(GO:0048850) |
| 0.1 | 0.4 | GO:0010760 | negative regulation of macrophage chemotaxis(GO:0010760) |
| 0.1 | 1.5 | GO:2001046 | positive regulation of integrin-mediated signaling pathway(GO:2001046) |
| 0.1 | 0.3 | GO:0035262 | gonad morphogenesis(GO:0035262) |
| 0.1 | 0.3 | GO:0019303 | D-ribose catabolic process(GO:0019303) |
| 0.1 | 0.2 | GO:1902161 | positive regulation of cyclic nucleotide-gated ion channel activity(GO:1902161) |
| 0.1 | 0.6 | GO:0030450 | regulation of complement activation, classical pathway(GO:0030450) negative regulation of complement activation, classical pathway(GO:0045959) regulation of opsonization(GO:1903027) |
| 0.1 | 0.3 | GO:0055014 | atrial cardiac muscle cell differentiation(GO:0055011) atrial cardiac muscle cell development(GO:0055014) |
| 0.1 | 1.0 | GO:0006975 | DNA damage induced protein phosphorylation(GO:0006975) |
| 0.1 | 0.2 | GO:0016094 | polyprenol biosynthetic process(GO:0016094) |
| 0.1 | 0.5 | GO:0035754 | B cell chemotaxis(GO:0035754) |
| 0.1 | 0.2 | GO:0038178 | complement component C5a signaling pathway(GO:0038178) negative regulation of granulocyte chemotaxis(GO:0071623) negative regulation of neutrophil chemotaxis(GO:0090024) negative regulation of neutrophil migration(GO:1902623) |
| 0.1 | 0.3 | GO:0051684 | maintenance of Golgi location(GO:0051684) |
| 0.0 | 1.1 | GO:0051764 | actin crosslink formation(GO:0051764) |
| 0.0 | 0.4 | GO:0002767 | immune response-inhibiting cell surface receptor signaling pathway(GO:0002767) |
| 0.0 | 0.1 | GO:0060164 | regulation of timing of neuron differentiation(GO:0060164) |
| 0.0 | 0.1 | GO:2000308 | iron assimilation(GO:0033212) iron assimilation by chelation and transport(GO:0033214) positive regulation of bone mineralization involved in bone maturation(GO:1900159) negative regulation of tumor necrosis factor (ligand) superfamily member 11 production(GO:2000308) |
| 0.0 | 0.5 | GO:0099612 | protein localization to axon(GO:0099612) |
| 0.0 | 0.5 | GO:0042492 | gamma-delta T cell differentiation(GO:0042492) |
| 0.0 | 0.4 | GO:0016191 | synaptic vesicle uncoating(GO:0016191) |
| 0.0 | 0.1 | GO:0044278 | cell wall disruption in other organism(GO:0044278) |
| 0.0 | 0.3 | GO:0098706 | ferric iron import into cell(GO:0097461) ferric iron import across plasma membrane(GO:0098706) |
| 0.0 | 0.7 | GO:0032802 | low-density lipoprotein particle receptor catabolic process(GO:0032802) |
| 0.0 | 0.3 | GO:0032696 | negative regulation of interleukin-13 production(GO:0032696) |
| 0.0 | 0.9 | GO:0060716 | labyrinthine layer blood vessel development(GO:0060716) |
| 0.0 | 0.2 | GO:0044855 | plasma membrane raft distribution(GO:0044855) plasma membrane raft localization(GO:0044856) plasma membrane raft polarization(GO:0044858) regulation of plasma membrane raft polarization(GO:1903906) |
| 0.0 | 0.2 | GO:0018343 | protein farnesylation(GO:0018343) |
| 0.0 | 0.7 | GO:0007021 | tubulin complex assembly(GO:0007021) |
| 0.0 | 0.3 | GO:0060295 | regulation of cilium movement involved in cell motility(GO:0060295) regulation of cilium beat frequency involved in ciliary motility(GO:0060296) regulation of cilium-dependent cell motility(GO:1902019) |
| 0.0 | 0.2 | GO:0033383 | geranyl diphosphate metabolic process(GO:0033383) geranyl diphosphate biosynthetic process(GO:0033384) farnesyl diphosphate biosynthetic process(GO:0045337) |
| 0.0 | 0.3 | GO:0036072 | intramembranous ossification(GO:0001957) direct ossification(GO:0036072) |
| 0.0 | 0.6 | GO:0032291 | central nervous system myelination(GO:0022010) axon ensheathment in central nervous system(GO:0032291) |
| 0.0 | 1.1 | GO:0010811 | positive regulation of cell-substrate adhesion(GO:0010811) |
| 0.0 | 0.3 | GO:0017062 | respiratory chain complex III assembly(GO:0017062) mitochondrial respiratory chain complex III assembly(GO:0034551) mitochondrial respiratory chain complex III biogenesis(GO:0097033) |
| 0.0 | 0.2 | GO:0033132 | negative regulation of glucokinase activity(GO:0033132) negative regulation of hexokinase activity(GO:1903300) |
| 0.0 | 0.4 | GO:0046600 | negative regulation of centriole replication(GO:0046600) |
| 0.0 | 0.1 | GO:0030070 | insulin processing(GO:0030070) |
| 0.0 | 0.1 | GO:1901253 | negative regulation of intracellular transport of viral material(GO:1901253) |
| 0.0 | 0.2 | GO:0050915 | sensory perception of sour taste(GO:0050915) |
| 0.0 | 0.1 | GO:0006740 | NADPH regeneration(GO:0006740) |
| 0.0 | 0.1 | GO:2000196 | positive regulation of female gonad development(GO:2000196) |
| 0.0 | 0.3 | GO:0038063 | collagen-activated tyrosine kinase receptor signaling pathway(GO:0038063) |
| 0.0 | 0.3 | GO:0060235 | lens induction in camera-type eye(GO:0060235) |
| 0.0 | 0.4 | GO:0008090 | retrograde axonal transport(GO:0008090) |
| 0.0 | 0.2 | GO:0019075 | virus maturation(GO:0019075) |
| 0.0 | 0.4 | GO:0048245 | eosinophil chemotaxis(GO:0048245) |
| 0.0 | 0.1 | GO:0002874 | regulation of chronic inflammatory response to antigenic stimulus(GO:0002874) |
| 0.0 | 0.1 | GO:0019255 | glucose 1-phosphate metabolic process(GO:0019255) |
| 0.0 | 0.1 | GO:0021529 | spinal cord oligodendrocyte cell differentiation(GO:0021529) spinal cord oligodendrocyte cell fate specification(GO:0021530) |
| 0.0 | 0.2 | GO:2000124 | regulation of endocannabinoid signaling pathway(GO:2000124) |
| 0.0 | 0.3 | GO:0035542 | regulation of SNARE complex assembly(GO:0035542) |
| 0.0 | 0.1 | GO:0060574 | intestinal epithelial cell maturation(GO:0060574) |
| 0.0 | 0.2 | GO:2000857 | positive regulation of mineralocorticoid secretion(GO:2000857) positive regulation of aldosterone secretion(GO:2000860) |
| 0.0 | 0.1 | GO:1902616 | acyl carnitine transport(GO:0006844) acyl carnitine transmembrane transport(GO:1902616) |
| 0.0 | 0.1 | GO:0035995 | detection of muscle stretch(GO:0035995) |
| 0.0 | 0.4 | GO:0019321 | pentose metabolic process(GO:0019321) |
| 0.0 | 0.1 | GO:0006447 | regulation of translational initiation by iron(GO:0006447) |
| 0.0 | 0.1 | GO:0061302 | smooth muscle cell-matrix adhesion(GO:0061302) |
| 0.0 | 0.2 | GO:0035234 | ectopic germ cell programmed cell death(GO:0035234) |
| 0.0 | 0.2 | GO:0035799 | ureter maturation(GO:0035799) |
| 0.0 | 1.2 | GO:0007520 | myoblast fusion(GO:0007520) |
| 0.0 | 0.1 | GO:0031642 | negative regulation of myelination(GO:0031642) |
| 0.0 | 0.1 | GO:0032625 | interleukin-21 production(GO:0032625) interleukin-21 secretion(GO:0072619) |
| 0.0 | 0.0 | GO:1900365 | positive regulation of mRNA polyadenylation(GO:1900365) |
| 0.0 | 0.1 | GO:0052651 | monoacylglycerol metabolic process(GO:0046462) monoacylglycerol catabolic process(GO:0052651) |
| 0.0 | 0.8 | GO:0015813 | L-glutamate transport(GO:0015813) |
| 0.0 | 0.3 | GO:0035721 | intraciliary retrograde transport(GO:0035721) |
| 0.0 | 0.5 | GO:1900745 | positive regulation of p38MAPK cascade(GO:1900745) |
| 0.0 | 0.2 | GO:0038028 | insulin receptor signaling pathway via phosphatidylinositol 3-kinase(GO:0038028) |
| 0.0 | 0.1 | GO:0080154 | regulation of fertilization(GO:0080154) |
| 0.0 | 0.1 | GO:0046125 | thymidine metabolic process(GO:0046104) pyrimidine deoxyribonucleoside metabolic process(GO:0046125) |
| 0.0 | 0.4 | GO:0018298 | protein-chromophore linkage(GO:0018298) |
| 0.0 | 0.0 | GO:0044111 | development involved in symbiotic interaction(GO:0044111) |
| 0.0 | 0.3 | GO:0048681 | negative regulation of axon regeneration(GO:0048681) |
| 0.0 | 0.3 | GO:0036066 | protein O-linked fucosylation(GO:0036066) |
| 0.0 | 0.2 | GO:0097647 | calcitonin family receptor signaling pathway(GO:0097646) amylin receptor signaling pathway(GO:0097647) |
| 0.0 | 0.2 | GO:0035865 | cellular response to potassium ion(GO:0035865) |
| 0.0 | 0.1 | GO:0006620 | posttranslational protein targeting to membrane(GO:0006620) |
| 0.0 | 0.1 | GO:1902766 | skeletal muscle satellite cell migration(GO:1902766) |
| 0.0 | 0.2 | GO:0006013 | mannose metabolic process(GO:0006013) |
| 0.0 | 0.2 | GO:0010739 | positive regulation of protein kinase A signaling(GO:0010739) |
| 0.0 | 0.1 | GO:0042796 | snRNA transcription from RNA polymerase III promoter(GO:0042796) |
| 0.0 | 0.2 | GO:0010724 | regulation of definitive erythrocyte differentiation(GO:0010724) |
| 0.0 | 0.2 | GO:0090050 | positive regulation of cell migration involved in sprouting angiogenesis(GO:0090050) |
| 0.0 | 0.1 | GO:1904647 | response to rotenone(GO:1904647) |
| 0.0 | 0.1 | GO:0097338 | response to clozapine(GO:0097338) |
| 0.0 | 0.3 | GO:0070527 | platelet aggregation(GO:0070527) |
| 0.0 | 0.2 | GO:0045617 | negative regulation of keratinocyte differentiation(GO:0045617) |
| 0.0 | 0.5 | GO:0045332 | phospholipid translocation(GO:0045332) |
| 0.0 | 0.2 | GO:0023035 | CD40 signaling pathway(GO:0023035) |
| 0.0 | 0.3 | GO:0033148 | positive regulation of intracellular estrogen receptor signaling pathway(GO:0033148) |
| 0.0 | 0.1 | GO:0038060 | nitric oxide-cGMP-mediated signaling pathway(GO:0038060) |
| 0.0 | 0.1 | GO:0055129 | L-proline biosynthetic process(GO:0055129) |
| 0.0 | 0.2 | GO:0039536 | negative regulation of RIG-I signaling pathway(GO:0039536) |
| 0.0 | 0.2 | GO:0015816 | glycine transport(GO:0015816) |
| 0.0 | 0.0 | GO:0006669 | sphinganine-1-phosphate biosynthetic process(GO:0006669) |
| 0.0 | 0.2 | GO:0014827 | intestine smooth muscle contraction(GO:0014827) |
| 0.0 | 0.1 | GO:0007341 | penetration of zona pellucida(GO:0007341) |
| 0.0 | 0.7 | GO:0050690 | regulation of defense response to virus by virus(GO:0050690) |
| 0.0 | 0.0 | GO:2000296 | negative regulation of hydrogen peroxide catabolic process(GO:2000296) |
| 0.0 | 0.3 | GO:0010801 | negative regulation of peptidyl-threonine phosphorylation(GO:0010801) |
| 0.0 | 0.1 | GO:0070213 | protein auto-ADP-ribosylation(GO:0070213) |
| 0.0 | 0.3 | GO:0048266 | behavioral response to pain(GO:0048266) |
| 0.0 | 0.1 | GO:0035701 | hematopoietic stem cell migration(GO:0035701) |
| 0.0 | 0.1 | GO:0044245 | polysaccharide digestion(GO:0044245) |
| 0.0 | 0.1 | GO:0009253 | peptidoglycan metabolic process(GO:0000270) peptidoglycan catabolic process(GO:0009253) |
| 0.0 | 0.2 | GO:0000290 | deadenylation-dependent decapping of nuclear-transcribed mRNA(GO:0000290) |
| 0.0 | 0.1 | GO:0051611 | negative regulation of neurotransmitter uptake(GO:0051581) serotonin uptake(GO:0051610) regulation of serotonin uptake(GO:0051611) negative regulation of serotonin uptake(GO:0051612) |
| 0.0 | 0.5 | GO:0016339 | calcium-dependent cell-cell adhesion via plasma membrane cell adhesion molecules(GO:0016339) |
| 0.0 | 0.2 | GO:0040016 | embryonic cleavage(GO:0040016) |
| 0.0 | 0.0 | GO:0002925 | positive regulation of humoral immune response mediated by circulating immunoglobulin(GO:0002925) |
| 0.0 | 0.1 | GO:0039516 | modulation by virus of host molecular function(GO:0039506) suppression by virus of host molecular function(GO:0039507) suppression by virus of host catalytic activity(GO:0039513) modulation by virus of host catalytic activity(GO:0039516) suppression by virus of host cysteine-type endopeptidase activity involved in apoptotic process(GO:0039650) negative regulation by symbiont of host catalytic activity(GO:0052053) negative regulation by symbiont of host molecular function(GO:0052056) modulation by symbiont of host catalytic activity(GO:0052148) |
| 0.0 | 0.0 | GO:0071638 | negative regulation of monocyte chemotactic protein-1 production(GO:0071638) |
| 0.0 | 0.1 | GO:0019344 | cysteine biosynthetic process(GO:0019344) |
| 0.0 | 0.5 | GO:0071377 | cellular response to glucagon stimulus(GO:0071377) |
| 0.0 | 0.1 | GO:1901475 | pyruvate transport(GO:0006848) pyruvate transmembrane transport(GO:1901475) |
| 0.0 | 0.1 | GO:0051454 | pH elevation(GO:0045852) intracellular pH elevation(GO:0051454) |
| 0.0 | 0.8 | GO:0000186 | activation of MAPKK activity(GO:0000186) |
| 0.0 | 0.2 | GO:0051775 | response to redox state(GO:0051775) |
| 0.0 | 0.1 | GO:0051127 | positive regulation of actin nucleation(GO:0051127) |
| 0.0 | 0.1 | GO:1904293 | negative regulation of ERAD pathway(GO:1904293) |
| 0.0 | 0.2 | GO:0090129 | positive regulation of synapse maturation(GO:0090129) |
| 0.0 | 0.2 | GO:0010447 | response to acidic pH(GO:0010447) |
| 0.0 | 0.1 | GO:2000623 | regulation of nuclear-transcribed mRNA catabolic process, nonsense-mediated decay(GO:2000622) negative regulation of nuclear-transcribed mRNA catabolic process, nonsense-mediated decay(GO:2000623) |
| 0.0 | 0.2 | GO:1904778 | regulation of protein localization to cell cortex(GO:1904776) positive regulation of protein localization to cell cortex(GO:1904778) |
| 0.0 | 0.1 | GO:0098532 | histone H3-K27 trimethylation(GO:0098532) |
| 0.0 | 0.1 | GO:0002074 | extraocular skeletal muscle development(GO:0002074) |
| 0.0 | 0.1 | GO:0034421 | post-translational protein acetylation(GO:0034421) |
Gene overrepresentation in cellular_component category:
| Log-likelihood per target | Total log-likelihood | Term | Description |
|---|---|---|---|
| 0.7 | 2.1 | GO:0005588 | collagen type V trimer(GO:0005588) |
| 0.3 | 1.8 | GO:0001652 | granular component(GO:0001652) |
| 0.3 | 4.4 | GO:0097418 | neurofibrillary tangle(GO:0097418) |
| 0.2 | 2.5 | GO:0098647 | collagen type VI trimer(GO:0005589) collagen beaded filament(GO:0098647) |
| 0.2 | 0.5 | GO:1990667 | PCSK9-AnxA2 complex(GO:1990667) |
| 0.2 | 1.2 | GO:0000110 | nucleotide-excision repair factor 1 complex(GO:0000110) |
| 0.2 | 1.5 | GO:0071953 | elastic fiber(GO:0071953) |
| 0.2 | 0.9 | GO:0030485 | smooth muscle contractile fiber(GO:0030485) |
| 0.1 | 0.4 | GO:0031673 | H zone(GO:0031673) |
| 0.1 | 0.3 | GO:0032002 | interleukin-28 receptor complex(GO:0032002) |
| 0.1 | 0.6 | GO:0031233 | intrinsic component of external side of plasma membrane(GO:0031233) |
| 0.1 | 0.8 | GO:0005883 | neurofilament(GO:0005883) |
| 0.1 | 1.3 | GO:0005862 | muscle thin filament tropomyosin(GO:0005862) |
| 0.1 | 3.0 | GO:0000421 | autophagosome membrane(GO:0000421) |
| 0.1 | 0.4 | GO:1990769 | proximal neuron projection(GO:1990769) |
| 0.1 | 0.6 | GO:1990111 | spermatoproteasome complex(GO:1990111) |
| 0.1 | 1.0 | GO:0030478 | actin cap(GO:0030478) |
| 0.1 | 0.2 | GO:0009330 | DNA topoisomerase complex (ATP-hydrolyzing)(GO:0009330) |
| 0.1 | 0.2 | GO:0005608 | laminin-3 complex(GO:0005608) |
| 0.1 | 0.7 | GO:0097487 | multivesicular body, internal vesicle(GO:0097487) |
| 0.1 | 0.2 | GO:0005965 | protein farnesyltransferase complex(GO:0005965) |
| 0.0 | 0.1 | GO:0070557 | PCNA-p21 complex(GO:0070557) |
| 0.0 | 0.7 | GO:0008385 | IkappaB kinase complex(GO:0008385) |
| 0.0 | 0.7 | GO:0097512 | cardiac myofibril(GO:0097512) |
| 0.0 | 0.7 | GO:0030122 | AP-2 adaptor complex(GO:0030122) |
| 0.0 | 0.2 | GO:0008537 | proteasome activator complex(GO:0008537) |
| 0.0 | 0.2 | GO:0071598 | neuronal ribonucleoprotein granule(GO:0071598) |
| 0.0 | 0.2 | GO:0031205 | endoplasmic reticulum Sec complex(GO:0031205) |
| 0.0 | 0.3 | GO:0036128 | CatSper complex(GO:0036128) |
| 0.0 | 0.3 | GO:0030991 | intraciliary transport particle A(GO:0030991) |
| 0.0 | 0.6 | GO:0001518 | voltage-gated sodium channel complex(GO:0001518) |
| 0.0 | 0.2 | GO:0002081 | outer acrosomal membrane(GO:0002081) |
| 0.0 | 0.1 | GO:0071062 | rough endoplasmic reticulum lumen(GO:0048237) alphav-beta3 integrin-vitronectin complex(GO:0071062) |
| 0.0 | 0.1 | GO:0070939 | Dsl1p complex(GO:0070939) |
| 0.0 | 0.3 | GO:0005579 | membrane attack complex(GO:0005579) |
| 0.0 | 0.2 | GO:0000836 | Hrd1p ubiquitin ligase complex(GO:0000836) |
| 0.0 | 0.5 | GO:0000177 | cytoplasmic exosome (RNase complex)(GO:0000177) |
| 0.0 | 0.2 | GO:0000015 | phosphopyruvate hydratase complex(GO:0000015) |
| 0.0 | 0.1 | GO:1990015 | mesaxon(GO:0097453) ensheathing process(GO:1990015) |
| 0.0 | 0.5 | GO:0031045 | dense core granule(GO:0031045) |
| 0.0 | 0.3 | GO:0005750 | mitochondrial respiratory chain complex III(GO:0005750) respiratory chain complex III(GO:0045275) |
| 0.0 | 1.3 | GO:0031941 | filamentous actin(GO:0031941) |
| 0.0 | 0.2 | GO:1903439 | calcitonin family receptor complex(GO:1903439) amylin receptor complex(GO:1903440) |
| 0.0 | 0.3 | GO:0030126 | COPI vesicle coat(GO:0030126) |
| 0.0 | 0.1 | GO:0070435 | Shc-EGFR complex(GO:0070435) |
| 0.0 | 0.1 | GO:0005602 | complement component C1 complex(GO:0005602) |
| 0.0 | 0.2 | GO:0033269 | internode region of axon(GO:0033269) |
| 0.0 | 0.4 | GO:0097431 | mitotic spindle pole(GO:0097431) |
| 0.0 | 0.7 | GO:0000145 | exocyst(GO:0000145) |
| 0.0 | 0.1 | GO:0036021 | endolysosome lumen(GO:0036021) |
| 0.0 | 0.1 | GO:0097013 | phagocytic vesicle lumen(GO:0097013) |
| 0.0 | 0.1 | GO:0070876 | SOSS complex(GO:0070876) |
| 0.0 | 0.1 | GO:0031251 | PAN complex(GO:0031251) |
| 0.0 | 0.5 | GO:0031083 | BLOC-1 complex(GO:0031083) |
| 0.0 | 0.1 | GO:0005863 | striated muscle myosin thick filament(GO:0005863) |
| 0.0 | 1.8 | GO:0031093 | platelet alpha granule lumen(GO:0031093) |
| 0.0 | 0.3 | GO:0036038 | MKS complex(GO:0036038) |
| 0.0 | 1.1 | GO:0031672 | A band(GO:0031672) |
| 0.0 | 0.5 | GO:0032391 | photoreceptor connecting cilium(GO:0032391) |
| 0.0 | 0.7 | GO:0042571 | immunoglobulin complex, circulating(GO:0042571) |
| 0.0 | 0.1 | GO:0070847 | core mediator complex(GO:0070847) |
| 0.0 | 1.4 | GO:0005884 | actin filament(GO:0005884) |
| 0.0 | 0.0 | GO:0071682 | endocytic vesicle lumen(GO:0071682) |
| 0.0 | 0.2 | GO:0008091 | spectrin(GO:0008091) |
| 0.0 | 0.0 | GO:0031838 | haptoglobin-hemoglobin complex(GO:0031838) |
| 0.0 | 0.2 | GO:0043197 | dendritic spine(GO:0043197) neuron spine(GO:0044309) |
| 0.0 | 1.2 | GO:0005581 | collagen trimer(GO:0005581) |
| 0.0 | 0.2 | GO:0000813 | ESCRT I complex(GO:0000813) |
Gene overrepresentation in molecular_function category:
| Log-likelihood per target | Total log-likelihood | Term | Description |
|---|---|---|---|
| 1.0 | 3.9 | GO:0047391 | alkylglycerophosphoethanolamine phosphodiesterase activity(GO:0047391) |
| 0.3 | 0.8 | GO:0070538 | oleic acid binding(GO:0070538) |
| 0.2 | 0.5 | GO:0016493 | C-C chemokine receptor activity(GO:0016493) |
| 0.2 | 4.4 | GO:0051787 | misfolded protein binding(GO:0051787) |
| 0.2 | 0.8 | GO:0016404 | 15-hydroxyprostaglandin dehydrogenase (NAD+) activity(GO:0016404) |
| 0.2 | 1.2 | GO:1990599 | 3' overhang single-stranded DNA endodeoxyribonuclease activity(GO:1990599) |
| 0.2 | 5.3 | GO:0001965 | G-protein alpha-subunit binding(GO:0001965) |
| 0.2 | 0.7 | GO:0031727 | CCR2 chemokine receptor binding(GO:0031727) |
| 0.1 | 0.3 | GO:0005173 | stem cell factor receptor binding(GO:0005173) |
| 0.1 | 1.4 | GO:0035374 | chondroitin sulfate binding(GO:0035374) |
| 0.1 | 0.5 | GO:0003854 | 3-beta-hydroxy-delta5-steroid dehydrogenase activity(GO:0003854) |
| 0.1 | 0.8 | GO:0038085 | vascular endothelial growth factor binding(GO:0038085) |
| 0.1 | 0.2 | GO:0042007 | interleukin-18 binding(GO:0042007) |
| 0.1 | 0.1 | GO:0046899 | nucleoside triphosphate adenylate kinase activity(GO:0046899) |
| 0.1 | 0.5 | GO:0019834 | phospholipase A2 inhibitor activity(GO:0019834) |
| 0.1 | 2.0 | GO:0004697 | protein kinase C activity(GO:0004697) |
| 0.1 | 0.4 | GO:0004720 | protein-lysine 6-oxidase activity(GO:0004720) |
| 0.1 | 1.3 | GO:0005522 | profilin binding(GO:0005522) |
| 0.1 | 0.3 | GO:0038062 | protein tyrosine kinase collagen receptor activity(GO:0038062) |
| 0.1 | 1.6 | GO:0004707 | MAP kinase activity(GO:0004707) |
| 0.1 | 0.2 | GO:0004362 | glutathione-disulfide reductase activity(GO:0004362) |
| 0.1 | 0.2 | GO:0005260 | channel-conductance-controlling ATPase activity(GO:0005260) |
| 0.1 | 0.2 | GO:0019770 | IgG receptor activity(GO:0019770) |
| 0.1 | 0.2 | GO:0004507 | steroid 11-beta-monooxygenase activity(GO:0004507) corticosterone 18-monooxygenase activity(GO:0047783) |
| 0.1 | 0.2 | GO:0002094 | polyprenyltransferase activity(GO:0002094) |
| 0.1 | 0.2 | GO:0004660 | protein farnesyltransferase activity(GO:0004660) |
| 0.1 | 0.2 | GO:0004878 | complement component C5a receptor activity(GO:0004878) |
| 0.1 | 0.2 | GO:0033867 | Fas-activated serine/threonine kinase activity(GO:0033867) |
| 0.1 | 0.8 | GO:0044213 | intronic transcription regulatory region sequence-specific DNA binding(GO:0001161) intronic transcription regulatory region DNA binding(GO:0044213) |
| 0.0 | 0.1 | GO:1904455 | ubiquitin-specific protease activity involved in negative regulation of ERAD pathway(GO:1904455) |
| 0.0 | 0.1 | GO:0097493 | structural molecule activity conferring elasticity(GO:0097493) |
| 0.0 | 0.4 | GO:0008158 | hedgehog receptor activity(GO:0008158) |
| 0.0 | 0.1 | GO:0019912 | cyclin-dependent protein kinase activating kinase activity(GO:0019912) |
| 0.0 | 0.1 | GO:0004157 | dihydropyrimidinase activity(GO:0004157) |
| 0.0 | 0.3 | GO:0052851 | cupric reductase activity(GO:0008823) ferric-chelate reductase (NADPH) activity(GO:0052851) |
| 0.0 | 0.3 | GO:0016681 | ubiquinol-cytochrome-c reductase activity(GO:0008121) oxidoreductase activity, acting on diphenols and related substances as donors, cytochrome as acceptor(GO:0016681) |
| 0.0 | 0.1 | GO:0008746 | NAD(P)+ transhydrogenase activity(GO:0008746) oxidoreductase activity, acting on NAD(P)H, NAD(P) as acceptor(GO:0016652) |
| 0.0 | 1.4 | GO:0001968 | fibronectin binding(GO:0001968) |
| 0.0 | 0.2 | GO:0034714 | type III transforming growth factor beta receptor binding(GO:0034714) |
| 0.0 | 2.6 | GO:0050840 | extracellular matrix binding(GO:0050840) |
| 0.0 | 0.2 | GO:0004616 | phosphogluconate dehydrogenase (decarboxylating) activity(GO:0004616) |
| 0.0 | 0.2 | GO:1990050 | phosphatidic acid transporter activity(GO:1990050) |
| 0.0 | 0.2 | GO:0001515 | opioid peptide activity(GO:0001515) |
| 0.0 | 0.2 | GO:0004161 | dimethylallyltranstransferase activity(GO:0004161) geranyltranstransferase activity(GO:0004337) |
| 0.0 | 0.1 | GO:0043812 | phosphatidylinositol-4-phosphate phosphatase activity(GO:0043812) |
| 0.0 | 0.5 | GO:0042301 | phosphate ion binding(GO:0042301) |
| 0.0 | 0.2 | GO:0061133 | endopeptidase activator activity(GO:0061133) |
| 0.0 | 0.5 | GO:0019911 | structural constituent of myelin sheath(GO:0019911) |
| 0.0 | 0.1 | GO:0004797 | thymidine kinase activity(GO:0004797) |
| 0.0 | 0.4 | GO:0001206 | transcriptional repressor activity, RNA polymerase II distal enhancer sequence-specific binding(GO:0001206) |
| 0.0 | 0.2 | GO:0098519 | nucleotide phosphatase activity, acting on free nucleotides(GO:0098519) |
| 0.0 | 0.7 | GO:0035615 | clathrin adaptor activity(GO:0035615) endocytic adaptor activity(GO:0098748) |
| 0.0 | 0.2 | GO:0004614 | phosphoglucomutase activity(GO:0004614) |
| 0.0 | 0.4 | GO:0008020 | G-protein coupled photoreceptor activity(GO:0008020) |
| 0.0 | 1.9 | GO:0001221 | transcription cofactor binding(GO:0001221) |
| 0.0 | 0.2 | GO:0030109 | HLA-B specific inhibitory MHC class I receptor activity(GO:0030109) |
| 0.0 | 0.3 | GO:0050145 | nucleoside phosphate kinase activity(GO:0050145) |
| 0.0 | 0.2 | GO:0039552 | RIG-I binding(GO:0039552) |
| 0.0 | 0.2 | GO:0004634 | phosphopyruvate hydratase activity(GO:0004634) |
| 0.0 | 0.3 | GO:0004704 | NF-kappaB-inducing kinase activity(GO:0004704) |
| 0.0 | 0.1 | GO:0015227 | acyl carnitine transmembrane transporter activity(GO:0015227) |
| 0.0 | 0.1 | GO:0004694 | eukaryotic translation initiation factor 2alpha kinase activity(GO:0004694) |
| 0.0 | 0.4 | GO:0008140 | cAMP response element binding protein binding(GO:0008140) |
| 0.0 | 0.6 | GO:0031402 | sodium ion binding(GO:0031402) |
| 0.0 | 0.2 | GO:0030628 | pre-mRNA 3'-splice site binding(GO:0030628) |
| 0.0 | 0.2 | GO:0097643 | amylin receptor activity(GO:0097643) |
| 0.0 | 0.2 | GO:0004534 | 5'-3' exoribonuclease activity(GO:0004534) |
| 0.0 | 0.7 | GO:0005212 | structural constituent of eye lens(GO:0005212) |
| 0.0 | 0.2 | GO:0003720 | telomerase activity(GO:0003720) RNA-directed DNA polymerase activity(GO:0003964) |
| 0.0 | 0.1 | GO:0005477 | pyruvate secondary active transmembrane transporter activity(GO:0005477) |
| 0.0 | 0.3 | GO:0051371 | muscle alpha-actinin binding(GO:0051371) |
| 0.0 | 0.1 | GO:0048408 | epidermal growth factor binding(GO:0048408) |
| 0.0 | 0.2 | GO:0003917 | DNA topoisomerase type I activity(GO:0003917) |
| 0.0 | 0.1 | GO:0008808 | cardiolipin synthase activity(GO:0008808) phosphatidyltransferase activity(GO:0030572) CDP-diacylglycerol-phosphatidylglycerol phosphatidyltransferase activity(GO:0043337) |
| 0.0 | 0.2 | GO:0015187 | glycine transmembrane transporter activity(GO:0015187) |
| 0.0 | 0.3 | GO:1990459 | transferrin receptor binding(GO:1990459) |
| 0.0 | 0.7 | GO:0004709 | MAP kinase kinase kinase activity(GO:0004709) |
| 0.0 | 0.1 | GO:0008192 | RNA guanylyltransferase activity(GO:0008192) |
| 0.0 | 2.2 | GO:0005201 | extracellular matrix structural constituent(GO:0005201) |
| 0.0 | 0.1 | GO:0004735 | pyrroline-5-carboxylate reductase activity(GO:0004735) |
| 0.0 | 0.5 | GO:0004012 | phospholipid-translocating ATPase activity(GO:0004012) |
| 0.0 | 0.7 | GO:0019200 | carbohydrate kinase activity(GO:0019200) |
| 0.0 | 0.4 | GO:0004859 | phospholipase inhibitor activity(GO:0004859) |
| 0.0 | 0.2 | GO:0015450 | P-P-bond-hydrolysis-driven protein transmembrane transporter activity(GO:0015450) |
| 0.0 | 0.3 | GO:0017049 | GTP-Rho binding(GO:0017049) |
| 0.0 | 0.2 | GO:0001758 | retinal dehydrogenase activity(GO:0001758) |
| 0.0 | 1.7 | GO:0008307 | structural constituent of muscle(GO:0008307) |
| 0.0 | 0.6 | GO:0017147 | Wnt-protein binding(GO:0017147) |
| 0.0 | 0.2 | GO:0045159 | myosin II binding(GO:0045159) |
| 0.0 | 1.0 | GO:0001784 | phosphotyrosine binding(GO:0001784) |
| 0.0 | 0.5 | GO:0004298 | threonine-type endopeptidase activity(GO:0004298) threonine-type peptidase activity(GO:0070003) |
| 0.0 | 0.3 | GO:0047372 | acylglycerol lipase activity(GO:0047372) |
| 0.0 | 0.2 | GO:0043176 | amine binding(GO:0043176) serotonin binding(GO:0051378) |
| 0.0 | 0.2 | GO:0042731 | PH domain binding(GO:0042731) |
| 0.0 | 0.6 | GO:0004435 | phosphatidylinositol phospholipase C activity(GO:0004435) |
| 0.0 | 0.3 | GO:0042287 | MHC protein binding(GO:0042287) |
| 0.0 | 0.1 | GO:0004505 | phenylalanine 4-monooxygenase activity(GO:0004505) |
| 0.0 | 0.2 | GO:0008179 | adenylate cyclase binding(GO:0008179) |
| 0.0 | 0.2 | GO:1904264 | ubiquitin protein ligase activity involved in ERAD pathway(GO:1904264) |
| 0.0 | 0.7 | GO:0034987 | immunoglobulin receptor binding(GO:0034987) |
| 0.0 | 0.2 | GO:0004143 | diacylglycerol kinase activity(GO:0004143) |
| 0.0 | 0.3 | GO:0005527 | macrolide binding(GO:0005527) FK506 binding(GO:0005528) |
| 0.0 | 0.2 | GO:0097109 | neuroligin family protein binding(GO:0097109) |
| 0.0 | 0.2 | GO:0016174 | NAD(P)H oxidase activity(GO:0016174) |
| 0.0 | 0.3 | GO:0008331 | high voltage-gated calcium channel activity(GO:0008331) |
| 0.0 | 0.0 | GO:0046556 | alpha-L-arabinofuranosidase activity(GO:0046556) |
| 0.0 | 0.1 | GO:0005113 | patched binding(GO:0005113) |
| 0.0 | 0.0 | GO:0017057 | glucose-6-phosphate dehydrogenase activity(GO:0004345) 6-phosphogluconolactonase activity(GO:0017057) |
| 0.0 | 0.1 | GO:0008970 | phosphatidylcholine 1-acylhydrolase activity(GO:0008970) |
Gene overrepresentation in C2:CP category:
| Log-likelihood per target | Total log-likelihood | Term | Description |
|---|---|---|---|
| 0.1 | 2.3 | PID HDAC CLASSIII PATHWAY | Signaling events mediated by HDAC Class III |
| 0.1 | 1.9 | PID HEDGEHOG 2PATHWAY | Signaling events mediated by the Hedgehog family |
| 0.1 | 1.0 | PID P38 GAMMA DELTA PATHWAY | Signaling mediated by p38-gamma and p38-delta |
| 0.0 | 3.0 | ST GA13 PATHWAY | G alpha 13 Pathway |
| 0.0 | 0.8 | PID VEGF VEGFR PATHWAY | VEGF and VEGFR signaling network |
| 0.0 | 2.1 | NABA PROTEOGLYCANS | Genes encoding proteoglycans |
| 0.0 | 2.0 | NABA COLLAGENS | Genes encoding collagen proteins |
| 0.0 | 1.2 | PID P38 MKK3 6PATHWAY | p38 MAPK signaling pathway |
| 0.0 | 4.2 | PID MYC REPRESS PATHWAY | Validated targets of C-MYC transcriptional repression |
| 0.0 | 0.7 | PID ARF 3PATHWAY | Arf1 pathway |
| 0.0 | 1.4 | PID IL12 2PATHWAY | IL12-mediated signaling events |
| 0.0 | 1.1 | PID IL23 PATHWAY | IL23-mediated signaling events |
| 0.0 | 0.6 | PID WNT SIGNALING PATHWAY | Wnt signaling network |
| 0.0 | 1.0 | PID HDAC CLASSII PATHWAY | Signaling events mediated by HDAC Class II |
| 0.0 | 1.3 | PID FCER1 PATHWAY | Fc-epsilon receptor I signaling in mast cells |
| 0.0 | 1.0 | ST PHOSPHOINOSITIDE 3 KINASE PATHWAY | PI3K Pathway |
| 0.0 | 0.6 | PID RAS PATHWAY | Regulation of Ras family activation |
| 0.0 | 0.6 | ST JNK MAPK PATHWAY | JNK MAPK Pathway |
| 0.0 | 0.6 | PID AURORA A PATHWAY | Aurora A signaling |
| 0.0 | 1.0 | PID ILK PATHWAY | Integrin-linked kinase signaling |
| 0.0 | 0.8 | PID ERBB1 INTERNALIZATION PATHWAY | Internalization of ErbB1 |
| 0.0 | 0.2 | PID ERBB1 RECEPTOR PROXIMAL PATHWAY | EGF receptor (ErbB1) signaling pathway |
| 0.0 | 2.8 | NABA ECM AFFILIATED | Genes encoding proteins affiliated structurally or functionally to extracellular matrix proteins |
| 0.0 | 0.5 | PID ANGIOPOIETIN RECEPTOR PATHWAY | Angiopoietin receptor Tie2-mediated signaling |
| 0.0 | 0.2 | PID INTEGRIN4 PATHWAY | Alpha6 beta4 integrin-ligand interactions |
| 0.0 | 0.2 | PID TRAIL PATHWAY | TRAIL signaling pathway |
| 0.0 | 0.7 | PID HNF3A PATHWAY | FOXA1 transcription factor network |
Gene overrepresentation in C2:CP:REACTOME category:
| Log-likelihood per target | Total log-likelihood | Term | Description |
|---|---|---|---|
| 0.1 | 1.6 | REACTOME GAMMA CARBOXYLATION TRANSPORT AND AMINO TERMINAL CLEAVAGE OF PROTEINS | Genes involved in Gamma-carboxylation, transport, and amino-terminal cleavage of proteins |
| 0.1 | 2.5 | REACTOME CS DS DEGRADATION | Genes involved in CS/DS degradation |
| 0.1 | 1.7 | REACTOME DSCAM INTERACTIONS | Genes involved in DSCAM interactions |
| 0.1 | 2.3 | REACTOME CRMPS IN SEMA3A SIGNALING | Genes involved in CRMPs in Sema3A signaling |
| 0.1 | 4.8 | REACTOME G ALPHA Z SIGNALLING EVENTS | Genes involved in G alpha (z) signalling events |
| 0.1 | 2.8 | REACTOME SPHINGOLIPID DE NOVO BIOSYNTHESIS | Genes involved in Sphingolipid de novo biosynthesis |
| 0.1 | 1.9 | REACTOME SIGNALING BY NODAL | Genes involved in Signaling by NODAL |
| 0.1 | 0.6 | REACTOME SYNTHESIS OF BILE ACIDS AND BILE SALTS VIA 24 HYDROXYCHOLESTEROL | Genes involved in Synthesis of bile acids and bile salts via 24-hydroxycholesterol |
| 0.0 | 0.8 | REACTOME IL 6 SIGNALING | Genes involved in Interleukin-6 signaling |
| 0.0 | 2.7 | REACTOME SMOOTH MUSCLE CONTRACTION | Genes involved in Smooth Muscle Contraction |
| 0.0 | 1.2 | REACTOME FORMATION OF INCISION COMPLEX IN GG NER | Genes involved in Formation of incision complex in GG-NER |
| 0.0 | 0.7 | REACTOME GAP JUNCTION DEGRADATION | Genes involved in Gap junction degradation |
| 0.0 | 2.1 | REACTOME NCAM1 INTERACTIONS | Genes involved in NCAM1 interactions |
| 0.0 | 0.4 | REACTOME OPSINS | Genes involved in Opsins |
| 0.0 | 3.2 | REACTOME RESPONSE TO ELEVATED PLATELET CYTOSOLIC CA2 | Genes involved in Response to elevated platelet cytosolic Ca2+ |
| 0.0 | 0.3 | REACTOME REGULATION OF KIT SIGNALING | Genes involved in Regulation of KIT signaling |
| 0.0 | 0.5 | REACTOME ACTIVATION OF GENES BY ATF4 | Genes involved in Activation of Genes by ATF4 |
| 0.0 | 0.2 | REACTOME PRESYNAPTIC NICOTINIC ACETYLCHOLINE RECEPTORS | Genes involved in Presynaptic nicotinic acetylcholine receptors |
| 0.0 | 0.2 | REACTOME VITAMIN B5 PANTOTHENATE METABOLISM | Genes involved in Vitamin B5 (pantothenate) metabolism |
| 0.0 | 0.2 | REACTOME SYNTHESIS OF SUBSTRATES IN N GLYCAN BIOSYTHESIS | Genes involved in Synthesis of substrates in N-glycan biosythesis |
| 0.0 | 0.1 | REACTOME SYNTHESIS OF PIPS AT THE LATE ENDOSOME MEMBRANE | Genes involved in Synthesis of PIPs at the late endosome membrane |
| 0.0 | 1.0 | REACTOME VIF MEDIATED DEGRADATION OF APOBEC3G | Genes involved in Vif-mediated degradation of APOBEC3G |
| 0.0 | 0.2 | REACTOME SEROTONIN RECEPTORS | Genes involved in Serotonin receptors |
| 0.0 | 0.2 | REACTOME NFKB ACTIVATION THROUGH FADD RIP1 PATHWAY MEDIATED BY CASPASE 8 AND10 | Genes involved in NF-kB activation through FADD/RIP-1 pathway mediated by caspase-8 and -10 |
| 0.0 | 0.2 | REACTOME REGULATION OF INSULIN LIKE GROWTH FACTOR IGF ACTIVITY BY INSULIN LIKE GROWTH FACTOR BINDING PROTEINS IGFBPS | Genes involved in Regulation of Insulin-like Growth Factor (IGF) Activity by Insulin-like Growth Factor Binding Proteins (IGFBPs) |
| 0.0 | 0.4 | REACTOME LYSOSOME VESICLE BIOGENESIS | Genes involved in Lysosome Vesicle Biogenesis |
| 0.0 | 0.3 | REACTOME HORMONE SENSITIVE LIPASE HSL MEDIATED TRIACYLGLYCEROL HYDROLYSIS | Genes involved in Hormone-sensitive lipase (HSL)-mediated triacylglycerol hydrolysis |