Project
Epithelial-Mesenchymal Transition, human (Scheel, 2011)
Navigation
Downloads
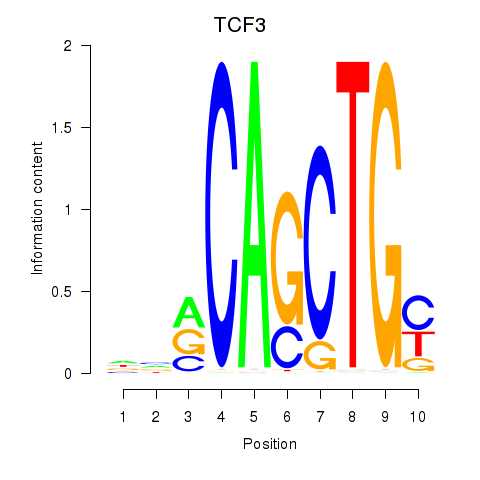
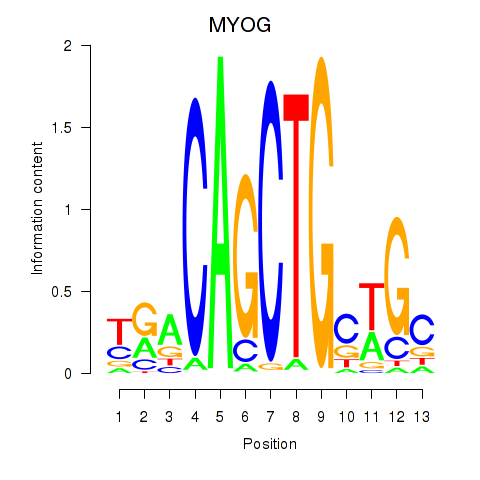
Results for TCF3_MYOG
Z-value: 1.52
Motif logo
Transcription factors associated with TCF3_MYOG
| Gene Symbol | Gene ID | Gene Info |
|---|---|---|
|
TCF3
|
ENSG00000071564.10 | TCF3 |
|
MYOG
|
ENSG00000122180.4 | MYOG |
Activity-expression correlation:
| Gene | Promoter | Pearson corr. coef. | P-value | Plot |
|---|---|---|---|---|
| MYOG | hg19_v2_chr1_-_203055129_203055164 | -0.62 | 1.0e-01 | Click! |
| TCF3 | hg19_v2_chr19_-_1652575_1652621 | -0.34 | 4.1e-01 | Click! |
Activity profile of TCF3_MYOG motif
Sorted Z-values of TCF3_MYOG motif
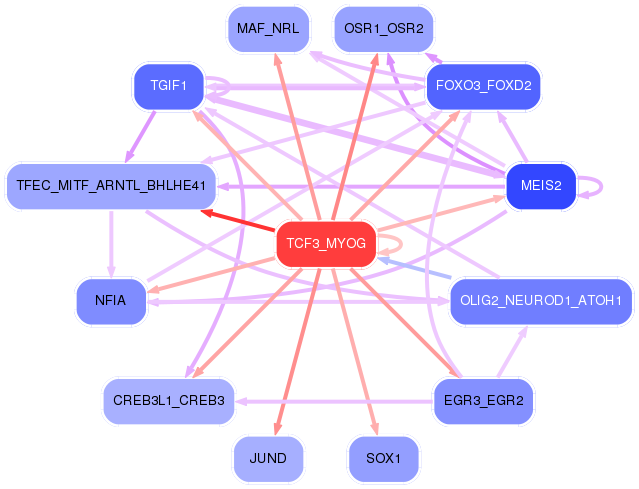
Network of associatons between targets according to the STRING database.

First level regulatory network of TCF3_MYOG
| Promoter | Score | Transcript | Gene | Gene Info |
|---|---|---|---|---|
| chr1_+_89990431 | 2.91 |
ENST00000330947.2 ENST00000358200.4 |
LRRC8B |
leucine rich repeat containing 8 family, member B |
| chrX_-_107018969 | 2.75 |
ENST00000372383.4 |
TSC22D3 |
TSC22 domain family, member 3 |
| chr14_-_92413353 | 2.70 |
ENST00000556154.1 |
FBLN5 |
fibulin 5 |
| chrX_+_86772787 | 2.66 |
ENST00000373114.4 |
KLHL4 |
kelch-like family member 4 |
| chr3_+_69788576 | 2.59 |
ENST00000352241.4 ENST00000448226.2 |
MITF |
microphthalmia-associated transcription factor |
| chr14_-_92414055 | 2.47 |
ENST00000342058.4 |
FBLN5 |
fibulin 5 |
| chr2_+_33359646 | 2.41 |
ENST00000390003.4 ENST00000418533.2 |
LTBP1 |
latent transforming growth factor beta binding protein 1 |
| chr2_+_33359687 | 2.37 |
ENST00000402934.1 ENST00000404525.1 ENST00000407925.1 |
LTBP1 |
latent transforming growth factor beta binding protein 1 |
| chrX_+_86772707 | 2.35 |
ENST00000373119.4 |
KLHL4 |
kelch-like family member 4 |
| chr17_-_19648683 | 2.26 |
ENST00000573368.1 ENST00000457500.2 |
ALDH3A1 |
aldehyde dehydrogenase 3 family, member A1 |
| chr13_+_102104980 | 2.24 |
ENST00000545560.2 |
ITGBL1 |
integrin, beta-like 1 (with EGF-like repeat domains) |
| chr15_-_48937982 | 2.18 |
ENST00000316623.5 |
FBN1 |
fibrillin 1 |
| chr14_-_92413727 | 2.05 |
ENST00000267620.10 |
FBLN5 |
fibulin 5 |
| chr13_+_102104952 | 1.99 |
ENST00000376180.3 |
ITGBL1 |
integrin, beta-like 1 (with EGF-like repeat domains) |
| chr6_-_31697255 | 1.93 |
ENST00000436437.1 |
DDAH2 |
dimethylarginine dimethylaminohydrolase 2 |
| chr16_-_31076332 | 1.86 |
ENST00000539836.3 ENST00000535577.1 ENST00000442862.2 |
ZNF668 |
zinc finger protein 668 |
| chr1_+_78354297 | 1.79 |
ENST00000334785.7 |
NEXN |
nexilin (F actin binding protein) |
| chr1_-_236228417 | 1.75 |
ENST00000264187.6 |
NID1 |
nidogen 1 |
| chr1_-_236228403 | 1.75 |
ENST00000366595.3 |
NID1 |
nidogen 1 |
| chr3_-_178790057 | 1.70 |
ENST00000311417.2 |
ZMAT3 |
zinc finger, matrin-type 3 |
| chr1_-_33168336 | 1.66 |
ENST00000373484.3 |
SYNC |
syncoilin, intermediate filament protein |
| chr5_+_156693159 | 1.62 |
ENST00000347377.6 |
CYFIP2 |
cytoplasmic FMR1 interacting protein 2 |
| chr1_+_78354175 | 1.61 |
ENST00000401035.3 ENST00000457030.1 ENST00000330010.8 |
NEXN |
nexilin (F actin binding protein) |
| chr8_+_104383728 | 1.58 |
ENST00000330295.5 |
CTHRC1 |
collagen triple helix repeat containing 1 |
| chr5_+_156693091 | 1.56 |
ENST00000318218.6 ENST00000442283.2 ENST00000522463.1 ENST00000521420.1 |
CYFIP2 |
cytoplasmic FMR1 interacting protein 2 |
| chr12_+_56075330 | 1.54 |
ENST00000394252.3 |
METTL7B |
methyltransferase like 7B |
| chr9_-_35689900 | 1.51 |
ENST00000378300.5 ENST00000329305.2 ENST00000360958.2 |
TPM2 |
tropomyosin 2 (beta) |
| chr1_-_57045228 | 1.50 |
ENST00000371250.3 |
PPAP2B |
phosphatidic acid phosphatase type 2B |
| chr3_-_178789220 | 1.49 |
ENST00000414084.1 |
ZMAT3 |
zinc finger, matrin-type 3 |
| chr19_+_35521572 | 1.46 |
ENST00000262631.5 |
SCN1B |
sodium channel, voltage-gated, type I, beta subunit |
| chr12_+_56114189 | 1.44 |
ENST00000548082.1 |
RDH5 |
retinol dehydrogenase 5 (11-cis/9-cis) |
| chr3_-_195310802 | 1.38 |
ENST00000421243.1 ENST00000453131.1 |
APOD |
apolipoprotein D |
| chr12_+_56114151 | 1.36 |
ENST00000547072.1 ENST00000552930.1 ENST00000257895.5 |
RDH5 |
retinol dehydrogenase 5 (11-cis/9-cis) |
| chr10_-_79398250 | 1.31 |
ENST00000286627.5 |
KCNMA1 |
potassium large conductance calcium-activated channel, subfamily M, alpha member 1 |
| chr3_+_49059038 | 1.30 |
ENST00000451378.2 |
NDUFAF3 |
NADH dehydrogenase (ubiquinone) complex I, assembly factor 3 |
| chr6_+_136172820 | 1.28 |
ENST00000308191.6 |
PDE7B |
phosphodiesterase 7B |
| chr1_+_155829286 | 1.28 |
ENST00000368324.4 |
SYT11 |
synaptotagmin XI |
| chr1_-_92351769 | 1.22 |
ENST00000212355.4 |
TGFBR3 |
transforming growth factor, beta receptor III |
| chr2_+_24714729 | 1.22 |
ENST00000406961.1 ENST00000405141.1 |
NCOA1 |
nuclear receptor coactivator 1 |
| chr11_+_86511549 | 1.21 |
ENST00000533902.2 |
PRSS23 |
protease, serine, 23 |
| chr9_-_123239632 | 1.21 |
ENST00000416449.1 |
CDK5RAP2 |
CDK5 regulatory subunit associated protein 2 |
| chr17_-_53800217 | 1.20 |
ENST00000424486.2 |
TMEM100 |
transmembrane protein 100 |
| chr8_+_37654693 | 1.19 |
ENST00000412232.2 |
GPR124 |
G protein-coupled receptor 124 |
| chr11_+_71938925 | 1.19 |
ENST00000538751.1 |
INPPL1 |
inositol polyphosphate phosphatase-like 1 |
| chr1_-_84464780 | 1.19 |
ENST00000260505.8 |
TTLL7 |
tubulin tyrosine ligase-like family, member 7 |
| chrX_-_107019181 | 1.18 |
ENST00000315660.4 ENST00000372384.2 ENST00000502650.1 ENST00000506724.1 |
TSC22D3 |
TSC22 domain family, member 3 |
| chr2_-_19558373 | 1.18 |
ENST00000272223.2 |
OSR1 |
odd-skipped related transciption factor 1 |
| chr2_-_37899323 | 1.17 |
ENST00000295324.3 ENST00000457889.1 |
CDC42EP3 |
CDC42 effector protein (Rho GTPase binding) 3 |
| chrX_+_16964794 | 1.17 |
ENST00000357277.3 |
REPS2 |
RALBP1 associated Eps domain containing 2 |
| chrX_-_118827333 | 1.16 |
ENST00000360156.7 ENST00000354228.4 ENST00000489216.1 ENST00000354416.3 ENST00000394610.1 ENST00000343984.5 |
SEPT6 |
septin 6 |
| chr4_-_39640513 | 1.15 |
ENST00000511809.1 ENST00000505729.1 |
SMIM14 |
small integral membrane protein 14 |
| chr2_+_56411131 | 1.15 |
ENST00000407595.2 |
CCDC85A |
coiled-coil domain containing 85A |
| chr22_-_21905120 | 1.14 |
ENST00000331505.5 |
RIMBP3C |
RIMS binding protein 3C |
| chr17_-_39191107 | 1.11 |
ENST00000344363.5 |
KRTAP1-3 |
keratin associated protein 1-3 |
| chr5_+_75699040 | 1.10 |
ENST00000274364.6 |
IQGAP2 |
IQ motif containing GTPase activating protein 2 |
| chrX_-_99665262 | 1.08 |
ENST00000373034.4 ENST00000255531.7 |
PCDH19 |
protocadherin 19 |
| chr2_+_27274506 | 1.07 |
ENST00000451003.1 ENST00000323064.8 ENST00000360131.4 |
AGBL5 |
ATP/GTP binding protein-like 5 |
| chr19_-_18391708 | 1.06 |
ENST00000600972.1 |
JUND |
jun D proto-oncogene |
| chr9_-_79307096 | 1.02 |
ENST00000376717.2 ENST00000223609.6 ENST00000443509.2 |
PRUNE2 |
prune homolog 2 (Drosophila) |
| chr11_-_2170786 | 1.01 |
ENST00000300632.5 |
IGF2 |
insulin-like growth factor 2 (somatomedin A) |
| chrX_+_54835493 | 1.01 |
ENST00000396224.1 |
MAGED2 |
melanoma antigen family D, 2 |
| chr5_+_75699149 | 1.01 |
ENST00000379730.3 |
IQGAP2 |
IQ motif containing GTPase activating protein 2 |
| chr22_+_38071615 | 1.01 |
ENST00000215909.5 |
LGALS1 |
lectin, galactoside-binding, soluble, 1 |
| chr17_+_39240459 | 0.99 |
ENST00000391417.4 |
KRTAP4-7 |
keratin associated protein 4-7 |
| chr5_+_126626498 | 0.98 |
ENST00000503335.2 ENST00000508365.1 ENST00000418761.2 ENST00000274473.6 |
MEGF10 |
multiple EGF-like-domains 10 |
| chrX_+_80457442 | 0.96 |
ENST00000373212.5 |
SH3BGRL |
SH3 domain binding glutamic acid-rich protein like |
| chr8_+_37654424 | 0.96 |
ENST00000315215.7 |
GPR124 |
G protein-coupled receptor 124 |
| chr10_-_79398127 | 0.95 |
ENST00000372443.1 |
KCNMA1 |
potassium large conductance calcium-activated channel, subfamily M, alpha member 1 |
| chrX_+_100333709 | 0.93 |
ENST00000372930.4 |
TMEM35 |
transmembrane protein 35 |
| chr1_-_232598163 | 0.93 |
ENST00000308942.4 |
SIPA1L2 |
signal-induced proliferation-associated 1 like 2 |
| chr14_+_105781102 | 0.93 |
ENST00000547217.1 |
PACS2 |
phosphofurin acidic cluster sorting protein 2 |
| chr10_-_79397740 | 0.90 |
ENST00000372440.1 ENST00000480683.1 |
KCNMA1 |
potassium large conductance calcium-activated channel, subfamily M, alpha member 1 |
| chr12_-_92539614 | 0.90 |
ENST00000256015.3 |
BTG1 |
B-cell translocation gene 1, anti-proliferative |
| chr2_-_160919112 | 0.89 |
ENST00000283243.7 ENST00000392771.1 |
PLA2R1 |
phospholipase A2 receptor 1, 180kDa |
| chr1_-_85930823 | 0.89 |
ENST00000284031.8 ENST00000539042.1 |
DDAH1 |
dimethylarginine dimethylaminohydrolase 1 |
| chr11_-_67120974 | 0.88 |
ENST00000539074.1 ENST00000312419.3 |
POLD4 |
polymerase (DNA-directed), delta 4, accessory subunit |
| chr14_-_89021077 | 0.87 |
ENST00000556564.1 |
PTPN21 |
protein tyrosine phosphatase, non-receptor type 21 |
| chrX_-_118826784 | 0.86 |
ENST00000394616.4 |
SEPT6 |
septin 6 |
| chrX_-_118827113 | 0.85 |
ENST00000394617.2 |
SEPT6 |
septin 6 |
| chr13_+_76362974 | 0.85 |
ENST00000497947.2 |
LMO7 |
LIM domain 7 |
| chr8_+_17354617 | 0.84 |
ENST00000470360.1 |
SLC7A2 |
solute carrier family 7 (cationic amino acid transporter, y+ system), member 2 |
| chr16_+_53133070 | 0.84 |
ENST00000565832.1 |
CHD9 |
chromodomain helicase DNA binding protein 9 |
| chr7_-_45960850 | 0.84 |
ENST00000381083.4 ENST00000381086.5 ENST00000275521.6 |
IGFBP3 |
insulin-like growth factor binding protein 3 |
| chrX_-_19140677 | 0.83 |
ENST00000357544.3 ENST00000379869.3 ENST00000360279.4 ENST00000379873.2 ENST00000379878.3 ENST00000354791.3 ENST00000379876.1 |
GPR64 |
G protein-coupled receptor 64 |
| chr1_+_159750776 | 0.83 |
ENST00000368107.1 |
DUSP23 |
dual specificity phosphatase 23 |
| chrX_-_103087136 | 0.82 |
ENST00000243298.2 |
RAB9B |
RAB9B, member RAS oncogene family |
| chrX_-_19140575 | 0.82 |
ENST00000357991.3 ENST00000356606.4 |
GPR64 |
G protein-coupled receptor 64 |
| chr10_-_64576105 | 0.81 |
ENST00000242480.3 ENST00000411732.1 |
EGR2 |
early growth response 2 |
| chr2_-_27294500 | 0.81 |
ENST00000447619.1 ENST00000429985.1 ENST00000456793.1 |
OST4 |
oligosaccharyltransferase 4 homolog (S. cerevisiae) |
| chr14_-_24551195 | 0.81 |
ENST00000560550.1 |
NRL |
neural retina leucine zipper |
| chr1_+_159750720 | 0.80 |
ENST00000368109.1 ENST00000368108.3 |
DUSP23 |
dual specificity phosphatase 23 |
| chr6_+_39760783 | 0.80 |
ENST00000398904.2 ENST00000538976.1 |
DAAM2 |
dishevelled associated activator of morphogenesis 2 |
| chr14_-_23822080 | 0.80 |
ENST00000397267.1 ENST00000354772.3 |
SLC22A17 |
solute carrier family 22, member 17 |
| chr1_+_110230456 | 0.79 |
ENST00000349334.3 ENST00000476065.2 ENST00000483399.2 ENST00000369819.2 |
GSTM1 |
glutathione S-transferase mu 1 |
| chr1_+_101003687 | 0.78 |
ENST00000315033.4 |
GPR88 |
G protein-coupled receptor 88 |
| chr6_-_139695757 | 0.78 |
ENST00000367651.2 |
CITED2 |
Cbp/p300-interacting transactivator, with Glu/Asp-rich carboxy-terminal domain, 2 |
| chr9_+_37650945 | 0.77 |
ENST00000377765.3 |
FRMPD1 |
FERM and PDZ domain containing 1 |
| chr16_-_31076273 | 0.77 |
ENST00000426488.2 |
ZNF668 |
zinc finger protein 668 |
| chr10_+_92980517 | 0.74 |
ENST00000336126.5 |
PCGF5 |
polycomb group ring finger 5 |
| chr2_-_190044480 | 0.74 |
ENST00000374866.3 |
COL5A2 |
collagen, type V, alpha 2 |
| chr11_-_62323702 | 0.74 |
ENST00000530285.1 |
AHNAK |
AHNAK nucleoprotein |
| chr10_-_62704005 | 0.74 |
ENST00000337910.5 |
RHOBTB1 |
Rho-related BTB domain containing 1 |
| chr1_-_38218577 | 0.73 |
ENST00000540011.1 |
EPHA10 |
EPH receptor A10 |
| chr12_-_56122426 | 0.71 |
ENST00000551173.1 |
CD63 |
CD63 molecule |
| chr16_-_30107491 | 0.70 |
ENST00000566134.1 ENST00000565110.1 ENST00000398841.1 ENST00000398838.4 |
YPEL3 |
yippee-like 3 (Drosophila) |
| chr8_+_38758737 | 0.69 |
ENST00000521746.1 ENST00000420274.1 |
PLEKHA2 |
pleckstrin homology domain containing, family A (phosphoinositide binding specific) member 2 |
| chr10_-_98480243 | 0.68 |
ENST00000339364.5 |
PIK3AP1 |
phosphoinositide-3-kinase adaptor protein 1 |
| chr11_+_19798964 | 0.68 |
ENST00000527559.2 |
NAV2 |
neuron navigator 2 |
| chr11_+_67776012 | 0.68 |
ENST00000539229.1 |
ALDH3B1 |
aldehyde dehydrogenase 3 family, member B1 |
| chr11_+_46299199 | 0.68 |
ENST00000529193.1 ENST00000288400.3 |
CREB3L1 |
cAMP responsive element binding protein 3-like 1 |
| chr19_-_46285646 | 0.68 |
ENST00000458663.2 |
DMPK |
dystrophia myotonica-protein kinase |
| chr5_-_107717058 | 0.67 |
ENST00000359660.5 |
FBXL17 |
F-box and leucine-rich repeat protein 17 |
| chr2_-_230579185 | 0.66 |
ENST00000341772.4 |
DNER |
delta/notch-like EGF repeat containing |
| chr11_+_19799327 | 0.66 |
ENST00000540292.1 |
NAV2 |
neuron navigator 2 |
| chr11_-_66115032 | 0.66 |
ENST00000311181.4 |
B3GNT1 |
UDP-GlcNAc:betaGal beta-1,3-N-acetylglucosaminyltransferase 1 |
| chr5_+_137774706 | 0.65 |
ENST00000378339.2 ENST00000254901.5 ENST00000506158.1 |
REEP2 |
receptor accessory protein 2 |
| chr5_+_67586465 | 0.65 |
ENST00000336483.5 |
PIK3R1 |
phosphoinositide-3-kinase, regulatory subunit 1 (alpha) |
| chr19_+_16186903 | 0.64 |
ENST00000588507.1 |
TPM4 |
tropomyosin 4 |
| chr22_-_42342733 | 0.64 |
ENST00000402420.1 |
CENPM |
centromere protein M |
| chr14_+_72399114 | 0.64 |
ENST00000553525.1 ENST00000555571.1 |
RGS6 |
regulator of G-protein signaling 6 |
| chr2_-_38303218 | 0.64 |
ENST00000407341.1 ENST00000260630.3 |
CYP1B1 |
cytochrome P450, family 1, subfamily B, polypeptide 1 |
| chr17_+_45286387 | 0.64 |
ENST00000572316.1 ENST00000354968.1 ENST00000576874.1 ENST00000536623.2 |
MYL4 |
myosin, light chain 4, alkali; atrial, embryonic |
| chr6_-_117747015 | 0.63 |
ENST00000368508.3 ENST00000368507.3 |
ROS1 |
c-ros oncogene 1 , receptor tyrosine kinase |
| chr6_-_24911195 | 0.63 |
ENST00000259698.4 |
FAM65B |
family with sequence similarity 65, member B |
| chr19_-_47137942 | 0.63 |
ENST00000300873.4 |
GNG8 |
guanine nucleotide binding protein (G protein), gamma 8 |
| chr20_+_1246908 | 0.63 |
ENST00000381873.3 ENST00000381867.1 |
SNPH |
syntaphilin |
| chr19_-_46285736 | 0.63 |
ENST00000291270.4 ENST00000447742.2 ENST00000354227.5 |
DMPK |
dystrophia myotonica-protein kinase |
| chr10_-_28571015 | 0.63 |
ENST00000375719.3 ENST00000375732.1 |
MPP7 |
membrane protein, palmitoylated 7 (MAGUK p55 subfamily member 7) |
| chr9_-_13165457 | 0.63 |
ENST00000542239.1 ENST00000538841.1 ENST00000433359.2 |
MPDZ |
multiple PDZ domain protein |
| chr17_-_7123021 | 0.63 |
ENST00000399510.2 |
DLG4 |
discs, large homolog 4 (Drosophila) |
| chr12_+_71833756 | 0.63 |
ENST00000536515.1 ENST00000540815.2 |
LGR5 |
leucine-rich repeat containing G protein-coupled receptor 5 |
| chr5_+_67511524 | 0.62 |
ENST00000521381.1 ENST00000521657.1 |
PIK3R1 |
phosphoinositide-3-kinase, regulatory subunit 1 (alpha) |
| chr17_-_7216939 | 0.62 |
ENST00000573684.1 |
GPS2 |
G protein pathway suppressor 2 |
| chr3_-_156534754 | 0.62 |
ENST00000472943.1 ENST00000473352.1 |
LINC00886 |
long intergenic non-protein coding RNA 886 |
| chr7_-_120497178 | 0.62 |
ENST00000441017.1 ENST00000424710.1 ENST00000433758.1 |
TSPAN12 |
tetraspanin 12 |
| chrX_-_153775426 | 0.62 |
ENST00000393562.2 |
G6PD |
glucose-6-phosphate dehydrogenase |
| chr1_+_110230412 | 0.62 |
ENST00000309851.5 ENST00000369823.2 |
GSTM1 |
glutathione S-transferase mu 1 |
| chr14_+_105781048 | 0.61 |
ENST00000458164.2 ENST00000447393.1 |
PACS2 |
phosphofurin acidic cluster sorting protein 2 |
| chr6_+_132873832 | 0.61 |
ENST00000275200.1 |
TAAR8 |
trace amine associated receptor 8 |
| chr2_+_220436917 | 0.60 |
ENST00000243786.2 |
INHA |
inhibin, alpha |
| chr9_+_140172200 | 0.60 |
ENST00000357503.2 |
TOR4A |
torsin family 4, member A |
| chr4_-_186696425 | 0.60 |
ENST00000430503.1 ENST00000319454.6 ENST00000450341.1 |
SORBS2 |
sorbin and SH3 domain containing 2 |
| chr6_+_108977520 | 0.60 |
ENST00000540898.1 |
FOXO3 |
forkhead box O3 |
| chr7_+_8008418 | 0.59 |
ENST00000223145.5 |
GLCCI1 |
glucocorticoid induced transcript 1 |
| chr3_-_178789993 | 0.58 |
ENST00000432729.1 |
ZMAT3 |
zinc finger, matrin-type 3 |
| chr7_-_28220354 | 0.58 |
ENST00000283928.5 |
JAZF1 |
JAZF zinc finger 1 |
| chr17_+_71161140 | 0.58 |
ENST00000357585.2 |
SSTR2 |
somatostatin receptor 2 |
| chr17_+_68165657 | 0.57 |
ENST00000243457.3 |
KCNJ2 |
potassium inwardly-rectifying channel, subfamily J, member 2 |
| chr11_-_842509 | 0.57 |
ENST00000322028.4 |
POLR2L |
polymerase (RNA) II (DNA directed) polypeptide L, 7.6kDa |
| chr14_-_24551137 | 0.57 |
ENST00000396995.1 |
NRL |
neural retina leucine zipper |
| chr9_+_36136700 | 0.57 |
ENST00000396613.3 ENST00000377959.1 ENST00000377960.4 |
GLIPR2 |
GLI pathogenesis-related 2 |
| chr17_+_7123125 | 0.57 |
ENST00000356839.5 ENST00000583312.1 ENST00000350303.5 |
ACADVL |
acyl-CoA dehydrogenase, very long chain |
| chr17_+_45286706 | 0.56 |
ENST00000393450.1 ENST00000572303.1 |
MYL4 |
myosin, light chain 4, alkali; atrial, embryonic |
| chr5_+_139027877 | 0.56 |
ENST00000302517.3 |
CXXC5 |
CXXC finger protein 5 |
| chr4_+_113970772 | 0.56 |
ENST00000504454.1 ENST00000394537.3 ENST00000357077.4 ENST00000264366.6 |
ANK2 |
ankyrin 2, neuronal |
| chr7_+_150065278 | 0.56 |
ENST00000519397.1 ENST00000479668.1 ENST00000540729.1 |
REPIN1 |
replication initiator 1 |
| chr1_-_17304771 | 0.55 |
ENST00000375534.3 |
MFAP2 |
microfibrillar-associated protein 2 |
| chr4_+_114214125 | 0.55 |
ENST00000509550.1 |
ANK2 |
ankyrin 2, neuronal |
| chr17_-_39316983 | 0.55 |
ENST00000390661.3 |
KRTAP4-4 |
keratin associated protein 4-4 |
| chr10_-_92681033 | 0.54 |
ENST00000371697.3 |
ANKRD1 |
ankyrin repeat domain 1 (cardiac muscle) |
| chr9_-_104357277 | 0.54 |
ENST00000374806.1 |
PPP3R2 |
protein phosphatase 3, regulatory subunit B, beta |
| chr2_-_158345462 | 0.53 |
ENST00000439355.1 ENST00000540637.1 |
CYTIP |
cytohesin 1 interacting protein |
| chr5_-_176936844 | 0.53 |
ENST00000510380.1 ENST00000510898.1 ENST00000357198.4 |
DOK3 |
docking protein 3 |
| chr9_-_130952989 | 0.53 |
ENST00000415526.1 ENST00000277465.4 |
CIZ1 |
CDKN1A interacting zinc finger protein 1 |
| chr1_+_180165672 | 0.53 |
ENST00000443059.1 |
QSOX1 |
quiescin Q6 sulfhydryl oxidase 1 |
| chr12_+_71833550 | 0.53 |
ENST00000266674.5 |
LGR5 |
leucine-rich repeat containing G protein-coupled receptor 5 |
| chr8_-_93029865 | 0.53 |
ENST00000422361.2 |
RUNX1T1 |
runt-related transcription factor 1; translocated to, 1 (cyclin D-related) |
| chr8_+_17354587 | 0.53 |
ENST00000494857.1 ENST00000522656.1 |
SLC7A2 |
solute carrier family 7 (cationic amino acid transporter, y+ system), member 2 |
| chr17_-_7145106 | 0.53 |
ENST00000577035.1 |
GABARAP |
GABA(A) receptor-associated protein |
| chr2_-_55647057 | 0.52 |
ENST00000436346.1 |
CCDC88A |
coiled-coil domain containing 88A |
| chr19_-_13068012 | 0.52 |
ENST00000316939.1 |
GADD45GIP1 |
growth arrest and DNA-damage-inducible, gamma interacting protein 1 |
| chr2_-_202316260 | 0.52 |
ENST00000332624.3 |
TRAK2 |
trafficking protein, kinesin binding 2 |
| chr21_-_45079341 | 0.52 |
ENST00000443485.1 ENST00000291560.2 |
HSF2BP |
heat shock transcription factor 2 binding protein |
| chr11_-_82708519 | 0.52 |
ENST00000534301.1 |
RAB30 |
RAB30, member RAS oncogene family |
| chr2_-_55646957 | 0.52 |
ENST00000263630.8 |
CCDC88A |
coiled-coil domain containing 88A |
| chr13_+_112721913 | 0.52 |
ENST00000330949.1 |
SOX1 |
SRY (sex determining region Y)-box 1 |
| chr19_+_47104553 | 0.51 |
ENST00000598871.1 ENST00000594523.1 |
CALM3 |
calmodulin 3 (phosphorylase kinase, delta) |
| chr12_+_90102729 | 0.51 |
ENST00000605386.1 |
LINC00936 |
long intergenic non-protein coding RNA 936 |
| chr3_-_99833333 | 0.51 |
ENST00000354552.3 ENST00000331335.5 ENST00000398326.2 |
FILIP1L |
filamin A interacting protein 1-like |
| chr12_-_52585765 | 0.51 |
ENST00000313234.5 ENST00000394815.2 |
KRT80 |
keratin 80 |
| chr2_-_224702270 | 0.51 |
ENST00000396654.2 ENST00000396653.2 ENST00000423110.1 ENST00000443700.1 |
AP1S3 |
adaptor-related protein complex 1, sigma 3 subunit |
| chr16_-_89043377 | 0.51 |
ENST00000436887.2 ENST00000448839.1 ENST00000360302.2 |
CBFA2T3 |
core-binding factor, runt domain, alpha subunit 2; translocated to, 3 |
| chrX_-_63005405 | 0.51 |
ENST00000374878.1 ENST00000437457.2 |
ARHGEF9 |
Cdc42 guanine nucleotide exchange factor (GEF) 9 |
| chr14_-_23822061 | 0.50 |
ENST00000397260.3 |
SLC22A17 |
solute carrier family 22, member 17 |
| chr5_-_180688105 | 0.50 |
ENST00000327767.4 |
TRIM52 |
tripartite motif containing 52 |
| chr9_-_35685452 | 0.50 |
ENST00000607559.1 |
TPM2 |
tropomyosin 2 (beta) |
| chrX_-_106243451 | 0.49 |
ENST00000355610.4 ENST00000535534.1 |
MORC4 |
MORC family CW-type zinc finger 4 |
| chr6_-_85474219 | 0.49 |
ENST00000369663.5 |
TBX18 |
T-box 18 |
| chr11_-_321340 | 0.49 |
ENST00000526811.1 |
IFITM3 |
interferon induced transmembrane protein 3 |
| chr16_+_21695750 | 0.49 |
ENST00000388956.4 |
OTOA |
otoancorin |
| chr12_+_79258444 | 0.48 |
ENST00000261205.4 |
SYT1 |
synaptotagmin I |
| chr18_-_54305658 | 0.48 |
ENST00000586262.1 ENST00000217515.6 |
TXNL1 |
thioredoxin-like 1 |
| chr19_+_18111927 | 0.48 |
ENST00000379656.3 |
ARRDC2 |
arrestin domain containing 2 |
| chr2_+_148778570 | 0.48 |
ENST00000407073.1 |
MBD5 |
methyl-CpG binding domain protein 5 |
| chr1_+_25071848 | 0.48 |
ENST00000374379.4 |
CLIC4 |
chloride intracellular channel 4 |
| chrX_-_77395186 | 0.48 |
ENST00000341864.5 |
TAF9B |
TAF9B RNA polymerase II, TATA box binding protein (TBP)-associated factor, 31kDa |
| chr1_+_6615241 | 0.48 |
ENST00000333172.6 ENST00000328191.4 ENST00000351136.3 |
TAS1R1 |
taste receptor, type 1, member 1 |
| chr10_+_103348031 | 0.47 |
ENST00000370151.4 ENST00000370147.1 ENST00000370148.2 |
DPCD |
deleted in primary ciliary dyskinesia homolog (mouse) |
| chr7_-_132261223 | 0.47 |
ENST00000423507.2 |
PLXNA4 |
plexin A4 |
| chr17_-_39623681 | 0.47 |
ENST00000225899.3 |
KRT32 |
keratin 32 |
Gene Ontology Analysis
Gene overrepresentation in biological_process category:
| Log-likelihood per target | Total log-likelihood | Term | Description |
|---|---|---|---|
| 0.8 | 0.8 | GO:0035801 | adrenal cortex development(GO:0035801) adrenal cortex formation(GO:0035802) |
| 0.7 | 7.1 | GO:0035583 | sequestering of TGFbeta in extracellular matrix(GO:0035583) |
| 0.6 | 7.2 | GO:0048251 | elastic fiber assembly(GO:0048251) |
| 0.5 | 1.6 | GO:0021966 | corticospinal neuron axon guidance(GO:0021966) |
| 0.5 | 1.4 | GO:2000097 | regulation of smooth muscle cell-matrix adhesion(GO:2000097) |
| 0.5 | 1.4 | GO:0034226 | lysine import(GO:0034226) L-lysine import(GO:0061461) L-lysine import into cell(GO:1903410) |
| 0.4 | 3.9 | GO:0070236 | negative regulation of activation-induced cell death of T cells(GO:0070236) |
| 0.4 | 1.3 | GO:1905154 | negative regulation of synaptic vesicle recycling(GO:1903422) negative regulation of membrane invagination(GO:1905154) calcium ion regulated lysosome exocytosis(GO:1990927) |
| 0.4 | 1.2 | GO:0045925 | positive regulation of female receptivity(GO:0045925) |
| 0.4 | 1.2 | GO:1900075 | regulation of neuromuscular synaptic transmission(GO:1900073) positive regulation of neuromuscular synaptic transmission(GO:1900075) |
| 0.4 | 1.1 | GO:0036371 | protein localization to T-tubule(GO:0036371) |
| 0.3 | 1.4 | GO:0007468 | regulation of rhodopsin gene expression(GO:0007468) positive regulation of rhodopsin gene expression(GO:0045872) |
| 0.3 | 3.1 | GO:0051388 | positive regulation of neurotrophin TRK receptor signaling pathway(GO:0051388) |
| 0.3 | 1.2 | GO:0007181 | transforming growth factor beta receptor complex assembly(GO:0007181) |
| 0.3 | 0.9 | GO:0072186 | metanephric cap development(GO:0072185) metanephric cap morphogenesis(GO:0072186) metanephric cap mesenchymal cell proliferation involved in metanephros development(GO:0090094) |
| 0.3 | 0.9 | GO:0098746 | fast, calcium ion-dependent exocytosis of neurotransmitter(GO:0098746) |
| 0.3 | 1.8 | GO:0070458 | cellular detoxification of nitrogen compound(GO:0070458) |
| 0.3 | 0.9 | GO:0032304 | negative regulation of icosanoid secretion(GO:0032304) |
| 0.3 | 3.2 | GO:0034465 | response to carbon monoxide(GO:0034465) |
| 0.3 | 0.6 | GO:0070374 | positive regulation of ERK1 and ERK2 cascade(GO:0070374) |
| 0.3 | 0.8 | GO:0021793 | chemorepulsion of branchiomotor axon(GO:0021793) |
| 0.3 | 0.8 | GO:0021569 | rhombomere 3 development(GO:0021569) |
| 0.3 | 1.3 | GO:0021564 | vagus nerve development(GO:0021564) |
| 0.3 | 0.8 | GO:0006542 | glutamine biosynthetic process(GO:0006542) |
| 0.3 | 1.0 | GO:1903566 | positive regulation of protein localization to cilium(GO:1903566) |
| 0.3 | 0.3 | GO:0090003 | regulation of establishment of protein localization to plasma membrane(GO:0090003) |
| 0.2 | 1.2 | GO:0015688 | iron chelate transport(GO:0015688) siderophore transport(GO:0015891) |
| 0.2 | 0.7 | GO:1903225 | negative regulation of endodermal cell differentiation(GO:1903225) |
| 0.2 | 0.5 | GO:0050917 | sensory perception of umami taste(GO:0050917) |
| 0.2 | 4.3 | GO:0032836 | glomerular basement membrane development(GO:0032836) |
| 0.2 | 0.9 | GO:0018032 | protein amidation(GO:0018032) |
| 0.2 | 1.6 | GO:0043932 | ossification involved in bone remodeling(GO:0043932) |
| 0.2 | 0.2 | GO:1903433 | regulation of constitutive secretory pathway(GO:1903433) |
| 0.2 | 0.6 | GO:0009051 | pentose-phosphate shunt, oxidative branch(GO:0009051) |
| 0.2 | 0.8 | GO:0006050 | mannosamine metabolic process(GO:0006050) N-acetylmannosamine metabolic process(GO:0006051) |
| 0.2 | 1.0 | GO:0002317 | plasma cell differentiation(GO:0002317) |
| 0.2 | 0.6 | GO:0001544 | initiation of primordial ovarian follicle growth(GO:0001544) |
| 0.2 | 0.8 | GO:0061743 | motor learning(GO:0061743) |
| 0.2 | 0.6 | GO:0090076 | relaxation of skeletal muscle(GO:0090076) |
| 0.2 | 0.9 | GO:0019464 | glycine catabolic process(GO:0006546) glycine decarboxylation via glycine cleavage system(GO:0019464) |
| 0.2 | 0.7 | GO:1903778 | protein localization to vacuolar membrane(GO:1903778) |
| 0.2 | 0.5 | GO:0098937 | dendritic transport(GO:0098935) anterograde dendritic transport(GO:0098937) |
| 0.2 | 0.5 | GO:0060823 | canonical Wnt signaling pathway involved in neural plate anterior/posterior pattern formation(GO:0060823) |
| 0.2 | 2.9 | GO:0048739 | cardiac muscle fiber development(GO:0048739) |
| 0.2 | 2.8 | GO:0006527 | arginine catabolic process(GO:0006527) |
| 0.2 | 0.5 | GO:0006059 | hexitol metabolic process(GO:0006059) |
| 0.2 | 0.5 | GO:0044028 | DNA hypomethylation(GO:0044028) hypomethylation of CpG island(GO:0044029) |
| 0.2 | 0.5 | GO:0030908 | intein-mediated protein splicing(GO:0016539) protein splicing(GO:0030908) |
| 0.2 | 0.9 | GO:2000048 | negative regulation of cell-cell adhesion mediated by cadherin(GO:2000048) |
| 0.2 | 0.6 | GO:0046882 | negative regulation of B cell differentiation(GO:0045578) negative regulation of follicle-stimulating hormone secretion(GO:0046882) |
| 0.1 | 0.6 | GO:2001151 | regulation of renal water transport(GO:2001151) positive regulation of renal water transport(GO:2001153) |
| 0.1 | 0.1 | GO:0031146 | SCF-dependent proteasomal ubiquitin-dependent protein catabolic process(GO:0031146) |
| 0.1 | 0.4 | GO:0071314 | cellular response to cocaine(GO:0071314) |
| 0.1 | 0.4 | GO:0097212 | cadmium ion homeostasis(GO:0055073) lysosomal membrane organization(GO:0097212) negative regulation of hydrogen peroxide catabolic process(GO:2000296) regulation of oxygen metabolic process(GO:2000374) |
| 0.1 | 0.4 | GO:0048203 | vesicle targeting, trans-Golgi to endosome(GO:0048203) |
| 0.1 | 0.4 | GO:1900085 | negative regulation of peptidyl-tyrosine autophosphorylation(GO:1900085) negative regulation of inward rectifier potassium channel activity(GO:1903609) |
| 0.1 | 1.2 | GO:0060842 | arterial endothelial cell differentiation(GO:0060842) |
| 0.1 | 0.8 | GO:0060399 | positive regulation of growth hormone receptor signaling pathway(GO:0060399) |
| 0.1 | 0.5 | GO:1903862 | positive regulation of oxidative phosphorylation(GO:1903862) |
| 0.1 | 0.4 | GO:0030327 | prenylated protein catabolic process(GO:0030327) |
| 0.1 | 0.6 | GO:0050916 | sensory perception of sweet taste(GO:0050916) |
| 0.1 | 0.5 | GO:0036496 | regulation of translational initiation by eIF2 alpha dephosphorylation(GO:0036496) |
| 0.1 | 1.7 | GO:0046600 | negative regulation of centriole replication(GO:0046600) |
| 0.1 | 1.0 | GO:0038028 | insulin receptor signaling pathway via phosphatidylinositol 3-kinase(GO:0038028) |
| 0.1 | 0.6 | GO:0010966 | regulation of phosphate transport(GO:0010966) |
| 0.1 | 0.4 | GO:1902303 | regulation of heart rate by hormone(GO:0003064) negative regulation of potassium ion export(GO:1902303) |
| 0.1 | 1.4 | GO:1901725 | regulation of histone deacetylase activity(GO:1901725) |
| 0.1 | 1.0 | GO:0014816 | skeletal muscle satellite cell differentiation(GO:0014816) engulfment of apoptotic cell(GO:0043652) |
| 0.1 | 0.4 | GO:1903347 | negative regulation of bicellular tight junction assembly(GO:1903347) |
| 0.1 | 0.4 | GO:0036446 | myofibroblast differentiation(GO:0036446) regulation of myofibroblast differentiation(GO:1904760) |
| 0.1 | 1.2 | GO:0018095 | protein polyglutamylation(GO:0018095) |
| 0.1 | 1.5 | GO:0035826 | rubidium ion transport(GO:0035826) regulation of rubidium ion transport(GO:2000680) |
| 0.1 | 0.6 | GO:0038169 | somatostatin receptor signaling pathway(GO:0038169) somatostatin signaling pathway(GO:0038170) |
| 0.1 | 1.1 | GO:0003096 | renal sodium ion transport(GO:0003096) |
| 0.1 | 0.3 | GO:0035494 | SNARE complex disassembly(GO:0035494) |
| 0.1 | 0.7 | GO:0034154 | toll-like receptor 7 signaling pathway(GO:0034154) |
| 0.1 | 0.3 | GO:0038162 | erythropoietin-mediated signaling pathway(GO:0038162) |
| 0.1 | 0.6 | GO:0014835 | myoblast differentiation involved in skeletal muscle regeneration(GO:0014835) |
| 0.1 | 0.6 | GO:0097374 | sensory neuron axon guidance(GO:0097374) |
| 0.1 | 1.1 | GO:0035608 | protein deglutamylation(GO:0035608) |
| 0.1 | 2.0 | GO:0045663 | positive regulation of myoblast differentiation(GO:0045663) |
| 0.1 | 1.2 | GO:2001013 | epithelial cell proliferation involved in renal tubule morphogenesis(GO:2001013) |
| 0.1 | 0.1 | GO:2000196 | positive regulation of female gonad development(GO:2000196) |
| 0.1 | 0.8 | GO:0021678 | third ventricle development(GO:0021678) |
| 0.1 | 0.8 | GO:0071926 | endocannabinoid signaling pathway(GO:0071926) |
| 0.1 | 0.2 | GO:0002605 | negative regulation of dendritic cell antigen processing and presentation(GO:0002605) |
| 0.1 | 1.7 | GO:0034497 | protein localization to pre-autophagosomal structure(GO:0034497) |
| 0.1 | 0.4 | GO:0005986 | sucrose biosynthetic process(GO:0005986) |
| 0.1 | 0.2 | GO:0002874 | regulation of chronic inflammatory response to antigenic stimulus(GO:0002874) |
| 0.1 | 0.7 | GO:0070278 | extracellular matrix constituent secretion(GO:0070278) |
| 0.1 | 1.3 | GO:0031274 | positive regulation of pseudopodium assembly(GO:0031274) |
| 0.1 | 0.1 | GO:0031272 | regulation of pseudopodium assembly(GO:0031272) |
| 0.1 | 0.1 | GO:0018307 | enzyme active site formation(GO:0018307) |
| 0.1 | 2.1 | GO:0070493 | thrombin receptor signaling pathway(GO:0070493) |
| 0.1 | 0.3 | GO:0035674 | tricarboxylic acid transmembrane transport(GO:0035674) |
| 0.1 | 0.6 | GO:0019236 | response to pheromone(GO:0019236) |
| 0.1 | 0.2 | GO:0003009 | skeletal muscle contraction(GO:0003009) |
| 0.1 | 0.4 | GO:0007175 | negative regulation of epidermal growth factor-activated receptor activity(GO:0007175) |
| 0.1 | 0.4 | GO:0061304 | retinal blood vessel morphogenesis(GO:0061304) |
| 0.1 | 0.3 | GO:0006556 | S-adenosylmethionine biosynthetic process(GO:0006556) |
| 0.1 | 0.4 | GO:0015670 | carbon dioxide transport(GO:0015670) |
| 0.1 | 0.4 | GO:0061299 | retina vasculature morphogenesis in camera-type eye(GO:0061299) |
| 0.1 | 0.2 | GO:2001271 | negative regulation of cysteine-type endopeptidase activity involved in execution phase of apoptosis(GO:2001271) |
| 0.1 | 0.6 | GO:0048050 | post-embryonic eye morphogenesis(GO:0048050) |
| 0.1 | 0.3 | GO:0006850 | mitochondrial pyruvate transport(GO:0006850) mitochondrial pyruvate transmembrane transport(GO:1902361) |
| 0.1 | 0.6 | GO:1903715 | regulation of aerobic respiration(GO:1903715) |
| 0.1 | 0.9 | GO:0014722 | regulation of skeletal muscle contraction by calcium ion signaling(GO:0014722) |
| 0.1 | 0.3 | GO:0046726 | positive regulation by virus of viral protein levels in host cell(GO:0046726) |
| 0.1 | 1.3 | GO:0010457 | centriole-centriole cohesion(GO:0010457) |
| 0.1 | 0.9 | GO:0030050 | vesicle transport along actin filament(GO:0030050) |
| 0.1 | 0.1 | GO:0042326 | negative regulation of phosphorylation(GO:0042326) |
| 0.1 | 0.2 | GO:0090341 | negative regulation of secretion of lysosomal enzymes(GO:0090341) |
| 0.1 | 0.2 | GO:1901491 | negative regulation of lymphangiogenesis(GO:1901491) |
| 0.1 | 0.1 | GO:0052047 | interaction with other organism via secreted substance involved in symbiotic interaction(GO:0052047) |
| 0.1 | 0.4 | GO:0007525 | somatic muscle development(GO:0007525) |
| 0.1 | 0.6 | GO:0060573 | ventral spinal cord interneuron specification(GO:0021521) cell fate specification involved in pattern specification(GO:0060573) |
| 0.1 | 0.5 | GO:0051725 | protein de-ADP-ribosylation(GO:0051725) |
| 0.1 | 0.2 | GO:0000415 | negative regulation of histone H3-K36 methylation(GO:0000415) |
| 0.1 | 0.3 | GO:1904647 | response to rotenone(GO:1904647) |
| 0.1 | 0.1 | GO:0071320 | cellular response to cAMP(GO:0071320) |
| 0.1 | 0.5 | GO:0060385 | axonogenesis involved in innervation(GO:0060385) |
| 0.1 | 0.3 | GO:0035803 | egg coat formation(GO:0035803) |
| 0.1 | 0.2 | GO:0032922 | circadian regulation of gene expression(GO:0032922) |
| 0.1 | 0.2 | GO:0090156 | cellular sphingolipid homeostasis(GO:0090156) |
| 0.1 | 0.3 | GO:0033591 | response to L-ascorbic acid(GO:0033591) |
| 0.1 | 1.3 | GO:1900103 | positive regulation of endoplasmic reticulum unfolded protein response(GO:1900103) |
| 0.1 | 2.8 | GO:0042572 | retinol metabolic process(GO:0042572) |
| 0.1 | 3.1 | GO:0030318 | melanocyte differentiation(GO:0030318) |
| 0.1 | 0.7 | GO:0033227 | dsRNA transport(GO:0033227) |
| 0.1 | 0.1 | GO:0033025 | mast cell homeostasis(GO:0033023) mast cell apoptotic process(GO:0033024) regulation of mast cell apoptotic process(GO:0033025) |
| 0.1 | 0.2 | GO:0010814 | substance P catabolic process(GO:0010814) calcitonin catabolic process(GO:0010816) endothelin maturation(GO:0034959) |
| 0.1 | 0.2 | GO:1904529 | regulation of actin filament binding(GO:1904529) regulation of actin binding(GO:1904616) |
| 0.1 | 0.2 | GO:0006617 | SRP-dependent cotranslational protein targeting to membrane, signal sequence recognition(GO:0006617) |
| 0.1 | 0.7 | GO:0007144 | female meiosis I(GO:0007144) |
| 0.1 | 0.9 | GO:0033235 | positive regulation of protein sumoylation(GO:0033235) |
| 0.1 | 0.6 | GO:0046322 | negative regulation of fatty acid oxidation(GO:0046322) |
| 0.1 | 0.5 | GO:0071896 | protein localization to adherens junction(GO:0071896) |
| 0.1 | 0.3 | GO:0060800 | regulation of cell differentiation involved in embryonic placenta development(GO:0060800) |
| 0.1 | 0.8 | GO:0016188 | synaptic vesicle maturation(GO:0016188) |
| 0.1 | 1.5 | GO:0046856 | phosphatidylinositol dephosphorylation(GO:0046856) |
| 0.1 | 0.2 | GO:0014016 | neuroblast differentiation(GO:0014016) |
| 0.1 | 0.6 | GO:0016081 | synaptic vesicle docking(GO:0016081) |
| 0.1 | 0.3 | GO:0034249 | negative regulation of translation(GO:0017148) negative regulation of cellular amide metabolic process(GO:0034249) |
| 0.1 | 0.7 | GO:0019852 | L-ascorbic acid metabolic process(GO:0019852) |
| 0.1 | 0.2 | GO:0002572 | pro-T cell differentiation(GO:0002572) |
| 0.1 | 0.4 | GO:0006627 | protein processing involved in protein targeting to mitochondrion(GO:0006627) |
| 0.1 | 0.3 | GO:1903756 | regulation of transcription from RNA polymerase II promoter by histone modification(GO:1903756) negative regulation of transcription from RNA polymerase II promoter by histone modification(GO:1903758) |
| 0.1 | 0.2 | GO:0021650 | vestibulocochlear nerve formation(GO:0021650) |
| 0.0 | 0.7 | GO:0016576 | histone dephosphorylation(GO:0016576) |
| 0.0 | 0.3 | GO:0006287 | base-excision repair, gap-filling(GO:0006287) |
| 0.0 | 0.1 | GO:0097368 | establishment of Sertoli cell barrier(GO:0097368) |
| 0.0 | 0.1 | GO:0070837 | L-ascorbic acid transport(GO:0015882) dehydroascorbic acid transport(GO:0070837) transepithelial L-ascorbic acid transport(GO:0070904) |
| 0.0 | 0.3 | GO:0006420 | arginyl-tRNA aminoacylation(GO:0006420) |
| 0.0 | 0.2 | GO:0042100 | B cell proliferation(GO:0042100) |
| 0.0 | 0.2 | GO:0051581 | negative regulation of neurotransmitter uptake(GO:0051581) serotonin uptake(GO:0051610) regulation of serotonin uptake(GO:0051611) negative regulation of serotonin uptake(GO:0051612) |
| 0.0 | 0.2 | GO:0070945 | neutrophil mediated killing of gram-negative bacterium(GO:0070945) |
| 0.0 | 0.1 | GO:1904580 | regulation of intracellular mRNA localization(GO:1904580) positive regulation of intracellular mRNA localization(GO:1904582) |
| 0.0 | 0.1 | GO:1904772 | hepatocyte homeostasis(GO:0036333) response to tetrachloromethane(GO:1904772) |
| 0.0 | 0.3 | GO:0055001 | muscle cell development(GO:0055001) |
| 0.0 | 0.7 | GO:0046185 | aldehyde catabolic process(GO:0046185) |
| 0.0 | 0.8 | GO:0035020 | regulation of Rac protein signal transduction(GO:0035020) |
| 0.0 | 0.1 | GO:1902613 | regulation of anti-Mullerian hormone signaling pathway(GO:1902612) negative regulation of anti-Mullerian hormone signaling pathway(GO:1902613) anti-Mullerian hormone signaling pathway(GO:1990262) |
| 0.0 | 0.2 | GO:0098528 | skeletal muscle fiber differentiation(GO:0098528) |
| 0.0 | 0.1 | GO:0035509 | negative regulation of myosin-light-chain-phosphatase activity(GO:0035509) |
| 0.0 | 0.1 | GO:0010644 | cell communication by electrical coupling(GO:0010644) |
| 0.0 | 0.3 | GO:0007258 | JUN phosphorylation(GO:0007258) |
| 0.0 | 0.1 | GO:0071301 | cellular response to vitamin B1(GO:0071301) response to formaldehyde(GO:1904404) |
| 0.0 | 0.1 | GO:1904479 | negative regulation of intestinal absorption(GO:1904479) |
| 0.0 | 0.1 | GO:0002143 | tRNA wobble position uridine thiolation(GO:0002143) |
| 0.0 | 0.3 | GO:0006432 | phenylalanyl-tRNA aminoacylation(GO:0006432) |
| 0.0 | 0.6 | GO:0031848 | protection from non-homologous end joining at telomere(GO:0031848) |
| 0.0 | 0.8 | GO:2000774 | positive regulation of cellular senescence(GO:2000774) |
| 0.0 | 0.1 | GO:0043449 | olfactory learning(GO:0008355) cellular alkene metabolic process(GO:0043449) |
| 0.0 | 0.2 | GO:0061009 | common bile duct development(GO:0061009) |
| 0.0 | 0.5 | GO:0048194 | Golgi vesicle budding(GO:0048194) |
| 0.0 | 0.2 | GO:0022614 | membrane to membrane docking(GO:0022614) |
| 0.0 | 0.2 | GO:0007386 | compartment pattern specification(GO:0007386) |
| 0.0 | 0.7 | GO:0007213 | G-protein coupled acetylcholine receptor signaling pathway(GO:0007213) |
| 0.0 | 0.2 | GO:0060040 | retinal bipolar neuron differentiation(GO:0060040) |
| 0.0 | 0.4 | GO:1902083 | negative regulation of peptidyl-cysteine S-nitrosylation(GO:1902083) |
| 0.0 | 0.1 | GO:0002326 | B cell lineage commitment(GO:0002326) |
| 0.0 | 0.5 | GO:0090154 | positive regulation of sphingolipid biosynthetic process(GO:0090154) positive regulation of ceramide biosynthetic process(GO:2000304) |
| 0.0 | 0.2 | GO:1903998 | regulation of eating behavior(GO:1903998) |
| 0.0 | 0.5 | GO:0071688 | striated muscle myosin thick filament assembly(GO:0071688) |
| 0.0 | 0.1 | GO:0021979 | hypothalamus cell differentiation(GO:0021979) |
| 0.0 | 0.1 | GO:0071316 | cellular response to nicotine(GO:0071316) |
| 0.0 | 0.2 | GO:0043410 | positive regulation of MAPK cascade(GO:0043410) |
| 0.0 | 0.5 | GO:0060315 | negative regulation of ryanodine-sensitive calcium-release channel activity(GO:0060315) |
| 0.0 | 1.2 | GO:0002076 | osteoblast development(GO:0002076) |
| 0.0 | 0.1 | GO:1990086 | lens fiber cell apoptotic process(GO:1990086) |
| 0.0 | 0.2 | GO:2000334 | blood microparticle formation(GO:0072564) regulation of blood microparticle formation(GO:2000332) positive regulation of blood microparticle formation(GO:2000334) |
| 0.0 | 0.2 | GO:1902766 | skeletal muscle satellite cell migration(GO:1902766) |
| 0.0 | 0.6 | GO:0043562 | cellular response to nitrogen starvation(GO:0006995) cellular response to nitrogen levels(GO:0043562) |
| 0.0 | 0.1 | GO:0044111 | development involved in symbiotic interaction(GO:0044111) |
| 0.0 | 0.3 | GO:0086024 | adrenergic receptor signaling pathway involved in positive regulation of heart rate(GO:0086024) |
| 0.0 | 0.2 | GO:2001137 | positive regulation of endocytic recycling(GO:2001137) |
| 0.0 | 0.4 | GO:0001867 | complement activation, lectin pathway(GO:0001867) |
| 0.0 | 0.2 | GO:0061086 | negative regulation of histone H3-K27 methylation(GO:0061086) |
| 0.0 | 0.1 | GO:0048698 | negative regulation of collateral sprouting in absence of injury(GO:0048698) |
| 0.0 | 0.1 | GO:0010286 | heat acclimation(GO:0010286) cellular heat acclimation(GO:0070370) |
| 0.0 | 0.2 | GO:0006537 | glutamate biosynthetic process(GO:0006537) |
| 0.0 | 0.2 | GO:0019626 | short-chain fatty acid catabolic process(GO:0019626) |
| 0.0 | 0.5 | GO:0018210 | peptidyl-threonine phosphorylation(GO:0018107) peptidyl-threonine modification(GO:0018210) |
| 0.0 | 0.2 | GO:0006499 | N-terminal protein myristoylation(GO:0006499) |
| 0.0 | 0.1 | GO:1904742 | regulation of telomeric DNA binding(GO:1904742) |
| 0.0 | 0.5 | GO:0031016 | pancreas development(GO:0031016) |
| 0.0 | 0.2 | GO:0031914 | negative regulation of synaptic plasticity(GO:0031914) |
| 0.0 | 0.5 | GO:0072189 | ureter development(GO:0072189) |
| 0.0 | 0.2 | GO:0031536 | positive regulation of exit from mitosis(GO:0031536) |
| 0.0 | 0.2 | GO:0006436 | tryptophanyl-tRNA aminoacylation(GO:0006436) |
| 0.0 | 0.5 | GO:0035994 | response to muscle stretch(GO:0035994) |
| 0.0 | 0.2 | GO:0042364 | water-soluble vitamin biosynthetic process(GO:0042364) |
| 0.0 | 0.1 | GO:0032252 | secretory granule localization(GO:0032252) |
| 0.0 | 0.3 | GO:0007501 | mesodermal cell fate specification(GO:0007501) |
| 0.0 | 0.7 | GO:0007220 | Notch receptor processing(GO:0007220) |
| 0.0 | 1.0 | GO:0046597 | negative regulation of viral entry into host cell(GO:0046597) |
| 0.0 | 2.0 | GO:0006081 | cellular aldehyde metabolic process(GO:0006081) |
| 0.0 | 0.8 | GO:0010763 | positive regulation of fibroblast migration(GO:0010763) |
| 0.0 | 0.2 | GO:0032474 | otolith morphogenesis(GO:0032474) |
| 0.0 | 0.0 | GO:0036309 | protein localization to M-band(GO:0036309) |
| 0.0 | 0.4 | GO:0045603 | positive regulation of endothelial cell differentiation(GO:0045603) |
| 0.0 | 0.1 | GO:0002337 | B-1a B cell differentiation(GO:0002337) |
| 0.0 | 0.3 | GO:2000346 | negative regulation of hepatocyte proliferation(GO:2000346) |
| 0.0 | 0.3 | GO:0010499 | proteasomal ubiquitin-independent protein catabolic process(GO:0010499) |
| 0.0 | 0.8 | GO:0003298 | physiological muscle hypertrophy(GO:0003298) physiological cardiac muscle hypertrophy(GO:0003301) cell growth involved in cardiac muscle cell development(GO:0061049) |
| 0.0 | 0.7 | GO:1901663 | ubiquinone biosynthetic process(GO:0006744) quinone biosynthetic process(GO:1901663) |
| 0.0 | 0.3 | GO:0045601 | regulation of endothelial cell differentiation(GO:0045601) |
| 0.0 | 0.1 | GO:1901624 | negative regulation of lymphocyte chemotaxis(GO:1901624) |
| 0.0 | 0.1 | GO:0002331 | pre-B cell allelic exclusion(GO:0002331) |
| 0.0 | 0.2 | GO:0002036 | regulation of L-glutamate transport(GO:0002036) |
| 0.0 | 3.8 | GO:0072332 | intrinsic apoptotic signaling pathway by p53 class mediator(GO:0072332) |
| 0.0 | 0.3 | GO:0010225 | response to UV-C(GO:0010225) |
| 0.0 | 0.1 | GO:0070634 | transepithelial ammonium transport(GO:0070634) |
| 0.0 | 0.1 | GO:1901355 | response to rapamycin(GO:1901355) |
| 0.0 | 0.3 | GO:0031444 | slow-twitch skeletal muscle fiber contraction(GO:0031444) |
| 0.0 | 0.1 | GO:2000611 | pilomotor reflex(GO:0097195) positive regulation of thyroid hormone generation(GO:2000611) |
| 0.0 | 0.6 | GO:0002026 | regulation of the force of heart contraction(GO:0002026) |
| 0.0 | 1.4 | GO:0050690 | regulation of defense response to virus by virus(GO:0050690) |
| 0.0 | 0.6 | GO:0035090 | maintenance of apical/basal cell polarity(GO:0035090) maintenance of epithelial cell apical/basal polarity(GO:0045199) |
| 0.0 | 0.5 | GO:0007021 | tubulin complex assembly(GO:0007021) |
| 0.0 | 1.0 | GO:0061641 | CENP-A containing nucleosome assembly(GO:0034080) CENP-A containing chromatin organization(GO:0061641) |
| 0.0 | 0.2 | GO:0010831 | positive regulation of myotube differentiation(GO:0010831) |
| 0.0 | 0.1 | GO:0070253 | somatostatin secretion(GO:0070253) |
| 0.0 | 0.1 | GO:0003069 | age-dependent response to oxidative stress(GO:0001306) age-dependent response to reactive oxygen species(GO:0001315) regulation of systemic arterial blood pressure by acetylcholine(GO:0003068) vasodilation by acetylcholine involved in regulation of systemic arterial blood pressure(GO:0003069) regulation of systemic arterial blood pressure by neurotransmitter(GO:0003070) age-dependent general metabolic decline(GO:0007571) |
| 0.0 | 0.1 | GO:0045200 | establishment or maintenance of neuroblast polarity(GO:0045196) establishment of neuroblast polarity(GO:0045200) |
| 0.0 | 0.2 | GO:0098926 | acetylcholine receptor signaling pathway(GO:0095500) postsynaptic signal transduction(GO:0098926) signal transduction involved in cellular response to ammonium ion(GO:1903831) response to acetylcholine(GO:1905144) cellular response to acetylcholine(GO:1905145) |
| 0.0 | 0.2 | GO:0070934 | CRD-mediated mRNA stabilization(GO:0070934) |
| 0.0 | 0.1 | GO:0035553 | oxidative RNA demethylation(GO:0035513) oxidative single-stranded RNA demethylation(GO:0035553) |
| 0.0 | 0.1 | GO:0072709 | cellular response to sorbitol(GO:0072709) |
| 0.0 | 0.8 | GO:0006297 | nucleotide-excision repair, DNA gap filling(GO:0006297) |
| 0.0 | 0.1 | GO:0034421 | post-translational protein acetylation(GO:0034421) |
| 0.0 | 0.0 | GO:0060913 | cardiac cell fate determination(GO:0060913) |
| 0.0 | 0.2 | GO:0055129 | L-proline biosynthetic process(GO:0055129) |
| 0.0 | 0.1 | GO:0035105 | sterol regulatory element binding protein import into nucleus(GO:0035105) |
| 0.0 | 0.4 | GO:0006610 | ribosomal protein import into nucleus(GO:0006610) |
| 0.0 | 0.1 | GO:0035564 | regulation of kidney size(GO:0035564) regulation of pronephros size(GO:0035565) renal glucose absorption(GO:0035623) |
| 0.0 | 0.2 | GO:0022027 | interkinetic nuclear migration(GO:0022027) |
| 0.0 | 0.1 | GO:1901675 | response to methylglyoxal(GO:0051595) negative regulation of histone H3-K27 acetylation(GO:1901675) |
| 0.0 | 0.0 | GO:0021558 | trochlear nerve development(GO:0021558) |
| 0.0 | 0.1 | GO:0009956 | radial pattern formation(GO:0009956) |
| 0.0 | 0.1 | GO:0031548 | regulation of brain-derived neurotrophic factor receptor signaling pathway(GO:0031548) |
| 0.0 | 0.1 | GO:0014883 | transition between fast and slow fiber(GO:0014883) |
| 0.0 | 0.1 | GO:0071051 | polyadenylation-dependent snoRNA 3'-end processing(GO:0071051) |
| 0.0 | 0.1 | GO:0010847 | regulation of chromatin assembly(GO:0010847) |
| 0.0 | 2.0 | GO:0010257 | NADH dehydrogenase complex assembly(GO:0010257) mitochondrial respiratory chain complex I assembly(GO:0032981) mitochondrial respiratory chain complex I biogenesis(GO:0097031) |
| 0.0 | 0.1 | GO:0006120 | mitochondrial electron transport, NADH to ubiquinone(GO:0006120) |
| 0.0 | 0.1 | GO:1900383 | regulation of synaptic plasticity by receptor localization to synapse(GO:1900383) |
| 0.0 | 0.7 | GO:0006198 | cAMP catabolic process(GO:0006198) |
| 0.0 | 0.1 | GO:2000676 | positive regulation of type B pancreatic cell apoptotic process(GO:2000676) |
| 0.0 | 0.2 | GO:0090050 | peptidyl-lysine deacetylation(GO:0034983) positive regulation of cell migration involved in sprouting angiogenesis(GO:0090050) |
| 0.0 | 0.4 | GO:0033599 | regulation of mammary gland epithelial cell proliferation(GO:0033599) |
| 0.0 | 0.2 | GO:0090084 | negative regulation of inclusion body assembly(GO:0090084) |
| 0.0 | 0.1 | GO:2000768 | positive regulation of nephron tubule epithelial cell differentiation(GO:2000768) |
| 0.0 | 0.4 | GO:0043586 | tongue development(GO:0043586) |
| 0.0 | 0.1 | GO:0021514 | ventral spinal cord interneuron differentiation(GO:0021514) |
| 0.0 | 0.4 | GO:0070262 | peptidyl-serine dephosphorylation(GO:0070262) |
| 0.0 | 0.1 | GO:2000769 | regulation of unidimensional cell growth(GO:0051510) negative regulation of unidimensional cell growth(GO:0051511) establishment of cell polarity regulating cell shape(GO:0071964) regulation of establishment or maintenance of cell polarity regulating cell shape(GO:2000769) positive regulation of establishment or maintenance of cell polarity regulating cell shape(GO:2000771) regulation of establishment of cell polarity regulating cell shape(GO:2000782) positive regulation of establishment of cell polarity regulating cell shape(GO:2000784) positive regulation of barbed-end actin filament capping(GO:2000814) |
| 0.0 | 0.5 | GO:1901685 | glutathione derivative metabolic process(GO:1901685) glutathione derivative biosynthetic process(GO:1901687) |
| 0.0 | 0.1 | GO:0071374 | cellular response to parathyroid hormone stimulus(GO:0071374) |
| 0.0 | 0.3 | GO:0010561 | negative regulation of glycoprotein biosynthetic process(GO:0010561) |
| 0.0 | 0.8 | GO:1901385 | regulation of voltage-gated calcium channel activity(GO:1901385) |
| 0.0 | 0.3 | GO:2000785 | regulation of autophagosome assembly(GO:2000785) |
| 0.0 | 0.1 | GO:1902715 | positive regulation of interferon-gamma secretion(GO:1902715) |
| 0.0 | 0.2 | GO:0039692 | single stranded viral RNA replication via double stranded DNA intermediate(GO:0039692) |
| 0.0 | 0.1 | GO:0030263 | apoptotic chromosome condensation(GO:0030263) |
| 0.0 | 0.0 | GO:0003162 | atrioventricular node development(GO:0003162) |
| 0.0 | 0.3 | GO:0021930 | cell proliferation in external granule layer(GO:0021924) cerebellar granule cell precursor proliferation(GO:0021930) |
| 0.0 | 0.5 | GO:0007173 | epidermal growth factor receptor signaling pathway(GO:0007173) |
| 0.0 | 0.3 | GO:0006336 | DNA replication-independent nucleosome assembly(GO:0006336) DNA replication-independent nucleosome organization(GO:0034724) |
| 0.0 | 0.3 | GO:0000712 | resolution of meiotic recombination intermediates(GO:0000712) |
| 0.0 | 0.1 | GO:0000414 | regulation of histone H3-K36 methylation(GO:0000414) |
| 0.0 | 0.2 | GO:0060294 | cilium movement involved in cell motility(GO:0060294) |
| 0.0 | 0.1 | GO:0032484 | Ral protein signal transduction(GO:0032484) regulation of Ral protein signal transduction(GO:0032485) |
| 0.0 | 0.7 | GO:0046329 | negative regulation of JNK cascade(GO:0046329) |
| 0.0 | 0.4 | GO:0033137 | negative regulation of peptidyl-serine phosphorylation(GO:0033137) |
| 0.0 | 0.1 | GO:0006930 | substrate-dependent cell migration, cell extension(GO:0006930) |
| 0.0 | 0.1 | GO:0035331 | negative regulation of hippo signaling(GO:0035331) |
| 0.0 | 0.1 | GO:1904637 | cellular response to ether(GO:0071362) response to ionomycin(GO:1904636) cellular response to ionomycin(GO:1904637) |
| 0.0 | 0.2 | GO:1901678 | iron coordination entity transport(GO:1901678) |
| 0.0 | 0.4 | GO:0021756 | striatum development(GO:0021756) |
| 0.0 | 0.3 | GO:0048820 | hair follicle maturation(GO:0048820) |
| 0.0 | 0.6 | GO:0045599 | negative regulation of fat cell differentiation(GO:0045599) |
| 0.0 | 0.1 | GO:0010724 | regulation of definitive erythrocyte differentiation(GO:0010724) |
| 0.0 | 0.3 | GO:0032780 | negative regulation of ATPase activity(GO:0032780) |
| 0.0 | 0.6 | GO:0050873 | brown fat cell differentiation(GO:0050873) |
| 0.0 | 0.4 | GO:0043162 | ubiquitin-dependent protein catabolic process via the multivesicular body sorting pathway(GO:0043162) |
| 0.0 | 0.1 | GO:1901660 | calcium ion export(GO:1901660) calcium ion export from cell(GO:1990034) |
| 0.0 | 0.4 | GO:0032060 | bleb assembly(GO:0032060) |
| 0.0 | 0.6 | GO:1900739 | regulation of protein insertion into mitochondrial membrane involved in apoptotic signaling pathway(GO:1900739) positive regulation of protein insertion into mitochondrial membrane involved in apoptotic signaling pathway(GO:1900740) |
| 0.0 | 0.0 | GO:0071288 | cellular response to mercury ion(GO:0071288) |
| 0.0 | 0.1 | GO:2001199 | negative regulation of dendritic cell differentiation(GO:2001199) |
| 0.0 | 0.0 | GO:0010609 | mRNA localization resulting in posttranscriptional regulation of gene expression(GO:0010609) |
| 0.0 | 0.1 | GO:0006013 | mannose metabolic process(GO:0006013) |
| 0.0 | 0.1 | GO:0070212 | protein poly-ADP-ribosylation(GO:0070212) |
| 0.0 | 0.1 | GO:1901097 | negative regulation of autophagosome maturation(GO:1901097) |
| 0.0 | 0.1 | GO:0019375 | galactosylceramide biosynthetic process(GO:0006682) galactolipid biosynthetic process(GO:0019375) |
| 0.0 | 0.1 | GO:0032000 | positive regulation of fatty acid beta-oxidation(GO:0032000) |
| 0.0 | 0.8 | GO:0006904 | vesicle docking involved in exocytosis(GO:0006904) |
| 0.0 | 1.4 | GO:0043462 | regulation of ATPase activity(GO:0043462) |
| 0.0 | 0.5 | GO:0007520 | myoblast fusion(GO:0007520) |
| 0.0 | 0.2 | GO:0014887 | muscle hypertrophy in response to stress(GO:0003299) cardiac muscle adaptation(GO:0014887) cardiac muscle hypertrophy in response to stress(GO:0014898) |
| 0.0 | 0.0 | GO:1903413 | cellular response to bile acid(GO:1903413) |
| 0.0 | 0.7 | GO:0006370 | 7-methylguanosine mRNA capping(GO:0006370) |
| 0.0 | 0.1 | GO:0030854 | positive regulation of granulocyte differentiation(GO:0030854) |
| 0.0 | 0.3 | GO:0048935 | peripheral nervous system neuron differentiation(GO:0048934) peripheral nervous system neuron development(GO:0048935) |
| 0.0 | 0.0 | GO:2000213 | nitrogen catabolite regulation of transcription from RNA polymerase II promoter(GO:0001079) nitrogen catabolite activation of transcription from RNA polymerase II promoter(GO:0001080) regulation of nitrogen utilization(GO:0006808) nitrogen utilization(GO:0019740) regulation of urea metabolic process(GO:0034255) intracellular bile acid receptor signaling pathway(GO:0038185) interleukin-17 secretion(GO:0072615) nitrogen catabolite regulation of transcription(GO:0090293) nitrogen catabolite activation of transcription(GO:0090294) regulation of nitrogen cycle metabolic process(GO:1903314) positive regulation of glutamate metabolic process(GO:2000213) regulation of ammonia assimilation cycle(GO:2001248) positive regulation of ammonia assimilation cycle(GO:2001250) |
| 0.0 | 0.2 | GO:0043304 | regulation of mast cell activation involved in immune response(GO:0033006) regulation of mast cell degranulation(GO:0043304) |
| 0.0 | 0.1 | GO:0007585 | respiratory gaseous exchange(GO:0007585) |
| 0.0 | 0.1 | GO:2000427 | positive regulation of apoptotic cell clearance(GO:2000427) |
| 0.0 | 0.1 | GO:2000786 | positive regulation of autophagosome assembly(GO:2000786) |
| 0.0 | 0.1 | GO:0032364 | oxygen homeostasis(GO:0032364) |
| 0.0 | 0.4 | GO:0006626 | protein targeting to mitochondrion(GO:0006626) |
| 0.0 | 0.2 | GO:0015747 | urate transport(GO:0015747) |
| 0.0 | 0.6 | GO:0070979 | protein K11-linked ubiquitination(GO:0070979) |
| 0.0 | 0.1 | GO:0045577 | regulation of B cell differentiation(GO:0045577) |
| 0.0 | 0.1 | GO:0008298 | intracellular mRNA localization(GO:0008298) |
| 0.0 | 0.1 | GO:0010890 | positive regulation of sequestering of triglyceride(GO:0010890) |
| 0.0 | 0.0 | GO:0019442 | tryptophan catabolic process to acetyl-CoA(GO:0019442) |
| 0.0 | 0.2 | GO:1902857 | positive regulation of nonmotile primary cilium assembly(GO:1902857) |
| 0.0 | 0.3 | GO:0045662 | negative regulation of myoblast differentiation(GO:0045662) |
| 0.0 | 1.1 | GO:0045454 | cell redox homeostasis(GO:0045454) |
| 0.0 | 0.1 | GO:1901525 | negative regulation of macromitophagy(GO:1901525) |
| 0.0 | 1.6 | GO:0044070 | regulation of anion transport(GO:0044070) |
| 0.0 | 0.1 | GO:0033008 | positive regulation of mast cell activation involved in immune response(GO:0033008) positive regulation of mast cell degranulation(GO:0043306) |
| 0.0 | 0.2 | GO:0006553 | lysine metabolic process(GO:0006553) |
| 0.0 | 0.7 | GO:1902017 | regulation of cilium assembly(GO:1902017) |
| 0.0 | 0.2 | GO:0071157 | negative regulation of cell cycle arrest(GO:0071157) |
| 0.0 | 0.2 | GO:0045721 | negative regulation of gluconeogenesis(GO:0045721) |
| 0.0 | 0.1 | GO:0015015 | heparan sulfate proteoglycan biosynthetic process, enzymatic modification(GO:0015015) |
| 0.0 | 0.4 | GO:0048013 | ephrin receptor signaling pathway(GO:0048013) |
| 0.0 | 0.1 | GO:0052551 | response to defense-related nitric oxide production by other organism involved in symbiotic interaction(GO:0052551) response to defense-related host nitric oxide production(GO:0052565) |
| 0.0 | 0.0 | GO:2001293 | malonyl-CoA metabolic process(GO:2001293) |
| 0.0 | 0.1 | GO:0006348 | chromatin silencing at telomere(GO:0006348) |
| 0.0 | 0.1 | GO:0008340 | determination of adult lifespan(GO:0008340) |
| 0.0 | 0.0 | GO:0051198 | negative regulation of nucleotide catabolic process(GO:0030812) negative regulation of glycolytic process(GO:0045820) negative regulation of cofactor metabolic process(GO:0051195) negative regulation of coenzyme metabolic process(GO:0051198) |
Gene overrepresentation in cellular_component category:
| Log-likelihood per target | Total log-likelihood | Term | Description |
|---|---|---|---|
| 1.0 | 2.9 | GO:0032173 | septin ring(GO:0005940) septin collar(GO:0032173) |
| 0.7 | 7.3 | GO:0071953 | elastic fiber(GO:0071953) |
| 0.5 | 1.8 | GO:0034673 | inhibin-betaglycan-ActRII complex(GO:0034673) |
| 0.3 | 7.7 | GO:0043205 | microfibril(GO:0001527) fibril(GO:0043205) |
| 0.3 | 1.3 | GO:0048787 | presynaptic active zone membrane(GO:0048787) |
| 0.3 | 1.3 | GO:1990578 | perinuclear endoplasmic reticulum membrane(GO:1990578) |
| 0.3 | 0.8 | GO:0005588 | collagen type V trimer(GO:0005588) |
| 0.2 | 0.9 | GO:0043625 | delta DNA polymerase complex(GO:0043625) |
| 0.2 | 0.9 | GO:0060201 | clathrin-sculpted acetylcholine transport vesicle(GO:0060200) clathrin-sculpted acetylcholine transport vesicle membrane(GO:0060201) |
| 0.2 | 3.1 | GO:0005862 | muscle thin filament tropomyosin(GO:0005862) |
| 0.1 | 0.9 | GO:0016035 | zeta DNA polymerase complex(GO:0016035) |
| 0.1 | 0.4 | GO:0097450 | astrocyte end-foot(GO:0097450) |
| 0.1 | 1.1 | GO:0035976 | AP1 complex(GO:0035976) |
| 0.1 | 2.0 | GO:0099634 | postsynaptic specialization membrane(GO:0099634) |
| 0.1 | 0.2 | GO:0045180 | basal cortex(GO:0045180) |
| 0.1 | 0.4 | GO:0042720 | mitochondrial inner membrane peptidase complex(GO:0042720) |
| 0.1 | 1.5 | GO:0097487 | multivesicular body, internal vesicle(GO:0097487) |
| 0.1 | 0.1 | GO:0009331 | glycerol-3-phosphate dehydrogenase complex(GO:0009331) |
| 0.1 | 0.9 | GO:0042567 | insulin-like growth factor ternary complex(GO:0042567) |
| 0.1 | 0.5 | GO:1990425 | ryanodine receptor complex(GO:1990425) |
| 0.1 | 0.3 | GO:0071821 | FANCM-MHF complex(GO:0071821) |
| 0.1 | 0.3 | GO:0097233 | lamellar body membrane(GO:0097232) alveolar lamellar body membrane(GO:0097233) |
| 0.1 | 0.7 | GO:0043196 | varicosity(GO:0043196) |
| 0.1 | 0.6 | GO:0097025 | MPP7-DLG1-LIN7 complex(GO:0097025) |
| 0.1 | 0.4 | GO:1902937 | inward rectifier potassium channel complex(GO:1902937) |
| 0.1 | 1.3 | GO:0001518 | voltage-gated sodium channel complex(GO:0001518) |
| 0.1 | 1.6 | GO:0097431 | mitotic spindle pole(GO:0097431) |
| 0.1 | 0.5 | GO:1990393 | 3M complex(GO:1990393) |
| 0.1 | 0.3 | GO:0097513 | myosin II filament(GO:0097513) |
| 0.1 | 0.2 | GO:0031302 | intrinsic component of endosome membrane(GO:0031302) |
| 0.1 | 0.3 | GO:1990604 | IRE1-TRAF2-ASK1 complex(GO:1990604) |
| 0.1 | 0.3 | GO:0009328 | phenylalanine-tRNA ligase complex(GO:0009328) |
| 0.1 | 5.7 | GO:0031463 | Cul3-RING ubiquitin ligase complex(GO:0031463) |
| 0.1 | 0.2 | GO:0020003 | symbiont-containing vacuole(GO:0020003) symbiont-containing vacuole membrane(GO:0020005) |
| 0.1 | 1.4 | GO:0030315 | T-tubule(GO:0030315) |
| 0.1 | 0.4 | GO:0044294 | dendritic growth cone(GO:0044294) |
| 0.1 | 0.3 | GO:0090498 | extrinsic component of Golgi membrane(GO:0090498) |
| 0.1 | 0.5 | GO:0042587 | glycogen granule(GO:0042587) PTW/PP1 phosphatase complex(GO:0072357) |
| 0.1 | 0.8 | GO:0008250 | oligosaccharyltransferase complex(GO:0008250) |
| 0.1 | 0.2 | GO:0034751 | aryl hydrocarbon receptor complex(GO:0034751) |
| 0.0 | 0.2 | GO:0035339 | SPOTS complex(GO:0035339) |
| 0.0 | 1.5 | GO:0031307 | integral component of mitochondrial outer membrane(GO:0031307) |
| 0.0 | 1.1 | GO:0001891 | phagocytic cup(GO:0001891) |
| 0.0 | 0.7 | GO:0005833 | hemoglobin complex(GO:0005833) |
| 0.0 | 2.0 | GO:0000421 | autophagosome membrane(GO:0000421) |
| 0.0 | 0.8 | GO:0000177 | cytoplasmic exosome (RNase complex)(GO:0000177) |
| 0.0 | 0.4 | GO:0097443 | sorting endosome(GO:0097443) |
| 0.0 | 0.4 | GO:0005638 | lamin filament(GO:0005638) |
| 0.0 | 0.5 | GO:0032839 | dendrite cytoplasm(GO:0032839) |
| 0.0 | 0.1 | GO:0030686 | 90S preribosome(GO:0030686) |
| 0.0 | 0.2 | GO:0032044 | DSIF complex(GO:0032044) |
| 0.0 | 0.3 | GO:0042719 | mitochondrial intermembrane space protein transporter complex(GO:0042719) |
| 0.0 | 3.0 | GO:0031672 | A band(GO:0031672) |
| 0.0 | 0.2 | GO:0031941 | filamentous actin(GO:0031941) |
| 0.0 | 0.8 | GO:0005614 | interstitial matrix(GO:0005614) |
| 0.0 | 0.4 | GO:0032059 | bleb(GO:0032059) |
| 0.0 | 0.3 | GO:0070852 | cell body fiber(GO:0070852) |
| 0.0 | 1.3 | GO:0005605 | basal lamina(GO:0005605) |
| 0.0 | 0.5 | GO:0000124 | SAGA complex(GO:0000124) |
| 0.0 | 0.8 | GO:0010369 | chromocenter(GO:0010369) |
| 0.0 | 0.6 | GO:0005736 | DNA-directed RNA polymerase I complex(GO:0005736) |
| 0.0 | 0.6 | GO:0043220 | Schmidt-Lanterman incisure(GO:0043220) |
| 0.0 | 3.1 | GO:0031093 | platelet alpha granule lumen(GO:0031093) |
| 0.0 | 0.8 | GO:0034451 | centriolar satellite(GO:0034451) |
| 0.0 | 3.2 | GO:0005901 | caveola(GO:0005901) |
| 0.0 | 4.7 | GO:0031674 | I band(GO:0031674) |
| 0.0 | 0.1 | GO:0005944 | phosphatidylinositol 3-kinase complex, class IB(GO:0005944) |
| 0.0 | 0.2 | GO:0071204 | histone pre-mRNA 3'end processing complex(GO:0071204) |
| 0.0 | 3.9 | GO:0043204 | perikaryon(GO:0043204) |
| 0.0 | 0.4 | GO:0009897 | external side of plasma membrane(GO:0009897) |
| 0.0 | 0.3 | GO:0031464 | Cul4A-RING E3 ubiquitin ligase complex(GO:0031464) |
| 0.0 | 0.3 | GO:0000137 | Golgi cis cisterna(GO:0000137) |
| 0.0 | 0.1 | GO:0005577 | fibrinogen complex(GO:0005577) |
| 0.0 | 0.2 | GO:0001520 | outer dense fiber(GO:0001520) |
| 0.0 | 0.5 | GO:0030133 | transport vesicle(GO:0030133) |
| 0.0 | 0.1 | GO:0070381 | endosome to plasma membrane transport vesicle(GO:0070381) |
| 0.0 | 0.2 | GO:0031143 | pseudopodium(GO:0031143) |
| 0.0 | 0.3 | GO:0030008 | TRAPP complex(GO:0030008) |
| 0.0 | 1.5 | GO:0005581 | collagen trimer(GO:0005581) |
| 0.0 | 0.1 | GO:0030121 | AP-1 adaptor complex(GO:0030121) |
| 0.0 | 1.4 | GO:0034704 | calcium channel complex(GO:0034704) |
| 0.0 | 0.2 | GO:0005964 | phosphorylase kinase complex(GO:0005964) |
| 0.0 | 1.2 | GO:0005801 | cis-Golgi network(GO:0005801) |
| 0.0 | 0.7 | GO:0000145 | exocyst(GO:0000145) |
| 0.0 | 0.1 | GO:0033596 | TSC1-TSC2 complex(GO:0033596) |
| 0.0 | 0.0 | GO:0097208 | alveolar lamellar body(GO:0097208) |
| 0.0 | 0.1 | GO:0005667 | transcription factor complex(GO:0005667) |
| 0.0 | 0.5 | GO:0080008 | Cul4-RING E3 ubiquitin ligase complex(GO:0080008) |
| 0.0 | 0.0 | GO:0002193 | MAML1-RBP-Jkappa- ICN1 complex(GO:0002193) |
| 0.0 | 0.3 | GO:0000808 | origin recognition complex(GO:0000808) nuclear origin of replication recognition complex(GO:0005664) |
| 0.0 | 0.3 | GO:0005859 | muscle myosin complex(GO:0005859) |
| 0.0 | 0.8 | GO:0005669 | transcription factor TFIID complex(GO:0005669) |
| 0.0 | 1.4 | GO:0031519 | PcG protein complex(GO:0031519) |
| 0.0 | 1.1 | GO:0005834 | heterotrimeric G-protein complex(GO:0005834) |
| 0.0 | 0.3 | GO:0045177 | apical part of cell(GO:0045177) |
| 0.0 | 2.4 | GO:0005814 | centriole(GO:0005814) |
| 0.0 | 0.2 | GO:0005786 | signal recognition particle, endoplasmic reticulum targeting(GO:0005786) |
| 0.0 | 0.1 | GO:0061574 | ASAP complex(GO:0061574) |
| 0.0 | 0.2 | GO:0042622 | photoreceptor outer segment membrane(GO:0042622) |
| 0.0 | 0.9 | GO:0005881 | cytoplasmic microtubule(GO:0005881) |
| 0.0 | 0.2 | GO:0033179 | proton-transporting V-type ATPase, V0 domain(GO:0033179) |
| 0.0 | 0.3 | GO:0030122 | AP-2 adaptor complex(GO:0030122) |
| 0.0 | 0.2 | GO:0000930 | gamma-tubulin complex(GO:0000930) |
| 0.0 | 2.3 | GO:0000922 | spindle pole(GO:0000922) |
| 0.0 | 0.2 | GO:0005641 | nuclear envelope lumen(GO:0005641) |
| 0.0 | 0.1 | GO:0005854 | nascent polypeptide-associated complex(GO:0005854) |
| 0.0 | 0.9 | GO:0031907 | peroxisomal matrix(GO:0005782) microbody lumen(GO:0031907) |
| 0.0 | 0.3 | GO:0005665 | DNA-directed RNA polymerase II, core complex(GO:0005665) |
| 0.0 | 0.1 | GO:0016460 | myosin II complex(GO:0016460) |
| 0.0 | 1.6 | GO:0032588 | trans-Golgi network membrane(GO:0032588) |
| 0.0 | 0.2 | GO:0005662 | DNA replication factor A complex(GO:0005662) |
| 0.0 | 0.2 | GO:0014731 | spectrin-associated cytoskeleton(GO:0014731) |
| 0.0 | 0.1 | GO:0005785 | signal recognition particle receptor complex(GO:0005785) |
| 0.0 | 0.2 | GO:0016580 | Sin3 complex(GO:0016580) |
| 0.0 | 0.6 | GO:0042571 | immunoglobulin complex, circulating(GO:0042571) |
| 0.0 | 0.1 | GO:0072669 | tRNA-splicing ligase complex(GO:0072669) |
| 0.0 | 0.5 | GO:0016592 | mediator complex(GO:0016592) |
| 0.0 | 1.4 | GO:0017053 | transcriptional repressor complex(GO:0017053) |
| 0.0 | 0.2 | GO:0031105 | septin complex(GO:0031105) |
| 0.0 | 0.1 | GO:0097149 | centralspindlin complex(GO:0097149) |
| 0.0 | 0.8 | GO:0030670 | phagocytic vesicle membrane(GO:0030670) |
| 0.0 | 0.4 | GO:0000159 | protein phosphatase type 2A complex(GO:0000159) |
| 0.0 | 0.1 | GO:0031931 | TORC1 complex(GO:0031931) |
| 0.0 | 0.4 | GO:0000152 | nuclear ubiquitin ligase complex(GO:0000152) |
| 0.0 | 0.3 | GO:0031304 | intrinsic component of mitochondrial inner membrane(GO:0031304) integral component of mitochondrial inner membrane(GO:0031305) |
| 0.0 | 0.1 | GO:0033588 | Elongator holoenzyme complex(GO:0033588) |
| 0.0 | 0.9 | GO:0030864 | cortical actin cytoskeleton(GO:0030864) |
| 0.0 | 0.2 | GO:0034045 | pre-autophagosomal structure membrane(GO:0034045) |
| 0.0 | 0.7 | GO:0031526 | brush border membrane(GO:0031526) |
| 0.0 | 0.4 | GO:0032420 | stereocilium(GO:0032420) |
| 0.0 | 0.2 | GO:0030867 | rough endoplasmic reticulum membrane(GO:0030867) |
Gene overrepresentation in molecular_function category:
| Log-likelihood per target | Total log-likelihood | Term | Description |
|---|---|---|---|
| 0.9 | 4.7 | GO:0050436 | microfibril binding(GO:0050436) |
| 0.5 | 1.6 | GO:0086062 | voltage-gated sodium channel activity involved in Purkinje myocyte action potential(GO:0086062) |
| 0.5 | 2.3 | GO:0018479 | benzaldehyde dehydrogenase (NAD+) activity(GO:0018479) |
| 0.4 | 3.9 | GO:0043426 | MRF binding(GO:0043426) |
| 0.4 | 2.8 | GO:0016403 | dimethylargininase activity(GO:0016403) |
| 0.4 | 3.2 | GO:0060072 | large conductance calcium-activated potassium channel activity(GO:0060072) |
| 0.4 | 3.4 | GO:0043237 | laminin-1 binding(GO:0043237) |
| 0.3 | 1.4 | GO:0005292 | high-affinity basic amino acid transmembrane transporter activity(GO:0005287) high-affinity arginine transmembrane transporter activity(GO:0005289) high-affinity lysine transmembrane transporter activity(GO:0005292) |
| 0.3 | 1.2 | GO:0032038 | myosin II heavy chain binding(GO:0032038) |
| 0.3 | 0.8 | GO:0045127 | N-acetylglucosamine kinase activity(GO:0045127) |
| 0.3 | 0.8 | GO:0016880 | glutamate-ammonia ligase activity(GO:0004356) ammonia ligase activity(GO:0016211) acid-ammonia (or amide) ligase activity(GO:0016880) |
| 0.3 | 1.0 | GO:0004874 | aryl hydrocarbon receptor activity(GO:0004874) |
| 0.3 | 2.3 | GO:0030023 | extracellular matrix constituent conferring elasticity(GO:0030023) |
| 0.3 | 1.0 | GO:0030395 | lactose binding(GO:0030395) |
| 0.2 | 0.7 | GO:0097493 | structural molecule activity conferring elasticity(GO:0097493) |
| 0.2 | 0.9 | GO:0004047 | aminomethyltransferase activity(GO:0004047) |
| 0.2 | 0.9 | GO:0004504 | peptidylglycine monooxygenase activity(GO:0004504) peptidylamidoglycolate lyase activity(GO:0004598) |
| 0.2 | 0.6 | GO:0031811 | G-protein coupled nucleotide receptor binding(GO:0031811) P2Y1 nucleotide receptor binding(GO:0031812) |
| 0.2 | 0.6 | GO:0004345 | glucose-6-phosphate dehydrogenase activity(GO:0004345) |
| 0.2 | 2.1 | GO:0071933 | Arp2/3 complex binding(GO:0071933) |
| 0.2 | 0.5 | GO:0061629 | RNA polymerase II sequence-specific DNA binding transcription factor binding(GO:0061629) |
| 0.2 | 0.5 | GO:0008466 | glycogenin glucosyltransferase activity(GO:0008466) |
| 0.2 | 1.8 | GO:0034485 | phosphatidylinositol-3,4,5-trisphosphate 5-phosphatase activity(GO:0034485) |
| 0.2 | 1.3 | GO:0043559 | insulin binding(GO:0043559) |
| 0.2 | 0.9 | GO:0030348 | syntaxin-3 binding(GO:0030348) |
| 0.1 | 1.2 | GO:0070740 | tubulin-glutamic acid ligase activity(GO:0070740) |
| 0.1 | 1.5 | GO:0019871 | sodium channel inhibitor activity(GO:0019871) |
| 0.1 | 0.4 | GO:0070320 | inward rectifier potassium channel inhibitor activity(GO:0070320) |
| 0.1 | 0.6 | GO:0047179 | platelet-activating factor acetyltransferase activity(GO:0047179) |
| 0.1 | 0.8 | GO:0072542 | protein phosphatase activator activity(GO:0072542) |
| 0.1 | 0.5 | GO:0016230 | sphingomyelin phosphodiesterase activator activity(GO:0016230) |
| 0.1 | 0.5 | GO:0004335 | galactokinase activity(GO:0004335) |
| 0.1 | 0.6 | GO:0004994 | somatostatin receptor activity(GO:0004994) |
| 0.1 | 0.5 | GO:0001069 | regulatory region RNA binding(GO:0001069) |
| 0.1 | 1.2 | GO:0005114 | type II transforming growth factor beta receptor binding(GO:0005114) |
| 0.1 | 1.2 | GO:0017162 | aryl hydrocarbon receptor binding(GO:0017162) |
| 0.1 | 0.1 | GO:0004620 | phospholipase activity(GO:0004620) |
| 0.1 | 1.0 | GO:0001849 | complement component C1q binding(GO:0001849) |
| 0.1 | 0.3 | GO:0008502 | melatonin receptor activity(GO:0008502) |
| 0.1 | 0.3 | GO:0031531 | thyrotropin-releasing hormone receptor binding(GO:0031531) |
| 0.1 | 0.5 | GO:0016971 | flavin-linked sulfhydryl oxidase activity(GO:0016971) |
| 0.1 | 2.8 | GO:0004745 | retinol dehydrogenase activity(GO:0004745) |
| 0.1 | 0.3 | GO:0031768 | ghrelin receptor binding(GO:0031768) |
| 0.1 | 0.6 | GO:0001594 | trace-amine receptor activity(GO:0001594) |
| 0.1 | 0.4 | GO:0042132 | fructose 1,6-bisphosphate 1-phosphatase activity(GO:0042132) |
| 0.1 | 0.4 | GO:0016670 | oxidoreductase activity, acting on a sulfur group of donors, oxygen as acceptor(GO:0016670) |
| 0.1 | 0.7 | GO:0004030 | aldehyde dehydrogenase [NAD(P)+] activity(GO:0004030) |
| 0.1 | 1.8 | GO:0043295 | glutathione binding(GO:0043295) |
| 0.1 | 0.4 | GO:0047708 | biotinidase activity(GO:0047708) |
| 0.1 | 0.5 | GO:0004466 | long-chain-acyl-CoA dehydrogenase activity(GO:0004466) |
| 0.1 | 1.3 | GO:0030280 | structural constituent of epidermis(GO:0030280) |
| 0.1 | 1.6 | GO:0005225 | volume-sensitive anion channel activity(GO:0005225) |
| 0.1 | 0.3 | GO:0016639 | oxidoreductase activity, acting on the CH-NH2 group of donors, NAD or NADP as acceptor(GO:0016639) |
| 0.1 | 0.3 | GO:0004886 | 9-cis retinoic acid receptor activity(GO:0004886) |
| 0.1 | 0.7 | GO:0048039 | ubiquinone binding(GO:0048039) |
| 0.1 | 1.5 | GO:0043522 | leucine zipper domain binding(GO:0043522) |
| 0.1 | 0.5 | GO:0051033 | nucleic acid transmembrane transporter activity(GO:0051032) RNA transmembrane transporter activity(GO:0051033) |
| 0.1 | 0.4 | GO:0008449 | N-acetylglucosamine-6-sulfatase activity(GO:0008449) |
| 0.1 | 0.2 | GO:0015439 | heme-transporting ATPase activity(GO:0015439) |
| 0.1 | 0.2 | GO:0030550 | acetylcholine receptor inhibitor activity(GO:0030550) |
| 0.1 | 7.1 | GO:0008307 | structural constituent of muscle(GO:0008307) |
| 0.1 | 1.3 | GO:0043422 | protein kinase B binding(GO:0043422) |
| 0.1 | 0.3 | GO:0031708 | endothelin B receptor binding(GO:0031708) |
| 0.1 | 0.1 | GO:0004705 | JUN kinase activity(GO:0004705) SAP kinase activity(GO:0016909) |
| 0.1 | 0.8 | GO:0050693 | LBD domain binding(GO:0050693) |
| 0.1 | 0.2 | GO:0003986 | acetyl-CoA hydrolase activity(GO:0003986) |
| 0.1 | 1.2 | GO:0033130 | acetylcholine receptor binding(GO:0033130) |
| 0.1 | 0.5 | GO:0001618 | virus receptor activity(GO:0001618) |
| 0.1 | 0.6 | GO:0035312 | 5'-3' exodeoxyribonuclease activity(GO:0035312) |
| 0.1 | 0.7 | GO:0036312 | phosphatidylinositol 3-kinase regulatory subunit binding(GO:0036312) |
| 0.1 | 1.0 | GO:0008432 | JUN kinase binding(GO:0008432) |
| 0.1 | 0.2 | GO:1904288 | BAT3 complex binding(GO:1904288) |
| 0.1 | 0.2 | GO:0030305 | heparanase activity(GO:0030305) |
| 0.1 | 0.7 | GO:0004128 | cytochrome-b5 reductase activity, acting on NAD(P)H(GO:0004128) |
| 0.1 | 0.2 | GO:0035379 | carbon dioxide transmembrane transporter activity(GO:0035379) |
| 0.1 | 0.3 | GO:0004096 | catalase activity(GO:0004096) |
| 0.1 | 0.2 | GO:0019770 | IgG receptor activity(GO:0019770) |
| 0.1 | 0.6 | GO:0048273 | mitogen-activated protein kinase p38 binding(GO:0048273) NFAT protein binding(GO:0051525) |
| 0.0 | 0.2 | GO:0051373 | FATZ binding(GO:0051373) |
| 0.0 | 0.7 | GO:0030374 | ligand-dependent nuclear receptor transcription coactivator activity(GO:0030374) |
| 0.0 | 0.1 | GO:0033300 | L-ascorbate:sodium symporter activity(GO:0008520) L-ascorbic acid transporter activity(GO:0015229) dehydroascorbic acid transporter activity(GO:0033300) sodium-dependent L-ascorbate transmembrane transporter activity(GO:0070890) |
| 0.0 | 0.4 | GO:1901612 | cardiolipin binding(GO:1901612) |
| 0.0 | 0.3 | GO:0004814 | arginine-tRNA ligase activity(GO:0004814) |
| 0.0 | 0.2 | GO:0031728 | CCR3 chemokine receptor binding(GO:0031728) |
| 0.0 | 0.5 | GO:0005113 | patched binding(GO:0005113) |
| 0.0 | 0.3 | GO:0015137 | citrate transmembrane transporter activity(GO:0015137) tricarboxylic acid transmembrane transporter activity(GO:0015142) |
| 0.0 | 0.4 | GO:0038085 | vascular endothelial growth factor binding(GO:0038085) |
| 0.0 | 1.1 | GO:0016922 | ligand-dependent nuclear receptor binding(GO:0016922) |
| 0.0 | 0.4 | GO:0034711 | inhibin binding(GO:0034711) |
| 0.0 | 0.1 | GO:0047275 | glucosaminylgalactosylglucosylceramide beta-galactosyltransferase activity(GO:0047275) |
| 0.0 | 0.4 | GO:0031698 | beta-2 adrenergic receptor binding(GO:0031698) |
| 0.0 | 0.9 | GO:0017049 | GTP-Rho binding(GO:0017049) |
| 0.0 | 0.1 | GO:0005026 | transforming growth factor beta receptor activity, type II(GO:0005026) |
| 0.0 | 0.2 | GO:0032810 | sterol response element binding(GO:0032810) |
| 0.0 | 0.8 | GO:0047372 | acylglycerol lipase activity(GO:0047372) |
| 0.0 | 0.1 | GO:0061663 | NEDD8 ligase activity(GO:0061663) |
| 0.0 | 0.4 | GO:0033192 | calmodulin-dependent protein phosphatase activity(GO:0033192) |
| 0.0 | 0.3 | GO:0004826 | phenylalanine-tRNA ligase activity(GO:0004826) |
| 0.0 | 0.3 | GO:0001515 | opioid peptide activity(GO:0001515) |
| 0.0 | 0.4 | GO:0000155 | phosphorelay sensor kinase activity(GO:0000155) |
| 0.0 | 0.9 | GO:0001055 | RNA polymerase II activity(GO:0001055) |
| 0.0 | 0.1 | GO:0070052 | collagen V binding(GO:0070052) |
| 0.0 | 0.2 | GO:0033265 | acetylcholinesterase activity(GO:0003990) choline binding(GO:0033265) |
| 0.0 | 0.3 | GO:0050833 | pyruvate transmembrane transporter activity(GO:0050833) |
| 0.0 | 0.5 | GO:0048185 | type I transforming growth factor beta receptor binding(GO:0034713) activin binding(GO:0048185) |
| 0.0 | 0.1 | GO:0016309 | 1-phosphatidylinositol-5-phosphate 4-kinase activity(GO:0016309) |
| 0.0 | 0.1 | GO:0070644 | vitamin D response element binding(GO:0070644) |
| 0.0 | 1.3 | GO:0004181 | metallocarboxypeptidase activity(GO:0004181) |
| 0.0 | 0.1 | GO:0042799 | histone methyltransferase activity (H4-K20 specific)(GO:0042799) |
| 0.0 | 1.9 | GO:0048487 | beta-tubulin binding(GO:0048487) |
| 0.0 | 0.2 | GO:0070892 | lipoteichoic acid receptor activity(GO:0070892) |
| 0.0 | 0.5 | GO:0017154 | semaphorin receptor activity(GO:0017154) |
| 0.0 | 0.5 | GO:0047134 | protein-disulfide reductase activity(GO:0047134) |
| 0.0 | 0.3 | GO:0032190 | acrosin binding(GO:0032190) |
| 0.0 | 1.3 | GO:0005159 | insulin-like growth factor receptor binding(GO:0005159) |
| 0.0 | 1.0 | GO:0017075 | syntaxin-1 binding(GO:0017075) |
| 0.0 | 1.2 | GO:0003887 | DNA-directed DNA polymerase activity(GO:0003887) |
| 0.0 | 0.2 | GO:0004830 | tryptophan-tRNA ligase activity(GO:0004830) |
| 0.0 | 0.4 | GO:0046870 | cadmium ion binding(GO:0046870) |
| 0.0 | 1.8 | GO:0070888 | E-box binding(GO:0070888) |
| 0.0 | 0.3 | GO:0052629 | phosphatidylinositol-3,5-bisphosphate 3-phosphatase activity(GO:0052629) |
| 0.0 | 0.2 | GO:0003998 | acylphosphatase activity(GO:0003998) |
| 0.0 | 0.2 | GO:0004430 | 1-phosphatidylinositol 4-kinase activity(GO:0004430) |
| 0.0 | 0.9 | GO:0043325 | phosphatidylinositol-3,4-bisphosphate binding(GO:0043325) |
| 0.0 | 0.3 | GO:0001075 | transcription factor activity, RNA polymerase II core promoter sequence-specific binding involved in preinitiation complex assembly(GO:0001075) |
| 0.0 | 0.7 | GO:0035497 | cAMP response element binding(GO:0035497) |
| 0.0 | 1.3 | GO:0032266 | phosphatidylinositol-3-phosphate binding(GO:0032266) |
| 0.0 | 0.6 | GO:0070330 | aromatase activity(GO:0070330) |
| 0.0 | 0.5 | GO:0015467 | G-protein activated inward rectifier potassium channel activity(GO:0015467) |
| 0.0 | 0.4 | GO:0051371 | muscle alpha-actinin binding(GO:0051371) |
| 0.0 | 0.2 | GO:0004735 | pyrroline-5-carboxylate reductase activity(GO:0004735) |
| 0.0 | 0.1 | GO:0032422 | purine-rich negative regulatory element binding(GO:0032422) |
| 0.0 | 2.9 | GO:0004722 | protein serine/threonine phosphatase activity(GO:0004722) |
| 0.0 | 0.7 | GO:0030506 | ankyrin binding(GO:0030506) |
| 0.0 | 0.1 | GO:0004090 | carbonyl reductase (NADPH) activity(GO:0004090) |
| 0.0 | 0.2 | GO:0008597 | calcium-dependent protein serine/threonine phosphatase regulator activity(GO:0008597) |
| 0.0 | 0.3 | GO:0008553 | hydrogen-exporting ATPase activity, phosphorylative mechanism(GO:0008553) |
| 0.0 | 0.3 | GO:0097371 | MDM2/MDM4 family protein binding(GO:0097371) |
| 0.0 | 0.2 | GO:0022850 | serotonin-gated cation channel activity(GO:0022850) |
| 0.0 | 0.6 | GO:0008093 | cytoskeletal adaptor activity(GO:0008093) |
| 0.0 | 2.4 | GO:0002039 | p53 binding(GO:0002039) |
| 0.0 | 0.2 | GO:0042975 | peroxisome proliferator activated receptor binding(GO:0042975) |
| 0.0 | 0.5 | GO:0070273 | phosphatidylinositol-4-phosphate binding(GO:0070273) |
| 0.0 | 0.1 | GO:0035515 | oxidative RNA demethylase activity(GO:0035515) |
| 0.0 | 0.1 | GO:0031752 | D5 dopamine receptor binding(GO:0031752) |
| 0.0 | 0.9 | GO:0003950 | NAD+ ADP-ribosyltransferase activity(GO:0003950) |
| 0.0 | 0.6 | GO:0005112 | Notch binding(GO:0005112) |
| 0.0 | 0.7 | GO:0004115 | 3',5'-cyclic-AMP phosphodiesterase activity(GO:0004115) |
| 0.0 | 0.2 | GO:0030942 | endoplasmic reticulum signal peptide binding(GO:0030942) |
| 0.0 | 0.4 | GO:0070410 | co-SMAD binding(GO:0070410) |
| 0.0 | 0.1 | GO:0046976 | histone methyltransferase activity (H3-K27 specific)(GO:0046976) |
| 0.0 | 0.5 | GO:0008527 | taste receptor activity(GO:0008527) |
| 0.0 | 4.1 | GO:0005178 | integrin binding(GO:0005178) |
| 0.0 | 0.1 | GO:0004468 | lysine N-acetyltransferase activity, acting on acetyl phosphate as donor(GO:0004468) |
| 0.0 | 0.2 | GO:0004689 | phosphorylase kinase activity(GO:0004689) |
| 0.0 | 0.9 | GO:0004364 | glutathione transferase activity(GO:0004364) |
| 0.0 | 0.1 | GO:0004668 | protein-arginine deiminase activity(GO:0004668) |
| 0.0 | 0.2 | GO:0008035 | high-density lipoprotein particle binding(GO:0008035) |
| 0.0 | 0.4 | GO:0098748 | clathrin adaptor activity(GO:0035615) endocytic adaptor activity(GO:0098748) |
| 0.0 | 0.1 | GO:0004515 | nicotinate-nucleotide adenylyltransferase activity(GO:0004515) |
| 0.0 | 1.0 | GO:0001106 | RNA polymerase II transcription corepressor activity(GO:0001106) |
| 0.0 | 0.1 | GO:0047288 | monosialoganglioside sialyltransferase activity(GO:0047288) |
| 0.0 | 0.3 | GO:0005344 | oxygen transporter activity(GO:0005344) |
| 0.0 | 5.0 | GO:0003714 | transcription corepressor activity(GO:0003714) |
| 0.0 | 0.1 | GO:0005324 | long-chain fatty acid transporter activity(GO:0005324) |
| 0.0 | 0.1 | GO:0070290 | N-acylphosphatidylethanolamine-specific phospholipase D activity(GO:0070290) |
| 0.0 | 0.2 | GO:0008607 | phosphorylase kinase regulator activity(GO:0008607) |
| 0.0 | 0.1 | GO:0050698 | proteoglycan sulfotransferase activity(GO:0050698) |
| 0.0 | 0.2 | GO:0001206 | transcriptional repressor activity, RNA polymerase II distal enhancer sequence-specific binding(GO:0001206) |
| 0.0 | 0.4 | GO:0005003 | ephrin receptor activity(GO:0005003) |
| 0.0 | 2.4 | GO:0008565 | protein transporter activity(GO:0008565) |
| 0.0 | 1.1 | GO:0004712 | protein serine/threonine/tyrosine kinase activity(GO:0004712) |
| 0.0 | 0.1 | GO:0016721 | superoxide dismutase activity(GO:0004784) oxidoreductase activity, acting on superoxide radicals as acceptor(GO:0016721) |
| 0.0 | 0.3 | GO:0042923 | neuropeptide binding(GO:0042923) |
| 0.0 | 0.7 | GO:0005109 | frizzled binding(GO:0005109) |
| 0.0 | 0.2 | GO:0004972 | NMDA glutamate receptor activity(GO:0004972) |
| 0.0 | 0.2 | GO:0004645 | phosphorylase activity(GO:0004645) |
| 0.0 | 0.2 | GO:0005094 | Rho GDP-dissociation inhibitor activity(GO:0005094) |
| 0.0 | 0.1 | GO:0003875 | ADP-ribosylarginine hydrolase activity(GO:0003875) |
| 0.0 | 0.5 | GO:0001102 | RNA polymerase II activating transcription factor binding(GO:0001102) |
| 0.0 | 0.5 | GO:0005158 | insulin receptor binding(GO:0005158) |
| 0.0 | 0.1 | GO:0004792 | thiosulfate sulfurtransferase activity(GO:0004792) |
| 0.0 | 0.1 | GO:0034597 | phosphatidylinositol-4,5-bisphosphate 4-phosphatase activity(GO:0034597) |
| 0.0 | 0.2 | GO:0008191 | metalloendopeptidase inhibitor activity(GO:0008191) |
| 0.0 | 0.5 | GO:0031492 | nucleosomal DNA binding(GO:0031492) |
| 0.0 | 0.1 | GO:0019763 | immunoglobulin receptor activity(GO:0019763) |
| 0.0 | 0.6 | GO:0017046 | peptide hormone binding(GO:0017046) |
| 0.0 | 0.5 | GO:0046966 | thyroid hormone receptor binding(GO:0046966) |
| 0.0 | 0.8 | GO:0034987 | immunoglobulin receptor binding(GO:0034987) |
| 0.0 | 0.9 | GO:0019213 | deacetylase activity(GO:0019213) |
| 0.0 | 0.3 | GO:0097602 | cullin family protein binding(GO:0097602) |
| 0.0 | 0.4 | GO:0003924 | GTPase activity(GO:0003924) |
| 0.0 | 0.2 | GO:0001848 | complement binding(GO:0001848) |
| 0.0 | 0.4 | GO:0005184 | neuropeptide hormone activity(GO:0005184) |
| 0.0 | 0.4 | GO:0005212 | structural constituent of eye lens(GO:0005212) |
| 0.0 | 0.7 | GO:0001104 | RNA polymerase II transcription cofactor activity(GO:0001104) |
| 0.0 | 1.7 | GO:0001078 | transcriptional repressor activity, RNA polymerase II core promoter proximal region sequence-specific binding(GO:0001078) |
| 0.0 | 0.7 | GO:0004402 | histone acetyltransferase activity(GO:0004402) |
| 0.0 | 1.4 | GO:0001227 | transcriptional repressor activity, RNA polymerase II transcription regulatory region sequence-specific binding(GO:0001227) |
| 0.0 | 0.1 | GO:0008321 | Ral guanyl-nucleotide exchange factor activity(GO:0008321) |
| 0.0 | 0.1 | GO:0016907 | G-protein coupled acetylcholine receptor activity(GO:0016907) |
| 0.0 | 0.1 | GO:0035005 | 1-phosphatidylinositol-4-phosphate 3-kinase activity(GO:0035005) |
| 0.0 | 0.2 | GO:0035925 | mRNA 3'-UTR AU-rich region binding(GO:0035925) |
| 0.0 | 0.1 | GO:0003810 | protein-glutamine gamma-glutamyltransferase activity(GO:0003810) |
| 0.0 | 0.2 | GO:0008253 | 5'-nucleotidase activity(GO:0008253) |
| 0.0 | 0.2 | GO:0015143 | urate transmembrane transporter activity(GO:0015143) salt transmembrane transporter activity(GO:1901702) |
| 0.0 | 0.8 | GO:0017022 | myosin binding(GO:0017022) |
| 0.0 | 0.2 | GO:0042813 | Wnt-activated receptor activity(GO:0042813) |
| 0.0 | 0.1 | GO:1903763 | gap junction channel activity involved in cell communication by electrical coupling(GO:1903763) |
| 0.0 | 0.0 | GO:0004609 | phosphatidylserine decarboxylase activity(GO:0004609) |
| 0.0 | 0.5 | GO:0061631 | ubiquitin conjugating enzyme activity(GO:0061631) |
| 0.0 | 0.5 | GO:0046332 | SMAD binding(GO:0046332) |
Gene overrepresentation in C2:CP category:
| Log-likelihood per target | Total log-likelihood | Term | Description |
|---|---|---|---|
| 0.1 | 0.3 | PID TCR RAS PATHWAY | Ras signaling in the CD4+ TCR pathway |
| 0.1 | 0.6 | PID ERBB4 PATHWAY | ErbB4 signaling events |
| 0.1 | 2.8 | PID CONE PATHWAY | Visual signal transduction: Cones |
| 0.1 | 19.8 | NABA ECM GLYCOPROTEINS | Genes encoding structural ECM glycoproteins |
| 0.1 | 1.4 | PID ERB GENOMIC PATHWAY | Validated nuclear estrogen receptor beta network |
| 0.1 | 1.3 | PID IL5 PATHWAY | IL5-mediated signaling events |
| 0.1 | 0.7 | PID PI3KCI PATHWAY | Class I PI3K signaling events |
| 0.0 | 0.7 | SA G2 AND M PHASES | Cdc25 activates the cdc2/cyclin B complex to induce the G2/M transition. |
| 0.0 | 2.9 | PID HES HEY PATHWAY | Notch-mediated HES/HEY network |
| 0.0 | 3.2 | PID IL6 7 PATHWAY | IL6-mediated signaling events |
| 0.0 | 2.4 | PID ECADHERIN NASCENT AJ PATHWAY | E-cadherin signaling in the nascent adherens junction |
| 0.0 | 0.2 | PID ER NONGENOMIC PATHWAY | Plasma membrane estrogen receptor signaling |
| 0.0 | 0.3 | PID EPO PATHWAY | EPO signaling pathway |
| 0.0 | 0.9 | PID PRL SIGNALING EVENTS PATHWAY | Signaling events mediated by PRL |
| 0.0 | 1.4 | PID ALK1 PATHWAY | ALK1 signaling events |
| 0.0 | 1.0 | PID EPHA2 FWD PATHWAY | EPHA2 forward signaling |
| 0.0 | 0.9 | SIG CD40PATHWAYMAP | Genes related to CD40 signaling |
| 0.0 | 1.5 | ST DIFFERENTIATION PATHWAY IN PC12 CELLS | Differentiation Pathway in PC12 Cells; this is a specific case of PAC1 Receptor Pathway. |
| 0.0 | 0.8 | ST MYOCYTE AD PATHWAY | Myocyte Adrenergic Pathway is a specific case of the generalized Adrenergic Pathway. |
| 0.0 | 0.4 | PID P38 MK2 PATHWAY | p38 signaling mediated by MAPKAP kinases |
| 0.0 | 0.7 | PID LIS1 PATHWAY | Lissencephaly gene (LIS1) in neuronal migration and development |
| 0.0 | 1.9 | PID AVB3 INTEGRIN PATHWAY | Integrins in angiogenesis |
| 0.0 | 1.2 | PID PI3KCI AKT PATHWAY | Class I PI3K signaling events mediated by Akt |
| 0.0 | 0.8 | PID HIF2PATHWAY | HIF-2-alpha transcription factor network |
| 0.0 | 0.0 | PID REELIN PATHWAY | Reelin signaling pathway |
| 0.0 | 1.2 | PID TGFBR PATHWAY | TGF-beta receptor signaling |
| 0.0 | 0.6 | SA G1 AND S PHASES | Cdk2, 4, and 6 bind cyclin D in G1, while cdk2/cyclin E promotes the G1/S transition. |
| 0.0 | 2.1 | PID CMYB PATHWAY | C-MYB transcription factor network |
| 0.0 | 0.5 | PID HEDGEHOG 2PATHWAY | Signaling events mediated by the Hedgehog family |
| 0.0 | 1.1 | PID ATF2 PATHWAY | ATF-2 transcription factor network |
| 0.0 | 0.1 | PID ALK2 PATHWAY | ALK2 signaling events |
| 0.0 | 0.3 | PID RET PATHWAY | Signaling events regulated by Ret tyrosine kinase |
| 0.0 | 0.3 | PID P38 ALPHA BETA PATHWAY | Regulation of p38-alpha and p38-beta |
| 0.0 | 0.2 | PID SMAD2 3PATHWAY | Regulation of cytoplasmic and nuclear SMAD2/3 signaling |
| 0.0 | 0.3 | PID RETINOIC ACID PATHWAY | Retinoic acid receptors-mediated signaling |
| 0.0 | 0.7 | PID IL4 2PATHWAY | IL4-mediated signaling events |
| 0.0 | 0.3 | PID DNA PK PATHWAY | DNA-PK pathway in nonhomologous end joining |
| 0.0 | 0.2 | PID S1P S1P4 PATHWAY | S1P4 pathway |
| 0.0 | 0.6 | PID HNF3A PATHWAY | FOXA1 transcription factor network |
| 0.0 | 0.2 | PID RHOA PATHWAY | RhoA signaling pathway |
| 0.0 | 0.7 | PID ARF6 TRAFFICKING PATHWAY | Arf6 trafficking events |
| 0.0 | 0.8 | PID ERBB1 INTERNALIZATION PATHWAY | Internalization of ErbB1 |
| 0.0 | 0.5 | PID FOXO PATHWAY | FoxO family signaling |
| 0.0 | 0.5 | PID HDAC CLASSII PATHWAY | Signaling events mediated by HDAC Class II |
| 0.0 | 0.2 | PID ARF 3PATHWAY | Arf1 pathway |
| 0.0 | 0.2 | PID INTEGRIN1 PATHWAY | Beta1 integrin cell surface interactions |
Gene overrepresentation in C2:CP:REACTOME category:
| Log-likelihood per target | Total log-likelihood | Term | Description |
|---|---|---|---|
| 0.1 | 2.7 | REACTOME RAS ACTIVATION UOPN CA2 INFUX THROUGH NMDA RECEPTOR | Genes involved in Ras activation uopn Ca2+ infux through NMDA receptor |
| 0.1 | 1.0 | REACTOME REMOVAL OF THE FLAP INTERMEDIATE FROM THE C STRAND | Genes involved in Removal of the Flap Intermediate from the C-strand |
| 0.1 | 1.9 | REACTOME REGULATION OF INSULIN LIKE GROWTH FACTOR IGF ACTIVITY BY INSULIN LIKE GROWTH FACTOR BINDING PROTEINS IGFBPS | Genes involved in Regulation of Insulin-like Growth Factor (IGF) Activity by Insulin-like Growth Factor Binding Proteins (IGFBPs) |
| 0.1 | 3.4 | REACTOME SYNTHESIS OF PIPS AT THE PLASMA MEMBRANE | Genes involved in Synthesis of PIPs at the plasma membrane |
| 0.1 | 0.1 | REACTOME DESTABILIZATION OF MRNA BY BRF1 | Genes involved in Destabilization of mRNA by Butyrate Response Factor 1 (BRF1) |
| 0.1 | 3.3 | REACTOME SMOOTH MUSCLE CONTRACTION | Genes involved in Smooth Muscle Contraction |
| 0.1 | 1.6 | REACTOME HORMONE SENSITIVE LIPASE HSL MEDIATED TRIACYLGLYCEROL HYDROLYSIS | Genes involved in Hormone-sensitive lipase (HSL)-mediated triacylglycerol hydrolysis |
| 0.1 | 0.9 | REACTOME DOPAMINE NEUROTRANSMITTER RELEASE CYCLE | Genes involved in Dopamine Neurotransmitter Release Cycle |
| 0.0 | 0.8 | REACTOME MITOCHONDRIAL FATTY ACID BETA OXIDATION | Genes involved in Mitochondrial Fatty Acid Beta-Oxidation |
| 0.0 | 0.6 | REACTOME GLYCOPROTEIN HORMONES | Genes involved in Glycoprotein hormones |
| 0.0 | 1.2 | REACTOME CIRCADIAN REPRESSION OF EXPRESSION BY REV ERBA | Genes involved in Circadian Repression of Expression by REV-ERBA |
| 0.0 | 1.2 | REACTOME AMINO ACID SYNTHESIS AND INTERCONVERSION TRANSAMINATION | Genes involved in Amino acid synthesis and interconversion (transamination) |
| 0.0 | 0.7 | REACTOME SEMA3A PLEXIN REPULSION SIGNALING BY INHIBITING INTEGRIN ADHESION | Genes involved in SEMA3A-Plexin repulsion signaling by inhibiting Integrin adhesion |
| 0.0 | 1.7 | REACTOME GLUTATHIONE CONJUGATION | Genes involved in Glutathione conjugation |
| 0.0 | 0.4 | REACTOME DESTABILIZATION OF MRNA BY TRISTETRAPROLIN TTP | Genes involved in Destabilization of mRNA by Tristetraprolin (TTP) |
| 0.0 | 0.8 | REACTOME ENDOGENOUS STEROLS | Genes involved in Endogenous sterols |
| 0.0 | 0.3 | REACTOME SEMA4D INDUCED CELL MIGRATION AND GROWTH CONE COLLAPSE | Genes involved in Sema4D induced cell migration and growth-cone collapse |
| 0.0 | 0.7 | REACTOME CYCLIN A B1 ASSOCIATED EVENTS DURING G2 M TRANSITION | Genes involved in Cyclin A/B1 associated events during G2/M transition |
| 0.0 | 0.7 | REACTOME VIRAL MESSENGER RNA SYNTHESIS | Genes involved in Viral Messenger RNA Synthesis |
| 0.0 | 0.1 | REACTOME SEMAPHORIN INTERACTIONS | Genes involved in Semaphorin interactions |
| 0.0 | 0.8 | REACTOME INSULIN SYNTHESIS AND PROCESSING | Genes involved in Insulin Synthesis and Processing |
| 0.0 | 0.9 | REACTOME INTERACTION BETWEEN L1 AND ANKYRINS | Genes involved in Interaction between L1 and Ankyrins |
| 0.0 | 1.3 | REACTOME REGULATION OF HYPOXIA INDUCIBLE FACTOR HIF BY OXYGEN | Genes involved in Regulation of Hypoxia-inducible Factor (HIF) by Oxygen |
| 0.0 | 2.5 | REACTOME LOSS OF NLP FROM MITOTIC CENTROSOMES | Genes involved in Loss of Nlp from mitotic centrosomes |
| 0.0 | 0.8 | REACTOME DESTABILIZATION OF MRNA BY KSRP | Genes involved in Destabilization of mRNA by KSRP |
| 0.0 | 0.5 | REACTOME SYNTHESIS SECRETION AND DEACYLATION OF GHRELIN | Genes involved in Synthesis, Secretion, and Deacylation of Ghrelin |
| 0.0 | 0.2 | REACTOME SYNTHESIS OF PIPS AT THE LATE ENDOSOME MEMBRANE | Genes involved in Synthesis of PIPs at the late endosome membrane |
| 0.0 | 0.5 | REACTOME CLASS C 3 METABOTROPIC GLUTAMATE PHEROMONE RECEPTORS | Genes involved in Class C/3 (Metabotropic glutamate/pheromone receptors) |
| 0.0 | 0.4 | REACTOME SEMA3A PAK DEPENDENT AXON REPULSION | Genes involved in Sema3A PAK dependent Axon repulsion |
| 0.0 | 1.8 | REACTOME TRANSCRIPTIONAL REGULATION OF WHITE ADIPOCYTE DIFFERENTIATION | Genes involved in Transcriptional Regulation of White Adipocyte Differentiation |
| 0.0 | 0.3 | REACTOME PURINE CATABOLISM | Genes involved in Purine catabolism |
| 0.0 | 0.6 | REACTOME DOWNREGULATION OF SMAD2 3 SMAD4 TRANSCRIPTIONAL ACTIVITY | Genes involved in Downregulation of SMAD2/3:SMAD4 transcriptional activity |
| 0.0 | 0.8 | REACTOME INHIBITION OF VOLTAGE GATED CA2 CHANNELS VIA GBETA GAMMA SUBUNITS | Genes involved in Inhibition of voltage gated Ca2+ channels via Gbeta/gamma subunits |
| 0.0 | 0.7 | REACTOME KERATAN SULFATE BIOSYNTHESIS | Genes involved in Keratan sulfate biosynthesis |
| 0.0 | 0.3 | REACTOME TRAFFICKING OF GLUR2 CONTAINING AMPA RECEPTORS | Genes involved in Trafficking of GluR2-containing AMPA receptors |
| 0.0 | 0.8 | REACTOME PIP3 ACTIVATES AKT SIGNALING | Genes involved in PIP3 activates AKT signaling |
| 0.0 | 0.2 | REACTOME RECRUITMENT OF NUMA TO MITOTIC CENTROSOMES | Genes involved in Recruitment of NuMA to mitotic centrosomes |
| 0.0 | 0.3 | REACTOME ROLE OF DCC IN REGULATING APOPTOSIS | Genes involved in Role of DCC in regulating apoptosis |
| 0.0 | 0.2 | REACTOME ABORTIVE ELONGATION OF HIV1 TRANSCRIPT IN THE ABSENCE OF TAT | Genes involved in Abortive elongation of HIV-1 transcript in the absence of Tat |
| 0.0 | 0.2 | REACTOME ANTIGEN ACTIVATES B CELL RECEPTOR LEADING TO GENERATION OF SECOND MESSENGERS | Genes involved in Antigen Activates B Cell Receptor Leading to Generation of Second Messengers |
| 0.0 | 1.1 | REACTOME PPARA ACTIVATES GENE EXPRESSION | Genes involved in PPARA Activates Gene Expression |
| 0.0 | 0.3 | REACTOME ALPHA LINOLENIC ACID ALA METABOLISM | Genes involved in alpha-linolenic acid (ALA) metabolism |
| 0.0 | 0.1 | REACTOME GLUTAMATE NEUROTRANSMITTER RELEASE CYCLE | Genes involved in Glutamate Neurotransmitter Release Cycle |
| 0.0 | 0.4 | REACTOME CHYLOMICRON MEDIATED LIPID TRANSPORT | Genes involved in Chylomicron-mediated lipid transport |
| 0.0 | 0.7 | REACTOME AMINE LIGAND BINDING RECEPTORS | Genes involved in Amine ligand-binding receptors |
| 0.0 | 0.3 | REACTOME RETROGRADE NEUROTROPHIN SIGNALLING | Genes involved in Retrograde neurotrophin signalling |
| 0.0 | 0.4 | REACTOME PHOSPHORYLATION OF THE APC C | Genes involved in Phosphorylation of the APC/C |
| 0.0 | 0.3 | REACTOME ABCA TRANSPORTERS IN LIPID HOMEOSTASIS | Genes involved in ABCA transporters in lipid homeostasis |
| 0.0 | 0.5 | REACTOME SPHINGOLIPID DE NOVO BIOSYNTHESIS | Genes involved in Sphingolipid de novo biosynthesis |
| 0.0 | 0.2 | REACTOME REGULATORY RNA PATHWAYS | Genes involved in Regulatory RNA pathways |
| 0.0 | 0.3 | REACTOME SIGNALING BY HIPPO | Genes involved in Signaling by Hippo |
| 0.0 | 0.3 | REACTOME INITIAL TRIGGERING OF COMPLEMENT | Genes involved in Initial triggering of complement |
| 0.0 | 0.2 | REACTOME SYNTHESIS OF PIPS AT THE GOLGI MEMBRANE | Genes involved in Synthesis of PIPs at the Golgi membrane |
| 0.0 | 0.9 | REACTOME METABOLISM OF VITAMINS AND COFACTORS | Genes involved in Metabolism of vitamins and cofactors |
| 0.0 | 0.6 | REACTOME AMINO ACID TRANSPORT ACROSS THE PLASMA MEMBRANE | Genes involved in Amino acid transport across the plasma membrane |
| 0.0 | 0.2 | REACTOME OTHER SEMAPHORIN INTERACTIONS | Genes involved in Other semaphorin interactions |
| 0.0 | 0.1 | REACTOME COPI MEDIATED TRANSPORT | Genes involved in COPI Mediated Transport |
| 0.0 | 0.3 | REACTOME SULFUR AMINO ACID METABOLISM | Genes involved in Sulfur amino acid metabolism |