Project
Epithelial-Mesenchymal Transition, human (Scheel, 2011)
Navigation
Downloads
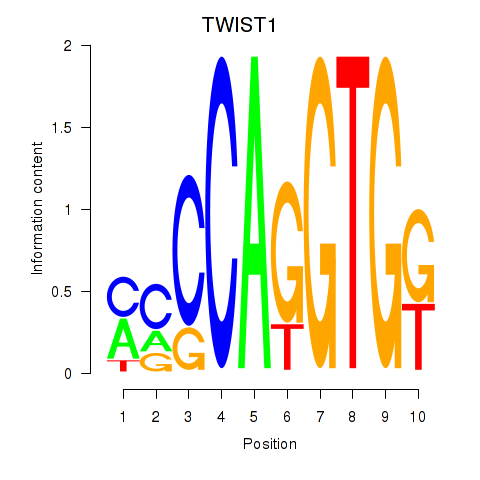
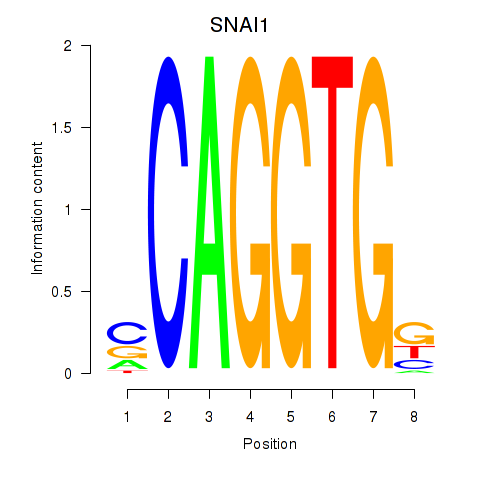
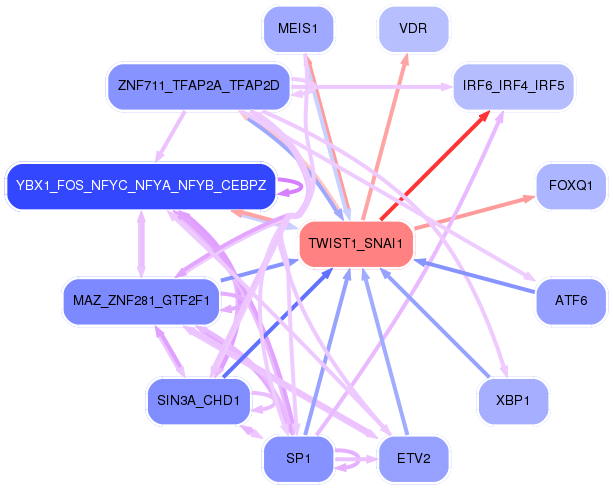
Results for TWIST1_SNAI1
Z-value: 2.12
Motif logo
Transcription factors associated with TWIST1_SNAI1
| Gene Symbol | Gene ID | Gene Info |
|---|---|---|
|
TWIST1
|
ENSG00000122691.8 | TWIST1 |
|
SNAI1
|
ENSG00000124216.3 | SNAI1 |
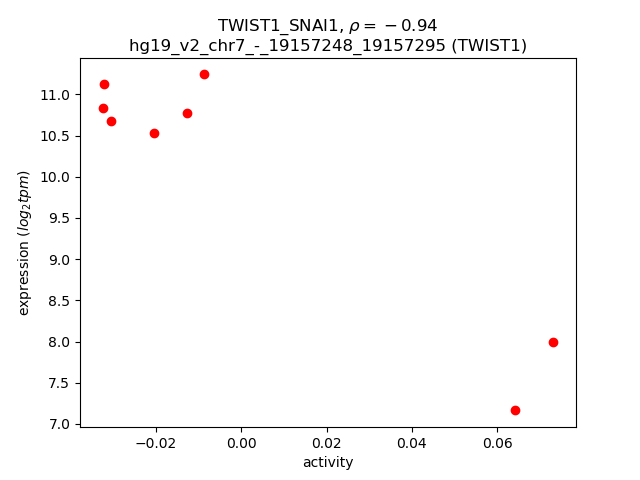
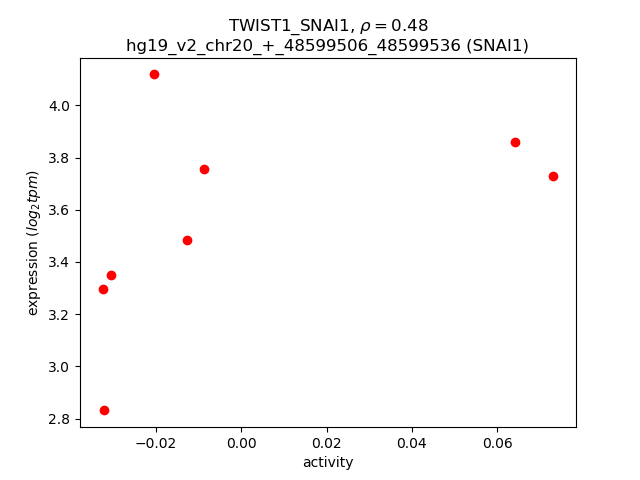
Activity-expression correlation:
| Gene | Promoter | Pearson corr. coef. | P-value | Plot |
|---|---|---|---|---|
| TWIST1 | hg19_v2_chr7_-_19157248_19157295 | -0.94 | 4.4e-04 | Click! |
| SNAI1 | hg19_v2_chr20_+_48599506_48599536 | 0.48 | 2.3e-01 | Click! |
Activity profile of TWIST1_SNAI1 motif
Sorted Z-values of TWIST1_SNAI1 motif
Network of associatons between targets according to the STRING database.

First level regulatory network of TWIST1_SNAI1
| Promoter | Score | Transcript | Gene | Gene Info |
|---|---|---|---|---|
| chr1_-_160990886 | 5.37 |
ENST00000537746.1 |
F11R |
F11 receptor |
| chr1_+_35247859 | 5.16 |
ENST00000373362.3 |
GJB3 |
gap junction protein, beta 3, 31kDa |
| chr2_+_47596287 | 4.60 |
ENST00000263735.4 |
EPCAM |
epithelial cell adhesion molecule |
| chr19_-_49565254 | 3.94 |
ENST00000593537.1 |
NTF4 |
neurotrophin 4 |
| chr3_-_111314230 | 3.88 |
ENST00000317012.4 |
ZBED2 |
zinc finger, BED-type containing 2 |
| chr16_+_68679193 | 3.81 |
ENST00000581171.1 |
CDH3 |
cadherin 3, type 1, P-cadherin (placental) |
| chr4_+_40198527 | 3.78 |
ENST00000381799.5 |
RHOH |
ras homolog family member H |
| chr1_+_60280458 | 3.68 |
ENST00000455990.1 ENST00000371208.3 |
HOOK1 |
hook microtubule-tethering protein 1 |
| chr19_+_35609380 | 3.67 |
ENST00000604621.1 |
FXYD3 |
FXYD domain containing ion transport regulator 3 |
| chr17_-_39677971 | 3.49 |
ENST00000393976.2 |
KRT15 |
keratin 15 |
| chr19_-_51456198 | 3.46 |
ENST00000594846.1 |
KLK5 |
kallikrein-related peptidase 5 |
| chr15_+_41136586 | 3.20 |
ENST00000431806.1 |
SPINT1 |
serine peptidase inhibitor, Kunitz type 1 |
| chr1_-_209979465 | 2.92 |
ENST00000542854.1 |
IRF6 |
interferon regulatory factor 6 |
| chr6_+_150464155 | 2.82 |
ENST00000361131.4 |
PPP1R14C |
protein phosphatase 1, regulatory (inhibitor) subunit 14C |
| chr19_-_54676846 | 2.75 |
ENST00000301187.4 |
TMC4 |
transmembrane channel-like 4 |
| chrX_+_105969893 | 2.75 |
ENST00000255499.2 |
RNF128 |
ring finger protein 128, E3 ubiquitin protein ligase |
| chr6_-_30043539 | 2.70 |
ENST00000376751.3 ENST00000244360.6 |
RNF39 |
ring finger protein 39 |
| chr14_-_23652849 | 2.59 |
ENST00000316902.7 ENST00000469263.1 ENST00000525062.1 ENST00000524758.1 |
SLC7A8 |
solute carrier family 7 (amino acid transporter light chain, L system), member 8 |
| chr9_+_35673853 | 2.55 |
ENST00000378357.4 |
CA9 |
carbonic anhydrase IX |
| chr16_+_4838393 | 2.51 |
ENST00000589721.1 |
SMIM22 |
small integral membrane protein 22 |
| chr4_-_10023095 | 2.49 |
ENST00000264784.3 |
SLC2A9 |
solute carrier family 2 (facilitated glucose transporter), member 9 |
| chr15_+_90728145 | 2.42 |
ENST00000561085.1 ENST00000379122.3 ENST00000332496.6 |
SEMA4B |
sema domain, immunoglobulin domain (Ig), transmembrane domain (TM) and short cytoplasmic domain, (semaphorin) 4B |
| chr19_-_54676884 | 2.41 |
ENST00000376591.4 |
TMC4 |
transmembrane channel-like 4 |
| chr16_+_68771128 | 2.40 |
ENST00000261769.5 ENST00000422392.2 |
CDH1 |
cadherin 1, type 1, E-cadherin (epithelial) |
| chr6_+_80341000 | 2.35 |
ENST00000369838.4 |
SH3BGRL2 |
SH3 domain binding glutamic acid-rich protein like 2 |
| chr19_+_38755042 | 2.32 |
ENST00000301244.7 |
SPINT2 |
serine peptidase inhibitor, Kunitz type, 2 |
| chr11_-_88070920 | 2.30 |
ENST00000524463.1 ENST00000227266.5 |
CTSC |
cathepsin C |
| chr1_-_201368707 | 2.17 |
ENST00000391967.2 |
LAD1 |
ladinin 1 |
| chr19_-_10697895 | 2.12 |
ENST00000591240.1 ENST00000589684.1 ENST00000591676.1 ENST00000250244.6 ENST00000590923.1 |
AP1M2 |
adaptor-related protein complex 1, mu 2 subunit |
| chr19_-_49567124 | 2.11 |
ENST00000301411.3 |
NTF4 |
neurotrophin 4 |
| chr1_+_27668505 | 2.08 |
ENST00000318074.5 |
SYTL1 |
synaptotagmin-like 1 |
| chr1_-_209979375 | 2.07 |
ENST00000367021.3 |
IRF6 |
interferon regulatory factor 6 |
| chr4_+_89299885 | 2.00 |
ENST00000380265.5 ENST00000273960.3 |
HERC6 |
HECT and RLD domain containing E3 ubiquitin protein ligase family member 6 |
| chr18_+_47088401 | 1.93 |
ENST00000261292.4 ENST00000427224.2 ENST00000580036.1 |
LIPG |
lipase, endothelial |
| chr19_-_35992780 | 1.93 |
ENST00000593342.1 ENST00000601650.1 ENST00000408915.2 |
DMKN |
dermokine |
| chr4_-_84255935 | 1.92 |
ENST00000513463.1 |
HPSE |
heparanase |
| chr18_+_33877654 | 1.91 |
ENST00000257209.4 ENST00000445677.1 ENST00000590592.1 ENST00000359247.4 |
FHOD3 |
formin homology 2 domain containing 3 |
| chr2_-_74669009 | 1.87 |
ENST00000272430.5 |
RTKN |
rhotekin |
| chr16_+_68678739 | 1.87 |
ENST00000264012.4 |
CDH3 |
cadherin 3, type 1, P-cadherin (placental) |
| chr14_-_61747949 | 1.84 |
ENST00000355702.2 |
TMEM30B |
transmembrane protein 30B |
| chr1_-_201368653 | 1.83 |
ENST00000367313.3 |
LAD1 |
ladinin 1 |
| chr11_+_1855645 | 1.81 |
ENST00000381968.3 ENST00000381978.3 |
SYT8 |
synaptotagmin VIII |
| chr16_+_68678892 | 1.80 |
ENST00000429102.2 |
CDH3 |
cadherin 3, type 1, P-cadherin (placental) |
| chr19_+_38755203 | 1.80 |
ENST00000587090.1 ENST00000454580.3 |
SPINT2 |
serine peptidase inhibitor, Kunitz type, 2 |
| chr1_+_156030937 | 1.76 |
ENST00000361084.5 |
RAB25 |
RAB25, member RAS oncogene family |
| chr6_+_7541845 | 1.76 |
ENST00000418664.2 |
DSP |
desmoplakin |
| chr16_+_3014217 | 1.75 |
ENST00000572045.1 |
KREMEN2 |
kringle containing transmembrane protein 2 |
| chr6_+_7541808 | 1.73 |
ENST00000379802.3 |
DSP |
desmoplakin |
| chr19_+_6464243 | 1.73 |
ENST00000600229.1 ENST00000356762.3 |
CRB3 |
crumbs homolog 3 (Drosophila) |
| chr9_+_101569944 | 1.72 |
ENST00000375011.3 |
GALNT12 |
UDP-N-acetyl-alpha-D-galactosamine:polypeptide N-acetylgalactosaminyltransferase 12 (GalNAc-T12) |
| chr14_+_67999999 | 1.72 |
ENST00000329153.5 |
PLEKHH1 |
pleckstrin homology domain containing, family H (with MyTH4 domain) member 1 |
| chr16_+_3014269 | 1.71 |
ENST00000575885.1 ENST00000571007.1 ENST00000319500.6 |
KREMEN2 |
kringle containing transmembrane protein 2 |
| chr19_+_751122 | 1.65 |
ENST00000215582.6 |
MISP |
mitotic spindle positioning |
| chr12_+_53342625 | 1.65 |
ENST00000388837.2 ENST00000550600.1 ENST00000388835.3 |
KRT18 |
keratin 18 |
| chr1_-_156675535 | 1.64 |
ENST00000368221.1 |
CRABP2 |
cellular retinoic acid binding protein 2 |
| chr1_+_1981890 | 1.63 |
ENST00000378567.3 ENST00000468310.1 |
PRKCZ |
protein kinase C, zeta |
| chr17_+_73521763 | 1.61 |
ENST00000167462.5 ENST00000375227.4 ENST00000392550.3 ENST00000578363.1 ENST00000579392.1 |
LLGL2 |
lethal giant larvae homolog 2 (Drosophila) |
| chr19_+_6464502 | 1.61 |
ENST00000308243.7 |
CRB3 |
crumbs homolog 3 (Drosophila) |
| chr15_+_101420028 | 1.61 |
ENST00000557963.1 ENST00000346623.6 |
ALDH1A3 |
aldehyde dehydrogenase 1 family, member A3 |
| chr17_+_39394250 | 1.60 |
ENST00000254072.6 |
KRTAP9-8 |
keratin associated protein 9-8 |
| chr8_+_22436248 | 1.57 |
ENST00000308354.7 |
PDLIM2 |
PDZ and LIM domain 2 (mystique) |
| chr8_-_81083731 | 1.56 |
ENST00000379096.5 |
TPD52 |
tumor protein D52 |
| chr11_+_66824276 | 1.55 |
ENST00000308831.2 |
RHOD |
ras homolog family member D |
| chr8_+_120220561 | 1.52 |
ENST00000276681.6 |
MAL2 |
mal, T-cell differentiation protein 2 (gene/pseudogene) |
| chr1_+_95285896 | 1.50 |
ENST00000446120.2 ENST00000271227.6 ENST00000527077.1 ENST00000529450.1 |
SLC44A3 |
solute carrier family 44, member 3 |
| chr1_-_55266926 | 1.50 |
ENST00000371276.4 |
TTC22 |
tetratricopeptide repeat domain 22 |
| chr7_+_16793160 | 1.45 |
ENST00000262067.4 |
TSPAN13 |
tetraspanin 13 |
| chr11_+_68080077 | 1.44 |
ENST00000294304.7 |
LRP5 |
low density lipoprotein receptor-related protein 5 |
| chr1_+_44399466 | 1.43 |
ENST00000498139.2 ENST00000491846.1 |
ARTN |
artemin |
| chr19_+_35606692 | 1.43 |
ENST00000406242.3 ENST00000454903.2 |
FXYD3 |
FXYD domain containing ion transport regulator 3 |
| chr1_-_156675368 | 1.40 |
ENST00000368222.3 |
CRABP2 |
cellular retinoic acid binding protein 2 |
| chr12_-_51785182 | 1.36 |
ENST00000356317.3 ENST00000603188.1 ENST00000604847.1 ENST00000604506.1 |
GALNT6 |
UDP-N-acetyl-alpha-D-galactosamine:polypeptide N-acetylgalactosaminyltransferase 6 (GalNAc-T6) |
| chr19_+_45281118 | 1.34 |
ENST00000270279.3 ENST00000341505.4 |
CBLC |
Cbl proto-oncogene C, E3 ubiquitin protein ligase |
| chr16_+_67233412 | 1.34 |
ENST00000477898.1 |
ELMO3 |
engulfment and cell motility 3 |
| chr11_+_45944190 | 1.33 |
ENST00000401752.1 ENST00000389968.3 ENST00000325468.5 ENST00000536139.1 |
GYLTL1B |
glycosyltransferase-like 1B |
| chr1_+_95582881 | 1.31 |
ENST00000370203.4 ENST00000456991.1 |
TMEM56 |
transmembrane protein 56 |
| chr21_+_43639211 | 1.27 |
ENST00000450121.1 ENST00000398449.3 ENST00000361802.2 |
ABCG1 |
ATP-binding cassette, sub-family G (WHITE), member 1 |
| chr5_-_149682447 | 1.26 |
ENST00000328668.7 |
ARSI |
arylsulfatase family, member I |
| chr8_-_144815966 | 1.26 |
ENST00000388913.3 |
FAM83H |
family with sequence similarity 83, member H |
| chr2_+_17721920 | 1.26 |
ENST00000295156.4 |
VSNL1 |
visinin-like 1 |
| chr19_-_19739007 | 1.25 |
ENST00000586703.1 ENST00000591042.1 ENST00000407877.3 |
LPAR2 |
lysophosphatidic acid receptor 2 |
| chr8_+_22438009 | 1.25 |
ENST00000409417.1 |
PDLIM2 |
PDZ and LIM domain 2 (mystique) |
| chr1_-_231175964 | 1.25 |
ENST00000366654.4 |
FAM89A |
family with sequence similarity 89, member A |
| chr11_+_120081475 | 1.23 |
ENST00000328965.4 |
OAF |
OAF homolog (Drosophila) |
| chr6_+_54711533 | 1.22 |
ENST00000306858.7 |
FAM83B |
family with sequence similarity 83, member B |
| chr11_+_66824346 | 1.18 |
ENST00000532559.1 |
RHOD |
ras homolog family member D |
| chr1_+_95286151 | 1.18 |
ENST00000467909.1 ENST00000422520.2 ENST00000532427.1 |
SLC44A3 |
solute carrier family 44, member 3 |
| chr17_-_18908040 | 1.17 |
ENST00000388995.6 |
FAM83G |
family with sequence similarity 83, member G |
| chr18_-_74844713 | 1.15 |
ENST00000397860.3 |
MBP |
myelin basic protein |
| chr17_-_39274606 | 1.15 |
ENST00000391413.2 |
KRTAP4-11 |
keratin associated protein 4-11 |
| chr19_+_35739280 | 1.14 |
ENST00000602122.1 |
LSR |
lipolysis stimulated lipoprotein receptor |
| chr11_-_119993979 | 1.14 |
ENST00000524816.3 ENST00000525327.1 |
TRIM29 |
tripartite motif containing 29 |
| chr22_-_37882395 | 1.13 |
ENST00000416983.3 ENST00000424765.2 ENST00000356998.3 |
MFNG |
MFNG O-fucosylpeptide 3-beta-N-acetylglucosaminyltransferase |
| chr3_+_111718036 | 1.13 |
ENST00000455401.2 |
TAGLN3 |
transgelin 3 |
| chr8_-_81083890 | 1.13 |
ENST00000518937.1 |
TPD52 |
tumor protein D52 |
| chr2_+_102615416 | 1.13 |
ENST00000393414.2 |
IL1R2 |
interleukin 1 receptor, type II |
| chr9_-_140196703 | 1.11 |
ENST00000356628.2 |
NRARP |
NOTCH-regulated ankyrin repeat protein |
| chr18_+_29077990 | 1.10 |
ENST00000261590.8 |
DSG2 |
desmoglein 2 |
| chr18_-_47721447 | 1.10 |
ENST00000285039.7 |
MYO5B |
myosin VB |
| chr1_+_109792641 | 1.09 |
ENST00000271332.3 |
CELSR2 |
cadherin, EGF LAG seven-pass G-type receptor 2 |
| chr2_-_70780572 | 1.09 |
ENST00000450929.1 |
TGFA |
transforming growth factor, alpha |
| chr17_-_7165662 | 1.08 |
ENST00000571881.2 ENST00000360325.7 |
CLDN7 |
claudin 7 |
| chr16_+_4845379 | 1.08 |
ENST00000588606.1 ENST00000586005.1 |
SMIM22 |
small integral membrane protein 22 |
| chr2_-_71454185 | 1.08 |
ENST00000244221.8 |
PAIP2B |
poly(A) binding protein interacting protein 2B |
| chr4_+_106816592 | 1.07 |
ENST00000379987.2 ENST00000453617.2 ENST00000427316.2 ENST00000514622.1 ENST00000305572.8 |
NPNT |
nephronectin |
| chr1_+_31885963 | 1.07 |
ENST00000373709.3 |
SERINC2 |
serine incorporator 2 |
| chr2_+_223289208 | 1.06 |
ENST00000321276.7 |
SGPP2 |
sphingosine-1-phosphate phosphatase 2 |
| chr1_+_15256230 | 1.06 |
ENST00000376028.4 ENST00000400798.2 |
KAZN |
kazrin, periplakin interacting protein |
| chrX_+_16804544 | 1.06 |
ENST00000380122.5 ENST00000398155.4 |
TXLNG |
taxilin gamma |
| chr1_+_32042131 | 1.05 |
ENST00000271064.7 ENST00000537531.1 |
TINAGL1 |
tubulointerstitial nephritis antigen-like 1 |
| chr3_+_111717600 | 1.04 |
ENST00000273368.4 |
TAGLN3 |
transgelin 3 |
| chr17_-_7197881 | 1.02 |
ENST00000007699.5 |
YBX2 |
Y box binding protein 2 |
| chr19_+_38810447 | 1.02 |
ENST00000263372.3 |
KCNK6 |
potassium channel, subfamily K, member 6 |
| chr1_-_12677714 | 0.98 |
ENST00000376223.2 |
DHRS3 |
dehydrogenase/reductase (SDR family) member 3 |
| chr4_-_36246060 | 0.97 |
ENST00000303965.4 |
ARAP2 |
ArfGAP with RhoGAP domain, ankyrin repeat and PH domain 2 |
| chr4_+_89299994 | 0.96 |
ENST00000264346.7 |
HERC6 |
HECT and RLD domain containing E3 ubiquitin protein ligase family member 6 |
| chrX_-_102565932 | 0.96 |
ENST00000372674.1 ENST00000372677.3 |
BEX2 |
brain expressed X-linked 2 |
| chr17_+_7942424 | 0.96 |
ENST00000573359.1 |
ALOX15B |
arachidonate 15-lipoxygenase, type B |
| chr6_+_27215494 | 0.95 |
ENST00000230582.3 |
PRSS16 |
protease, serine, 16 (thymus) |
| chr8_+_22436635 | 0.95 |
ENST00000452226.1 ENST00000397760.4 ENST00000339162.7 ENST00000397761.2 |
PDLIM2 |
PDZ and LIM domain 2 (mystique) |
| chr17_+_37894179 | 0.94 |
ENST00000577695.1 ENST00000309156.4 ENST00000309185.3 |
GRB7 |
growth factor receptor-bound protein 7 |
| chr2_+_66666432 | 0.94 |
ENST00000495021.2 |
MEIS1 |
Meis homeobox 1 |
| chr6_+_1312675 | 0.94 |
ENST00000296839.2 |
FOXQ1 |
forkhead box Q1 |
| chr7_+_73242490 | 0.93 |
ENST00000431918.1 |
CLDN4 |
claudin 4 |
| chr9_+_132096166 | 0.92 |
ENST00000436710.1 |
RP11-65J3.1 |
RP11-65J3.1 |
| chr6_+_27215471 | 0.92 |
ENST00000421826.2 |
PRSS16 |
protease, serine, 16 (thymus) |
| chr15_-_52587945 | 0.91 |
ENST00000443683.2 ENST00000558479.1 ENST00000261839.7 |
MYO5C |
myosin VC |
| chr17_-_39280419 | 0.91 |
ENST00000394014.1 |
KRTAP4-12 |
keratin associated protein 4-12 |
| chr15_+_74833518 | 0.90 |
ENST00000346246.5 |
ARID3B |
AT rich interactive domain 3B (BRIGHT-like) |
| chr11_+_59522532 | 0.89 |
ENST00000337979.4 ENST00000535361.1 |
STX3 |
syntaxin 3 |
| chr8_+_32405728 | 0.88 |
ENST00000523079.1 ENST00000338921.4 ENST00000356819.4 ENST00000287845.5 ENST00000341377.5 |
NRG1 |
neuregulin 1 |
| chr17_+_39382900 | 0.88 |
ENST00000377721.3 ENST00000455970.2 |
KRTAP9-2 |
keratin associated protein 9-2 |
| chr11_+_1860200 | 0.88 |
ENST00000381911.1 |
TNNI2 |
troponin I type 2 (skeletal, fast) |
| chr13_-_52585547 | 0.87 |
ENST00000448424.2 ENST00000400370.3 ENST00000418097.2 ENST00000242839.4 ENST00000400366.3 ENST00000344297.5 |
ATP7B |
ATPase, Cu++ transporting, beta polypeptide |
| chr2_+_27665232 | 0.85 |
ENST00000543753.1 ENST00000288873.3 |
KRTCAP3 |
keratinocyte associated protein 3 |
| chr2_+_27665289 | 0.85 |
ENST00000407293.1 |
KRTCAP3 |
keratinocyte associated protein 3 |
| chr21_-_43187231 | 0.84 |
ENST00000332512.3 ENST00000352483.2 |
RIPK4 |
receptor-interacting serine-threonine kinase 4 |
| chr7_+_73242069 | 0.83 |
ENST00000435050.1 |
CLDN4 |
claudin 4 |
| chr16_-_4987065 | 0.82 |
ENST00000590782.2 ENST00000345988.2 |
PPL |
periplakin |
| chr17_+_73717407 | 0.82 |
ENST00000579662.1 |
ITGB4 |
integrin, beta 4 |
| chr18_+_59992514 | 0.80 |
ENST00000269485.7 |
TNFRSF11A |
tumor necrosis factor receptor superfamily, member 11a, NFKB activator |
| chr8_+_32405785 | 0.79 |
ENST00000287842.3 |
NRG1 |
neuregulin 1 |
| chr18_+_59992527 | 0.79 |
ENST00000586569.1 |
TNFRSF11A |
tumor necrosis factor receptor superfamily, member 11a, NFKB activator |
| chr5_+_56111361 | 0.79 |
ENST00000399503.3 |
MAP3K1 |
mitogen-activated protein kinase kinase kinase 1, E3 ubiquitin protein ligase |
| chr8_-_494824 | 0.78 |
ENST00000427263.2 ENST00000324079.6 |
TDRP |
testis development related protein |
| chr2_+_220306745 | 0.78 |
ENST00000431523.1 ENST00000396698.1 ENST00000396695.2 |
SPEG |
SPEG complex locus |
| chr8_-_144655141 | 0.78 |
ENST00000398882.3 |
MROH6 |
maestro heat-like repeat family member 6 |
| chr14_+_75746781 | 0.78 |
ENST00000555347.1 |
FOS |
FBJ murine osteosarcoma viral oncogene homolog |
| chr11_+_59480899 | 0.78 |
ENST00000300150.7 |
STX3 |
syntaxin 3 |
| chr17_-_46507537 | 0.77 |
ENST00000336915.6 |
SKAP1 |
src kinase associated phosphoprotein 1 |
| chr12_-_48298785 | 0.77 |
ENST00000550325.1 ENST00000546653.1 ENST00000549336.1 ENST00000535672.1 ENST00000229022.3 ENST00000548664.1 |
VDR |
vitamin D (1,25- dihydroxyvitamin D3) receptor |
| chr16_+_23847267 | 0.77 |
ENST00000321728.7 |
PRKCB |
protein kinase C, beta |
| chr19_-_55658650 | 0.77 |
ENST00000589226.1 |
TNNT1 |
troponin T type 1 (skeletal, slow) |
| chr1_+_33207381 | 0.77 |
ENST00000401073.2 |
KIAA1522 |
KIAA1522 |
| chr5_+_68788594 | 0.76 |
ENST00000396442.2 ENST00000380766.2 |
OCLN |
occludin |
| chr7_-_22396533 | 0.76 |
ENST00000344041.6 |
RAPGEF5 |
Rap guanine nucleotide exchange factor (GEF) 5 |
| chr3_-_48481434 | 0.75 |
ENST00000395694.2 ENST00000447018.1 ENST00000442740.1 |
CCDC51 |
coiled-coil domain containing 51 |
| chr12_+_7055767 | 0.75 |
ENST00000447931.2 |
PTPN6 |
protein tyrosine phosphatase, non-receptor type 6 |
| chr7_-_20256965 | 0.75 |
ENST00000400331.5 ENST00000332878.4 |
MACC1 |
metastasis associated in colon cancer 1 |
| chr16_+_71660079 | 0.74 |
ENST00000565261.1 ENST00000268485.3 ENST00000299952.4 |
MARVELD3 |
MARVEL domain containing 3 |
| chr7_-_138666053 | 0.74 |
ENST00000440172.1 ENST00000422774.1 |
KIAA1549 |
KIAA1549 |
| chr8_-_124054362 | 0.74 |
ENST00000405944.3 |
DERL1 |
derlin 1 |
| chr4_-_74486217 | 0.74 |
ENST00000335049.5 ENST00000307439.5 |
RASSF6 |
Ras association (RalGDS/AF-6) domain family member 6 |
| chr19_+_7710774 | 0.73 |
ENST00000602355.1 |
STXBP2 |
syntaxin binding protein 2 |
| chr5_+_68710906 | 0.73 |
ENST00000325631.5 ENST00000454295.2 |
MARVELD2 |
MARVEL domain containing 2 |
| chr2_-_64881018 | 0.72 |
ENST00000313349.3 |
SERTAD2 |
SERTA domain containing 2 |
| chr8_+_98881268 | 0.72 |
ENST00000254898.5 ENST00000524308.1 ENST00000522025.2 |
MATN2 |
matrilin 2 |
| chr12_+_50451331 | 0.72 |
ENST00000228468.4 |
ASIC1 |
acid-sensing (proton-gated) ion channel 1 |
| chr3_-_48481518 | 0.72 |
ENST00000412398.2 ENST00000395696.1 |
CCDC51 |
coiled-coil domain containing 51 |
| chr19_+_49055332 | 0.72 |
ENST00000201586.2 |
SULT2B1 |
sulfotransferase family, cytosolic, 2B, member 1 |
| chr12_+_7055631 | 0.72 |
ENST00000543115.1 ENST00000399448.1 |
PTPN6 |
protein tyrosine phosphatase, non-receptor type 6 |
| chr21_-_42219065 | 0.72 |
ENST00000400454.1 |
DSCAM |
Down syndrome cell adhesion molecule |
| chr19_+_8117636 | 0.72 |
ENST00000253451.4 ENST00000315626.4 |
CCL25 |
chemokine (C-C motif) ligand 25 |
| chr16_+_71660052 | 0.71 |
ENST00000567566.1 |
MARVELD3 |
MARVEL domain containing 3 |
| chr12_+_50451462 | 0.71 |
ENST00000447966.2 |
ASIC1 |
acid-sensing (proton-gated) ion channel 1 |
| chr7_-_98030360 | 0.71 |
ENST00000005260.8 |
BAIAP2L1 |
BAI1-associated protein 2-like 1 |
| chr1_-_93426998 | 0.71 |
ENST00000370310.4 |
FAM69A |
family with sequence similarity 69, member A |
| chr2_-_165477971 | 0.71 |
ENST00000446413.2 |
GRB14 |
growth factor receptor-bound protein 14 |
| chr5_+_167718604 | 0.70 |
ENST00000265293.4 |
WWC1 |
WW and C2 domain containing 1 |
| chr22_+_29469012 | 0.70 |
ENST00000400335.4 ENST00000400338.2 |
KREMEN1 |
kringle containing transmembrane protein 1 |
| chr5_+_44809027 | 0.70 |
ENST00000507110.1 |
MRPS30 |
mitochondrial ribosomal protein S30 |
| chr14_-_106781017 | 0.69 |
ENST00000390612.2 |
IGHV4-28 |
immunoglobulin heavy variable 4-28 |
| chr11_+_394196 | 0.69 |
ENST00000331563.2 ENST00000531857.1 |
PKP3 |
plakophilin 3 |
| chr1_+_3773825 | 0.69 |
ENST00000378209.3 ENST00000338895.3 ENST00000378212.2 ENST00000341385.3 |
DFFB |
DNA fragmentation factor, 40kDa, beta polypeptide (caspase-activated DNase) |
| chr1_+_92495528 | 0.69 |
ENST00000370383.4 |
EPHX4 |
epoxide hydrolase 4 |
| chr1_+_233749739 | 0.69 |
ENST00000366621.3 |
KCNK1 |
potassium channel, subfamily K, member 1 |
| chr9_-_136024721 | 0.68 |
ENST00000393160.3 |
RALGDS |
ral guanine nucleotide dissociation stimulator |
| chr1_+_62208091 | 0.68 |
ENST00000316485.6 ENST00000371158.2 |
INADL |
InaD-like (Drosophila) |
| chr2_+_106361333 | 0.67 |
ENST00000233154.4 ENST00000451463.2 |
NCK2 |
NCK adaptor protein 2 |
| chr16_+_4838412 | 0.66 |
ENST00000589327.1 |
SMIM22 |
small integral membrane protein 22 |
| chr17_-_39780819 | 0.65 |
ENST00000311208.8 |
KRT17 |
keratin 17 |
| chr11_-_88070896 | 0.64 |
ENST00000529974.1 ENST00000527018.1 |
CTSC |
cathepsin C |
| chr15_+_69591235 | 0.64 |
ENST00000395407.2 ENST00000558684.1 |
PAQR5 |
progestin and adipoQ receptor family member V |
| chr5_-_1295104 | 0.64 |
ENST00000334602.6 ENST00000508104.2 ENST00000310581.5 ENST00000296820.5 |
TERT |
telomerase reverse transcriptase |
| chr19_+_1071203 | 0.64 |
ENST00000543365.1 |
HMHA1 |
histocompatibility (minor) HA-1 |
| chr4_+_144354644 | 0.64 |
ENST00000512843.1 |
GAB1 |
GRB2-associated binding protein 1 |
| chr1_-_6550625 | 0.64 |
ENST00000377725.1 ENST00000340850.5 |
PLEKHG5 |
pleckstrin homology domain containing, family G (with RhoGef domain) member 5 |
| chr7_-_44365216 | 0.63 |
ENST00000358707.3 ENST00000457475.1 ENST00000440254.2 |
CAMK2B |
calcium/calmodulin-dependent protein kinase II beta |
| chr19_+_7701985 | 0.63 |
ENST00000595950.1 ENST00000441779.2 ENST00000221283.5 ENST00000414284.2 |
STXBP2 |
syntaxin binding protein 2 |
| chr4_+_166128735 | 0.63 |
ENST00000226725.6 |
KLHL2 |
kelch-like family member 2 |
Gene Ontology Analysis
Gene overrepresentation in biological_process category:
| Log-likelihood per target | Total log-likelihood | Term | Description |
|---|---|---|---|
| 2.5 | 7.5 | GO:0032773 | regulation of monophenol monooxygenase activity(GO:0032771) positive regulation of monophenol monooxygenase activity(GO:0032773) negative regulation of catagen(GO:0051796) regulation of hair cycle by canonical Wnt signaling pathway(GO:0060901) positive regulation of melanosome transport(GO:1902910) |
| 1.5 | 6.1 | GO:0007402 | ganglion mother cell fate determination(GO:0007402) |
| 0.8 | 4.1 | GO:0060672 | epithelial cell differentiation involved in embryonic placenta development(GO:0060671) epithelial cell morphogenesis involved in placental branching(GO:0060672) |
| 0.7 | 4.4 | GO:2000048 | negative regulation of cell-cell adhesion mediated by cadherin(GO:2000048) |
| 0.7 | 0.7 | GO:0002159 | desmosome assembly(GO:0002159) |
| 0.6 | 3.5 | GO:0002225 | positive regulation of antimicrobial peptide production(GO:0002225) positive regulation of antimicrobial humoral response(GO:0002760) positive regulation of antibacterial peptide production(GO:0002803) |
| 0.5 | 1.6 | GO:0043000 | Golgi to plasma membrane CFTR protein transport(GO:0043000) |
| 0.5 | 1.6 | GO:0060166 | olfactory pit development(GO:0060166) |
| 0.5 | 1.6 | GO:0100009 | circadian temperature homeostasis(GO:0060086) regulation of fever generation by regulation of prostaglandin secretion(GO:0071810) positive regulation of fever generation by positive regulation of prostaglandin secretion(GO:0071812) positive regulation of ERK1 and ERK2 cascade via TNFSF11-mediated signaling(GO:0071848) regulation of fever generation by prostaglandin secretion(GO:0100009) |
| 0.5 | 4.4 | GO:0086073 | bundle of His cell-Purkinje myocyte adhesion involved in cell communication(GO:0086073) |
| 0.5 | 1.9 | GO:0010982 | regulation of high-density lipoprotein particle clearance(GO:0010982) |
| 0.4 | 1.3 | GO:0035408 | histone H3-T6 phosphorylation(GO:0035408) |
| 0.4 | 0.4 | GO:0010360 | negative regulation of anion channel activity(GO:0010360) |
| 0.4 | 1.9 | GO:0030200 | heparan sulfate proteoglycan catabolic process(GO:0030200) |
| 0.4 | 1.5 | GO:0033277 | abortive mitotic cell cycle(GO:0033277) |
| 0.3 | 1.3 | GO:0061304 | retinal blood vessel morphogenesis(GO:0061304) |
| 0.3 | 2.3 | GO:0021842 | directional guidance of interneurons involved in migration from the subpallium to the cortex(GO:0021840) chemorepulsion involved in interneuron migration from the subpallium to the cortex(GO:0021842) |
| 0.3 | 1.9 | GO:1903575 | cornified envelope assembly(GO:1903575) |
| 0.3 | 1.3 | GO:0009726 | detection of endogenous stimulus(GO:0009726) |
| 0.3 | 1.9 | GO:0032185 | septin cytoskeleton organization(GO:0032185) |
| 0.3 | 2.1 | GO:0098881 | exocytic insertion of neurotransmitter receptor to plasma membrane(GO:0098881) exocytic insertion of neurotransmitter receptor to postsynaptic membrane(GO:0098967) |
| 0.3 | 1.8 | GO:0030581 | intracellular transport of viral protein in host cell(GO:0019060) symbiont intracellular protein transport in host(GO:0030581) intracellular protein transport in other organism involved in symbiotic interaction(GO:0051708) |
| 0.3 | 5.4 | GO:0090557 | establishment of endothelial intestinal barrier(GO:0090557) |
| 0.3 | 0.9 | GO:0015680 | intracellular copper ion transport(GO:0015680) |
| 0.3 | 0.9 | GO:1903028 | positive regulation of opsonization(GO:1903028) |
| 0.3 | 1.4 | GO:0061146 | Peyer's patch morphogenesis(GO:0061146) lymphocyte migration into lymphoid organs(GO:0097021) |
| 0.3 | 1.1 | GO:0050712 | negative regulation of interleukin-1 alpha production(GO:0032690) negative regulation of interleukin-1 alpha secretion(GO:0050712) |
| 0.3 | 2.0 | GO:0071681 | response to indole-3-methanol(GO:0071680) cellular response to indole-3-methanol(GO:0071681) |
| 0.3 | 3.0 | GO:0048672 | positive regulation of collateral sprouting(GO:0048672) |
| 0.3 | 1.1 | GO:2000721 | positive regulation of transcription from RNA polymerase II promoter involved in smooth muscle cell differentiation(GO:2000721) |
| 0.3 | 2.7 | GO:1904352 | positive regulation of protein catabolic process in the vacuole(GO:1904352) |
| 0.3 | 1.6 | GO:0045218 | zonula adherens maintenance(GO:0045218) |
| 0.3 | 1.0 | GO:0097089 | methyl-branched fatty acid metabolic process(GO:0097089) |
| 0.3 | 0.8 | GO:1902339 | apoptotic process involved in mammary gland involution(GO:0060057) positive regulation of apoptotic process involved in mammary gland involution(GO:0060058) positive regulation of apoptotic process involved in morphogenesis(GO:1902339) regulation of mammary gland involution(GO:1903519) positive regulation of mammary gland involution(GO:1903521) positive regulation of apoptotic process involved in development(GO:1904747) |
| 0.3 | 0.5 | GO:0060061 | Spemann organizer formation(GO:0060061) |
| 0.3 | 1.0 | GO:0009386 | translational attenuation(GO:0009386) |
| 0.2 | 0.7 | GO:1902214 | regulation of interleukin-4-mediated signaling pathway(GO:1902214) negative regulation of macrophage colony-stimulating factor signaling pathway(GO:1902227) negative regulation of response to macrophage colony-stimulating factor(GO:1903970) negative regulation of cellular response to macrophage colony-stimulating factor stimulus(GO:1903973) |
| 0.2 | 3.3 | GO:0060670 | branching involved in labyrinthine layer morphogenesis(GO:0060670) |
| 0.2 | 1.6 | GO:2001181 | positive regulation of interleukin-10 secretion(GO:2001181) |
| 0.2 | 1.1 | GO:1904274 | tricellular tight junction assembly(GO:1904274) |
| 0.2 | 1.1 | GO:1904219 | regulation of CDP-diacylglycerol-serine O-phosphatidyltransferase activity(GO:1904217) positive regulation of CDP-diacylglycerol-serine O-phosphatidyltransferase activity(GO:1904219) positive regulation of serine C-palmitoyltransferase activity(GO:1904222) |
| 0.2 | 0.6 | GO:1900369 | transcription, RNA-templated(GO:0001172) negative regulation of RNA interference(GO:1900369) |
| 0.2 | 0.6 | GO:1903572 | regulation of protein kinase D signaling(GO:1903570) positive regulation of protein kinase D signaling(GO:1903572) |
| 0.2 | 1.0 | GO:1905075 | occluding junction disassembly(GO:1905071) regulation of occluding junction disassembly(GO:1905073) positive regulation of occluding junction disassembly(GO:1905075) |
| 0.2 | 1.4 | GO:0050915 | sensory perception of sour taste(GO:0050915) |
| 0.2 | 1.2 | GO:1903237 | negative regulation of leukocyte tethering or rolling(GO:1903237) |
| 0.2 | 1.2 | GO:1904209 | regulation of chemokine (C-C motif) ligand 2 secretion(GO:1904207) positive regulation of chemokine (C-C motif) ligand 2 secretion(GO:1904209) |
| 0.2 | 1.7 | GO:0060075 | regulation of resting membrane potential(GO:0060075) |
| 0.2 | 0.9 | GO:0002913 | positive regulation of T cell anergy(GO:0002669) positive regulation of lymphocyte anergy(GO:0002913) |
| 0.2 | 0.7 | GO:0000103 | sulfate assimilation(GO:0000103) |
| 0.2 | 0.3 | GO:1900220 | semaphorin-plexin signaling pathway involved in bone trabecula morphogenesis(GO:1900220) |
| 0.2 | 5.2 | GO:0060644 | mammary gland epithelial cell differentiation(GO:0060644) |
| 0.2 | 0.2 | GO:0044333 | Wnt signaling pathway involved in digestive tract morphogenesis(GO:0044333) |
| 0.2 | 0.6 | GO:0072156 | distal tubule morphogenesis(GO:0072156) |
| 0.2 | 2.7 | GO:0015871 | choline transport(GO:0015871) |
| 0.2 | 0.3 | GO:0061300 | cerebellum vasculature development(GO:0061300) |
| 0.2 | 0.5 | GO:0002071 | glandular epithelial cell maturation(GO:0002071) regulation of transcription from RNA polymerase II promoter involved in ventral spinal cord interneuron specification(GO:0021913) type B pancreatic cell maturation(GO:0072560) |
| 0.1 | 2.4 | GO:0051639 | actin filament network formation(GO:0051639) |
| 0.1 | 0.4 | GO:0002337 | B-1a B cell differentiation(GO:0002337) |
| 0.1 | 1.3 | GO:0002315 | marginal zone B cell differentiation(GO:0002315) |
| 0.1 | 0.4 | GO:0031133 | regulation of axon diameter(GO:0031133) |
| 0.1 | 0.3 | GO:1903721 | regulation of I-kappaB phosphorylation(GO:1903719) positive regulation of I-kappaB phosphorylation(GO:1903721) |
| 0.1 | 0.6 | GO:0046271 | phenylpropanoid catabolic process(GO:0046271) |
| 0.1 | 2.5 | GO:0046415 | urate metabolic process(GO:0046415) |
| 0.1 | 0.6 | GO:0007386 | compartment pattern specification(GO:0007386) |
| 0.1 | 1.1 | GO:0032439 | endosome localization(GO:0032439) |
| 0.1 | 1.0 | GO:0051121 | hepoxilin metabolic process(GO:0051121) hepoxilin biosynthetic process(GO:0051122) |
| 0.1 | 0.4 | GO:0051066 | dihydrobiopterin metabolic process(GO:0051066) |
| 0.1 | 0.5 | GO:0006015 | 5-phosphoribose 1-diphosphate biosynthetic process(GO:0006015) 5-phosphoribose 1-diphosphate metabolic process(GO:0046391) |
| 0.1 | 0.4 | GO:0042138 | meiotic DNA double-strand break processing(GO:0000706) meiotic DNA double-strand break formation(GO:0042138) double-strand break repair involved in meiotic recombination(GO:1990918) |
| 0.1 | 0.3 | GO:0003215 | cardiac right ventricle morphogenesis(GO:0003215) |
| 0.1 | 0.4 | GO:0061537 | glycine secretion(GO:0061536) glycine secretion, neurotransmission(GO:0061537) |
| 0.1 | 0.5 | GO:0072344 | rescue of stalled ribosome(GO:0072344) |
| 0.1 | 0.6 | GO:0046952 | ketone body catabolic process(GO:0046952) |
| 0.1 | 1.5 | GO:1902414 | protein localization to cell junction(GO:1902414) |
| 0.1 | 0.3 | GO:0000294 | nuclear-transcribed mRNA catabolic process, endonucleolytic cleavage-dependent decay(GO:0000294) |
| 0.1 | 0.3 | GO:0006382 | adenosine to inosine editing(GO:0006382) |
| 0.1 | 0.7 | GO:0036493 | positive regulation of translation in response to endoplasmic reticulum stress(GO:0036493) |
| 0.1 | 1.1 | GO:0021999 | neural plate anterior/posterior regionalization(GO:0021999) |
| 0.1 | 1.8 | GO:0070863 | positive regulation of protein exit from endoplasmic reticulum(GO:0070863) |
| 0.1 | 0.5 | GO:1902961 | regulation of aspartic-type endopeptidase activity involved in amyloid precursor protein catabolic process(GO:1902959) positive regulation of aspartic-type endopeptidase activity involved in amyloid precursor protein catabolic process(GO:1902961) regulation of aspartic-type peptidase activity(GO:1905245) positive regulation of aspartic-type peptidase activity(GO:1905247) |
| 0.1 | 0.3 | GO:0015728 | mevalonate transport(GO:0015728) behavioral response to nutrient(GO:0051780) |
| 0.1 | 1.0 | GO:0014807 | regulation of somitogenesis(GO:0014807) |
| 0.1 | 3.3 | GO:0016338 | calcium-independent cell-cell adhesion via plasma membrane cell-adhesion molecules(GO:0016338) |
| 0.1 | 0.5 | GO:0000738 | DNA catabolic process, exonucleolytic(GO:0000738) |
| 0.1 | 0.4 | GO:0032811 | negative regulation of epinephrine secretion(GO:0032811) epidermal growth factor-activated receptor transactivation by G-protein coupled receptor signaling pathway(GO:0035625) |
| 0.1 | 0.1 | GO:0086047 | membrane depolarization during Purkinje myocyte cell action potential(GO:0086047) |
| 0.1 | 0.8 | GO:0001661 | conditioned taste aversion(GO:0001661) |
| 0.1 | 0.3 | GO:1902630 | regulation of membrane hyperpolarization(GO:1902630) |
| 0.1 | 1.4 | GO:0035878 | nail development(GO:0035878) |
| 0.1 | 0.4 | GO:0071393 | cellular response to progesterone stimulus(GO:0071393) |
| 0.1 | 0.5 | GO:0045631 | regulation of auditory receptor cell differentiation(GO:0045607) regulation of mechanoreceptor differentiation(GO:0045631) regulation of inner ear receptor cell differentiation(GO:2000980) |
| 0.1 | 0.4 | GO:0070384 | Harderian gland development(GO:0070384) |
| 0.1 | 0.7 | GO:0035331 | negative regulation of hippo signaling(GO:0035331) |
| 0.1 | 0.4 | GO:1902202 | regulation of hepatocyte growth factor receptor signaling pathway(GO:1902202) |
| 0.1 | 0.8 | GO:0031444 | slow-twitch skeletal muscle fiber contraction(GO:0031444) |
| 0.1 | 0.9 | GO:0021853 | cerebral cortex GABAergic interneuron migration(GO:0021853) interneuron migration(GO:1904936) |
| 0.1 | 1.1 | GO:0045741 | positive regulation of epidermal growth factor-activated receptor activity(GO:0045741) |
| 0.1 | 0.3 | GO:0031659 | positive regulation of cyclin-dependent protein serine/threonine kinase activity involved in G1/S transition of mitotic cell cycle(GO:0031659) activation of phospholipase A2 activity by calcium-mediated signaling(GO:0043006) |
| 0.1 | 1.2 | GO:0031268 | pseudopodium organization(GO:0031268) |
| 0.1 | 2.7 | GO:0015695 | organic cation transport(GO:0015695) |
| 0.1 | 0.8 | GO:0030263 | apoptotic chromosome condensation(GO:0030263) |
| 0.1 | 0.7 | GO:0048842 | positive regulation of axon extension involved in axon guidance(GO:0048842) |
| 0.1 | 3.2 | GO:2000249 | regulation of actin cytoskeleton reorganization(GO:2000249) |
| 0.1 | 0.4 | GO:0034773 | histone H4-K20 trimethylation(GO:0034773) |
| 0.1 | 0.4 | GO:0032287 | peripheral nervous system myelin maintenance(GO:0032287) |
| 0.1 | 0.5 | GO:0034316 | negative regulation of Arp2/3 complex-mediated actin nucleation(GO:0034316) |
| 0.1 | 0.4 | GO:0010989 | negative regulation of low-density lipoprotein particle clearance(GO:0010989) |
| 0.1 | 3.4 | GO:0045022 | early endosome to late endosome transport(GO:0045022) |
| 0.1 | 0.2 | GO:0006425 | glutaminyl-tRNA aminoacylation(GO:0006425) |
| 0.1 | 0.3 | GO:0032485 | Ral protein signal transduction(GO:0032484) regulation of Ral protein signal transduction(GO:0032485) |
| 0.1 | 0.6 | GO:1903764 | cortical microtubule organization(GO:0043622) establishment of centrosome localization(GO:0051660) regulation of potassium ion export across plasma membrane(GO:1903764) |
| 0.1 | 0.3 | GO:1901187 | regulation of ephrin receptor signaling pathway(GO:1901187) |
| 0.1 | 0.4 | GO:0060528 | secretory columnal luminar epithelial cell differentiation involved in prostate glandular acinus development(GO:0060528) |
| 0.1 | 0.4 | GO:0033274 | response to vitamin B2(GO:0033274) heterochromatin maintenance(GO:0070829) |
| 0.1 | 4.7 | GO:0070830 | bicellular tight junction assembly(GO:0070830) |
| 0.1 | 4.7 | GO:0048791 | calcium ion-regulated exocytosis of neurotransmitter(GO:0048791) |
| 0.1 | 0.3 | GO:0009236 | cobalamin biosynthetic process(GO:0009236) |
| 0.1 | 0.2 | GO:0015917 | aminophospholipid transport(GO:0015917) |
| 0.1 | 0.3 | GO:0034343 | type III interferon production(GO:0034343) regulation of type III interferon production(GO:0034344) |
| 0.1 | 0.3 | GO:2001288 | positive regulation of caveolin-mediated endocytosis(GO:2001288) |
| 0.1 | 0.1 | GO:0009786 | regulation of asymmetric cell division(GO:0009786) |
| 0.1 | 0.1 | GO:1903526 | negative regulation of membrane tubulation(GO:1903526) |
| 0.1 | 0.1 | GO:0030201 | heparan sulfate proteoglycan metabolic process(GO:0030201) |
| 0.1 | 1.1 | GO:0006670 | sphingosine metabolic process(GO:0006670) |
| 0.1 | 0.1 | GO:0021558 | trochlear nerve development(GO:0021558) |
| 0.1 | 1.0 | GO:0048387 | negative regulation of retinoic acid receptor signaling pathway(GO:0048387) |
| 0.1 | 0.3 | GO:0018002 | N-terminal peptidyl-serine acetylation(GO:0017198) N-terminal peptidyl-glutamic acid acetylation(GO:0018002) peptidyl-serine acetylation(GO:0030920) |
| 0.1 | 0.3 | GO:1902723 | negative regulation of skeletal muscle cell proliferation(GO:0014859) negative regulation of skeletal muscle satellite cell proliferation(GO:1902723) |
| 0.1 | 1.2 | GO:0060044 | negative regulation of cardiac muscle cell proliferation(GO:0060044) |
| 0.1 | 0.3 | GO:2000354 | regulation of ovarian follicle development(GO:2000354) |
| 0.1 | 0.4 | GO:0006021 | inositol biosynthetic process(GO:0006021) |
| 0.1 | 0.2 | GO:0070902 | mitochondrial tRNA pseudouridine synthesis(GO:0070902) |
| 0.1 | 3.7 | GO:0034260 | negative regulation of GTPase activity(GO:0034260) |
| 0.1 | 1.2 | GO:0034063 | stress granule assembly(GO:0034063) |
| 0.1 | 0.2 | GO:0046900 | tetrahydrofolylpolyglutamate metabolic process(GO:0046900) |
| 0.1 | 0.4 | GO:1902474 | positive regulation of protein localization to synapse(GO:1902474) |
| 0.1 | 0.1 | GO:1904862 | inhibitory synapse assembly(GO:1904862) |
| 0.1 | 2.8 | GO:0050919 | negative chemotaxis(GO:0050919) |
| 0.1 | 0.6 | GO:0042635 | positive regulation of hair cycle(GO:0042635) |
| 0.1 | 0.4 | GO:0010820 | positive regulation of T cell chemotaxis(GO:0010820) |
| 0.1 | 0.1 | GO:0021988 | olfactory bulb development(GO:0021772) olfactory lobe development(GO:0021988) |
| 0.1 | 0.8 | GO:0031069 | hair follicle morphogenesis(GO:0031069) |
| 0.1 | 0.1 | GO:2000854 | positive regulation of corticosterone secretion(GO:2000854) |
| 0.1 | 0.1 | GO:0032911 | negative regulation of transforming growth factor beta1 production(GO:0032911) |
| 0.1 | 0.7 | GO:0009414 | response to water deprivation(GO:0009414) |
| 0.1 | 0.3 | GO:0033504 | floor plate development(GO:0033504) |
| 0.1 | 0.6 | GO:0051823 | regulation of synapse structural plasticity(GO:0051823) |
| 0.1 | 9.4 | GO:0031424 | keratinization(GO:0031424) |
| 0.1 | 2.9 | GO:0001913 | T cell mediated cytotoxicity(GO:0001913) |
| 0.1 | 0.2 | GO:0006624 | vacuolar protein processing(GO:0006624) |
| 0.1 | 0.3 | GO:1903588 | negative regulation of blood vessel endothelial cell proliferation involved in sprouting angiogenesis(GO:1903588) |
| 0.1 | 4.6 | GO:0071300 | cellular response to retinoic acid(GO:0071300) |
| 0.0 | 0.4 | GO:1900029 | positive regulation of ruffle assembly(GO:1900029) |
| 0.0 | 0.3 | GO:0019348 | dolichol metabolic process(GO:0019348) |
| 0.0 | 0.2 | GO:0032972 | diaphragm contraction(GO:0002086) regulation of muscle filament sliding speed(GO:0032972) |
| 0.0 | 0.3 | GO:0043353 | enucleate erythrocyte differentiation(GO:0043353) |
| 0.0 | 0.5 | GO:0033623 | regulation of integrin activation(GO:0033623) |
| 0.0 | 0.2 | GO:0018125 | peptidyl-cysteine methylation(GO:0018125) |
| 0.0 | 1.2 | GO:0045056 | transcytosis(GO:0045056) |
| 0.0 | 0.8 | GO:0007175 | negative regulation of epidermal growth factor-activated receptor activity(GO:0007175) |
| 0.0 | 0.1 | GO:0010641 | activation of plasma proteins involved in acute inflammatory response(GO:0002541) positive regulation of platelet-derived growth factor receptor signaling pathway(GO:0010641) |
| 0.0 | 0.5 | GO:0016075 | rRNA catabolic process(GO:0016075) |
| 0.0 | 0.1 | GO:0006478 | peptidyl-tyrosine sulfation(GO:0006478) |
| 0.0 | 0.1 | GO:0044828 | negative regulation by host of viral genome replication(GO:0044828) |
| 0.0 | 0.1 | GO:0070340 | detection of triacyl bacterial lipopeptide(GO:0042495) detection of bacterial lipopeptide(GO:0070340) |
| 0.0 | 3.7 | GO:0030279 | negative regulation of ossification(GO:0030279) |
| 0.0 | 0.2 | GO:0018283 | metal incorporation into metallo-sulfur cluster(GO:0018282) iron incorporation into metallo-sulfur cluster(GO:0018283) |
| 0.0 | 0.1 | GO:1902490 | regulation of sperm capacitation(GO:1902490) |
| 0.0 | 0.5 | GO:0014029 | neural crest formation(GO:0014029) |
| 0.0 | 0.3 | GO:0016098 | monoterpenoid metabolic process(GO:0016098) |
| 0.0 | 0.1 | GO:0052314 | isoquinoline alkaloid metabolic process(GO:0033076) phytoalexin metabolic process(GO:0052314) |
| 0.0 | 0.3 | GO:0016554 | cytidine to uridine editing(GO:0016554) |
| 0.0 | 0.3 | GO:0016480 | negative regulation of transcription from RNA polymerase III promoter(GO:0016480) |
| 0.0 | 0.4 | GO:0009415 | response to water(GO:0009415) |
| 0.0 | 0.2 | GO:1900827 | maintenance of protein location in membrane(GO:0072658) maintenance of protein location in plasma membrane(GO:0072660) positive regulation of membrane depolarization during cardiac muscle cell action potential(GO:1900827) |
| 0.0 | 2.1 | GO:0006730 | one-carbon metabolic process(GO:0006730) |
| 0.0 | 0.6 | GO:0006516 | glycoprotein catabolic process(GO:0006516) |
| 0.0 | 0.1 | GO:0044209 | AMP salvage(GO:0044209) |
| 0.0 | 0.5 | GO:0009950 | dorsal/ventral axis specification(GO:0009950) |
| 0.0 | 0.2 | GO:0018076 | N-terminal peptidyl-lysine acetylation(GO:0018076) |
| 0.0 | 0.8 | GO:0006751 | glutathione catabolic process(GO:0006751) |
| 0.0 | 0.1 | GO:1902499 | positive regulation of protein autoubiquitination(GO:1902499) |
| 0.0 | 0.3 | GO:0019896 | axonal transport of mitochondrion(GO:0019896) |
| 0.0 | 1.3 | GO:0007202 | activation of phospholipase C activity(GO:0007202) |
| 0.0 | 0.2 | GO:0050882 | voluntary musculoskeletal movement(GO:0050882) |
| 0.0 | 0.6 | GO:0090179 | planar cell polarity pathway involved in neural tube closure(GO:0090179) |
| 0.0 | 0.5 | GO:0045945 | positive regulation of transcription from RNA polymerase III promoter(GO:0045945) |
| 0.0 | 0.2 | GO:0006477 | protein sulfation(GO:0006477) |
| 0.0 | 0.2 | GO:0060282 | positive regulation of oocyte development(GO:0060282) |
| 0.0 | 0.1 | GO:0019626 | short-chain fatty acid catabolic process(GO:0019626) |
| 0.0 | 0.2 | GO:0071321 | cellular response to cGMP(GO:0071321) |
| 0.0 | 0.1 | GO:0042986 | positive regulation of amyloid precursor protein biosynthetic process(GO:0042986) |
| 0.0 | 0.6 | GO:0010510 | regulation of acetyl-CoA biosynthetic process from pyruvate(GO:0010510) |
| 0.0 | 0.6 | GO:1902018 | negative regulation of cilium assembly(GO:1902018) |
| 0.0 | 2.6 | GO:2000649 | regulation of sodium ion transmembrane transporter activity(GO:2000649) |
| 0.0 | 1.0 | GO:0045745 | positive regulation of G-protein coupled receptor protein signaling pathway(GO:0045745) |
| 0.0 | 1.0 | GO:0045947 | negative regulation of translational initiation(GO:0045947) |
| 0.0 | 0.0 | GO:0060056 | mammary gland involution(GO:0060056) |
| 0.0 | 0.1 | GO:1990414 | replication-born double-strand break repair via sister chromatid exchange(GO:1990414) |
| 0.0 | 0.2 | GO:1902715 | secretory granule localization(GO:0032252) positive regulation of interferon-gamma secretion(GO:1902715) |
| 0.0 | 0.1 | GO:0002326 | B cell lineage commitment(GO:0002326) |
| 0.0 | 2.6 | GO:0016266 | O-glycan processing(GO:0016266) |
| 0.0 | 0.2 | GO:0036115 | fatty-acyl-CoA catabolic process(GO:0036115) malonyl-CoA metabolic process(GO:2001293) |
| 0.0 | 0.5 | GO:2000786 | positive regulation of autophagosome assembly(GO:2000786) |
| 0.0 | 0.3 | GO:0090073 | positive regulation of protein homodimerization activity(GO:0090073) |
| 0.0 | 0.1 | GO:0030718 | germ-line stem cell population maintenance(GO:0030718) |
| 0.0 | 0.6 | GO:0034656 | nucleobase-containing small molecule catabolic process(GO:0034656) |
| 0.0 | 0.3 | GO:0006682 | galactosylceramide biosynthetic process(GO:0006682) galactolipid biosynthetic process(GO:0019375) |
| 0.0 | 0.1 | GO:0042369 | vitamin D catabolic process(GO:0042369) |
| 0.0 | 0.7 | GO:0016180 | snRNA processing(GO:0016180) |
| 0.0 | 0.6 | GO:0048706 | embryonic skeletal system development(GO:0048706) |
| 0.0 | 0.3 | GO:0002191 | cap-dependent translational initiation(GO:0002191) |
| 0.0 | 0.6 | GO:0043401 | steroid hormone mediated signaling pathway(GO:0043401) |
| 0.0 | 0.1 | GO:0006145 | purine nucleobase catabolic process(GO:0006145) |
| 0.0 | 1.0 | GO:0035767 | endothelial cell chemotaxis(GO:0035767) |
| 0.0 | 0.1 | GO:0003409 | optic cup structural organization(GO:0003409) |
| 0.0 | 0.3 | GO:0006939 | smooth muscle contraction(GO:0006939) |
| 0.0 | 0.1 | GO:1902416 | positive regulation of mRNA binding(GO:1902416) |
| 0.0 | 0.9 | GO:0045104 | intermediate filament cytoskeleton organization(GO:0045104) |
| 0.0 | 0.1 | GO:0010940 | positive regulation of necrotic cell death(GO:0010940) |
| 0.0 | 0.1 | GO:0001189 | RNA polymerase I transcriptional preinitiation complex assembly(GO:0001188) RNA polymerase I transcriptional preinitiation complex assembly at the promoter for the nuclear large rRNA transcript(GO:0001189) |
| 0.0 | 0.1 | GO:2000382 | positive regulation of mesoderm development(GO:2000382) |
| 0.0 | 0.5 | GO:0045717 | negative regulation of fatty acid biosynthetic process(GO:0045717) |
| 0.0 | 0.1 | GO:0045013 | carbon catabolite repression of transcription(GO:0045013) negative regulation of transcription by glucose(GO:0045014) |
| 0.0 | 0.7 | GO:0042753 | positive regulation of circadian rhythm(GO:0042753) |
| 0.0 | 0.3 | GO:0090286 | cytoskeletal anchoring at nuclear membrane(GO:0090286) |
| 0.0 | 0.1 | GO:0014067 | negative regulation of phosphatidylinositol 3-kinase signaling(GO:0014067) |
| 0.0 | 0.4 | GO:0019373 | epoxygenase P450 pathway(GO:0019373) |
| 0.0 | 0.1 | GO:1900027 | regulation of ruffle assembly(GO:1900027) |
| 0.0 | 0.7 | GO:0046710 | GDP metabolic process(GO:0046710) |
| 0.0 | 1.0 | GO:0043304 | regulation of mast cell activation involved in immune response(GO:0033006) regulation of mast cell degranulation(GO:0043304) |
| 0.0 | 0.8 | GO:0035774 | positive regulation of insulin secretion involved in cellular response to glucose stimulus(GO:0035774) |
| 0.0 | 0.2 | GO:1904262 | negative regulation of TORC1 signaling(GO:1904262) |
| 0.0 | 0.1 | GO:0002232 | leukocyte chemotaxis involved in inflammatory response(GO:0002232) cell surface pattern recognition receptor signaling pathway(GO:0002752) |
| 0.0 | 0.1 | GO:0035948 | positive regulation of gluconeogenesis by positive regulation of transcription from RNA polymerase II promoter(GO:0035948) |
| 0.0 | 0.1 | GO:0045163 | clustering of voltage-gated potassium channels(GO:0045163) |
| 0.0 | 0.1 | GO:0070358 | actin polymerization-dependent cell motility(GO:0070358) |
| 0.0 | 2.8 | GO:0030183 | B cell differentiation(GO:0030183) |
| 0.0 | 0.5 | GO:0060674 | placenta blood vessel development(GO:0060674) |
| 0.0 | 0.2 | GO:0015860 | purine nucleoside transmembrane transport(GO:0015860) |
| 0.0 | 0.4 | GO:1903169 | regulation of calcium ion transmembrane transport(GO:1903169) |
| 0.0 | 0.2 | GO:0098734 | macromolecule depalmitoylation(GO:0098734) |
| 0.0 | 0.2 | GO:1903546 | protein localization to photoreceptor outer segment(GO:1903546) |
| 0.0 | 0.2 | GO:1904776 | regulation of protein localization to cell cortex(GO:1904776) positive regulation of protein localization to cell cortex(GO:1904778) |
| 0.0 | 0.2 | GO:0099500 | synaptic vesicle fusion to presynaptic active zone membrane(GO:0031629) vesicle fusion to plasma membrane(GO:0099500) |
| 0.0 | 0.5 | GO:0007638 | mechanosensory behavior(GO:0007638) |
| 0.0 | 0.2 | GO:0018231 | peptidyl-L-cysteine S-palmitoylation(GO:0018230) peptidyl-S-diacylglycerol-L-cysteine biosynthetic process from peptidyl-cysteine(GO:0018231) |
| 0.0 | 0.1 | GO:0032581 | ER-dependent peroxisome organization(GO:0032581) |
| 0.0 | 0.9 | GO:0003009 | skeletal muscle contraction(GO:0003009) |
| 0.0 | 0.2 | GO:0038203 | TORC2 signaling(GO:0038203) |
| 0.0 | 0.2 | GO:0006600 | creatine metabolic process(GO:0006600) |
| 0.0 | 0.2 | GO:0048386 | positive regulation of retinoic acid receptor signaling pathway(GO:0048386) |
| 0.0 | 0.4 | GO:0035589 | G-protein coupled purinergic nucleotide receptor signaling pathway(GO:0035589) |
| 0.0 | 0.1 | GO:0018352 | protein-pyridoxal-5-phosphate linkage(GO:0018352) |
| 0.0 | 0.2 | GO:0048298 | positive regulation of isotype switching to IgA isotypes(GO:0048298) |
| 0.0 | 0.1 | GO:0032776 | DNA methylation on cytosine(GO:0032776) |
| 0.0 | 0.2 | GO:0098789 | pre-mRNA cleavage required for polyadenylation(GO:0098789) |
| 0.0 | 0.4 | GO:0048266 | behavioral response to pain(GO:0048266) |
| 0.0 | 0.1 | GO:0045084 | positive regulation of interleukin-12 biosynthetic process(GO:0045084) |
| 0.0 | 1.0 | GO:0038128 | ERBB2 signaling pathway(GO:0038128) |
| 0.0 | 0.1 | GO:0001315 | age-dependent response to oxidative stress(GO:0001306) age-dependent response to reactive oxygen species(GO:0001315) regulation of systemic arterial blood pressure by acetylcholine(GO:0003068) vasodilation by acetylcholine involved in regulation of systemic arterial blood pressure(GO:0003069) regulation of systemic arterial blood pressure by neurotransmitter(GO:0003070) age-dependent general metabolic decline(GO:0007571) |
| 0.0 | 1.5 | GO:1900181 | negative regulation of protein localization to nucleus(GO:1900181) |
| 0.0 | 0.4 | GO:0090004 | positive regulation of establishment of protein localization to plasma membrane(GO:0090004) |
| 0.0 | 0.2 | GO:1901978 | mitochondrial fragmentation involved in apoptotic process(GO:0043653) positive regulation of cell cycle checkpoint(GO:1901978) |
| 0.0 | 0.1 | GO:0035871 | protein K11-linked deubiquitination(GO:0035871) |
| 0.0 | 0.1 | GO:0035672 | oligopeptide transmembrane transport(GO:0035672) |
| 0.0 | 0.3 | GO:0006704 | glucocorticoid biosynthetic process(GO:0006704) |
| 0.0 | 0.1 | GO:0035635 | entry of bacterium into host cell(GO:0035635) |
| 0.0 | 0.1 | GO:0001575 | globoside metabolic process(GO:0001575) |
| 0.0 | 0.2 | GO:0048149 | behavioral response to ethanol(GO:0048149) |
| 0.0 | 0.1 | GO:0098703 | calcium ion import across plasma membrane(GO:0098703) calcium ion import into cell(GO:1990035) |
| 0.0 | 0.6 | GO:0002755 | MyD88-dependent toll-like receptor signaling pathway(GO:0002755) |
| 0.0 | 0.3 | GO:0030322 | stabilization of membrane potential(GO:0030322) |
| 0.0 | 0.1 | GO:0097151 | positive regulation of inhibitory postsynaptic potential(GO:0097151) modulation of inhibitory postsynaptic potential(GO:0098828) |
| 0.0 | 0.2 | GO:0007171 | activation of transmembrane receptor protein tyrosine kinase activity(GO:0007171) |
| 0.0 | 0.3 | GO:0015991 | energy coupled proton transmembrane transport, against electrochemical gradient(GO:0015988) ATP hydrolysis coupled proton transport(GO:0015991) ATP hydrolysis coupled transmembrane transport(GO:0090662) |
| 0.0 | 0.3 | GO:0060117 | auditory receptor cell development(GO:0060117) |
| 0.0 | 0.2 | GO:0021527 | spinal cord association neuron differentiation(GO:0021527) |
| 0.0 | 0.2 | GO:0015884 | folic acid transport(GO:0015884) |
| 0.0 | 0.1 | GO:2000821 | regulation of grooming behavior(GO:2000821) |
| 0.0 | 0.2 | GO:0030046 | parallel actin filament bundle assembly(GO:0030046) |
| 0.0 | 0.1 | GO:0099538 | synaptic signaling via neuropeptide(GO:0099538) trans-synaptic signaling by neuropeptide(GO:0099540) trans-synaptic signaling by neuropeptide, modulating synaptic transmission(GO:0099551) |
| 0.0 | 0.7 | GO:0008347 | glial cell migration(GO:0008347) |
| 0.0 | 0.1 | GO:0009629 | response to gravity(GO:0009629) |
| 0.0 | 0.4 | GO:0005980 | glycogen catabolic process(GO:0005980) |
| 0.0 | 0.2 | GO:0016584 | nucleosome positioning(GO:0016584) |
| 0.0 | 0.1 | GO:0007042 | lysosomal lumen acidification(GO:0007042) |
| 0.0 | 0.2 | GO:0001867 | complement activation, lectin pathway(GO:0001867) |
| 0.0 | 0.3 | GO:0006999 | nuclear pore organization(GO:0006999) |
| 0.0 | 0.3 | GO:0071243 | cellular response to arsenic-containing substance(GO:0071243) |
| 0.0 | 0.4 | GO:0032878 | regulation of establishment or maintenance of cell polarity(GO:0032878) |
| 0.0 | 0.3 | GO:0034587 | piRNA metabolic process(GO:0034587) |
| 0.0 | 0.1 | GO:0050891 | multicellular organismal water homeostasis(GO:0050891) |
| 0.0 | 0.1 | GO:1901379 | regulation of potassium ion transmembrane transport(GO:1901379) |
| 0.0 | 0.1 | GO:0045039 | protein import into mitochondrial inner membrane(GO:0045039) |
| 0.0 | 0.1 | GO:0070980 | biphenyl catabolic process(GO:0070980) |
| 0.0 | 0.2 | GO:0007224 | smoothened signaling pathway(GO:0007224) |
| 0.0 | 0.2 | GO:0044351 | macropinocytosis(GO:0044351) |
| 0.0 | 0.3 | GO:0001893 | maternal placenta development(GO:0001893) |
| 0.0 | 0.2 | GO:2000210 | positive regulation of anoikis(GO:2000210) |
| 0.0 | 0.2 | GO:0051256 | mitotic spindle midzone assembly(GO:0051256) |
| 0.0 | 0.2 | GO:0002902 | regulation of B cell apoptotic process(GO:0002902) negative regulation of B cell apoptotic process(GO:0002903) |
| 0.0 | 0.1 | GO:0006741 | NADP biosynthetic process(GO:0006741) |
| 0.0 | 0.2 | GO:0051438 | regulation of ubiquitin-protein transferase activity(GO:0051438) |
| 0.0 | 0.1 | GO:0090520 | sphingosine-1-phosphate signaling pathway(GO:0003376) sphingolipid mediated signaling pathway(GO:0090520) |
| 0.0 | 0.1 | GO:0034058 | endosomal vesicle fusion(GO:0034058) |
| 0.0 | 0.1 | GO:0045471 | response to ethanol(GO:0045471) |
| 0.0 | 0.3 | GO:0016339 | calcium-dependent cell-cell adhesion via plasma membrane cell adhesion molecules(GO:0016339) |
| 0.0 | 0.0 | GO:0046626 | regulation of insulin receptor signaling pathway(GO:0046626) |
| 0.0 | 1.3 | GO:0006903 | vesicle targeting(GO:0006903) |
| 0.0 | 0.1 | GO:0070507 | regulation of microtubule cytoskeleton organization(GO:0070507) |
| 0.0 | 0.2 | GO:0006703 | estrogen biosynthetic process(GO:0006703) |
| 0.0 | 0.1 | GO:0030174 | regulation of DNA-dependent DNA replication initiation(GO:0030174) |
| 0.0 | 0.0 | GO:0061484 | hematopoietic stem cell homeostasis(GO:0061484) |
| 0.0 | 0.2 | GO:0071880 | adenylate cyclase-activating adrenergic receptor signaling pathway(GO:0071880) |
Gene overrepresentation in cellular_component category:
| Log-likelihood per target | Total log-likelihood | Term | Description |
|---|---|---|---|
| 0.6 | 5.1 | GO:0036056 | filtration diaphragm(GO:0036056) slit diaphragm(GO:0036057) |
| 0.5 | 2.2 | GO:1990796 | photoreceptor cell terminal bouton(GO:1990796) |
| 0.5 | 3.6 | GO:0070695 | FHF complex(GO:0070695) |
| 0.5 | 3.5 | GO:0097209 | epidermal lamellar body(GO:0097209) |
| 0.5 | 1.4 | GO:1990851 | Wnt-Frizzled-LRP5/6 complex(GO:1990851) |
| 0.5 | 1.8 | GO:0036502 | Derlin-1-VIMP complex(GO:0036502) |
| 0.3 | 2.0 | GO:0016342 | catenin complex(GO:0016342) |
| 0.3 | 0.8 | GO:0035976 | AP1 complex(GO:0035976) |
| 0.2 | 3.5 | GO:0005916 | fascia adherens(GO:0005916) |
| 0.2 | 0.2 | GO:0097227 | sperm annulus(GO:0097227) |
| 0.2 | 2.4 | GO:0042105 | alpha-beta T cell receptor complex(GO:0042105) |
| 0.2 | 1.1 | GO:0034678 | integrin alpha8-beta1 complex(GO:0034678) |
| 0.2 | 4.9 | GO:0005922 | connexon complex(GO:0005922) |
| 0.2 | 0.6 | GO:0031379 | RNA-directed RNA polymerase complex(GO:0031379) |
| 0.2 | 2.7 | GO:0045179 | apical cortex(GO:0045179) |
| 0.2 | 0.6 | GO:0034686 | integrin alphav-beta8 complex(GO:0034686) |
| 0.2 | 1.7 | GO:0005915 | zonula adherens(GO:0005915) |
| 0.2 | 4.4 | GO:0031528 | microvillus membrane(GO:0031528) |
| 0.2 | 1.4 | GO:0061689 | tricellular tight junction(GO:0061689) |
| 0.2 | 1.5 | GO:0005865 | striated muscle thin filament(GO:0005865) |
| 0.2 | 1.4 | GO:0044194 | cytolytic granule(GO:0044194) |
| 0.1 | 4.6 | GO:0016327 | apicolateral plasma membrane(GO:0016327) |
| 0.1 | 3.7 | GO:0030057 | desmosome(GO:0030057) |
| 0.1 | 1.0 | GO:0070022 | transforming growth factor beta receptor homodimeric complex(GO:0070022) |
| 0.1 | 0.3 | GO:0097489 | multivesicular body, internal vesicle lumen(GO:0097489) |
| 0.1 | 11.3 | GO:0005913 | cell-cell adherens junction(GO:0005913) |
| 0.1 | 1.0 | GO:0033269 | internode region of axon(GO:0033269) |
| 0.1 | 0.3 | GO:0042720 | mitochondrial inner membrane peptidase complex(GO:0042720) |
| 0.1 | 0.3 | GO:0097057 | TRAF2-GSTP1 complex(GO:0097057) |
| 0.1 | 0.3 | GO:0030849 | autosome(GO:0030849) |
| 0.1 | 11.5 | GO:0005923 | bicellular tight junction(GO:0005923) occluding junction(GO:0070160) |
| 0.1 | 1.8 | GO:0005861 | troponin complex(GO:0005861) |
| 0.1 | 1.8 | GO:0031143 | pseudopodium(GO:0031143) |
| 0.1 | 5.5 | GO:0045095 | keratin filament(GO:0045095) |
| 0.1 | 0.5 | GO:0030121 | AP-1 adaptor complex(GO:0030121) |
| 0.1 | 3.4 | GO:0001772 | immunological synapse(GO:0001772) |
| 0.1 | 0.3 | GO:0031074 | nucleocytoplasmic shuttling complex(GO:0031074) |
| 0.1 | 0.3 | GO:0044530 | supraspliceosomal complex(GO:0044530) |
| 0.1 | 1.1 | GO:0030056 | hemidesmosome(GO:0030056) |
| 0.1 | 0.2 | GO:0044609 | DBIRD complex(GO:0044609) |
| 0.1 | 0.2 | GO:0098855 | HCN channel complex(GO:0098855) |
| 0.1 | 0.7 | GO:0032039 | integrator complex(GO:0032039) |
| 0.1 | 0.2 | GO:0005600 | collagen type XIII trimer(GO:0005600) transmembrane collagen trimer(GO:0030936) |
| 0.0 | 0.1 | GO:0035354 | Toll-like receptor 1-Toll-like receptor 2 protein complex(GO:0035354) |
| 0.0 | 1.1 | GO:0031231 | integral component of peroxisomal membrane(GO:0005779) intrinsic component of peroxisomal membrane(GO:0031231) |
| 0.0 | 0.1 | GO:0033257 | Bcl3/NF-kappaB2 complex(GO:0033257) |
| 0.0 | 2.9 | GO:0005882 | intermediate filament(GO:0005882) |
| 0.0 | 0.5 | GO:0031258 | lamellipodium membrane(GO:0031258) |
| 0.0 | 0.2 | GO:0005784 | Sec61 translocon complex(GO:0005784) translocon complex(GO:0071256) |
| 0.0 | 1.4 | GO:0030673 | axolemma(GO:0030673) |
| 0.0 | 0.2 | GO:0045323 | interleukin-1 receptor complex(GO:0045323) |
| 0.0 | 1.6 | GO:0030131 | clathrin adaptor complex(GO:0030131) |
| 0.0 | 0.3 | GO:0031415 | NatA complex(GO:0031415) |
| 0.0 | 3.7 | GO:0030134 | ER to Golgi transport vesicle(GO:0030134) |
| 0.0 | 2.2 | GO:0000323 | lytic vacuole(GO:0000323) lysosome(GO:0005764) |
| 0.0 | 1.5 | GO:0030173 | integral component of Golgi membrane(GO:0030173) |
| 0.0 | 0.3 | GO:0014731 | spectrin-associated cytoskeleton(GO:0014731) |
| 0.0 | 0.6 | GO:0098576 | lumenal side of membrane(GO:0098576) |
| 0.0 | 0.4 | GO:0060077 | inhibitory synapse(GO:0060077) |
| 0.0 | 0.1 | GO:0097425 | smooth endoplasmic reticulum membrane(GO:0030868) smooth endoplasmic reticulum part(GO:0097425) |
| 0.0 | 0.6 | GO:0005666 | DNA-directed RNA polymerase III complex(GO:0005666) |
| 0.0 | 0.2 | GO:0042588 | zymogen granule(GO:0042588) |
| 0.0 | 0.1 | GO:1902937 | inward rectifier potassium channel complex(GO:1902937) |
| 0.0 | 2.5 | GO:0099501 | synaptic vesicle membrane(GO:0030672) exocytic vesicle membrane(GO:0099501) |
| 0.0 | 0.5 | GO:0043235 | receptor complex(GO:0043235) |
| 0.0 | 0.2 | GO:0005884 | actin filament(GO:0005884) |
| 0.0 | 0.7 | GO:0031092 | platelet alpha granule membrane(GO:0031092) |
| 0.0 | 0.4 | GO:0034709 | methylosome(GO:0034709) |
| 0.0 | 0.2 | GO:0097470 | ribbon synapse(GO:0097470) |
| 0.0 | 0.2 | GO:0031527 | filopodium membrane(GO:0031527) |
| 0.0 | 0.2 | GO:0005802 | trans-Golgi network(GO:0005802) |
| 0.0 | 0.1 | GO:0005736 | DNA-directed RNA polymerase I complex(GO:0005736) |
| 0.0 | 0.1 | GO:0033263 | CORVET complex(GO:0033263) |
| 0.0 | 0.3 | GO:0044615 | nuclear pore nuclear basket(GO:0044615) |
| 0.0 | 0.6 | GO:0048786 | presynaptic active zone(GO:0048786) |
| 0.0 | 0.2 | GO:0005955 | calcineurin complex(GO:0005955) |
| 0.0 | 1.4 | GO:0035580 | specific granule lumen(GO:0035580) |
| 0.0 | 1.2 | GO:0010494 | cytoplasmic stress granule(GO:0010494) |
| 0.0 | 0.2 | GO:0042622 | photoreceptor outer segment membrane(GO:0042622) |
| 0.0 | 0.3 | GO:0016281 | eukaryotic translation initiation factor 4F complex(GO:0016281) |
| 0.0 | 0.3 | GO:0034992 | microtubule organizing center attachment site(GO:0034992) LINC complex(GO:0034993) |
| 0.0 | 0.5 | GO:0001533 | cornified envelope(GO:0001533) |
| 0.0 | 0.1 | GO:0070436 | Grb2-EGFR complex(GO:0070436) |
| 0.0 | 4.2 | GO:0016323 | basolateral plasma membrane(GO:0016323) |
| 0.0 | 0.2 | GO:0032426 | stereocilium tip(GO:0032426) |
| 0.0 | 0.3 | GO:0005903 | brush border(GO:0005903) |
| 0.0 | 0.4 | GO:0016581 | NuRD complex(GO:0016581) CHD-type complex(GO:0090545) |
| 0.0 | 5.3 | GO:0005769 | early endosome(GO:0005769) |
| 0.0 | 0.3 | GO:0005604 | basement membrane(GO:0005604) |
| 0.0 | 0.2 | GO:0005847 | mRNA cleavage and polyadenylation specificity factor complex(GO:0005847) |
| 0.0 | 0.4 | GO:0044322 | endoplasmic reticulum quality control compartment(GO:0044322) |
| 0.0 | 0.1 | GO:1990635 | proximal dendrite(GO:1990635) |
| 0.0 | 0.3 | GO:0010008 | endosome membrane(GO:0010008) |
| 0.0 | 0.1 | GO:0042719 | mitochondrial intermembrane space protein transporter complex(GO:0042719) |
| 0.0 | 1.0 | GO:0005938 | cell cortex(GO:0005938) |
| 0.0 | 0.2 | GO:0005952 | cAMP-dependent protein kinase complex(GO:0005952) |
| 0.0 | 0.2 | GO:0031932 | TORC2 complex(GO:0031932) |
| 0.0 | 0.2 | GO:0031588 | nucleotide-activated protein kinase complex(GO:0031588) |
| 0.0 | 0.9 | GO:0016529 | sarcoplasmic reticulum(GO:0016529) |
Gene overrepresentation in molecular_function category:
| Log-likelihood per target | Total log-likelihood | Term | Description |
|---|---|---|---|
| 1.0 | 6.1 | GO:0005166 | neurotrophin p75 receptor binding(GO:0005166) |
| 0.5 | 4.4 | GO:0086083 | cell adhesive protein binding involved in bundle of His cell-Purkinje myocyte communication(GO:0086083) |
| 0.5 | 1.9 | GO:0030305 | heparanase activity(GO:0030305) |
| 0.4 | 5.3 | GO:0019534 | toxin transporter activity(GO:0019534) |
| 0.4 | 1.3 | GO:0035403 | histone kinase activity (H3-T6 specific)(GO:0035403) |
| 0.4 | 1.2 | GO:0036313 | phosphatidylinositol 3-kinase catalytic subunit binding(GO:0036313) |
| 0.3 | 1.0 | GO:0016165 | linoleate 13S-lipoxygenase activity(GO:0016165) |
| 0.3 | 2.7 | GO:0015220 | choline transmembrane transporter activity(GO:0015220) |
| 0.3 | 1.2 | GO:0031735 | CCR10 chemokine receptor binding(GO:0031735) |
| 0.3 | 1.2 | GO:0033829 | O-fucosylpeptide 3-beta-N-acetylglucosaminyltransferase activity(GO:0033829) |
| 0.3 | 8.6 | GO:0098641 | cadherin binding involved in cell-cell adhesion(GO:0098641) |
| 0.3 | 3.6 | GO:0004865 | protein serine/threonine phosphatase inhibitor activity(GO:0004865) |
| 0.2 | 4.9 | GO:0005243 | gap junction channel activity(GO:0005243) |
| 0.2 | 1.9 | GO:0004465 | lipoprotein lipase activity(GO:0004465) |
| 0.2 | 1.4 | GO:0044736 | acid-sensing ion channel activity(GO:0044736) |
| 0.2 | 2.3 | GO:0005176 | ErbB-2 class receptor binding(GO:0005176) |
| 0.2 | 5.6 | GO:0005095 | GTPase inhibitor activity(GO:0005095) |
| 0.2 | 0.6 | GO:0003968 | RNA-directed RNA polymerase activity(GO:0003968) |
| 0.2 | 0.6 | GO:0003858 | 3-hydroxybutyrate dehydrogenase activity(GO:0003858) |
| 0.2 | 2.2 | GO:0050544 | arachidonic acid binding(GO:0050544) |
| 0.2 | 1.0 | GO:0004910 | interleukin-1, Type II, blocking receptor activity(GO:0004910) |
| 0.2 | 2.5 | GO:1901702 | urate transmembrane transporter activity(GO:0015143) salt transmembrane transporter activity(GO:1901702) |
| 0.2 | 0.9 | GO:0070644 | vitamin D response element binding(GO:0070644) |
| 0.2 | 1.3 | GO:1990254 | keratin filament binding(GO:1990254) |
| 0.2 | 0.7 | GO:0097677 | STAT family protein binding(GO:0097677) |
| 0.2 | 1.1 | GO:0030348 | syntaxin-3 binding(GO:0030348) |
| 0.2 | 0.5 | GO:0016309 | 1-phosphatidylinositol-5-phosphate 4-kinase activity(GO:0016309) |
| 0.2 | 0.5 | GO:0008859 | exoribonuclease II activity(GO:0008859) |
| 0.2 | 1.7 | GO:0070324 | thyroid hormone binding(GO:0070324) |
| 0.2 | 3.6 | GO:0038191 | neuropilin binding(GO:0038191) |
| 0.1 | 0.4 | GO:0005171 | hepatocyte growth factor receptor binding(GO:0005171) |
| 0.1 | 2.7 | GO:0031404 | chloride ion binding(GO:0031404) |
| 0.1 | 0.7 | GO:0042289 | MHC class II protein binding(GO:0042289) |
| 0.1 | 1.3 | GO:0070915 | lysophosphatidic acid receptor activity(GO:0070915) |
| 0.1 | 3.0 | GO:0019841 | retinol binding(GO:0019841) |
| 0.1 | 0.4 | GO:0004938 | alpha2-adrenergic receptor activity(GO:0004938) |
| 0.1 | 1.8 | GO:0031014 | troponin T binding(GO:0031014) |
| 0.1 | 0.5 | GO:0008184 | purine nucleobase binding(GO:0002060) glycogen phosphorylase activity(GO:0008184) |
| 0.1 | 0.4 | GO:0003918 | DNA topoisomerase type II (ATP-hydrolyzing) activity(GO:0003918) DNA topoisomerase II activity(GO:0061505) |
| 0.1 | 2.3 | GO:0004089 | carbonate dehydratase activity(GO:0004089) |
| 0.1 | 0.7 | GO:0050294 | steroid sulfotransferase activity(GO:0050294) |
| 0.1 | 2.7 | GO:0032794 | GTPase activating protein binding(GO:0032794) |
| 0.1 | 0.6 | GO:1990430 | extracellular matrix protein binding(GO:1990430) |
| 0.1 | 0.5 | GO:0043325 | phosphatidylinositol-3,4-bisphosphate binding(GO:0043325) |
| 0.1 | 1.0 | GO:0005025 | transforming growth factor beta receptor activity, type I(GO:0005025) |
| 0.1 | 1.4 | GO:0038132 | neuregulin binding(GO:0038132) |
| 0.1 | 2.7 | GO:0004653 | polypeptide N-acetylgalactosaminyltransferase activity(GO:0004653) |
| 0.1 | 0.3 | GO:0015130 | mevalonate transmembrane transporter activity(GO:0015130) |
| 0.1 | 0.6 | GO:0043183 | vascular endothelial growth factor receptor 1 binding(GO:0043183) |
| 0.1 | 0.6 | GO:0004741 | [pyruvate dehydrogenase (lipoamide)] phosphatase activity(GO:0004741) |
| 0.1 | 0.1 | GO:0086006 | voltage-gated sodium channel activity involved in cardiac muscle cell action potential(GO:0086006) voltage-gated sodium channel activity involved in Purkinje myocyte action potential(GO:0086062) |
| 0.1 | 0.8 | GO:0070097 | delta-catenin binding(GO:0070097) |
| 0.1 | 0.3 | GO:0005174 | CD40 receptor binding(GO:0005174) |
| 0.1 | 0.4 | GO:0015375 | glycine:sodium symporter activity(GO:0015375) |
| 0.1 | 2.0 | GO:0022841 | potassium ion leak channel activity(GO:0022841) |
| 0.1 | 0.6 | GO:0003945 | N-acetyllactosamine synthase activity(GO:0003945) |
| 0.1 | 1.0 | GO:0052650 | NADP-retinol dehydrogenase activity(GO:0052650) |
| 0.1 | 0.3 | GO:0003845 | 11-beta-hydroxysteroid dehydrogenase [NAD(P)] activity(GO:0003845) |
| 0.1 | 0.4 | GO:0004040 | amidase activity(GO:0004040) |
| 0.1 | 3.6 | GO:0051959 | dynein light intermediate chain binding(GO:0051959) |
| 0.1 | 0.9 | GO:0005375 | copper ion transmembrane transporter activity(GO:0005375) |
| 0.1 | 1.9 | GO:1990381 | ubiquitin-specific protease binding(GO:1990381) |
| 0.1 | 0.3 | GO:0000994 | RNA polymerase III core binding(GO:0000994) |
| 0.1 | 0.3 | GO:0048408 | epidermal growth factor binding(GO:0048408) |
| 0.1 | 0.6 | GO:0004301 | epoxide hydrolase activity(GO:0004301) |
| 0.1 | 0.9 | GO:0042608 | T cell receptor binding(GO:0042608) |
| 0.1 | 1.6 | GO:0043560 | insulin receptor substrate binding(GO:0043560) |
| 0.1 | 2.0 | GO:0008239 | dipeptidyl-peptidase activity(GO:0008239) |
| 0.1 | 0.2 | GO:0031862 | prostanoid receptor binding(GO:0031862) |
| 0.1 | 0.3 | GO:0003976 | UDP-N-acetylglucosamine-lysosomal-enzyme N-acetylglucosaminephosphotransferase activity(GO:0003976) |
| 0.1 | 0.7 | GO:0071933 | Arp2/3 complex binding(GO:0071933) |
| 0.1 | 1.5 | GO:0031435 | mitogen-activated protein kinase kinase kinase binding(GO:0031435) |
| 0.1 | 0.2 | GO:0004819 | glutamine-tRNA ligase activity(GO:0004819) |
| 0.1 | 1.1 | GO:0022889 | L-serine transmembrane transporter activity(GO:0015194) serine transmembrane transporter activity(GO:0022889) |
| 0.1 | 3.9 | GO:0001784 | phosphotyrosine binding(GO:0001784) |
| 0.1 | 0.4 | GO:0004489 | methylenetetrahydrofolate reductase (NAD(P)H) activity(GO:0004489) |
| 0.1 | 1.5 | GO:0042043 | neurexin family protein binding(GO:0042043) |
| 0.1 | 1.9 | GO:0031489 | myosin V binding(GO:0031489) |
| 0.1 | 0.3 | GO:0003726 | double-stranded RNA adenosine deaminase activity(GO:0003726) |
| 0.1 | 0.5 | GO:0005005 | transmembrane-ephrin receptor activity(GO:0005005) |
| 0.1 | 0.6 | GO:0090599 | alpha-glucosidase activity(GO:0090599) |
| 0.1 | 0.3 | GO:1990190 | peptide-glutamate-N-acetyltransferase activity(GO:1990190) |
| 0.1 | 0.4 | GO:0008569 | ATP-dependent microtubule motor activity, minus-end-directed(GO:0008569) |
| 0.1 | 0.8 | GO:0017034 | Rap guanyl-nucleotide exchange factor activity(GO:0017034) |
| 0.1 | 0.2 | GO:0004730 | pseudouridylate synthase activity(GO:0004730) |
| 0.1 | 1.2 | GO:0004065 | arylsulfatase activity(GO:0004065) |
| 0.1 | 0.2 | GO:0016530 | metallochaperone activity(GO:0016530) |
| 0.1 | 0.2 | GO:0047025 | 3-oxoacyl-[acyl-carrier-protein] reductase (NADH) activity(GO:0047025) |
| 0.1 | 0.2 | GO:0003839 | gamma-glutamylcyclotransferase activity(GO:0003839) |
| 0.1 | 7.6 | GO:0004867 | serine-type endopeptidase inhibitor activity(GO:0004867) |
| 0.1 | 0.2 | GO:0009019 | tRNA (guanine-N1-)-methyltransferase activity(GO:0009019) |
| 0.1 | 0.6 | GO:0019784 | NEDD8-specific protease activity(GO:0019784) |
| 0.1 | 0.5 | GO:1903136 | cuprous ion binding(GO:1903136) |
| 0.1 | 0.6 | GO:0097016 | L27 domain binding(GO:0097016) |
| 0.1 | 5.7 | GO:0030165 | PDZ domain binding(GO:0030165) |
| 0.0 | 3.0 | GO:0017080 | sodium channel regulator activity(GO:0017080) |
| 0.0 | 0.4 | GO:0005227 | calcium activated cation channel activity(GO:0005227) |
| 0.0 | 2.8 | GO:0097110 | scaffold protein binding(GO:0097110) |
| 0.0 | 0.1 | GO:0008476 | protein-tyrosine sulfotransferase activity(GO:0008476) |
| 0.0 | 1.1 | GO:0034237 | protein kinase A regulatory subunit binding(GO:0034237) |
| 0.0 | 0.5 | GO:0001042 | RNA polymerase I core binding(GO:0001042) |
| 0.0 | 0.2 | GO:0005222 | intracellular cAMP activated cation channel activity(GO:0005222) |
| 0.0 | 0.8 | GO:0102391 | decanoate--CoA ligase activity(GO:0102391) |
| 0.0 | 0.4 | GO:0017128 | phospholipid scramblase activity(GO:0017128) |
| 0.0 | 0.2 | GO:0008408 | 3'-5' exonuclease activity(GO:0008408) |
| 0.0 | 0.4 | GO:0019238 | cyclohydrolase activity(GO:0019238) |
| 0.0 | 0.5 | GO:0000982 | transcription factor activity, RNA polymerase II core promoter proximal region sequence-specific binding(GO:0000982) |
| 0.0 | 0.4 | GO:0000182 | rDNA binding(GO:0000182) |
| 0.0 | 0.2 | GO:0001855 | complement component C4b binding(GO:0001855) |
| 0.0 | 0.3 | GO:0008440 | inositol-1,4,5-trisphosphate 3-kinase activity(GO:0008440) |
| 0.0 | 0.1 | GO:0017082 | mineralocorticoid receptor activity(GO:0017082) |
| 0.0 | 1.4 | GO:0005035 | tumor necrosis factor-activated receptor activity(GO:0005031) death receptor activity(GO:0005035) |
| 0.0 | 0.5 | GO:0031434 | mitogen-activated protein kinase kinase binding(GO:0031434) |
| 0.0 | 0.3 | GO:0008526 | phosphatidylinositol transporter activity(GO:0008526) |
| 0.0 | 6.5 | GO:0017124 | SH3 domain binding(GO:0017124) |
| 0.0 | 0.6 | GO:0036374 | glutathione hydrolase activity(GO:0036374) |
| 0.0 | 0.7 | GO:0008392 | arachidonic acid monooxygenase activity(GO:0008391) arachidonic acid epoxygenase activity(GO:0008392) |
| 0.0 | 0.1 | GO:0035663 | Toll-like receptor 2 binding(GO:0035663) |
| 0.0 | 1.7 | GO:0005246 | calcium channel regulator activity(GO:0005246) |
| 0.0 | 0.1 | GO:0004769 | steroid delta-isomerase activity(GO:0004769) |
| 0.0 | 0.5 | GO:0051011 | microtubule minus-end binding(GO:0051011) |
| 0.0 | 0.2 | GO:0005250 | A-type (transient outward) potassium channel activity(GO:0005250) |
| 0.0 | 0.5 | GO:0070513 | death domain binding(GO:0070513) |
| 0.0 | 0.2 | GO:0004800 | thyroxine 5'-deiodinase activity(GO:0004800) |
| 0.0 | 0.1 | GO:0033149 | FFAT motif binding(GO:0033149) |
| 0.0 | 0.4 | GO:0004000 | adenosine deaminase activity(GO:0004000) |
| 0.0 | 0.3 | GO:0003713 | transcription coactivator activity(GO:0003713) |
| 0.0 | 0.3 | GO:0031419 | cobalamin binding(GO:0031419) |
| 0.0 | 0.1 | GO:0000033 | alpha-1,3-mannosyltransferase activity(GO:0000033) |
| 0.0 | 0.2 | GO:0060002 | plus-end directed microfilament motor activity(GO:0060002) |
| 0.0 | 0.1 | GO:0001190 | transcriptional activator activity, RNA polymerase II transcription factor binding(GO:0001190) transcriptional repressor activity, RNA polymerase II activating transcription factor binding(GO:0098811) |
| 0.0 | 0.4 | GO:0003708 | retinoic acid receptor activity(GO:0003708) |
| 0.0 | 0.6 | GO:0001056 | RNA polymerase III activity(GO:0001056) |
| 0.0 | 0.2 | GO:0030297 | transmembrane receptor protein tyrosine kinase activator activity(GO:0030297) |
| 0.0 | 0.1 | GO:0070576 | vitamin D 24-hydroxylase activity(GO:0070576) |
| 0.0 | 0.5 | GO:0005112 | Notch binding(GO:0005112) |
| 0.0 | 0.9 | GO:0043236 | laminin binding(GO:0043236) |
| 0.0 | 0.3 | GO:0097322 | 7SK snRNA binding(GO:0097322) |
| 0.0 | 0.1 | GO:0004419 | hydroxymethylglutaryl-CoA lyase activity(GO:0004419) |
| 0.0 | 0.2 | GO:0016618 | hydroxypyruvate reductase activity(GO:0016618) glyoxylate reductase (NADP) activity(GO:0030267) |
| 0.0 | 0.4 | GO:0016595 | glutamate binding(GO:0016595) |
| 0.0 | 0.1 | GO:0030107 | HLA-A specific inhibitory MHC class I receptor activity(GO:0030107) |
| 0.0 | 0.4 | GO:0050786 | RAGE receptor binding(GO:0050786) |
| 0.0 | 0.1 | GO:0004719 | protein-L-isoaspartate (D-aspartate) O-methyltransferase activity(GO:0004719) |
| 0.0 | 0.6 | GO:0000900 | translation repressor activity, nucleic acid binding(GO:0000900) |
| 0.0 | 0.2 | GO:0008474 | palmitoyl-(protein) hydrolase activity(GO:0008474) palmitoyl hydrolase activity(GO:0098599) |
| 0.0 | 1.0 | GO:0043531 | ADP binding(GO:0043531) |
| 0.0 | 0.5 | GO:0001608 | G-protein coupled nucleotide receptor activity(GO:0001608) G-protein coupled purinergic nucleotide receptor activity(GO:0045028) |
| 0.0 | 0.1 | GO:0008513 | secondary active organic cation transmembrane transporter activity(GO:0008513) |
| 0.0 | 0.2 | GO:0004704 | NF-kappaB-inducing kinase activity(GO:0004704) |
| 0.0 | 0.4 | GO:0016274 | arginine N-methyltransferase activity(GO:0016273) protein-arginine N-methyltransferase activity(GO:0016274) |
| 0.0 | 0.1 | GO:0008430 | selenium binding(GO:0008430) |
| 0.0 | 0.2 | GO:0004468 | lysine N-acetyltransferase activity, acting on acetyl phosphate as donor(GO:0004468) |
| 0.0 | 1.7 | GO:0030276 | clathrin binding(GO:0030276) |
| 0.0 | 0.6 | GO:0000146 | microfilament motor activity(GO:0000146) |
| 0.0 | 0.4 | GO:0004709 | MAP kinase kinase kinase activity(GO:0004709) |
| 0.0 | 0.2 | GO:0008142 | oxysterol binding(GO:0008142) |
| 0.0 | 0.1 | GO:0001054 | RNA polymerase I activity(GO:0001054) |
| 0.0 | 0.1 | GO:0003974 | UDP-N-acetylglucosamine 4-epimerase activity(GO:0003974) UDP-glucose 4-epimerase activity(GO:0003978) |
| 0.0 | 0.2 | GO:0005030 | neurotrophin receptor activity(GO:0005030) |
| 0.0 | 0.1 | GO:0016802 | adenosylhomocysteinase activity(GO:0004013) trialkylsulfonium hydrolase activity(GO:0016802) |
| 0.0 | 0.3 | GO:0034236 | protein kinase A catalytic subunit binding(GO:0034236) |
| 0.0 | 0.2 | GO:0004935 | adrenergic receptor activity(GO:0004935) |
| 0.0 | 0.1 | GO:0016413 | O-acetyltransferase activity(GO:0016413) |
| 0.0 | 0.1 | GO:0019215 | intermediate filament binding(GO:0019215) |
| 0.0 | 0.1 | GO:0035673 | oligopeptide transmembrane transporter activity(GO:0035673) |
| 0.0 | 3.4 | GO:0008083 | growth factor activity(GO:0008083) |
| 0.0 | 0.1 | GO:0008336 | gamma-butyrobetaine dioxygenase activity(GO:0008336) |
| 0.0 | 0.1 | GO:0003810 | protein-glutamine gamma-glutamyltransferase activity(GO:0003810) |
| 0.0 | 0.1 | GO:0030151 | molybdenum ion binding(GO:0030151) |
| 0.0 | 0.8 | GO:0070412 | R-SMAD binding(GO:0070412) |
| 0.0 | 0.3 | GO:0008190 | eukaryotic initiation factor 4E binding(GO:0008190) |
| 0.0 | 0.4 | GO:0016303 | 1-phosphatidylinositol-3-kinase activity(GO:0016303) |
| 0.0 | 0.1 | GO:0015280 | ligand-gated sodium channel activity(GO:0015280) |
| 0.0 | 0.4 | GO:0030676 | Rac guanyl-nucleotide exchange factor activity(GO:0030676) |
| 0.0 | 0.1 | GO:0016421 | CoA carboxylase activity(GO:0016421) |
| 0.0 | 0.1 | GO:0001225 | RNA polymerase II transcription coactivator binding(GO:0001225) |
| 0.0 | 0.1 | GO:0008503 | benzodiazepine receptor activity(GO:0008503) |
| 0.0 | 0.2 | GO:0005545 | 1-phosphatidylinositol binding(GO:0005545) |
| 0.0 | 0.1 | GO:0030296 | protein tyrosine kinase activator activity(GO:0030296) |
| 0.0 | 0.1 | GO:0016634 | oxidoreductase activity, acting on the CH-CH group of donors, oxygen as acceptor(GO:0016634) |
| 0.0 | 0.1 | GO:0004999 | vasoactive intestinal polypeptide receptor activity(GO:0004999) |
| 0.0 | 0.3 | GO:0019707 | protein-cysteine S-palmitoyltransferase activity(GO:0019706) protein-cysteine S-acyltransferase activity(GO:0019707) |
| 0.0 | 0.5 | GO:0001786 | phosphatidylserine binding(GO:0001786) |
| 0.0 | 0.2 | GO:0046875 | ephrin receptor binding(GO:0046875) |
| 0.0 | 0.4 | GO:1990841 | promoter-specific chromatin binding(GO:1990841) |
| 0.0 | 0.1 | GO:0004784 | superoxide dismutase activity(GO:0004784) oxidoreductase activity, acting on superoxide radicals as acceptor(GO:0016721) |
| 0.0 | 0.1 | GO:0043522 | leucine zipper domain binding(GO:0043522) |
| 0.0 | 0.1 | GO:0005497 | androgen binding(GO:0005497) |
| 0.0 | 0.1 | GO:0015643 | toxic substance binding(GO:0015643) |
Gene overrepresentation in C2:CP category:
| Log-likelihood per target | Total log-likelihood | Term | Description |
|---|---|---|---|
| 0.1 | 5.1 | PID WNT SIGNALING PATHWAY | Wnt signaling network |
| 0.1 | 7.3 | PID NECTIN PATHWAY | Nectin adhesion pathway |
| 0.1 | 4.0 | PID ERBB NETWORK PATHWAY | ErbB receptor signaling network |
| 0.1 | 0.7 | PID A6B1 A6B4 INTEGRIN PATHWAY | a6b1 and a6b4 Integrin signaling |
| 0.1 | 2.1 | PID TCR RAS PATHWAY | Ras signaling in the CD4+ TCR pathway |
| 0.1 | 7.2 | PID SHP2 PATHWAY | SHP2 signaling |
| 0.1 | 4.7 | PID AJDISS 2PATHWAY | Posttranslational regulation of adherens junction stability and dissassembly |
| 0.1 | 2.3 | PID IL2 PI3K PATHWAY | IL2 signaling events mediated by PI3K |
| 0.0 | 3.4 | PID TAP63 PATHWAY | Validated transcriptional targets of TAp63 isoforms |
| 0.0 | 0.8 | SA B CELL RECEPTOR COMPLEXES | Antigen binding to B cell receptors activates protein tyrosine kinases, such as the Src family, which ultimate activate MAP kinases. |
| 0.0 | 0.1 | PID NFKAPPAB ATYPICAL PATHWAY | Atypical NF-kappaB pathway |
| 0.0 | 2.5 | PID NFAT TFPATHWAY | Calcineurin-regulated NFAT-dependent transcription in lymphocytes |
| 0.0 | 1.3 | PID GLYPICAN 1PATHWAY | Glypican 1 network |
| 0.0 | 1.0 | PID ALPHA SYNUCLEIN PATHWAY | Alpha-synuclein signaling |
| 0.0 | 1.1 | PID RET PATHWAY | Signaling events regulated by Ret tyrosine kinase |
| 0.0 | 0.8 | PID EPHRINB REV PATHWAY | Ephrin B reverse signaling |
| 0.0 | 1.3 | PID IL1 PATHWAY | IL1-mediated signaling events |
| 0.0 | 1.0 | PID IL23 PATHWAY | IL23-mediated signaling events |
| 0.0 | 2.4 | PID CASPASE PATHWAY | Caspase cascade in apoptosis |
| 0.0 | 1.3 | PID ECADHERIN STABILIZATION PATHWAY | Stabilization and expansion of the E-cadherin adherens junction |
| 0.0 | 0.9 | PID ARF6 PATHWAY | Arf6 signaling events |
| 0.0 | 2.2 | PID HIF1 TFPATHWAY | HIF-1-alpha transcription factor network |
| 0.0 | 0.5 | PID EPHA FWDPATHWAY | EPHA forward signaling |
| 0.0 | 0.1 | PID S1P S1P4 PATHWAY | S1P4 pathway |
| 0.0 | 0.3 | PID ALK2 PATHWAY | ALK2 signaling events |
| 0.0 | 0.5 | PID ANGIOPOIETIN RECEPTOR PATHWAY | Angiopoietin receptor Tie2-mediated signaling |
| 0.0 | 0.3 | PID HIF2PATHWAY | HIF-2-alpha transcription factor network |
| 0.0 | 0.5 | PID TCPTP PATHWAY | Signaling events mediated by TCPTP |
| 0.0 | 0.7 | PID HNF3B PATHWAY | FOXA2 and FOXA3 transcription factor networks |
| 0.0 | 3.6 | NABA ECM REGULATORS | Genes encoding enzymes and their regulators involved in the remodeling of the extracellular matrix |
| 0.0 | 0.8 | PID HNF3A PATHWAY | FOXA1 transcription factor network |
| 0.0 | 0.4 | PID RXR VDR PATHWAY | RXR and RAR heterodimerization with other nuclear receptor |
| 0.0 | 2.5 | NABA ECM AFFILIATED | Genes encoding proteins affiliated structurally or functionally to extracellular matrix proteins |
| 0.0 | 0.3 | ST ERK1 ERK2 MAPK PATHWAY | ERK1/ERK2 MAPK Pathway |
| 0.0 | 0.4 | PID RAS PATHWAY | Regulation of Ras family activation |
| 0.0 | 0.5 | PID TGFBR PATHWAY | TGF-beta receptor signaling |
| 0.0 | 0.3 | PID CERAMIDE PATHWAY | Ceramide signaling pathway |
Gene overrepresentation in C2:CP:REACTOME category:
| Log-likelihood per target | Total log-likelihood | Term | Description |
|---|---|---|---|
| 0.4 | 7.8 | REACTOME APOPTOTIC CLEAVAGE OF CELL ADHESION PROTEINS | Genes involved in Apoptotic cleavage of cell adhesion proteins |
| 0.3 | 8.5 | REACTOME TGF BETA RECEPTOR SIGNALING IN EMT EPITHELIAL TO MESENCHYMAL TRANSITION | Genes involved in TGF-beta receptor signaling in EMT (epithelial to mesenchymal transition) |
| 0.2 | 4.9 | REACTOME GAP JUNCTION ASSEMBLY | Genes involved in Gap junction assembly |
| 0.2 | 7.1 | REACTOME ADHERENS JUNCTIONS INTERACTIONS | Genes involved in Adherens junctions interactions |
| 0.2 | 7.7 | REACTOME TIGHT JUNCTION INTERACTIONS | Genes involved in Tight junction interactions |
| 0.1 | 2.3 | REACTOME REVERSIBLE HYDRATION OF CARBON DIOXIDE | Genes involved in Reversible Hydration of Carbon Dioxide |
| 0.1 | 2.0 | REACTOME TANDEM PORE DOMAIN POTASSIUM CHANNELS | Genes involved in Tandem pore domain potassium channels |
| 0.1 | 2.4 | REACTOME FACILITATIVE NA INDEPENDENT GLUCOSE TRANSPORTERS | Genes involved in Facilitative Na+-independent glucose transporters |
| 0.1 | 1.9 | REACTOME NEF MEDIATED DOWNREGULATION OF MHC CLASS I COMPLEX CELL SURFACE EXPRESSION | Genes involved in Nef mediated downregulation of MHC class I complex cell surface expression |
| 0.1 | 0.5 | REACTOME NEGATIVE REGULATION OF THE PI3K AKT NETWORK | Genes involved in Negative regulation of the PI3K/AKT network |
| 0.1 | 1.8 | REACTOME PECAM1 INTERACTIONS | Genes involved in PECAM1 interactions |
| 0.1 | 2.2 | REACTOME DOWNREGULATION OF ERBB2 ERBB3 SIGNALING | Genes involved in Downregulation of ERBB2:ERBB3 signaling |
| 0.1 | 2.2 | REACTOME PROTEOLYTIC CLEAVAGE OF SNARE COMPLEX PROTEINS | Genes involved in Proteolytic cleavage of SNARE complex proteins |
| 0.1 | 3.2 | REACTOME AMINE COMPOUND SLC TRANSPORTERS | Genes involved in Amine compound SLC transporters |
| 0.1 | 1.2 | REACTOME THE ACTIVATION OF ARYLSULFATASES | Genes involved in The activation of arylsulfatases |
| 0.1 | 1.0 | REACTOME SIGNALING BY CONSTITUTIVELY ACTIVE EGFR | Genes involved in Signaling by constitutively active EGFR |
| 0.1 | 2.3 | REACTOME TIE2 SIGNALING | Genes involved in Tie2 Signaling |
| 0.1 | 1.9 | REACTOME HS GAG DEGRADATION | Genes involved in HS-GAG degradation |
| 0.1 | 0.2 | REACTOME SIGNALING BY ERBB2 | Genes involved in Signaling by ERBB2 |
| 0.1 | 5.3 | REACTOME INTERFERON GAMMA SIGNALING | Genes involved in Interferon gamma signaling |
| 0.1 | 2.3 | REACTOME AMINO ACID TRANSPORT ACROSS THE PLASMA MEMBRANE | Genes involved in Amino acid transport across the plasma membrane |
| 0.1 | 1.3 | REACTOME PHOSPHORYLATION OF CD3 AND TCR ZETA CHAINS | Genes involved in Phosphorylation of CD3 and TCR zeta chains |
| 0.1 | 1.3 | REACTOME ABCA TRANSPORTERS IN LIPID HOMEOSTASIS | Genes involved in ABCA transporters in lipid homeostasis |
| 0.1 | 1.1 | REACTOME GLYCOGEN BREAKDOWN GLYCOGENOLYSIS | Genes involved in Glycogen breakdown (glycogenolysis) |
| 0.1 | 1.6 | REACTOME TRAFFICKING OF GLUR2 CONTAINING AMPA RECEPTORS | Genes involved in Trafficking of GluR2-containing AMPA receptors |
| 0.1 | 1.2 | REACTOME PRE NOTCH PROCESSING IN GOLGI | Genes involved in Pre-NOTCH Processing in Golgi |
| 0.0 | 0.5 | REACTOME SYNTHESIS OF BILE ACIDS AND BILE SALTS VIA 24 HYDROXYCHOLESTEROL | Genes involved in Synthesis of bile acids and bile salts via 24-hydroxycholesterol |
| 0.0 | 0.7 | REACTOME APOPTOSIS INDUCED DNA FRAGMENTATION | Genes involved in Apoptosis induced DNA fragmentation |
| 0.0 | 2.8 | REACTOME O LINKED GLYCOSYLATION OF MUCINS | Genes involved in O-linked glycosylation of mucins |
| 0.0 | 1.0 | REACTOME OTHER SEMAPHORIN INTERACTIONS | Genes involved in Other semaphorin interactions |
| 0.0 | 1.3 | REACTOME TRAF6 MEDIATED NFKB ACTIVATION | Genes involved in TRAF6 mediated NF-kB activation |
| 0.0 | 0.6 | REACTOME REGULATION OF PYRUVATE DEHYDROGENASE PDH COMPLEX | Genes involved in Regulation of pyruvate dehydrogenase (PDH) complex |
| 0.0 | 0.9 | REACTOME NCAM1 INTERACTIONS | Genes involved in NCAM1 interactions |
| 0.0 | 0.4 | REACTOME DSCAM INTERACTIONS | Genes involved in DSCAM interactions |
| 0.0 | 0.4 | REACTOME TETRAHYDROBIOPTERIN BH4 SYNTHESIS RECYCLING SALVAGE AND REGULATION | Genes involved in Tetrahydrobiopterin (BH4) synthesis, recycling, salvage and regulation |
| 0.0 | 0.8 | REACTOME IONOTROPIC ACTIVITY OF KAINATE RECEPTORS | Genes involved in Ionotropic activity of Kainate Receptors |
| 0.0 | 0.8 | REACTOME SIGNALING BY HIPPO | Genes involved in Signaling by Hippo |
| 0.0 | 0.5 | REACTOME N GLYCAN ANTENNAE ELONGATION | Genes involved in N-Glycan antennae elongation |
| 0.0 | 0.6 | REACTOME NEPHRIN INTERACTIONS | Genes involved in Nephrin interactions |
| 0.0 | 0.5 | REACTOME P38MAPK EVENTS | Genes involved in p38MAPK events |
| 0.0 | 0.6 | REACTOME VEGF LIGAND RECEPTOR INTERACTIONS | Genes involved in VEGF ligand-receptor interactions |
| 0.0 | 0.2 | REACTOME NFKB IS ACTIVATED AND SIGNALS SURVIVAL | Genes involved in NF-kB is activated and signals survival |
| 0.0 | 1.4 | REACTOME CELL JUNCTION ORGANIZATION | Genes involved in Cell junction organization |
| 0.0 | 1.2 | REACTOME SPHINGOLIPID DE NOVO BIOSYNTHESIS | Genes involved in Sphingolipid de novo biosynthesis |
| 0.0 | 1.0 | REACTOME ASSOCIATION OF TRIC CCT WITH TARGET PROTEINS DURING BIOSYNTHESIS | Genes involved in Association of TriC/CCT with target proteins during biosynthesis |
| 0.0 | 0.6 | REACTOME RNA POL III CHAIN ELONGATION | Genes involved in RNA Polymerase III Chain Elongation |
| 0.0 | 0.5 | REACTOME ACTIVATION OF THE AP1 FAMILY OF TRANSCRIPTION FACTORS | Genes involved in Activation of the AP-1 family of transcription factors |
| 0.0 | 0.3 | REACTOME CDC6 ASSOCIATION WITH THE ORC ORIGIN COMPLEX | Genes involved in CDC6 association with the ORC:origin complex |
| 0.0 | 0.7 | REACTOME CYTOSOLIC SULFONATION OF SMALL MOLECULES | Genes involved in Cytosolic sulfonation of small molecules |
| 0.0 | 0.4 | REACTOME XENOBIOTICS | Genes involved in Xenobiotics |
| 0.0 | 2.5 | REACTOME MHC CLASS II ANTIGEN PRESENTATION | Genes involved in MHC class II antigen presentation |
| 0.0 | 1.1 | REACTOME IL1 SIGNALING | Genes involved in Interleukin-1 signaling |
| 0.0 | 1.1 | REACTOME ION TRANSPORT BY P TYPE ATPASES | Genes involved in Ion transport by P-type ATPases |
| 0.0 | 1.7 | REACTOME GOLGI ASSOCIATED VESICLE BIOGENESIS | Genes involved in Golgi Associated Vesicle Biogenesis |
| 0.0 | 0.2 | REACTOME TRAF3 DEPENDENT IRF ACTIVATION PATHWAY | Genes involved in TRAF3-dependent IRF activation pathway |
| 0.0 | 0.1 | REACTOME UNBLOCKING OF NMDA RECEPTOR GLUTAMATE BINDING AND ACTIVATION | Genes involved in Unblocking of NMDA receptor, glutamate binding and activation |
| 0.0 | 0.2 | REACTOME ACTIVATION OF RAC | Genes involved in Activation of Rac |
| 0.0 | 3.6 | REACTOME SIGNALING BY RHO GTPASES | Genes involved in Signaling by Rho GTPases |
| 0.0 | 0.2 | REACTOME ACTIVATION OF BH3 ONLY PROTEINS | Genes involved in Activation of BH3-only proteins |
| 0.0 | 1.0 | REACTOME CHEMOKINE RECEPTORS BIND CHEMOKINES | Genes involved in Chemokine receptors bind chemokines |
| 0.0 | 0.3 | REACTOME RECYCLING PATHWAY OF L1 | Genes involved in Recycling pathway of L1 |
| 0.0 | 0.4 | REACTOME CYTOCHROME P450 ARRANGED BY SUBSTRATE TYPE | Genes involved in Cytochrome P450 - arranged by substrate type |
| 0.0 | 0.1 | REACTOME SEMA3A PLEXIN REPULSION SIGNALING BY INHIBITING INTEGRIN ADHESION | Genes involved in SEMA3A-Plexin repulsion signaling by inhibiting Integrin adhesion |
| 0.0 | 0.3 | REACTOME CS DS DEGRADATION | Genes involved in CS/DS degradation |
| 0.0 | 0.3 | REACTOME MTORC1 MEDIATED SIGNALLING | Genes involved in mTORC1-mediated signalling |
| 0.0 | 0.2 | REACTOME CREATION OF C4 AND C2 ACTIVATORS | Genes involved in Creation of C4 and C2 activators |
| 0.0 | 0.1 | REACTOME DOWNSTREAM TCR SIGNALING | Genes involved in Downstream TCR signaling |
| 0.0 | 0.3 | REACTOME AMINE DERIVED HORMONES | Genes involved in Amine-derived hormones |