Project
Epithelial-Mesenchymal Transition, human (Scheel, 2011)
Navigation
Downloads
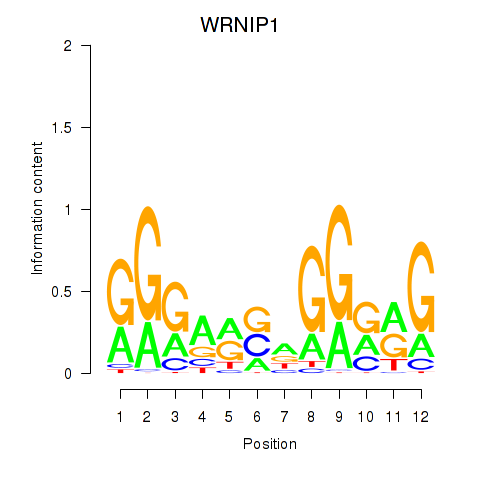
Results for WRNIP1
Z-value: 2.15
Motif logo
Transcription factors associated with WRNIP1
| Gene Symbol | Gene ID | Gene Info |
|---|---|---|
|
WRNIP1
|
ENSG00000124535.11 | WRNIP1 |
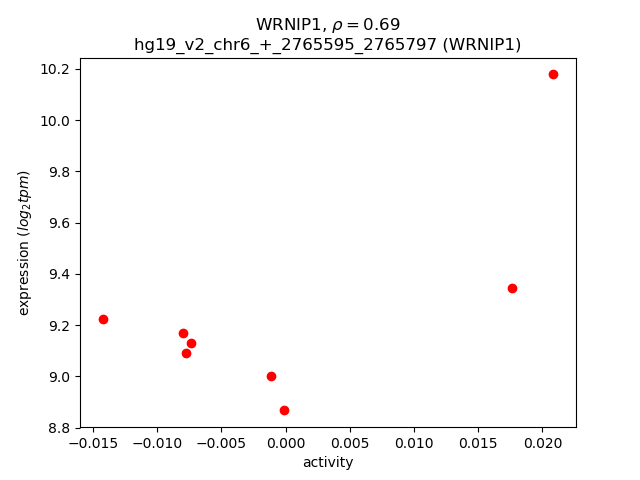
Activity-expression correlation:
| Gene | Promoter | Pearson corr. coef. | P-value | Plot |
|---|---|---|---|---|
| WRNIP1 | hg19_v2_chr6_+_2765595_2765797 | 0.69 | 6.0e-02 | Click! |
Activity profile of WRNIP1 motif
Sorted Z-values of WRNIP1 motif
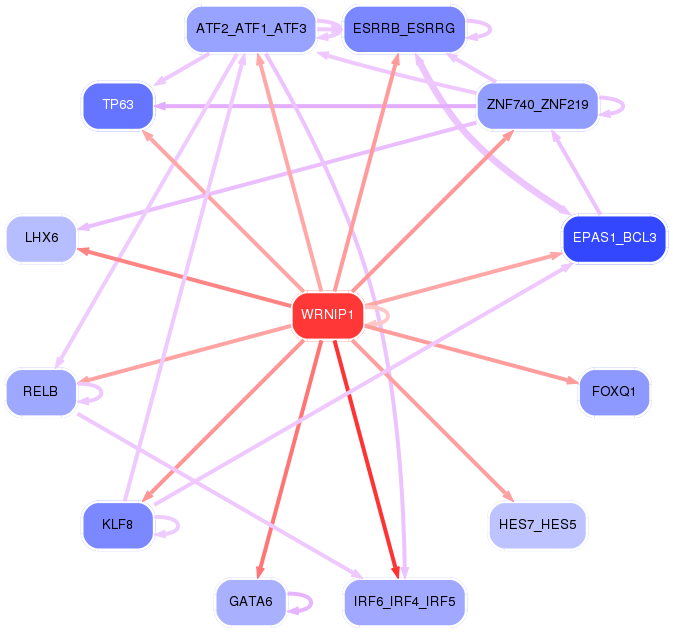
Network of associatons between targets according to the STRING database.

First level regulatory network of WRNIP1
| Promoter | Score | Transcript | Gene | Gene Info |
|---|---|---|---|---|
| chr19_-_36004543 | 7.30 |
ENST00000339686.3 ENST00000447113.2 ENST00000440396.1 |
DMKN |
dermokine |
| chr19_-_51456344 | 6.46 |
ENST00000336334.3 ENST00000593428.1 |
KLK5 |
kallikrein-related peptidase 5 |
| chr1_-_153588334 | 6.09 |
ENST00000476873.1 |
S100A14 |
S100 calcium binding protein A14 |
| chr19_-_51504852 | 4.97 |
ENST00000391806.2 ENST00000347619.4 ENST00000291726.7 ENST00000320838.5 |
KLK8 |
kallikrein-related peptidase 8 |
| chr19_-_51456321 | 4.96 |
ENST00000391809.2 |
KLK5 |
kallikrein-related peptidase 5 |
| chr2_+_102608306 | 4.69 |
ENST00000332549.3 |
IL1R2 |
interleukin 1 receptor, type II |
| chr7_+_145813453 | 4.67 |
ENST00000361727.3 |
CNTNAP2 |
contactin associated protein-like 2 |
| chr1_-_153588765 | 4.47 |
ENST00000368701.1 ENST00000344616.2 |
S100A14 |
S100 calcium binding protein A14 |
| chr8_-_41166953 | 4.32 |
ENST00000220772.3 |
SFRP1 |
secreted frizzled-related protein 1 |
| chr19_-_51504411 | 4.03 |
ENST00000593490.1 |
KLK8 |
kallikrein-related peptidase 8 |
| chr17_-_39677971 | 4.01 |
ENST00000393976.2 |
KRT15 |
keratin 15 |
| chr19_-_36001286 | 4.00 |
ENST00000602679.1 ENST00000492341.2 ENST00000472252.2 ENST00000602781.1 ENST00000402589.2 ENST00000458071.1 ENST00000436012.1 ENST00000443640.1 ENST00000450261.1 ENST00000467637.1 ENST00000480502.1 ENST00000474928.1 ENST00000414866.2 ENST00000392206.2 ENST00000488892.1 |
DMKN |
dermokine |
| chr1_-_209979465 | 3.99 |
ENST00000542854.1 |
IRF6 |
interferon regulatory factor 6 |
| chr1_-_28503693 | 3.91 |
ENST00000373857.3 |
PTAFR |
platelet-activating factor receptor |
| chr8_+_95653373 | 3.87 |
ENST00000358397.5 |
ESRP1 |
epithelial splicing regulatory protein 1 |
| chr19_-_51522955 | 3.86 |
ENST00000358789.3 |
KLK10 |
kallikrein-related peptidase 10 |
| chr7_-_41740181 | 3.58 |
ENST00000442711.1 |
INHBA |
inhibin, beta A |
| chr8_+_95653427 | 3.46 |
ENST00000454170.2 |
ESRP1 |
epithelial splicing regulatory protein 1 |
| chr19_-_35992780 | 3.45 |
ENST00000593342.1 ENST00000601650.1 ENST00000408915.2 |
DMKN |
dermokine |
| chr8_+_95653302 | 3.24 |
ENST00000423620.2 ENST00000433389.2 |
ESRP1 |
epithelial splicing regulatory protein 1 |
| chr19_-_55658281 | 3.21 |
ENST00000585321.2 ENST00000587465.2 |
TNNT1 |
troponin T type 1 (skeletal, slow) |
| chr1_+_209602156 | 3.18 |
ENST00000429156.1 ENST00000366437.3 ENST00000603283.1 ENST00000431096.1 |
MIR205HG |
MIR205 host gene (non-protein coding) |
| chr12_-_6483969 | 3.11 |
ENST00000396966.2 |
SCNN1A |
sodium channel, non-voltage-gated 1 alpha subunit |
| chr1_+_2036149 | 3.04 |
ENST00000482686.1 ENST00000400920.1 ENST00000486681.1 |
PRKCZ |
protein kinase C, zeta |
| chr1_+_35247859 | 3.03 |
ENST00000373362.3 |
GJB3 |
gap junction protein, beta 3, 31kDa |
| chr4_-_15939963 | 3.02 |
ENST00000259988.2 |
FGFBP1 |
fibroblast growth factor binding protein 1 |
| chr12_-_6484715 | 3.00 |
ENST00000228916.2 |
SCNN1A |
sodium channel, non-voltage-gated 1 alpha subunit |
| chr12_-_6484376 | 2.99 |
ENST00000360168.3 ENST00000358945.3 |
SCNN1A |
sodium channel, non-voltage-gated 1 alpha subunit |
| chr2_-_70781087 | 2.95 |
ENST00000394241.3 ENST00000295400.6 |
TGFA |
transforming growth factor, alpha |
| chr1_-_209979375 | 2.93 |
ENST00000367021.3 |
IRF6 |
interferon regulatory factor 6 |
| chr2_-_70780572 | 2.92 |
ENST00000450929.1 |
TGFA |
transforming growth factor, alpha |
| chr1_+_209602609 | 2.90 |
ENST00000458250.1 |
MIR205HG |
MIR205 host gene (non-protein coding) |
| chr2_-_46385 | 2.87 |
ENST00000327669.4 |
FAM110C |
family with sequence similarity 110, member C |
| chr5_-_60140009 | 2.84 |
ENST00000505959.1 |
ELOVL7 |
ELOVL fatty acid elongase 7 |
| chr12_-_51785182 | 2.81 |
ENST00000356317.3 ENST00000603188.1 ENST00000604847.1 ENST00000604506.1 |
GALNT6 |
UDP-N-acetyl-alpha-D-galactosamine:polypeptide N-acetylgalactosaminyltransferase 6 (GalNAc-T6) |
| chr2_+_47596287 | 2.79 |
ENST00000263735.4 |
EPCAM |
epithelial cell adhesion molecule |
| chr6_+_30851840 | 2.79 |
ENST00000511510.1 ENST00000376569.3 ENST00000376575.3 ENST00000376570.4 ENST00000446312.1 ENST00000504927.1 |
DDR1 |
discoidin domain receptor tyrosine kinase 1 |
| chr1_-_153363452 | 2.78 |
ENST00000368732.1 ENST00000368733.3 |
S100A8 |
S100 calcium binding protein A8 |
| chr19_-_51456198 | 2.78 |
ENST00000594846.1 |
KLK5 |
kallikrein-related peptidase 5 |
| chr19_-_51487071 | 2.75 |
ENST00000391807.1 ENST00000593904.1 |
KLK7 |
kallikrein-related peptidase 7 |
| chr7_+_69064300 | 2.72 |
ENST00000342771.4 |
AUTS2 |
autism susceptibility candidate 2 |
| chr16_+_57673207 | 2.71 |
ENST00000564783.1 ENST00000564729.1 ENST00000565976.1 ENST00000566508.1 ENST00000544297.1 |
GPR56 |
G protein-coupled receptor 56 |
| chr19_-_51523275 | 2.71 |
ENST00000309958.3 |
KLK10 |
kallikrein-related peptidase 10 |
| chr15_+_43886057 | 2.68 |
ENST00000441322.1 ENST00000413657.2 ENST00000453733.1 |
CKMT1B |
creatine kinase, mitochondrial 1B |
| chr16_+_57673430 | 2.67 |
ENST00000540164.2 ENST00000568531.1 |
GPR56 |
G protein-coupled receptor 56 |
| chr19_-_291365 | 2.60 |
ENST00000591572.1 ENST00000269812.3 ENST00000434325.2 |
PPAP2C |
phosphatidic acid phosphatase type 2C |
| chr19_-_6720686 | 2.59 |
ENST00000245907.6 |
C3 |
complement component 3 |
| chr1_-_207206092 | 2.55 |
ENST00000359470.5 ENST00000461135.2 |
C1orf116 |
chromosome 1 open reading frame 116 |
| chr15_+_43985725 | 2.54 |
ENST00000413453.2 |
CKMT1A |
creatine kinase, mitochondrial 1A |
| chr19_+_35606692 | 2.52 |
ENST00000406242.3 ENST00000454903.2 |
FXYD3 |
FXYD domain containing ion transport regulator 3 |
| chr19_-_51523412 | 2.49 |
ENST00000391805.1 ENST00000599077.1 |
KLK10 |
kallikrein-related peptidase 10 |
| chr15_+_43885252 | 2.48 |
ENST00000453782.1 ENST00000300283.6 ENST00000437924.1 ENST00000450086.2 |
CKMT1B |
creatine kinase, mitochondrial 1B |
| chr10_-_123357598 | 2.46 |
ENST00000358487.5 ENST00000369058.3 ENST00000369060.4 ENST00000359354.2 |
FGFR2 |
fibroblast growth factor receptor 2 |
| chr1_+_2005425 | 2.42 |
ENST00000461106.2 |
PRKCZ |
protein kinase C, zeta |
| chr15_+_43985084 | 2.41 |
ENST00000434505.1 ENST00000411750.1 |
CKMT1A |
creatine kinase, mitochondrial 1A |
| chr6_+_27215494 | 2.39 |
ENST00000230582.3 |
PRSS16 |
protease, serine, 16 (thymus) |
| chr16_+_68679193 | 2.39 |
ENST00000581171.1 |
CDH3 |
cadherin 3, type 1, P-cadherin (placental) |
| chr7_-_98030360 | 2.37 |
ENST00000005260.8 |
BAIAP2L1 |
BAI1-associated protein 2-like 1 |
| chr19_-_51487282 | 2.37 |
ENST00000595820.1 ENST00000597707.1 ENST00000336317.4 |
KLK7 |
kallikrein-related peptidase 7 |
| chr18_+_21452804 | 2.36 |
ENST00000269217.6 |
LAMA3 |
laminin, alpha 3 |
| chr19_-_6690723 | 2.34 |
ENST00000601008.1 |
C3 |
complement component 3 |
| chr6_+_27215471 | 2.34 |
ENST00000421826.2 |
PRSS16 |
protease, serine, 16 (thymus) |
| chr18_+_21452964 | 2.33 |
ENST00000587184.1 |
LAMA3 |
laminin, alpha 3 |
| chr1_+_35220613 | 2.33 |
ENST00000338513.1 |
GJB5 |
gap junction protein, beta 5, 31.1kDa |
| chr22_+_45148432 | 2.31 |
ENST00000389774.2 ENST00000396119.2 ENST00000336963.4 ENST00000356099.6 ENST00000412433.1 |
ARHGAP8 |
Rho GTPase activating protein 8 |
| chr19_-_291133 | 2.29 |
ENST00000327790.3 |
PPAP2C |
phosphatidic acid phosphatase type 2C |
| chr19_-_54676846 | 2.29 |
ENST00000301187.4 |
TMC4 |
transmembrane channel-like 4 |
| chr19_-_36001113 | 2.29 |
ENST00000434389.1 |
DMKN |
dermokine |
| chr14_-_21994525 | 2.28 |
ENST00000538754.1 |
SALL2 |
spalt-like transcription factor 2 |
| chr18_+_19749386 | 2.28 |
ENST00000269216.3 |
GATA6 |
GATA binding protein 6 |
| chr17_-_7166500 | 2.25 |
ENST00000575313.1 ENST00000397317.4 |
CLDN7 |
claudin 7 |
| chr12_-_52887034 | 2.25 |
ENST00000330722.6 |
KRT6A |
keratin 6A |
| chr8_+_31497271 | 2.22 |
ENST00000520407.1 |
NRG1 |
neuregulin 1 |
| chr1_+_152957707 | 2.17 |
ENST00000368762.1 |
SPRR1A |
small proline-rich protein 1A |
| chr4_-_90758227 | 2.15 |
ENST00000506691.1 ENST00000394986.1 ENST00000506244.1 ENST00000394989.2 ENST00000394991.3 |
SNCA |
synuclein, alpha (non A4 component of amyloid precursor) |
| chr15_+_41136586 | 2.15 |
ENST00000431806.1 |
SPINT1 |
serine peptidase inhibitor, Kunitz type 1 |
| chr11_+_1861399 | 2.14 |
ENST00000381905.3 |
TNNI2 |
troponin I type 2 (skeletal, fast) |
| chr12_-_8803128 | 2.11 |
ENST00000543467.1 |
MFAP5 |
microfibrillar associated protein 5 |
| chr1_-_160990886 | 2.11 |
ENST00000537746.1 |
F11R |
F11 receptor |
| chrX_-_153141302 | 2.10 |
ENST00000361699.4 ENST00000543994.1 ENST00000370057.3 ENST00000538883.1 ENST00000361981.3 |
L1CAM |
L1 cell adhesion molecule |
| chr2_+_17721920 | 2.10 |
ENST00000295156.4 |
VSNL1 |
visinin-like 1 |
| chr10_-_105845674 | 2.09 |
ENST00000353479.5 ENST00000369733.3 |
COL17A1 |
collagen, type XVII, alpha 1 |
| chr1_+_44401479 | 2.05 |
ENST00000438616.3 |
ARTN |
artemin |
| chr8_+_124194752 | 2.03 |
ENST00000318462.6 |
FAM83A |
family with sequence similarity 83, member A |
| chr19_+_45281118 | 2.02 |
ENST00000270279.3 ENST00000341505.4 |
CBLC |
Cbl proto-oncogene C, E3 ubiquitin protein ligase |
| chr15_+_41136216 | 2.01 |
ENST00000562057.1 ENST00000344051.4 |
SPINT1 |
serine peptidase inhibitor, Kunitz type 1 |
| chr2_-_70780770 | 1.98 |
ENST00000444975.1 ENST00000445399.1 ENST00000418333.2 |
TGFA |
transforming growth factor, alpha |
| chr11_+_130029457 | 1.98 |
ENST00000278742.5 |
ST14 |
suppression of tumorigenicity 14 (colon carcinoma) |
| chr6_-_41130841 | 1.98 |
ENST00000373122.4 |
TREM2 |
triggering receptor expressed on myeloid cells 2 |
| chr19_-_55658650 | 1.98 |
ENST00000589226.1 |
TNNT1 |
troponin T type 1 (skeletal, slow) |
| chr19_-_49567124 | 1.98 |
ENST00000301411.3 |
NTF4 |
neurotrophin 4 |
| chr3_-_13921594 | 1.97 |
ENST00000285018.4 |
WNT7A |
wingless-type MMTV integration site family, member 7A |
| chrX_-_102565932 | 1.97 |
ENST00000372674.1 ENST00000372677.3 |
BEX2 |
brain expressed X-linked 2 |
| chr1_-_209824643 | 1.97 |
ENST00000391911.1 ENST00000415782.1 |
LAMB3 |
laminin, beta 3 |
| chr16_+_68678892 | 1.96 |
ENST00000429102.2 |
CDH3 |
cadherin 3, type 1, P-cadherin (placental) |
| chr6_+_30852130 | 1.95 |
ENST00000428153.2 ENST00000376568.3 ENST00000452441.1 ENST00000515219.1 |
DDR1 |
discoidin domain receptor tyrosine kinase 1 |
| chr16_+_57653989 | 1.95 |
ENST00000567835.1 ENST00000569372.1 ENST00000563548.1 ENST00000562003.1 |
GPR56 |
G protein-coupled receptor 56 |
| chr16_+_68771128 | 1.94 |
ENST00000261769.5 ENST00000422392.2 |
CDH1 |
cadherin 1, type 1, E-cadherin (epithelial) |
| chr19_+_45312347 | 1.94 |
ENST00000270233.6 ENST00000591520.1 |
BCAM |
basal cell adhesion molecule (Lutheran blood group) |
| chr1_+_117452669 | 1.94 |
ENST00000393203.2 |
PTGFRN |
prostaglandin F2 receptor inhibitor |
| chr5_-_149682447 | 1.92 |
ENST00000328668.7 |
ARSI |
arylsulfatase family, member I |
| chr12_-_53343602 | 1.91 |
ENST00000546897.1 ENST00000552551.1 |
KRT8 |
keratin 8 |
| chr17_-_7167279 | 1.91 |
ENST00000571932.2 |
CLDN7 |
claudin 7 |
| chr1_-_159915386 | 1.91 |
ENST00000361509.3 ENST00000368094.1 |
IGSF9 |
immunoglobulin superfamily, member 9 |
| chr1_+_109792641 | 1.88 |
ENST00000271332.3 |
CELSR2 |
cadherin, EGF LAG seven-pass G-type receptor 2 |
| chr19_-_55658687 | 1.88 |
ENST00000593046.1 |
TNNT1 |
troponin T type 1 (skeletal, slow) |
| chr19_+_17905919 | 1.87 |
ENST00000318683.6 ENST00000600777.1 ENST00000595387.1 |
B3GNT3 |
UDP-GlcNAc:betaGal beta-1,3-N-acetylglucosaminyltransferase 3 |
| chr9_-_124991124 | 1.87 |
ENST00000394319.4 ENST00000340587.3 |
LHX6 |
LIM homeobox 6 |
| chr12_+_4382917 | 1.85 |
ENST00000261254.3 |
CCND2 |
cyclin D2 |
| chr19_+_7710774 | 1.85 |
ENST00000602355.1 |
STXBP2 |
syntaxin binding protein 2 |
| chr8_-_57232656 | 1.85 |
ENST00000396721.2 |
SDR16C5 |
short chain dehydrogenase/reductase family 16C, member 5 |
| chr18_+_47088401 | 1.84 |
ENST00000261292.4 ENST00000427224.2 ENST00000580036.1 |
LIPG |
lipase, endothelial |
| chr1_+_160370344 | 1.84 |
ENST00000368061.2 |
VANGL2 |
VANGL planar cell polarity protein 2 |
| chr1_+_156030937 | 1.82 |
ENST00000361084.5 |
RAB25 |
RAB25, member RAS oncogene family |
| chr20_+_58296265 | 1.81 |
ENST00000395636.2 ENST00000361300.4 |
PHACTR3 |
phosphatase and actin regulator 3 |
| chr22_+_29876197 | 1.78 |
ENST00000310624.6 |
NEFH |
neurofilament, heavy polypeptide |
| chr12_-_53298841 | 1.77 |
ENST00000293308.6 |
KRT8 |
keratin 8 |
| chr4_-_11431389 | 1.77 |
ENST00000002596.5 |
HS3ST1 |
heparan sulfate (glucosamine) 3-O-sulfotransferase 1 |
| chr9_-_124989804 | 1.77 |
ENST00000373755.2 ENST00000373754.2 |
LHX6 |
LIM homeobox 6 |
| chr8_-_127570603 | 1.77 |
ENST00000304916.3 |
FAM84B |
family with sequence similarity 84, member B |
| chr10_+_75670862 | 1.76 |
ENST00000446342.1 ENST00000372764.3 ENST00000372762.4 |
PLAU |
plasminogen activator, urokinase |
| chr11_-_119999611 | 1.75 |
ENST00000529044.1 |
TRIM29 |
tripartite motif containing 29 |
| chr19_+_51152702 | 1.75 |
ENST00000425202.1 |
C19orf81 |
chromosome 19 open reading frame 81 |
| chr1_+_153003671 | 1.74 |
ENST00000307098.4 |
SPRR1B |
small proline-rich protein 1B |
| chr16_-_68269971 | 1.74 |
ENST00000565858.1 |
ESRP2 |
epithelial splicing regulatory protein 2 |
| chr12_-_8815299 | 1.74 |
ENST00000535336.1 |
MFAP5 |
microfibrillar associated protein 5 |
| chr3_-_124839648 | 1.74 |
ENST00000430155.2 |
SLC12A8 |
solute carrier family 12, member 8 |
| chr4_+_79472673 | 1.74 |
ENST00000264908.6 |
ANXA3 |
annexin A3 |
| chr2_-_113594279 | 1.73 |
ENST00000416750.1 ENST00000418817.1 ENST00000263341.2 |
IL1B |
interleukin 1, beta |
| chr5_-_60140089 | 1.72 |
ENST00000507047.1 ENST00000438340.1 ENST00000425382.1 ENST00000508821.1 |
ELOVL7 |
ELOVL fatty acid elongase 7 |
| chr9_-_33447584 | 1.70 |
ENST00000297991.4 |
AQP3 |
aquaporin 3 (Gill blood group) |
| chr17_+_7344057 | 1.70 |
ENST00000575398.1 ENST00000575082.1 |
FGF11 |
fibroblast growth factor 11 |
| chr6_-_136847610 | 1.70 |
ENST00000454590.1 ENST00000432797.2 |
MAP7 |
microtubule-associated protein 7 |
| chr9_-_139948487 | 1.69 |
ENST00000355097.2 |
ENTPD2 |
ectonucleoside triphosphate diphosphohydrolase 2 |
| chr15_+_90744533 | 1.69 |
ENST00000411539.2 |
SEMA4B |
sema domain, immunoglobulin domain (Ig), transmembrane domain (TM) and short cytoplasmic domain, (semaphorin) 4B |
| chr6_+_30848557 | 1.69 |
ENST00000460944.2 ENST00000324771.8 |
DDR1 |
discoidin domain receptor tyrosine kinase 1 |
| chr1_+_32042131 | 1.68 |
ENST00000271064.7 ENST00000537531.1 |
TINAGL1 |
tubulointerstitial nephritis antigen-like 1 |
| chr7_+_86273700 | 1.68 |
ENST00000546348.1 |
GRM3 |
glutamate receptor, metabotropic 3 |
| chr16_+_67233412 | 1.67 |
ENST00000477898.1 |
ELMO3 |
engulfment and cell motility 3 |
| chr19_+_35606777 | 1.67 |
ENST00000604404.1 ENST00000435734.2 ENST00000603181.1 |
FXYD3 |
FXYD domain containing ion transport regulator 3 |
| chr20_+_58251716 | 1.67 |
ENST00000355648.4 |
PHACTR3 |
phosphatase and actin regulator 3 |
| chr20_+_1875378 | 1.66 |
ENST00000356025.3 |
SIRPA |
signal-regulatory protein alpha |
| chr3_-_56835967 | 1.65 |
ENST00000495373.1 ENST00000296315.3 |
ARHGEF3 |
Rho guanine nucleotide exchange factor (GEF) 3 |
| chr11_-_108408895 | 1.64 |
ENST00000443411.1 ENST00000533052.1 |
EXPH5 |
exophilin 5 |
| chr1_-_156786634 | 1.64 |
ENST00000392306.2 ENST00000368199.3 |
SH2D2A |
SH2 domain containing 2A |
| chr16_-_31147020 | 1.64 |
ENST00000568261.1 ENST00000567797.1 ENST00000317508.6 |
PRSS8 |
protease, serine, 8 |
| chr11_+_117947724 | 1.63 |
ENST00000534111.1 |
TMPRSS4 |
transmembrane protease, serine 4 |
| chr5_+_175298573 | 1.63 |
ENST00000512824.1 |
CPLX2 |
complexin 2 |
| chr19_+_50084561 | 1.63 |
ENST00000246794.5 |
PRRG2 |
proline rich Gla (G-carboxyglutamic acid) 2 |
| chr15_+_89182178 | 1.61 |
ENST00000559876.1 |
ISG20 |
interferon stimulated exonuclease gene 20kDa |
| chr1_-_175162048 | 1.61 |
ENST00000444639.1 |
KIAA0040 |
KIAA0040 |
| chr20_+_58179582 | 1.61 |
ENST00000371015.1 ENST00000395639.4 |
PHACTR3 |
phosphatase and actin regulator 3 |
| chr1_-_24469602 | 1.60 |
ENST00000270800.1 |
IL22RA1 |
interleukin 22 receptor, alpha 1 |
| chr19_-_16045220 | 1.59 |
ENST00000326742.8 |
CYP4F11 |
cytochrome P450, family 4, subfamily F, polypeptide 11 |
| chr14_-_94856987 | 1.59 |
ENST00000449399.3 ENST00000404814.4 |
SERPINA1 |
serpin peptidase inhibitor, clade A (alpha-1 antiproteinase, antitrypsin), member 1 |
| chr11_+_69931519 | 1.59 |
ENST00000316296.5 ENST00000530676.1 |
ANO1 |
anoctamin 1, calcium activated chloride channel |
| chr8_+_124194875 | 1.58 |
ENST00000522648.1 ENST00000276699.6 |
FAM83A |
family with sequence similarity 83, member A |
| chr19_-_54676884 | 1.58 |
ENST00000376591.4 |
TMC4 |
transmembrane channel-like 4 |
| chr6_+_25279651 | 1.58 |
ENST00000329474.6 |
LRRC16A |
leucine rich repeat containing 16A |
| chr2_-_113542063 | 1.57 |
ENST00000263339.3 |
IL1A |
interleukin 1, alpha |
| chr11_+_18287801 | 1.57 |
ENST00000532858.1 ENST00000405158.2 |
SAA1 |
serum amyloid A1 |
| chr1_+_77333117 | 1.57 |
ENST00000477717.1 |
ST6GALNAC5 |
ST6 (alpha-N-acetyl-neuraminyl-2,3-beta-galactosyl-1,3)-N-acetylgalactosaminide alpha-2,6-sialyltransferase 5 |
| chr1_+_2004901 | 1.56 |
ENST00000400921.2 |
PRKCZ |
protein kinase C, zeta |
| chr16_-_85784557 | 1.56 |
ENST00000602675.1 |
C16orf74 |
chromosome 16 open reading frame 74 |
| chr11_+_18287721 | 1.56 |
ENST00000356524.4 |
SAA1 |
serum amyloid A1 |
| chr12_-_52867569 | 1.56 |
ENST00000252250.6 |
KRT6C |
keratin 6C |
| chr1_+_13910479 | 1.56 |
ENST00000509009.1 |
PDPN |
podoplanin |
| chr12_-_28122980 | 1.55 |
ENST00000395868.3 ENST00000534890.1 |
PTHLH |
parathyroid hormone-like hormone |
| chr15_+_89182156 | 1.54 |
ENST00000379224.5 |
ISG20 |
interferon stimulated exonuclease gene 20kDa |
| chr16_+_76587314 | 1.54 |
ENST00000563764.1 |
RP11-58C22.1 |
Uncharacterized protein |
| chr1_-_242687989 | 1.53 |
ENST00000442594.2 |
PLD5 |
phospholipase D family, member 5 |
| chr19_+_35609380 | 1.53 |
ENST00000604621.1 |
FXYD3 |
FXYD domain containing ion transport regulator 3 |
| chr17_-_7164410 | 1.52 |
ENST00000574070.1 |
CLDN7 |
claudin 7 |
| chr18_+_21529811 | 1.51 |
ENST00000588004.1 |
LAMA3 |
laminin, alpha 3 |
| chr5_+_68788594 | 1.51 |
ENST00000396442.2 ENST00000380766.2 |
OCLN |
occludin |
| chr12_-_8814669 | 1.49 |
ENST00000535411.1 ENST00000540087.1 |
MFAP5 |
microfibrillar associated protein 5 |
| chr18_+_33877654 | 1.48 |
ENST00000257209.4 ENST00000445677.1 ENST00000590592.1 ENST00000359247.4 |
FHOD3 |
formin homology 2 domain containing 3 |
| chr4_+_79472888 | 1.48 |
ENST00000512884.1 ENST00000512542.1 ENST00000503570.2 |
ANXA3 |
annexin A3 |
| chr2_+_113931513 | 1.48 |
ENST00000245796.6 ENST00000441564.3 |
PSD4 |
pleckstrin and Sec7 domain containing 4 |
| chr1_+_82266053 | 1.47 |
ENST00000370715.1 ENST00000370713.1 ENST00000319517.6 ENST00000370717.2 ENST00000394879.1 ENST00000271029.4 ENST00000335786.5 |
LPHN2 |
latrophilin 2 |
| chr3_-_189840223 | 1.47 |
ENST00000427335.2 |
LEPREL1 |
leprecan-like 1 |
| chrX_+_152953505 | 1.46 |
ENST00000253122.5 |
SLC6A8 |
solute carrier family 6 (neurotransmitter transporter), member 8 |
| chr11_-_119993734 | 1.45 |
ENST00000533302.1 |
TRIM29 |
tripartite motif containing 29 |
| chr6_-_136871957 | 1.45 |
ENST00000354570.3 |
MAP7 |
microtubule-associated protein 7 |
| chr1_-_175161890 | 1.45 |
ENST00000545251.2 ENST00000423313.1 |
KIAA0040 |
KIAA0040 |
| chr16_+_4845379 | 1.44 |
ENST00000588606.1 ENST00000586005.1 |
SMIM22 |
small integral membrane protein 22 |
| chr3_-_49941042 | 1.44 |
ENST00000344206.4 ENST00000296474.3 |
MST1R |
macrophage stimulating 1 receptor (c-met-related tyrosine kinase) |
| chr16_+_57662138 | 1.43 |
ENST00000562414.1 ENST00000561969.1 ENST00000562631.1 ENST00000563445.1 ENST00000565338.1 ENST00000567702.1 |
GPR56 |
G protein-coupled receptor 56 |
| chr15_+_40532058 | 1.43 |
ENST00000260404.4 |
PAK6 |
p21 protein (Cdc42/Rac)-activated kinase 6 |
| chrX_+_56259316 | 1.43 |
ENST00000468660.1 |
KLF8 |
Kruppel-like factor 8 |
| chr11_-_118134997 | 1.43 |
ENST00000278937.2 |
MPZL2 |
myelin protein zero-like 2 |
| chr12_+_83080659 | 1.43 |
ENST00000321196.3 |
TMTC2 |
transmembrane and tetratricopeptide repeat containing 2 |
| chr11_-_119999539 | 1.42 |
ENST00000541857.1 |
TRIM29 |
tripartite motif containing 29 |
| chr4_-_90758118 | 1.41 |
ENST00000420646.2 |
SNCA |
synuclein, alpha (non A4 component of amyloid precursor) |
| chr11_-_112034803 | 1.41 |
ENST00000528832.1 |
IL18 |
interleukin 18 (interferon-gamma-inducing factor) |
| chr11_-_112034831 | 1.41 |
ENST00000280357.7 |
IL18 |
interleukin 18 (interferon-gamma-inducing factor) |
| chr19_-_49149553 | 1.41 |
ENST00000084798.4 |
CA11 |
carbonic anhydrase XI |
| chr4_-_84255935 | 1.41 |
ENST00000513463.1 |
HPSE |
heparanase |
| chr1_-_32801825 | 1.40 |
ENST00000329421.7 |
MARCKSL1 |
MARCKS-like 1 |
| chr16_-_85784718 | 1.40 |
ENST00000602766.1 |
C16orf74 |
chromosome 16 open reading frame 74 |
Gene Ontology Analysis
Gene overrepresentation in biological_process category:
| Log-likelihood per target | Total log-likelihood | Term | Description |
|---|---|---|---|
| 3.2 | 19.4 | GO:0002760 | positive regulation of antimicrobial peptide production(GO:0002225) positive regulation of antimicrobial humoral response(GO:0002760) positive regulation of antibacterial peptide production(GO:0002803) |
| 2.8 | 16.8 | GO:1903575 | cornified envelope assembly(GO:1903575) |
| 2.0 | 7.8 | GO:0045578 | negative regulation of B cell differentiation(GO:0045578) |
| 2.0 | 7.8 | GO:0032912 | negative regulation of transforming growth factor beta2 production(GO:0032912) |
| 1.9 | 5.7 | GO:0071109 | superior temporal gyrus development(GO:0071109) |
| 1.8 | 5.5 | GO:1904298 | positive regulation of neutrophil degranulation(GO:0043315) cellular response to gravity(GO:0071258) positive regulation of neutrophil activation(GO:1902565) regulation of transcytosis(GO:1904298) positive regulation of transcytosis(GO:1904300) regulation of maternal process involved in parturition(GO:1904301) positive regulation of maternal process involved in parturition(GO:1904303) response to 2-O-acetyl-1-O-hexadecyl-sn-glycero-3-phosphocholine(GO:1904316) cellular response to 2-O-acetyl-1-O-hexadecyl-sn-glycero-3-phosphocholine(GO:1904317) |
| 1.6 | 4.9 | GO:0001798 | positive regulation of type IIa hypersensitivity(GO:0001798) positive regulation of type II hypersensitivity(GO:0002894) |
| 1.4 | 8.2 | GO:2001181 | positive regulation of interleukin-10 secretion(GO:2001181) |
| 1.4 | 5.4 | GO:0032690 | negative regulation of interleukin-1 alpha production(GO:0032690) negative regulation of interleukin-1 alpha secretion(GO:0050712) |
| 1.3 | 4.0 | GO:0002588 | positive regulation of antigen processing and presentation of peptide or polysaccharide antigen via MHC class II(GO:0002582) positive regulation of antigen processing and presentation of peptide antigen(GO:0002585) positive regulation of antigen processing and presentation of peptide antigen via MHC class II(GO:0002588) |
| 1.3 | 3.9 | GO:0035604 | fibroblast growth factor receptor signaling pathway involved in negative regulation of apoptotic process in bone marrow(GO:0035602) fibroblast growth factor receptor signaling pathway involved in hemopoiesis(GO:0035603) fibroblast growth factor receptor signaling pathway involved in positive regulation of cell proliferation in bone marrow(GO:0035604) |
| 1.1 | 9.2 | GO:0031642 | negative regulation of myelination(GO:0031642) |
| 1.1 | 3.3 | GO:1990764 | regulation of myofibroblast contraction(GO:1904328) myofibroblast contraction(GO:1990764) |
| 1.1 | 2.2 | GO:0046136 | positive regulation of vitamin metabolic process(GO:0046136) positive regulation of vitamin D biosynthetic process(GO:0060557) positive regulation of calcidiol 1-monooxygenase activity(GO:0060559) |
| 1.0 | 3.0 | GO:0033693 | neurofilament bundle assembly(GO:0033693) |
| 1.0 | 2.9 | GO:0098582 | innate vocalization behavior(GO:0098582) |
| 1.0 | 3.9 | GO:0042231 | interleukin-13 biosynthetic process(GO:0042231) |
| 0.9 | 4.5 | GO:0000738 | DNA catabolic process, exonucleolytic(GO:0000738) |
| 0.9 | 4.5 | GO:0051945 | negative regulation of dopamine uptake involved in synaptic transmission(GO:0051585) norepinephrine uptake(GO:0051620) regulation of norepinephrine uptake(GO:0051621) negative regulation of norepinephrine uptake(GO:0051622) negative regulation of catecholamine uptake involved in synaptic transmission(GO:0051945) regulation of glutathione peroxidase activity(GO:1903282) positive regulation of glutathione peroxidase activity(GO:1903284) positive regulation of hydrogen peroxide catabolic process(GO:1903285) positive regulation of peroxidase activity(GO:2000470) |
| 0.9 | 3.6 | GO:0042377 | menaquinone catabolic process(GO:0042361) vitamin K catabolic process(GO:0042377) |
| 0.9 | 4.4 | GO:0060671 | epithelial cell differentiation involved in embryonic placenta development(GO:0060671) epithelial cell morphogenesis involved in placental branching(GO:0060672) |
| 0.9 | 7.8 | GO:0031444 | slow-twitch skeletal muscle fiber contraction(GO:0031444) |
| 0.8 | 3.4 | GO:0007402 | ganglion mother cell fate determination(GO:0007402) |
| 0.8 | 7.3 | GO:0061302 | smooth muscle cell-matrix adhesion(GO:0061302) |
| 0.8 | 4.0 | GO:1901731 | positive regulation of platelet aggregation(GO:1901731) |
| 0.8 | 4.0 | GO:1904274 | tricellular tight junction assembly(GO:1904274) |
| 0.8 | 4.5 | GO:0042335 | cuticle development(GO:0042335) |
| 0.8 | 2.3 | GO:0042360 | vitamin E metabolic process(GO:0042360) |
| 0.8 | 3.8 | GO:0097021 | lymphocyte migration into lymphoid organs(GO:0097021) |
| 0.8 | 1.5 | GO:0002302 | CD8-positive, alpha-beta T cell differentiation involved in immune response(GO:0002302) |
| 0.7 | 3.7 | GO:0045743 | positive regulation of fibroblast growth factor receptor signaling pathway(GO:0045743) |
| 0.7 | 2.9 | GO:0060448 | dichotomous subdivision of terminal units involved in lung branching(GO:0060448) |
| 0.7 | 2.9 | GO:0060066 | oviduct development(GO:0060066) |
| 0.7 | 0.7 | GO:0045976 | negative regulation of mitotic cell cycle, embryonic(GO:0045976) |
| 0.7 | 0.7 | GO:0032227 | negative regulation of synaptic transmission, dopaminergic(GO:0032227) |
| 0.7 | 6.6 | GO:0006600 | creatine metabolic process(GO:0006600) |
| 0.6 | 4.5 | GO:0021840 | directional guidance of interneurons involved in migration from the subpallium to the cortex(GO:0021840) chemorepulsion involved in interneuron migration from the subpallium to the cortex(GO:0021842) |
| 0.6 | 2.5 | GO:0030311 | poly-N-acetyllactosamine biosynthetic process(GO:0030311) |
| 0.6 | 1.8 | GO:0010652 | regulation of cell communication by chemical coupling(GO:0010645) positive regulation of cell communication by chemical coupling(GO:0010652) |
| 0.6 | 1.2 | GO:2000309 | positive regulation of tumor necrosis factor (ligand) superfamily member 11 production(GO:2000309) |
| 0.6 | 1.8 | GO:0048627 | myoblast development(GO:0048627) |
| 0.6 | 3.0 | GO:0038018 | Wnt receptor catabolic process(GO:0038018) |
| 0.6 | 2.3 | GO:0003134 | BMP signaling pathway involved in heart induction(GO:0003130) endodermal-mesodermal cell signaling(GO:0003133) endodermal-mesodermal cell signaling involved in heart induction(GO:0003134) |
| 0.6 | 2.3 | GO:0001897 | cytolysis by symbiont of host cells(GO:0001897) |
| 0.6 | 2.2 | GO:0007499 | ectoderm and mesoderm interaction(GO:0007499) |
| 0.6 | 5.5 | GO:0048875 | chemical homeostasis within a tissue(GO:0048875) |
| 0.5 | 9.2 | GO:0045741 | positive regulation of epidermal growth factor-activated receptor activity(GO:0045741) |
| 0.5 | 15.6 | GO:0031581 | hemidesmosome assembly(GO:0031581) |
| 0.5 | 2.1 | GO:2001287 | negative regulation of caveolin-mediated endocytosis(GO:2001287) |
| 0.5 | 4.6 | GO:0086073 | bundle of His cell-Purkinje myocyte adhesion involved in cell communication(GO:0086073) |
| 0.5 | 1.5 | GO:0018057 | peptidyl-lysine oxidation(GO:0018057) |
| 0.5 | 2.5 | GO:0010609 | mRNA localization resulting in posttranscriptional regulation of gene expression(GO:0010609) |
| 0.5 | 1.5 | GO:1903984 | positive regulation of TRAIL-activated apoptotic signaling pathway(GO:1903984) |
| 0.5 | 0.5 | GO:0002761 | regulation of myeloid leukocyte differentiation(GO:0002761) |
| 0.5 | 4.4 | GO:0034625 | fatty acid elongation, saturated fatty acid(GO:0019367) fatty acid elongation, unsaturated fatty acid(GO:0019368) fatty acid elongation, monounsaturated fatty acid(GO:0034625) fatty acid elongation, polyunsaturated fatty acid(GO:0034626) |
| 0.5 | 0.5 | GO:0060197 | cloacal septation(GO:0060197) |
| 0.5 | 1.5 | GO:0002541 | activation of plasma proteins involved in acute inflammatory response(GO:0002541) |
| 0.5 | 1.5 | GO:0090362 | positive regulation of platelet-derived growth factor production(GO:0090362) |
| 0.5 | 13.1 | GO:0090026 | positive regulation of monocyte chemotaxis(GO:0090026) |
| 0.5 | 3.4 | GO:0051121 | hepoxilin metabolic process(GO:0051121) hepoxilin biosynthetic process(GO:0051122) |
| 0.5 | 1.9 | GO:0061591 | calcium activated phospholipid scrambling(GO:0061588) calcium activated phosphatidylserine scrambling(GO:0061589) calcium activated phosphatidylcholine scrambling(GO:0061590) calcium activated galactosylceramide scrambling(GO:0061591) |
| 0.5 | 2.4 | GO:0030200 | heparan sulfate proteoglycan catabolic process(GO:0030200) |
| 0.5 | 0.9 | GO:0045168 | cell-cell signaling involved in cell fate commitment(GO:0045168) |
| 0.5 | 1.4 | GO:1904387 | cellular response to thyroxine stimulus(GO:0097069) cellular response to L-phenylalanine derivative(GO:1904387) |
| 0.5 | 0.5 | GO:0021773 | striatal medium spiny neuron differentiation(GO:0021773) |
| 0.5 | 1.8 | GO:0030037 | actin filament reorganization involved in cell cycle(GO:0030037) |
| 0.5 | 2.3 | GO:0071802 | negative regulation of podosome assembly(GO:0071802) |
| 0.4 | 5.8 | GO:1904936 | cerebral cortex GABAergic interneuron migration(GO:0021853) interneuron migration(GO:1904936) |
| 0.4 | 1.8 | GO:0060708 | spongiotrophoblast differentiation(GO:0060708) |
| 0.4 | 1.8 | GO:0090038 | negative regulation of protein kinase C signaling(GO:0090038) |
| 0.4 | 1.7 | GO:0071226 | response to molecule of fungal origin(GO:0002238) cellular response to molecule of fungal origin(GO:0071226) |
| 0.4 | 4.8 | GO:0060670 | branching involved in labyrinthine layer morphogenesis(GO:0060670) |
| 0.4 | 6.1 | GO:0051599 | response to hydrostatic pressure(GO:0051599) |
| 0.4 | 1.3 | GO:1903348 | positive regulation of bicellular tight junction assembly(GO:1903348) |
| 0.4 | 1.3 | GO:0000117 | regulation of transcription involved in G2/M transition of mitotic cell cycle(GO:0000117) |
| 0.4 | 1.7 | GO:0014028 | notochord formation(GO:0014028) |
| 0.4 | 1.3 | GO:2000173 | negative regulation of dendrite extension(GO:1903860) regulation of neuron remodeling(GO:1904799) negative regulation of neuron remodeling(GO:1904800) negative regulation of branching morphogenesis of a nerve(GO:2000173) |
| 0.4 | 2.5 | GO:0030035 | microspike assembly(GO:0030035) |
| 0.4 | 1.2 | GO:1902994 | regulation of phospholipid efflux(GO:1902994) positive regulation of phospholipid efflux(GO:1902995) |
| 0.4 | 1.6 | GO:0003409 | optic cup structural organization(GO:0003409) |
| 0.4 | 1.6 | GO:0050976 | detection of mechanical stimulus involved in sensory perception of touch(GO:0050976) |
| 0.4 | 2.0 | GO:0032929 | negative regulation of superoxide anion generation(GO:0032929) |
| 0.4 | 6.0 | GO:0007196 | adenylate cyclase-inhibiting G-protein coupled glutamate receptor signaling pathway(GO:0007196) |
| 0.4 | 0.4 | GO:0003197 | endocardial cushion development(GO:0003197) |
| 0.4 | 2.4 | GO:0061502 | early endosome to recycling endosome transport(GO:0061502) |
| 0.4 | 1.9 | GO:0071680 | response to indole-3-methanol(GO:0071680) cellular response to indole-3-methanol(GO:0071681) |
| 0.4 | 2.3 | GO:0010025 | wax biosynthetic process(GO:0010025) wax metabolic process(GO:0010166) |
| 0.4 | 1.5 | GO:0033277 | abortive mitotic cell cycle(GO:0033277) |
| 0.4 | 1.9 | GO:0010986 | positive regulation of lipoprotein particle clearance(GO:0010986) |
| 0.4 | 1.1 | GO:0045014 | carbon catabolite repression of transcription(GO:0045013) negative regulation of transcription by glucose(GO:0045014) |
| 0.4 | 1.5 | GO:0018352 | protein-pyridoxal-5-phosphate linkage(GO:0018352) |
| 0.4 | 1.1 | GO:2000670 | positive regulation of dendritic cell apoptotic process(GO:2000670) |
| 0.4 | 2.2 | GO:0003011 | involuntary skeletal muscle contraction(GO:0003011) |
| 0.4 | 2.2 | GO:2000048 | negative regulation of cell-cell adhesion mediated by cadherin(GO:2000048) |
| 0.4 | 1.1 | GO:2000393 | negative regulation of lamellipodium morphogenesis(GO:2000393) |
| 0.4 | 0.7 | GO:0071426 | ribonucleoprotein complex localization(GO:0071166) ribonucleoprotein complex export from nucleus(GO:0071426) |
| 0.4 | 1.1 | GO:0060086 | circadian temperature homeostasis(GO:0060086) |
| 0.3 | 2.1 | GO:0006021 | inositol biosynthetic process(GO:0006021) |
| 0.3 | 1.0 | GO:0043000 | Golgi to plasma membrane CFTR protein transport(GO:0043000) |
| 0.3 | 0.3 | GO:0006775 | fat-soluble vitamin metabolic process(GO:0006775) vitamin D metabolic process(GO:0042359) |
| 0.3 | 3.1 | GO:0032808 | lacrimal gland development(GO:0032808) |
| 0.3 | 0.7 | GO:0030167 | proteoglycan catabolic process(GO:0030167) |
| 0.3 | 0.7 | GO:0021553 | olfactory nerve development(GO:0021553) |
| 0.3 | 1.3 | GO:0031117 | positive regulation of microtubule depolymerization(GO:0031117) |
| 0.3 | 1.0 | GO:0018894 | dibenzo-p-dioxin metabolic process(GO:0018894) |
| 0.3 | 1.3 | GO:2000721 | positive regulation of transcription from RNA polymerase II promoter involved in smooth muscle cell differentiation(GO:2000721) |
| 0.3 | 1.0 | GO:0046271 | phenylpropanoid catabolic process(GO:0046271) |
| 0.3 | 1.0 | GO:0002522 | leukocyte migration involved in immune response(GO:0002522) |
| 0.3 | 3.5 | GO:0032782 | bile acid secretion(GO:0032782) |
| 0.3 | 1.0 | GO:0060373 | regulation of ventricular cardiac muscle cell membrane depolarization(GO:0060373) |
| 0.3 | 0.9 | GO:0045659 | regulation of neutrophil differentiation(GO:0045658) negative regulation of neutrophil differentiation(GO:0045659) |
| 0.3 | 3.8 | GO:0090361 | platelet-derived growth factor production(GO:0090360) regulation of platelet-derived growth factor production(GO:0090361) |
| 0.3 | 2.2 | GO:0098881 | exocytic insertion of neurotransmitter receptor to plasma membrane(GO:0098881) exocytic insertion of neurotransmitter receptor to postsynaptic membrane(GO:0098967) |
| 0.3 | 0.3 | GO:0048702 | embryonic neurocranium morphogenesis(GO:0048702) |
| 0.3 | 0.9 | GO:0005988 | lactose metabolic process(GO:0005988) lactose biosynthetic process(GO:0005989) |
| 0.3 | 1.8 | GO:0071072 | negative regulation of phospholipid biosynthetic process(GO:0071072) |
| 0.3 | 1.5 | GO:0060356 | leucine import(GO:0060356) |
| 0.3 | 0.9 | GO:0071460 | cellular response to cell-matrix adhesion(GO:0071460) |
| 0.3 | 0.6 | GO:1900127 | positive regulation of hyaluronan biosynthetic process(GO:1900127) |
| 0.3 | 2.1 | GO:0006537 | glutamate biosynthetic process(GO:0006537) |
| 0.3 | 0.9 | GO:1900220 | semaphorin-plexin signaling pathway involved in bone trabecula morphogenesis(GO:1900220) |
| 0.3 | 1.5 | GO:0061760 | antifungal innate immune response(GO:0061760) |
| 0.3 | 1.5 | GO:1903237 | negative regulation of leukocyte tethering or rolling(GO:1903237) |
| 0.3 | 0.9 | GO:0010760 | negative regulation of macrophage chemotaxis(GO:0010760) |
| 0.3 | 0.9 | GO:0015820 | leucine transport(GO:0015820) |
| 0.3 | 1.5 | GO:0042985 | negative regulation of amyloid precursor protein biosynthetic process(GO:0042985) |
| 0.3 | 1.2 | GO:0038195 | urokinase plasminogen activator signaling pathway(GO:0038195) |
| 0.3 | 0.3 | GO:0032499 | detection of peptidoglycan(GO:0032499) |
| 0.3 | 0.9 | GO:0007202 | activation of phospholipase C activity(GO:0007202) |
| 0.3 | 1.5 | GO:1990834 | response to odorant(GO:1990834) |
| 0.3 | 0.3 | GO:0060166 | olfactory pit development(GO:0060166) |
| 0.3 | 0.9 | GO:0021823 | cerebral cortex tangential migration using cell-cell interactions(GO:0021823) postnatal olfactory bulb interneuron migration(GO:0021827) chemorepulsion involved in postnatal olfactory bulb interneuron migration(GO:0021836) |
| 0.3 | 0.3 | GO:0036302 | atrioventricular canal development(GO:0036302) |
| 0.3 | 1.7 | GO:0050829 | defense response to Gram-negative bacterium(GO:0050829) |
| 0.3 | 0.9 | GO:0035544 | negative regulation of SNARE complex assembly(GO:0035544) |
| 0.3 | 1.7 | GO:1903588 | negative regulation of blood vessel endothelial cell proliferation involved in sprouting angiogenesis(GO:1903588) |
| 0.3 | 1.4 | GO:0015888 | thiamine transport(GO:0015888) |
| 0.3 | 5.9 | GO:0016540 | protein autoprocessing(GO:0016540) |
| 0.3 | 1.4 | GO:1990036 | calcium ion import into sarcoplasmic reticulum(GO:1990036) |
| 0.3 | 0.6 | GO:0048817 | negative regulation of hair follicle maturation(GO:0048817) |
| 0.3 | 3.3 | GO:0048003 | antigen processing and presentation of lipid antigen via MHC class Ib(GO:0048003) antigen processing and presentation, exogenous lipid antigen via MHC class Ib(GO:0048007) |
| 0.3 | 0.3 | GO:0060648 | mammary gland bud morphogenesis(GO:0060648) |
| 0.3 | 1.6 | GO:0010899 | regulation of phosphatidylcholine catabolic process(GO:0010899) |
| 0.3 | 0.3 | GO:0003104 | positive regulation of glomerular filtration(GO:0003104) |
| 0.3 | 0.8 | GO:0006478 | peptidyl-tyrosine sulfation(GO:0006478) |
| 0.3 | 0.8 | GO:0050902 | leukocyte adhesive activation(GO:0050902) |
| 0.3 | 1.1 | GO:0046967 | cytosol to ER transport(GO:0046967) |
| 0.3 | 0.3 | GO:0046688 | response to copper ion(GO:0046688) |
| 0.3 | 0.8 | GO:0009436 | glyoxylate catabolic process(GO:0009436) |
| 0.3 | 0.8 | GO:1903028 | positive regulation of opsonization(GO:1903028) |
| 0.3 | 2.6 | GO:0043491 | protein kinase B signaling(GO:0043491) |
| 0.3 | 1.6 | GO:0010046 | response to mycotoxin(GO:0010046) |
| 0.3 | 1.0 | GO:2001268 | negative regulation of cysteine-type endopeptidase activity involved in apoptotic signaling pathway(GO:2001268) |
| 0.3 | 0.8 | GO:1904808 | regulation of protein oxidation(GO:1904806) positive regulation of protein oxidation(GO:1904808) |
| 0.3 | 1.8 | GO:0090649 | response to oxygen-glucose deprivation(GO:0090649) cellular response to oxygen-glucose deprivation(GO:0090650) |
| 0.3 | 0.3 | GO:0014839 | myoblast migration involved in skeletal muscle regeneration(GO:0014839) |
| 0.3 | 0.8 | GO:0042369 | vitamin D catabolic process(GO:0042369) |
| 0.3 | 0.8 | GO:1904020 | regulation of G-protein coupled receptor internalization(GO:1904020) |
| 0.3 | 0.3 | GO:0055017 | cardiac muscle tissue growth(GO:0055017) |
| 0.3 | 0.5 | GO:0002408 | myeloid dendritic cell chemotaxis(GO:0002408) |
| 0.3 | 1.0 | GO:0014859 | negative regulation of skeletal muscle cell proliferation(GO:0014859) negative regulation of skeletal muscle satellite cell proliferation(GO:1902723) |
| 0.2 | 1.0 | GO:0006663 | platelet activating factor biosynthetic process(GO:0006663) |
| 0.2 | 0.7 | GO:0015770 | disaccharide transport(GO:0015766) sucrose transport(GO:0015770) oligosaccharide transport(GO:0015772) |
| 0.2 | 0.5 | GO:0036023 | limb joint morphogenesis(GO:0036022) embryonic skeletal limb joint morphogenesis(GO:0036023) |
| 0.2 | 0.7 | GO:0019858 | cytosine metabolic process(GO:0019858) |
| 0.2 | 0.2 | GO:0021940 | positive regulation of cerebellar granule cell precursor proliferation(GO:0021940) |
| 0.2 | 0.2 | GO:1901187 | regulation of ephrin receptor signaling pathway(GO:1901187) |
| 0.2 | 1.2 | GO:0002415 | immunoglobulin transcytosis in epithelial cells mediated by polymeric immunoglobulin receptor(GO:0002415) |
| 0.2 | 0.9 | GO:2000490 | negative regulation of hepatic stellate cell activation(GO:2000490) |
| 0.2 | 1.9 | GO:0030917 | midbrain-hindbrain boundary development(GO:0030917) |
| 0.2 | 1.4 | GO:0060214 | endocardium formation(GO:0060214) |
| 0.2 | 1.6 | GO:0061669 | spontaneous neurotransmitter secretion(GO:0061669) spontaneous synaptic transmission(GO:0098814) |
| 0.2 | 1.4 | GO:0009137 | purine nucleoside diphosphate catabolic process(GO:0009137) purine ribonucleoside diphosphate catabolic process(GO:0009181) |
| 0.2 | 0.2 | GO:0097061 | dendritic spine organization(GO:0097061) |
| 0.2 | 0.7 | GO:0035526 | retrograde transport, plasma membrane to Golgi(GO:0035526) |
| 0.2 | 0.5 | GO:0042323 | negative regulation of circadian sleep/wake cycle, non-REM sleep(GO:0042323) negative regulation of mucus secretion(GO:0070256) |
| 0.2 | 0.5 | GO:0016242 | negative regulation of macroautophagy(GO:0016242) |
| 0.2 | 0.5 | GO:1905064 | negative regulation of vascular smooth muscle cell differentiation(GO:1905064) |
| 0.2 | 1.4 | GO:0009099 | branched-chain amino acid biosynthetic process(GO:0009082) leucine biosynthetic process(GO:0009098) valine biosynthetic process(GO:0009099) |
| 0.2 | 0.9 | GO:1901842 | negative regulation of high voltage-gated calcium channel activity(GO:1901842) |
| 0.2 | 2.9 | GO:0070327 | thyroid hormone transport(GO:0070327) |
| 0.2 | 1.1 | GO:0002934 | desmosome organization(GO:0002934) |
| 0.2 | 1.8 | GO:0035726 | common myeloid progenitor cell proliferation(GO:0035726) |
| 0.2 | 0.7 | GO:0033159 | negative regulation of protein import into nucleus, translocation(GO:0033159) |
| 0.2 | 0.9 | GO:0002296 | T-helper 1 cell lineage commitment(GO:0002296) |
| 0.2 | 0.9 | GO:0042271 | susceptibility to natural killer cell mediated cytotoxicity(GO:0042271) |
| 0.2 | 2.2 | GO:0098734 | macromolecule depalmitoylation(GO:0098734) |
| 0.2 | 0.7 | GO:1902219 | negative regulation of intrinsic apoptotic signaling pathway in response to osmotic stress(GO:1902219) |
| 0.2 | 0.2 | GO:0010875 | positive regulation of cholesterol efflux(GO:0010875) |
| 0.2 | 2.2 | GO:0032264 | IMP salvage(GO:0032264) |
| 0.2 | 1.7 | GO:0034350 | regulation of glial cell apoptotic process(GO:0034350) negative regulation of glial cell apoptotic process(GO:0034351) |
| 0.2 | 1.9 | GO:0002329 | pre-B cell differentiation(GO:0002329) |
| 0.2 | 0.2 | GO:2000863 | positive regulation of estrogen secretion(GO:2000863) positive regulation of estradiol secretion(GO:2000866) |
| 0.2 | 3.0 | GO:0038203 | TORC2 signaling(GO:0038203) |
| 0.2 | 9.2 | GO:0043616 | keratinocyte proliferation(GO:0043616) |
| 0.2 | 0.6 | GO:0007538 | primary sex determination(GO:0007538) |
| 0.2 | 4.9 | GO:0003334 | keratinocyte development(GO:0003334) |
| 0.2 | 0.4 | GO:1904862 | inhibitory synapse assembly(GO:1904862) |
| 0.2 | 1.7 | GO:0097461 | ferric iron import into cell(GO:0097461) ferric iron import across plasma membrane(GO:0098706) |
| 0.2 | 6.4 | GO:0016338 | calcium-independent cell-cell adhesion via plasma membrane cell-adhesion molecules(GO:0016338) |
| 0.2 | 4.4 | GO:0002544 | chronic inflammatory response(GO:0002544) |
| 0.2 | 0.4 | GO:0086092 | regulation of the force of heart contraction by cardiac conduction(GO:0086092) |
| 0.2 | 0.2 | GO:0061394 | regulation of transcription from RNA polymerase II promoter in response to arsenic-containing substance(GO:0061394) |
| 0.2 | 0.8 | GO:0036228 | protein targeting to nuclear inner membrane(GO:0036228) |
| 0.2 | 0.2 | GO:0070900 | mitochondrial tRNA modification(GO:0070900) mitochondrial RNA modification(GO:1900864) |
| 0.2 | 0.6 | GO:0093001 | glycolysis from storage polysaccharide through glucose-1-phosphate(GO:0093001) |
| 0.2 | 0.8 | GO:0002913 | positive regulation of T cell anergy(GO:0002669) positive regulation of lymphocyte anergy(GO:0002913) |
| 0.2 | 0.2 | GO:2000036 | regulation of stem cell population maintenance(GO:2000036) |
| 0.2 | 0.6 | GO:0033341 | regulation of collagen binding(GO:0033341) |
| 0.2 | 0.4 | GO:0042541 | hemoglobin biosynthetic process(GO:0042541) |
| 0.2 | 0.8 | GO:0043006 | activation of phospholipase A2 activity by calcium-mediated signaling(GO:0043006) |
| 0.2 | 1.4 | GO:0089712 | L-aspartate transport(GO:0070778) L-aspartate transmembrane transport(GO:0089712) |
| 0.2 | 2.6 | GO:0051798 | positive regulation of hair follicle development(GO:0051798) |
| 0.2 | 0.8 | GO:0038172 | interleukin-33-mediated signaling pathway(GO:0038172) |
| 0.2 | 2.0 | GO:0046940 | nucleoside monophosphate phosphorylation(GO:0046940) |
| 0.2 | 1.4 | GO:0070995 | NADPH oxidation(GO:0070995) |
| 0.2 | 1.8 | GO:0014807 | regulation of somitogenesis(GO:0014807) |
| 0.2 | 0.6 | GO:0034471 | endonucleolytic cleavage to generate mature 5'-end of SSU-rRNA from (SSU-rRNA, 5.8S rRNA, LSU-rRNA)(GO:0000472) rRNA 5'-end processing(GO:0000967) ncRNA 5'-end processing(GO:0034471) |
| 0.2 | 2.2 | GO:0048706 | embryonic skeletal system development(GO:0048706) |
| 0.2 | 3.3 | GO:0009950 | dorsal/ventral axis specification(GO:0009950) |
| 0.2 | 0.2 | GO:0046928 | regulation of neurotransmitter secretion(GO:0046928) |
| 0.2 | 0.6 | GO:0046586 | regulation of calcium-dependent cell-cell adhesion(GO:0046586) |
| 0.2 | 0.2 | GO:2000777 | positive regulation of proteasomal ubiquitin-dependent protein catabolic process involved in cellular response to hypoxia(GO:2000777) |
| 0.2 | 1.9 | GO:0002480 | antigen processing and presentation of exogenous peptide antigen via MHC class I, TAP-independent(GO:0002480) |
| 0.2 | 0.8 | GO:0009804 | coumarin metabolic process(GO:0009804) |
| 0.2 | 1.0 | GO:2000660 | negative regulation of interleukin-1-mediated signaling pathway(GO:2000660) |
| 0.2 | 1.6 | GO:0019344 | cysteine biosynthetic process(GO:0019344) |
| 0.2 | 0.4 | GO:0001560 | regulation of cell growth by extracellular stimulus(GO:0001560) |
| 0.2 | 0.2 | GO:2000563 | positive regulation of CD4-positive, alpha-beta T cell proliferation(GO:2000563) |
| 0.2 | 1.4 | GO:0060282 | positive regulation of oocyte development(GO:0060282) |
| 0.2 | 1.7 | GO:0007256 | activation of JNKK activity(GO:0007256) |
| 0.2 | 1.0 | GO:1903412 | response to bile acid(GO:1903412) |
| 0.2 | 0.6 | GO:0072675 | multinuclear osteoclast differentiation(GO:0072674) osteoclast fusion(GO:0072675) |
| 0.2 | 2.3 | GO:0045086 | positive regulation of interleukin-2 biosynthetic process(GO:0045086) |
| 0.2 | 2.7 | GO:0070863 | positive regulation of protein exit from endoplasmic reticulum(GO:0070863) |
| 0.2 | 1.0 | GO:1904217 | regulation of CDP-diacylglycerol-serine O-phosphatidyltransferase activity(GO:1904217) positive regulation of CDP-diacylglycerol-serine O-phosphatidyltransferase activity(GO:1904219) positive regulation of serine C-palmitoyltransferase activity(GO:1904222) |
| 0.2 | 0.6 | GO:0014744 | positive regulation of muscle adaptation(GO:0014744) |
| 0.2 | 0.4 | GO:0015917 | aminophospholipid transport(GO:0015917) |
| 0.2 | 0.2 | GO:0050975 | sensory perception of touch(GO:0050975) |
| 0.2 | 1.3 | GO:0070673 | response to interleukin-18(GO:0070673) |
| 0.2 | 0.6 | GO:0098758 | response to interleukin-8(GO:0098758) cellular response to interleukin-8(GO:0098759) |
| 0.2 | 0.8 | GO:0034224 | cellular response to zinc ion starvation(GO:0034224) |
| 0.2 | 1.1 | GO:0086048 | membrane depolarization during bundle of His cell action potential(GO:0086048) |
| 0.2 | 1.3 | GO:0033089 | positive regulation of T cell differentiation in thymus(GO:0033089) positive regulation of thymocyte aggregation(GO:2000400) |
| 0.2 | 0.7 | GO:0070445 | oligodendrocyte progenitor proliferation(GO:0070444) regulation of oligodendrocyte progenitor proliferation(GO:0070445) |
| 0.2 | 0.4 | GO:0010764 | negative regulation of fibroblast migration(GO:0010764) |
| 0.2 | 0.2 | GO:0008355 | olfactory learning(GO:0008355) |
| 0.2 | 1.5 | GO:0035021 | negative regulation of Rac protein signal transduction(GO:0035021) |
| 0.2 | 0.6 | GO:0042732 | D-xylose metabolic process(GO:0042732) |
| 0.2 | 0.6 | GO:0051596 | methylglyoxal catabolic process to D-lactate via S-lactoyl-glutathione(GO:0019243) methylglyoxal catabolic process(GO:0051596) methylglyoxal catabolic process to lactate(GO:0061727) |
| 0.2 | 3.0 | GO:0051639 | actin filament network formation(GO:0051639) |
| 0.2 | 0.6 | GO:0097254 | renal tubular secretion(GO:0097254) |
| 0.2 | 0.4 | GO:0008356 | asymmetric cell division(GO:0008356) |
| 0.2 | 0.7 | GO:0050710 | negative regulation of cytokine secretion(GO:0050710) |
| 0.2 | 0.4 | GO:0046379 | extracellular polysaccharide biosynthetic process(GO:0045226) extracellular polysaccharide metabolic process(GO:0046379) |
| 0.2 | 1.8 | GO:0051918 | negative regulation of fibrinolysis(GO:0051918) |
| 0.2 | 0.7 | GO:0001808 | negative regulation of type IV hypersensitivity(GO:0001808) |
| 0.2 | 0.5 | GO:0010819 | regulation of T cell chemotaxis(GO:0010819) positive regulation of T cell chemotaxis(GO:0010820) |
| 0.2 | 0.9 | GO:0009134 | nucleoside diphosphate catabolic process(GO:0009134) |
| 0.2 | 0.5 | GO:0021722 | superior olivary nucleus development(GO:0021718) superior olivary nucleus maturation(GO:0021722) |
| 0.2 | 1.6 | GO:0015705 | iodide transport(GO:0015705) |
| 0.2 | 0.5 | GO:0051482 | positive regulation of cytosolic calcium ion concentration involved in phospholipase C-activating G-protein coupled signaling pathway(GO:0051482) |
| 0.2 | 0.4 | GO:0007412 | axon target recognition(GO:0007412) |
| 0.2 | 1.1 | GO:0045218 | zonula adherens maintenance(GO:0045218) |
| 0.2 | 0.7 | GO:0046952 | ketone body catabolic process(GO:0046952) |
| 0.2 | 0.9 | GO:1903750 | regulation of intrinsic apoptotic signaling pathway in response to hydrogen peroxide(GO:1903750) negative regulation of intrinsic apoptotic signaling pathway in response to hydrogen peroxide(GO:1903751) |
| 0.2 | 0.5 | GO:0051780 | mevalonate transport(GO:0015728) behavioral response to nutrient(GO:0051780) |
| 0.2 | 3.2 | GO:0046415 | urate metabolic process(GO:0046415) |
| 0.2 | 0.5 | GO:0003241 | growth involved in heart morphogenesis(GO:0003241) |
| 0.2 | 1.4 | GO:0007216 | G-protein coupled glutamate receptor signaling pathway(GO:0007216) |
| 0.2 | 0.5 | GO:0060738 | epithelial-mesenchymal signaling involved in prostate gland development(GO:0060738) |
| 0.2 | 19.8 | GO:0070268 | cornification(GO:0070268) |
| 0.2 | 0.9 | GO:0035633 | maintenance of blood-brain barrier(GO:0035633) |
| 0.2 | 0.5 | GO:0042351 | 'de novo' GDP-L-fucose biosynthetic process(GO:0042351) |
| 0.2 | 1.2 | GO:1905247 | regulation of aspartic-type endopeptidase activity involved in amyloid precursor protein catabolic process(GO:1902959) positive regulation of aspartic-type endopeptidase activity involved in amyloid precursor protein catabolic process(GO:1902961) regulation of aspartic-type peptidase activity(GO:1905245) positive regulation of aspartic-type peptidase activity(GO:1905247) |
| 0.2 | 1.4 | GO:0038026 | reelin-mediated signaling pathway(GO:0038026) |
| 0.2 | 0.5 | GO:0006522 | alanine metabolic process(GO:0006522) alanine catabolic process(GO:0006524) pyruvate family amino acid metabolic process(GO:0009078) pyruvate family amino acid catabolic process(GO:0009080) |
| 0.2 | 1.1 | GO:0033603 | positive regulation of dopamine secretion(GO:0033603) |
| 0.2 | 0.5 | GO:1903925 | signal transduction involved in intra-S DNA damage checkpoint(GO:0072428) response to bisphenol A(GO:1903925) cellular response to bisphenol A(GO:1903926) |
| 0.2 | 1.2 | GO:1901314 | negative regulation of histone ubiquitination(GO:0033183) negative regulation of protein K63-linked ubiquitination(GO:1900045) regulation of histone H2A K63-linked ubiquitination(GO:1901314) negative regulation of histone H2A K63-linked ubiquitination(GO:1901315) negative regulation of protein polyubiquitination(GO:1902915) |
| 0.2 | 1.6 | GO:0038145 | macrophage colony-stimulating factor signaling pathway(GO:0038145) |
| 0.2 | 1.9 | GO:0032287 | peripheral nervous system myelin maintenance(GO:0032287) |
| 0.2 | 0.3 | GO:0042940 | D-amino acid transport(GO:0042940) |
| 0.2 | 0.7 | GO:0032484 | Ral protein signal transduction(GO:0032484) regulation of Ral protein signal transduction(GO:0032485) |
| 0.2 | 1.9 | GO:0006657 | CDP-choline pathway(GO:0006657) |
| 0.2 | 0.7 | GO:0036005 | response to macrophage colony-stimulating factor(GO:0036005) cellular response to macrophage colony-stimulating factor stimulus(GO:0036006) |
| 0.2 | 0.5 | GO:0035854 | regulation of primitive erythrocyte differentiation(GO:0010725) eosinophil fate commitment(GO:0035854) |
| 0.2 | 1.0 | GO:0002774 | Fc receptor mediated inhibitory signaling pathway(GO:0002774) |
| 0.2 | 0.3 | GO:0009386 | translational attenuation(GO:0009386) |
| 0.2 | 0.5 | GO:0035606 | peptidyl-cysteine S-trans-nitrosylation(GO:0035606) |
| 0.2 | 2.0 | GO:0032688 | negative regulation of interferon-beta production(GO:0032688) |
| 0.2 | 0.7 | GO:1902460 | regulation of mesenchymal stem cell proliferation(GO:1902460) positive regulation of mesenchymal stem cell proliferation(GO:1902462) |
| 0.2 | 0.3 | GO:0060447 | bud outgrowth involved in lung branching(GO:0060447) |
| 0.2 | 1.0 | GO:0051708 | intracellular transport of viral protein in host cell(GO:0019060) symbiont intracellular protein transport in host(GO:0030581) intracellular protein transport in other organism involved in symbiotic interaction(GO:0051708) |
| 0.2 | 0.2 | GO:0015783 | GDP-fucose transport(GO:0015783) purine nucleotide-sugar transport(GO:0036079) |
| 0.2 | 1.2 | GO:1902714 | negative regulation of interferon-gamma secretion(GO:1902714) |
| 0.2 | 0.2 | GO:0050912 | detection of chemical stimulus involved in sensory perception of taste(GO:0050912) |
| 0.2 | 0.3 | GO:0035408 | histone H3-T6 phosphorylation(GO:0035408) |
| 0.2 | 0.2 | GO:0051969 | regulation of transmission of nerve impulse(GO:0051969) |
| 0.2 | 0.5 | GO:2000820 | negative regulation of transcription from RNA polymerase II promoter involved in smooth muscle cell differentiation(GO:2000820) |
| 0.2 | 0.2 | GO:0000255 | allantoin metabolic process(GO:0000255) |
| 0.2 | 0.5 | GO:0002337 | B-1a B cell differentiation(GO:0002337) |
| 0.2 | 1.1 | GO:0001661 | conditioned taste aversion(GO:0001661) |
| 0.2 | 2.3 | GO:0048712 | negative regulation of astrocyte differentiation(GO:0048712) |
| 0.2 | 1.0 | GO:0032185 | septin cytoskeleton organization(GO:0032185) |
| 0.2 | 0.6 | GO:0001550 | ovarian cumulus expansion(GO:0001550) fused antrum stage(GO:0048165) |
| 0.2 | 0.8 | GO:0015862 | uridine transport(GO:0015862) |
| 0.2 | 0.3 | GO:0009644 | response to high light intensity(GO:0009644) |
| 0.2 | 1.0 | GO:0060391 | positive regulation of SMAD protein import into nucleus(GO:0060391) |
| 0.2 | 0.2 | GO:0048073 | regulation of eye pigmentation(GO:0048073) |
| 0.2 | 0.8 | GO:0003406 | retinal pigment epithelium development(GO:0003406) |
| 0.2 | 0.6 | GO:0006218 | uridine catabolic process(GO:0006218) |
| 0.2 | 0.6 | GO:1904528 | positive regulation of microtubule binding(GO:1904528) |
| 0.2 | 0.6 | GO:1990523 | bone regeneration(GO:1990523) |
| 0.2 | 0.5 | GO:0046521 | sphingoid catabolic process(GO:0046521) |
| 0.2 | 1.3 | GO:0002074 | extraocular skeletal muscle development(GO:0002074) |
| 0.2 | 0.3 | GO:0055099 | response to high density lipoprotein particle(GO:0055099) |
| 0.2 | 0.3 | GO:2001186 | negative regulation of CD8-positive, alpha-beta T cell activation(GO:2001186) |
| 0.2 | 0.2 | GO:1904798 | positive regulation of core promoter binding(GO:1904798) |
| 0.2 | 0.5 | GO:0032289 | central nervous system myelin formation(GO:0032289) |
| 0.2 | 0.3 | GO:0001923 | B-1 B cell differentiation(GO:0001923) |
| 0.2 | 0.3 | GO:0021761 | limbic system development(GO:0021761) |
| 0.2 | 0.3 | GO:0060584 | regulation of prostaglandin-endoperoxide synthase activity(GO:0060584) positive regulation of prostaglandin-endoperoxide synthase activity(GO:0060585) |
| 0.2 | 0.3 | GO:1900155 | regulation of bone trabecula formation(GO:1900154) negative regulation of bone trabecula formation(GO:1900155) |
| 0.2 | 0.3 | GO:0002232 | leukocyte chemotaxis involved in inflammatory response(GO:0002232) |
| 0.2 | 0.6 | GO:0010585 | glutamine secretion(GO:0010585) L-glutamine import(GO:0036229) L-glutamine import into cell(GO:1903803) |
| 0.2 | 0.2 | GO:0030185 | nitric oxide transport(GO:0030185) |
| 0.2 | 0.3 | GO:0002832 | negative regulation of response to biotic stimulus(GO:0002832) negative regulation of defense response to virus(GO:0050687) |
| 0.2 | 0.5 | GO:0072560 | glandular epithelial cell maturation(GO:0002071) type B pancreatic cell maturation(GO:0072560) |
| 0.2 | 0.9 | GO:0051151 | negative regulation of smooth muscle cell differentiation(GO:0051151) |
| 0.2 | 0.5 | GO:1904899 | regulation of hepatic stellate cell proliferation(GO:1904897) positive regulation of hepatic stellate cell proliferation(GO:1904899) hepatic stellate cell proliferation(GO:1990922) |
| 0.2 | 0.6 | GO:0042997 | negative regulation of Golgi to plasma membrane protein transport(GO:0042997) |
| 0.2 | 2.9 | GO:0014733 | regulation of skeletal muscle adaptation(GO:0014733) |
| 0.1 | 0.3 | GO:0060684 | epithelial-mesenchymal cell signaling(GO:0060684) |
| 0.1 | 0.4 | GO:0031468 | nuclear envelope reassembly(GO:0031468) |
| 0.1 | 0.4 | GO:1902396 | protein localization to bicellular tight junction(GO:1902396) |
| 0.1 | 0.4 | GO:0016561 | protein import into peroxisome matrix, translocation(GO:0016561) |
| 0.1 | 0.4 | GO:0035522 | monoubiquitinated histone deubiquitination(GO:0035521) monoubiquitinated histone H2A deubiquitination(GO:0035522) |
| 0.1 | 0.6 | GO:1901093 | regulation of protein tetramerization(GO:1901090) negative regulation of protein tetramerization(GO:1901091) regulation of protein homotetramerization(GO:1901093) negative regulation of protein homotetramerization(GO:1901094) |
| 0.1 | 0.4 | GO:0042137 | sequestering of neurotransmitter(GO:0042137) |
| 0.1 | 0.6 | GO:0006238 | CMP salvage(GO:0006238) CMP biosynthetic process(GO:0009224) CMP metabolic process(GO:0046035) |
| 0.1 | 0.4 | GO:0061300 | cerebellum vasculature development(GO:0061300) |
| 0.1 | 1.9 | GO:0018401 | peptidyl-proline hydroxylation to 4-hydroxy-L-proline(GO:0018401) |
| 0.1 | 0.4 | GO:0044771 | meiotic cell cycle phase transition(GO:0044771) regulation of meiotic cell cycle phase transition(GO:1901993) negative regulation of meiotic cell cycle phase transition(GO:1901994) |
| 0.1 | 0.4 | GO:0035878 | nail development(GO:0035878) |
| 0.1 | 0.1 | GO:1903204 | negative regulation of oxidative stress-induced neuron death(GO:1903204) |
| 0.1 | 0.4 | GO:1903371 | regulation of endoplasmic reticulum tubular network organization(GO:1903371) |
| 0.1 | 0.1 | GO:1902993 | regulation of beta-amyloid formation(GO:1902003) positive regulation of beta-amyloid formation(GO:1902004) positive regulation of amyloid precursor protein catabolic process(GO:1902993) |
| 0.1 | 1.6 | GO:1901339 | regulation of store-operated calcium channel activity(GO:1901339) |
| 0.1 | 0.3 | GO:0090521 | glomerular visceral epithelial cell migration(GO:0090521) |
| 0.1 | 0.7 | GO:1901318 | negative regulation of sperm motility(GO:1901318) |
| 0.1 | 0.4 | GO:0098886 | modification of dendritic spine(GO:0098886) |
| 0.1 | 0.1 | GO:0006477 | protein sulfation(GO:0006477) |
| 0.1 | 0.1 | GO:0071895 | odontoblast differentiation(GO:0071895) |
| 0.1 | 0.1 | GO:0016321 | female meiosis chromosome segregation(GO:0016321) |
| 0.1 | 0.3 | GO:0042214 | terpene metabolic process(GO:0042214) |
| 0.1 | 1.0 | GO:0033504 | floor plate development(GO:0033504) |
| 0.1 | 1.1 | GO:0030259 | lipid glycosylation(GO:0030259) |
| 0.1 | 0.6 | GO:0001766 | membrane raft polarization(GO:0001766) membrane raft distribution(GO:0031580) membrane raft localization(GO:0051665) |
| 0.1 | 0.3 | GO:0048745 | smooth muscle tissue development(GO:0048745) |
| 0.1 | 0.6 | GO:0007386 | compartment pattern specification(GO:0007386) |
| 0.1 | 1.0 | GO:0016554 | cytidine to uridine editing(GO:0016554) |
| 0.1 | 0.4 | GO:0090341 | negative regulation of secretion of lysosomal enzymes(GO:0090341) |
| 0.1 | 0.6 | GO:0071918 | urea transmembrane transport(GO:0071918) |
| 0.1 | 0.3 | GO:0002215 | defense response to nematode(GO:0002215) |
| 0.1 | 0.1 | GO:2000018 | regulation of male gonad development(GO:2000018) positive regulation of male gonad development(GO:2000020) |
| 0.1 | 2.5 | GO:0032331 | negative regulation of chondrocyte differentiation(GO:0032331) |
| 0.1 | 0.4 | GO:0019364 | NADP catabolic process(GO:0006742) pyridine nucleotide catabolic process(GO:0019364) |
| 0.1 | 0.3 | GO:1900452 | regulation of long term synaptic depression(GO:1900452) |
| 0.1 | 1.4 | GO:1902455 | negative regulation of stem cell population maintenance(GO:1902455) |
| 0.1 | 0.8 | GO:1902414 | protein localization to cell junction(GO:1902414) |
| 0.1 | 0.8 | GO:0036493 | positive regulation of translation in response to endoplasmic reticulum stress(GO:0036493) |
| 0.1 | 0.8 | GO:1900625 | monocyte aggregation(GO:0070487) regulation of monocyte aggregation(GO:1900623) positive regulation of monocyte aggregation(GO:1900625) |
| 0.1 | 0.3 | GO:0044154 | histone H3-K14 acetylation(GO:0044154) |
| 0.1 | 1.3 | GO:0035095 | behavioral response to nicotine(GO:0035095) |
| 0.1 | 0.4 | GO:0045631 | regulation of auditory receptor cell differentiation(GO:0045607) regulation of mechanoreceptor differentiation(GO:0045631) regulation of inner ear receptor cell differentiation(GO:2000980) |
| 0.1 | 0.4 | GO:0044210 | 'de novo' CTP biosynthetic process(GO:0044210) |
| 0.1 | 0.8 | GO:0070836 | caveola assembly(GO:0070836) |
| 0.1 | 0.8 | GO:0006776 | vitamin A metabolic process(GO:0006776) |
| 0.1 | 1.2 | GO:0015760 | hexose phosphate transport(GO:0015712) glucose-6-phosphate transport(GO:0015760) |
| 0.1 | 0.7 | GO:0046292 | formaldehyde metabolic process(GO:0046292) |
| 0.1 | 0.4 | GO:0038043 | interleukin-5-mediated signaling pathway(GO:0038043) |
| 0.1 | 0.4 | GO:0033499 | galactose catabolic process via UDP-galactose(GO:0033499) |
| 0.1 | 0.7 | GO:0060179 | male mating behavior(GO:0060179) |
| 0.1 | 0.4 | GO:0010637 | negative regulation of mitochondrial fusion(GO:0010637) |
| 0.1 | 0.7 | GO:0006438 | valyl-tRNA aminoacylation(GO:0006438) |
| 0.1 | 0.1 | GO:0060268 | negative regulation of respiratory burst(GO:0060268) |
| 0.1 | 0.9 | GO:0002396 | MHC protein complex assembly(GO:0002396) |
| 0.1 | 0.3 | GO:0031339 | negative regulation of vesicle fusion(GO:0031339) |
| 0.1 | 0.6 | GO:0071051 | polyadenylation-dependent snoRNA 3'-end processing(GO:0071051) |
| 0.1 | 1.9 | GO:0016102 | retinoic acid biosynthetic process(GO:0002138) diterpenoid biosynthetic process(GO:0016102) |
| 0.1 | 0.1 | GO:0072720 | response to dithiothreitol(GO:0072720) |
| 0.1 | 0.4 | GO:0017186 | peptidyl-pyroglutamic acid biosynthetic process, using glutaminyl-peptide cyclotransferase(GO:0017186) |
| 0.1 | 0.1 | GO:0031000 | response to caffeine(GO:0031000) |
| 0.1 | 0.4 | GO:0030812 | negative regulation of nucleotide catabolic process(GO:0030812) |
| 0.1 | 0.1 | GO:1904220 | regulation of serine C-palmitoyltransferase activity(GO:1904220) |
| 0.1 | 0.6 | GO:0015842 | aminergic neurotransmitter loading into synaptic vesicle(GO:0015842) |
| 0.1 | 0.1 | GO:0044333 | Wnt signaling pathway involved in digestive tract morphogenesis(GO:0044333) |
| 0.1 | 1.4 | GO:0001573 | ganglioside metabolic process(GO:0001573) |
| 0.1 | 0.6 | GO:0043988 | histone H3-S28 phosphorylation(GO:0043988) |
| 0.1 | 0.3 | GO:0044362 | modulation of molecular function in other organism(GO:0044359) negative regulation of molecular function in other organism(GO:0044362) negative regulation of molecular function in other organism involved in symbiotic interaction(GO:0052204) modulation of molecular function in other organism involved in symbiotic interaction(GO:0052205) negative regulation by host of symbiont molecular function(GO:0052405) modification by host of symbiont molecular function(GO:0052428) |
| 0.1 | 0.4 | GO:0061073 | ciliary body morphogenesis(GO:0061073) |
| 0.1 | 0.9 | GO:0050689 | negative regulation of defense response to virus by host(GO:0050689) |
| 0.1 | 0.1 | GO:0009395 | phospholipid catabolic process(GO:0009395) |
| 0.1 | 0.7 | GO:2000503 | positive regulation of natural killer cell chemotaxis(GO:2000503) |
| 0.1 | 0.4 | GO:0030860 | regulation of polarized epithelial cell differentiation(GO:0030860) |
| 0.1 | 0.4 | GO:0002318 | myeloid progenitor cell differentiation(GO:0002318) |
| 0.1 | 0.7 | GO:0043615 | astrocyte cell migration(GO:0043615) |
| 0.1 | 1.2 | GO:0010818 | T cell chemotaxis(GO:0010818) |
| 0.1 | 0.4 | GO:1900153 | regulation of nuclear-transcribed mRNA catabolic process, deadenylation-dependent decay(GO:1900151) positive regulation of nuclear-transcribed mRNA catabolic process, deadenylation-dependent decay(GO:1900153) |
| 0.1 | 0.5 | GO:0072205 | metanephric collecting duct development(GO:0072205) |
| 0.1 | 0.6 | GO:2000479 | activation of protein kinase A activity(GO:0034199) regulation of cAMP-dependent protein kinase activity(GO:2000479) |
| 0.1 | 4.2 | GO:0097503 | sialylation(GO:0097503) |
| 0.1 | 0.5 | GO:1902730 | regulation of heparan sulfate proteoglycan biosynthetic process(GO:0010908) positive regulation of heparan sulfate proteoglycan biosynthetic process(GO:0010909) canonical Wnt signaling pathway involved in positive regulation of epithelial to mesenchymal transition(GO:0044334) positive regulation of proteoglycan biosynthetic process(GO:1902730) |
| 0.1 | 0.2 | GO:0086042 | cardiac muscle cell-cardiac muscle cell adhesion(GO:0086042) |
| 0.1 | 1.8 | GO:0090557 | establishment of endothelial intestinal barrier(GO:0090557) |
| 0.1 | 0.1 | GO:0036289 | peptidyl-serine autophosphorylation(GO:0036289) |
| 0.1 | 0.6 | GO:0007621 | negative regulation of female receptivity(GO:0007621) |
| 0.1 | 0.4 | GO:1905203 | regulation of connective tissue replacement(GO:1905203) |
| 0.1 | 0.2 | GO:0030223 | neutrophil differentiation(GO:0030223) |
| 0.1 | 1.3 | GO:0039530 | MDA-5 signaling pathway(GO:0039530) |
| 0.1 | 0.5 | GO:0050928 | negative regulation of positive chemotaxis(GO:0050928) |
| 0.1 | 1.0 | GO:0035897 | proteolysis in other organism(GO:0035897) |
| 0.1 | 0.1 | GO:0014033 | neural crest cell development(GO:0014032) neural crest cell differentiation(GO:0014033) |
| 0.1 | 0.6 | GO:0045204 | MAPK export from nucleus(GO:0045204) |
| 0.1 | 0.2 | GO:1902938 | regulation of intracellular calcium activated chloride channel activity(GO:1902938) |
| 0.1 | 1.1 | GO:0045656 | negative regulation of monocyte differentiation(GO:0045656) |
| 0.1 | 0.1 | GO:0060458 | right lung development(GO:0060458) |
| 0.1 | 0.6 | GO:0097091 | synaptic vesicle clustering(GO:0097091) |
| 0.1 | 0.7 | GO:1903385 | regulation of homophilic cell adhesion(GO:1903385) |
| 0.1 | 0.4 | GO:0060743 | epithelial cell maturation involved in prostate gland development(GO:0060743) |
| 0.1 | 0.5 | GO:0000960 | mitochondrial RNA catabolic process(GO:0000957) regulation of mitochondrial RNA catabolic process(GO:0000960) |
| 0.1 | 0.7 | GO:0008063 | Toll signaling pathway(GO:0008063) |
| 0.1 | 0.9 | GO:1900029 | positive regulation of ruffle assembly(GO:1900029) |
| 0.1 | 0.2 | GO:0030886 | negative regulation of myeloid dendritic cell activation(GO:0030886) |
| 0.1 | 1.9 | GO:1990573 | potassium ion import across plasma membrane(GO:1990573) |
| 0.1 | 0.1 | GO:0030201 | heparan sulfate proteoglycan metabolic process(GO:0030201) |
| 0.1 | 0.6 | GO:0018879 | biphenyl metabolic process(GO:0018879) |
| 0.1 | 0.1 | GO:0051573 | negative regulation of histone H3-K9 methylation(GO:0051573) |
| 0.1 | 0.5 | GO:1900738 | positive regulation of phospholipase C-activating G-protein coupled receptor signaling pathway(GO:1900738) |
| 0.1 | 0.1 | GO:0034198 | cellular response to amino acid starvation(GO:0034198) |
| 0.1 | 0.7 | GO:0046985 | positive regulation of hemoglobin biosynthetic process(GO:0046985) |
| 0.1 | 0.5 | GO:0001188 | RNA polymerase I transcriptional preinitiation complex assembly(GO:0001188) RNA polymerase I transcriptional preinitiation complex assembly at the promoter for the nuclear large rRNA transcript(GO:0001189) |
| 0.1 | 0.6 | GO:1904504 | regulation of lipophagy(GO:1904502) positive regulation of lipophagy(GO:1904504) |
| 0.1 | 6.3 | GO:0055078 | sodium ion homeostasis(GO:0055078) |
| 0.1 | 0.5 | GO:2000686 | regulation of rubidium ion transmembrane transporter activity(GO:2000686) |
| 0.1 | 0.8 | GO:0032439 | endosome localization(GO:0032439) |
| 0.1 | 0.1 | GO:0050435 | beta-amyloid metabolic process(GO:0050435) |
| 0.1 | 1.5 | GO:0010867 | positive regulation of triglyceride biosynthetic process(GO:0010867) |
| 0.1 | 0.3 | GO:0000821 | regulation of arginine metabolic process(GO:0000821) |
| 0.1 | 1.0 | GO:0034720 | histone H3-K4 demethylation(GO:0034720) |
| 0.1 | 0.1 | GO:0060287 | epithelial cilium movement involved in determination of left/right asymmetry(GO:0060287) |
| 0.1 | 0.3 | GO:0043012 | regulation of fusion of sperm to egg plasma membrane(GO:0043012) |
| 0.1 | 1.8 | GO:2000251 | positive regulation of actin cytoskeleton reorganization(GO:2000251) |
| 0.1 | 0.8 | GO:1902474 | positive regulation of protein localization to synapse(GO:1902474) |
| 0.1 | 0.7 | GO:0006177 | GMP biosynthetic process(GO:0006177) |
| 0.1 | 0.9 | GO:0030903 | notochord development(GO:0030903) |
| 0.1 | 0.8 | GO:0042126 | nitrate metabolic process(GO:0042126) |
| 0.1 | 0.3 | GO:1903691 | positive regulation of wound healing, spreading of epidermal cells(GO:1903691) |
| 0.1 | 0.3 | GO:0033386 | geranylgeranyl diphosphate metabolic process(GO:0033385) geranylgeranyl diphosphate biosynthetic process(GO:0033386) |
| 0.1 | 0.3 | GO:0046900 | tetrahydrofolylpolyglutamate metabolic process(GO:0046900) |
| 0.1 | 0.4 | GO:0070124 | mitochondrial translational initiation(GO:0070124) |
| 0.1 | 0.8 | GO:1904491 | protein localization to ciliary transition zone(GO:1904491) |
| 0.1 | 1.0 | GO:2000321 | positive regulation of T-helper 17 cell differentiation(GO:2000321) |
| 0.1 | 0.2 | GO:0022605 | oogenesis stage(GO:0022605) |
| 0.1 | 1.7 | GO:0045162 | clustering of voltage-gated sodium channels(GO:0045162) |
| 0.1 | 0.6 | GO:0036100 | leukotriene catabolic process(GO:0036100) leukotriene B4 catabolic process(GO:0036101) leukotriene B4 metabolic process(GO:0036102) icosanoid catabolic process(GO:1901523) fatty acid derivative catabolic process(GO:1901569) |
| 0.1 | 0.1 | GO:0032425 | positive regulation of mismatch repair(GO:0032425) |
| 0.1 | 0.9 | GO:0061436 | establishment of skin barrier(GO:0061436) |
| 0.1 | 0.3 | GO:0035350 | FAD transport(GO:0015883) FAD transmembrane transport(GO:0035350) |
| 0.1 | 0.2 | GO:0000706 | meiotic DNA double-strand break processing(GO:0000706) |
| 0.1 | 0.1 | GO:0060482 | lobar bronchus epithelium development(GO:0060481) lobar bronchus development(GO:0060482) |
| 0.1 | 0.3 | GO:0030222 | eosinophil differentiation(GO:0030222) |
| 0.1 | 0.1 | GO:0060501 | positive regulation of epithelial cell proliferation involved in lung morphogenesis(GO:0060501) |
| 0.1 | 0.3 | GO:0051685 | maintenance of ER location(GO:0051685) |
| 0.1 | 0.1 | GO:2000696 | regulation of epithelial cell differentiation involved in kidney development(GO:2000696) |
| 0.1 | 0.5 | GO:1901097 | negative regulation of autophagosome maturation(GO:1901097) |
| 0.1 | 0.3 | GO:1990414 | replication-born double-strand break repair via sister chromatid exchange(GO:1990414) |
| 0.1 | 0.8 | GO:0070649 | polar body extrusion after meiotic divisions(GO:0040038) formin-nucleated actin cable assembly(GO:0070649) |
| 0.1 | 2.4 | GO:0031915 | positive regulation of synaptic plasticity(GO:0031915) |
| 0.1 | 0.4 | GO:1900425 | negative regulation of defense response to bacterium(GO:1900425) |
| 0.1 | 0.9 | GO:2000857 | positive regulation of mineralocorticoid secretion(GO:2000857) positive regulation of aldosterone secretion(GO:2000860) |
| 0.1 | 0.3 | GO:0061537 | glycine secretion(GO:0061536) glycine secretion, neurotransmission(GO:0061537) |
| 0.1 | 0.9 | GO:0015732 | prostaglandin transport(GO:0015732) |
| 0.1 | 0.2 | GO:0002249 | lymphocyte anergy(GO:0002249) regulation of T cell anergy(GO:0002667) T cell anergy(GO:0002870) regulation of lymphocyte anergy(GO:0002911) |
| 0.1 | 3.4 | GO:0035590 | purinergic nucleotide receptor signaling pathway(GO:0035590) |
| 0.1 | 1.4 | GO:0038166 | angiotensin-activated signaling pathway(GO:0038166) |
| 0.1 | 0.3 | GO:0032229 | negative regulation of synaptic transmission, GABAergic(GO:0032229) |
| 0.1 | 0.3 | GO:1904385 | cellular response to angiotensin(GO:1904385) |
| 0.1 | 0.2 | GO:0000820 | regulation of glutamine family amino acid metabolic process(GO:0000820) |
| 0.1 | 0.1 | GO:0071706 | tumor necrosis factor superfamily cytokine production(GO:0071706) |
| 0.1 | 1.8 | GO:0060213 | regulation of nuclear-transcribed mRNA poly(A) tail shortening(GO:0060211) positive regulation of nuclear-transcribed mRNA poly(A) tail shortening(GO:0060213) |
| 0.1 | 0.2 | GO:0060168 | positive regulation of adenosine receptor signaling pathway(GO:0060168) |
| 0.1 | 0.4 | GO:0072660 | maintenance of protein location in membrane(GO:0072658) maintenance of protein location in plasma membrane(GO:0072660) positive regulation of membrane depolarization during cardiac muscle cell action potential(GO:1900827) |
| 0.1 | 0.4 | GO:0051533 | positive regulation of NFAT protein import into nucleus(GO:0051533) |
| 0.1 | 0.2 | GO:0071484 | cellular response to light intensity(GO:0071484) |
| 0.1 | 0.1 | GO:1900125 | regulation of hyaluronan biosynthetic process(GO:1900125) |
| 0.1 | 0.5 | GO:0090009 | primitive streak formation(GO:0090009) |
| 0.1 | 0.9 | GO:0046929 | negative regulation of neurotransmitter secretion(GO:0046929) |
| 0.1 | 0.3 | GO:0072093 | ureteric bud invasion(GO:0072092) metanephric renal vesicle formation(GO:0072093) |
| 0.1 | 0.6 | GO:0010765 | positive regulation of sodium ion transport(GO:0010765) |
| 0.1 | 0.3 | GO:0015788 | UDP-N-acetylglucosamine transport(GO:0015788) UDP-N-acetylglucosamine transmembrane transport(GO:1990569) |
| 0.1 | 0.1 | GO:0046643 | regulation of gamma-delta T cell activation(GO:0046643) |
| 0.1 | 0.7 | GO:0016199 | axon midline choice point recognition(GO:0016199) |
| 0.1 | 0.2 | GO:0034397 | telomere localization(GO:0034397) |
| 0.1 | 0.6 | GO:0038161 | prolactin signaling pathway(GO:0038161) |
| 0.1 | 1.0 | GO:0015691 | cadmium ion transport(GO:0015691) cadmium ion transmembrane transport(GO:0070574) |
| 0.1 | 0.2 | GO:0061724 | lipophagy(GO:0061724) |
| 0.1 | 0.5 | GO:0001951 | intestinal D-glucose absorption(GO:0001951) |
| 0.1 | 0.1 | GO:0060161 | positive regulation of dopamine receptor signaling pathway(GO:0060161) |
| 0.1 | 0.4 | GO:0002268 | follicular dendritic cell differentiation(GO:0002268) |
| 0.1 | 3.3 | GO:0045737 | positive regulation of cyclin-dependent protein serine/threonine kinase activity(GO:0045737) |
| 0.1 | 0.5 | GO:0018125 | peptidyl-cysteine methylation(GO:0018125) |
| 0.1 | 0.5 | GO:0016098 | monoterpenoid metabolic process(GO:0016098) |
| 0.1 | 0.1 | GO:0002032 | desensitization of G-protein coupled receptor protein signaling pathway by arrestin(GO:0002032) |
| 0.1 | 0.6 | GO:0002679 | respiratory burst involved in defense response(GO:0002679) |
| 0.1 | 0.5 | GO:0038001 | paracrine signaling(GO:0038001) |
| 0.1 | 0.1 | GO:0045229 | cell envelope organization(GO:0043163) external encapsulating structure organization(GO:0045229) |
| 0.1 | 0.3 | GO:0019074 | viral genome packaging(GO:0019072) viral RNA genome packaging(GO:0019074) |
| 0.1 | 0.4 | GO:1903659 | regulation of complement-dependent cytotoxicity(GO:1903659) |
| 0.1 | 0.6 | GO:0001916 | positive regulation of T cell mediated cytotoxicity(GO:0001916) |
| 0.1 | 0.7 | GO:1903232 | melanosome assembly(GO:1903232) |
| 0.1 | 1.1 | GO:0031115 | negative regulation of microtubule polymerization(GO:0031115) |
| 0.1 | 0.1 | GO:0071635 | negative regulation of transforming growth factor beta production(GO:0071635) |
| 0.1 | 0.1 | GO:0007406 | negative regulation of neuroblast proliferation(GO:0007406) |
| 0.1 | 0.2 | GO:0090309 | positive regulation of methylation-dependent chromatin silencing(GO:0090309) |
| 0.1 | 0.4 | GO:0003431 | growth plate cartilage chondrocyte development(GO:0003431) |
| 0.1 | 0.2 | GO:0035425 | autocrine signaling(GO:0035425) |
| 0.1 | 0.4 | GO:0019046 | release from viral latency(GO:0019046) |
| 0.1 | 0.2 | GO:1900112 | regulation of histone H3-K9 trimethylation(GO:1900112) |
| 0.1 | 0.3 | GO:0071725 | toll-like receptor TLR1:TLR2 signaling pathway(GO:0038123) response to triacyl bacterial lipopeptide(GO:0071725) cellular response to triacyl bacterial lipopeptide(GO:0071727) |
| 0.1 | 0.1 | GO:0002625 | regulation of T cell antigen processing and presentation(GO:0002625) |
| 0.1 | 0.2 | GO:0071557 | histone H3-K27 demethylation(GO:0071557) |
| 0.1 | 0.3 | GO:1903896 | positive regulation of IRE1-mediated unfolded protein response(GO:1903896) |
| 0.1 | 0.6 | GO:2000773 | negative regulation of cellular senescence(GO:2000773) |
| 0.1 | 0.6 | GO:0061737 | leukotriene signaling pathway(GO:0061737) |
| 0.1 | 0.4 | GO:1903899 | positive regulation of PERK-mediated unfolded protein response(GO:1903899) |
| 0.1 | 0.4 | GO:0060528 | secretory columnal luminar epithelial cell differentiation involved in prostate glandular acinus development(GO:0060528) |
| 0.1 | 0.3 | GO:2000609 | regulation of thyroid hormone generation(GO:2000609) |
| 0.1 | 2.7 | GO:0061098 | positive regulation of protein tyrosine kinase activity(GO:0061098) |
| 0.1 | 0.1 | GO:1902563 | regulation of neutrophil activation(GO:1902563) |
| 0.1 | 0.2 | GO:1904058 | positive regulation of sensory perception of pain(GO:1904058) |
| 0.1 | 0.4 | GO:0006015 | 5-phosphoribose 1-diphosphate biosynthetic process(GO:0006015) 5-phosphoribose 1-diphosphate metabolic process(GO:0046391) |
| 0.1 | 0.1 | GO:0071910 | determination of pancreatic left/right asymmetry(GO:0035469) determination of liver left/right asymmetry(GO:0071910) |
| 0.1 | 0.3 | GO:0016188 | synaptic vesicle maturation(GO:0016188) |
| 0.1 | 0.3 | GO:0045746 | negative regulation of Notch signaling pathway(GO:0045746) |
| 0.1 | 0.5 | GO:0042695 | thelarche(GO:0042695) mammary gland branching involved in thelarche(GO:0060744) |
| 0.1 | 1.0 | GO:0048298 | positive regulation of isotype switching to IgA isotypes(GO:0048298) |
| 0.1 | 0.1 | GO:1902304 | positive regulation of potassium ion export(GO:1902304) |
| 0.1 | 0.5 | GO:0044800 | fusion of virus membrane with host plasma membrane(GO:0019064) membrane fusion involved in viral entry into host cell(GO:0039663) multi-organism membrane fusion(GO:0044800) |
| 0.1 | 1.0 | GO:0006670 | sphingosine metabolic process(GO:0006670) |
| 0.1 | 0.1 | GO:0060766 | negative regulation of androgen receptor signaling pathway(GO:0060766) |
| 0.1 | 0.1 | GO:0060947 | cardiac vascular smooth muscle cell differentiation(GO:0060947) |
| 0.1 | 0.5 | GO:0019896 | axonal transport of mitochondrion(GO:0019896) |
| 0.1 | 0.5 | GO:0042416 | dopamine biosynthetic process(GO:0042416) |
| 0.1 | 0.5 | GO:0032468 | Golgi calcium ion homeostasis(GO:0032468) |
| 0.1 | 2.5 | GO:0046710 | GDP metabolic process(GO:0046710) |
| 0.1 | 0.1 | GO:1902992 | negative regulation of amyloid precursor protein catabolic process(GO:1902992) |
| 0.1 | 1.0 | GO:2000821 | regulation of grooming behavior(GO:2000821) |
| 0.1 | 0.4 | GO:0009236 | cobalamin biosynthetic process(GO:0009236) |
| 0.1 | 0.9 | GO:0043045 | DNA methylation involved in embryo development(GO:0043045) changes to DNA methylation involved in embryo development(GO:1901538) |
| 0.1 | 0.4 | GO:0007198 | adenylate cyclase-inhibiting serotonin receptor signaling pathway(GO:0007198) |
| 0.1 | 0.3 | GO:2000418 | positive regulation of eosinophil migration(GO:2000418) |
| 0.1 | 0.4 | GO:0046340 | diacylglycerol catabolic process(GO:0046340) |
| 0.1 | 0.6 | GO:0097428 | protein maturation by iron-sulfur cluster transfer(GO:0097428) |
| 0.1 | 0.2 | GO:0010621 | negative regulation of transcription by transcription factor localization(GO:0010621) |
| 0.1 | 0.4 | GO:0032218 | riboflavin transport(GO:0032218) |
| 0.1 | 0.4 | GO:0031126 | snoRNA 3'-end processing(GO:0031126) |
| 0.1 | 0.4 | GO:1904751 | positive regulation of protein localization to nucleolus(GO:1904751) |
| 0.1 | 1.1 | GO:0097264 | self proteolysis(GO:0097264) |
| 0.1 | 0.3 | GO:0097106 | postsynaptic density organization(GO:0097106) |
| 0.1 | 0.3 | GO:0061198 | fungiform papilla formation(GO:0061198) |
| 0.1 | 0.3 | GO:0033353 | S-adenosylmethionine cycle(GO:0033353) |
| 0.1 | 0.3 | GO:0010641 | positive regulation of platelet-derived growth factor receptor signaling pathway(GO:0010641) |
| 0.1 | 0.2 | GO:0060024 | rhythmic synaptic transmission(GO:0060024) |
| 0.1 | 0.3 | GO:0048539 | bone marrow development(GO:0048539) |
| 0.1 | 0.1 | GO:0001732 | formation of cytoplasmic translation initiation complex(GO:0001732) |
| 0.1 | 0.3 | GO:0050771 | negative regulation of axonogenesis(GO:0050771) |
| 0.1 | 0.3 | GO:0006533 | aspartate catabolic process(GO:0006533) |
| 0.1 | 0.3 | GO:1902499 | positive regulation of protein autoubiquitination(GO:1902499) |
| 0.1 | 0.3 | GO:0001207 | histone displacement(GO:0001207) positive regulation of transcription involved in meiotic cell cycle(GO:0051039) |
| 0.1 | 0.2 | GO:0071169 | establishment of protein localization to chromatin(GO:0071169) |
| 0.1 | 0.1 | GO:1900104 | hyaluranon cable assembly(GO:0036118) regulation of hyaluranon cable assembly(GO:1900104) positive regulation of hyaluranon cable assembly(GO:1900106) |
| 0.1 | 0.8 | GO:0071474 | cellular hyperosmotic response(GO:0071474) |
| 0.1 | 0.3 | GO:1902630 | regulation of membrane hyperpolarization(GO:1902630) |
| 0.1 | 1.0 | GO:0042355 | fucose catabolic process(GO:0019317) L-fucose metabolic process(GO:0042354) L-fucose catabolic process(GO:0042355) |
| 0.1 | 0.3 | GO:0042418 | epinephrine biosynthetic process(GO:0042418) |
| 0.1 | 0.3 | GO:0000393 | spliceosomal conformational changes to generate catalytic conformation(GO:0000393) |
| 0.1 | 0.4 | GO:0048749 | compound eye development(GO:0048749) |
| 0.1 | 0.3 | GO:0001757 | somite specification(GO:0001757) |
| 0.1 | 1.4 | GO:0045063 | T-helper 1 cell differentiation(GO:0045063) |
| 0.1 | 0.8 | GO:1900121 | negative regulation of receptor binding(GO:1900121) |
| 0.1 | 0.3 | GO:0021571 | rhombomere 5 development(GO:0021571) |
| 0.1 | 0.3 | GO:0000711 | meiotic DNA repair synthesis(GO:0000711) |
| 0.1 | 0.4 | GO:1900107 | regulation of nodal signaling pathway(GO:1900107) |
| 0.1 | 0.3 | GO:0071955 | recycling endosome to Golgi transport(GO:0071955) |
| 0.1 | 0.2 | GO:0007439 | ectodermal digestive tract development(GO:0007439) embryonic ectodermal digestive tract development(GO:0048611) |
| 0.1 | 2.5 | GO:0090200 | positive regulation of release of cytochrome c from mitochondria(GO:0090200) |
| 0.1 | 0.3 | GO:0038180 | nerve growth factor signaling pathway(GO:0038180) |
| 0.1 | 0.1 | GO:0051481 | negative regulation of cytosolic calcium ion concentration(GO:0051481) |
| 0.1 | 0.5 | GO:0050957 | equilibrioception(GO:0050957) |
| 0.1 | 0.1 | GO:0021830 | interneuron migration from the subpallium to the cortex(GO:0021830) |
| 0.1 | 0.1 | GO:0045210 | FasL biosynthetic process(GO:0045210) |
| 0.1 | 0.7 | GO:0006686 | sphingomyelin biosynthetic process(GO:0006686) |
| 0.1 | 0.2 | GO:1902534 | single-organism membrane invagination(GO:1902534) |
| 0.1 | 0.7 | GO:0090394 | negative regulation of excitatory postsynaptic potential(GO:0090394) |
| 0.1 | 0.3 | GO:0050862 | positive regulation of T cell receptor signaling pathway(GO:0050862) |
| 0.1 | 0.4 | GO:0044268 | multicellular organismal protein metabolic process(GO:0044268) |
| 0.1 | 0.2 | GO:0035634 | response to stilbenoid(GO:0035634) |
| 0.1 | 0.1 | GO:0070125 | mitochondrial translational elongation(GO:0070125) |
| 0.1 | 0.2 | GO:0021794 | thalamus development(GO:0021794) |
| 0.1 | 0.5 | GO:1900825 | regulation of membrane depolarization during cardiac muscle cell action potential(GO:1900825) |
| 0.1 | 0.2 | GO:0051941 | regulation of amino acid uptake involved in synaptic transmission(GO:0051941) regulation of glutamate uptake involved in transmission of nerve impulse(GO:0051946) regulation of L-glutamate import(GO:1900920) |
| 0.1 | 0.2 | GO:0042699 | follicle-stimulating hormone signaling pathway(GO:0042699) |
| 0.1 | 0.1 | GO:0003064 | regulation of heart rate by hormone(GO:0003064) |
| 0.1 | 0.3 | GO:1904031 | positive regulation of cyclin-dependent protein kinase activity(GO:1904031) |
| 0.1 | 0.2 | GO:0036465 | synaptic vesicle recycling(GO:0036465) synaptic vesicle endocytosis(GO:0048488) |
| 0.1 | 0.2 | GO:1900113 | negative regulation of histone H3-K9 trimethylation(GO:1900113) |
| 0.1 | 0.5 | GO:0016480 | negative regulation of transcription from RNA polymerase III promoter(GO:0016480) |
| 0.1 | 0.2 | GO:0070459 | prolactin secretion(GO:0070459) |
| 0.1 | 0.2 | GO:0018065 | protein-cofactor linkage(GO:0018065) |
| 0.1 | 4.1 | GO:0006953 | acute-phase response(GO:0006953) |
| 0.1 | 0.1 | GO:0032460 | negative regulation of protein oligomerization(GO:0032460) |
| 0.1 | 0.1 | GO:0043696 | dedifferentiation(GO:0043696) cell dedifferentiation(GO:0043697) |
| 0.1 | 0.6 | GO:0032713 | negative regulation of interleukin-4 production(GO:0032713) |
| 0.1 | 0.1 | GO:0070346 | positive regulation of fat cell proliferation(GO:0070346) |
| 0.1 | 0.2 | GO:0006425 | glutaminyl-tRNA aminoacylation(GO:0006425) |
| 0.1 | 1.6 | GO:0010800 | positive regulation of peptidyl-threonine phosphorylation(GO:0010800) |
| 0.1 | 0.5 | GO:0061366 | behavioral response to chemical pain(GO:0061366) behavioral response to formalin induced pain(GO:0061368) |
| 0.1 | 1.3 | GO:0006825 | copper ion transport(GO:0006825) |
| 0.1 | 0.5 | GO:0060134 | prepulse inhibition(GO:0060134) |
| 0.1 | 0.1 | GO:1903351 | response to dopamine(GO:1903350) cellular response to dopamine(GO:1903351) |
| 0.1 | 0.3 | GO:2000741 | positive regulation of mesenchymal stem cell differentiation(GO:2000741) |
| 0.1 | 0.3 | GO:0045163 | clustering of voltage-gated potassium channels(GO:0045163) |
| 0.1 | 0.2 | GO:0003415 | chondrocyte hypertrophy(GO:0003415) |
| 0.1 | 0.2 | GO:0002143 | tRNA wobble position uridine thiolation(GO:0002143) |
| 0.1 | 0.4 | GO:0055009 | atrial cardiac muscle tissue development(GO:0003228) atrial cardiac muscle tissue morphogenesis(GO:0055009) |
| 0.1 | 0.1 | GO:0010520 | regulation of reciprocal meiotic recombination(GO:0010520) |
| 0.1 | 0.2 | GO:0048730 | epidermis morphogenesis(GO:0048730) |
| 0.1 | 0.5 | GO:0015744 | succinate transport(GO:0015744) succinate transmembrane transport(GO:0071422) |
| 0.1 | 0.1 | GO:0061153 | trachea submucosa development(GO:0061152) trachea gland development(GO:0061153) |
| 0.1 | 0.1 | GO:1902164 | regulation of DNA damage response, signal transduction by p53 class mediator resulting in transcription of p21 class mediator(GO:1902162) positive regulation of DNA damage response, signal transduction by p53 class mediator resulting in transcription of p21 class mediator(GO:1902164) |
| 0.1 | 0.1 | GO:0033861 | negative regulation of NAD(P)H oxidase activity(GO:0033861) |
| 0.1 | 0.1 | GO:0035915 | pore formation in membrane of other organism(GO:0035915) |
| 0.1 | 0.6 | GO:0010248 | establishment or maintenance of transmembrane electrochemical gradient(GO:0010248) |
| 0.1 | 0.1 | GO:0061484 | hematopoietic stem cell homeostasis(GO:0061484) |
| 0.1 | 0.3 | GO:0043335 | protein unfolding(GO:0043335) |
| 0.1 | 0.1 | GO:1900110 | negative regulation of histone H3-K9 dimethylation(GO:1900110) |
| 0.1 | 0.1 | GO:0010587 | miRNA catabolic process(GO:0010587) |
| 0.1 | 0.1 | GO:0070358 | actin polymerization-dependent cell motility(GO:0070358) |
| 0.1 | 0.1 | GO:0001836 | release of cytochrome c from mitochondria(GO:0001836) |
| 0.1 | 0.1 | GO:0070245 | positive regulation of thymocyte apoptotic process(GO:0070245) |
| 0.1 | 0.4 | GO:0098502 | DNA dephosphorylation(GO:0098502) |
| 0.1 | 0.1 | GO:1903625 | negative regulation of DNA catabolic process(GO:1903625) |
| 0.1 | 0.4 | GO:0016553 | base conversion or substitution editing(GO:0016553) |
| 0.1 | 0.3 | GO:0034729 | histone H3-K79 methylation(GO:0034729) |
| 0.1 | 0.7 | GO:0070314 | G1 to G0 transition(GO:0070314) |
| 0.1 | 0.1 | GO:0015801 | aromatic amino acid transport(GO:0015801) |
| 0.1 | 1.7 | GO:0016254 | preassembly of GPI anchor in ER membrane(GO:0016254) |
| 0.1 | 0.4 | GO:0051673 | membrane disruption in other organism(GO:0051673) |
| 0.1 | 2.5 | GO:0051898 | negative regulation of protein kinase B signaling(GO:0051898) |
| 0.1 | 0.4 | GO:0045124 | regulation of bone resorption(GO:0045124) |
| 0.1 | 0.1 | GO:0070873 | regulation of polysaccharide metabolic process(GO:0032881) regulation of glycogen metabolic process(GO:0070873) |
| 0.1 | 0.1 | GO:0045824 | negative regulation of innate immune response(GO:0045824) |
| 0.1 | 0.9 | GO:1904871 | regulation of protein localization to Cajal body(GO:1904869) positive regulation of protein localization to Cajal body(GO:1904871) |
| 0.1 | 0.5 | GO:0035458 | cellular response to interferon-beta(GO:0035458) |
| 0.1 | 0.2 | GO:0016115 | terpenoid catabolic process(GO:0016115) |
| 0.1 | 0.6 | GO:0010960 | magnesium ion homeostasis(GO:0010960) |
| 0.1 | 1.1 | GO:0035855 | megakaryocyte development(GO:0035855) |
| 0.1 | 0.1 | GO:0040019 | positive regulation of embryonic development(GO:0040019) |
| 0.1 | 0.1 | GO:0050717 | positive regulation of interleukin-1 alpha secretion(GO:0050717) |
| 0.1 | 0.9 | GO:0031284 | positive regulation of guanylate cyclase activity(GO:0031284) |
| 0.1 | 0.2 | GO:0032224 | positive regulation of synaptic transmission, cholinergic(GO:0032224) |
| 0.1 | 0.3 | GO:0044878 | mitotic cytokinesis checkpoint(GO:0044878) |
| 0.1 | 0.1 | GO:0072240 | DCT cell differentiation(GO:0072069) metanephric DCT cell differentiation(GO:0072240) |
| 0.1 | 0.1 | GO:0070296 | sarcoplasmic reticulum calcium ion transport(GO:0070296) |
| 0.1 | 0.2 | GO:0015742 | alpha-ketoglutarate transport(GO:0015742) |
| 0.1 | 0.1 | GO:0008298 | intracellular mRNA localization(GO:0008298) |
| 0.1 | 0.1 | GO:0003352 | regulation of cilium movement(GO:0003352) |
| 0.1 | 0.3 | GO:0007217 | tachykinin receptor signaling pathway(GO:0007217) |
| 0.1 | 0.3 | GO:0035063 | nuclear speck organization(GO:0035063) |
| 0.1 | 0.1 | GO:0051295 | establishment of meiotic spindle localization(GO:0051295) |
| 0.1 | 0.1 | GO:0042448 | progesterone metabolic process(GO:0042448) |
| 0.1 | 0.3 | GO:0086068 | Purkinje myocyte to ventricular cardiac muscle cell signaling(GO:0086029) Purkinje myocyte to ventricular cardiac muscle cell communication(GO:0086068) |
| 0.1 | 0.1 | GO:0072103 | glomerulus vasculature morphogenesis(GO:0072103) glomerular capillary formation(GO:0072104) |
| 0.1 | 0.2 | GO:0072579 | molybdenum incorporation into molybdenum-molybdopterin complex(GO:0018315) metal incorporation into metallo-molybdopterin complex(GO:0042040) glycine receptor clustering(GO:0072579) |
| 0.1 | 0.1 | GO:0048679 | regulation of axon regeneration(GO:0048679) |
| 0.1 | 0.7 | GO:0035331 | negative regulation of hippo signaling(GO:0035331) |
| 0.1 | 0.2 | GO:0035627 | ER to Golgi ceramide transport(GO:0035621) ceramide transport(GO:0035627) |
| 0.1 | 0.2 | GO:0002528 | regulation of vascular permeability involved in acute inflammatory response(GO:0002528) |
| 0.1 | 0.1 | GO:0007195 | adenylate cyclase-inhibiting dopamine receptor signaling pathway(GO:0007195) |
| 0.1 | 0.6 | GO:0010172 | embryonic body morphogenesis(GO:0010172) |
| 0.1 | 0.3 | GO:0030046 | parallel actin filament bundle assembly(GO:0030046) |
| 0.1 | 0.1 | GO:0051299 | centrosome separation(GO:0051299) |
| 0.1 | 0.2 | GO:0006422 | aspartyl-tRNA aminoacylation(GO:0006422) |
| 0.1 | 0.2 | GO:0006421 | asparaginyl-tRNA aminoacylation(GO:0006421) |
| 0.1 | 0.8 | GO:0021680 | cerebellar Purkinje cell layer development(GO:0021680) |
| 0.1 | 0.1 | GO:0002725 | negative regulation of T cell cytokine production(GO:0002725) |
| 0.1 | 0.2 | GO:0048485 | sympathetic nervous system development(GO:0048485) |
| 0.1 | 0.1 | GO:0007181 | transforming growth factor beta receptor complex assembly(GO:0007181) |
| 0.1 | 0.3 | GO:0032878 | regulation of establishment or maintenance of cell polarity(GO:0032878) |
| 0.1 | 2.1 | GO:0060216 | definitive hemopoiesis(GO:0060216) |
| 0.1 | 0.2 | GO:0016256 | N-glycan processing to lysosome(GO:0016256) |
| 0.1 | 0.2 | GO:1903964 | monounsaturated fatty acid metabolic process(GO:1903964) monounsaturated fatty acid biosynthetic process(GO:1903966) |
| 0.1 | 0.1 | GO:0035995 | detection of muscle stretch(GO:0035995) |
| 0.1 | 0.3 | GO:0007512 | adult heart development(GO:0007512) |
| 0.1 | 0.5 | GO:0006390 | transcription from mitochondrial promoter(GO:0006390) |
| 0.1 | 0.7 | GO:0090168 | Golgi reassembly(GO:0090168) |
| 0.1 | 0.9 | GO:0048385 | regulation of retinoic acid receptor signaling pathway(GO:0048385) |
| 0.1 | 1.1 | GO:0030322 | stabilization of membrane potential(GO:0030322) |
| 0.1 | 0.5 | GO:0007258 | JUN phosphorylation(GO:0007258) |
| 0.1 | 0.5 | GO:1902031 | regulation of NADP metabolic process(GO:1902031) |
| 0.1 | 0.6 | GO:0086027 | AV node cell action potential(GO:0086016) AV node cell to bundle of His cell signaling(GO:0086027) |
| 0.1 | 0.1 | GO:0001575 | globoside metabolic process(GO:0001575) |
| 0.1 | 0.2 | GO:0045198 | establishment of epithelial cell apical/basal polarity(GO:0045198) |
| 0.1 | 0.3 | GO:0070417 | cellular response to cold(GO:0070417) |
| 0.1 | 0.1 | GO:0034427 | nuclear-transcribed mRNA catabolic process, exonucleolytic, 3'-5'(GO:0034427) |
| 0.1 | 0.1 | GO:0032417 | regulation of sodium:proton antiporter activity(GO:0032415) positive regulation of sodium:proton antiporter activity(GO:0032417) |
| 0.1 | 0.3 | GO:0051754 | meiotic sister chromatid cohesion, centromeric(GO:0051754) |
| 0.1 | 0.7 | GO:0001867 | complement activation, lectin pathway(GO:0001867) |
| 0.1 | 0.8 | GO:0018206 | peptidyl-methionine modification(GO:0018206) |
| 0.1 | 0.5 | GO:0007000 | nucleolus organization(GO:0007000) |
| 0.1 | 0.2 | GO:0019640 | glucuronate catabolic process(GO:0006064) glucuronate catabolic process to xylulose 5-phosphate(GO:0019640) xylulose 5-phosphate metabolic process(GO:0051167) xylulose 5-phosphate biosynthetic process(GO:1901159) |
| 0.1 | 0.2 | GO:0034970 | histone H3-R2 methylation(GO:0034970) |
| 0.1 | 1.2 | GO:0050691 | regulation of defense response to virus by host(GO:0050691) |
| 0.1 | 0.2 | GO:0003032 | detection of oxygen(GO:0003032) |
| 0.1 | 0.3 | GO:0071609 | chemokine (C-C motif) ligand 5 production(GO:0071609) |
| 0.1 | 0.3 | GO:0009149 | pyrimidine nucleoside triphosphate catabolic process(GO:0009149) pyrimidine deoxyribonucleoside triphosphate catabolic process(GO:0009213) |
| 0.1 | 0.1 | GO:0051497 | negative regulation of actin filament bundle assembly(GO:0032232) negative regulation of stress fiber assembly(GO:0051497) |
| 0.1 | 1.7 | GO:0035774 | positive regulation of insulin secretion involved in cellular response to glucose stimulus(GO:0035774) |
| 0.1 | 0.2 | GO:0060152 | peroxisome localization(GO:0060151) microtubule-based peroxisome localization(GO:0060152) |
| 0.1 | 0.1 | GO:0002690 | positive regulation of leukocyte chemotaxis(GO:0002690) |
| 0.1 | 0.1 | GO:0031060 | regulation of histone methylation(GO:0031060) |
| 0.1 | 0.1 | GO:0043686 | co-translational protein modification(GO:0043686) |
| 0.1 | 0.1 | GO:0043382 | positive regulation of memory T cell differentiation(GO:0043382) |
| 0.1 | 0.1 | GO:0033227 | dsRNA transport(GO:0033227) |
| 0.1 | 0.1 | GO:1903897 | regulation of PERK-mediated unfolded protein response(GO:1903897) |
| 0.1 | 0.1 | GO:0070638 | nicotinamide riboside catabolic process(GO:0006738) nicotinamide riboside metabolic process(GO:0046495) pyridine nucleoside metabolic process(GO:0070637) pyridine nucleoside catabolic process(GO:0070638) |
| 0.1 | 1.2 | GO:0031167 | rRNA methylation(GO:0031167) |
| 0.1 | 0.2 | GO:0000460 | maturation of 5.8S rRNA(GO:0000460) |
| 0.1 | 0.1 | GO:0018171 | peptidyl-cysteine oxidation(GO:0018171) |
| 0.1 | 0.4 | GO:0061469 | regulation of type B pancreatic cell proliferation(GO:0061469) |
| 0.1 | 0.6 | GO:0032020 | ISG15-protein conjugation(GO:0032020) |
| 0.1 | 0.8 | GO:0001833 | inner cell mass cell proliferation(GO:0001833) |
| 0.1 | 0.1 | GO:0043117 | positive regulation of vascular permeability(GO:0043117) |
| 0.1 | 0.1 | GO:0007059 | chromosome segregation(GO:0007059) |
| 0.1 | 1.1 | GO:0007342 | fusion of sperm to egg plasma membrane(GO:0007342) |
| 0.1 | 0.1 | GO:0007056 | spindle assembly involved in female meiosis(GO:0007056) |
| 0.1 | 0.4 | GO:0097338 | response to clozapine(GO:0097338) |
| 0.1 | 0.2 | GO:0006434 | seryl-tRNA aminoacylation(GO:0006434) |
| 0.1 | 0.1 | GO:1900368 | regulation of RNA interference(GO:1900368) |
| 0.1 | 0.3 | GO:1902571 | regulation of serine-type endopeptidase activity(GO:1900003) regulation of serine-type peptidase activity(GO:1902571) |
| 0.1 | 0.5 | GO:0060244 | negative regulation of cell proliferation involved in contact inhibition(GO:0060244) |
| 0.1 | 0.1 | GO:0033484 | nitric oxide homeostasis(GO:0033484) |
| 0.1 | 0.2 | GO:0032261 | purine nucleotide salvage(GO:0032261) |
| 0.1 | 0.5 | GO:0060700 | regulation of ribonuclease activity(GO:0060700) |
| 0.1 | 0.1 | GO:0051835 | positive regulation of synapse structural plasticity(GO:0051835) |
| 0.1 | 0.1 | GO:0014878 | response to electrical stimulus involved in regulation of muscle adaptation(GO:0014878) |
| 0.1 | 0.6 | GO:0000160 | phosphorelay signal transduction system(GO:0000160) |
| 0.1 | 0.1 | GO:0042746 | regulation of circadian sleep/wake cycle, wakefulness(GO:0010840) circadian sleep/wake cycle, wakefulness(GO:0042746) |
| 0.1 | 0.2 | GO:0048149 | behavioral response to ethanol(GO:0048149) |
| 0.1 | 0.1 | GO:0032898 | neurotrophin production(GO:0032898) |
| 0.1 | 0.2 | GO:0045955 | negative regulation of calcium ion-dependent exocytosis(GO:0045955) |
| 0.1 | 0.1 | GO:1904970 | brush border assembly(GO:1904970) |
| 0.1 | 0.1 | GO:0052251 | induction by symbiont of host defense response(GO:0044416) induction of host immune response by virus(GO:0046730) active induction of host immune response by virus(GO:0046732) modulation by symbiont of host defense response(GO:0052031) induction by organism of defense response of other organism involved in symbiotic interaction(GO:0052251) modulation by organism of defense response of other organism involved in symbiotic interaction(GO:0052255) positive regulation by symbiont of host defense response(GO:0052509) positive regulation by organism of defense response of other organism involved in symbiotic interaction(GO:0052510) modulation by organism of immune response of other organism involved in symbiotic interaction(GO:0052552) modulation by symbiont of host immune response(GO:0052553) modulation by virus of host immune response(GO:0075528) |
| 0.1 | 0.2 | GO:0045591 | positive regulation of regulatory T cell differentiation(GO:0045591) |
| 0.1 | 0.1 | GO:0097167 | circadian regulation of translation(GO:0097167) |
| 0.1 | 0.1 | GO:0002003 | angiotensin maturation(GO:0002003) |
| 0.1 | 0.2 | GO:0014063 | negative regulation of serotonin secretion(GO:0014063) |
| 0.1 | 0.3 | GO:2000601 | positive regulation of Arp2/3 complex-mediated actin nucleation(GO:2000601) |
| 0.1 | 0.1 | GO:1901877 | regulation of calcium ion binding(GO:1901876) negative regulation of calcium ion binding(GO:1901877) |
| 0.1 | 0.1 | GO:1900239 | phenotypic switching(GO:0036166) regulation of phenotypic switching(GO:1900239) |
| 0.1 | 0.1 | GO:0061101 | neuroendocrine cell differentiation(GO:0061101) |
| 0.1 | 0.3 | GO:1902231 | positive regulation of intrinsic apoptotic signaling pathway in response to DNA damage(GO:1902231) |
| 0.1 | 0.6 | GO:0000463 | maturation of LSU-rRNA from tricistronic rRNA transcript (SSU-rRNA, 5.8S rRNA, LSU-rRNA)(GO:0000463) |
| 0.1 | 0.3 | GO:0031648 | protein destabilization(GO:0031648) |
| 0.1 | 0.1 | GO:0001172 | transcription, RNA-templated(GO:0001172) |
| 0.1 | 0.1 | GO:0015698 | inorganic anion transport(GO:0015698) |
| 0.1 | 0.2 | GO:0016198 | axon choice point recognition(GO:0016198) |
| 0.1 | 0.1 | GO:0034138 | toll-like receptor 3 signaling pathway(GO:0034138) |
| 0.1 | 0.6 | GO:1902074 | response to salt(GO:1902074) |
| 0.1 | 0.5 | GO:0010606 | positive regulation of cytoplasmic mRNA processing body assembly(GO:0010606) |
| 0.1 | 0.1 | GO:0014043 | negative regulation of neuron maturation(GO:0014043) |
| 0.1 | 0.5 | GO:0043152 | induction of bacterial agglutination(GO:0043152) |
| 0.1 | 0.1 | GO:0035989 | tendon development(GO:0035989) |
| 0.1 | 0.1 | GO:1902916 | positive regulation of protein polyubiquitination(GO:1902916) |
| 0.1 | 0.1 | GO:2000275 | regulation of oxidative phosphorylation uncoupler activity(GO:2000275) |
| 0.1 | 0.2 | GO:1903567 | negative regulation of protein localization to cilium(GO:1903565) regulation of protein localization to ciliary membrane(GO:1903567) negative regulation of protein localization to ciliary membrane(GO:1903568) |
| 0.1 | 1.1 | GO:0042753 | positive regulation of circadian rhythm(GO:0042753) |
| 0.1 | 0.1 | GO:0060742 | epithelial cell differentiation involved in prostate gland development(GO:0060742) |
| 0.1 | 1.3 | GO:0018146 | keratan sulfate biosynthetic process(GO:0018146) |
| 0.1 | 0.3 | GO:2000253 | positive regulation of feeding behavior(GO:2000253) |
| 0.1 | 0.3 | GO:0048066 | developmental pigmentation(GO:0048066) |
| 0.1 | 0.9 | GO:0001913 | T cell mediated cytotoxicity(GO:0001913) |
| 0.1 | 0.1 | GO:0045918 | negative regulation of cytolysis(GO:0045918) |
| 0.1 | 0.1 | GO:0006788 | heme oxidation(GO:0006788) |
| 0.1 | 0.3 | GO:0006436 | tryptophanyl-tRNA aminoacylation(GO:0006436) |
| 0.1 | 0.4 | GO:2001199 | negative regulation of dendritic cell differentiation(GO:2001199) |
| 0.1 | 0.1 | GO:0060052 | neurofilament cytoskeleton organization(GO:0060052) |
| 0.1 | 0.1 | GO:0048690 | regulation of sprouting of injured axon(GO:0048686) regulation of axon extension involved in regeneration(GO:0048690) |
| 0.1 | 0.3 | GO:1902775 | mitochondrial large ribosomal subunit assembly(GO:1902775) |
| 0.1 | 0.6 | GO:1901998 | toxin transport(GO:1901998) |
| 0.1 | 0.3 | GO:0048266 | behavioral response to pain(GO:0048266) |
| 0.1 | 0.3 | GO:0090074 | negative regulation of protein homodimerization activity(GO:0090074) |
| 0.1 | 0.2 | GO:0009257 | 10-formyltetrahydrofolate biosynthetic process(GO:0009257) |
| 0.1 | 0.3 | GO:1903800 | positive regulation of production of miRNAs involved in gene silencing by miRNA(GO:1903800) |
| 0.1 | 0.2 | GO:0036150 | phosphatidylserine acyl-chain remodeling(GO:0036150) |
| 0.1 | 0.7 | GO:0035092 | sperm chromatin condensation(GO:0035092) |
| 0.1 | 0.2 | GO:0045575 | basophil activation(GO:0045575) |
| 0.1 | 0.1 | GO:0090118 | receptor-mediated endocytosis of low-density lipoprotein particle involved in cholesterol transport(GO:0090118) |
| 0.1 | 0.4 | GO:0097411 | hypoxia-inducible factor-1alpha signaling pathway(GO:0097411) |
| 0.1 | 0.2 | GO:0040009 | regulation of growth rate(GO:0040009) |
| 0.1 | 0.5 | GO:2000291 | regulation of myoblast proliferation(GO:2000291) |
| 0.1 | 0.2 | GO:0071806 | protein transmembrane transport(GO:0071806) |
| 0.1 | 0.1 | GO:0045819 | positive regulation of glycogen catabolic process(GO:0045819) |
| 0.1 | 0.1 | GO:0003085 | negative regulation of systemic arterial blood pressure(GO:0003085) |
| 0.1 | 0.2 | GO:0060856 | establishment of blood-brain barrier(GO:0060856) |
| 0.1 | 0.6 | GO:0051964 | negative regulation of synapse assembly(GO:0051964) |
| 0.1 | 0.6 | GO:1901223 | negative regulation of NIK/NF-kappaB signaling(GO:1901223) |
| 0.1 | 0.1 | GO:0003350 | pulmonary myocardium development(GO:0003350) |
| 0.1 | 0.2 | GO:0010956 | negative regulation of calcidiol 1-monooxygenase activity(GO:0010956) |
| 0.1 | 0.1 | GO:1901079 | positive regulation of relaxation of muscle(GO:1901079) |
| 0.1 | 0.1 | GO:0008626 | granzyme-mediated apoptotic signaling pathway(GO:0008626) |
| 0.1 | 1.9 | GO:1902475 | L-alpha-amino acid transmembrane transport(GO:1902475) |
| 0.1 | 0.5 | GO:0099638 | endosome to plasma membrane protein transport(GO:0099638) |
| 0.1 | 0.6 | GO:0002430 | complement receptor mediated signaling pathway(GO:0002430) |
| 0.1 | 0.2 | GO:0072156 | distal tubule morphogenesis(GO:0072156) |
| 0.1 | 0.5 | GO:0021692 | cerebellar Purkinje cell layer morphogenesis(GO:0021692) |
| 0.1 | 0.3 | GO:0036414 | protein citrullination(GO:0018101) histone citrullination(GO:0036414) |
| 0.1 | 0.2 | GO:0048536 | spleen development(GO:0048536) |
| 0.1 | 0.7 | GO:0000050 | urea cycle(GO:0000050) |
| 0.1 | 0.5 | GO:0006089 | lactate metabolic process(GO:0006089) |
| 0.1 | 0.1 | GO:0070227 | lymphocyte apoptotic process(GO:0070227) |
| 0.1 | 0.1 | GO:0042270 | protection from natural killer cell mediated cytotoxicity(GO:0042270) |
| 0.1 | 0.1 | GO:0006473 | protein acetylation(GO:0006473) |
| 0.1 | 0.1 | GO:1904106 | protein localization to microvillus(GO:1904106) |
| 0.1 | 0.4 | GO:0000389 | mRNA 3'-splice site recognition(GO:0000389) |
| 0.1 | 0.2 | GO:0035411 | catenin import into nucleus(GO:0035411) |
| 0.1 | 0.6 | GO:0032692 | negative regulation of interleukin-1 production(GO:0032692) |
| 0.1 | 0.4 | GO:1902415 | regulation of mRNA binding(GO:1902415) positive regulation of mRNA binding(GO:1902416) |
| 0.1 | 0.2 | GO:0030920 | N-terminal peptidyl-serine acetylation(GO:0017198) N-terminal peptidyl-glutamic acid acetylation(GO:0018002) peptidyl-serine acetylation(GO:0030920) |
| 0.1 | 0.2 | GO:0051300 | spindle pole body duplication(GO:0030474) spindle pole body organization(GO:0051300) spindle pole body localization(GO:0070631) establishment of spindle pole body localization(GO:0070632) spindle pole body localization to nuclear envelope(GO:0071789) establishment of spindle pole body localization to nuclear envelope(GO:0071790) |
| 0.1 | 0.2 | GO:0097010 | eukaryotic translation initiation factor 4F complex assembly(GO:0097010) |
| 0.1 | 0.2 | GO:0006627 | protein processing involved in protein targeting to mitochondrion(GO:0006627) |
| 0.1 | 0.1 | GO:0060463 | lung lobe development(GO:0060462) lung lobe morphogenesis(GO:0060463) |
| 0.1 | 0.3 | GO:0060011 | Sertoli cell proliferation(GO:0060011) |
| 0.1 | 0.6 | GO:0002097 | tRNA wobble base modification(GO:0002097) |
| 0.0 | 0.2 | GO:1902510 | regulation of apoptotic DNA fragmentation(GO:1902510) |
| 0.0 | 0.1 | GO:1900020 | regulation of protein kinase C activity(GO:1900019) positive regulation of protein kinase C activity(GO:1900020) |
| 0.0 | 0.0 | GO:0046337 | phosphatidylethanolamine metabolic process(GO:0046337) |
| 0.0 | 0.3 | GO:2000324 | positive regulation of glucocorticoid receptor signaling pathway(GO:2000324) |
| 0.0 | 0.1 | GO:0002184 | cytoplasmic translational termination(GO:0002184) |
| 0.0 | 0.1 | GO:0051891 | positive regulation of cardioblast differentiation(GO:0051891) |
| 0.0 | 0.2 | GO:1902268 | negative regulation of polyamine transmembrane transport(GO:1902268) |
| 0.0 | 0.3 | GO:0002191 | cap-dependent translational initiation(GO:0002191) |
| 0.0 | 0.2 | GO:0061002 | negative regulation of dendritic spine morphogenesis(GO:0061002) |
| 0.0 | 0.1 | GO:0042747 | circadian sleep/wake cycle, REM sleep(GO:0042747) |
| 0.0 | 0.9 | GO:0007250 | activation of NF-kappaB-inducing kinase activity(GO:0007250) |
| 0.0 | 8.3 | GO:0043484 | regulation of RNA splicing(GO:0043484) |
| 0.0 | 0.1 | GO:0007341 | penetration of zona pellucida(GO:0007341) |
| 0.0 | 0.1 | GO:0097694 | establishment of RNA localization to telomere(GO:0097694) establishment of macromolecular complex localization to telomere(GO:0097695) |
| 0.0 | 0.4 | GO:0007042 | lysosomal lumen acidification(GO:0007042) |
| 0.0 | 0.3 | GO:0006857 | oligopeptide transport(GO:0006857) |
| 0.0 | 0.3 | GO:0043555 | regulation of translation in response to stress(GO:0043555) |
| 0.0 | 0.4 | GO:0010917 | negative regulation of mitochondrial membrane potential(GO:0010917) |
| 0.0 | 0.5 | GO:0090487 | toxin catabolic process(GO:0009407) secondary metabolite catabolic process(GO:0090487) |
| 0.0 | 0.3 | GO:0070940 | dephosphorylation of RNA polymerase II C-terminal domain(GO:0070940) |
| 0.0 | 0.2 | GO:0071233 | cellular response to leucine(GO:0071233) |
| 0.0 | 0.2 | GO:0042986 | positive regulation of amyloid precursor protein biosynthetic process(GO:0042986) |
| 0.0 | 0.7 | GO:0048714 | positive regulation of oligodendrocyte differentiation(GO:0048714) |
| 0.0 | 0.1 | GO:0070874 | negative regulation of glycogen biosynthetic process(GO:0045719) negative regulation of glycogen metabolic process(GO:0070874) |
| 0.0 | 0.7 | GO:0007175 | negative regulation of epidermal growth factor-activated receptor activity(GO:0007175) |
| 0.0 | 0.2 | GO:0070544 | histone H3-K36 demethylation(GO:0070544) |
| 0.0 | 0.1 | GO:2000348 | regulation of CD40 signaling pathway(GO:2000348) |
| 0.0 | 0.1 | GO:2000439 | positive regulation of monocyte extravasation(GO:2000439) |
| 0.0 | 0.1 | GO:0001866 | NK T cell proliferation(GO:0001866) |
| 0.0 | 0.1 | GO:1905224 | clathrin-coated pit assembly(GO:1905224) |
| 0.0 | 0.2 | GO:0043949 | regulation of cAMP-mediated signaling(GO:0043949) |
| 0.0 | 0.2 | GO:0044782 | cilium organization(GO:0044782) |
| 0.0 | 0.2 | GO:0060022 | hard palate development(GO:0060022) |
| 0.0 | 0.0 | GO:0098735 | positive regulation of the force of heart contraction(GO:0098735) |
| 0.0 | 0.2 | GO:0044827 | modulation by host of viral genome replication(GO:0044827) |
| 0.0 | 0.1 | GO:0048312 | intracellular distribution of mitochondria(GO:0048312) |
| 0.0 | 0.3 | GO:2000002 | negative regulation of DNA damage checkpoint(GO:2000002) |
| 0.0 | 0.1 | GO:0038163 | thrombopoietin-mediated signaling pathway(GO:0038163) |
| 0.0 | 0.4 | GO:0000055 | ribosomal large subunit export from nucleus(GO:0000055) |
| 0.0 | 0.6 | GO:0001675 | acrosome assembly(GO:0001675) |
| 0.0 | 0.0 | GO:0009233 | menaquinone metabolic process(GO:0009233) |
| 0.0 | 0.1 | GO:0050894 | determination of affect(GO:0050894) |
| 0.0 | 0.0 | GO:1990481 | mRNA pseudouridine synthesis(GO:1990481) |
| 0.0 | 0.1 | GO:0007064 | mitotic sister chromatid cohesion(GO:0007064) |
| 0.0 | 1.0 | GO:0030150 | protein import into mitochondrial matrix(GO:0030150) |
| 0.0 | 0.4 | GO:0048384 | retinoic acid receptor signaling pathway(GO:0048384) |
| 0.0 | 0.2 | GO:0038110 | interleukin-2-mediated signaling pathway(GO:0038110) |
| 0.0 | 0.5 | GO:0006971 | hypotonic response(GO:0006971) cellular hypotonic response(GO:0071476) |
| 0.0 | 0.2 | GO:0032776 | DNA methylation on cytosine(GO:0032776) |
| 0.0 | 0.4 | GO:0032049 | cardiolipin biosynthetic process(GO:0032049) |
| 0.0 | 0.3 | GO:0010002 | cardioblast differentiation(GO:0010002) |
| 0.0 | 0.3 | GO:0015780 | nucleotide-sugar transport(GO:0015780) |
| 0.0 | 0.3 | GO:0052697 | flavonoid glucuronidation(GO:0052696) xenobiotic glucuronidation(GO:0052697) |
| 0.0 | 0.0 | GO:0030522 | intracellular receptor signaling pathway(GO:0030522) |
| 0.0 | 0.0 | GO:0042758 | long-chain fatty acid catabolic process(GO:0042758) |
| 0.0 | 0.1 | GO:0061042 | vascular wound healing(GO:0061042) |
| 0.0 | 0.1 | GO:0010259 | multicellular organism aging(GO:0010259) |
| 0.0 | 0.1 | GO:1904046 | negative regulation of vascular endothelial growth factor production(GO:1904046) |
| 0.0 | 0.3 | GO:0002943 | tRNA dihydrouridine synthesis(GO:0002943) |
| 0.0 | 0.1 | GO:0030497 | fatty acid elongation(GO:0030497) |
| 0.0 | 0.0 | GO:0002604 | dendritic cell antigen processing and presentation(GO:0002468) regulation of dendritic cell antigen processing and presentation(GO:0002604) |
| 0.0 | 0.2 | GO:0002638 | negative regulation of immunoglobulin production(GO:0002638) |
| 0.0 | 0.4 | GO:0042760 | very long-chain fatty acid catabolic process(GO:0042760) |
| 0.0 | 0.0 | GO:0042364 | water-soluble vitamin biosynthetic process(GO:0042364) |
| 0.0 | 0.4 | GO:0014870 | response to muscle inactivity(GO:0014870) |
| 0.0 | 0.4 | GO:0042095 | interferon-gamma biosynthetic process(GO:0042095) |
| 0.0 | 1.5 | GO:0070286 | axonemal dynein complex assembly(GO:0070286) |
| 0.0 | 0.0 | GO:0060623 | regulation of chromosome condensation(GO:0060623) |
| 0.0 | 0.5 | GO:0015074 | DNA integration(GO:0015074) |
| 0.0 | 0.1 | GO:0002710 | negative regulation of T cell mediated immunity(GO:0002710) |
| 0.0 | 0.3 | GO:0048535 | lymph node development(GO:0048535) |
| 0.0 | 0.0 | GO:0007113 | endomitotic cell cycle(GO:0007113) |
| 0.0 | 0.2 | GO:0098532 | histone H3-K27 trimethylation(GO:0098532) |
| 0.0 | 0.4 | GO:0070933 | histone H4 deacetylation(GO:0070933) |
| 0.0 | 0.2 | GO:0000379 | tRNA-type intron splice site recognition and cleavage(GO:0000379) |
| 0.0 | 0.0 | GO:0046958 | nonassociative learning(GO:0046958) |
| 0.0 | 0.1 | GO:0042303 | molting cycle(GO:0042303) hair cycle(GO:0042633) |
| 0.0 | 0.1 | GO:0070584 | mitochondrion morphogenesis(GO:0070584) |
| 0.0 | 0.1 | GO:0040016 | embryonic cleavage(GO:0040016) |
| 0.0 | 0.2 | GO:1904406 | negative regulation of nitric oxide biosynthetic process(GO:0045019) negative regulation of nitric oxide metabolic process(GO:1904406) |
| 0.0 | 0.3 | GO:0046604 | positive regulation of mitotic centrosome separation(GO:0046604) |
| 0.0 | 0.1 | GO:0060133 | somatotropin secreting cell development(GO:0060133) |
| 0.0 | 0.2 | GO:0032957 | inositol trisphosphate metabolic process(GO:0032957) |
| 0.0 | 0.0 | GO:0097051 | establishment of protein localization to endoplasmic reticulum membrane(GO:0097051) |
| 0.0 | 0.0 | GO:0045200 | establishment or maintenance of neuroblast polarity(GO:0045196) establishment of neuroblast polarity(GO:0045200) |
| 0.0 | 0.2 | GO:0097623 | potassium ion export across plasma membrane(GO:0097623) |
| 0.0 | 0.1 | GO:0000294 | nuclear-transcribed mRNA catabolic process, endonucleolytic cleavage-dependent decay(GO:0000294) |
| 0.0 | 0.1 | GO:0072268 | pattern specification involved in metanephros development(GO:0072268) |
| 0.0 | 0.1 | GO:0038169 | somatostatin receptor signaling pathway(GO:0038169) somatostatin signaling pathway(GO:0038170) |
| 0.0 | 0.2 | GO:0061763 | multivesicular body-lysosome fusion(GO:0061763) |
| 0.0 | 0.2 | GO:0045622 | regulation of T-helper cell differentiation(GO:0045622) |
| 0.0 | 0.4 | GO:0051085 | chaperone mediated protein folding requiring cofactor(GO:0051085) |
| 0.0 | 0.2 | GO:0018377 | protein myristoylation(GO:0018377) |
| 0.0 | 0.4 | GO:0015884 | folic acid transport(GO:0015884) |
| 0.0 | 0.8 | GO:0010591 | regulation of lamellipodium assembly(GO:0010591) |
| 0.0 | 0.1 | GO:0051569 | regulation of histone H3-K4 methylation(GO:0051569) |
| 0.0 | 0.1 | GO:1901860 | positive regulation of mitochondrial DNA metabolic process(GO:1901860) |
| 0.0 | 0.0 | GO:0002042 | cell migration involved in sprouting angiogenesis(GO:0002042) |
| 0.0 | 0.1 | GO:0051182 | coenzyme transport(GO:0051182) |
| 0.0 | 0.3 | GO:0000270 | peptidoglycan metabolic process(GO:0000270) peptidoglycan catabolic process(GO:0009253) |
| 0.0 | 0.1 | GO:0048742 | regulation of skeletal muscle fiber development(GO:0048742) |
| 0.0 | 0.3 | GO:1901838 | positive regulation of transcription of nuclear large rRNA transcript from RNA polymerase I promoter(GO:1901838) |
| 0.0 | 0.1 | GO:0055119 | relaxation of cardiac muscle(GO:0055119) |
| 0.0 | 0.2 | GO:1904693 | midbrain morphogenesis(GO:1904693) |
| 0.0 | 0.2 | GO:0001831 | trophectodermal cellular morphogenesis(GO:0001831) |
| 0.0 | 0.1 | GO:0043951 | negative regulation of cAMP-mediated signaling(GO:0043951) |
| 0.0 | 0.2 | GO:0035616 | histone H2B conserved C-terminal lysine deubiquitination(GO:0035616) |
| 0.0 | 0.0 | GO:0021569 | rhombomere 3 development(GO:0021569) |
| 0.0 | 0.1 | GO:0070601 | centromeric sister chromatid cohesion(GO:0070601) |
| 0.0 | 0.1 | GO:0072719 | cellular response to cisplatin(GO:0072719) |
| 0.0 | 0.1 | GO:2000402 | negative regulation of lymphocyte migration(GO:2000402) |
| 0.0 | 0.0 | GO:2001293 | malonyl-CoA metabolic process(GO:2001293) |
| 0.0 | 0.1 | GO:0038033 | positive regulation of endothelial cell chemotaxis by VEGF-activated vascular endothelial growth factor receptor signaling pathway(GO:0038033) |
| 0.0 | 0.4 | GO:0006449 | regulation of translational termination(GO:0006449) |
| 0.0 | 0.0 | GO:0051541 | elastin metabolic process(GO:0051541) |
| 0.0 | 0.4 | GO:0000183 | chromatin silencing at rDNA(GO:0000183) |
| 0.0 | 0.2 | GO:0090286 | cytoskeletal anchoring at nuclear membrane(GO:0090286) |
| 0.0 | 0.5 | GO:1903690 | negative regulation of wound healing, spreading of epidermal cells(GO:1903690) |
| 0.0 | 0.0 | GO:0031291 | Ran protein signal transduction(GO:0031291) |
| 0.0 | 0.2 | GO:0044806 | G-quadruplex DNA unwinding(GO:0044806) |
| 0.0 | 1.0 | GO:0006123 | mitochondrial electron transport, cytochrome c to oxygen(GO:0006123) |
| 0.0 | 0.1 | GO:0014029 | neural crest formation(GO:0014029) |
| 0.0 | 1.9 | GO:0038128 | ERBB2 signaling pathway(GO:0038128) |
| 0.0 | 0.3 | GO:0021999 | neural plate anterior/posterior regionalization(GO:0021999) |
| 0.0 | 0.1 | GO:0042727 | flavin-containing compound biosynthetic process(GO:0042727) |
| 0.0 | 0.1 | GO:0046427 | positive regulation of JAK-STAT cascade(GO:0046427) positive regulation of STAT cascade(GO:1904894) |
| 0.0 | 0.1 | GO:1902262 | apoptotic process involved in patterning of blood vessels(GO:1902262) |
| 0.0 | 0.1 | GO:0046013 | regulation of T cell homeostatic proliferation(GO:0046013) |
| 0.0 | 0.3 | GO:1900264 | regulation of DNA-directed DNA polymerase activity(GO:1900262) positive regulation of DNA-directed DNA polymerase activity(GO:1900264) |
| 0.0 | 0.3 | GO:0070255 | regulation of mucus secretion(GO:0070255) |
| 0.0 | 0.3 | GO:2000304 | positive regulation of sphingolipid biosynthetic process(GO:0090154) positive regulation of ceramide biosynthetic process(GO:2000304) |
| 0.0 | 0.8 | GO:0016973 | poly(A)+ mRNA export from nucleus(GO:0016973) |
| 0.0 | 1.5 | GO:2001238 | positive regulation of extrinsic apoptotic signaling pathway(GO:2001238) |
| 0.0 | 0.1 | GO:0045653 | negative regulation of megakaryocyte differentiation(GO:0045653) |
| 0.0 | 0.2 | GO:0022401 | desensitization of G-protein coupled receptor protein signaling pathway(GO:0002029) negative adaptation of signaling pathway(GO:0022401) |
| 0.0 | 0.2 | GO:0006685 | sphingomyelin catabolic process(GO:0006685) |
| 0.0 | 0.8 | GO:0042417 | dopamine metabolic process(GO:0042417) |
| 0.0 | 0.3 | GO:0019585 | uronic acid metabolic process(GO:0006063) glucuronate metabolic process(GO:0019585) cellular glucuronidation(GO:0052695) |
| 0.0 | 0.0 | GO:0039656 | modulation by virus of host gene expression(GO:0039656) modification by virus of host mRNA processing(GO:0046778) |
| 0.0 | 0.1 | GO:0060012 | synaptic transmission, glycinergic(GO:0060012) |
| 0.0 | 0.2 | GO:1902902 | negative regulation of autophagosome assembly(GO:1902902) |
| 0.0 | 0.0 | GO:0033634 | positive regulation of cell-cell adhesion mediated by integrin(GO:0033634) |
| 0.0 | 0.1 | GO:0061158 | 3'-UTR-mediated mRNA destabilization(GO:0061158) |
| 0.0 | 0.1 | GO:0090283 | regulation of protein glycosylation in Golgi(GO:0090283) |
| 0.0 | 0.1 | GO:0070265 | necrotic cell death(GO:0070265) |
| 0.0 | 0.0 | GO:0042350 | GDP-L-fucose biosynthetic process(GO:0042350) |
| 0.0 | 0.3 | GO:0042026 | protein refolding(GO:0042026) |
| 0.0 | 0.0 | GO:0051932 | synaptic transmission, GABAergic(GO:0051932) |
| 0.0 | 0.1 | GO:0036378 | calcitriol biosynthetic process from calciol(GO:0036378) |
| 0.0 | 0.1 | GO:0002728 | negative regulation of natural killer cell cytokine production(GO:0002728) |
| 0.0 | 0.1 | GO:0048625 | myoblast fate commitment(GO:0048625) |
| 0.0 | 0.1 | GO:2000824 | negative regulation of androgen receptor activity(GO:2000824) |
| 0.0 | 0.2 | GO:0000480 | endonucleolytic cleavage in 5'-ETS of tricistronic rRNA transcript (SSU-rRNA, 5.8S rRNA, LSU-rRNA)(GO:0000480) |
| 0.0 | 0.0 | GO:0051782 | negative regulation of cell division(GO:0051782) |
| 0.0 | 0.1 | GO:0019418 | sulfide oxidation(GO:0019418) sulfide oxidation, using sulfide:quinone oxidoreductase(GO:0070221) |
| 0.0 | 0.1 | GO:0038060 | nitric oxide-cGMP-mediated signaling pathway(GO:0038060) |
| 0.0 | 0.1 | GO:0042045 | epithelial fluid transport(GO:0042045) |
| 0.0 | 0.1 | GO:0006624 | vacuolar protein processing(GO:0006624) |
| 0.0 | 0.1 | GO:0070352 | positive regulation of white fat cell proliferation(GO:0070352) |
| 0.0 | 0.2 | GO:0071461 | cellular response to redox state(GO:0071461) |
| 0.0 | 0.1 | GO:0032455 | nerve growth factor processing(GO:0032455) |
| 0.0 | 0.1 | GO:1903445 | intermembrane transport(GO:0046909) protein transport from ciliary membrane to plasma membrane(GO:1903445) |
| 0.0 | 0.4 | GO:0006570 | tyrosine metabolic process(GO:0006570) |
| 0.0 | 0.1 | GO:0045054 | constitutive secretory pathway(GO:0045054) |
| 0.0 | 0.0 | GO:0072429 | response to cell cycle checkpoint signaling(GO:0072396) response to DNA integrity checkpoint signaling(GO:0072402) response to DNA damage checkpoint signaling(GO:0072423) response to intra-S DNA damage checkpoint signaling(GO:0072429) |
| 0.0 | 0.1 | GO:0045065 | cytotoxic T cell differentiation(GO:0045065) |
| 0.0 | 0.7 | GO:0009303 | rRNA transcription(GO:0009303) |
| 0.0 | 0.6 | GO:0046339 | diacylglycerol metabolic process(GO:0046339) |
| 0.0 | 0.2 | GO:0005981 | regulation of glycogen catabolic process(GO:0005981) |
| 0.0 | 0.7 | GO:0097320 | membrane tubulation(GO:0097320) |
| 0.0 | 0.2 | GO:0033152 | immunoglobulin V(D)J recombination(GO:0033152) |
| 0.0 | 0.1 | GO:1902047 | polyamine transmembrane transport(GO:1902047) regulation of polyamine transmembrane transport(GO:1902267) |
| 0.0 | 0.2 | GO:1904158 | axonemal central apparatus assembly(GO:1904158) |
| 0.0 | 0.0 | GO:0045806 | negative regulation of endocytosis(GO:0045806) |
| 0.0 | 1.3 | GO:0006362 | transcription elongation from RNA polymerase I promoter(GO:0006362) |
| 0.0 | 0.3 | GO:0006335 | DNA replication-dependent nucleosome assembly(GO:0006335) DNA replication-dependent nucleosome organization(GO:0034723) |
| 0.0 | 0.5 | GO:0033209 | tumor necrosis factor-mediated signaling pathway(GO:0033209) |
| 0.0 | 0.1 | GO:0032510 | endosome to lysosome transport via multivesicular body sorting pathway(GO:0032510) |
| 0.0 | 0.1 | GO:0000492 | box C/D snoRNP assembly(GO:0000492) |
| 0.0 | 0.0 | GO:0006543 | glutamine catabolic process(GO:0006543) |
| 0.0 | 1.2 | GO:0007340 | acrosome reaction(GO:0007340) |
| 0.0 | 0.0 | GO:0097680 | double-strand break repair via classical nonhomologous end joining(GO:0097680) |
| 0.0 | 1.3 | GO:0007214 | gamma-aminobutyric acid signaling pathway(GO:0007214) |
| 0.0 | 0.0 | GO:0032661 | regulation of interleukin-18 production(GO:0032661) |
| 0.0 | 0.0 | GO:0008228 | opsonization(GO:0008228) |
| 0.0 | 0.3 | GO:0048681 | negative regulation of axon regeneration(GO:0048681) |
| 0.0 | 0.0 | GO:0036090 | cleavage furrow ingression(GO:0036090) |
| 0.0 | 0.2 | GO:0050917 | sensory perception of umami taste(GO:0050917) |
| 0.0 | 2.4 | GO:0060333 | interferon-gamma-mediated signaling pathway(GO:0060333) |
| 0.0 | 0.1 | GO:0072498 | embryonic skeletal joint development(GO:0072498) |
| 0.0 | 0.1 | GO:0030299 | intestinal cholesterol absorption(GO:0030299) intestinal lipid absorption(GO:0098856) |
| 0.0 | 0.1 | GO:0009820 | alkaloid metabolic process(GO:0009820) |
| 0.0 | 0.5 | GO:0070977 | bone maturation(GO:0070977) |
| 0.0 | 0.1 | GO:0090245 | axis elongation involved in somitogenesis(GO:0090245) |
| 0.0 | 0.7 | GO:0034389 | lipid particle organization(GO:0034389) |
| 0.0 | 0.1 | GO:0046166 | glyceraldehyde-3-phosphate biosynthetic process(GO:0046166) |
| 0.0 | 0.2 | GO:0006930 | substrate-dependent cell migration, cell extension(GO:0006930) |
| 0.0 | 0.4 | GO:0043982 | histone H4-K5 acetylation(GO:0043981) histone H4-K8 acetylation(GO:0043982) |
| 0.0 | 0.1 | GO:1904327 | protein localization to cytosolic proteasome complex(GO:1904327) protein localization to cytosolic proteasome complex involved in ERAD pathway(GO:1904379) |
| 0.0 | 0.0 | GO:0051052 | regulation of DNA metabolic process(GO:0051052) |
| 0.0 | 0.4 | GO:0071688 | striated muscle myosin thick filament assembly(GO:0071688) |
| 0.0 | 0.1 | GO:2001300 | lipoxin metabolic process(GO:2001300) |
| 0.0 | 0.1 | GO:0000479 | endonucleolytic cleavage of tricistronic rRNA transcript (SSU-rRNA, 5.8S rRNA, LSU-rRNA)(GO:0000479) |
| 0.0 | 0.1 | GO:0098703 | calcium ion import across plasma membrane(GO:0098703) calcium ion import into cell(GO:1990035) |
| 0.0 | 0.0 | GO:1902908 | regulation of melanosome transport(GO:1902908) |
| 0.0 | 0.0 | GO:0045053 | protein retention in Golgi apparatus(GO:0045053) |
| 0.0 | 0.1 | GO:0042908 | xenobiotic transport(GO:0042908) |
| 0.0 | 0.1 | GO:1903697 | negative regulation of microvillus assembly(GO:1903697) |
| 0.0 | 0.1 | GO:0043435 | response to corticotropin-releasing hormone(GO:0043435) cellular response to corticotropin-releasing hormone stimulus(GO:0071376) |
| 0.0 | 0.5 | GO:0007141 | male meiosis I(GO:0007141) |
| 0.0 | 0.0 | GO:0060143 | positive regulation of syncytium formation by plasma membrane fusion(GO:0060143) |
| 0.0 | 0.2 | GO:0006777 | Mo-molybdopterin cofactor biosynthetic process(GO:0006777) Mo-molybdopterin cofactor metabolic process(GO:0019720) |
| 0.0 | 0.0 | GO:0051315 | attachment of mitotic spindle microtubules to kinetochore(GO:0051315) |
| 0.0 | 0.2 | GO:0014003 | oligodendrocyte development(GO:0014003) |
| 0.0 | 0.1 | GO:0060435 | bronchiole development(GO:0060435) |
| 0.0 | 2.2 | GO:1900181 | negative regulation of protein localization to nucleus(GO:1900181) |
| 0.0 | 0.4 | GO:0006995 | cellular response to nitrogen starvation(GO:0006995) cellular response to nitrogen levels(GO:0043562) |
| 0.0 | 0.4 | GO:0036148 | phosphatidylglycerol acyl-chain remodeling(GO:0036148) |
| 0.0 | 0.0 | GO:0060029 | convergent extension involved in organogenesis(GO:0060029) |
| 0.0 | 0.1 | GO:1901656 | glycoside transport(GO:1901656) |
| 0.0 | 0.1 | GO:0006379 | mRNA cleavage(GO:0006379) |
| 0.0 | 0.1 | GO:0008053 | mitochondrial fusion(GO:0008053) |
| 0.0 | 0.2 | GO:0002291 | T cell activation via T cell receptor contact with antigen bound to MHC molecule on antigen presenting cell(GO:0002291) |
| 0.0 | 0.1 | GO:0048290 | isotype switching to IgA isotypes(GO:0048290) |
| 0.0 | 0.1 | GO:0090205 | positive regulation of cholesterol metabolic process(GO:0090205) |
| 0.0 | 0.1 | GO:0036337 | Fas signaling pathway(GO:0036337) |
| 0.0 | 0.1 | GO:0032508 | DNA duplex unwinding(GO:0032508) |
| 0.0 | 0.1 | GO:2000811 | negative regulation of anoikis(GO:2000811) |
| 0.0 | 0.1 | GO:0050847 | progesterone receptor signaling pathway(GO:0050847) |
| 0.0 | 0.3 | GO:0006198 | cAMP catabolic process(GO:0006198) |
| 0.0 | 0.0 | GO:0007021 | tubulin complex assembly(GO:0007021) |
| 0.0 | 0.6 | GO:0008347 | glial cell migration(GO:0008347) |
| 0.0 | 0.3 | GO:0006030 | chitin metabolic process(GO:0006030) chitin catabolic process(GO:0006032) |
| 0.0 | 0.3 | GO:0001570 | vasculogenesis(GO:0001570) |
| 0.0 | 0.4 | GO:0034975 | protein folding in endoplasmic reticulum(GO:0034975) |
| 0.0 | 0.2 | GO:0040034 | regulation of development, heterochronic(GO:0040034) regulation of timing of cell differentiation(GO:0048505) |
| 0.0 | 0.1 | GO:0045639 | positive regulation of myeloid cell differentiation(GO:0045639) |
| 0.0 | 0.1 | GO:0032309 | icosanoid secretion(GO:0032309) |
| 0.0 | 0.3 | GO:2001224 | positive regulation of neuron migration(GO:2001224) |
| 0.0 | 0.1 | GO:0008214 | protein demethylation(GO:0006482) protein dealkylation(GO:0008214) |
| 0.0 | 1.7 | GO:0098781 | ncRNA transcription(GO:0098781) |
| 0.0 | 0.1 | GO:0030644 | cellular chloride ion homeostasis(GO:0030644) |
| 0.0 | 0.1 | GO:0032494 | response to peptidoglycan(GO:0032494) |
| 0.0 | 0.2 | GO:0002523 | leukocyte migration involved in inflammatory response(GO:0002523) |
| 0.0 | 0.0 | GO:2000373 | regulation of DNA topoisomerase (ATP-hydrolyzing) activity(GO:2000371) positive regulation of DNA topoisomerase (ATP-hydrolyzing) activity(GO:2000373) |
| 0.0 | 0.1 | GO:0002862 | negative regulation of inflammatory response to antigenic stimulus(GO:0002862) |
| 0.0 | 0.1 | GO:0000354 | cis assembly of pre-catalytic spliceosome(GO:0000354) |
| 0.0 | 0.2 | GO:0007207 | phospholipase C-activating G-protein coupled acetylcholine receptor signaling pathway(GO:0007207) |
| 0.0 | 0.1 | GO:0070682 | proteasome regulatory particle assembly(GO:0070682) |
| 0.0 | 0.3 | GO:0097500 | receptor localization to nonmotile primary cilium(GO:0097500) |
| 0.0 | 0.2 | GO:0070973 | protein localization to endoplasmic reticulum exit site(GO:0070973) |
| 0.0 | 0.1 | GO:0045875 | negative regulation of sister chromatid cohesion(GO:0045875) |
| 0.0 | 0.3 | GO:2000786 | positive regulation of autophagosome assembly(GO:2000786) |
| 0.0 | 0.5 | GO:0006450 | regulation of translational fidelity(GO:0006450) |
| 0.0 | 0.2 | GO:0043457 | regulation of cellular respiration(GO:0043457) |
| 0.0 | 0.1 | GO:0019242 | methylglyoxal biosynthetic process(GO:0019242) |
| 0.0 | 0.4 | GO:0097186 | amelogenesis(GO:0097186) |
| 0.0 | 0.3 | GO:0031119 | tRNA pseudouridine synthesis(GO:0031119) |
| 0.0 | 0.5 | GO:0001682 | tRNA 5'-leader removal(GO:0001682) |
| 0.0 | 0.1 | GO:0039692 | single stranded viral RNA replication via double stranded DNA intermediate(GO:0039692) negative regulation of single stranded viral RNA replication via double stranded DNA intermediate(GO:0045869) |
| 0.0 | 0.0 | GO:0097032 | respiratory chain complex II assembly(GO:0034552) mitochondrial respiratory chain complex II assembly(GO:0034553) mitochondrial respiratory chain complex II biogenesis(GO:0097032) |
| 0.0 | 0.7 | GO:0043252 | sodium-independent organic anion transport(GO:0043252) |
| 0.0 | 1.0 | GO:2000649 | regulation of sodium ion transmembrane transporter activity(GO:2000649) |
| 0.0 | 0.1 | GO:0021502 | neural fold elevation formation(GO:0021502) |
| 0.0 | 0.1 | GO:0033274 | response to vitamin B2(GO:0033274) heterochromatin maintenance(GO:0070829) |
| 0.0 | 0.0 | GO:0010155 | regulation of proton transport(GO:0010155) |
| 0.0 | 0.1 | GO:0043489 | RNA stabilization(GO:0043489) |
| 0.0 | 0.1 | GO:0006356 | regulation of transcription from RNA polymerase I promoter(GO:0006356) |
| 0.0 | 0.0 | GO:0014004 | microglia differentiation(GO:0014004) microglia development(GO:0014005) |
| 0.0 | 0.1 | GO:0050859 | negative regulation of B cell receptor signaling pathway(GO:0050859) |
| 0.0 | 0.0 | GO:0007521 | muscle cell fate determination(GO:0007521) |
| 0.0 | 0.1 | GO:2000234 | positive regulation of ribosome biogenesis(GO:0090070) positive regulation of rRNA processing(GO:2000234) |
| 0.0 | 0.0 | GO:0006659 | phosphatidylserine biosynthetic process(GO:0006659) |
| 0.0 | 0.1 | GO:0006423 | cysteinyl-tRNA aminoacylation(GO:0006423) |
| 0.0 | 0.0 | GO:0009405 | pathogenesis(GO:0009405) |
| 0.0 | 0.1 | GO:0002281 | macrophage activation involved in immune response(GO:0002281) |
| 0.0 | 0.1 | GO:0038188 | cholecystokinin signaling pathway(GO:0038188) |
| 0.0 | 0.1 | GO:0021633 | optic nerve structural organization(GO:0021633) |
| 0.0 | 0.3 | GO:0007130 | synaptonemal complex assembly(GO:0007130) |
| 0.0 | 0.1 | GO:0016557 | peroxisome membrane biogenesis(GO:0016557) |
| 0.0 | 0.0 | GO:0071922 | establishment of sister chromatid cohesion(GO:0034085) cohesin loading(GO:0071921) regulation of cohesin loading(GO:0071922) |
| 0.0 | 0.2 | GO:1901978 | positive regulation of cell cycle checkpoint(GO:1901978) |
| 0.0 | 0.2 | GO:0018344 | protein geranylgeranylation(GO:0018344) |
| 0.0 | 0.1 | GO:0032876 | negative regulation of DNA endoreduplication(GO:0032876) |
| 0.0 | 0.2 | GO:0007506 | gonadal mesoderm development(GO:0007506) |
| 0.0 | 0.1 | GO:2000035 | regulation of stem cell division(GO:2000035) |
| 0.0 | 0.1 | GO:0048671 | negative regulation of collateral sprouting(GO:0048671) |
| 0.0 | 0.0 | GO:0071963 | establishment or maintenance of cell polarity regulating cell shape(GO:0071963) |
| 0.0 | 0.1 | GO:0006780 | uroporphyrinogen III biosynthetic process(GO:0006780) uroporphyrinogen III metabolic process(GO:0046502) |
| 0.0 | 0.6 | GO:0042273 | ribosomal large subunit biogenesis(GO:0042273) |
| 0.0 | 0.0 | GO:0051583 | dopamine uptake involved in synaptic transmission(GO:0051583) catecholamine uptake involved in synaptic transmission(GO:0051934) catecholamine uptake(GO:0090493) dopamine uptake(GO:0090494) |
| 0.0 | 0.7 | GO:0072488 | ammonium transmembrane transport(GO:0072488) |
| 0.0 | 0.3 | GO:0030033 | microvillus assembly(GO:0030033) |
| 0.0 | 0.2 | GO:0098787 | mRNA cleavage involved in mRNA processing(GO:0098787) |
| 0.0 | 0.0 | GO:0000973 | posttranscriptional tethering of RNA polymerase II gene DNA at nuclear periphery(GO:0000973) |
| 0.0 | 0.2 | GO:0090162 | establishment of epithelial cell polarity(GO:0090162) |
| 0.0 | 0.0 | GO:0060722 | spongiotrophoblast cell proliferation(GO:0060720) regulation of spongiotrophoblast cell proliferation(GO:0060721) cell proliferation involved in embryonic placenta development(GO:0060722) regulation of cell proliferation involved in embryonic placenta development(GO:0060723) |
| 0.0 | 0.1 | GO:0008343 | adult feeding behavior(GO:0008343) |
| 0.0 | 0.1 | GO:0006701 | progesterone biosynthetic process(GO:0006701) |
| 0.0 | 0.3 | GO:0006703 | estrogen biosynthetic process(GO:0006703) |
| 0.0 | 0.1 | GO:0042573 | retinoic acid metabolic process(GO:0042573) |
| 0.0 | 0.2 | GO:0035635 | entry of bacterium into host cell(GO:0035635) |
| 0.0 | 0.1 | GO:0051597 | response to methylmercury(GO:0051597) |
| 0.0 | 0.0 | GO:0097476 | spinal cord motor neuron migration(GO:0097476) |
| 0.0 | 0.2 | GO:0000083 | regulation of transcription involved in G1/S transition of mitotic cell cycle(GO:0000083) |
| 0.0 | 0.2 | GO:1900028 | negative regulation of ruffle assembly(GO:1900028) |
| 0.0 | 0.1 | GO:0033299 | secretion of lysosomal enzymes(GO:0033299) |
| 0.0 | 0.1 | GO:0016598 | protein arginylation(GO:0016598) |
| 0.0 | 2.1 | GO:0050911 | detection of chemical stimulus involved in sensory perception of smell(GO:0050911) |
| 0.0 | 0.1 | GO:0008272 | sulfate transport(GO:0008272) |
| 0.0 | 0.2 | GO:0006707 | cholesterol catabolic process(GO:0006707) sterol catabolic process(GO:0016127) |
| 0.0 | 0.4 | GO:0016339 | calcium-dependent cell-cell adhesion via plasma membrane cell adhesion molecules(GO:0016339) |
| 0.0 | 0.2 | GO:0072540 | T-helper 17 cell lineage commitment(GO:0072540) |
| 0.0 | 0.0 | GO:0014067 | negative regulation of phosphatidylinositol 3-kinase signaling(GO:0014067) |
| 0.0 | 0.2 | GO:0010944 | negative regulation of transcription by competitive promoter binding(GO:0010944) |
| 0.0 | 0.1 | GO:0007635 | chemosensory behavior(GO:0007635) |
| 0.0 | 0.1 | GO:0070831 | basement membrane assembly(GO:0070831) |
| 0.0 | 0.1 | GO:0060285 | cilium-dependent cell motility(GO:0060285) |
| 0.0 | 0.1 | GO:0072662 | protein targeting to peroxisome(GO:0006625) peroxisomal transport(GO:0043574) protein localization to peroxisome(GO:0072662) establishment of protein localization to peroxisome(GO:0072663) |
| 0.0 | 0.1 | GO:0003070 | age-dependent response to oxidative stress(GO:0001306) age-dependent response to reactive oxygen species(GO:0001315) regulation of systemic arterial blood pressure by acetylcholine(GO:0003068) vasodilation by acetylcholine involved in regulation of systemic arterial blood pressure(GO:0003069) regulation of systemic arterial blood pressure by neurotransmitter(GO:0003070) age-dependent general metabolic decline(GO:0007571) |
| 0.0 | 0.1 | GO:0072344 | rescue of stalled ribosome(GO:0072344) |
| 0.0 | 0.1 | GO:0045716 | positive regulation of low-density lipoprotein particle receptor biosynthetic process(GO:0045716) |
| 0.0 | 0.2 | GO:1901673 | regulation of mitotic spindle assembly(GO:1901673) |
| 0.0 | 0.0 | GO:0016185 | synaptic vesicle budding from presynaptic endocytic zone membrane(GO:0016185) synaptic vesicle budding(GO:0070142) |
| 0.0 | 0.2 | GO:0033169 | histone H3-K9 demethylation(GO:0033169) |
| 0.0 | 0.1 | GO:0031507 | heterochromatin assembly(GO:0031507) |
| 0.0 | 0.0 | GO:0032286 | central nervous system myelin maintenance(GO:0032286) |
| 0.0 | 0.0 | GO:0090239 | regulation of histone H4 acetylation(GO:0090239) |
| 0.0 | 0.0 | GO:0032754 | positive regulation of interleukin-5 production(GO:0032754) |
| 0.0 | 0.2 | GO:0010265 | SCF complex assembly(GO:0010265) |
| 0.0 | 0.0 | GO:2001242 | regulation of intrinsic apoptotic signaling pathway(GO:2001242) |
| 0.0 | 0.0 | GO:0070309 | lens fiber cell morphogenesis(GO:0070309) |
| 0.0 | 0.5 | GO:0010824 | regulation of centrosome duplication(GO:0010824) |
| 0.0 | 0.1 | GO:0019747 | regulation of isoprenoid metabolic process(GO:0019747) |
| 0.0 | 0.0 | GO:0030423 | targeting of mRNA for destruction involved in RNA interference(GO:0030423) |
| 0.0 | 0.0 | GO:0098909 | regulation of cardiac muscle cell action potential involved in regulation of contraction(GO:0098909) |
| 0.0 | 0.0 | GO:0016080 | synaptic vesicle targeting(GO:0016080) |
| 0.0 | 0.0 | GO:0031937 | positive regulation of chromatin silencing(GO:0031937) |
| 0.0 | 0.0 | GO:0006363 | termination of RNA polymerase I transcription(GO:0006363) |
| 0.0 | 0.0 | GO:2000051 | negative regulation of non-canonical Wnt signaling pathway(GO:2000051) |
| 0.0 | 0.0 | GO:1900222 | negative regulation of beta-amyloid clearance(GO:1900222) |
| 0.0 | 0.5 | GO:0000462 | maturation of SSU-rRNA from tricistronic rRNA transcript (SSU-rRNA, 5.8S rRNA, LSU-rRNA)(GO:0000462) |
| 0.0 | 0.2 | GO:0043248 | proteasome assembly(GO:0043248) |
| 0.0 | 0.1 | GO:1900246 | positive regulation of RIG-I signaling pathway(GO:1900246) |
| 0.0 | 0.2 | GO:0006188 | IMP biosynthetic process(GO:0006188) |
| 0.0 | 0.1 | GO:0048820 | hair follicle maturation(GO:0048820) |
| 0.0 | 0.2 | GO:1902412 | regulation of mitotic cytokinesis(GO:1902412) |
| 0.0 | 0.2 | GO:0051292 | nuclear pore complex assembly(GO:0051292) |
| 0.0 | 2.2 | GO:0006415 | translational termination(GO:0006415) |
| 0.0 | 0.1 | GO:0090219 | negative regulation of lipid kinase activity(GO:0090219) |
| 0.0 | 0.2 | GO:0030174 | regulation of DNA-dependent DNA replication initiation(GO:0030174) |
| 0.0 | 0.1 | GO:0042475 | odontogenesis of dentin-containing tooth(GO:0042475) |
| 0.0 | 0.1 | GO:0060005 | vestibular reflex(GO:0060005) |
| 0.0 | 0.1 | GO:0002091 | negative regulation of receptor internalization(GO:0002091) |
| 0.0 | 0.2 | GO:0031053 | primary miRNA processing(GO:0031053) |
| 0.0 | 0.1 | GO:0060290 | transdifferentiation(GO:0060290) |
| 0.0 | 0.3 | GO:1901642 | nucleoside transmembrane transport(GO:1901642) |
| 0.0 | 0.2 | GO:0035246 | peptidyl-arginine N-methylation(GO:0035246) |
| 0.0 | 0.0 | GO:0097011 | cellular response to granulocyte macrophage colony-stimulating factor stimulus(GO:0097011) response to granulocyte macrophage colony-stimulating factor(GO:0097012) |
| 0.0 | 0.0 | GO:1903093 | negative regulation of protein deubiquitination(GO:0090086) regulation of protein K48-linked deubiquitination(GO:1903093) negative regulation of protein K48-linked deubiquitination(GO:1903094) negative regulation of ubiquitin-specific protease activity(GO:2000157) |
| 0.0 | 0.0 | GO:0070839 | divalent metal ion export(GO:0070839) |
| 0.0 | 0.1 | GO:0060363 | cranial suture morphogenesis(GO:0060363) |
| 0.0 | 0.1 | GO:0090073 | positive regulation of protein homodimerization activity(GO:0090073) |
| 0.0 | 0.1 | GO:1990167 | protein K27-linked deubiquitination(GO:1990167) |
| 0.0 | 0.0 | GO:0086091 | regulation of heart rate by cardiac conduction(GO:0086091) |
| 0.0 | 0.1 | GO:0007060 | male meiosis chromosome segregation(GO:0007060) |
| 0.0 | 0.0 | GO:0006105 | succinate metabolic process(GO:0006105) |
| 0.0 | 0.1 | GO:0006999 | nuclear pore organization(GO:0006999) |
| 0.0 | 0.0 | GO:0046015 | regulation of transcription by glucose(GO:0046015) |
| 0.0 | 0.2 | GO:0006564 | L-serine biosynthetic process(GO:0006564) |
| 0.0 | 0.0 | GO:0019240 | citrulline biosynthetic process(GO:0019240) |
| 0.0 | 0.0 | GO:0003360 | brainstem development(GO:0003360) |
| 0.0 | 0.0 | GO:1900016 | negative regulation of cytokine production involved in inflammatory response(GO:1900016) |
| 0.0 | 0.2 | GO:0016601 | Rac protein signal transduction(GO:0016601) |
| 0.0 | 0.3 | GO:2000052 | positive regulation of non-canonical Wnt signaling pathway(GO:2000052) |
| 0.0 | 0.0 | GO:0010650 | positive regulation of cell communication by electrical coupling(GO:0010650) |
| 0.0 | 0.3 | GO:0006309 | apoptotic DNA fragmentation(GO:0006309) |
| 0.0 | 0.0 | GO:1904925 | positive regulation of macromitophagy(GO:1901526) positive regulation of mitophagy in response to mitochondrial depolarization(GO:1904925) |
| 0.0 | 0.0 | GO:0048205 | COPI-coated vesicle budding(GO:0035964) Golgi transport vesicle coating(GO:0048200) COPI coating of Golgi vesicle(GO:0048205) |
| 0.0 | 0.0 | GO:0002573 | myeloid leukocyte differentiation(GO:0002573) |
| 0.0 | 0.0 | GO:0036112 | medium-chain fatty-acyl-CoA metabolic process(GO:0036112) |
| 0.0 | 0.0 | GO:0050893 | sensory processing(GO:0050893) |
| 0.0 | 0.0 | GO:1904636 | response to ionomycin(GO:1904636) cellular response to ionomycin(GO:1904637) |
| 0.0 | 0.2 | GO:1903830 | magnesium ion transmembrane transport(GO:1903830) |
| 0.0 | 0.2 | GO:0050812 | regulation of acyl-CoA biosynthetic process(GO:0050812) |
| 0.0 | 0.1 | GO:0006828 | manganese ion transport(GO:0006828) |
| 0.0 | 0.0 | GO:2000271 | positive regulation of fibroblast apoptotic process(GO:2000271) |
| 0.0 | 0.1 | GO:0034379 | very-low-density lipoprotein particle assembly(GO:0034379) |
| 0.0 | 0.0 | GO:0006680 | glucosylceramide catabolic process(GO:0006680) |
| 0.0 | 0.1 | GO:0001865 | NK T cell differentiation(GO:0001865) |
| 0.0 | 0.1 | GO:0032483 | regulation of Rab protein signal transduction(GO:0032483) |
| 0.0 | 0.4 | GO:0034629 | cellular protein complex localization(GO:0034629) |
| 0.0 | 0.0 | GO:0008038 | neuron recognition(GO:0008038) |
| 0.0 | 0.2 | GO:0031268 | pseudopodium organization(GO:0031268) |
| 0.0 | 0.0 | GO:0060669 | embryonic placenta morphogenesis(GO:0060669) |
| 0.0 | 0.1 | GO:0071163 | DNA replication preinitiation complex assembly(GO:0071163) |
| 0.0 | 0.1 | GO:1904029 | regulation of cyclin-dependent protein serine/threonine kinase activity(GO:0000079) regulation of cyclin-dependent protein kinase activity(GO:1904029) |
| 0.0 | 0.1 | GO:0043031 | negative regulation of macrophage activation(GO:0043031) |
| 0.0 | 0.1 | GO:0008295 | spermidine biosynthetic process(GO:0008295) |
| 0.0 | 0.1 | GO:0032461 | positive regulation of protein oligomerization(GO:0032461) |
| 0.0 | 0.0 | GO:0009441 | glycolate metabolic process(GO:0009441) |
| 0.0 | 0.0 | GO:0070407 | oxidation-dependent protein catabolic process(GO:0070407) |
| 0.0 | 0.3 | GO:0048934 | peripheral nervous system neuron differentiation(GO:0048934) peripheral nervous system neuron development(GO:0048935) |
| 0.0 | 0.0 | GO:0014038 | regulation of Schwann cell differentiation(GO:0014038) |
| 0.0 | 0.2 | GO:0007205 | protein kinase C-activating G-protein coupled receptor signaling pathway(GO:0007205) |
| 0.0 | 0.0 | GO:0032846 | positive regulation of homeostatic process(GO:0032846) |
| 0.0 | 0.1 | GO:1900027 | regulation of ruffle assembly(GO:1900027) |
| 0.0 | 0.2 | GO:0030490 | maturation of SSU-rRNA(GO:0030490) |
| 0.0 | 0.0 | GO:1904742 | regulation of telomeric DNA binding(GO:1904742) |
| 0.0 | 0.0 | GO:0001920 | negative regulation of receptor recycling(GO:0001920) |
| 0.0 | 0.1 | GO:0021695 | cerebellar cortex development(GO:0021695) |
| 0.0 | 0.1 | GO:0071344 | diphosphate metabolic process(GO:0071344) |
| 0.0 | 0.1 | GO:0006982 | response to lipid hydroperoxide(GO:0006982) |
| 0.0 | 0.0 | GO:0018013 | N-terminal protein amino acid methylation(GO:0006480) N-terminal peptidyl-alanine methylation(GO:0018011) N-terminal peptidyl-alanine trimethylation(GO:0018012) N-terminal peptidyl-glycine methylation(GO:0018013) N-terminal peptidyl-proline dimethylation(GO:0018016) peptidyl-alanine modification(GO:0018194) N-terminal peptidyl-proline methylation(GO:0035568) N-terminal peptidyl-serine methylation(GO:0035570) N-terminal peptidyl-serine dimethylation(GO:0035572) N-terminal peptidyl-serine trimethylation(GO:0035573) |
| 0.0 | 0.1 | GO:0002378 | immunoglobulin biosynthetic process(GO:0002378) protein O-linked glycosylation via serine(GO:0018242) |
| 0.0 | 0.0 | GO:0071352 | cellular response to interleukin-2(GO:0071352) |
| 0.0 | 0.1 | GO:0015671 | oxygen transport(GO:0015671) |
| 0.0 | 0.1 | GO:2001206 | positive regulation of osteoclast development(GO:2001206) |
| 0.0 | 0.2 | GO:0033617 | mitochondrial respiratory chain complex IV assembly(GO:0033617) mitochondrial respiratory chain complex IV biogenesis(GO:0097034) |
| 0.0 | 0.1 | GO:0045950 | negative regulation of mitotic recombination(GO:0045950) |
| 0.0 | 0.1 | GO:0036500 | ATF6-mediated unfolded protein response(GO:0036500) |
| 0.0 | 0.3 | GO:0030970 | retrograde protein transport, ER to cytosol(GO:0030970) |
| 0.0 | 0.0 | GO:1903587 | regulation of blood vessel endothelial cell proliferation involved in sprouting angiogenesis(GO:1903587) |
| 0.0 | 0.0 | GO:1903595 | positive regulation of histamine secretion by mast cell(GO:1903595) |
| 0.0 | 0.1 | GO:1904903 | ESCRT complex disassembly(GO:1904896) ESCRT III complex disassembly(GO:1904903) |
| 0.0 | 0.3 | GO:0030488 | tRNA methylation(GO:0030488) |
| 0.0 | 0.0 | GO:0044205 | 'de novo' UMP biosynthetic process(GO:0044205) |
| 0.0 | 0.3 | GO:0048268 | clathrin coat assembly(GO:0048268) |
| 0.0 | 0.0 | GO:0032481 | positive regulation of type I interferon production(GO:0032481) |
| 0.0 | 0.0 | GO:1901621 | negative regulation of smoothened signaling pathway involved in dorsal/ventral neural tube patterning(GO:1901621) |
| 0.0 | 0.0 | GO:0032927 | positive regulation of activin receptor signaling pathway(GO:0032927) |
| 0.0 | 0.2 | GO:0015871 | choline transport(GO:0015871) |
| 0.0 | 0.0 | GO:0046208 | spermine catabolic process(GO:0046208) |
| 0.0 | 0.1 | GO:0060123 | regulation of growth hormone secretion(GO:0060123) |
| 0.0 | 0.0 | GO:0031063 | regulation of histone deacetylation(GO:0031063) |
| 0.0 | 0.1 | GO:0043634 | polyadenylation-dependent RNA catabolic process(GO:0043633) polyadenylation-dependent ncRNA catabolic process(GO:0043634) |
| 0.0 | 0.1 | GO:0051725 | protein de-ADP-ribosylation(GO:0051725) |
| 0.0 | 0.0 | GO:0070507 | regulation of microtubule cytoskeleton organization(GO:0070507) |
| 0.0 | 0.0 | GO:0032802 | low-density lipoprotein particle receptor catabolic process(GO:0032802) |
| 0.0 | 0.0 | GO:0045898 | regulation of RNA polymerase II transcriptional preinitiation complex assembly(GO:0045898) |
| 0.0 | 0.3 | GO:0031100 | organ regeneration(GO:0031100) |
| 0.0 | 0.1 | GO:0043984 | histone H4-K16 acetylation(GO:0043984) |
| 0.0 | 0.0 | GO:1903553 | positive regulation of extracellular exosome assembly(GO:1903553) |
| 0.0 | 0.1 | GO:0002675 | positive regulation of acute inflammatory response(GO:0002675) |
| 0.0 | 0.0 | GO:0060081 | membrane hyperpolarization(GO:0060081) |
| 0.0 | 0.0 | GO:0032482 | Rab protein signal transduction(GO:0032482) |
| 0.0 | 0.0 | GO:0046203 | spermidine catabolic process(GO:0046203) |
| 0.0 | 0.0 | GO:0051931 | regulation of sensory perception of pain(GO:0051930) regulation of sensory perception(GO:0051931) |
| 0.0 | 1.2 | GO:0006614 | SRP-dependent cotranslational protein targeting to membrane(GO:0006614) |
| 0.0 | 0.1 | GO:0006122 | mitochondrial electron transport, ubiquinol to cytochrome c(GO:0006122) |
| 0.0 | 0.1 | GO:1902229 | regulation of intrinsic apoptotic signaling pathway in response to DNA damage(GO:1902229) negative regulation of intrinsic apoptotic signaling pathway in response to DNA damage(GO:1902230) |
| 0.0 | 0.0 | GO:0007616 | long-term memory(GO:0007616) |
| 0.0 | 0.1 | GO:2000767 | positive regulation of cytoplasmic translation(GO:2000767) |
| 0.0 | 0.0 | GO:0000912 | assembly of actomyosin apparatus involved in cytokinesis(GO:0000912) actomyosin contractile ring assembly(GO:0000915) actomyosin contractile ring organization(GO:0044837) |
| 0.0 | 0.0 | GO:0001994 | norepinephrine-epinephrine vasoconstriction involved in regulation of systemic arterial blood pressure(GO:0001994) |
Gene overrepresentation in cellular_component category:
| Log-likelihood per target | Total log-likelihood | Term | Description |
|---|---|---|---|
| 2.9 | 20.4 | GO:0097209 | epidermal lamellar body(GO:0097209) |
| 1.3 | 10.3 | GO:0005610 | laminin-5 complex(GO:0005610) |
| 1.2 | 3.5 | GO:0043512 | inhibin complex(GO:0043511) inhibin A complex(GO:0043512) |
| 0.9 | 0.9 | GO:0030315 | T-tubule(GO:0030315) |
| 0.7 | 8.8 | GO:0045179 | apical cortex(GO:0045179) |
| 0.6 | 14.3 | GO:0005861 | troponin complex(GO:0005861) |
| 0.5 | 2.1 | GO:1990796 | photoreceptor cell terminal bouton(GO:1990796) |
| 0.5 | 3.0 | GO:0097129 | cyclin D2-CDK4 complex(GO:0097129) |
| 0.5 | 3.8 | GO:0070554 | synaptobrevin 2-SNAP-25-syntaxin-3-complexin complex(GO:0070554) |
| 0.5 | 1.4 | GO:0017109 | glutamate-cysteine ligase complex(GO:0017109) |
| 0.5 | 4.2 | GO:0061689 | tricellular tight junction(GO:0061689) |
| 0.4 | 15.2 | GO:0016327 | apicolateral plasma membrane(GO:0016327) |
| 0.4 | 1.3 | GO:1990622 | CHOP-ATF3 complex(GO:1990622) |
| 0.4 | 1.7 | GO:0005600 | collagen type XIII trimer(GO:0005600) transmembrane collagen trimer(GO:0030936) |
| 0.4 | 1.3 | GO:0071065 | alpha9-beta1 integrin-vascular cell adhesion molecule-1 complex(GO:0071065) |
| 0.4 | 1.7 | GO:0071595 | Nem1-Spo7 phosphatase complex(GO:0071595) |
| 0.4 | 4.5 | GO:0097197 | tetraspanin-enriched microdomain(GO:0097197) |
| 0.4 | 0.8 | GO:0017053 | transcriptional repressor complex(GO:0017053) |
| 0.4 | 1.2 | GO:0034678 | integrin alpha8-beta1 complex(GO:0034678) |
| 0.4 | 10.4 | GO:0034706 | sodium channel complex(GO:0034706) |
| 0.4 | 2.2 | GO:0072558 | NLRP1 inflammasome complex(GO:0072558) |
| 0.4 | 4.0 | GO:0046581 | intercellular canaliculus(GO:0046581) |
| 0.4 | 1.1 | GO:0034686 | integrin alphav-beta8 complex(GO:0034686) |
| 0.3 | 10.7 | GO:0030057 | desmosome(GO:0030057) |
| 0.3 | 1.4 | GO:1990031 | pinceau fiber(GO:1990031) |
| 0.3 | 4.7 | GO:0033010 | paranodal junction(GO:0033010) |
| 0.3 | 1.0 | GO:0072534 | perineuronal net(GO:0072534) |
| 0.3 | 1.5 | GO:0034666 | integrin alpha2-beta1 complex(GO:0034666) |
| 0.3 | 7.2 | GO:0005922 | connexon complex(GO:0005922) |
| 0.3 | 0.3 | GO:0042575 | DNA polymerase complex(GO:0042575) |
| 0.3 | 1.1 | GO:0071149 | TEAD-2-YAP complex(GO:0071149) |
| 0.3 | 0.5 | GO:0005889 | hydrogen:potassium-exchanging ATPase complex(GO:0005889) |
| 0.3 | 1.1 | GO:0032010 | phagolysosome(GO:0032010) |
| 0.3 | 3.3 | GO:0030056 | hemidesmosome(GO:0030056) |
| 0.3 | 9.5 | GO:0001533 | cornified envelope(GO:0001533) |
| 0.2 | 0.7 | GO:0005607 | laminin-2 complex(GO:0005607) |
| 0.2 | 2.1 | GO:0044194 | cytolytic granule(GO:0044194) |
| 0.2 | 1.9 | GO:0098560 | cytoplasmic side of late endosome membrane(GO:0098560) |
| 0.2 | 0.7 | GO:0030849 | autosome(GO:0030849) |
| 0.2 | 1.1 | GO:0044393 | microspike(GO:0044393) |
| 0.2 | 0.9 | GO:0036502 | Derlin-1-VIMP complex(GO:0036502) |
| 0.2 | 0.7 | GO:1990032 | parallel fiber(GO:1990032) |
| 0.2 | 0.9 | GO:0044611 | nuclear pore inner ring(GO:0044611) |
| 0.2 | 0.7 | GO:0097489 | multivesicular body, internal vesicle lumen(GO:0097489) |
| 0.2 | 0.6 | GO:0034365 | discoidal high-density lipoprotein particle(GO:0034365) |
| 0.2 | 2.6 | GO:0033256 | I-kappaB/NF-kappaB complex(GO:0033256) |
| 0.2 | 0.8 | GO:0032937 | SREBP-SCAP-Insig complex(GO:0032937) |
| 0.2 | 4.4 | GO:0031095 | platelet dense tubular network membrane(GO:0031095) |
| 0.2 | 2.3 | GO:0042612 | MHC class I protein complex(GO:0042612) |
| 0.2 | 1.4 | GO:0097208 | alveolar lamellar body(GO:0097208) |
| 0.2 | 5.4 | GO:0044295 | axonal growth cone(GO:0044295) |
| 0.2 | 0.6 | GO:1990851 | Wnt-Frizzled-LRP5/6 complex(GO:1990851) |
| 0.2 | 2.2 | GO:0033017 | sarcoplasmic reticulum membrane(GO:0033017) |
| 0.2 | 1.4 | GO:0070695 | FHF complex(GO:0070695) |
| 0.2 | 0.2 | GO:0060201 | clathrin-sculpted acetylcholine transport vesicle(GO:0060200) clathrin-sculpted acetylcholine transport vesicle membrane(GO:0060201) |
| 0.2 | 0.8 | GO:0031256 | leading edge membrane(GO:0031256) |
| 0.2 | 2.8 | GO:0035253 | ciliary rootlet(GO:0035253) |
| 0.2 | 0.3 | GO:0098574 | cytoplasmic side of lysosomal membrane(GO:0098574) |
| 0.2 | 0.7 | GO:0000839 | Hrd1p ubiquitin ligase ERAD-L complex(GO:0000839) |
| 0.2 | 1.4 | GO:0071438 | invadopodium membrane(GO:0071438) |
| 0.2 | 0.3 | GO:0034366 | spherical high-density lipoprotein particle(GO:0034366) |
| 0.2 | 1.3 | GO:0005672 | transcription factor TFIIA complex(GO:0005672) |
| 0.2 | 0.5 | GO:0034676 | integrin alpha6-beta4 complex(GO:0034676) |
| 0.2 | 1.2 | GO:1990452 | Parkin-FBXW7-Cul1 ubiquitin ligase complex(GO:1990452) |
| 0.2 | 2.9 | GO:0060077 | inhibitory synapse(GO:0060077) |
| 0.2 | 19.2 | GO:0070821 | tertiary granule membrane(GO:0070821) |
| 0.2 | 3.9 | GO:0071682 | endocytic vesicle lumen(GO:0071682) |
| 0.2 | 1.1 | GO:0042824 | MHC class I peptide loading complex(GO:0042824) TAP complex(GO:0042825) |
| 0.1 | 1.0 | GO:0019815 | B cell receptor complex(GO:0019815) |
| 0.1 | 0.4 | GO:0043198 | dendritic shaft(GO:0043198) |
| 0.1 | 0.1 | GO:0030427 | site of polarized growth(GO:0030427) |
| 0.1 | 0.4 | GO:0097444 | spine apparatus(GO:0097444) |
| 0.1 | 1.6 | GO:0045252 | oxoglutarate dehydrogenase complex(GO:0045252) |
| 0.1 | 1.1 | GO:0036057 | filtration diaphragm(GO:0036056) slit diaphragm(GO:0036057) |
| 0.1 | 1.2 | GO:0030314 | junctional membrane complex(GO:0030314) |
| 0.1 | 0.1 | GO:0031300 | intrinsic component of organelle membrane(GO:0031300) |
| 0.1 | 3.1 | GO:0031932 | TORC2 complex(GO:0031932) |
| 0.1 | 0.8 | GO:0035692 | macrophage migration inhibitory factor receptor complex(GO:0035692) |
| 0.1 | 0.5 | GO:0036338 | viral envelope(GO:0019031) viral membrane(GO:0036338) |
| 0.1 | 1.7 | GO:0032039 | integrator complex(GO:0032039) |
| 0.1 | 1.2 | GO:0016012 | sarcoglycan complex(GO:0016012) |
| 0.1 | 10.3 | GO:0016328 | lateral plasma membrane(GO:0016328) |
| 0.1 | 2.5 | GO:0030136 | clathrin-coated vesicle(GO:0030136) |
| 0.1 | 0.1 | GO:0031224 | intrinsic component of membrane(GO:0031224) |
| 0.1 | 0.1 | GO:1990667 | PCSK9-AnxA2 complex(GO:1990667) |
| 0.1 | 2.6 | GO:0042613 | MHC class II protein complex(GO:0042613) |
| 0.1 | 0.3 | GO:0060199 | clathrin-sculpted glutamate transport vesicle(GO:0060199) clathrin-sculpted glutamate transport vesicle membrane(GO:0060203) |
| 0.1 | 4.3 | GO:0031092 | platelet alpha granule membrane(GO:0031092) |
| 0.1 | 11.1 | GO:0033116 | endoplasmic reticulum-Golgi intermediate compartment membrane(GO:0033116) |
| 0.1 | 0.5 | GO:0071664 | catenin-TCF7L2 complex(GO:0071664) |
| 0.1 | 0.5 | GO:0016533 | cyclin-dependent protein kinase 5 holoenzyme complex(GO:0016533) |
| 0.1 | 2.8 | GO:0001891 | phagocytic cup(GO:0001891) |
| 0.1 | 0.4 | GO:0042720 | mitochondrial inner membrane peptidase complex(GO:0042720) |
| 0.1 | 0.4 | GO:0002139 | stereocilia coupling link(GO:0002139) |
| 0.1 | 0.1 | GO:0097542 | ciliary tip(GO:0097542) |
| 0.1 | 1.3 | GO:0031362 | anchored component of external side of plasma membrane(GO:0031362) |
| 0.1 | 0.2 | GO:0005667 | transcription factor complex(GO:0005667) |
| 0.1 | 0.1 | GO:0019866 | organelle inner membrane(GO:0019866) |
| 0.1 | 0.6 | GO:0005945 | 6-phosphofructokinase complex(GO:0005945) |
| 0.1 | 0.2 | GO:1990357 | terminal web(GO:1990357) |
| 0.1 | 1.2 | GO:0042105 | alpha-beta T cell receptor complex(GO:0042105) |
| 0.1 | 0.1 | GO:0097060 | synaptic membrane(GO:0097060) |
| 0.1 | 0.1 | GO:0002178 | palmitoyltransferase complex(GO:0002178) |
| 0.1 | 0.5 | GO:0001405 | presequence translocase-associated import motor(GO:0001405) |
| 0.1 | 0.4 | GO:0097179 | protease inhibitor complex(GO:0097179) |
| 0.1 | 0.4 | GO:0031905 | early endosome lumen(GO:0031905) |
| 0.1 | 3.3 | GO:0090545 | NuRD complex(GO:0016581) CHD-type complex(GO:0090545) |
| 0.1 | 12.2 | GO:0005913 | cell-cell adherens junction(GO:0005913) |
| 0.1 | 0.3 | GO:0005900 | oncostatin-M receptor complex(GO:0005900) |
| 0.1 | 0.5 | GO:0032449 | CBM complex(GO:0032449) |
| 0.1 | 0.9 | GO:0033269 | internode region of axon(GO:0033269) |
| 0.1 | 0.6 | GO:0034388 | Pwp2p-containing subcomplex of 90S preribosome(GO:0034388) |
| 0.1 | 0.7 | GO:0030121 | AP-1 adaptor complex(GO:0030121) |
| 0.1 | 2.5 | GO:0005639 | integral component of nuclear inner membrane(GO:0005639) intrinsic component of nuclear inner membrane(GO:0031229) |
| 0.1 | 0.5 | GO:0009368 | endopeptidase Clp complex(GO:0009368) |
| 0.1 | 0.2 | GO:0000939 | condensed chromosome inner kinetochore(GO:0000939) |
| 0.1 | 0.5 | GO:0097136 | Bcl-2 family protein complex(GO:0097136) |
| 0.1 | 0.2 | GO:0042585 | germinal vesicle(GO:0042585) |
| 0.1 | 0.9 | GO:0034709 | methylosome(GO:0034709) |
| 0.1 | 0.5 | GO:0042629 | mast cell granule(GO:0042629) |
| 0.1 | 0.4 | GO:0005687 | U4 snRNP(GO:0005687) |
| 0.1 | 0.3 | GO:0038039 | G-protein coupled receptor heterodimeric complex(GO:0038039) |
| 0.1 | 0.4 | GO:0031313 | extrinsic component of endosome membrane(GO:0031313) |
| 0.1 | 0.7 | GO:0000120 | RNA polymerase I transcription factor complex(GO:0000120) |
| 0.1 | 0.1 | GO:0005689 | U12-type spliceosomal complex(GO:0005689) |
| 0.1 | 0.3 | GO:0032009 | early phagosome(GO:0032009) |
| 0.1 | 0.9 | GO:0072687 | meiotic spindle(GO:0072687) |
| 0.1 | 0.5 | GO:1902937 | inward rectifier potassium channel complex(GO:1902937) |
| 0.1 | 2.6 | GO:0046658 | anchored component of plasma membrane(GO:0046658) |
| 0.1 | 1.3 | GO:0002199 | zona pellucida receptor complex(GO:0002199) |
| 0.1 | 0.2 | GO:0043679 | axon terminus(GO:0043679) |
| 0.1 | 0.4 | GO:0097123 | cyclin A1-CDK2 complex(GO:0097123) |
| 0.1 | 0.1 | GO:0044306 | neuron projection terminus(GO:0044306) |
| 0.1 | 1.0 | GO:0005641 | nuclear envelope lumen(GO:0005641) |
| 0.1 | 0.3 | GO:0044309 | neuron spine(GO:0044309) |
| 0.1 | 0.4 | GO:0044354 | pinosome(GO:0044352) macropinosome(GO:0044354) |
| 0.1 | 0.1 | GO:0097227 | sperm annulus(GO:0097227) |
| 0.1 | 0.4 | GO:0042599 | lamellar body(GO:0042599) |
| 0.1 | 0.2 | GO:0097443 | sorting endosome(GO:0097443) |
| 0.1 | 0.5 | GO:0070022 | transforming growth factor beta receptor homodimeric complex(GO:0070022) |
| 0.1 | 2.6 | GO:0031231 | integral component of peroxisomal membrane(GO:0005779) intrinsic component of peroxisomal membrane(GO:0031231) |
| 0.1 | 0.2 | GO:0016013 | syntrophin complex(GO:0016013) |
| 0.1 | 0.4 | GO:0005927 | muscle tendon junction(GO:0005927) |
| 0.1 | 3.2 | GO:0030673 | axolemma(GO:0030673) |
| 0.1 | 0.6 | GO:0033018 | sarcoplasmic reticulum lumen(GO:0033018) |
| 0.1 | 0.2 | GO:0044609 | DBIRD complex(GO:0044609) |
| 0.1 | 0.2 | GO:0031074 | nucleocytoplasmic shuttling complex(GO:0031074) |
| 0.1 | 0.2 | GO:0034657 | GID complex(GO:0034657) |
| 0.1 | 0.2 | GO:0098589 | membrane region(GO:0098589) |
| 0.1 | 0.3 | GO:0008282 | ATP-sensitive potassium channel complex(GO:0008282) |
| 0.1 | 0.2 | GO:0098855 | HCN channel complex(GO:0098855) |
| 0.1 | 0.5 | GO:0042272 | nuclear RNA export factor complex(GO:0042272) |
| 0.1 | 1.5 | GO:0005736 | DNA-directed RNA polymerase I complex(GO:0005736) |
| 0.1 | 0.2 | GO:0005960 | glycine cleavage complex(GO:0005960) |
| 0.1 | 0.3 | GO:0099738 | cell cortex region(GO:0099738) |
| 0.1 | 0.5 | GO:0070847 | core mediator complex(GO:0070847) |
| 0.1 | 0.6 | GO:0016589 | NURF complex(GO:0016589) |
| 0.1 | 0.9 | GO:0044798 | nuclear transcription factor complex(GO:0044798) |
| 0.1 | 0.1 | GO:0034687 | integrin alphaL-beta2 complex(GO:0034687) |
| 0.1 | 1.0 | GO:0001931 | uropod(GO:0001931) cell trailing edge(GO:0031254) |
| 0.1 | 0.2 | GO:0031379 | RNA-directed RNA polymerase complex(GO:0031379) |
| 0.1 | 0.9 | GO:0000506 | glycosylphosphatidylinositol-N-acetylglucosaminyltransferase (GPI-GnT) complex(GO:0000506) |
| 0.1 | 7.5 | GO:0035578 | azurophil granule lumen(GO:0035578) |
| 0.1 | 0.3 | GO:0005850 | eukaryotic translation initiation factor 2 complex(GO:0005850) |
| 0.1 | 0.1 | GO:0043159 | acrosomal matrix(GO:0043159) |
| 0.1 | 0.5 | GO:0005771 | multivesicular body(GO:0005771) |
| 0.1 | 0.1 | GO:0055087 | Ski complex(GO:0055087) |
| 0.1 | 1.4 | GO:0031143 | pseudopodium(GO:0031143) |
| 0.1 | 0.9 | GO:0031225 | anchored component of membrane(GO:0031225) |
| 0.1 | 0.1 | GO:0030689 | Noc complex(GO:0030689) |
| 0.1 | 0.4 | GO:0070436 | Grb2-EGFR complex(GO:0070436) |
| 0.1 | 2.5 | GO:0005903 | brush border(GO:0005903) |
| 0.1 | 0.3 | GO:0000938 | GARP complex(GO:0000938) |
| 0.1 | 1.0 | GO:0031528 | microvillus membrane(GO:0031528) |
| 0.1 | 0.7 | GO:0072559 | NLRP3 inflammasome complex(GO:0072559) |
| 0.1 | 0.4 | GO:0071012 | catalytic step 1 spliceosome(GO:0071012) |
| 0.1 | 0.4 | GO:0070545 | PeBoW complex(GO:0070545) |
| 0.1 | 0.3 | GO:0000221 | vacuolar proton-transporting V-type ATPase, V1 domain(GO:0000221) |
| 0.1 | 0.2 | GO:0036156 | inner dynein arm(GO:0036156) |
| 0.1 | 1.1 | GO:0005845 | mRNA cap binding complex(GO:0005845) RNA cap binding complex(GO:0034518) |
| 0.1 | 0.2 | GO:0000814 | ESCRT II complex(GO:0000814) |
| 0.1 | 0.5 | GO:0005642 | annulate lamellae(GO:0005642) |
| 0.1 | 0.3 | GO:0098837 | postsynaptic recycling endosome(GO:0098837) postsynaptic endosome(GO:0098845) |
| 0.1 | 0.6 | GO:0042588 | zymogen granule(GO:0042588) |
| 0.1 | 0.1 | GO:0020003 | symbiont-containing vacuole(GO:0020003) symbiont-containing vacuole membrane(GO:0020005) |
| 0.1 | 0.2 | GO:1990742 | microvesicle(GO:1990742) |
| 0.1 | 0.7 | GO:0034364 | high-density lipoprotein particle(GO:0034364) |
| 0.1 | 0.4 | GO:1990712 | HFE-transferrin receptor complex(GO:1990712) |
| 0.1 | 0.3 | GO:0012510 | trans-Golgi network transport vesicle membrane(GO:0012510) |
| 0.1 | 0.2 | GO:0000438 | core TFIIH complex portion of holo TFIIH complex(GO:0000438) |
| 0.1 | 0.6 | GO:0097524 | sperm plasma membrane(GO:0097524) |
| 0.1 | 0.2 | GO:0097431 | mitotic spindle pole(GO:0097431) |
| 0.1 | 0.2 | GO:0019008 | molybdopterin synthase complex(GO:0019008) |
| 0.1 | 0.4 | GO:0042406 | extrinsic component of endoplasmic reticulum membrane(GO:0042406) |
| 0.1 | 0.6 | GO:1990454 | L-type voltage-gated calcium channel complex(GO:1990454) |
| 0.1 | 0.1 | GO:0070557 | PCNA-p21 complex(GO:0070557) |
| 0.1 | 0.2 | GO:1990037 | Lewy body core(GO:1990037) |
| 0.1 | 15.0 | GO:0016323 | basolateral plasma membrane(GO:0016323) |
| 0.1 | 0.2 | GO:0070762 | nuclear pore transmembrane ring(GO:0070762) |
| 0.1 | 0.2 | GO:0005879 | axonemal microtubule(GO:0005879) |
| 0.1 | 0.2 | GO:0070876 | SOSS complex(GO:0070876) |
| 0.1 | 0.5 | GO:0035577 | azurophil granule membrane(GO:0035577) |
| 0.1 | 0.3 | GO:0031428 | box C/D snoRNP complex(GO:0031428) |
| 0.0 | 0.4 | GO:0030877 | beta-catenin destruction complex(GO:0030877) |
| 0.0 | 0.4 | GO:0031415 | NatA complex(GO:0031415) |
| 0.0 | 1.7 | GO:0005763 | organellar small ribosomal subunit(GO:0000314) mitochondrial small ribosomal subunit(GO:0005763) |
| 0.0 | 0.1 | GO:1990316 | ATG1/ULK1 kinase complex(GO:1990316) |
| 0.0 | 0.2 | GO:0017102 | methionyl glutamyl tRNA synthetase complex(GO:0017102) |
| 0.0 | 0.1 | GO:0018444 | translation release factor complex(GO:0018444) |
| 0.0 | 0.5 | GO:0005655 | nucleolar ribonuclease P complex(GO:0005655) |
| 0.0 | 3.6 | GO:0045095 | keratin filament(GO:0045095) |
| 0.0 | 0.2 | GO:0031466 | Cul5-RING ubiquitin ligase complex(GO:0031466) |
| 0.0 | 0.3 | GO:0035976 | AP1 complex(GO:0035976) |
| 0.0 | 0.1 | GO:1990909 | Wnt signalosome(GO:1990909) |
| 0.0 | 0.0 | GO:0000444 | MIS12/MIND type complex(GO:0000444) |
| 0.0 | 1.4 | GO:0048471 | perinuclear region of cytoplasm(GO:0048471) |
| 0.0 | 1.6 | GO:0005685 | U1 snRNP(GO:0005685) |
| 0.0 | 0.1 | GO:0031933 | telomeric heterochromatin(GO:0031933) |
| 0.0 | 0.3 | GO:1990393 | 3M complex(GO:1990393) |
| 0.0 | 0.2 | GO:0031417 | NatC complex(GO:0031417) |
| 0.0 | 0.2 | GO:0014802 | terminal cisterna(GO:0014802) |
| 0.0 | 0.4 | GO:0099568 | cytoplasmic region(GO:0099568) |
| 0.0 | 0.0 | GO:0097512 | cardiac myofibril(GO:0097512) |
| 0.0 | 0.2 | GO:0005640 | nuclear outer membrane(GO:0005640) |
| 0.0 | 0.2 | GO:0030061 | mitochondrial crista(GO:0030061) |
| 0.0 | 2.0 | GO:0030131 | clathrin adaptor complex(GO:0030131) |
| 0.0 | 0.2 | GO:0032279 | asymmetric synapse(GO:0032279) |
| 0.0 | 0.7 | GO:0030684 | preribosome(GO:0030684) |
| 0.0 | 0.1 | GO:0002177 | manchette(GO:0002177) |
| 0.0 | 3.0 | GO:0019005 | SCF ubiquitin ligase complex(GO:0019005) |
| 0.0 | 0.9 | GO:0044613 | nuclear pore central transport channel(GO:0044613) |
| 0.0 | 0.1 | GO:0097057 | TRAF2-GSTP1 complex(GO:0097057) |
| 0.0 | 0.3 | GO:0005958 | DNA-dependent protein kinase-DNA ligase 4 complex(GO:0005958) |
| 0.0 | 0.4 | GO:0005744 | mitochondrial inner membrane presequence translocase complex(GO:0005744) |
| 0.0 | 0.0 | GO:0098794 | postsynapse(GO:0098794) |
| 0.0 | 0.7 | GO:0005847 | mRNA cleavage and polyadenylation specificity factor complex(GO:0005847) |
| 0.0 | 0.1 | GO:0032391 | photoreceptor connecting cilium(GO:0032391) |
| 0.0 | 1.8 | GO:0001917 | photoreceptor inner segment(GO:0001917) |
| 0.0 | 0.2 | GO:0070985 | TFIIK complex(GO:0070985) |
| 0.0 | 0.5 | GO:0005577 | fibrinogen complex(GO:0005577) |
| 0.0 | 0.4 | GO:0031390 | Ctf18 RFC-like complex(GO:0031390) |
| 0.0 | 0.2 | GO:0031436 | BRCA1-BARD1 complex(GO:0031436) |
| 0.0 | 0.6 | GO:0071439 | clathrin complex(GO:0071439) |
| 0.0 | 0.6 | GO:0000176 | nuclear exosome (RNase complex)(GO:0000176) |
| 0.0 | 0.5 | GO:0032426 | stereocilium tip(GO:0032426) |
| 0.0 | 0.0 | GO:0002945 | cyclin K-CDK13 complex(GO:0002945) |
| 0.0 | 0.1 | GO:0001534 | radial spoke(GO:0001534) |
| 0.0 | 0.2 | GO:0000214 | tRNA-intron endonuclease complex(GO:0000214) |
| 0.0 | 2.3 | GO:0030173 | integral component of Golgi membrane(GO:0030173) |
| 0.0 | 0.3 | GO:0071541 | eukaryotic translation initiation factor 3 complex, eIF3m(GO:0071541) |
| 0.0 | 0.6 | GO:0016281 | eukaryotic translation initiation factor 4F complex(GO:0016281) |
| 0.0 | 0.4 | GO:0061700 | GATOR2 complex(GO:0061700) |
| 0.0 | 0.4 | GO:0005818 | astral microtubule(GO:0000235) aster(GO:0005818) |
| 0.0 | 0.3 | GO:0008180 | COP9 signalosome(GO:0008180) |
| 0.0 | 0.1 | GO:0034464 | BBSome(GO:0034464) |
| 0.0 | 2.1 | GO:0002102 | podosome(GO:0002102) |
| 0.0 | 0.0 | GO:0016529 | sarcoplasmic reticulum(GO:0016529) |
| 0.0 | 0.6 | GO:0034663 | endoplasmic reticulum chaperone complex(GO:0034663) |
| 0.0 | 0.1 | GO:1990597 | AIP1-IRE1 complex(GO:1990597) |
| 0.0 | 0.1 | GO:0005968 | Rab-protein geranylgeranyltransferase complex(GO:0005968) |
| 0.0 | 2.3 | GO:0015030 | Cajal body(GO:0015030) |
| 0.0 | 0.1 | GO:0005826 | actomyosin contractile ring(GO:0005826) |
| 0.0 | 0.4 | GO:0033162 | melanosome membrane(GO:0033162) chitosome(GO:0045009) |
| 0.0 | 0.2 | GO:0033553 | rDNA heterochromatin(GO:0033553) |
| 0.0 | 0.2 | GO:0005875 | microtubule associated complex(GO:0005875) |
| 0.0 | 0.4 | GO:0033588 | Elongator holoenzyme complex(GO:0033588) |
| 0.0 | 0.1 | GO:0002189 | ribose phosphate diphosphokinase complex(GO:0002189) |
| 0.0 | 0.3 | GO:0042622 | photoreceptor outer segment membrane(GO:0042622) |
| 0.0 | 0.0 | GO:0000178 | exosome (RNase complex)(GO:0000178) |
| 0.0 | 0.1 | GO:0030895 | apolipoprotein B mRNA editing enzyme complex(GO:0030895) |
| 0.0 | 0.0 | GO:0070938 | contractile ring(GO:0070938) |
| 0.0 | 0.1 | GO:0071144 | SMAD2-SMAD3 protein complex(GO:0071144) |
| 0.0 | 0.2 | GO:0097504 | Gemini of coiled bodies(GO:0097504) |
| 0.0 | 0.6 | GO:0008250 | oligosaccharyltransferase complex(GO:0008250) |
| 0.0 | 0.2 | GO:0005742 | mitochondrial outer membrane translocase complex(GO:0005742) |
| 0.0 | 0.1 | GO:0042582 | primary lysosome(GO:0005766) azurophil granule(GO:0042582) |
| 0.0 | 0.2 | GO:0097361 | CIA complex(GO:0097361) |
| 0.0 | 0.5 | GO:0072546 | ER membrane protein complex(GO:0072546) |
| 0.0 | 0.5 | GO:0005852 | eukaryotic translation initiation factor 3 complex(GO:0005852) |
| 0.0 | 0.3 | GO:0005833 | hemoglobin complex(GO:0005833) |
| 0.0 | 0.1 | GO:0031010 | ISWI-type complex(GO:0031010) |
| 0.0 | 0.1 | GO:0000818 | nuclear MIS12/MIND complex(GO:0000818) |
| 0.0 | 0.1 | GO:0097225 | sperm midpiece(GO:0097225) |
| 0.0 | 0.1 | GO:0034455 | t-UTP complex(GO:0034455) |
| 0.0 | 0.5 | GO:0048188 | Set1C/COMPASS complex(GO:0048188) |
| 0.0 | 0.0 | GO:0031332 | RISC complex(GO:0016442) RNAi effector complex(GO:0031332) |
| 0.0 | 2.4 | GO:0045211 | postsynaptic membrane(GO:0045211) |
| 0.0 | 0.4 | GO:0042627 | chylomicron(GO:0042627) |
| 0.0 | 0.1 | GO:0042022 | interleukin-12 receptor complex(GO:0042022) |
| 0.0 | 0.1 | GO:0001739 | sex chromatin(GO:0001739) |
| 0.0 | 0.4 | GO:0048786 | presynaptic active zone(GO:0048786) |
| 0.0 | 0.1 | GO:0005784 | Sec61 translocon complex(GO:0005784) translocon complex(GO:0071256) |
| 0.0 | 0.1 | GO:0032389 | MutLalpha complex(GO:0032389) |
| 0.0 | 0.9 | GO:0099501 | synaptic vesicle membrane(GO:0030672) exocytic vesicle membrane(GO:0099501) |
| 0.0 | 2.6 | GO:0042734 | presynaptic membrane(GO:0042734) |
| 0.0 | 0.1 | GO:1990726 | Lsm1-7-Pat1 complex(GO:1990726) |
| 0.0 | 0.1 | GO:0000407 | pre-autophagosomal structure(GO:0000407) |
| 0.0 | 0.2 | GO:0000127 | transcription factor TFIIIC complex(GO:0000127) |
| 0.0 | 1.0 | GO:0045178 | basal part of cell(GO:0045178) |
| 0.0 | 0.0 | GO:0005796 | Golgi lumen(GO:0005796) |
| 0.0 | 0.3 | GO:0031906 | late endosome lumen(GO:0031906) |
| 0.0 | 0.1 | GO:0090571 | RNA polymerase II transcription repressor complex(GO:0090571) |
| 0.0 | 0.1 | GO:0019907 | cyclin-dependent protein kinase activating kinase holoenzyme complex(GO:0019907) |
| 0.0 | 0.1 | GO:0033186 | CAF-1 complex(GO:0033186) |
| 0.0 | 0.1 | GO:0000942 | condensed nuclear chromosome outer kinetochore(GO:0000942) |
| 0.0 | 0.0 | GO:0071159 | NF-kappaB complex(GO:0071159) |
| 0.0 | 0.9 | GO:1902710 | GABA receptor complex(GO:1902710) GABA-A receptor complex(GO:1902711) |
| 0.0 | 0.5 | GO:0000815 | ESCRT III complex(GO:0000815) |
| 0.0 | 0.0 | GO:0033503 | HULC complex(GO:0033503) |
| 0.0 | 0.1 | GO:0070081 | clathrin-sculpted monoamine transport vesicle(GO:0070081) clathrin-sculpted monoamine transport vesicle membrane(GO:0070083) |
| 0.0 | 0.2 | GO:0048500 | signal recognition particle(GO:0048500) |
| 0.0 | 0.8 | GO:0002080 | acrosomal membrane(GO:0002080) |
| 0.0 | 0.2 | GO:0035869 | ciliary transition zone(GO:0035869) |
| 0.0 | 0.1 | GO:0098536 | deuterosome(GO:0098536) |
| 0.0 | 0.1 | GO:1990075 | periciliary membrane compartment(GO:1990075) |
| 0.0 | 0.1 | GO:0005677 | chromatin silencing complex(GO:0005677) |
| 0.0 | 0.3 | GO:0008541 | proteasome regulatory particle, lid subcomplex(GO:0008541) |
| 0.0 | 0.0 | GO:1990923 | PET complex(GO:1990923) |
| 0.0 | 3.5 | GO:1904813 | ficolin-1-rich granule(GO:0101002) ficolin-1-rich granule lumen(GO:1904813) |
| 0.0 | 0.5 | GO:0036038 | MKS complex(GO:0036038) |
| 0.0 | 0.2 | GO:0098576 | lumenal side of membrane(GO:0098576) |
| 0.0 | 0.1 | GO:0098843 | postsynaptic endocytic zone(GO:0098843) |
| 0.0 | 0.1 | GO:0005853 | eukaryotic translation elongation factor 1 complex(GO:0005853) |
| 0.0 | 0.1 | GO:0031205 | endoplasmic reticulum Sec complex(GO:0031205) |
| 0.0 | 0.5 | GO:0071011 | precatalytic spliceosome(GO:0071011) |
| 0.0 | 0.0 | GO:0022626 | cytosolic ribosome(GO:0022626) |
| 0.0 | 0.1 | GO:0016234 | inclusion body(GO:0016234) |
| 0.0 | 0.2 | GO:0005901 | caveola(GO:0005901) |
| 0.0 | 0.0 | GO:0030118 | clathrin coat(GO:0030118) clathrin coat of coated pit(GO:0030132) |
| 0.0 | 0.4 | GO:0000783 | telomere cap complex(GO:0000782) nuclear telomere cap complex(GO:0000783) |
| 0.0 | 1.9 | GO:0001669 | acrosomal vesicle(GO:0001669) |
| 0.0 | 0.2 | GO:0005787 | signal peptidase complex(GO:0005787) |
| 0.0 | 0.4 | GO:0005765 | lysosomal membrane(GO:0005765) lytic vacuole membrane(GO:0098852) |
| 0.0 | 1.0 | GO:0000791 | euchromatin(GO:0000791) |
| 0.0 | 0.0 | GO:0030485 | smooth muscle contractile fiber(GO:0030485) |
| 0.0 | 0.1 | GO:0033185 | dolichol-phosphate-mannose synthase complex(GO:0033185) |
| 0.0 | 0.2 | GO:0042587 | glycogen granule(GO:0042587) |
| 0.0 | 0.1 | GO:1990682 | CSF1-CSF1R complex(GO:1990682) |
| 0.0 | 0.1 | GO:0044530 | supraspliceosomal complex(GO:0044530) |
| 0.0 | 2.6 | GO:0045111 | intermediate filament cytoskeleton(GO:0045111) |
| 0.0 | 0.0 | GO:0031233 | intrinsic component of external side of plasma membrane(GO:0031233) |
| 0.0 | 0.2 | GO:0032045 | guanyl-nucleotide exchange factor complex(GO:0032045) |
| 0.0 | 1.9 | GO:0032580 | Golgi cisterna membrane(GO:0032580) |
| 0.0 | 0.2 | GO:0017119 | Golgi transport complex(GO:0017119) |
| 0.0 | 0.1 | GO:0034272 | phosphatidylinositol 3-kinase complex, class III, type I(GO:0034271) phosphatidylinositol 3-kinase complex, class III, type II(GO:0034272) |
| 0.0 | 0.2 | GO:0008278 | cohesin complex(GO:0008278) |
| 0.0 | 0.1 | GO:0036194 | muscle cell projection(GO:0036194) muscle cell projection membrane(GO:0036195) |
| 0.0 | 0.6 | GO:0010494 | cytoplasmic stress granule(GO:0010494) |
| 0.0 | 0.4 | GO:0016514 | SWI/SNF complex(GO:0016514) |
| 0.0 | 0.0 | GO:0032797 | SMN complex(GO:0032797) |
| 0.0 | 0.1 | GO:0042584 | chromaffin granule membrane(GO:0042584) |
| 0.0 | 0.1 | GO:0005726 | perichromatin fibrils(GO:0005726) |
| 0.0 | 0.0 | GO:1902911 | protein kinase complex(GO:1902911) |
| 0.0 | 0.1 | GO:1990716 | axonemal central apparatus(GO:1990716) |
| 0.0 | 0.1 | GO:0032541 | cortical endoplasmic reticulum(GO:0032541) |
| 0.0 | 0.0 | GO:0005881 | cytoplasmic microtubule(GO:0005881) |
| 0.0 | 0.0 | GO:0097450 | astrocyte end-foot(GO:0097450) |
| 0.0 | 0.1 | GO:0072487 | MSL complex(GO:0072487) |
| 0.0 | 0.3 | GO:0070822 | Sin3-type complex(GO:0070822) |
| 0.0 | 0.1 | GO:0030125 | clathrin vesicle coat(GO:0030125) |
| 0.0 | 0.0 | GO:0070110 | ciliary neurotrophic factor receptor complex(GO:0070110) |
| 0.0 | 0.0 | GO:0031414 | N-terminal protein acetyltransferase complex(GO:0031414) |
| 0.0 | 0.1 | GO:0045283 | mitochondrial respiratory chain complex II, succinate dehydrogenase complex (ubiquinone)(GO:0005749) succinate dehydrogenase complex (ubiquinone)(GO:0045257) respiratory chain complex II(GO:0045273) succinate dehydrogenase complex(GO:0045281) fumarate reductase complex(GO:0045283) |
| 0.0 | 1.8 | GO:0022625 | cytosolic large ribosomal subunit(GO:0022625) |
| 0.0 | 0.1 | GO:0005579 | membrane attack complex(GO:0005579) |
| 0.0 | 1.9 | GO:0042581 | specific granule(GO:0042581) |
| 0.0 | 0.0 | GO:0005953 | CAAX-protein geranylgeranyltransferase complex(GO:0005953) |
| 0.0 | 0.1 | GO:0097470 | ribbon synapse(GO:0097470) |
| 0.0 | 0.0 | GO:0030140 | trans-Golgi network transport vesicle(GO:0030140) |
| 0.0 | 0.1 | GO:0098799 | outer mitochondrial membrane protein complex(GO:0098799) |
| 0.0 | 0.1 | GO:0005854 | nascent polypeptide-associated complex(GO:0005854) |
| 0.0 | 0.3 | GO:0032982 | myosin filament(GO:0032982) |
| 0.0 | 0.1 | GO:0016461 | unconventional myosin complex(GO:0016461) |
| 0.0 | 0.0 | GO:0014701 | junctional sarcoplasmic reticulum membrane(GO:0014701) |
| 0.0 | 0.0 | GO:0035339 | SPOTS complex(GO:0035339) |
| 0.0 | 1.1 | GO:0031463 | Cul3-RING ubiquitin ligase complex(GO:0031463) |
| 0.0 | 0.1 | GO:0005675 | holo TFIIH complex(GO:0005675) |
| 0.0 | 0.3 | GO:0032040 | small-subunit processome(GO:0032040) |
| 0.0 | 0.1 | GO:0030688 | preribosome, small subunit precursor(GO:0030688) |
| 0.0 | 0.2 | GO:0000346 | transcription export complex(GO:0000346) |
| 0.0 | 0.7 | GO:0045171 | intercellular bridge(GO:0045171) |
| 0.0 | 0.2 | GO:0000808 | origin recognition complex(GO:0000808) nuclear origin of replication recognition complex(GO:0005664) |
| 0.0 | 0.1 | GO:0032839 | dendrite cytoplasm(GO:0032839) |
| 0.0 | 0.1 | GO:0005602 | complement component C1 complex(GO:0005602) |
| 0.0 | 0.0 | GO:0036398 | TCR signalosome(GO:0036398) |
| 0.0 | 0.3 | GO:0030014 | CCR4-NOT complex(GO:0030014) |
| 0.0 | 0.1 | GO:0005955 | calcineurin complex(GO:0005955) |
| 0.0 | 0.0 | GO:0005827 | polar microtubule(GO:0005827) |
| 0.0 | 0.1 | GO:0034451 | centriolar satellite(GO:0034451) |
| 0.0 | 0.1 | GO:0000801 | central element(GO:0000801) |
| 0.0 | 0.0 | GO:0048269 | methionine adenosyltransferase complex(GO:0048269) |
| 0.0 | 0.0 | GO:0090568 | nuclear transcriptional repressor complex(GO:0090568) |
| 0.0 | 0.3 | GO:0005791 | rough endoplasmic reticulum(GO:0005791) |
| 0.0 | 0.1 | GO:0031298 | replication fork protection complex(GO:0031298) |
Gene overrepresentation in molecular_function category:
| Log-likelihood per target | Total log-likelihood | Term | Description |
|---|---|---|---|
| 1.5 | 4.5 | GO:0008859 | exoribonuclease II activity(GO:0008859) |
| 1.3 | 6.3 | GO:0038062 | protein tyrosine kinase collagen receptor activity(GO:0038062) |
| 1.2 | 3.6 | GO:0070699 | type II activin receptor binding(GO:0070699) |
| 1.1 | 3.3 | GO:0019834 | phospholipase A2 inhibitor activity(GO:0019834) |
| 1.1 | 5.5 | GO:0001641 | group II metabotropic glutamate receptor activity(GO:0001641) |
| 1.0 | 5.2 | GO:0004910 | interleukin-1, Type II, blocking receptor activity(GO:0004910) |
| 0.9 | 13.0 | GO:0031014 | troponin T binding(GO:0031014) |
| 0.9 | 0.9 | GO:0005547 | phosphatidylinositol-3,4,5-trisphosphate binding(GO:0005547) |
| 0.9 | 4.5 | GO:0060961 | phospholipase D inhibitor activity(GO:0060961) |
| 0.8 | 5.6 | GO:0004111 | creatine kinase activity(GO:0004111) |
| 0.7 | 2.7 | GO:0030305 | heparanase activity(GO:0030305) |
| 0.7 | 0.7 | GO:0050473 | arachidonate 15-lipoxygenase activity(GO:0050473) |
| 0.7 | 3.3 | GO:0004992 | platelet activating factor receptor activity(GO:0004992) |
| 0.7 | 0.7 | GO:0051400 | BH domain binding(GO:0051400) |
| 0.6 | 2.6 | GO:0008532 | N-acetyllactosaminide beta-1,3-N-acetylglucosaminyltransferase activity(GO:0008532) |
| 0.6 | 1.9 | GO:0016165 | linoleate 13S-lipoxygenase activity(GO:0016165) |
| 0.6 | 0.6 | GO:0004052 | arachidonate 12-lipoxygenase activity(GO:0004052) |
| 0.6 | 8.9 | GO:0015280 | ligand-gated sodium channel activity(GO:0015280) |
| 0.6 | 4.1 | GO:0035662 | Toll-like receptor 4 binding(GO:0035662) |
| 0.5 | 3.2 | GO:0005166 | neurotrophin p75 receptor binding(GO:0005166) |
| 0.5 | 1.6 | GO:0038131 | neuregulin receptor activity(GO:0038131) |
| 0.5 | 3.6 | GO:0070891 | lipoteichoic acid binding(GO:0070891) |
| 0.5 | 4.6 | GO:0086083 | cell adhesive protein binding involved in bundle of His cell-Purkinje myocyte communication(GO:0086083) |
| 0.5 | 3.5 | GO:0001665 | alpha-N-acetylgalactosaminide alpha-2,6-sialyltransferase activity(GO:0001665) |
| 0.5 | 4.4 | GO:0102337 | fatty acid elongase activity(GO:0009922) 3-oxo-arachidoyl-CoA synthase activity(GO:0102336) 3-oxo-cerotoyl-CoA synthase activity(GO:0102337) 3-oxo-lignoceronyl-CoA synthase activity(GO:0102338) |
| 0.5 | 1.4 | GO:0004357 | glutamate-cysteine ligase activity(GO:0004357) |
| 0.5 | 1.4 | GO:0098782 | mechanically-gated potassium channel activity(GO:0098782) |
| 0.5 | 2.3 | GO:0080019 | fatty-acyl-CoA reductase (alcohol-forming) activity(GO:0080019) |
| 0.5 | 1.4 | GO:0030377 | urokinase plasminogen activator receptor activity(GO:0030377) |
| 0.4 | 13.2 | GO:0098641 | cadherin binding involved in cell-cell adhesion(GO:0098641) |
| 0.4 | 2.2 | GO:0015254 | glycerol channel activity(GO:0015254) |
| 0.4 | 2.1 | GO:0046899 | nucleoside triphosphate adenylate kinase activity(GO:0046899) |
| 0.4 | 2.0 | GO:0004699 | calcium-independent protein kinase C activity(GO:0004699) |
| 0.4 | 2.4 | GO:0042015 | interleukin-20 binding(GO:0042015) |
| 0.4 | 3.9 | GO:0005176 | ErbB-2 class receptor binding(GO:0005176) |
| 0.4 | 1.2 | GO:0004947 | bradykinin receptor activity(GO:0004947) |
| 0.4 | 1.5 | GO:0031735 | CCR10 chemokine receptor binding(GO:0031735) |
| 0.4 | 3.4 | GO:0008467 | [heparan sulfate]-glucosamine 3-sulfotransferase 1 activity(GO:0008467) |
| 0.4 | 1.1 | GO:0097259 | tocopherol omega-hydroxylase activity(GO:0052870) alpha-tocopherol omega-hydroxylase activity(GO:0052871) 20-hydroxy-leukotriene B4 omega oxidase activity(GO:0097258) 20-aldehyde-leukotriene B4 20-monooxygenase activity(GO:0097259) |
| 0.4 | 1.4 | GO:0086020 | gap junction channel activity involved in SA node cell-atrial cardiac muscle cell electrical coupling(GO:0086020) |
| 0.3 | 3.4 | GO:0019534 | toxin transporter activity(GO:0019534) |
| 0.3 | 4.1 | GO:0005007 | fibroblast growth factor-activated receptor activity(GO:0005007) |
| 0.3 | 3.0 | GO:0015349 | thyroid hormone transmembrane transporter activity(GO:0015349) |
| 0.3 | 3.3 | GO:0030884 | lipid antigen binding(GO:0030882) endogenous lipid antigen binding(GO:0030883) exogenous lipid antigen binding(GO:0030884) |
| 0.3 | 1.3 | GO:0034040 | lipid-transporting ATPase activity(GO:0034040) |
| 0.3 | 1.7 | GO:0005152 | interleukin-1 receptor antagonist activity(GO:0005152) |
| 0.3 | 4.3 | GO:0038132 | neuregulin binding(GO:0038132) |
| 0.3 | 2.0 | GO:0030348 | syntaxin-3 binding(GO:0030348) |
| 0.3 | 1.6 | GO:0070576 | vitamin D 24-hydroxylase activity(GO:0070576) |
| 0.3 | 5.3 | GO:0043274 | phospholipase binding(GO:0043274) |
| 0.3 | 1.2 | GO:0004142 | diacylglycerol cholinephosphotransferase activity(GO:0004142) |
| 0.3 | 0.9 | GO:0047192 | 1-alkylglycerophosphocholine O-acetyltransferase activity(GO:0047192) |
| 0.3 | 0.9 | GO:0051120 | hepoxilin A3 synthase activity(GO:0051120) |
| 0.3 | 1.5 | GO:0052834 | inositol monophosphate 1-phosphatase activity(GO:0008934) inositol monophosphate 3-phosphatase activity(GO:0052832) inositol monophosphate 4-phosphatase activity(GO:0052833) inositol monophosphate phosphatase activity(GO:0052834) |
| 0.3 | 1.4 | GO:0015111 | iodide transmembrane transporter activity(GO:0015111) |
| 0.3 | 3.1 | GO:0001730 | 2'-5'-oligoadenylate synthetase activity(GO:0001730) |
| 0.3 | 1.1 | GO:0008900 | hydrogen:potassium-exchanging ATPase activity(GO:0008900) |
| 0.3 | 0.3 | GO:0035374 | chondroitin sulfate binding(GO:0035374) |
| 0.3 | 0.8 | GO:0047273 | galactosylgalactosylglucosylceramide beta-D-acetylgalactosaminyltransferase activity(GO:0047273) |
| 0.3 | 3.6 | GO:0001011 | transcription factor activity, sequence-specific DNA binding, RNA polymerase recruiting(GO:0001011) transcription factor activity, TFIIB-class binding(GO:0001087) |
| 0.3 | 6.0 | GO:0038191 | neuropilin binding(GO:0038191) |
| 0.3 | 0.3 | GO:0043533 | inositol 1,3,4,5 tetrakisphosphate binding(GO:0043533) |
| 0.3 | 0.8 | GO:0008476 | protein-tyrosine sulfotransferase activity(GO:0008476) |
| 0.3 | 0.5 | GO:0034437 | glycoprotein transporter activity(GO:0034437) |
| 0.3 | 1.1 | GO:0004461 | lactose synthase activity(GO:0004461) |
| 0.3 | 0.8 | GO:0032090 | Pyrin domain binding(GO:0032090) |
| 0.3 | 3.4 | GO:0008517 | folic acid transporter activity(GO:0008517) |
| 0.3 | 1.0 | GO:0070326 | very-low-density lipoprotein particle receptor binding(GO:0070326) |
| 0.2 | 1.5 | GO:0005332 | gamma-aminobutyric acid:sodium symporter activity(GO:0005332) |
| 0.2 | 0.7 | GO:0030984 | kininogen binding(GO:0030984) |
| 0.2 | 0.7 | GO:0005298 | proline:sodium symporter activity(GO:0005298) |
| 0.2 | 0.7 | GO:0015157 | sucrose:proton symporter activity(GO:0008506) sucrose transmembrane transporter activity(GO:0008515) disaccharide transmembrane transporter activity(GO:0015154) oligosaccharide transmembrane transporter activity(GO:0015157) |
| 0.2 | 1.2 | GO:0004359 | glutaminase activity(GO:0004359) |
| 0.2 | 2.2 | GO:0046978 | TAP binding(GO:0046977) TAP1 binding(GO:0046978) |
| 0.2 | 2.2 | GO:0047623 | AMP deaminase activity(GO:0003876) adenosine-phosphate deaminase activity(GO:0047623) |
| 0.2 | 1.9 | GO:0019826 | oxygen sensor activity(GO:0019826) |
| 0.2 | 0.9 | GO:0047888 | fatty acid peroxidase activity(GO:0047888) |
| 0.2 | 5.4 | GO:0042813 | Wnt-activated receptor activity(GO:0042813) |
| 0.2 | 0.7 | GO:0019959 | interleukin-8 binding(GO:0019959) |
| 0.2 | 2.8 | GO:0098632 | protein binding involved in cell-cell adhesion(GO:0098632) |
| 0.2 | 0.7 | GO:0047389 | glycerophosphocholine phosphodiesterase activity(GO:0047389) |
| 0.2 | 1.4 | GO:0052654 | branched-chain-amino-acid transaminase activity(GO:0004084) L-leucine transaminase activity(GO:0052654) L-valine transaminase activity(GO:0052655) L-isoleucine transaminase activity(GO:0052656) |
| 0.2 | 2.5 | GO:0004931 | extracellular ATP-gated cation channel activity(GO:0004931) ATP-gated ion channel activity(GO:0035381) |
| 0.2 | 0.9 | GO:0030899 | calcium-dependent ATPase activity(GO:0030899) |
| 0.2 | 0.7 | GO:0004574 | oligo-1,6-glucosidase activity(GO:0004574) |
| 0.2 | 0.9 | GO:0004706 | JUN kinase kinase kinase activity(GO:0004706) |
| 0.2 | 3.6 | GO:0005243 | gap junction channel activity(GO:0005243) |
| 0.2 | 1.5 | GO:0004591 | oxoglutarate dehydrogenase (succinyl-transferring) activity(GO:0004591) |
| 0.2 | 3.3 | GO:0035256 | G-protein coupled glutamate receptor binding(GO:0035256) |
| 0.2 | 2.4 | GO:0004969 | histamine receptor activity(GO:0004969) |
| 0.2 | 2.2 | GO:0098599 | palmitoyl-(protein) hydrolase activity(GO:0008474) palmitoyl hydrolase activity(GO:0098599) |
| 0.2 | 0.7 | GO:0005006 | epidermal growth factor-activated receptor activity(GO:0005006) |
| 0.2 | 1.1 | GO:1990430 | extracellular matrix protein binding(GO:1990430) |
| 0.2 | 1.5 | GO:1903136 | cuprous ion binding(GO:1903136) |
| 0.2 | 0.6 | GO:0003858 | 3-hydroxybutyrate dehydrogenase activity(GO:0003858) |
| 0.2 | 0.8 | GO:0003835 | beta-galactoside alpha-2,6-sialyltransferase activity(GO:0003835) |
| 0.2 | 0.4 | GO:0038064 | collagen receptor activity(GO:0038064) |
| 0.2 | 7.1 | GO:0008157 | protein phosphatase 1 binding(GO:0008157) |
| 0.2 | 1.7 | GO:0004465 | lipoprotein lipase activity(GO:0004465) |
| 0.2 | 2.1 | GO:0008525 | phosphatidylcholine transporter activity(GO:0008525) |
| 0.2 | 0.2 | GO:0030297 | transmembrane receptor protein tyrosine kinase activator activity(GO:0030297) |
| 0.2 | 1.4 | GO:0035614 | snRNA stem-loop binding(GO:0035614) |
| 0.2 | 1.4 | GO:0008823 | cupric reductase activity(GO:0008823) ferric-chelate reductase (NADPH) activity(GO:0052851) |
| 0.2 | 1.4 | GO:0015526 | hexose phosphate transmembrane transporter activity(GO:0015119) organophosphate:inorganic phosphate antiporter activity(GO:0015315) hexose-phosphate:inorganic phosphate antiporter activity(GO:0015526) glucose 6-phosphate:inorganic phosphate antiporter activity(GO:0061513) |
| 0.2 | 12.7 | GO:0042379 | chemokine receptor binding(GO:0042379) |
| 0.2 | 3.0 | GO:0030280 | structural constituent of epidermis(GO:0030280) |
| 0.2 | 0.2 | GO:0004300 | enoyl-CoA hydratase activity(GO:0004300) |
| 0.2 | 1.4 | GO:0015183 | L-aspartate transmembrane transporter activity(GO:0015183) |
| 0.2 | 1.6 | GO:0008201 | heparin binding(GO:0008201) |
| 0.2 | 2.8 | GO:0016176 | superoxide-generating NADPH oxidase activator activity(GO:0016176) |
| 0.2 | 1.6 | GO:0050544 | arachidonic acid binding(GO:0050544) |
| 0.2 | 1.4 | GO:0048406 | nerve growth factor binding(GO:0048406) |
| 0.2 | 2.4 | GO:0070700 | BMP receptor binding(GO:0070700) |
| 0.2 | 1.2 | GO:0043183 | vascular endothelial growth factor receptor 1 binding(GO:0043183) |
| 0.2 | 1.0 | GO:0004720 | protein-lysine 6-oxidase activity(GO:0004720) |
| 0.2 | 2.3 | GO:0008503 | benzodiazepine receptor activity(GO:0008503) |
| 0.2 | 1.9 | GO:0070324 | thyroid hormone binding(GO:0070324) |
| 0.2 | 0.6 | GO:0047325 | inositol tetrakisphosphate 1-kinase activity(GO:0047325) inositol-1,3,4-trisphosphate 6-kinase activity(GO:0052725) inositol-1,3,4-trisphosphate 5-kinase activity(GO:0052726) inositol-1,3,4,5,6-pentakisphosphate 1-phosphatase activity(GO:0052825) inositol-1,3,4,6-tetrakisphosphate 6-phosphatase activity(GO:0052830) inositol-1,3,4,6-tetrakisphosphate 1-phosphatase activity(GO:0052831) inositol-3,4,6-trisphosphate 1-kinase activity(GO:0052835) |
| 0.2 | 0.8 | GO:0022897 | peptide:proton symporter activity(GO:0015333) proton-dependent peptide secondary active transmembrane transporter activity(GO:0022897) |
| 0.2 | 0.2 | GO:0001786 | phosphatidylserine binding(GO:0001786) |
| 0.2 | 3.2 | GO:0017017 | MAP kinase tyrosine/serine/threonine phosphatase activity(GO:0017017) |
| 0.2 | 0.4 | GO:0042610 | CD8 receptor binding(GO:0042610) |
| 0.2 | 0.6 | GO:0004416 | hydroxyacylglutathione hydrolase activity(GO:0004416) |
| 0.2 | 2.4 | GO:0036312 | phosphatidylinositol 3-kinase regulatory subunit binding(GO:0036312) |
| 0.2 | 0.6 | GO:0003870 | 5-aminolevulinate synthase activity(GO:0003870) N-succinyltransferase activity(GO:0016749) |
| 0.2 | 0.5 | GO:0050659 | N-acetylgalactosamine 4-sulfate 6-O-sulfotransferase activity(GO:0050659) |
| 0.2 | 0.7 | GO:0051916 | granulocyte colony-stimulating factor binding(GO:0051916) |
| 0.2 | 0.5 | GO:0016534 | cyclin-dependent protein kinase 5 activator activity(GO:0016534) |
| 0.2 | 2.0 | GO:0022820 | potassium:chloride symporter activity(GO:0015379) potassium ion symporter activity(GO:0022820) |
| 0.2 | 0.5 | GO:0015130 | mevalonate transmembrane transporter activity(GO:0015130) |
| 0.2 | 4.7 | GO:0008239 | dipeptidyl-peptidase activity(GO:0008239) |
| 0.2 | 54.9 | GO:0004252 | serine-type endopeptidase activity(GO:0004252) |
| 0.2 | 2.3 | GO:0015143 | urate transmembrane transporter activity(GO:0015143) salt transmembrane transporter activity(GO:1901702) |
| 0.2 | 0.4 | GO:0032767 | copper-dependent protein binding(GO:0032767) |
| 0.2 | 0.2 | GO:0097153 | cysteine-type endopeptidase activity involved in apoptotic process(GO:0097153) |
| 0.2 | 0.5 | GO:0015222 | serotonin transmembrane transporter activity(GO:0015222) |
| 0.2 | 0.5 | GO:0003845 | 11-beta-hydroxysteroid dehydrogenase [NAD(P)] activity(GO:0003845) |
| 0.2 | 0.5 | GO:0034186 | apolipoprotein A-I binding(GO:0034186) |
| 0.2 | 0.2 | GO:0004909 | interleukin-1, Type I, activating receptor activity(GO:0004909) |
| 0.2 | 0.5 | GO:0004464 | leukotriene-C4 synthase activity(GO:0004464) |
| 0.2 | 0.7 | GO:0003938 | IMP dehydrogenase activity(GO:0003938) |
| 0.2 | 4.2 | GO:0005229 | intracellular calcium activated chloride channel activity(GO:0005229) |
| 0.2 | 0.8 | GO:0004105 | choline-phosphate cytidylyltransferase activity(GO:0004105) |
| 0.2 | 2.2 | GO:0097371 | MDM2/MDM4 family protein binding(GO:0097371) |
| 0.2 | 1.8 | GO:0030274 | LIM domain binding(GO:0030274) |
| 0.2 | 0.3 | GO:0001224 | RNA polymerase II transcription cofactor binding(GO:0001224) |
| 0.2 | 9.3 | GO:0005154 | epidermal growth factor receptor binding(GO:0005154) |
| 0.2 | 1.0 | GO:0086006 | voltage-gated sodium channel activity involved in cardiac muscle cell action potential(GO:0086006) |
| 0.2 | 0.5 | GO:0001632 | leukotriene B4 receptor activity(GO:0001632) |
| 0.2 | 0.2 | GO:0008527 | taste receptor activity(GO:0008527) |
| 0.2 | 0.7 | GO:0033829 | O-fucosylpeptide 3-beta-N-acetylglucosaminyltransferase activity(GO:0033829) |
| 0.2 | 0.7 | GO:0044715 | 8-oxo-dGDP phosphatase activity(GO:0044715) |
| 0.2 | 1.0 | GO:0008940 | nitrate reductase activity(GO:0008940) |
| 0.2 | 1.0 | GO:0034648 | histone demethylase activity (H3-dimethyl-K4 specific)(GO:0034648) |
| 0.2 | 0.8 | GO:0002114 | interleukin-33 receptor activity(GO:0002114) |
| 0.2 | 1.1 | GO:0016416 | O-palmitoyltransferase activity(GO:0016416) |
| 0.2 | 0.5 | GO:0086089 | voltage-gated potassium channel activity involved in atrial cardiac muscle cell action potential repolarization(GO:0086089) |
| 0.2 | 2.2 | GO:0042834 | peptidoglycan binding(GO:0042834) |
| 0.2 | 0.2 | GO:0019870 | potassium channel inhibitor activity(GO:0019870) |
| 0.2 | 0.5 | GO:0000994 | RNA polymerase III core binding(GO:0000994) |
| 0.2 | 0.2 | GO:0047718 | indanol dehydrogenase activity(GO:0047718) |
| 0.2 | 0.9 | GO:0042835 | BRE binding(GO:0042835) |
| 0.2 | 2.0 | GO:0004716 | receptor signaling protein tyrosine kinase activity(GO:0004716) |
| 0.2 | 0.8 | GO:0004322 | ferroxidase activity(GO:0004322) oxidoreductase activity, oxidizing metal ions, oxygen as acceptor(GO:0016724) |
| 0.2 | 2.1 | GO:0032395 | MHC class II receptor activity(GO:0032395) |
| 0.2 | 0.9 | GO:0016314 | phosphatidylinositol-3,4,5-trisphosphate 3-phosphatase activity(GO:0016314) |
| 0.2 | 0.9 | GO:0016909 | JUN kinase activity(GO:0004705) SAP kinase activity(GO:0016909) |
| 0.2 | 1.5 | GO:0004117 | calmodulin-dependent cyclic-nucleotide phosphodiesterase activity(GO:0004117) |
| 0.2 | 0.5 | GO:0050252 | retinol O-fatty-acyltransferase activity(GO:0050252) |
| 0.1 | 0.6 | GO:0002060 | purine nucleobase binding(GO:0002060) |
| 0.1 | 0.6 | GO:0035939 | microsatellite binding(GO:0035939) |
| 0.1 | 0.6 | GO:0004102 | choline O-acetyltransferase activity(GO:0004102) |
| 0.1 | 0.6 | GO:0004060 | arylamine N-acetyltransferase activity(GO:0004060) |
| 0.1 | 0.4 | GO:0098808 | mRNA cap binding(GO:0098808) |
| 0.1 | 2.2 | GO:0016174 | NAD(P)H oxidase activity(GO:0016174) |
| 0.1 | 0.1 | GO:0004332 | fructose-bisphosphate aldolase activity(GO:0004332) |
| 0.1 | 0.8 | GO:0034711 | inhibin binding(GO:0034711) |
| 0.1 | 0.6 | GO:0008426 | protein kinase C inhibitor activity(GO:0008426) |
| 0.1 | 0.4 | GO:0003945 | N-acetyllactosamine synthase activity(GO:0003945) |
| 0.1 | 1.0 | GO:0050682 | AF-2 domain binding(GO:0050682) |
| 0.1 | 0.6 | GO:0003978 | UDP-N-acetylglucosamine 4-epimerase activity(GO:0003974) UDP-glucose 4-epimerase activity(GO:0003978) |
| 0.1 | 0.3 | GO:0001640 | adenylate cyclase inhibiting G-protein coupled glutamate receptor activity(GO:0001640) G-protein coupled glutamate receptor activity(GO:0098988) |
| 0.1 | 0.6 | GO:0004740 | pyruvate dehydrogenase (acetyl-transferring) kinase activity(GO:0004740) |
| 0.1 | 0.7 | GO:0004925 | prolactin receptor activity(GO:0004925) |
| 0.1 | 0.4 | GO:0005497 | androgen binding(GO:0005497) |
| 0.1 | 0.5 | GO:0098821 | BMP receptor activity(GO:0098821) |
| 0.1 | 0.4 | GO:0061629 | RNA polymerase II sequence-specific DNA binding transcription factor binding(GO:0061629) |
| 0.1 | 0.4 | GO:1901474 | thiamine transmembrane transporter activity(GO:0015234) azole transmembrane transporter activity(GO:1901474) |
| 0.1 | 0.7 | GO:0071532 | ankyrin repeat binding(GO:0071532) |
| 0.1 | 0.9 | GO:0016846 | carbon-sulfur lyase activity(GO:0016846) |
| 0.1 | 0.4 | GO:0003883 | CTP synthase activity(GO:0003883) |
| 0.1 | 0.4 | GO:0005457 | GDP-fucose transmembrane transporter activity(GO:0005457) purine nucleotide-sugar transmembrane transporter activity(GO:0036080) |
| 0.1 | 3.7 | GO:0042056 | chemoattractant activity(GO:0042056) |
| 0.1 | 0.4 | GO:0004914 | interleukin-5 receptor activity(GO:0004914) |
| 0.1 | 1.0 | GO:0005250 | A-type (transient outward) potassium channel activity(GO:0005250) |
| 0.1 | 2.5 | GO:0005149 | interleukin-1 receptor binding(GO:0005149) |
| 0.1 | 0.7 | GO:0004832 | valine-tRNA ligase activity(GO:0004832) |
| 0.1 | 0.4 | GO:0004531 | deoxyribonuclease II activity(GO:0004531) |
| 0.1 | 1.4 | GO:0003996 | acyl-CoA ligase activity(GO:0003996) |
| 0.1 | 0.3 | GO:0005111 | type 2 fibroblast growth factor receptor binding(GO:0005111) |
| 0.1 | 0.4 | GO:0016603 | glutaminyl-peptide cyclotransferase activity(GO:0016603) |
| 0.1 | 0.5 | GO:0004809 | tRNA (guanine-N2-)-methyltransferase activity(GO:0004809) |
| 0.1 | 0.4 | GO:0033878 | hormone-sensitive lipase activity(GO:0033878) |
| 0.1 | 0.5 | GO:0009383 | rRNA (cytosine-C5-)-methyltransferase activity(GO:0009383) |
| 0.1 | 0.4 | GO:0015039 | ferredoxin-NADP+ reductase activity(GO:0004324) NADPH-adrenodoxin reductase activity(GO:0015039) oxidoreductase activity, acting on iron-sulfur proteins as donors(GO:0016730) oxidoreductase activity, acting on iron-sulfur proteins as donors, NAD or NADP as acceptor(GO:0016731) |
| 0.1 | 0.9 | GO:0001591 | dopamine neurotransmitter receptor activity, coupled via Gi/Go(GO:0001591) |
| 0.1 | 0.6 | GO:0047757 | chondroitin-glucuronate 5-epimerase activity(GO:0047757) |
| 0.1 | 0.4 | GO:0042134 | rRNA primary transcript binding(GO:0042134) |
| 0.1 | 0.6 | GO:0008453 | alanine-glyoxylate transaminase activity(GO:0008453) |
| 0.1 | 0.6 | GO:0004850 | uridine phosphorylase activity(GO:0004850) |
| 0.1 | 2.2 | GO:0030306 | ADP-ribosylation factor binding(GO:0030306) |
| 0.1 | 1.5 | GO:0046703 | natural killer cell lectin-like receptor binding(GO:0046703) |
| 0.1 | 1.4 | GO:0004865 | protein serine/threonine phosphatase inhibitor activity(GO:0004865) |
| 0.1 | 0.9 | GO:0004522 | ribonuclease A activity(GO:0004522) |
| 0.1 | 0.5 | GO:0035650 | AP-1 adaptor complex binding(GO:0035650) |
| 0.1 | 1.0 | GO:0070097 | delta-catenin binding(GO:0070097) |
| 0.1 | 0.2 | GO:0071936 | coreceptor activity involved in Wnt signaling pathway(GO:0071936) coreceptor activity involved in Wnt signaling pathway, planar cell polarity pathway(GO:1904929) |
| 0.1 | 0.4 | GO:1904599 | advanced glycation end-product binding(GO:1904599) |
| 0.1 | 3.7 | GO:0043014 | alpha-tubulin binding(GO:0043014) |
| 0.1 | 0.5 | GO:1990254 | keratin filament binding(GO:1990254) |
| 0.1 | 2.2 | GO:0004089 | carbonate dehydratase activity(GO:0004089) |
| 0.1 | 2.0 | GO:0004000 | adenosine deaminase activity(GO:0004000) |
| 0.1 | 0.7 | GO:0016433 | rRNA (adenine) methyltransferase activity(GO:0016433) |
| 0.1 | 1.7 | GO:0070679 | inositol 1,4,5 trisphosphate binding(GO:0070679) |
| 0.1 | 1.7 | GO:0017110 | nucleoside-diphosphatase activity(GO:0017110) |
| 0.1 | 0.6 | GO:0017040 | ceramidase activity(GO:0017040) |
| 0.1 | 2.8 | GO:0005326 | neurotransmitter transporter activity(GO:0005326) |
| 0.1 | 0.1 | GO:0045159 | myosin II binding(GO:0045159) |
| 0.1 | 0.8 | GO:0000155 | phosphorelay sensor kinase activity(GO:0000155) |
| 0.1 | 0.4 | GO:0004613 | phosphoenolpyruvate carboxykinase activity(GO:0004611) phosphoenolpyruvate carboxykinase (GTP) activity(GO:0004613) |
| 0.1 | 1.3 | GO:0047498 | calcium-dependent phospholipase A2 activity(GO:0047498) |
| 0.1 | 0.2 | GO:0047184 | 1-acylglycerophosphocholine O-acyltransferase activity(GO:0047184) |
| 0.1 | 0.8 | GO:0008048 | calcium sensitive guanylate cyclase activator activity(GO:0008048) |
| 0.1 | 0.5 | GO:0052798 | beta-galactoside alpha-2,3-sialyltransferase activity(GO:0052798) |
| 0.1 | 0.6 | GO:0045545 | syndecan binding(GO:0045545) |
| 0.1 | 4.2 | GO:0005109 | frizzled binding(GO:0005109) |
| 0.1 | 9.3 | GO:0097110 | scaffold protein binding(GO:0097110) |
| 0.1 | 0.2 | GO:0042043 | neurexin family protein binding(GO:0042043) |
| 0.1 | 0.7 | GO:0045029 | UDP-activated nucleotide receptor activity(GO:0045029) |
| 0.1 | 0.1 | GO:0008504 | monoamine transmembrane transporter activity(GO:0008504) |
| 0.1 | 0.3 | GO:0070984 | SET domain binding(GO:0070984) |
| 0.1 | 0.2 | GO:0038025 | reelin receptor activity(GO:0038025) |
| 0.1 | 0.3 | GO:0019912 | cyclin-dependent protein kinase activating kinase activity(GO:0019912) |
| 0.1 | 0.7 | GO:0047894 | flavonol 3-sulfotransferase activity(GO:0047894) |
| 0.1 | 0.3 | GO:0004938 | alpha2-adrenergic receptor activity(GO:0004938) |
| 0.1 | 1.1 | GO:0004983 | neuropeptide Y receptor activity(GO:0004983) |
| 0.1 | 2.3 | GO:0004745 | retinol dehydrogenase activity(GO:0004745) |
| 0.1 | 1.0 | GO:0030369 | ICAM-3 receptor activity(GO:0030369) |
| 0.1 | 2.7 | GO:0004653 | polypeptide N-acetylgalactosaminyltransferase activity(GO:0004653) |
| 0.1 | 0.4 | GO:0004698 | calcium-dependent protein kinase C activity(GO:0004698) |
| 0.1 | 1.5 | GO:0008199 | ferric iron binding(GO:0008199) |
| 0.1 | 0.4 | GO:0098518 | polynucleotide phosphatase activity(GO:0098518) |
| 0.1 | 0.6 | GO:0005499 | vitamin D binding(GO:0005499) |
| 0.1 | 0.4 | GO:0004965 | G-protein coupled GABA receptor activity(GO:0004965) |
| 0.1 | 0.5 | GO:0033188 | sphingomyelin synthase activity(GO:0033188) ceramide cholinephosphotransferase activity(GO:0047493) |
| 0.1 | 3.0 | GO:0031489 | myosin V binding(GO:0031489) |
| 0.1 | 3.4 | GO:0030676 | Rac guanyl-nucleotide exchange factor activity(GO:0030676) |
| 0.1 | 0.3 | GO:0080130 | L-phenylalanine aminotransferase activity(GO:0070546) L-phenylalanine:2-oxoglutarate aminotransferase activity(GO:0080130) |
| 0.1 | 1.2 | GO:0004859 | phospholipase inhibitor activity(GO:0004859) |
| 0.1 | 0.8 | GO:0005005 | transmembrane-ephrin receptor activity(GO:0005005) |
| 0.1 | 1.4 | GO:0003708 | retinoic acid receptor activity(GO:0003708) |
| 0.1 | 0.7 | GO:0008046 | axon guidance receptor activity(GO:0008046) |
| 0.1 | 2.9 | GO:0019198 | transmembrane receptor protein tyrosine phosphatase activity(GO:0005001) transmembrane receptor protein phosphatase activity(GO:0019198) |
| 0.1 | 0.8 | GO:0005283 | sodium:amino acid symporter activity(GO:0005283) |
| 0.1 | 0.2 | GO:0002046 | opsin binding(GO:0002046) |
| 0.1 | 1.4 | GO:0015194 | L-serine transmembrane transporter activity(GO:0015194) serine transmembrane transporter activity(GO:0022889) |
| 0.1 | 0.2 | GO:0050294 | steroid sulfotransferase activity(GO:0050294) |
| 0.1 | 1.0 | GO:0003705 | transcription factor activity, RNA polymerase II distal enhancer sequence-specific binding(GO:0003705) |
| 0.1 | 0.4 | GO:0000033 | alpha-1,3-mannosyltransferase activity(GO:0000033) |
| 0.1 | 0.3 | GO:0005462 | UDP-N-acetylglucosamine transmembrane transporter activity(GO:0005462) |
| 0.1 | 0.3 | GO:0043515 | kinetochore binding(GO:0043515) |
| 0.1 | 0.4 | GO:0050510 | N-acetylgalactosaminyl-proteoglycan 3-beta-glucuronosyltransferase activity(GO:0050510) |
| 0.1 | 0.7 | GO:0030267 | hydroxypyruvate reductase activity(GO:0016618) glyoxylate reductase (NADP) activity(GO:0030267) |
| 0.1 | 0.3 | GO:0050421 | cystathionine beta-synthase activity(GO:0004122) oxidoreductase activity, acting on other nitrogenous compounds as donors, cytochrome as acceptor(GO:0016662) nitrite reductase (NO-forming) activity(GO:0050421) carbon monoxide binding(GO:0070025) nitrite reductase activity(GO:0098809) |
| 0.1 | 0.4 | GO:0004514 | nicotinate-nucleotide diphosphorylase (carboxylating) activity(GO:0004514) |
| 0.1 | 1.2 | GO:0017034 | Rap guanyl-nucleotide exchange factor activity(GO:0017034) |
| 0.1 | 0.8 | GO:0042296 | ISG15 transferase activity(GO:0042296) |
| 0.1 | 0.6 | GO:0047115 | trans-1,2-dihydrobenzene-1,2-diol dehydrogenase activity(GO:0047115) |
| 0.1 | 0.5 | GO:0008401 | retinoic acid 4-hydroxylase activity(GO:0008401) |
| 0.1 | 0.1 | GO:0034191 | apolipoprotein A-I receptor binding(GO:0034191) |
| 0.1 | 0.6 | GO:0019960 | C-X3-C chemokine binding(GO:0019960) |
| 0.1 | 0.6 | GO:0005272 | sodium channel activity(GO:0005272) |
| 0.1 | 0.6 | GO:0004719 | protein-L-isoaspartate (D-aspartate) O-methyltransferase activity(GO:0004719) |
| 0.1 | 0.1 | GO:0003916 | DNA topoisomerase activity(GO:0003916) |
| 0.1 | 0.3 | GO:0004119 | cGMP-inhibited cyclic-nucleotide phosphodiesterase activity(GO:0004119) |
| 0.1 | 0.1 | GO:0004096 | catalase activity(GO:0004096) |
| 0.1 | 0.6 | GO:0004447 | iodide peroxidase activity(GO:0004447) |
| 0.1 | 0.2 | GO:0097199 | cysteine-type endopeptidase activity involved in apoptotic signaling pathway(GO:0097199) |
| 0.1 | 0.6 | GO:0023025 | MHC class Ib protein complex binding(GO:0023025) MHC class Ib protein binding, via antigen binding groove(GO:0023030) |
| 0.1 | 1.5 | GO:0015643 | toxic substance binding(GO:0015643) |
| 0.1 | 0.6 | GO:0008269 | JAK pathway signal transduction adaptor activity(GO:0008269) |
| 0.1 | 0.7 | GO:0016723 | oxidoreductase activity, oxidizing metal ions, NAD or NADP as acceptor(GO:0016723) |
| 0.1 | 0.3 | GO:0052810 | 1-phosphatidylinositol-5-kinase activity(GO:0052810) |
| 0.1 | 1.9 | GO:0019841 | retinol binding(GO:0019841) |
| 0.1 | 1.5 | GO:0032454 | histone demethylase activity (H3-K9 specific)(GO:0032454) |
| 0.1 | 0.5 | GO:0030144 | alpha-1,6-mannosylglycoprotein 6-beta-N-acetylglucosaminyltransferase activity(GO:0030144) |
| 0.1 | 3.3 | GO:0005031 | tumor necrosis factor-activated receptor activity(GO:0005031) death receptor activity(GO:0005035) |
| 0.1 | 0.4 | GO:0044020 | histone methyltransferase activity (H4-R3 specific)(GO:0044020) |
| 0.1 | 0.3 | GO:0051377 | mannose-ethanolamine phosphotransferase activity(GO:0051377) |
| 0.1 | 1.0 | GO:0017151 | DEAD/H-box RNA helicase binding(GO:0017151) |
| 0.1 | 0.3 | GO:0032052 | bile acid binding(GO:0032052) |
| 0.1 | 0.2 | GO:0047006 | 17-alpha,20-alpha-dihydroxypregn-4-en-3-one dehydrogenase activity(GO:0047006) |
| 0.1 | 0.1 | GO:0008430 | selenium binding(GO:0008430) |
| 0.1 | 0.4 | GO:0032217 | riboflavin transporter activity(GO:0032217) |
| 0.1 | 2.7 | GO:0016709 | oxidoreductase activity, acting on paired donors, with incorporation or reduction of molecular oxygen, NAD(P)H as one donor, and incorporation of one atom of oxygen(GO:0016709) |
| 0.1 | 0.3 | GO:0008281 | sulfonylurea receptor activity(GO:0008281) |
| 0.1 | 1.0 | GO:0016423 | tRNA (guanine) methyltransferase activity(GO:0016423) |
| 0.1 | 0.4 | GO:0060002 | plus-end directed microfilament motor activity(GO:0060002) |
| 0.1 | 0.4 | GO:0001025 | RNA polymerase III transcription factor binding(GO:0001025) |
| 0.1 | 2.0 | GO:0030553 | cGMP binding(GO:0030553) |
| 0.1 | 0.4 | GO:0010521 | telomerase inhibitor activity(GO:0010521) |
| 0.1 | 1.2 | GO:0008376 | acetylgalactosaminyltransferase activity(GO:0008376) |
| 0.1 | 0.3 | GO:0004991 | parathyroid hormone receptor activity(GO:0004991) |
| 0.1 | 0.3 | GO:0035241 | protein-arginine omega-N monomethyltransferase activity(GO:0035241) |
| 0.1 | 0.9 | GO:0004652 | polynucleotide adenylyltransferase activity(GO:0004652) |
| 0.1 | 0.3 | GO:0047045 | testosterone 17-beta-dehydrogenase (NADP+) activity(GO:0047045) |
| 0.1 | 0.1 | GO:0008649 | rRNA methyltransferase activity(GO:0008649) |
| 0.1 | 0.3 | GO:0004603 | phenylethanolamine N-methyltransferase activity(GO:0004603) |
| 0.1 | 2.0 | GO:0032794 | GTPase activating protein binding(GO:0032794) |
| 0.1 | 0.3 | GO:1902122 | chenodeoxycholic acid binding(GO:1902122) |
| 0.1 | 0.3 | GO:0047035 | testosterone dehydrogenase (NAD+) activity(GO:0047035) |
| 0.1 | 2.1 | GO:0015347 | sodium-independent organic anion transmembrane transporter activity(GO:0015347) |
| 0.1 | 4.9 | GO:0019894 | kinesin binding(GO:0019894) |
| 0.1 | 0.5 | GO:0004046 | aminoacylase activity(GO:0004046) |
| 0.1 | 0.5 | GO:0003872 | 6-phosphofructokinase activity(GO:0003872) |
| 0.1 | 0.3 | GO:0016309 | 1-phosphatidylinositol-5-phosphate 4-kinase activity(GO:0016309) |
| 0.1 | 0.1 | GO:0015216 | purine nucleotide transmembrane transporter activity(GO:0015216) |
| 0.1 | 0.7 | GO:0015556 | C4-dicarboxylate transmembrane transporter activity(GO:0015556) |
| 0.1 | 0.4 | GO:0032810 | sterol response element binding(GO:0032810) |
| 0.1 | 0.5 | GO:0043028 | cysteine-type endopeptidase regulator activity involved in apoptotic process(GO:0043028) |
| 0.1 | 1.6 | GO:0046875 | ephrin receptor binding(GO:0046875) |
| 0.1 | 1.3 | GO:0050700 | CARD domain binding(GO:0050700) |
| 0.1 | 0.2 | GO:0008502 | melatonin receptor activity(GO:0008502) |
| 0.1 | 1.4 | GO:0004143 | diacylglycerol kinase activity(GO:0004143) |
| 0.1 | 0.4 | GO:0004815 | aspartate-tRNA ligase activity(GO:0004815) |
| 0.1 | 0.5 | GO:0008559 | xenobiotic-transporting ATPase activity(GO:0008559) |
| 0.1 | 0.2 | GO:0046573 | lactonohydrolase activity(GO:0046573) acyl-L-homoserine-lactone lactonohydrolase activity(GO:0102007) |
| 0.1 | 0.2 | GO:0008241 | peptidyl-dipeptidase activity(GO:0008241) |
| 0.1 | 0.1 | GO:0031748 | D1 dopamine receptor binding(GO:0031748) |
| 0.1 | 0.9 | GO:0017091 | AU-rich element binding(GO:0017091) |
| 0.1 | 0.2 | GO:0005105 | type 1 fibroblast growth factor receptor binding(GO:0005105) |
| 0.1 | 0.5 | GO:0031705 | bombesin receptor binding(GO:0031705) |
| 0.1 | 0.2 | GO:0008486 | endopolyphosphatase activity(GO:0000298) diphosphoinositol-polyphosphate diphosphatase activity(GO:0008486) bis(5'-adenosyl)-hexaphosphatase activity(GO:0034431) bis(5'-adenosyl)-pentaphosphatase activity(GO:0034432) inositol diphosphate tetrakisphosphate diphosphatase activity(GO:0052840) inositol bisdiphosphate tetrakisphosphate diphosphatase activity(GO:0052841) inositol diphosphate pentakisphosphate diphosphatase activity(GO:0052842) inositol-1-diphosphate-2,3,4,5,6-pentakisphosphate diphosphatase activity(GO:0052843) inositol-3-diphosphate-1,2,4,5,6-pentakisphosphate diphosphatase activity(GO:0052844) inositol-5-diphosphate-1,2,3,4,6-pentakisphosphate diphosphatase activity(GO:0052845) inositol-1,5-bisdiphosphate-2,3,4,6-tetrakisphosphate 1-diphosphatase activity(GO:0052846) inositol-1,5-bisdiphosphate-2,3,4,6-tetrakisphosphate 5-diphosphatase activity(GO:0052847) inositol-3,5-bisdiphosphate-2,3,4,6-tetrakisphosphate 5-diphosphatase activity(GO:0052848) |
| 0.1 | 1.3 | GO:0008556 | sodium:potassium-exchanging ATPase activity(GO:0005391) potassium-transporting ATPase activity(GO:0008556) |
| 0.1 | 0.2 | GO:0004819 | glutamine-tRNA ligase activity(GO:0004819) |
| 0.1 | 0.5 | GO:0034046 | poly(G) binding(GO:0034046) |
| 0.1 | 0.5 | GO:0030371 | translation repressor activity(GO:0030371) |
| 0.1 | 0.2 | GO:0005222 | intracellular cAMP activated cation channel activity(GO:0005222) |
| 0.1 | 1.5 | GO:0001054 | RNA polymerase I activity(GO:0001054) |
| 0.1 | 0.2 | GO:0043140 | ATP-dependent 3'-5' DNA helicase activity(GO:0043140) |
| 0.1 | 0.5 | GO:0090599 | alpha-glucosidase activity(GO:0090599) |
| 0.1 | 0.2 | GO:0004307 | ethanolaminephosphotransferase activity(GO:0004307) |
| 0.1 | 0.3 | GO:0050220 | prostaglandin-E synthase activity(GO:0050220) |
| 0.1 | 0.2 | GO:0050429 | calcium-dependent phospholipase C activity(GO:0050429) |
| 0.1 | 0.4 | GO:0031435 | mitogen-activated protein kinase kinase kinase binding(GO:0031435) |
| 0.1 | 0.2 | GO:0051380 | beta-adrenergic receptor activity(GO:0004939) norepinephrine binding(GO:0051380) |
| 0.1 | 0.7 | GO:0005025 | transforming growth factor beta receptor activity, type I(GO:0005025) |
| 0.1 | 0.1 | GO:0003990 | acetylcholinesterase activity(GO:0003990) |
| 0.1 | 2.0 | GO:0017056 | structural constituent of nuclear pore(GO:0017056) |
| 0.1 | 0.2 | GO:0080122 | coenzyme A transmembrane transporter activity(GO:0015228) adenosine 3',5'-bisphosphate transmembrane transporter activity(GO:0071077) AMP transmembrane transporter activity(GO:0080122) |
| 0.1 | 0.2 | GO:0042608 | T cell receptor binding(GO:0042608) |
| 0.1 | 0.9 | GO:0071837 | HMG box domain binding(GO:0071837) |
| 0.1 | 0.4 | GO:0004741 | [pyruvate dehydrogenase (lipoamide)] phosphatase activity(GO:0004741) |
| 0.1 | 0.4 | GO:0017018 | myosin phosphatase activity(GO:0017018) |
| 0.1 | 0.3 | GO:0003963 | RNA-3'-phosphate cyclase activity(GO:0003963) |
| 0.1 | 0.9 | GO:0019957 | C-C chemokine binding(GO:0019957) |
| 0.1 | 2.2 | GO:0005388 | calcium-transporting ATPase activity(GO:0005388) |
| 0.1 | 1.8 | GO:0051428 | peptide hormone receptor binding(GO:0051428) |
| 0.1 | 0.5 | GO:0016813 | hydrolase activity, acting on carbon-nitrogen (but not peptide) bonds, in linear amidines(GO:0016813) |
| 0.1 | 0.9 | GO:0035612 | AP-2 adaptor complex binding(GO:0035612) |
| 0.1 | 1.0 | GO:0005095 | GTPase inhibitor activity(GO:0005095) |
| 0.1 | 0.9 | GO:0017176 | phosphatidylinositol N-acetylglucosaminyltransferase activity(GO:0017176) |
| 0.1 | 0.4 | GO:0009378 | four-way junction helicase activity(GO:0009378) |
| 0.1 | 0.4 | GO:0005004 | GPI-linked ephrin receptor activity(GO:0005004) |
| 0.1 | 0.9 | GO:0038036 | sphingosine-1-phosphate receptor activity(GO:0038036) |
| 0.1 | 0.4 | GO:0050610 | oxidoreductase activity, acting on a sulfur group of donors, quinone or similar compound as acceptor(GO:0016672) glutathione dehydrogenase (ascorbate) activity(GO:0045174) methylarsonate reductase activity(GO:0050610) |
| 0.1 | 0.7 | GO:0004767 | sphingomyelin phosphodiesterase activity(GO:0004767) |
| 0.1 | 3.2 | GO:0017080 | sodium channel regulator activity(GO:0017080) |
| 0.1 | 1.1 | GO:0008061 | chitin binding(GO:0008061) |
| 0.1 | 0.2 | GO:0015235 | cobalamin transporter activity(GO:0015235) |
| 0.1 | 0.1 | GO:0001034 | RNA polymerase III transcription factor activity, sequence-specific DNA binding(GO:0001034) |
| 0.1 | 0.2 | GO:0031177 | phosphopantetheine binding(GO:0031177) |
| 0.1 | 1.4 | GO:0034450 | ubiquitin-ubiquitin ligase activity(GO:0034450) |
| 0.1 | 0.1 | GO:0070644 | vitamin D response element binding(GO:0070644) |
| 0.1 | 0.2 | GO:0034511 | U3 snoRNA binding(GO:0034511) |
| 0.1 | 0.5 | GO:0015269 | calcium-activated potassium channel activity(GO:0015269) |
| 0.1 | 3.5 | GO:0030507 | spectrin binding(GO:0030507) |
| 0.1 | 0.5 | GO:0004126 | cytidine deaminase activity(GO:0004126) |
| 0.1 | 0.1 | GO:0015275 | stretch-activated, cation-selective, calcium channel activity(GO:0015275) |
| 0.1 | 0.8 | GO:0043176 | amine binding(GO:0043176) serotonin binding(GO:0051378) |
| 0.1 | 1.1 | GO:0019911 | structural constituent of myelin sheath(GO:0019911) |
| 0.1 | 0.3 | GO:0004161 | dimethylallyltranstransferase activity(GO:0004161) geranyltranstransferase activity(GO:0004337) |
| 0.1 | 0.7 | GO:0047499 | calcium-independent phospholipase A2 activity(GO:0047499) |
| 0.1 | 2.8 | GO:0001103 | RNA polymerase II repressing transcription factor binding(GO:0001103) |
| 0.1 | 1.3 | GO:0035259 | glucocorticoid receptor binding(GO:0035259) |
| 0.1 | 0.4 | GO:0030621 | U4 snRNA binding(GO:0030621) |
| 0.1 | 0.2 | GO:0004967 | glucagon receptor activity(GO:0004967) |
| 0.1 | 0.3 | GO:0033612 | receptor serine/threonine kinase binding(GO:0033612) |
| 0.1 | 0.3 | GO:0016262 | protein N-acetylglucosaminyltransferase activity(GO:0016262) |
| 0.1 | 0.3 | GO:0016882 | cyclo-ligase activity(GO:0016882) |
| 0.1 | 0.6 | GO:0015220 | choline transmembrane transporter activity(GO:0015220) |
| 0.1 | 0.3 | GO:0015319 | sodium:inorganic phosphate symporter activity(GO:0015319) |
| 0.1 | 0.5 | GO:0050816 | phosphothreonine binding(GO:0050816) |
| 0.1 | 0.3 | GO:0070180 | large ribosomal subunit rRNA binding(GO:0070180) |
| 0.1 | 0.1 | GO:0070026 | nitric oxide binding(GO:0070026) |
| 0.1 | 0.3 | GO:0003976 | UDP-N-acetylglucosamine-lysosomal-enzyme N-acetylglucosaminephosphotransferase activity(GO:0003976) |
| 0.1 | 0.6 | GO:0051766 | inositol trisphosphate kinase activity(GO:0051766) |
| 0.1 | 0.4 | GO:0017161 | phosphatidylinositol-3,4-bisphosphate 4-phosphatase activity(GO:0016316) inositol-1,3,4-trisphosphate 4-phosphatase activity(GO:0017161) inositol-3,4-bisphosphate 4-phosphatase activity(GO:0052828) |
| 0.1 | 0.3 | GO:0003831 | beta-N-acetylglucosaminylglycopeptide beta-1,4-galactosyltransferase activity(GO:0003831) |
| 0.1 | 0.2 | GO:0070016 | armadillo repeat domain binding(GO:0070016) |
| 0.1 | 0.5 | GO:0015252 | hydrogen ion channel activity(GO:0015252) |
| 0.1 | 0.1 | GO:0008174 | mRNA methyltransferase activity(GO:0008174) |
| 0.1 | 0.7 | GO:0004579 | dolichyl-diphosphooligosaccharide-protein glycotransferase activity(GO:0004579) |
| 0.1 | 0.2 | GO:0008140 | cAMP response element binding protein binding(GO:0008140) |
| 0.1 | 0.7 | GO:1990381 | ubiquitin-specific protease binding(GO:1990381) |
| 0.1 | 1.1 | GO:0022841 | potassium ion leak channel activity(GO:0022841) |
| 0.1 | 0.1 | GO:0015932 | nucleobase-containing compound transmembrane transporter activity(GO:0015932) |
| 0.1 | 0.1 | GO:0004731 | purine-nucleoside phosphorylase activity(GO:0004731) |
| 0.1 | 0.9 | GO:0001206 | transcriptional repressor activity, RNA polymerase II distal enhancer sequence-specific binding(GO:0001206) |
| 0.1 | 0.2 | GO:0004618 | phosphoglycerate kinase activity(GO:0004618) |
| 0.1 | 0.2 | GO:0050509 | N-acetylglucosaminyl-proteoglycan 4-beta-glucuronosyltransferase activity(GO:0050509) |
| 0.1 | 2.2 | GO:0004385 | guanylate kinase activity(GO:0004385) |
| 0.1 | 0.2 | GO:0004828 | serine-tRNA ligase activity(GO:0004828) |
| 0.1 | 0.2 | GO:0004911 | interleukin-2 receptor activity(GO:0004911) interleukin-2 binding(GO:0019976) |
| 0.1 | 0.7 | GO:0046972 | histone acetyltransferase activity (H4-K5 specific)(GO:0043995) histone acetyltransferase activity (H4-K8 specific)(GO:0043996) histone acetyltransferase activity (H4-K16 specific)(GO:0046972) |
| 0.1 | 1.2 | GO:0015095 | magnesium ion transmembrane transporter activity(GO:0015095) |
| 0.1 | 0.5 | GO:0005052 | peroxisome matrix targeting signal-1 binding(GO:0005052) |
| 0.1 | 1.4 | GO:0034237 | protein kinase A regulatory subunit binding(GO:0034237) |
| 0.1 | 0.5 | GO:0015279 | store-operated calcium channel activity(GO:0015279) |
| 0.1 | 0.4 | GO:0004013 | adenosylhomocysteinase activity(GO:0004013) trialkylsulfonium hydrolase activity(GO:0016802) |
| 0.1 | 7.8 | GO:0004867 | serine-type endopeptidase inhibitor activity(GO:0004867) |
| 0.1 | 1.1 | GO:0008190 | eukaryotic initiation factor 4E binding(GO:0008190) |
| 0.1 | 0.2 | GO:0016936 | galactoside binding(GO:0016936) |
| 0.1 | 0.2 | GO:0036009 | protein-glutamine N-methyltransferase activity(GO:0036009) histone-glutamine methyltransferase activity(GO:1990259) |
| 0.1 | 0.2 | GO:0052642 | lysophosphatidic acid phosphatase activity(GO:0052642) |
| 0.1 | 0.3 | GO:0017159 | pantetheine hydrolase activity(GO:0017159) |
| 0.1 | 0.2 | GO:0072345 | NAADP-sensitive calcium-release channel activity(GO:0072345) |
| 0.1 | 0.6 | GO:0005049 | nuclear export signal receptor activity(GO:0005049) |
| 0.1 | 0.1 | GO:0015440 | peptide-transporting ATPase activity(GO:0015440) |
| 0.1 | 5.5 | GO:0000980 | RNA polymerase II distal enhancer sequence-specific DNA binding(GO:0000980) |
| 0.1 | 0.2 | GO:0045155 | electron transporter, transferring electrons from CoQH2-cytochrome c reductase complex and cytochrome c oxidase complex activity(GO:0045155) |
| 0.1 | 1.1 | GO:0071855 | neuropeptide receptor binding(GO:0071855) |
| 0.1 | 0.2 | GO:0005160 | transforming growth factor beta receptor binding(GO:0005160) |
| 0.1 | 0.1 | GO:0004392 | heme oxygenase (decyclizing) activity(GO:0004392) |
| 0.1 | 0.3 | GO:0004830 | tryptophan-tRNA ligase activity(GO:0004830) |
| 0.1 | 0.1 | GO:0008410 | CoA-transferase activity(GO:0008410) |
| 0.1 | 0.5 | GO:0086007 | voltage-gated calcium channel activity involved in cardiac muscle cell action potential(GO:0086007) |
| 0.1 | 0.2 | GO:0004329 | formate-tetrahydrofolate ligase activity(GO:0004329) |
| 0.1 | 0.3 | GO:0008273 | calcium, potassium:sodium antiporter activity(GO:0008273) |
| 0.1 | 0.4 | GO:0005338 | nucleotide-sugar transmembrane transporter activity(GO:0005338) |
| 0.1 | 0.3 | GO:0004045 | aminoacyl-tRNA hydrolase activity(GO:0004045) |
| 0.1 | 0.3 | GO:0004668 | protein-arginine deiminase activity(GO:0004668) |
| 0.1 | 0.3 | GO:0016175 | superoxide-generating NADPH oxidase activity(GO:0016175) |
| 0.1 | 0.8 | GO:0004708 | MAP kinase kinase activity(GO:0004708) |
| 0.1 | 0.3 | GO:0000150 | recombinase activity(GO:0000150) |
| 0.1 | 0.3 | GO:0046624 | sphingolipid transporter activity(GO:0046624) |
| 0.1 | 0.5 | GO:0004687 | myosin light chain kinase activity(GO:0004687) |
| 0.1 | 0.1 | GO:0061649 | ubiquitinated histone binding(GO:0061649) |
| 0.1 | 0.2 | GO:1990190 | peptide-glutamate-N-acetyltransferase activity(GO:1990190) |
| 0.1 | 0.4 | GO:0005113 | patched binding(GO:0005113) |
| 0.1 | 0.9 | GO:0031957 | very long-chain fatty acid-CoA ligase activity(GO:0031957) |
| 0.1 | 0.2 | GO:0034057 | RNA strand-exchange activity(GO:0034057) |
| 0.1 | 0.2 | GO:0043141 | ATP-dependent 5'-3' DNA helicase activity(GO:0043141) |
| 0.0 | 0.3 | GO:0003747 | translation release factor activity(GO:0003747) translation termination factor activity(GO:0008079) |
| 0.0 | 0.6 | GO:0016505 | peptidase activator activity involved in apoptotic process(GO:0016505) |
| 0.0 | 0.2 | GO:0098811 | transcriptional activator activity, RNA polymerase II transcription factor binding(GO:0001190) transcriptional repressor activity, RNA polymerase II activating transcription factor binding(GO:0098811) |
| 0.0 | 0.4 | GO:0004565 | beta-galactosidase activity(GO:0004565) |
| 0.0 | 0.5 | GO:0050998 | nitric-oxide synthase binding(GO:0050998) |
| 0.0 | 0.2 | GO:0008073 | ornithine decarboxylase inhibitor activity(GO:0008073) |
| 0.0 | 0.1 | GO:0004144 | diacylglycerol O-acyltransferase activity(GO:0004144) |
| 0.0 | 0.1 | GO:0000384 | first spliceosomal transesterification activity(GO:0000384) |
| 0.0 | 0.5 | GO:0004691 | cAMP-dependent protein kinase activity(GO:0004691) |
| 0.0 | 1.0 | GO:0043395 | heparan sulfate proteoglycan binding(GO:0043395) |
| 0.0 | 0.0 | GO:0050405 | [hydroxymethylglutaryl-CoA reductase (NADPH)] kinase activity(GO:0047322) [acetyl-CoA carboxylase] kinase activity(GO:0050405) |
| 0.0 | 0.1 | GO:0097363 | protein O-GlcNAc transferase activity(GO:0097363) |
| 0.0 | 0.3 | GO:0016833 | oxo-acid-lyase activity(GO:0016833) |
| 0.0 | 0.6 | GO:0005094 | Rho GDP-dissociation inhibitor activity(GO:0005094) |
| 0.0 | 0.8 | GO:0004707 | MAP kinase activity(GO:0004707) |
| 0.0 | 0.7 | GO:0004985 | opioid receptor activity(GO:0004985) |
| 0.0 | 0.8 | GO:0050811 | GABA receptor binding(GO:0050811) |
| 0.0 | 2.4 | GO:0004715 | non-membrane spanning protein tyrosine kinase activity(GO:0004715) |
| 0.0 | 0.0 | GO:0017098 | sulfonylurea receptor binding(GO:0017098) |
| 0.0 | 1.2 | GO:0000146 | microfilament motor activity(GO:0000146) |
| 0.0 | 0.1 | GO:0003829 | beta-1,3-galactosyl-O-glycosyl-glycoprotein beta-1,6-N-acetylglucosaminyltransferase activity(GO:0003829) |
| 0.0 | 0.6 | GO:0010385 | double-stranded methylated DNA binding(GO:0010385) |
| 0.0 | 0.7 | GO:0031702 | type 1 angiotensin receptor binding(GO:0031702) |
| 0.0 | 0.8 | GO:0008417 | fucosyltransferase activity(GO:0008417) |
| 0.0 | 0.1 | GO:0004663 | Rab geranylgeranyltransferase activity(GO:0004663) |
| 0.0 | 0.1 | GO:0016835 | carbon-oxygen lyase activity(GO:0016835) |
| 0.0 | 0.6 | GO:0004875 | complement receptor activity(GO:0004875) |
| 0.0 | 0.3 | GO:0017150 | tRNA dihydrouridine synthase activity(GO:0017150) |
| 0.0 | 0.2 | GO:0047820 | D-glutamate cyclase activity(GO:0047820) |
| 0.0 | 0.1 | GO:0048763 | calcium-induced calcium release activity(GO:0048763) |
| 0.0 | 0.1 | GO:0001181 | transcription factor activity, core RNA polymerase I binding(GO:0001181) |
| 0.0 | 4.8 | GO:0005089 | Rho guanyl-nucleotide exchange factor activity(GO:0005089) |
| 0.0 | 0.1 | GO:0080101 | phosphatidyl-N-methylethanolamine N-methyltransferase activity(GO:0000773) phosphatidylethanolamine N-methyltransferase activity(GO:0004608) phosphatidyl-N-dimethylethanolamine N-methyltransferase activity(GO:0080101) |
| 0.0 | 0.2 | GO:0051864 | histone demethylase activity (H3-K36 specific)(GO:0051864) |
| 0.0 | 0.2 | GO:0004303 | estradiol 17-beta-dehydrogenase activity(GO:0004303) |
| 0.0 | 0.1 | GO:0035473 | lipase binding(GO:0035473) |
| 0.0 | 0.3 | GO:0015245 | fatty acid transporter activity(GO:0015245) |
| 0.0 | 0.1 | GO:0004920 | interleukin-10 receptor activity(GO:0004920) |
| 0.0 | 0.5 | GO:0001161 | intronic transcription regulatory region sequence-specific DNA binding(GO:0001161) intronic transcription regulatory region DNA binding(GO:0044213) |
| 0.0 | 0.1 | GO:0051139 | metal ion:proton antiporter activity(GO:0051139) |
| 0.0 | 0.3 | GO:0061134 | peptidase regulator activity(GO:0061134) |
| 0.0 | 0.2 | GO:0097677 | STAT family protein binding(GO:0097677) |
| 0.0 | 0.1 | GO:0016907 | G-protein coupled acetylcholine receptor activity(GO:0016907) |
| 0.0 | 0.2 | GO:0016725 | oxidoreductase activity, acting on CH or CH2 groups(GO:0016725) |
| 0.0 | 1.8 | GO:0005164 | tumor necrosis factor receptor binding(GO:0005164) |
| 0.0 | 1.8 | GO:0004864 | protein phosphatase inhibitor activity(GO:0004864) |
| 0.0 | 0.3 | GO:0003700 | nucleic acid binding transcription factor activity(GO:0001071) transcription factor activity, sequence-specific DNA binding(GO:0003700) |
| 0.0 | 0.2 | GO:0031208 | POZ domain binding(GO:0031208) |
| 0.0 | 0.1 | GO:0004775 | succinate-CoA ligase (ADP-forming) activity(GO:0004775) |
| 0.0 | 0.2 | GO:0052650 | NADP-retinol dehydrogenase activity(GO:0052650) |
| 0.0 | 0.1 | GO:0003839 | gamma-glutamylcyclotransferase activity(GO:0003839) |
| 0.0 | 0.5 | GO:0015266 | protein channel activity(GO:0015266) |
| 0.0 | 0.1 | GO:0003968 | RNA-directed RNA polymerase activity(GO:0003968) |
| 0.0 | 0.6 | GO:0009982 | pseudouridine synthase activity(GO:0009982) |
| 0.0 | 0.3 | GO:0061575 | cyclin-dependent protein serine/threonine kinase activator activity(GO:0061575) |
| 0.0 | 0.1 | GO:0036033 | mediator complex binding(GO:0036033) |
| 0.0 | 0.2 | GO:0015272 | ATP-activated inward rectifier potassium channel activity(GO:0015272) |
| 0.0 | 1.0 | GO:0043325 | phosphatidylinositol-3,4-bisphosphate binding(GO:0043325) |
| 0.0 | 0.3 | GO:0019784 | NEDD8-specific protease activity(GO:0019784) |
| 0.0 | 0.1 | GO:0003989 | acetyl-CoA carboxylase activity(GO:0003989) |
| 0.0 | 0.1 | GO:0005502 | 11-cis retinal binding(GO:0005502) |
| 0.0 | 0.1 | GO:0043024 | ribosomal small subunit binding(GO:0043024) |
| 0.0 | 0.1 | GO:0015173 | aromatic amino acid transmembrane transporter activity(GO:0015173) |
| 0.0 | 2.9 | GO:0000979 | RNA polymerase II core promoter sequence-specific DNA binding(GO:0000979) |
| 0.0 | 0.1 | GO:0097506 | uracil DNA N-glycosylase activity(GO:0004844) deaminated base DNA N-glycosylase activity(GO:0097506) |
| 0.0 | 0.1 | GO:0008309 | double-stranded DNA exodeoxyribonuclease activity(GO:0008309) |
| 0.0 | 0.1 | GO:0001851 | complement component C3b binding(GO:0001851) |
| 0.0 | 1.0 | GO:0004435 | phosphatidylinositol phospholipase C activity(GO:0004435) |
| 0.0 | 0.4 | GO:0001222 | transcription corepressor binding(GO:0001222) |
| 0.0 | 0.8 | GO:0004012 | phospholipid-translocating ATPase activity(GO:0004012) |
| 0.0 | 0.2 | GO:0004427 | inorganic diphosphatase activity(GO:0004427) |
| 0.0 | 0.1 | GO:0070643 | vitamin D3 25-hydroxylase activity(GO:0030343) vitamin D 25-hydroxylase activity(GO:0070643) |
| 0.0 | 0.4 | GO:0002161 | aminoacyl-tRNA editing activity(GO:0002161) |
| 0.0 | 0.2 | GO:0032558 | adenyl deoxyribonucleotide binding(GO:0032558) dATP binding(GO:0032564) |
| 0.0 | 0.1 | GO:1901338 | catecholamine binding(GO:1901338) |
| 0.0 | 1.1 | GO:0005337 | nucleoside transmembrane transporter activity(GO:0005337) |
| 0.0 | 0.5 | GO:0005549 | odorant binding(GO:0005549) |
| 0.0 | 0.0 | GO:0016748 | succinyltransferase activity(GO:0016748) |
| 0.0 | 0.2 | GO:0008569 | ATP-dependent microtubule motor activity, minus-end-directed(GO:0008569) |
| 0.0 | 0.3 | GO:0022833 | mechanically-gated ion channel activity(GO:0008381) mechanically gated channel activity(GO:0022833) |
| 0.0 | 0.3 | GO:0008607 | phosphorylase kinase regulator activity(GO:0008607) |
| 0.0 | 0.2 | GO:0030492 | hemoglobin binding(GO:0030492) |
| 0.0 | 0.2 | GO:0001595 | angiotensin receptor activity(GO:0001595) angiotensin type II receptor activity(GO:0004945) |
| 0.0 | 0.1 | GO:0001026 | TFIIIB-type transcription factor activity(GO:0001026) |
| 0.0 | 0.1 | GO:0004530 | deoxyribonuclease I activity(GO:0004530) |
| 0.0 | 0.2 | GO:0070290 | N-acylphosphatidylethanolamine-specific phospholipase D activity(GO:0070290) |
| 0.0 | 0.1 | GO:0034988 | Fc-gamma receptor I complex binding(GO:0034988) |
| 0.0 | 0.2 | GO:0005047 | signal recognition particle binding(GO:0005047) |
| 0.0 | 0.3 | GO:0016857 | racemase and epimerase activity, acting on carbohydrates and derivatives(GO:0016857) |
| 0.0 | 0.1 | GO:0035197 | siRNA binding(GO:0035197) |
| 0.0 | 0.0 | GO:0032089 | NACHT domain binding(GO:0032089) |
| 0.0 | 0.1 | GO:0042979 | ornithine decarboxylase regulator activity(GO:0042979) |
| 0.0 | 0.3 | GO:0003917 | DNA topoisomerase type I activity(GO:0003917) |
| 0.0 | 0.2 | GO:0060698 | endoribonuclease inhibitor activity(GO:0060698) |
| 0.0 | 0.1 | GO:0004087 | carbamoyl-phosphate synthase (ammonia) activity(GO:0004087) carbamoyl-phosphate synthase (glutamine-hydrolyzing) activity(GO:0004088) |
| 0.0 | 0.1 | GO:0004694 | eukaryotic translation initiation factor 2alpha kinase activity(GO:0004694) |
| 0.0 | 1.2 | GO:0044183 | protein binding involved in protein folding(GO:0044183) |
| 0.0 | 0.1 | GO:0008177 | succinate dehydrogenase (ubiquinone) activity(GO:0008177) |
| 0.0 | 0.3 | GO:0042609 | CD4 receptor binding(GO:0042609) |
| 0.0 | 0.4 | GO:0043142 | single-stranded DNA-dependent ATPase activity(GO:0043142) |
| 0.0 | 0.2 | GO:1990932 | 5.8S rRNA binding(GO:1990932) |
| 0.0 | 0.1 | GO:0004769 | steroid delta-isomerase activity(GO:0004769) |
| 0.0 | 0.3 | GO:0004596 | peptide alpha-N-acetyltransferase activity(GO:0004596) |
| 0.0 | 0.0 | GO:0070905 | serine binding(GO:0070905) |
| 0.0 | 0.1 | GO:0004766 | spermidine synthase activity(GO:0004766) |
| 0.0 | 0.1 | GO:0008889 | glycerophosphodiester phosphodiesterase activity(GO:0008889) |
| 0.0 | 0.1 | GO:0010484 | H3 histone acetyltransferase activity(GO:0010484) |
| 0.0 | 0.4 | GO:0005487 | nucleocytoplasmic transporter activity(GO:0005487) |
| 0.0 | 0.7 | GO:0050321 | tau-protein kinase activity(GO:0050321) |
| 0.0 | 0.2 | GO:0005313 | L-glutamate transmembrane transporter activity(GO:0005313) acidic amino acid transmembrane transporter activity(GO:0015172) |
| 0.0 | 0.1 | GO:0050692 | DBD domain binding(GO:0050692) |
| 0.0 | 3.9 | GO:0035591 | signaling adaptor activity(GO:0035591) |
| 0.0 | 0.1 | GO:0016434 | rRNA (cytosine) methyltransferase activity(GO:0016434) |
| 0.0 | 0.6 | GO:0015923 | mannosidase activity(GO:0015923) |
| 0.0 | 0.1 | GO:0015616 | DNA translocase activity(GO:0015616) |
| 0.0 | 0.2 | GO:0019215 | intermediate filament binding(GO:0019215) |
| 0.0 | 0.1 | GO:0031862 | prostanoid receptor binding(GO:0031862) |
| 0.0 | 0.1 | GO:0047726 | iron-cytochrome-c reductase activity(GO:0047726) |
| 0.0 | 0.7 | GO:0008143 | poly(A) binding(GO:0008143) |
| 0.0 | 0.1 | GO:0000268 | peroxisome targeting sequence binding(GO:0000268) |
| 0.0 | 0.1 | GO:0016517 | interleukin-12 receptor activity(GO:0016517) |
| 0.0 | 0.1 | GO:0043023 | ribosomal large subunit binding(GO:0043023) |
| 0.0 | 0.2 | GO:0051537 | 2 iron, 2 sulfur cluster binding(GO:0051537) |
| 0.0 | 0.1 | GO:0004906 | interferon-gamma receptor activity(GO:0004906) |
| 0.0 | 0.1 | GO:0004935 | adrenergic receptor activity(GO:0004935) |
| 0.0 | 0.5 | GO:0004526 | ribonuclease P activity(GO:0004526) |
| 0.0 | 0.1 | GO:0052795 | exo-alpha-(2->3)-sialidase activity(GO:0052794) exo-alpha-(2->6)-sialidase activity(GO:0052795) exo-alpha-(2->8)-sialidase activity(GO:0052796) |
| 0.0 | 0.2 | GO:0070728 | leucine binding(GO:0070728) |
| 0.0 | 0.1 | GO:0050501 | hyaluronan synthase activity(GO:0050501) |
| 0.0 | 0.1 | GO:0035326 | enhancer binding(GO:0035326) |
| 0.0 | 0.3 | GO:0016861 | intramolecular oxidoreductase activity, interconverting aldoses and ketoses(GO:0016861) |
| 0.0 | 0.3 | GO:0004849 | uridine kinase activity(GO:0004849) |
| 0.0 | 0.1 | GO:0036134 | thromboxane-A synthase activity(GO:0004796) 12-hydroxyheptadecatrienoic acid synthase activity(GO:0036134) |
| 0.0 | 0.1 | GO:1901505 | carbohydrate derivative transporter activity(GO:1901505) |
| 0.0 | 0.1 | GO:0046966 | thyroid hormone receptor binding(GO:0046966) |
| 0.0 | 0.8 | GO:0043236 | laminin binding(GO:0043236) |
| 0.0 | 0.1 | GO:0004974 | leukotriene receptor activity(GO:0004974) |
| 0.0 | 0.3 | GO:0016273 | arginine N-methyltransferase activity(GO:0016273) protein-arginine N-methyltransferase activity(GO:0016274) |
| 0.0 | 0.3 | GO:0005542 | folic acid binding(GO:0005542) |
| 0.0 | 0.3 | GO:0097322 | 7SK snRNA binding(GO:0097322) |
| 0.0 | 0.1 | GO:0005384 | manganese ion transmembrane transporter activity(GO:0005384) |
| 0.0 | 0.1 | GO:0050253 | retinyl-palmitate esterase activity(GO:0050253) |
| 0.0 | 0.1 | GO:0000403 | Y-form DNA binding(GO:0000403) |
| 0.0 | 0.4 | GO:0005225 | volume-sensitive anion channel activity(GO:0005225) |
| 0.0 | 0.1 | GO:0000990 | transcription factor activity, core RNA polymerase binding(GO:0000990) |
| 0.0 | 0.4 | GO:0005540 | hyaluronic acid binding(GO:0005540) |
| 0.0 | 0.1 | GO:0001083 | transcription factor activity, RNA polymerase II basal transcription factor binding(GO:0001083) RNA polymerase II transcription factor activity, TBP-class protein binding, involved in preinitiation complex assembly(GO:0001129) RNA polymerase II transcription factor activity, TBP-class protein binding(GO:0001132) |
| 0.0 | 0.1 | GO:0019239 | deaminase activity(GO:0019239) |
| 0.0 | 0.1 | GO:0016286 | small conductance calcium-activated potassium channel activity(GO:0016286) |
| 0.0 | 0.1 | GO:0004140 | dephospho-CoA kinase activity(GO:0004140) |
| 0.0 | 0.0 | GO:0047631 | ADP-ribose diphosphatase activity(GO:0047631) |
| 0.0 | 0.1 | GO:0004028 | 3-chloroallyl aldehyde dehydrogenase activity(GO:0004028) |
| 0.0 | 0.2 | GO:0017134 | fibroblast growth factor binding(GO:0017134) |
| 0.0 | 0.1 | GO:0004489 | methylenetetrahydrofolate reductase (NAD(P)H) activity(GO:0004489) |
| 0.0 | 0.4 | GO:0045028 | G-protein coupled nucleotide receptor activity(GO:0001608) G-protein coupled purinergic nucleotide receptor activity(GO:0045028) |
| 0.0 | 0.1 | GO:0015215 | nucleotide transmembrane transporter activity(GO:0015215) |
| 0.0 | 0.0 | GO:0099609 | microtubule lateral binding(GO:0099609) |
| 0.0 | 0.5 | GO:0023026 | MHC class II protein complex binding(GO:0023026) |
| 0.0 | 0.5 | GO:0019888 | protein phosphatase regulator activity(GO:0019888) |
| 0.0 | 0.1 | GO:0004873 | asialoglycoprotein receptor activity(GO:0004873) |
| 0.0 | 0.1 | GO:0047288 | monosialoganglioside sialyltransferase activity(GO:0047288) |
| 0.0 | 0.1 | GO:0044547 | DNA topoisomerase binding(GO:0044547) |
| 0.0 | 0.1 | GO:0004817 | cysteine-tRNA ligase activity(GO:0004817) |
| 0.0 | 0.4 | GO:0004971 | AMPA glutamate receptor activity(GO:0004971) |
| 0.0 | 0.1 | GO:0015377 | cation:chloride symporter activity(GO:0015377) |
| 0.0 | 0.1 | GO:0005260 | channel-conductance-controlling ATPase activity(GO:0005260) |
| 0.0 | 0.7 | GO:0043015 | gamma-tubulin binding(GO:0043015) |
| 0.0 | 1.3 | GO:0033558 | protein deacetylase activity(GO:0033558) |
| 0.0 | 0.4 | GO:0008353 | RNA polymerase II carboxy-terminal domain kinase activity(GO:0008353) |
| 0.0 | 0.4 | GO:0008349 | MAP kinase kinase kinase kinase activity(GO:0008349) |
| 0.0 | 1.3 | GO:0032947 | protein complex scaffold(GO:0032947) |
| 0.0 | 0.1 | GO:0008732 | glycine hydroxymethyltransferase activity(GO:0004372) threonine aldolase activity(GO:0004793) L-allo-threonine aldolase activity(GO:0008732) |
| 0.0 | 0.1 | GO:0032408 | MutLbeta complex binding(GO:0032406) MutSbeta complex binding(GO:0032408) |
| 0.0 | 0.1 | GO:0030368 | interleukin-17 receptor activity(GO:0030368) |
| 0.0 | 0.1 | GO:0070053 | thrombospondin receptor activity(GO:0070053) |
| 0.0 | 0.3 | GO:0050840 | extracellular matrix binding(GO:0050840) |
| 0.0 | 0.6 | GO:0008188 | neuropeptide receptor activity(GO:0008188) |
| 0.0 | 0.6 | GO:0045505 | dynein intermediate chain binding(GO:0045505) |
| 0.0 | 0.4 | GO:0044390 | ubiquitin-like protein conjugating enzyme binding(GO:0044390) |
| 0.0 | 0.1 | GO:0047275 | glucosaminylgalactosylglucosylceramide beta-galactosyltransferase activity(GO:0047275) |
| 0.0 | 0.6 | GO:0051721 | protein phosphatase 2A binding(GO:0051721) |
| 0.0 | 0.4 | GO:0001134 | transcription factor activity, transcription factor recruiting(GO:0001134) |
| 0.0 | 1.3 | GO:0031490 | chromatin DNA binding(GO:0031490) |
| 0.0 | 0.0 | GO:0004365 | glyceraldehyde-3-phosphate dehydrogenase (NAD+) (phosphorylating) activity(GO:0004365) glyceraldehyde-3-phosphate dehydrogenase (NAD(P)+) (phosphorylating) activity(GO:0043891) |
| 0.0 | 0.1 | GO:0004802 | transketolase activity(GO:0004802) |
| 0.0 | 0.2 | GO:0005375 | copper ion transmembrane transporter activity(GO:0005375) |
| 0.0 | 0.1 | GO:0004057 | arginyltransferase activity(GO:0004057) |
| 0.0 | 0.1 | GO:0047696 | beta-adrenergic receptor kinase activity(GO:0047696) |
| 0.0 | 0.4 | GO:0070006 | metalloaminopeptidase activity(GO:0070006) |
| 0.0 | 0.1 | GO:0004582 | dolichyl-phosphate beta-D-mannosyltransferase activity(GO:0004582) |
| 0.0 | 0.3 | GO:0017171 | serine hydrolase activity(GO:0017171) |
| 0.0 | 0.1 | GO:0032453 | histone demethylase activity (H3-K4 specific)(GO:0032453) |
| 0.0 | 0.4 | GO:0042166 | acetylcholine binding(GO:0042166) |
| 0.0 | 0.1 | GO:0005072 | transforming growth factor beta receptor, cytoplasmic mediator activity(GO:0005072) |
| 0.0 | 0.3 | GO:0003688 | DNA replication origin binding(GO:0003688) |
| 0.0 | 0.0 | GO:0015037 | peptide disulfide oxidoreductase activity(GO:0015037) |
| 0.0 | 0.0 | GO:0051731 | ATP-dependent polydeoxyribonucleotide 5'-hydroxyl-kinase activity(GO:0046404) polynucleotide 5'-hydroxyl-kinase activity(GO:0051731) polydeoxyribonucleotide kinase activity(GO:0051733) ATP-dependent polynucleotide kinase activity(GO:0051734) |
| 0.0 | 0.1 | GO:0005143 | interleukin-12 receptor binding(GO:0005143) |
| 0.0 | 0.1 | GO:0046976 | histone methyltransferase activity (H3-K27 specific)(GO:0046976) |
| 0.0 | 0.1 | GO:0033906 | hyaluronoglucuronidase activity(GO:0033906) |
| 0.0 | 1.4 | GO:0003743 | translation initiation factor activity(GO:0003743) |
| 0.0 | 0.1 | GO:0004647 | phosphoserine phosphatase activity(GO:0004647) |
| 0.0 | 0.2 | GO:0008420 | CTD phosphatase activity(GO:0008420) |
| 0.0 | 0.1 | GO:0008301 | DNA binding, bending(GO:0008301) |
| 0.0 | 0.1 | GO:0030618 | transforming growth factor beta receptor, pathway-specific cytoplasmic mediator activity(GO:0030618) |
| 0.0 | 0.4 | GO:0005251 | delayed rectifier potassium channel activity(GO:0005251) |
| 0.0 | 0.0 | GO:0047223 | beta-1,3-galactosyl-O-glycosyl-glycoprotein beta-1,3-N-acetylglucosaminyltransferase activity(GO:0047223) |
| 0.0 | 0.0 | GO:0046975 | histone methyltransferase activity (H3-K36 specific)(GO:0046975) |
| 0.0 | 1.6 | GO:0004984 | olfactory receptor activity(GO:0004984) |
| 0.0 | 0.0 | GO:0031893 | vasopressin receptor binding(GO:0031893) |
| 0.0 | 0.7 | GO:0000049 | tRNA binding(GO:0000049) |
| 0.0 | 0.3 | GO:0015175 | neutral amino acid transmembrane transporter activity(GO:0015175) |
| 0.0 | 0.3 | GO:0031005 | filamin binding(GO:0031005) |
| 0.0 | 0.1 | GO:0102008 | cytosolic dipeptidase activity(GO:0102008) |
| 0.0 | 0.1 | GO:0003943 | N-acetylgalactosamine-4-sulfatase activity(GO:0003943) |
| 0.0 | 0.1 | GO:0004791 | thioredoxin-disulfide reductase activity(GO:0004791) |
| 0.0 | 0.1 | GO:0089720 | caspase binding(GO:0089720) |
| 0.0 | 0.5 | GO:0051019 | mitogen-activated protein kinase binding(GO:0051019) |
| 0.0 | 0.0 | GO:0036435 | K48-linked polyubiquitin binding(GO:0036435) |
| 0.0 | 0.0 | GO:0015093 | ferrous iron transmembrane transporter activity(GO:0015093) |
| 0.0 | 0.0 | GO:0032184 | SUMO polymer binding(GO:0032184) |
| 0.0 | 0.2 | GO:0017070 | U6 snRNA binding(GO:0017070) |
| 0.0 | 0.1 | GO:0031432 | titin binding(GO:0031432) |
| 0.0 | 0.1 | GO:0034353 | RNA pyrophosphohydrolase activity(GO:0034353) |
| 0.0 | 0.1 | GO:0030229 | very-low-density lipoprotein particle receptor activity(GO:0030229) |
| 0.0 | 0.1 | GO:1990825 | sequence-specific mRNA binding(GO:1990825) |
| 0.0 | 0.0 | GO:0004351 | glutamate decarboxylase activity(GO:0004351) |
| 0.0 | 0.2 | GO:0098505 | G-rich strand telomeric DNA binding(GO:0098505) |
| 0.0 | 0.5 | GO:0015020 | glucuronosyltransferase activity(GO:0015020) |
| 0.0 | 0.0 | GO:0019958 | C-X-C chemokine binding(GO:0019958) |
| 0.0 | 0.0 | GO:0032451 | demethylase activity(GO:0032451) |
| 0.0 | 0.0 | GO:0010485 | H4 histone acetyltransferase activity(GO:0010485) |
| 0.0 | 0.1 | GO:0001042 | RNA polymerase I core binding(GO:0001042) |
| 0.0 | 0.1 | GO:0046538 | bisphosphoglycerate mutase activity(GO:0004082) phosphoglycerate mutase activity(GO:0004619) 2,3-bisphosphoglycerate-dependent phosphoglycerate mutase activity(GO:0046538) |
| 0.0 | 0.1 | GO:0016167 | glial cell-derived neurotrophic factor receptor activity(GO:0016167) |
| 0.0 | 0.3 | GO:0019213 | deacetylase activity(GO:0019213) |
| 0.0 | 0.2 | GO:0019905 | syntaxin binding(GO:0019905) |
| 0.0 | 3.7 | GO:0003729 | mRNA binding(GO:0003729) poly(A) RNA binding(GO:0044822) |
| 0.0 | 0.2 | GO:0001158 | enhancer sequence-specific DNA binding(GO:0001158) |
| 0.0 | 0.0 | GO:0033754 | indoleamine 2,3-dioxygenase activity(GO:0033754) |
| 0.0 | 0.4 | GO:0008138 | protein tyrosine/serine/threonine phosphatase activity(GO:0008138) |
| 0.0 | 0.1 | GO:0004305 | ethanolamine kinase activity(GO:0004305) |
| 0.0 | 0.0 | GO:0043559 | insulin binding(GO:0043559) |
| 0.0 | 0.0 | GO:0035198 | miRNA binding(GO:0035198) |
| 0.0 | 0.1 | GO:0004449 | isocitrate dehydrogenase (NAD+) activity(GO:0004449) |
| 0.0 | 0.1 | GO:0002151 | G-quadruplex RNA binding(GO:0002151) |
| 0.0 | 0.1 | GO:0010348 | lithium:proton antiporter activity(GO:0010348) |
| 0.0 | 0.3 | GO:0008135 | translation factor activity, RNA binding(GO:0008135) |
| 0.0 | 0.3 | GO:0043621 | protein self-association(GO:0043621) |
| 0.0 | 0.1 | GO:0004629 | phospholipase C activity(GO:0004629) |
| 0.0 | 0.0 | GO:0071885 | N-terminal protein N-methyltransferase activity(GO:0071885) |
| 0.0 | 0.1 | GO:0032552 | deoxyribonucleotide binding(GO:0032552) |
| 0.0 | 0.1 | GO:0001758 | retinal dehydrogenase activity(GO:0001758) |
| 0.0 | 0.3 | GO:1990841 | promoter-specific chromatin binding(GO:1990841) |
| 0.0 | 0.1 | GO:0030215 | semaphorin receptor binding(GO:0030215) |
| 0.0 | 0.1 | GO:0043522 | leucine zipper domain binding(GO:0043522) |
| 0.0 | 0.0 | GO:0047256 | beta-galactosyl-N-acetylglucosaminylgalactosylglucosyl-ceramide beta-1,3-acetylglucosaminyltransferase activity(GO:0008457) lactosylceramide 1,3-N-acetyl-beta-D-glucosaminyltransferase activity(GO:0047256) |
| 0.0 | 0.1 | GO:0004749 | ribose phosphate diphosphokinase activity(GO:0004749) |
| 0.0 | 1.9 | GO:0001078 | transcriptional repressor activity, RNA polymerase II core promoter proximal region sequence-specific binding(GO:0001078) |
| 0.0 | 0.0 | GO:0050211 | procollagen galactosyltransferase activity(GO:0050211) |
| 0.0 | 0.0 | GO:0008267 | poly-glutamine tract binding(GO:0008267) |
| 0.0 | 0.2 | GO:0070330 | aromatase activity(GO:0070330) |
| 0.0 | 0.2 | GO:0019992 | diacylglycerol binding(GO:0019992) |
| 0.0 | 0.1 | GO:0010181 | FMN binding(GO:0010181) |
| 0.0 | 0.0 | GO:0004771 | sterol esterase activity(GO:0004771) |
| 0.0 | 0.2 | GO:0033038 | bitter taste receptor activity(GO:0033038) |
| 0.0 | 0.1 | GO:0004311 | farnesyltranstransferase activity(GO:0004311) |
| 0.0 | 0.0 | GO:0008336 | gamma-butyrobetaine dioxygenase activity(GO:0008336) |
| 0.0 | 0.4 | GO:0005246 | calcium channel regulator activity(GO:0005246) |
| 0.0 | 0.0 | GO:0034038 | deoxyhypusine synthase activity(GO:0034038) |
| 0.0 | 0.0 | GO:0009008 | DNA-methyltransferase activity(GO:0009008) |
| 0.0 | 0.0 | GO:0046974 | histone methyltransferase activity (H3-K9 specific)(GO:0046974) |
| 0.0 | 0.2 | GO:0047617 | acyl-CoA hydrolase activity(GO:0047617) |
| 0.0 | 0.0 | GO:0001223 | transcription coactivator binding(GO:0001223) |
| 0.0 | 0.0 | GO:0031826 | type 2A serotonin receptor binding(GO:0031826) |
| 0.0 | 0.0 | GO:0033170 | DNA clamp loader activity(GO:0003689) protein-DNA loading ATPase activity(GO:0033170) |
Gene overrepresentation in C2:CP category:
| Log-likelihood per target | Total log-likelihood | Term | Description |
|---|---|---|---|
| 0.5 | 11.3 | PID INTEGRIN4 PATHWAY | Alpha6 beta4 integrin-ligand interactions |
| 0.4 | 15.6 | PID ERBB NETWORK PATHWAY | ErbB receptor signaling network |
| 0.4 | 0.8 | SIG BCR SIGNALING PATHWAY | Members of the BCR signaling pathway |
| 0.3 | 1.7 | PID FRA PATHWAY | Validated transcriptional targets of AP1 family members Fra1 and Fra2 |
| 0.3 | 8.9 | PID ANTHRAX PATHWAY | Cellular roles of Anthrax toxin |
| 0.3 | 0.8 | ST IL 13 PATHWAY | Interleukin 13 (IL-13) Pathway |
| 0.2 | 12.4 | PID IL1 PATHWAY | IL1-mediated signaling events |
| 0.2 | 14.1 | PID ALPHA SYNUCLEIN PATHWAY | Alpha-synuclein signaling |
| 0.2 | 3.2 | PID HEDGEHOG 2PATHWAY | Signaling events mediated by the Hedgehog family |
| 0.2 | 0.6 | PID GLYPICAN 1PATHWAY | Glypican 1 network |
| 0.2 | 3.8 | PID FGF PATHWAY | FGF signaling pathway |
| 0.2 | 0.7 | PID ER NONGENOMIC PATHWAY | Plasma membrane estrogen receptor signaling |
| 0.1 | 3.0 | PID ECADHERIN KERATINOCYTE PATHWAY | E-cadherin signaling in keratinocytes |
| 0.1 | 0.4 | SA REG CASCADE OF CYCLIN EXPR | Expression of cyclins regulates progression through the cell cycle by activating cyclin-dependent kinases. |
| 0.1 | 0.3 | PID TRAIL PATHWAY | TRAIL signaling pathway |
| 0.1 | 3.1 | PID ERB GENOMIC PATHWAY | Validated nuclear estrogen receptor beta network |
| 0.1 | 0.7 | PID NFKAPPAB ATYPICAL PATHWAY | Atypical NF-kappaB pathway |
| 0.1 | 3.4 | PID EPHRINB REV PATHWAY | Ephrin B reverse signaling |
| 0.1 | 3.7 | PID S1P S1P1 PATHWAY | S1P1 pathway |
| 0.1 | 1.9 | SA B CELL RECEPTOR COMPLEXES | Antigen binding to B cell receptors activates protein tyrosine kinases, such as the Src family, which ultimate activate MAP kinases. |
| 0.1 | 0.2 | PID LYMPH ANGIOGENESIS PATHWAY | VEGFR3 signaling in lymphatic endothelium |
| 0.1 | 1.1 | PID SYNDECAN 2 PATHWAY | Syndecan-2-mediated signaling events |
| 0.1 | 3.0 | PID NECTIN PATHWAY | Nectin adhesion pathway |
| 0.1 | 0.8 | ST PHOSPHOINOSITIDE 3 KINASE PATHWAY | PI3K Pathway |
| 0.1 | 9.6 | PID NOTCH PATHWAY | Notch signaling pathway |
| 0.1 | 0.2 | PID PI3KCI AKT PATHWAY | Class I PI3K signaling events mediated by Akt |
| 0.1 | 1.0 | ST PAC1 RECEPTOR PATHWAY | PAC1 Receptor Pathway |
| 0.1 | 1.8 | SA TRKA RECEPTOR | The TrkA receptor binds nerve growth factor to activate MAP kinase pathways and promote cell growth. |
| 0.1 | 2.2 | ST INTERLEUKIN 4 PATHWAY | Interleukin 4 (IL-4) Pathway |
| 0.1 | 0.1 | PID RANBP2 PATHWAY | Sumoylation by RanBP2 regulates transcriptional repression |
| 0.1 | 2.5 | PID INTEGRIN5 PATHWAY | Beta5 beta6 beta7 and beta8 integrin cell surface interactions |
| 0.1 | 8.3 | PID RHOA REG PATHWAY | Regulation of RhoA activity |
| 0.1 | 4.4 | PID HIF2PATHWAY | HIF-2-alpha transcription factor network |
| 0.1 | 6.0 | PID P38 ALPHA BETA DOWNSTREAM PATHWAY | Signaling mediated by p38-alpha and p38-beta |
| 0.1 | 2.7 | PID ALK1 PATHWAY | ALK1 signaling events |
| 0.1 | 0.2 | PID CXCR3 PATHWAY | CXCR3-mediated signaling events |
| 0.1 | 0.2 | PID ALK2 PATHWAY | ALK2 signaling events |
| 0.1 | 0.4 | PID IL8 CXCR1 PATHWAY | IL8- and CXCR1-mediated signaling events |
| 0.1 | 1.3 | PID RXR VDR PATHWAY | RXR and RAR heterodimerization with other nuclear receptor |
| 0.1 | 0.3 | PID S1P S1P4 PATHWAY | S1P4 pathway |
| 0.1 | 3.9 | PID BMP PATHWAY | BMP receptor signaling |
| 0.1 | 2.3 | PID WNT SIGNALING PATHWAY | Wnt signaling network |
| 0.1 | 4.1 | PID VEGFR1 2 PATHWAY | Signaling events mediated by VEGFR1 and VEGFR2 |
| 0.1 | 1.7 | PID RETINOIC ACID PATHWAY | Retinoic acid receptors-mediated signaling |
| 0.1 | 0.6 | PID IL8 CXCR2 PATHWAY | IL8- and CXCR2-mediated signaling events |
| 0.1 | 2.2 | PID A6B1 A6B4 INTEGRIN PATHWAY | a6b1 and a6b4 Integrin signaling |
| 0.1 | 1.4 | ST GAQ PATHWAY | G alpha q Pathway |
| 0.1 | 2.6 | PID RAS PATHWAY | Regulation of Ras family activation |
| 0.1 | 3.9 | PID DELTA NP63 PATHWAY | Validated transcriptional targets of deltaNp63 isoforms |
| 0.1 | 1.3 | ST P38 MAPK PATHWAY | p38 MAPK Pathway |
| 0.1 | 0.5 | PID IL5 PATHWAY | IL5-mediated signaling events |
| 0.1 | 1.2 | PID WNT NONCANONICAL PATHWAY | Noncanonical Wnt signaling pathway |
| 0.1 | 1.7 | PID TXA2PATHWAY | Thromboxane A2 receptor signaling |
| 0.1 | 0.8 | PID WNT CANONICAL PATHWAY | Canonical Wnt signaling pathway |
| 0.0 | 0.3 | SA G1 AND S PHASES | Cdk2, 4, and 6 bind cyclin D in G1, while cdk2/cyclin E promotes the G1/S transition. |
| 0.0 | 2.7 | PID HEDGEHOG GLI PATHWAY | Hedgehog signaling events mediated by Gli proteins |
| 0.0 | 1.3 | PID EPHB FWD PATHWAY | EPHB forward signaling |
| 0.0 | 0.6 | PID IL2 1PATHWAY | IL2-mediated signaling events |
| 0.0 | 2.8 | PID MTOR 4PATHWAY | mTOR signaling pathway |
| 0.0 | 0.0 | PID THROMBIN PAR4 PATHWAY | PAR4-mediated thrombin signaling events |
| 0.0 | 1.1 | PID IL2 STAT5 PATHWAY | IL2 signaling events mediated by STAT5 |
| 0.0 | 1.5 | PID AJDISS 2PATHWAY | Posttranslational regulation of adherens junction stability and dissassembly |
| 0.0 | 1.3 | PID INTEGRIN A9B1 PATHWAY | Alpha9 beta1 integrin signaling events |
| 0.0 | 0.6 | PID EPHA FWDPATHWAY | EPHA forward signaling |
| 0.0 | 16.8 | NABA SECRETED FACTORS | Genes encoding secreted soluble factors |
| 0.0 | 0.6 | ST G ALPHA I PATHWAY | G alpha i Pathway |
| 0.0 | 0.4 | PID GMCSF PATHWAY | GMCSF-mediated signaling events |
| 0.0 | 0.5 | PID ANGIOPOIETIN RECEPTOR PATHWAY | Angiopoietin receptor Tie2-mediated signaling |
| 0.0 | 0.8 | PID IL23 PATHWAY | IL23-mediated signaling events |
| 0.0 | 0.5 | PID LPA4 PATHWAY | LPA4-mediated signaling events |
| 0.0 | 1.8 | SIG REGULATION OF THE ACTIN CYTOSKELETON BY RHO GTPASES | Genes related to regulation of the actin cytoskeleton |
| 0.0 | 1.3 | PID IL12 2PATHWAY | IL12-mediated signaling events |
| 0.0 | 0.6 | ST JNK MAPK PATHWAY | JNK MAPK Pathway |
| 0.0 | 0.3 | PID FOXO PATHWAY | FoxO family signaling |
| 0.0 | 0.1 | PID AR NONGENOMIC PATHWAY | Nongenotropic Androgen signaling |
| 0.0 | 1.9 | PID HNF3A PATHWAY | FOXA1 transcription factor network |
| 0.0 | 0.4 | SA PROGRAMMED CELL DEATH | Programmed cell death, or apoptosis, eliminates damaged or unneeded cells. |
| 0.0 | 0.2 | PID SYNDECAN 3 PATHWAY | Syndecan-3-mediated signaling events |
| 0.0 | 0.3 | PID SMAD2 3PATHWAY | Regulation of cytoplasmic and nuclear SMAD2/3 signaling |
| 0.0 | 0.3 | PID P38 ALPHA BETA PATHWAY | Regulation of p38-alpha and p38-beta |
| 0.0 | 0.7 | PID RAC1 PATHWAY | RAC1 signaling pathway |
| 0.0 | 0.2 | PID EPO PATHWAY | EPO signaling pathway |
| 0.0 | 1.0 | PID NFAT TFPATHWAY | Calcineurin-regulated NFAT-dependent transcription in lymphocytes |
| 0.0 | 0.1 | PID CXCR4 PATHWAY | CXCR4-mediated signaling events |
| 0.0 | 0.4 | PID MAPK TRK PATHWAY | Trk receptor signaling mediated by the MAPK pathway |
| 0.0 | 0.2 | ST ERK1 ERK2 MAPK PATHWAY | ERK1/ERK2 MAPK Pathway |
| 0.0 | 0.6 | PID CD8 TCR PATHWAY | TCR signaling in naïve CD8+ T cells |
| 0.0 | 0.0 | SA G2 AND M PHASES | Cdc25 activates the cdc2/cyclin B complex to induce the G2/M transition. |
| 0.0 | 0.2 | PID CERAMIDE PATHWAY | Ceramide signaling pathway |
| 0.0 | 2.3 | PID P53 DOWNSTREAM PATHWAY | Direct p53 effectors |
| 0.0 | 0.1 | ST GA12 PATHWAY | G alpha 12 Pathway |
| 0.0 | 0.3 | PID DNA PK PATHWAY | DNA-PK pathway in nonhomologous end joining |
| 0.0 | 0.1 | SIG PIP3 SIGNALING IN CARDIAC MYOCTES | Genes related to PIP3 signaling in cardiac myocytes |
| 0.0 | 0.1 | SA CASPASE CASCADE | Apoptosis is mediated by caspases, cysteine proteases arranged in a proteolytic cascade. |
| 0.0 | 0.8 | PID HDAC CLASSI PATHWAY | Signaling events mediated by HDAC Class I |
Gene overrepresentation in C2:CP:REACTOME category:
| Log-likelihood per target | Total log-likelihood | Term | Description |
|---|---|---|---|
| 0.5 | 1.0 | REACTOME P75NTR RECRUITS SIGNALLING COMPLEXES | Genes involved in p75NTR recruits signalling complexes |
| 0.5 | 0.9 | REACTOME SIGNALING BY FGFR3 MUTANTS | Genes involved in Signaling by FGFR3 mutants |
| 0.4 | 11.1 | REACTOME TGF BETA RECEPTOR SIGNALING IN EMT EPITHELIAL TO MESENCHYMAL TRANSITION | Genes involved in TGF-beta receptor signaling in EMT (epithelial to mesenchymal transition) |
| 0.3 | 6.5 | REACTOME APOPTOTIC CLEAVAGE OF CELL ADHESION PROTEINS | Genes involved in Apoptotic cleavage of cell adhesion proteins |
| 0.3 | 7.3 | REACTOME GAP JUNCTION ASSEMBLY | Genes involved in Gap junction assembly |
| 0.3 | 6.1 | REACTOME CLASS C 3 METABOTROPIC GLUTAMATE PHEROMONE RECEPTORS | Genes involved in Class C/3 (Metabotropic glutamate/pheromone receptors) |
| 0.3 | 2.1 | REACTOME HS GAG DEGRADATION | Genes involved in HS-GAG degradation |
| 0.3 | 3.6 | REACTOME GLYCOPROTEIN HORMONES | Genes involved in Glycoprotein hormones |
| 0.3 | 6.3 | REACTOME DOWNREGULATION OF ERBB2 ERBB3 SIGNALING | Genes involved in Downregulation of ERBB2:ERBB3 signaling |
| 0.3 | 6.3 | REACTOME ACTIVATION OF RAC | Genes involved in Activation of Rac |
| 0.2 | 9.9 | REACTOME TIGHT JUNCTION INTERACTIONS | Genes involved in Tight junction interactions |
| 0.2 | 9.7 | REACTOME BASIGIN INTERACTIONS | Genes involved in Basigin interactions |
| 0.2 | 0.9 | REACTOME FGFR4 LIGAND BINDING AND ACTIVATION | Genes involved in FGFR4 ligand binding and activation |
| 0.2 | 4.5 | REACTOME TRANSPORT OF ORGANIC ANIONS | Genes involved in Transport of organic anions |
| 0.2 | 20.9 | REACTOME INTERFERON GAMMA SIGNALING | Genes involved in Interferon gamma signaling |
| 0.2 | 4.6 | REACTOME INITIAL TRIGGERING OF COMPLEMENT | Genes involved in Initial triggering of complement |
| 0.2 | 16.1 | REACTOME CELL JUNCTION ORGANIZATION | Genes involved in Cell junction organization |
| 0.2 | 4.4 | REACTOME OTHER SEMAPHORIN INTERACTIONS | Genes involved in Other semaphorin interactions |
| 0.2 | 4.7 | REACTOME SYNTHESIS OF VERY LONG CHAIN FATTY ACYL COAS | Genes involved in Synthesis of very long-chain fatty acyl-CoAs |
| 0.2 | 3.8 | REACTOME TAK1 ACTIVATES NFKB BY PHOSPHORYLATION AND ACTIVATION OF IKKS COMPLEX | Genes involved in TAK1 activates NFkB by phosphorylation and activation of IKKs complex |
| 0.2 | 10.5 | REACTOME IL1 SIGNALING | Genes involved in Interleukin-1 signaling |
| 0.2 | 2.6 | REACTOME FGFR2C LIGAND BINDING AND ACTIVATION | Genes involved in FGFR2c ligand binding and activation |
| 0.2 | 1.1 | REACTOME JNK C JUN KINASES PHOSPHORYLATION AND ACTIVATION MEDIATED BY ACTIVATED HUMAN TAK1 | Genes involved in JNK (c-Jun kinases) phosphorylation and activation mediated by activated human TAK1 |
| 0.1 | 2.1 | REACTOME NEF MEDIATED DOWNREGULATION OF MHC CLASS I COMPLEX CELL SURFACE EXPRESSION | Genes involved in Nef mediated downregulation of MHC class I complex cell surface expression |
| 0.1 | 2.0 | REACTOME DSCAM INTERACTIONS | Genes involved in DSCAM interactions |
| 0.1 | 1.5 | REACTOME ACTIVATION OF NF KAPPAB IN B CELLS | Genes involved in Activation of NF-kappaB in B Cells |
| 0.1 | 3.0 | REACTOME HDL MEDIATED LIPID TRANSPORT | Genes involved in HDL-mediated lipid transport |
| 0.1 | 3.3 | REACTOME NA CL DEPENDENT NEUROTRANSMITTER TRANSPORTERS | Genes involved in Na+/Cl- dependent neurotransmitter transporters |
| 0.1 | 2.0 | REACTOME THE NLRP3 INFLAMMASOME | Genes involved in The NLRP3 inflammasome |
| 0.1 | 2.6 | REACTOME P38MAPK EVENTS | Genes involved in p38MAPK events |
| 0.1 | 0.9 | REACTOME PURINE CATABOLISM | Genes involved in Purine catabolism |
| 0.1 | 0.5 | REACTOME BINDING AND ENTRY OF HIV VIRION | Genes involved in Binding and entry of HIV virion |
| 0.1 | 5.1 | REACTOME MYOGENESIS | Genes involved in Myogenesis |
| 0.1 | 1.9 | REACTOME TANDEM PORE DOMAIN POTASSIUM CHANNELS | Genes involved in Tandem pore domain potassium channels |
| 0.1 | 1.1 | REACTOME RECEPTOR LIGAND BINDING INITIATES THE SECOND PROTEOLYTIC CLEAVAGE OF NOTCH RECEPTOR | Genes involved in Receptor-ligand binding initiates the second proteolytic cleavage of Notch receptor |
| 0.1 | 0.2 | REACTOME SIGNALING BY ERBB4 | Genes involved in Signaling by ERBB4 |
| 0.1 | 2.3 | REACTOME PRE NOTCH PROCESSING IN GOLGI | Genes involved in Pre-NOTCH Processing in Golgi |
| 0.1 | 2.9 | REACTOME PURINE SALVAGE | Genes involved in Purine salvage |
| 0.1 | 0.5 | REACTOME ACTIVATION OF THE AP1 FAMILY OF TRANSCRIPTION FACTORS | Genes involved in Activation of the AP-1 family of transcription factors |
| 0.1 | 5.2 | REACTOME ION TRANSPORT BY P TYPE ATPASES | Genes involved in Ion transport by P-type ATPases |
| 0.1 | 5.1 | REACTOME REGULATION OF HYPOXIA INDUCIBLE FACTOR HIF BY OXYGEN | Genes involved in Regulation of Hypoxia-inducible Factor (HIF) by Oxygen |
| 0.1 | 1.2 | REACTOME PECAM1 INTERACTIONS | Genes involved in PECAM1 interactions |
| 0.1 | 7.0 | REACTOME STRIATED MUSCLE CONTRACTION | Genes involved in Striated Muscle Contraction |
| 0.1 | 1.5 | REACTOME PASSIVE TRANSPORT BY AQUAPORINS | Genes involved in Passive Transport by Aquaporins |
| 0.1 | 1.5 | REACTOME REGULATION OF SIGNALING BY CBL | Genes involved in Regulation of signaling by CBL |
| 0.1 | 2.3 | REACTOME IONOTROPIC ACTIVITY OF KAINATE RECEPTORS | Genes involved in Ionotropic activity of Kainate Receptors |
| 0.1 | 2.8 | REACTOME SIGNAL REGULATORY PROTEIN SIRP FAMILY INTERACTIONS | Genes involved in Signal regulatory protein (SIRP) family interactions |
| 0.1 | 0.8 | REACTOME ROLE OF SECOND MESSENGERS IN NETRIN1 SIGNALING | Genes involved in Role of second messengers in netrin-1 signaling |
| 0.1 | 1.3 | REACTOME SIGNALING BY CONSTITUTIVELY ACTIVE EGFR | Genes involved in Signaling by constitutively active EGFR |
| 0.1 | 0.6 | REACTOME G ALPHA S SIGNALLING EVENTS | Genes involved in G alpha (s) signalling events |
| 0.1 | 2.0 | REACTOME N GLYCAN ANTENNAE ELONGATION | Genes involved in N-Glycan antennae elongation |
| 0.1 | 1.5 | REACTOME THE ACTIVATION OF ARYLSULFATASES | Genes involved in The activation of arylsulfatases |
| 0.1 | 0.3 | REACTOME TRAFFICKING OF GLUR2 CONTAINING AMPA RECEPTORS | Genes involved in Trafficking of GluR2-containing AMPA receptors |
| 0.1 | 2.1 | REACTOME TIE2 SIGNALING | Genes involved in Tie2 Signaling |
| 0.1 | 1.0 | REACTOME ER PHAGOSOME PATHWAY | Genes involved in ER-Phagosome pathway |
| 0.1 | 1.6 | REACTOME ABCA TRANSPORTERS IN LIPID HOMEOSTASIS | Genes involved in ABCA transporters in lipid homeostasis |
| 0.1 | 2.1 | REACTOME METABOLISM OF STEROID HORMONES AND VITAMINS A AND D | Genes involved in Metabolism of steroid hormones and vitamins A and D |
| 0.1 | 2.1 | REACTOME SIGNALING BY BMP | Genes involved in Signaling by BMP |
| 0.1 | 0.2 | REACTOME SIGNALING BY ERBB2 | Genes involved in Signaling by ERBB2 |
| 0.1 | 0.4 | REACTOME ERKS ARE INACTIVATED | Genes involved in ERKs are inactivated |
| 0.1 | 5.0 | REACTOME CYTOCHROME P450 ARRANGED BY SUBSTRATE TYPE | Genes involved in Cytochrome P450 - arranged by substrate type |
| 0.1 | 2.7 | REACTOME KINESINS | Genes involved in Kinesins |
| 0.1 | 2.2 | REACTOME TRANSPORT OF VITAMINS NUCLEOSIDES AND RELATED MOLECULES | Genes involved in Transport of vitamins, nucleosides, and related molecules |
| 0.1 | 1.4 | REACTOME PLATELET SENSITIZATION BY LDL | Genes involved in Platelet sensitization by LDL |
| 0.1 | 2.6 | REACTOME POST TRANSLATIONAL MODIFICATION SYNTHESIS OF GPI ANCHORED PROTEINS | Genes involved in Post-translational modification: synthesis of GPI-anchored proteins |
| 0.1 | 0.4 | REACTOME REGULATION OF THE FANCONI ANEMIA PATHWAY | Genes involved in Regulation of the Fanconi anemia pathway |
| 0.1 | 1.4 | REACTOME KERATAN SULFATE BIOSYNTHESIS | Genes involved in Keratan sulfate biosynthesis |
| 0.1 | 0.8 | REACTOME ADVANCED GLYCOSYLATION ENDPRODUCT RECEPTOR SIGNALING | Genes involved in Advanced glycosylation endproduct receptor signaling |
| 0.1 | 0.8 | REACTOME ABACAVIR TRANSPORT AND METABOLISM | Genes involved in Abacavir transport and metabolism |
| 0.1 | 0.4 | REACTOME SPRY REGULATION OF FGF SIGNALING | Genes involved in Spry regulation of FGF signaling |
| 0.1 | 0.8 | REACTOME ACTIVATION OF GENES BY ATF4 | Genes involved in Activation of Genes by ATF4 |
| 0.1 | 0.3 | REACTOME NEGATIVE REGULATION OF THE PI3K AKT NETWORK | Genes involved in Negative regulation of the PI3K/AKT network |
| 0.1 | 0.7 | REACTOME ASSOCIATION OF LICENSING FACTORS WITH THE PRE REPLICATIVE COMPLEX | Genes involved in Association of licensing factors with the pre-replicative complex |
| 0.1 | 3.8 | REACTOME CHEMOKINE RECEPTORS BIND CHEMOKINES | Genes involved in Chemokine receptors bind chemokines |
| 0.1 | 2.9 | REACTOME SMAD2 SMAD3 SMAD4 HETEROTRIMER REGULATES TRANSCRIPTION | Genes involved in SMAD2/SMAD3:SMAD4 heterotrimer regulates transcription |
| 0.1 | 2.7 | REACTOME CGMP EFFECTS | Genes involved in cGMP effects |
| 0.1 | 2.2 | REACTOME REGULATION OF MRNA STABILITY BY PROTEINS THAT BIND AU RICH ELEMENTS | Genes involved in Regulation of mRNA Stability by Proteins that Bind AU-rich Elements |
| 0.1 | 0.9 | REACTOME HORMONE SENSITIVE LIPASE HSL MEDIATED TRIACYLGLYCEROL HYDROLYSIS | Genes involved in Hormone-sensitive lipase (HSL)-mediated triacylglycerol hydrolysis |
| 0.1 | 1.0 | REACTOME REGULATION OF PYRUVATE DEHYDROGENASE PDH COMPLEX | Genes involved in Regulation of pyruvate dehydrogenase (PDH) complex |
| 0.1 | 1.2 | REACTOME FACILITATIVE NA INDEPENDENT GLUCOSE TRANSPORTERS | Genes involved in Facilitative Na+-independent glucose transporters |
| 0.1 | 2.3 | REACTOME G1 PHASE | Genes involved in G1 Phase |
| 0.1 | 2.8 | REACTOME INTERFERON ALPHA BETA SIGNALING | Genes involved in Interferon alpha/beta signaling |
| 0.1 | 3.3 | REACTOME SIGNALING BY ILS | Genes involved in Signaling by Interleukins |
| 0.1 | 2.2 | REACTOME ASSOCIATION OF TRIC CCT WITH TARGET PROTEINS DURING BIOSYNTHESIS | Genes involved in Association of TriC/CCT with target proteins during biosynthesis |
| 0.1 | 1.4 | REACTOME GABA A RECEPTOR ACTIVATION | Genes involved in GABA A receptor activation |
| 0.1 | 0.1 | REACTOME DOWNSTREAM SIGNALING EVENTS OF B CELL RECEPTOR BCR | Genes involved in Downstream Signaling Events Of B Cell Receptor (BCR) |
| 0.1 | 1.4 | REACTOME PROTEOLYTIC CLEAVAGE OF SNARE COMPLEX PROTEINS | Genes involved in Proteolytic cleavage of SNARE complex proteins |
| 0.0 | 4.2 | REACTOME AMYLOIDS | Genes involved in Amyloids |
| 0.0 | 1.1 | REACTOME MTORC1 MEDIATED SIGNALLING | Genes involved in mTORC1-mediated signalling |
| 0.0 | 1.7 | REACTOME INTERACTION BETWEEN L1 AND ANKYRINS | Genes involved in Interaction between L1 and Ankyrins |
| 0.0 | 0.1 | REACTOME VIF MEDIATED DEGRADATION OF APOBEC3G | Genes involved in Vif-mediated degradation of APOBEC3G |
| 0.0 | 0.2 | REACTOME CROSS PRESENTATION OF SOLUBLE EXOGENOUS ANTIGENS ENDOSOMES | Genes involved in Cross-presentation of soluble exogenous antigens (endosomes) |
| 0.0 | 0.6 | REACTOME MRNA DECAY BY 3 TO 5 EXORIBONUCLEASE | Genes involved in mRNA Decay by 3' to 5' Exoribonuclease |
| 0.0 | 1.4 | REACTOME MITOCHONDRIAL TRNA AMINOACYLATION | Genes involved in Mitochondrial tRNA aminoacylation |
| 0.0 | 1.7 | REACTOME EFFECTS OF PIP2 HYDROLYSIS | Genes involved in Effects of PIP2 hydrolysis |
| 0.0 | 0.8 | REACTOME PURINE RIBONUCLEOSIDE MONOPHOSPHATE BIOSYNTHESIS | Genes involved in Purine ribonucleoside monophosphate biosynthesis |
| 0.0 | 0.1 | REACTOME PERK REGULATED GENE EXPRESSION | Genes involved in PERK regulated gene expression |
| 0.0 | 2.8 | REACTOME NRAGE SIGNALS DEATH THROUGH JNK | Genes involved in NRAGE signals death through JNK |
| 0.0 | 0.3 | REACTOME RNA POL III TRANSCRIPTION INITIATION FROM TYPE 2 PROMOTER | Genes involved in RNA Polymerase III Transcription Initiation From Type 2 Promoter |
| 0.0 | 1.5 | REACTOME METAL ION SLC TRANSPORTERS | Genes involved in Metal ion SLC transporters |
| 0.0 | 0.8 | REACTOME ADENYLATE CYCLASE INHIBITORY PATHWAY | Genes involved in Adenylate cyclase inhibitory pathway |
| 0.0 | 0.3 | REACTOME AQUAPORIN MEDIATED TRANSPORT | Genes involved in Aquaporin-mediated transport |
| 0.0 | 0.6 | REACTOME SEROTONIN RECEPTORS | Genes involved in Serotonin receptors |
| 0.0 | 0.7 | REACTOME ACTIVATION OF BH3 ONLY PROTEINS | Genes involved in Activation of BH3-only proteins |
| 0.0 | 0.6 | REACTOME ACTIVATION OF CHAPERONE GENES BY ATF6 ALPHA | Genes involved in Activation of Chaperone Genes by ATF6-alpha |
| 0.0 | 0.8 | REACTOME SIGNALING BY HIPPO | Genes involved in Signaling by Hippo |
| 0.0 | 0.3 | REACTOME TRANSCRIPTIONAL ACTIVITY OF SMAD2 SMAD3 SMAD4 HETEROTRIMER | Genes involved in Transcriptional activity of SMAD2/SMAD3:SMAD4 heterotrimer |
| 0.0 | 1.2 | REACTOME AMINE LIGAND BINDING RECEPTORS | Genes involved in Amine ligand-binding receptors |
| 0.0 | 0.6 | REACTOME PYRIMIDINE CATABOLISM | Genes involved in Pyrimidine catabolism |
| 0.0 | 2.4 | REACTOME VOLTAGE GATED POTASSIUM CHANNELS | Genes involved in Voltage gated Potassium channels |
| 0.0 | 1.3 | REACTOME RNA POL III TRANSCRIPTION INITIATION FROM TYPE 3 PROMOTER | Genes involved in RNA Polymerase III Transcription Initiation From Type 3 Promoter |
| 0.0 | 2.5 | REACTOME MITOCHONDRIAL PROTEIN IMPORT | Genes involved in Mitochondrial Protein Import |
| 0.0 | 0.3 | REACTOME TRAF6 MEDIATED NFKB ACTIVATION | Genes involved in TRAF6 mediated NF-kB activation |
| 0.0 | 0.7 | REACTOME P2Y RECEPTORS | Genes involved in P2Y receptors |
| 0.0 | 0.7 | REACTOME PYRIMIDINE METABOLISM | Genes involved in Pyrimidine metabolism |
| 0.0 | 1.3 | REACTOME SPHINGOLIPID DE NOVO BIOSYNTHESIS | Genes involved in Sphingolipid de novo biosynthesis |
| 0.0 | 0.6 | REACTOME ANTIGEN PROCESSING CROSS PRESENTATION | Genes involved in Antigen processing-Cross presentation |
| 0.0 | 4.1 | REACTOME CLASS B 2 SECRETIN FAMILY RECEPTORS | Genes involved in Class B/2 (Secretin family receptors) |
| 0.0 | 0.2 | REACTOME COMMON PATHWAY | Genes involved in Common Pathway |
| 0.0 | 0.1 | REACTOME ELEVATION OF CYTOSOLIC CA2 LEVELS | Genes involved in Elevation of cytosolic Ca2+ levels |
| 0.0 | 0.1 | REACTOME RNA POL I PROMOTER OPENING | Genes involved in RNA Polymerase I Promoter Opening |
| 0.0 | 0.4 | REACTOME AMINE COMPOUND SLC TRANSPORTERS | Genes involved in Amine compound SLC transporters |
| 0.0 | 0.1 | REACTOME CYCLIN A B1 ASSOCIATED EVENTS DURING G2 M TRANSITION | Genes involved in Cyclin A/B1 associated events during G2/M transition |
| 0.0 | 8.9 | REACTOME METABOLISM OF AMINO ACIDS AND DERIVATIVES | Genes involved in Metabolism of amino acids and derivatives |
| 0.0 | 0.3 | REACTOME SYNTHESIS SECRETION AND INACTIVATION OF GLP1 | Genes involved in Synthesis, Secretion, and Inactivation of Glucagon-like Peptide-1 (GLP-1) |
| 0.0 | 0.4 | REACTOME G ALPHA1213 SIGNALLING EVENTS | Genes involved in G alpha (12/13) signalling events |
| 0.0 | 0.5 | REACTOME FANCONI ANEMIA PATHWAY | Genes involved in Fanconi Anemia pathway |
| 0.0 | 0.3 | REACTOME P53 INDEPENDENT G1 S DNA DAMAGE CHECKPOINT | Genes involved in p53-Independent G1/S DNA damage checkpoint |
| 0.0 | 5.2 | REACTOME ANTIGEN PROCESSING UBIQUITINATION PROTEASOME DEGRADATION | Genes involved in Antigen processing: Ubiquitination & Proteasome degradation |
| 0.0 | 2.0 | REACTOME OLFACTORY SIGNALING PATHWAY | Genes involved in Olfactory Signaling Pathway |
| 0.0 | 0.1 | REACTOME ACTIVATION OF CHAPERONES BY ATF6 ALPHA | Genes involved in Activation of Chaperones by ATF6-alpha |
| 0.0 | 0.4 | REACTOME SYNTHESIS SECRETION AND DEACYLATION OF GHRELIN | Genes involved in Synthesis, Secretion, and Deacylation of Ghrelin |
| 0.0 | 1.2 | REACTOME O LINKED GLYCOSYLATION OF MUCINS | Genes involved in O-linked glycosylation of mucins |
| 0.0 | 0.5 | REACTOME METABOLISM OF NON CODING RNA | Genes involved in Metabolism of non-coding RNA |
| 0.0 | 0.4 | REACTOME GROWTH HORMONE RECEPTOR SIGNALING | Genes involved in Growth hormone receptor signaling |
| 0.0 | 0.5 | REACTOME BETA DEFENSINS | Genes involved in Beta defensins |
| 0.0 | 0.0 | REACTOME NRIF SIGNALS CELL DEATH FROM THE NUCLEUS | Genes involved in NRIF signals cell death from the nucleus |
| 0.0 | 2.6 | REACTOME SIGNALING BY RHO GTPASES | Genes involved in Signaling by Rho GTPases |
| 0.0 | 0.3 | REACTOME INTRINSIC PATHWAY | Genes involved in Intrinsic Pathway |
| 0.0 | 1.1 | REACTOME CYTOKINE SIGNALING IN IMMUNE SYSTEM | Genes involved in Cytokine Signaling in Immune system |
| 0.0 | 0.1 | REACTOME ACTIVATED POINT MUTANTS OF FGFR2 | Genes involved in Activated point mutants of FGFR2 |
| 0.0 | 0.1 | REACTOME PHOSPHORYLATION OF THE APC C | Genes involved in Phosphorylation of the APC/C |
| 0.0 | 0.3 | REACTOME REGULATION OF GENE EXPRESSION IN BETA CELLS | Genes involved in Regulation of gene expression in beta cells |
| 0.0 | 0.5 | REACTOME SYNTHESIS OF PA | Genes involved in Synthesis of PA |
| 0.0 | 1.1 | REACTOME FORMATION OF THE TERNARY COMPLEX AND SUBSEQUENTLY THE 43S COMPLEX | Genes involved in Formation of the ternary complex, and subsequently, the 43S complex |
| 0.0 | 0.3 | REACTOME UNBLOCKING OF NMDA RECEPTOR GLUTAMATE BINDING AND ACTIVATION | Genes involved in Unblocking of NMDA receptor, glutamate binding and activation |
| 0.0 | 0.1 | REACTOME INFLUENZA VIRAL RNA TRANSCRIPTION AND REPLICATION | Genes involved in Influenza Viral RNA Transcription and Replication |
| 0.0 | 0.4 | REACTOME CYTOSOLIC TRNA AMINOACYLATION | Genes involved in Cytosolic tRNA aminoacylation |
| 0.0 | 0.3 | REACTOME PROCESSING OF INTRONLESS PRE MRNAS | Genes involved in Processing of Intronless Pre-mRNAs |
| 0.0 | 0.4 | REACTOME ENDOSOMAL SORTING COMPLEX REQUIRED FOR TRANSPORT ESCRT | Genes involved in Endosomal Sorting Complex Required For Transport (ESCRT) |
| 0.0 | 0.1 | REACTOME CTNNB1 PHOSPHORYLATION CASCADE | Genes involved in Beta-catenin phosphorylation cascade |
| 0.0 | 0.3 | REACTOME DARPP 32 EVENTS | Genes involved in DARPP-32 events |
| 0.0 | 0.1 | REACTOME NUCLEAR SIGNALING BY ERBB4 | Genes involved in Nuclear signaling by ERBB4 |
| 0.0 | 1.1 | REACTOME 3 UTR MEDIATED TRANSLATIONAL REGULATION | Genes involved in 3' -UTR-mediated translational regulation |
| 0.0 | 0.1 | REACTOME APOPTOSIS INDUCED DNA FRAGMENTATION | Genes involved in Apoptosis induced DNA fragmentation |
| 0.0 | 0.1 | REACTOME HYALURONAN UPTAKE AND DEGRADATION | Genes involved in Hyaluronan uptake and degradation |