Project
Epithelial-Mesenchymal Transition, human (Scheel, 2011)
Navigation
Downloads
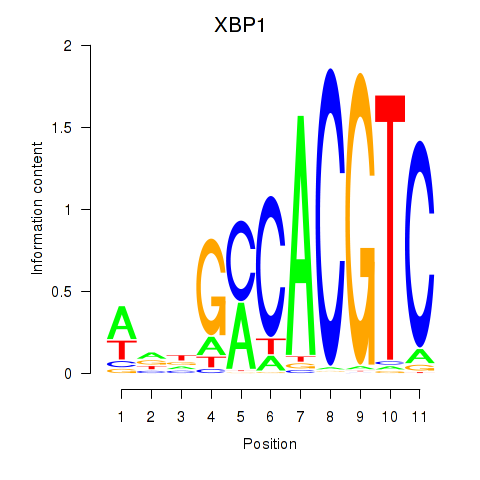
Results for XBP1
Z-value: 1.12
Motif logo
Transcription factors associated with XBP1
| Gene Symbol | Gene ID | Gene Info |
|---|---|---|
|
XBP1
|
ENSG00000100219.12 | XBP1 |
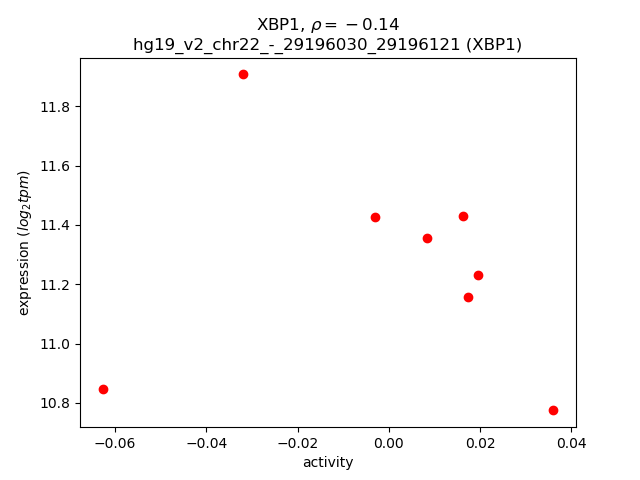
Activity-expression correlation:
| Gene | Promoter | Pearson corr. coef. | P-value | Plot |
|---|---|---|---|---|
| XBP1 | hg19_v2_chr22_-_29196030_29196121, hg19_v2_chr22_-_29196546_29196585 | -0.14 | 7.4e-01 | Click! |
Activity profile of XBP1 motif
Sorted Z-values of XBP1 motif
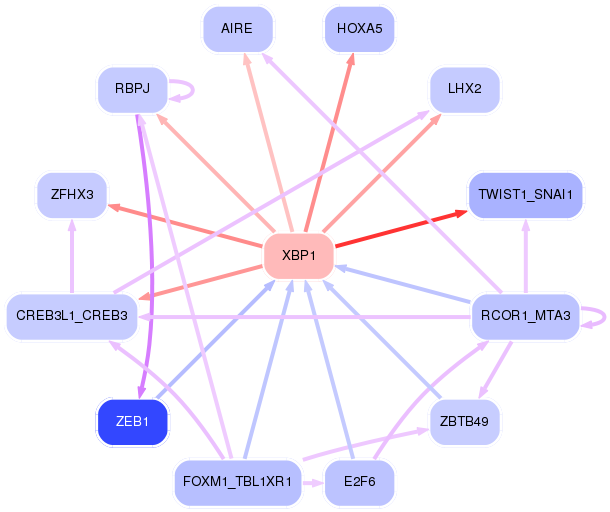
Network of associatons between targets according to the STRING database.

First level regulatory network of XBP1
| Promoter | Score | Transcript | Gene | Gene Info |
|---|---|---|---|---|
| chr7_+_94023873 | 5.94 |
ENST00000297268.6 |
COL1A2 |
collagen, type I, alpha 2 |
| chr5_+_119799927 | 2.26 |
ENST00000407149.2 ENST00000379551.2 |
PRR16 |
proline rich 16 |
| chr5_-_9546180 | 2.16 |
ENST00000382496.5 |
SEMA5A |
sema domain, seven thrombospondin repeats (type 1 and type 1-like), transmembrane domain (TM) and short cytoplasmic domain, (semaphorin) 5A |
| chr5_-_121413974 | 1.34 |
ENST00000231004.4 |
LOX |
lysyl oxidase |
| chr22_+_38864041 | 1.24 |
ENST00000216014.4 ENST00000409006.3 |
KDELR3 |
KDEL (Lys-Asp-Glu-Leu) endoplasmic reticulum protein retention receptor 3 |
| chr10_+_89419370 | 1.21 |
ENST00000361175.4 ENST00000456849.1 |
PAPSS2 |
3'-phosphoadenosine 5'-phosphosulfate synthase 2 |
| chr8_+_104384616 | 1.05 |
ENST00000520337.1 |
CTHRC1 |
collagen triple helix repeat containing 1 |
| chr7_-_19157248 | 0.99 |
ENST00000242261.5 |
TWIST1 |
twist family bHLH transcription factor 1 |
| chr14_+_100259666 | 0.85 |
ENST00000262233.6 ENST00000334192.4 |
EML1 |
echinoderm microtubule associated protein like 1 |
| chr5_+_9546306 | 0.84 |
ENST00000508179.1 |
SNHG18 |
small nucleolar RNA host gene 18 (non-protein coding) |
| chr22_+_46476192 | 0.73 |
ENST00000443490.1 |
FLJ27365 |
hsa-mir-4763 |
| chr6_+_132891461 | 0.72 |
ENST00000275198.1 |
TAAR6 |
trace amine associated receptor 6 |
| chr3_+_105086056 | 0.59 |
ENST00000472644.2 |
ALCAM |
activated leukocyte cell adhesion molecule |
| chr20_+_44044717 | 0.58 |
ENST00000279036.6 ENST00000279035.9 ENST00000372689.5 ENST00000545755.1 ENST00000341555.5 ENST00000535404.1 ENST00000543458.2 ENST00000432270.1 |
PIGT |
phosphatidylinositol glycan anchor biosynthesis, class T |
| chrX_+_9431324 | 0.56 |
ENST00000407597.2 ENST00000424279.1 ENST00000536365.1 ENST00000441088.1 ENST00000380961.1 ENST00000415293.1 |
TBL1X |
transducin (beta)-like 1X-linked |
| chr6_+_132129151 | 0.54 |
ENST00000360971.2 |
ENPP1 |
ectonucleotide pyrophosphatase/phosphodiesterase 1 |
| chr17_+_64298944 | 0.52 |
ENST00000413366.3 |
PRKCA |
protein kinase C, alpha |
| chr6_+_83903061 | 0.51 |
ENST00000369724.4 ENST00000539997.1 |
RWDD2A |
RWD domain containing 2A |
| chr12_+_99038919 | 0.49 |
ENST00000551964.1 |
APAF1 |
apoptotic peptidase activating factor 1 |
| chr3_-_105588231 | 0.48 |
ENST00000545639.1 ENST00000394027.3 ENST00000438603.1 ENST00000447441.1 ENST00000443752.1 |
CBLB |
Cbl proto-oncogene B, E3 ubiquitin protein ligase |
| chr12_-_99038732 | 0.48 |
ENST00000393042.3 ENST00000420861.1 ENST00000299157.4 ENST00000342502.2 |
IKBIP |
IKBKB interacting protein |
| chr12_+_7053172 | 0.46 |
ENST00000229281.5 |
C12orf57 |
chromosome 12 open reading frame 57 |
| chr12_+_7052974 | 0.46 |
ENST00000544681.1 ENST00000537087.1 |
C12orf57 |
chromosome 12 open reading frame 57 |
| chr6_-_83902933 | 0.46 |
ENST00000512866.1 ENST00000510258.1 ENST00000503094.1 ENST00000283977.4 ENST00000513973.1 ENST00000508748.1 |
PGM3 |
phosphoglucomutase 3 |
| chr22_-_31503490 | 0.45 |
ENST00000400299.2 |
SELM |
Selenoprotein M |
| chr1_-_145039949 | 0.45 |
ENST00000313382.9 |
PDE4DIP |
phosphodiesterase 4D interacting protein |
| chr17_-_8059638 | 0.45 |
ENST00000584202.1 ENST00000354903.5 ENST00000577253.1 |
PER1 |
period circadian clock 1 |
| chr10_-_128077024 | 0.44 |
ENST00000368679.4 ENST00000368676.4 ENST00000448723.1 |
ADAM12 |
ADAM metallopeptidase domain 12 |
| chr7_+_100547156 | 0.43 |
ENST00000379458.4 |
MUC3A |
Protein LOC100131514 |
| chr16_-_73082274 | 0.42 |
ENST00000268489.5 |
ZFHX3 |
zinc finger homeobox 3 |
| chr12_+_7053228 | 0.41 |
ENST00000540506.2 |
C12orf57 |
chromosome 12 open reading frame 57 |
| chr7_-_27183263 | 0.40 |
ENST00000222726.3 |
HOXA5 |
homeobox A5 |
| chr22_-_20850128 | 0.40 |
ENST00000328879.4 |
KLHL22 |
kelch-like family member 22 |
| chr12_+_99038998 | 0.40 |
ENST00000359972.2 ENST00000357310.1 ENST00000339433.3 ENST00000333991.1 |
APAF1 |
apoptotic peptidase activating factor 1 |
| chr17_-_42276574 | 0.38 |
ENST00000589805.1 |
ATXN7L3 |
ataxin 7-like 3 |
| chr6_+_33168637 | 0.37 |
ENST00000374677.3 |
SLC39A7 |
solute carrier family 39 (zinc transporter), member 7 |
| chr20_+_25228669 | 0.36 |
ENST00000216962.4 |
PYGB |
phosphorylase, glycogen; brain |
| chr12_+_107349497 | 0.36 |
ENST00000548125.1 ENST00000280756.4 |
C12orf23 |
chromosome 12 open reading frame 23 |
| chr6_+_33168597 | 0.36 |
ENST00000374675.3 |
SLC39A7 |
solute carrier family 39 (zinc transporter), member 7 |
| chr5_+_154238149 | 0.36 |
ENST00000519430.1 ENST00000520671.1 ENST00000521583.1 ENST00000518028.1 ENST00000519404.1 ENST00000519394.1 ENST00000518775.1 |
CNOT8 |
CCR4-NOT transcription complex, subunit 8 |
| chr1_+_101361782 | 0.35 |
ENST00000357650.4 |
SLC30A7 |
solute carrier family 30 (zinc transporter), member 7 |
| chr3_-_105587879 | 0.35 |
ENST00000264122.4 ENST00000403724.1 ENST00000405772.1 |
CBLB |
Cbl proto-oncogene B, E3 ubiquitin protein ligase |
| chr9_+_35732312 | 0.35 |
ENST00000353704.2 |
CREB3 |
cAMP responsive element binding protein 3 |
| chr5_+_154238042 | 0.34 |
ENST00000519211.1 ENST00000522458.1 ENST00000519903.1 ENST00000521450.1 ENST00000403027.2 |
CNOT8 |
CCR4-NOT transcription complex, subunit 8 |
| chr12_-_56123444 | 0.34 |
ENST00000546457.1 ENST00000549117.1 |
CD63 |
CD63 molecule |
| chr20_-_33680588 | 0.34 |
ENST00000451813.2 ENST00000432634.2 |
TRPC4AP |
transient receptor potential cation channel, subfamily C, member 4 associated protein |
| chr22_-_20850070 | 0.34 |
ENST00000440659.2 ENST00000458248.1 ENST00000443285.1 ENST00000444967.1 ENST00000451553.1 ENST00000431430.1 |
KLHL22 |
kelch-like family member 22 |
| chr5_+_126853301 | 0.33 |
ENST00000296666.8 ENST00000442138.2 ENST00000512635.2 |
PRRC1 |
proline-rich coiled-coil 1 |
| chr10_-_22292675 | 0.32 |
ENST00000376946.1 |
DNAJC1 |
DnaJ (Hsp40) homolog, subfamily C, member 1 |
| chr3_+_171758344 | 0.32 |
ENST00000336824.4 ENST00000423424.1 |
FNDC3B |
fibronectin type III domain containing 3B |
| chr11_+_69455855 | 0.32 |
ENST00000227507.2 ENST00000536559.1 |
CCND1 |
cyclin D1 |
| chr5_-_115177496 | 0.31 |
ENST00000274459.4 ENST00000509910.1 |
ATG12 |
autophagy related 12 |
| chr1_-_144932316 | 0.31 |
ENST00000313431.9 |
PDE4DIP |
phosphodiesterase 4D interacting protein |
| chr4_-_119757239 | 0.30 |
ENST00000280551.6 |
SEC24D |
SEC24 family member D |
| chr5_-_93447333 | 0.30 |
ENST00000395965.3 ENST00000505869.1 ENST00000509163.1 |
FAM172A |
family with sequence similarity 172, member A |
| chr19_-_58459039 | 0.30 |
ENST00000282308.3 ENST00000598928.1 |
ZNF256 |
zinc finger protein 256 |
| chr5_-_176730676 | 0.28 |
ENST00000393611.2 ENST00000303251.6 ENST00000303270.6 |
RAB24 |
RAB24, member RAS oncogene family |
| chr15_-_60690163 | 0.28 |
ENST00000558998.1 ENST00000560165.1 ENST00000557986.1 ENST00000559780.1 ENST00000559467.1 ENST00000559956.1 ENST00000332680.4 ENST00000396024.3 ENST00000421017.2 ENST00000560466.1 ENST00000558132.1 ENST00000559113.1 ENST00000557906.1 ENST00000558558.1 ENST00000560468.1 ENST00000559370.1 ENST00000558169.1 ENST00000559725.1 ENST00000558985.1 ENST00000451270.2 |
ANXA2 |
annexin A2 |
| chr13_+_35516390 | 0.28 |
ENST00000540320.1 ENST00000400445.3 ENST00000310336.4 |
NBEA |
neurobeachin |
| chr3_-_183543301 | 0.27 |
ENST00000318631.3 ENST00000431348.1 |
MAP6D1 |
MAP6 domain containing 1 |
| chr9_+_126777676 | 0.26 |
ENST00000488674.2 |
LHX2 |
LIM homeobox 2 |
| chr4_-_119757322 | 0.26 |
ENST00000379735.5 |
SEC24D |
SEC24 family member D |
| chr20_-_17662705 | 0.25 |
ENST00000455029.2 |
RRBP1 |
ribosome binding protein 1 |
| chr8_-_124553437 | 0.25 |
ENST00000517956.1 ENST00000443022.2 |
FBXO32 |
F-box protein 32 |
| chr2_+_242254507 | 0.25 |
ENST00000391973.2 |
SEPT2 |
septin 2 |
| chr5_-_108745689 | 0.25 |
ENST00000361189.2 |
PJA2 |
praja ring finger 2, E3 ubiquitin protein ligase |
| chr8_-_38126675 | 0.24 |
ENST00000531823.1 ENST00000534339.1 ENST00000524616.1 ENST00000422581.2 ENST00000424479.2 ENST00000419686.2 |
PPAPDC1B |
phosphatidic acid phosphatase type 2 domain containing 1B |
| chr1_-_144932014 | 0.24 |
ENST00000529945.1 |
PDE4DIP |
phosphodiesterase 4D interacting protein |
| chr1_+_6845384 | 0.24 |
ENST00000303635.7 |
CAMTA1 |
calmodulin binding transcription activator 1 |
| chr16_-_30546141 | 0.24 |
ENST00000535210.1 ENST00000395094.3 |
ZNF747 |
zinc finger protein 747 |
| chr11_+_17298255 | 0.24 |
ENST00000531172.1 ENST00000533738.2 ENST00000323688.6 |
NUCB2 |
nucleobindin 2 |
| chr20_-_17662878 | 0.23 |
ENST00000377813.1 ENST00000377807.2 ENST00000360807.4 ENST00000398782.2 |
RRBP1 |
ribosome binding protein 1 |
| chr5_-_171881362 | 0.23 |
ENST00000519643.1 |
SH3PXD2B |
SH3 and PX domains 2B |
| chr6_+_132873832 | 0.23 |
ENST00000275200.1 |
TAAR8 |
trace amine associated receptor 8 |
| chr12_-_91348949 | 0.23 |
ENST00000358859.2 |
CCER1 |
coiled-coil glutamate-rich protein 1 |
| chr15_-_43622736 | 0.23 |
ENST00000544735.1 ENST00000567039.1 ENST00000305641.5 |
LCMT2 |
leucine carboxyl methyltransferase 2 |
| chr5_+_154237778 | 0.22 |
ENST00000523698.1 ENST00000517876.1 ENST00000520472.1 |
CNOT8 |
CCR4-NOT transcription complex, subunit 8 |
| chr1_+_6845578 | 0.22 |
ENST00000467404.2 ENST00000439411.2 |
CAMTA1 |
calmodulin binding transcription activator 1 |
| chr21_+_45138941 | 0.22 |
ENST00000398081.1 ENST00000468090.1 ENST00000291565.4 |
PDXK |
pyridoxal (pyridoxine, vitamin B6) kinase |
| chr22_-_43253189 | 0.22 |
ENST00000437119.2 ENST00000429508.2 ENST00000454099.1 ENST00000263245.5 |
ARFGAP3 |
ADP-ribosylation factor GTPase activating protein 3 |
| chr11_+_17298297 | 0.21 |
ENST00000529010.1 |
NUCB2 |
nucleobindin 2 |
| chr17_+_73106035 | 0.21 |
ENST00000581078.1 ENST00000582136.1 ENST00000245543.1 |
ARMC7 |
armadillo repeat containing 7 |
| chr9_+_37079888 | 0.21 |
ENST00000429493.1 ENST00000593237.1 ENST00000588557.1 ENST00000430809.1 ENST00000592157.1 |
RP11-220I1.1 |
RP11-220I1.1 |
| chr5_+_154238096 | 0.20 |
ENST00000517568.1 ENST00000524105.1 ENST00000285896.6 |
CNOT8 |
CCR4-NOT transcription complex, subunit 8 |
| chr4_+_56262115 | 0.20 |
ENST00000506198.1 ENST00000381334.5 ENST00000542052.1 |
TMEM165 |
transmembrane protein 165 |
| chr11_-_102576537 | 0.20 |
ENST00000260229.4 |
MMP27 |
matrix metallopeptidase 27 |
| chr12_+_56624436 | 0.19 |
ENST00000266980.4 ENST00000437277.1 |
SLC39A5 |
solute carrier family 39 (zinc transporter), member 5 |
| chr2_-_15701422 | 0.19 |
ENST00000441750.1 ENST00000281513.5 |
NBAS |
neuroblastoma amplified sequence |
| chr1_+_6845497 | 0.19 |
ENST00000473578.1 ENST00000557126.1 |
CAMTA1 |
calmodulin binding transcription activator 1 |
| chr17_-_40575535 | 0.19 |
ENST00000357037.5 |
PTRF |
polymerase I and transcript release factor |
| chr1_+_249200395 | 0.19 |
ENST00000355360.4 ENST00000329291.5 ENST00000539153.1 |
PGBD2 |
piggyBac transposable element derived 2 |
| chr2_-_33824382 | 0.18 |
ENST00000238823.8 |
FAM98A |
family with sequence similarity 98, member A |
| chr6_-_90062543 | 0.18 |
ENST00000435041.2 |
UBE2J1 |
ubiquitin-conjugating enzyme E2, J1 |
| chr9_-_34523027 | 0.17 |
ENST00000399775.2 |
ENHO |
energy homeostasis associated |
| chr4_+_76649797 | 0.17 |
ENST00000538159.1 ENST00000514213.2 |
USO1 |
USO1 vesicle transport factor |
| chr1_+_26758790 | 0.16 |
ENST00000427245.2 ENST00000525682.2 ENST00000236342.7 ENST00000526219.1 ENST00000374185.3 ENST00000360009.2 |
DHDDS |
dehydrodolichyl diphosphate synthase |
| chr7_-_12443501 | 0.16 |
ENST00000275358.3 |
VWDE |
von Willebrand factor D and EGF domains |
| chr2_-_33824336 | 0.16 |
ENST00000431950.1 ENST00000403368.1 ENST00000441530.2 |
FAM98A |
family with sequence similarity 98, member A |
| chr14_-_24664776 | 0.16 |
ENST00000530468.1 ENST00000528010.1 ENST00000396854.4 ENST00000524835.1 ENST00000261789.4 ENST00000525592.1 |
TM9SF1 |
transmembrane 9 superfamily member 1 |
| chr1_+_145575980 | 0.16 |
ENST00000393045.2 |
PIAS3 |
protein inhibitor of activated STAT, 3 |
| chr20_-_8000426 | 0.16 |
ENST00000527925.1 ENST00000246024.2 |
TMX4 |
thioredoxin-related transmembrane protein 4 |
| chr1_+_145576007 | 0.16 |
ENST00000369298.1 |
PIAS3 |
protein inhibitor of activated STAT, 3 |
| chr4_+_26322185 | 0.15 |
ENST00000361572.6 |
RBPJ |
recombination signal binding protein for immunoglobulin kappa J region |
| chr2_+_242254679 | 0.15 |
ENST00000428282.1 ENST00000360051.3 |
SEPT2 |
septin 2 |
| chr19_+_36606654 | 0.15 |
ENST00000588385.1 ENST00000585746.1 |
TBCB |
tubulin folding cofactor B |
| chr2_+_85132749 | 0.15 |
ENST00000233143.4 |
TMSB10 |
thymosin beta 10 |
| chr15_-_60690932 | 0.15 |
ENST00000559818.1 |
ANXA2 |
annexin A2 |
| chr9_-_35732362 | 0.14 |
ENST00000314888.9 ENST00000540444.1 |
TLN1 |
talin 1 |
| chr2_-_69614373 | 0.14 |
ENST00000361060.5 ENST00000357308.4 |
GFPT1 |
glutamine--fructose-6-phosphate transaminase 1 |
| chr18_-_34408902 | 0.14 |
ENST00000593035.1 ENST00000383056.3 ENST00000588909.1 ENST00000590337.1 |
TPGS2 |
tubulin polyglutamylase complex subunit 2 |
| chr12_-_133405288 | 0.14 |
ENST00000204726.3 |
GOLGA3 |
golgin A3 |
| chr14_-_24664540 | 0.14 |
ENST00000530563.1 ENST00000528895.1 ENST00000528669.1 ENST00000532632.1 |
TM9SF1 |
transmembrane 9 superfamily member 1 |
| chr5_-_171881491 | 0.14 |
ENST00000311601.5 |
SH3PXD2B |
SH3 and PX domains 2B |
| chr1_+_21835858 | 0.14 |
ENST00000539907.1 ENST00000540617.1 ENST00000374840.3 |
ALPL |
alkaline phosphatase, liver/bone/kidney |
| chr3_-_132378919 | 0.14 |
ENST00000355458.3 |
ACAD11 |
acyl-CoA dehydrogenase family, member 11 |
| chr11_+_32605350 | 0.14 |
ENST00000531120.1 ENST00000524896.1 ENST00000323213.5 |
EIF3M |
eukaryotic translation initiation factor 3, subunit M |
| chr12_+_58120044 | 0.13 |
ENST00000542466.2 |
AGAP2-AS1 |
AGAP2 antisense RNA 1 |
| chr4_+_40058411 | 0.13 |
ENST00000261435.6 ENST00000515550.1 |
N4BP2 |
NEDD4 binding protein 2 |
| chr1_-_22109682 | 0.13 |
ENST00000400301.1 ENST00000532737.1 |
USP48 |
ubiquitin specific peptidase 48 |
| chr14_+_50087468 | 0.13 |
ENST00000305386.2 |
MGAT2 |
mannosyl (alpha-1,6-)-glycoprotein beta-1,2-N-acetylglucosaminyltransferase |
| chr19_+_55477711 | 0.13 |
ENST00000448584.2 ENST00000537859.1 ENST00000585500.1 ENST00000427260.2 ENST00000538819.1 ENST00000263437.6 |
NLRP2 |
NLR family, pyrin domain containing 2 |
| chr9_+_114393634 | 0.13 |
ENST00000556107.1 ENST00000374294.3 |
DNAJC25 DNAJC25-GNG10 |
DnaJ (Hsp40) homolog, subfamily C , member 25 DNAJC25-GNG10 readthrough |
| chr14_-_92506371 | 0.13 |
ENST00000267622.4 |
TRIP11 |
thyroid hormone receptor interactor 11 |
| chr4_+_26322409 | 0.13 |
ENST00000514807.1 ENST00000348160.4 ENST00000509158.1 ENST00000355476.3 |
RBPJ |
recombination signal binding protein for immunoglobulin kappa J region |
| chr3_+_50284321 | 0.12 |
ENST00000451956.1 |
GNAI2 |
guanine nucleotide binding protein (G protein), alpha inhibiting activity polypeptide 2 |
| chr2_-_242254595 | 0.11 |
ENST00000441124.1 ENST00000391976.2 |
HDLBP |
high density lipoprotein binding protein |
| chr3_-_28390415 | 0.11 |
ENST00000414162.1 ENST00000420543.2 |
AZI2 |
5-azacytidine induced 2 |
| chr19_+_50354462 | 0.11 |
ENST00000601675.1 |
PTOV1 |
prostate tumor overexpressed 1 |
| chr11_-_207221 | 0.11 |
ENST00000486280.1 ENST00000332865.6 ENST00000529614.2 ENST00000325147.9 ENST00000410108.1 ENST00000382762.3 |
BET1L |
Bet1 golgi vesicular membrane trafficking protein-like |
| chr18_+_34409069 | 0.11 |
ENST00000543923.1 ENST00000280020.5 ENST00000435985.2 ENST00000592521.1 ENST00000587139.1 |
KIAA1328 |
KIAA1328 |
| chr19_+_16187816 | 0.10 |
ENST00000588410.1 |
TPM4 |
tropomyosin 4 |
| chr9_+_15553055 | 0.10 |
ENST00000380701.3 |
CCDC171 |
coiled-coil domain containing 171 |
| chr11_-_62599505 | 0.10 |
ENST00000377897.4 ENST00000394690.1 ENST00000541317.1 ENST00000294179.3 |
STX5 |
syntaxin 5 |
| chr1_+_87170577 | 0.10 |
ENST00000482504.1 |
SH3GLB1 |
SH3-domain GRB2-like endophilin B1 |
| chr11_-_66056596 | 0.10 |
ENST00000471387.2 ENST00000359461.6 ENST00000376901.4 |
YIF1A |
Yip1 interacting factor homolog A (S. cerevisiae) |
| chr19_-_54618650 | 0.10 |
ENST00000391757.1 |
TFPT |
TCF3 (E2A) fusion partner (in childhood Leukemia) |
| chr19_+_50354430 | 0.09 |
ENST00000599732.1 |
PTOV1 |
prostate tumor overexpressed 1 |
| chr19_-_54619006 | 0.09 |
ENST00000391759.1 |
TFPT |
TCF3 (E2A) fusion partner (in childhood Leukemia) |
| chr6_+_63921351 | 0.09 |
ENST00000370659.1 |
FKBP1C |
FK506 binding protein 1C |
| chr1_-_155145721 | 0.09 |
ENST00000295682.4 |
KRTCAP2 |
keratinocyte associated protein 2 |
| chr2_-_118771701 | 0.09 |
ENST00000376300.2 ENST00000319432.5 |
CCDC93 |
coiled-coil domain containing 93 |
| chr12_-_133405409 | 0.09 |
ENST00000545875.1 ENST00000456883.2 |
GOLGA3 |
golgin A3 |
| chr19_+_50354393 | 0.09 |
ENST00000391842.1 |
PTOV1 |
prostate tumor overexpressed 1 |
| chr1_-_22109484 | 0.09 |
ENST00000529637.1 |
USP48 |
ubiquitin specific peptidase 48 |
| chr19_+_49468558 | 0.09 |
ENST00000331825.6 |
FTL |
ferritin, light polypeptide |
| chr19_-_19030157 | 0.09 |
ENST00000349893.4 ENST00000351079.4 ENST00000600932.1 ENST00000262812.4 |
COPE |
coatomer protein complex, subunit epsilon |
| chr14_+_102430855 | 0.09 |
ENST00000360184.4 |
DYNC1H1 |
dynein, cytoplasmic 1, heavy chain 1 |
| chr3_-_10362725 | 0.09 |
ENST00000397109.3 ENST00000428626.1 ENST00000445064.1 ENST00000431352.1 ENST00000397117.1 ENST00000337354.4 ENST00000383801.2 ENST00000432213.1 ENST00000350697.3 |
SEC13 |
SEC13 homolog (S. cerevisiae) |
| chr3_-_28390298 | 0.09 |
ENST00000457172.1 |
AZI2 |
5-azacytidine induced 2 |
| chr7_+_128379346 | 0.08 |
ENST00000535011.2 ENST00000542996.2 ENST00000535623.1 ENST00000538546.1 ENST00000249364.4 ENST00000449187.2 |
CALU |
calumenin |
| chr12_-_109125285 | 0.08 |
ENST00000552871.1 ENST00000261401.3 |
CORO1C |
coronin, actin binding protein, 1C |
| chr5_+_112196919 | 0.08 |
ENST00000505459.1 ENST00000282999.3 ENST00000515463.1 |
SRP19 |
signal recognition particle 19kDa |
| chr3_+_127771212 | 0.08 |
ENST00000243253.3 ENST00000481210.1 |
SEC61A1 |
Sec61 alpha 1 subunit (S. cerevisiae) |
| chr4_-_83351005 | 0.08 |
ENST00000295470.5 |
HNRNPDL |
heterogeneous nuclear ribonucleoprotein D-like |
| chrX_+_153627231 | 0.08 |
ENST00000406022.2 |
RPL10 |
ribosomal protein L10 |
| chr3_-_149688502 | 0.08 |
ENST00000481767.1 ENST00000475518.1 |
PFN2 |
profilin 2 |
| chrX_-_41782249 | 0.07 |
ENST00000442742.2 ENST00000421587.2 ENST00000378166.4 ENST00000318588.9 ENST00000361962.4 |
CASK |
calcium/calmodulin-dependent serine protein kinase (MAGUK family) |
| chr11_-_64646086 | 0.07 |
ENST00000320631.3 |
EHD1 |
EH-domain containing 1 |
| chr19_-_22379753 | 0.07 |
ENST00000397121.2 |
ZNF676 |
zinc finger protein 676 |
| chr6_-_7313381 | 0.07 |
ENST00000489567.1 ENST00000479365.1 ENST00000462112.1 ENST00000397511.2 ENST00000534851.1 ENST00000474597.1 ENST00000244763.4 |
SSR1 |
signal sequence receptor, alpha |
| chr14_+_39736299 | 0.07 |
ENST00000341502.5 ENST00000396158.2 ENST00000280083.3 |
CTAGE5 |
CTAGE family, member 5 |
| chr21_+_45705752 | 0.07 |
ENST00000291582.5 |
AIRE |
autoimmune regulator |
| chr7_+_128379449 | 0.07 |
ENST00000479257.1 |
CALU |
calumenin |
| chr3_-_149688896 | 0.07 |
ENST00000239940.7 |
PFN2 |
profilin 2 |
| chr11_-_66056478 | 0.07 |
ENST00000431556.2 ENST00000528575.1 |
YIF1A |
Yip1 interacting factor homolog A (S. cerevisiae) |
| chr11_+_47430133 | 0.06 |
ENST00000531974.1 ENST00000531419.1 ENST00000531865.1 ENST00000362021.4 ENST00000354884.4 |
SLC39A13 |
solute carrier family 39 (zinc transporter), member 13 |
| chr16_-_75569068 | 0.06 |
ENST00000336257.3 ENST00000565039.1 |
CHST5 |
carbohydrate (N-acetylglucosamine 6-O) sulfotransferase 5 |
| chr1_+_222791417 | 0.06 |
ENST00000344922.5 ENST00000344441.6 ENST00000344507.1 |
MIA3 |
melanoma inhibitory activity family, member 3 |
| chr17_+_46048376 | 0.06 |
ENST00000338399.4 |
CDK5RAP3 |
CDK5 regulatory subunit associated protein 3 |
| chr10_-_30348439 | 0.06 |
ENST00000375377.1 |
KIAA1462 |
KIAA1462 |
| chr9_+_101984577 | 0.06 |
ENST00000223641.4 |
SEC61B |
Sec61 beta subunit |
| chr4_-_47916543 | 0.05 |
ENST00000507489.1 |
NFXL1 |
nuclear transcription factor, X-box binding-like 1 |
| chr2_-_20251744 | 0.05 |
ENST00000175091.4 |
LAPTM4A |
lysosomal protein transmembrane 4 alpha |
| chr4_-_46392290 | 0.05 |
ENST00000515082.1 |
GABRA2 |
gamma-aminobutyric acid (GABA) A receptor, alpha 2 |
| chr19_+_50353944 | 0.05 |
ENST00000594151.1 ENST00000600603.1 ENST00000601638.1 ENST00000221557.9 |
PTOV1 |
prostate tumor overexpressed 1 |
| chr12_+_56862301 | 0.05 |
ENST00000338146.5 |
SPRYD4 |
SPRY domain containing 4 |
| chr18_-_34409116 | 0.05 |
ENST00000334295.4 |
TPGS2 |
tubulin polyglutamylase complex subunit 2 |
| chr15_-_75165651 | 0.05 |
ENST00000562363.1 ENST00000564529.1 ENST00000268099.9 |
SCAMP2 |
secretory carrier membrane protein 2 |
| chr4_-_47916613 | 0.05 |
ENST00000381538.3 ENST00000329043.3 |
NFXL1 |
nuclear transcription factor, X-box binding-like 1 |
| chr9_+_114393581 | 0.04 |
ENST00000313525.3 |
DNAJC25 |
DnaJ (Hsp40) homolog, subfamily C , member 25 |
| chr1_-_119683251 | 0.04 |
ENST00000369426.5 ENST00000235521.4 |
WARS2 |
tryptophanyl tRNA synthetase 2, mitochondrial |
| chr2_+_241508039 | 0.04 |
ENST00000270357.4 |
RNPEPL1 |
arginyl aminopeptidase (aminopeptidase B)-like 1 |
| chr18_-_34408802 | 0.04 |
ENST00000590842.1 |
TPGS2 |
tubulin polyglutamylase complex subunit 2 |
| chr4_+_141445311 | 0.03 |
ENST00000323570.3 ENST00000511887.2 |
ELMOD2 |
ELMO/CED-12 domain containing 2 |
| chr16_+_2083265 | 0.03 |
ENST00000565855.1 ENST00000566198.1 |
SLC9A3R2 |
solute carrier family 9, subfamily A (NHE3, cation proton antiporter 3), member 3 regulator 2 |
| chr12_+_48722763 | 0.03 |
ENST00000335017.1 |
H1FNT |
H1 histone family, member N, testis-specific |
| chr17_+_7184986 | 0.03 |
ENST00000317370.8 ENST00000571308.1 |
SLC2A4 |
solute carrier family 2 (facilitated glucose transporter), member 4 |
| chr17_+_72199721 | 0.03 |
ENST00000439590.2 ENST00000311111.6 ENST00000584577.1 ENST00000534490.1 ENST00000528433.2 ENST00000533498.1 |
RPL38 |
ribosomal protein L38 |
| chr14_+_31091511 | 0.03 |
ENST00000544052.2 ENST00000421551.3 ENST00000541123.1 ENST00000557076.1 ENST00000553693.1 ENST00000396629.2 |
SCFD1 |
sec1 family domain containing 1 |
| chr2_+_27255806 | 0.03 |
ENST00000238788.9 ENST00000404032.3 |
TMEM214 |
transmembrane protein 214 |
| chr6_+_43968306 | 0.03 |
ENST00000442114.2 ENST00000336600.5 ENST00000439969.2 |
C6orf223 |
chromosome 6 open reading frame 223 |
| chr18_-_34408693 | 0.03 |
ENST00000587382.1 ENST00000589049.1 ENST00000587129.1 |
TPGS2 |
tubulin polyglutamylase complex subunit 2 |
| chr3_+_132378741 | 0.03 |
ENST00000493720.2 |
UBA5 |
ubiquitin-like modifier activating enzyme 5 |
| chr7_+_6522922 | 0.03 |
ENST00000601673.1 |
FLJ20306 |
CDNA FLJ20306 fis, clone HEP06881; Putative uncharacterized protein FLJ20306; Uncharacterized protein |
| chr1_+_228270361 | 0.03 |
ENST00000272102.5 ENST00000540651.1 |
ARF1 |
ADP-ribosylation factor 1 |
| chr19_+_47104553 | 0.02 |
ENST00000598871.1 ENST00000594523.1 |
CALM3 |
calmodulin 3 (phosphorylase kinase, delta) |
| chr6_-_33168391 | 0.02 |
ENST00000374685.4 ENST00000413614.2 ENST00000374680.3 |
RXRB |
retinoid X receptor, beta |
| chr4_+_128982430 | 0.02 |
ENST00000512292.1 ENST00000508819.1 |
LARP1B |
La ribonucleoprotein domain family, member 1B |
| chr3_-_128369643 | 0.02 |
ENST00000296255.3 |
RPN1 |
ribophorin I |
| chrX_+_153060090 | 0.02 |
ENST00000370086.3 ENST00000370085.3 |
SSR4 |
signal sequence receptor, delta |
Gene Ontology Analysis
Gene overrepresentation in biological_process category:
| Log-likelihood per target | Total log-likelihood | Term | Description |
|---|---|---|---|
| 0.4 | 5.9 | GO:0043589 | skin morphogenesis(GO:0043589) |
| 0.3 | 1.0 | GO:2000276 | negative regulation of peroxisome proliferator activated receptor signaling pathway(GO:0035359) negative regulation of oxidative phosphorylation uncoupler activity(GO:2000276) |
| 0.3 | 1.2 | GO:0000103 | sulfate assimilation(GO:0000103) |
| 0.2 | 1.3 | GO:0036343 | psychomotor behavior(GO:0036343) |
| 0.2 | 0.5 | GO:0030505 | inorganic diphosphate transport(GO:0030505) |
| 0.2 | 0.5 | GO:0061110 | histone H3-T6 phosphorylation(GO:0035408) dense core granule biogenesis(GO:0061110) regulation of dense core granule biogenesis(GO:2000705) |
| 0.2 | 2.2 | GO:0048842 | positive regulation of axon extension involved in axon guidance(GO:0048842) negative regulation of axon extension involved in axon guidance(GO:0048843) |
| 0.1 | 1.0 | GO:0043932 | ossification involved in bone remodeling(GO:0043932) |
| 0.1 | 0.4 | GO:0032804 | negative regulation of low-density lipoprotein particle receptor catabolic process(GO:0032804) |
| 0.1 | 2.3 | GO:0045793 | positive regulation of cell size(GO:0045793) |
| 0.1 | 0.4 | GO:0060435 | bronchiole development(GO:0060435) |
| 0.1 | 0.9 | GO:0072396 | response to cell cycle checkpoint signaling(GO:0072396) response to DNA integrity checkpoint signaling(GO:0072402) response to DNA damage checkpoint signaling(GO:0072423) |
| 0.1 | 1.3 | GO:0048251 | elastic fiber assembly(GO:0048251) |
| 0.1 | 0.4 | GO:1904059 | regulation of locomotor rhythm(GO:1904059) |
| 0.1 | 1.2 | GO:0006621 | protein retention in ER lumen(GO:0006621) |
| 0.1 | 0.3 | GO:1901189 | positive regulation of ephrin receptor signaling pathway(GO:1901189) positive regulation of canonical Wnt signaling pathway involved in cardiac muscle cell fate commitment(GO:1901297) positive regulation of canonical Wnt signaling pathway involved in heart development(GO:1905068) |
| 0.1 | 0.5 | GO:0019255 | glucose 1-phosphate metabolic process(GO:0019255) |
| 0.1 | 0.3 | GO:0006500 | N-terminal protein palmitoylation(GO:0006500) |
| 0.1 | 0.6 | GO:0016255 | attachment of GPI anchor to protein(GO:0016255) |
| 0.1 | 0.2 | GO:0009443 | pyridoxal 5'-phosphate salvage(GO:0009443) |
| 0.1 | 0.3 | GO:0006990 | positive regulation of transcription from RNA polymerase II promoter involved in unfolded protein response(GO:0006990) |
| 0.1 | 0.4 | GO:2000323 | negative regulation of glucocorticoid receptor signaling pathway(GO:2000323) |
| 0.1 | 0.2 | GO:0016094 | polyprenol biosynthetic process(GO:0016094) |
| 0.0 | 0.8 | GO:0007175 | negative regulation of epidermal growth factor-activated receptor activity(GO:0007175) |
| 0.0 | 0.2 | GO:0034224 | cellular response to zinc ion starvation(GO:0034224) |
| 0.0 | 0.2 | GO:2000622 | regulation of nuclear-transcribed mRNA catabolic process, nonsense-mediated decay(GO:2000622) negative regulation of nuclear-transcribed mRNA catabolic process, nonsense-mediated decay(GO:2000623) |
| 0.0 | 0.1 | GO:0071529 | cementum mineralization(GO:0071529) |
| 0.0 | 0.6 | GO:0048846 | axon extension involved in axon guidance(GO:0048846) neuron projection extension involved in neuron projection guidance(GO:1902284) |
| 0.0 | 0.2 | GO:0044565 | dendritic cell proliferation(GO:0044565) |
| 0.0 | 0.4 | GO:0002051 | osteoblast fate commitment(GO:0002051) |
| 0.0 | 0.4 | GO:0061088 | regulation of sequestering of zinc ion(GO:0061088) |
| 0.0 | 0.1 | GO:1903778 | protein localization to vacuolar membrane(GO:1903778) |
| 0.0 | 0.8 | GO:0006882 | cellular zinc ion homeostasis(GO:0006882) zinc II ion transmembrane transport(GO:0071577) |
| 0.0 | 0.2 | GO:0032472 | Golgi calcium ion transport(GO:0032472) |
| 0.0 | 0.6 | GO:0090110 | cargo loading into COPII-coated vesicle(GO:0090110) |
| 0.0 | 0.1 | GO:0006617 | SRP-dependent cotranslational protein targeting to membrane, signal sequence recognition(GO:0006617) |
| 0.0 | 0.1 | GO:0039019 | pronephric nephron development(GO:0039019) |
| 0.0 | 0.3 | GO:0048280 | vesicle fusion with Golgi apparatus(GO:0048280) |
| 0.0 | 1.1 | GO:0061014 | positive regulation of mRNA catabolic process(GO:0061014) |
| 0.0 | 0.3 | GO:0035826 | rubidium ion transport(GO:0035826) regulation of rubidium ion transport(GO:2000680) |
| 0.0 | 0.3 | GO:0014877 | response to muscle inactivity involved in regulation of muscle adaptation(GO:0014877) response to denervation involved in regulation of muscle adaptation(GO:0014894) |
| 0.0 | 0.1 | GO:0090235 | regulation of metaphase plate congression(GO:0090235) |
| 0.0 | 0.3 | GO:0033235 | positive regulation of protein sumoylation(GO:0033235) |
| 0.0 | 0.3 | GO:0033327 | Leydig cell differentiation(GO:0033327) |
| 0.0 | 0.2 | GO:0070862 | negative regulation of protein exit from endoplasmic reticulum(GO:0070862) negative regulation of retrograde protein transport, ER to cytosol(GO:1904153) |
| 0.0 | 0.1 | GO:2000410 | tolerance induction dependent upon immune response(GO:0002461) regulation of thymocyte migration(GO:2000410) |
| 0.0 | 0.7 | GO:0007094 | mitotic spindle assembly checkpoint(GO:0007094) spindle assembly checkpoint(GO:0071173) |
| 0.0 | 0.3 | GO:0021978 | telencephalon regionalization(GO:0021978) |
| 0.0 | 0.1 | GO:0006616 | SRP-dependent cotranslational protein targeting to membrane, translocation(GO:0006616) |
| 0.0 | 0.1 | GO:0044387 | negative regulation of protein kinase activity by regulation of protein phosphorylation(GO:0044387) |
| 0.0 | 0.3 | GO:0048820 | hair follicle maturation(GO:0048820) |
| 0.0 | 0.4 | GO:0016578 | histone deubiquitination(GO:0016578) |
| 0.0 | 0.1 | GO:0006048 | UDP-N-acetylglucosamine biosynthetic process(GO:0006048) |
| 0.0 | 0.0 | GO:0097212 | lysosomal membrane organization(GO:0097212) |
| 0.0 | 0.3 | GO:0044804 | nucleophagy(GO:0044804) |
| 0.0 | 0.1 | GO:1900028 | negative regulation of ruffle assembly(GO:1900028) |
| 0.0 | 0.1 | GO:0097577 | intracellular sequestering of iron ion(GO:0006880) sequestering of iron ion(GO:0097577) |
| 0.0 | 0.1 | GO:2001137 | positive regulation of endocytic recycling(GO:2001137) |
Gene overrepresentation in cellular_component category:
| Log-likelihood per target | Total log-likelihood | Term | Description |
|---|---|---|---|
| 0.4 | 5.9 | GO:0005583 | fibrillar collagen trimer(GO:0005583) banded collagen fibril(GO:0098643) |
| 0.2 | 0.9 | GO:0043293 | apoptosome(GO:0043293) |
| 0.1 | 0.4 | GO:1990667 | PCSK9-AnxA2 complex(GO:1990667) |
| 0.1 | 0.6 | GO:0042765 | GPI-anchor transamidase complex(GO:0042765) |
| 0.1 | 1.1 | GO:0030015 | CCR4-NOT core complex(GO:0030015) |
| 0.1 | 0.7 | GO:0005827 | polar microtubule(GO:0005827) |
| 0.1 | 0.2 | GO:0070939 | Dsl1p complex(GO:0070939) |
| 0.1 | 0.3 | GO:0002193 | MAML1-RBP-Jkappa- ICN1 complex(GO:0002193) |
| 0.1 | 0.8 | GO:1990023 | mitotic spindle midzone(GO:1990023) |
| 0.1 | 0.3 | GO:0034274 | Atg12-Atg5-Atg16 complex(GO:0034274) |
| 0.0 | 0.2 | GO:0090498 | extrinsic component of Golgi membrane(GO:0090498) |
| 0.0 | 0.3 | GO:0072669 | tRNA-splicing ligase complex(GO:0072669) |
| 0.0 | 0.2 | GO:0042406 | extrinsic component of endoplasmic reticulum membrane(GO:0042406) |
| 0.0 | 0.3 | GO:0097487 | multivesicular body, internal vesicle(GO:0097487) |
| 0.0 | 0.1 | GO:0002079 | inner acrosomal membrane(GO:0002079) outer acrosomal membrane(GO:0002081) |
| 0.0 | 0.4 | GO:0000124 | SAGA complex(GO:0000124) |
| 0.0 | 0.3 | GO:0031464 | Cul4A-RING E3 ubiquitin ligase complex(GO:0031464) |
| 0.0 | 0.4 | GO:0097227 | sperm annulus(GO:0097227) |
| 0.0 | 0.5 | GO:0030127 | COPII vesicle coat(GO:0030127) |
| 0.0 | 0.1 | GO:0008043 | intracellular ferritin complex(GO:0008043) ferritin complex(GO:0070288) |
| 0.0 | 2.4 | GO:0005581 | collagen trimer(GO:0005581) |
| 0.0 | 0.6 | GO:0042101 | T cell receptor complex(GO:0042101) |
| 0.0 | 0.1 | GO:0065010 | extracellular membrane-bounded organelle(GO:0065010) |
| 0.0 | 0.2 | GO:0016342 | catenin complex(GO:0016342) |
| 0.0 | 0.1 | GO:0071541 | eukaryotic translation initiation factor 3 complex, eIF3m(GO:0071541) |
| 0.0 | 0.1 | GO:0020016 | ciliary pocket(GO:0020016) ciliary pocket membrane(GO:0020018) |
| 0.0 | 0.2 | GO:0033018 | sarcoplasmic reticulum lumen(GO:0033018) |
| 0.0 | 0.1 | GO:0031205 | endoplasmic reticulum Sec complex(GO:0031205) |
Gene overrepresentation in molecular_function category:
| Log-likelihood per target | Total log-likelihood | Term | Description |
|---|---|---|---|
| 0.5 | 2.2 | GO:0035373 | chondroitin sulfate proteoglycan binding(GO:0035373) |
| 0.4 | 1.2 | GO:0004020 | adenylylsulfate kinase activity(GO:0004020) sulfate adenylyltransferase activity(GO:0004779) sulfate adenylyltransferase (ATP) activity(GO:0004781) |
| 0.4 | 5.9 | GO:0048407 | platelet-derived growth factor binding(GO:0048407) |
| 0.3 | 1.3 | GO:0004720 | protein-lysine 6-oxidase activity(GO:0004720) |
| 0.2 | 0.5 | GO:0035403 | histone kinase activity (H3-T6 specific)(GO:0035403) |
| 0.2 | 0.9 | GO:0001594 | trace-amine receptor activity(GO:0001594) |
| 0.1 | 1.2 | GO:0046923 | ER retention sequence binding(GO:0046923) |
| 0.1 | 0.6 | GO:0003923 | GPI-anchor transamidase activity(GO:0003923) |
| 0.1 | 0.5 | GO:0035529 | NADH pyrophosphatase activity(GO:0035529) |
| 0.1 | 0.4 | GO:0008184 | glycogen phosphorylase activity(GO:0008184) |
| 0.1 | 0.1 | GO:0008312 | 7S RNA binding(GO:0008312) |
| 0.1 | 0.2 | GO:0031403 | pyridoxal kinase activity(GO:0008478) lithium ion binding(GO:0031403) |
| 0.1 | 0.4 | GO:0030197 | extracellular matrix constituent, lubricant activity(GO:0030197) |
| 0.1 | 0.5 | GO:0004614 | phosphoglucomutase activity(GO:0004614) |
| 0.1 | 0.4 | GO:0019834 | phospholipase A2 inhibitor activity(GO:0019834) |
| 0.1 | 0.2 | GO:0002094 | polyprenyltransferase activity(GO:0002094) |
| 0.1 | 0.3 | GO:0019776 | Atg8 ligase activity(GO:0019776) |
| 0.1 | 1.1 | GO:0004535 | poly(A)-specific ribonuclease activity(GO:0004535) |
| 0.0 | 0.1 | GO:0032090 | Pyrin domain binding(GO:0032090) |
| 0.0 | 0.9 | GO:0008656 | cysteine-type endopeptidase activator activity involved in apoptotic process(GO:0008656) |
| 0.0 | 1.3 | GO:0005385 | zinc ion transmembrane transporter activity(GO:0005385) |
| 0.0 | 0.1 | GO:0051733 | ATP-dependent polydeoxyribonucleotide 5'-hydroxyl-kinase activity(GO:0046404) polydeoxyribonucleotide kinase activity(GO:0051733) ATP-dependent polynucleotide kinase activity(GO:0051734) |
| 0.0 | 1.0 | GO:0005109 | frizzled binding(GO:0005109) |
| 0.0 | 0.4 | GO:0010314 | phosphatidylinositol-5-phosphate binding(GO:0010314) |
| 0.0 | 1.4 | GO:0070888 | E-box binding(GO:0070888) |
| 0.0 | 0.3 | GO:0000150 | recombinase activity(GO:0000150) |
| 0.0 | 0.1 | GO:0004035 | alkaline phosphatase activity(GO:0004035) |
| 0.0 | 0.3 | GO:0035497 | cAMP response element binding(GO:0035497) |
| 0.0 | 0.2 | GO:0045294 | alpha-catenin binding(GO:0045294) |
| 0.0 | 0.1 | GO:0048408 | epidermal growth factor binding(GO:0048408) |
| 0.0 | 0.1 | GO:0030274 | LIM domain binding(GO:0030274) |
| 0.0 | 0.1 | GO:0042954 | lipoprotein transporter activity(GO:0042954) |
| 0.0 | 0.3 | GO:0070064 | proline-rich region binding(GO:0070064) |
Gene overrepresentation in C2:CP category:
| Log-likelihood per target | Total log-likelihood | Term | Description |
|---|---|---|---|
| 0.1 | 5.9 | PID LYMPH ANGIOGENESIS PATHWAY | VEGFR3 signaling in lymphatic endothelium |
| 0.0 | 0.9 | SA PROGRAMMED CELL DEATH | Programmed cell death, or apoptosis, eliminates damaged or unneeded cells. |
| 0.0 | 0.5 | PID TCR RAS PATHWAY | Ras signaling in the CD4+ TCR pathway |
| 0.0 | 0.3 | ST JAK STAT PATHWAY | Jak-STAT Pathway |
| 0.0 | 0.8 | PID WNT SIGNALING PATHWAY | Wnt signaling network |
| 0.0 | 0.8 | PID CD40 PATHWAY | CD40/CD40L signaling |
| 0.0 | 1.3 | PID HES HEY PATHWAY | Notch-mediated HES/HEY network |
| 0.0 | 0.3 | PID P38 GAMMA DELTA PATHWAY | Signaling mediated by p38-gamma and p38-delta |
| 0.0 | 0.4 | PID CIRCADIAN PATHWAY | Circadian rhythm pathway |
| 0.0 | 0.3 | ST G ALPHA S PATHWAY | G alpha s Pathway |
| 0.0 | 0.4 | PID INTEGRIN A9B1 PATHWAY | Alpha9 beta1 integrin signaling events |
| 0.0 | 2.7 | NABA ECM AFFILIATED | Genes encoding proteins affiliated structurally or functionally to extracellular matrix proteins |
Gene overrepresentation in C2:CP:REACTOME category:
| Log-likelihood per target | Total log-likelihood | Term | Description |
|---|---|---|---|
| 0.3 | 5.9 | REACTOME PLATELET ADHESION TO EXPOSED COLLAGEN | Genes involved in Platelet Adhesion to exposed collagen |
| 0.1 | 2.2 | REACTOME OTHER SEMAPHORIN INTERACTIONS | Genes involved in Other semaphorin interactions |
| 0.0 | 1.3 | REACTOME ZINC TRANSPORTERS | Genes involved in Zinc transporters |
| 0.0 | 0.5 | REACTOME REGULATION OF INSULIN SECRETION BY ACETYLCHOLINE | Genes involved in Regulation of Insulin Secretion by Acetylcholine |
| 0.0 | 1.2 | REACTOME CYTOSOLIC SULFONATION OF SMALL MOLECULES | Genes involved in Cytosolic sulfonation of small molecules |
| 0.0 | 0.5 | REACTOME SYNTHESIS OF SUBSTRATES IN N GLYCAN BIOSYTHESIS | Genes involved in Synthesis of substrates in N-glycan biosythesis |
| 0.0 | 1.1 | REACTOME DEADENYLATION OF MRNA | Genes involved in Deadenylation of mRNA |
| 0.0 | 0.9 | REACTOME AMINE LIGAND BINDING RECEPTORS | Genes involved in Amine ligand-binding receptors |
| 0.0 | 0.6 | REACTOME PRE NOTCH TRANSCRIPTION AND TRANSLATION | Genes involved in Pre-NOTCH Transcription and Translation |
| 0.0 | 0.6 | REACTOME CIRCADIAN REPRESSION OF EXPRESSION BY REV ERBA | Genes involved in Circadian Repression of Expression by REV-ERBA |
| 0.0 | 0.4 | REACTOME BMAL1 CLOCK NPAS2 ACTIVATES CIRCADIAN EXPRESSION | Genes involved in BMAL1:CLOCK/NPAS2 Activates Circadian Expression |
| 0.0 | 0.4 | REACTOME GLYCOGEN BREAKDOWN GLYCOGENOLYSIS | Genes involved in Glycogen breakdown (glycogenolysis) |
| 0.0 | 0.6 | REACTOME POST TRANSLATIONAL MODIFICATION SYNTHESIS OF GPI ANCHORED PROTEINS | Genes involved in Post-translational modification: synthesis of GPI-anchored proteins |
| 0.0 | 0.9 | REACTOME INTRINSIC PATHWAY FOR APOPTOSIS | Genes involved in Intrinsic Pathway for Apoptosis |
| 0.0 | 1.1 | REACTOME ACTIVATION OF CHAPERONE GENES BY XBP1S | Genes involved in Activation of Chaperone Genes by XBP1(S) |
| 0.0 | 0.8 | REACTOME ANTIGEN ACTIVATES B CELL RECEPTOR LEADING TO GENERATION OF SECOND MESSENGERS | Genes involved in Antigen Activates B Cell Receptor Leading to Generation of Second Messengers |
| 0.0 | 0.5 | REACTOME ANTIGEN PRESENTATION FOLDING ASSEMBLY AND PEPTIDE LOADING OF CLASS I MHC | Genes involved in Antigen Presentation: Folding, assembly and peptide loading of class I MHC |