Project
Epithelial-Mesenchymal Transition, human (Scheel, 2011)
Navigation
Downloads
Results for YBX1_FOS_NFYC_NFYA_NFYB_CEBPZ
Z-value: 4.34
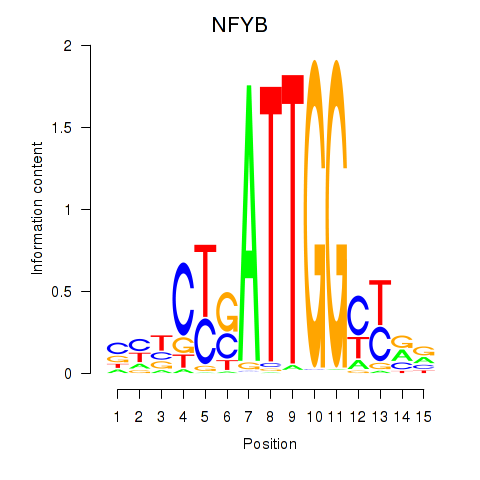
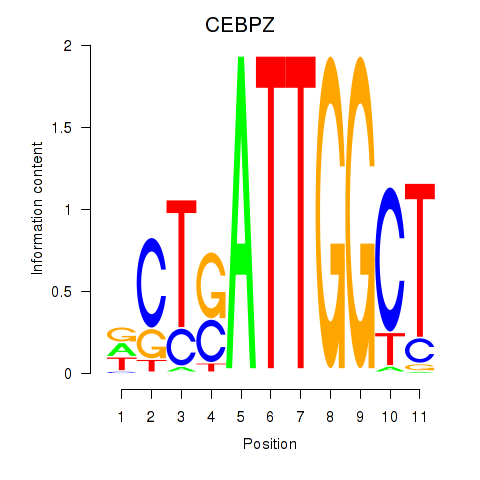
Motif logo
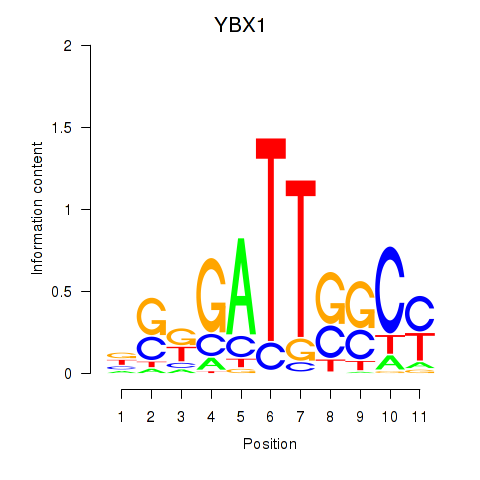
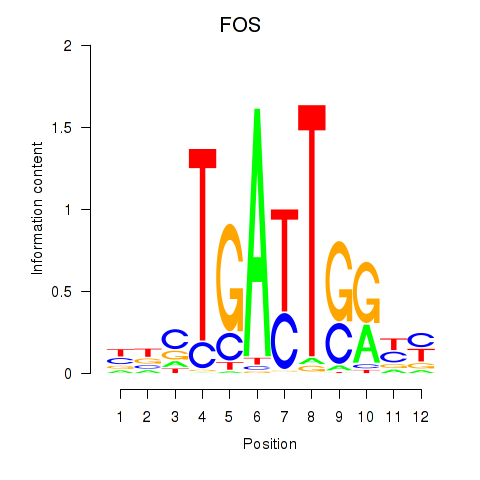
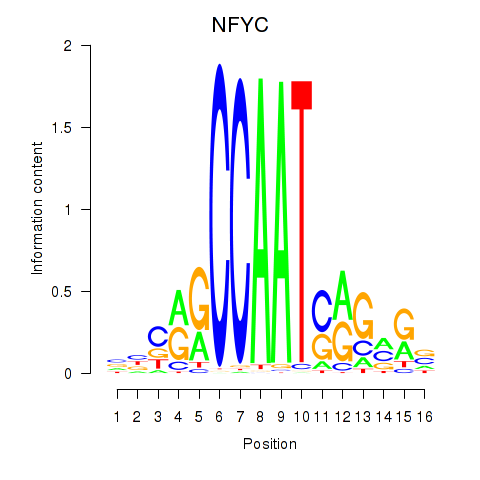
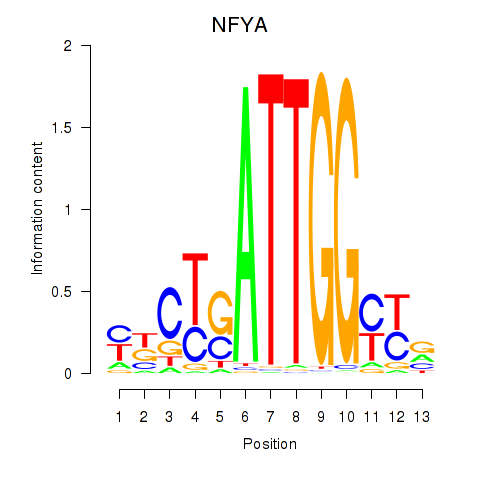
Transcription factors associated with YBX1_FOS_NFYC_NFYA_NFYB_CEBPZ
| Gene Symbol | Gene ID | Gene Info |
|---|---|---|
|
YBX1
|
ENSG00000065978.13 | YBX1 |
|
FOS
|
ENSG00000170345.5 | FOS |
|
NFYC
|
ENSG00000066136.15 | NFYC |
|
NFYA
|
ENSG00000001167.10 | NFYA |
|
NFYB
|
ENSG00000120837.3 | NFYB |
|
CEBPZ
|
ENSG00000115816.9 | CEBPZ |
Activity-expression correlation:
| Gene | Promoter | Pearson corr. coef. | P-value | Plot |
|---|---|---|---|---|
| NFYC | hg19_v2_chr1_+_41204506_41204541 | 0.85 | 8.1e-03 | Click! |
| NFYA | hg19_v2_chr6_+_41040678_41040722 | 0.80 | 1.8e-02 | Click! |
| FOS | hg19_v2_chr14_+_75745477_75745680 | -0.65 | 7.9e-02 | Click! |
| YBX1 | hg19_v2_chr1_+_43148059_43148111 | 0.55 | 1.6e-01 | Click! |
| NFYB | hg19_v2_chr12_-_104531785_104531812 | 0.48 | 2.3e-01 | Click! |
| CEBPZ | hg19_v2_chr2_-_37458749_37458856 | -0.41 | 3.1e-01 | Click! |
Activity profile of YBX1_FOS_NFYC_NFYA_NFYB_CEBPZ motif
Sorted Z-values of YBX1_FOS_NFYC_NFYA_NFYB_CEBPZ motif
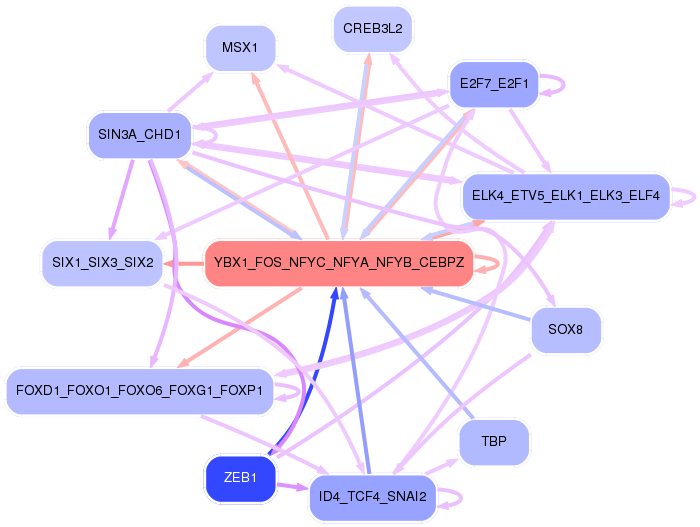
Network of associatons between targets according to the STRING database.

First level regulatory network of YBX1_FOS_NFYC_NFYA_NFYB_CEBPZ
| Promoter | Score | Transcript | Gene | Gene Info |
|---|---|---|---|---|
| chr4_-_2264015 | 5.50 |
ENST00000337190.2 |
MXD4 |
MAX dimerization protein 4 |
| chr1_+_163039143 | 4.54 |
ENST00000531057.1 ENST00000527809.1 ENST00000367908.4 |
RGS4 |
regulator of G-protein signaling 4 |
| chr1_+_163038565 | 4.29 |
ENST00000421743.2 |
RGS4 |
regulator of G-protein signaling 4 |
| chr6_-_167040731 | 4.25 |
ENST00000265678.4 |
RPS6KA2 |
ribosomal protein S6 kinase, 90kDa, polypeptide 2 |
| chr1_+_145438469 | 4.23 |
ENST00000369317.4 |
TXNIP |
thioredoxin interacting protein |
| chr12_-_6665200 | 3.87 |
ENST00000336604.4 ENST00000396840.2 ENST00000356896.4 |
IFFO1 |
intermediate filament family orphan 1 |
| chr14_-_52535712 | 3.31 |
ENST00000216286.5 ENST00000541773.1 |
NID2 |
nidogen 2 (osteonidogen) |
| chr14_-_74551096 | 3.21 |
ENST00000350259.4 |
ALDH6A1 |
aldehyde dehydrogenase 6 family, member A1 |
| chr1_+_213123915 | 2.99 |
ENST00000366968.4 ENST00000490792.1 |
VASH2 |
vasohibin 2 |
| chr1_-_46598284 | 2.98 |
ENST00000423209.1 ENST00000262741.5 |
PIK3R3 |
phosphoinositide-3-kinase, regulatory subunit 3 (gamma) |
| chr12_+_51818749 | 2.84 |
ENST00000514353.3 |
SLC4A8 |
solute carrier family 4, sodium bicarbonate cotransporter, member 8 |
| chr14_-_61116168 | 2.84 |
ENST00000247182.6 |
SIX1 |
SIX homeobox 1 |
| chr1_-_46598371 | 2.83 |
ENST00000372006.1 ENST00000425892.1 ENST00000420542.1 ENST00000354242.4 ENST00000340332.6 |
PIK3R3 |
phosphoinositide-3-kinase, regulatory subunit 3 (gamma) |
| chr1_-_150602035 | 2.80 |
ENST00000503241.1 ENST00000369016.4 ENST00000339643.5 ENST00000271690.8 ENST00000356527.5 ENST00000362052.7 ENST00000503345.1 ENST00000369014.5 ENST00000369009.3 |
ENSA |
endosulfine alpha |
| chr12_+_51818586 | 2.78 |
ENST00000394856.1 |
SLC4A8 |
solute carrier family 4, sodium bicarbonate cotransporter, member 8 |
| chr12_+_51818555 | 2.76 |
ENST00000453097.2 |
SLC4A8 |
solute carrier family 4, sodium bicarbonate cotransporter, member 8 |
| chr14_-_53019211 | 2.76 |
ENST00000557374.1 ENST00000281741.4 |
TXNDC16 |
thioredoxin domain containing 16 |
| chr20_+_33292068 | 2.74 |
ENST00000374810.3 ENST00000374809.2 ENST00000451665.1 |
TP53INP2 |
tumor protein p53 inducible nuclear protein 2 |
| chr14_+_74034310 | 2.57 |
ENST00000538782.1 |
ACOT2 |
acyl-CoA thioesterase 2 |
| chr12_+_108908962 | 2.52 |
ENST00000552695.1 ENST00000552758.1 ENST00000361549.2 |
FICD |
FIC domain containing |
| chr17_+_74261413 | 2.51 |
ENST00000587913.1 |
UBALD2 |
UBA-like domain containing 2 |
| chr17_+_6347761 | 2.49 |
ENST00000250056.8 ENST00000571373.1 ENST00000570337.2 ENST00000572595.2 ENST00000576056.1 |
FAM64A |
family with sequence similarity 64, member A |
| chr17_+_6347729 | 2.43 |
ENST00000572447.1 |
FAM64A |
family with sequence similarity 64, member A |
| chr5_-_19988339 | 2.41 |
ENST00000382275.1 |
CDH18 |
cadherin 18, type 2 |
| chr7_+_94023873 | 2.31 |
ENST00000297268.6 |
COL1A2 |
collagen, type I, alpha 2 |
| chr2_-_73460334 | 2.30 |
ENST00000258083.2 |
PRADC1 |
protease-associated domain containing 1 |
| chr14_-_74551172 | 2.25 |
ENST00000553458.1 |
ALDH6A1 |
aldehyde dehydrogenase 6 family, member A1 |
| chr11_-_67275542 | 2.25 |
ENST00000531506.1 |
CDK2AP2 |
cyclin-dependent kinase 2 associated protein 2 |
| chr5_-_149535421 | 2.21 |
ENST00000261799.4 |
PDGFRB |
platelet-derived growth factor receptor, beta polypeptide |
| chr9_+_34329493 | 2.16 |
ENST00000379158.2 ENST00000346365.4 ENST00000379155.5 |
NUDT2 |
nudix (nucleoside diphosphate linked moiety X)-type motif 2 |
| chr3_+_8543393 | 2.15 |
ENST00000157600.3 ENST00000415597.1 ENST00000535732.1 |
LMCD1 |
LIM and cysteine-rich domains 1 |
| chr1_-_150601588 | 2.13 |
ENST00000513281.1 ENST00000361631.5 ENST00000361532.5 |
ENSA |
endosulfine alpha |
| chr1_+_89990431 | 2.13 |
ENST00000330947.2 ENST00000358200.4 |
LRRC8B |
leucine rich repeat containing 8 family, member B |
| chr5_+_148737562 | 2.10 |
ENST00000274569.4 |
PCYOX1L |
prenylcysteine oxidase 1 like |
| chr3_-_185826855 | 2.09 |
ENST00000306376.5 |
ETV5 |
ets variant 5 |
| chr7_+_134331550 | 2.07 |
ENST00000344924.3 ENST00000418040.1 ENST00000393132.2 |
BPGM |
2,3-bisphosphoglycerate mutase |
| chr13_-_67804445 | 2.02 |
ENST00000456367.1 ENST00000377861.3 ENST00000544246.1 |
PCDH9 |
protocadherin 9 |
| chr13_-_33859819 | 1.99 |
ENST00000336934.5 |
STARD13 |
StAR-related lipid transfer (START) domain containing 13 |
| chr1_-_236228417 | 1.98 |
ENST00000264187.6 |
NID1 |
nidogen 1 |
| chr2_+_8822113 | 1.98 |
ENST00000396290.1 ENST00000331129.3 |
ID2 |
inhibitor of DNA binding 2, dominant negative helix-loop-helix protein |
| chr1_-_236228403 | 1.98 |
ENST00000366595.3 |
NID1 |
nidogen 1 |
| chr5_+_151151471 | 1.97 |
ENST00000394123.3 ENST00000543466.1 |
G3BP1 |
GTPase activating protein (SH3 domain) binding protein 1 |
| chr10_-_93392811 | 1.95 |
ENST00000238994.5 |
PPP1R3C |
protein phosphatase 1, regulatory subunit 3C |
| chr14_+_54863739 | 1.90 |
ENST00000541304.1 |
CDKN3 |
cyclin-dependent kinase inhibitor 3 |
| chr11_-_119293872 | 1.89 |
ENST00000524970.1 |
THY1 |
Thy-1 cell surface antigen |
| chr12_-_110011288 | 1.87 |
ENST00000540016.1 ENST00000266839.5 |
MMAB |
methylmalonic aciduria (cobalamin deficiency) cblB type |
| chr14_+_54863667 | 1.87 |
ENST00000335183.6 |
CDKN3 |
cyclin-dependent kinase inhibitor 3 |
| chrX_+_30671476 | 1.86 |
ENST00000378946.3 ENST00000378943.3 ENST00000378945.3 ENST00000427190.1 ENST00000378941.3 |
GK |
glycerol kinase |
| chr14_+_54863682 | 1.81 |
ENST00000543789.2 ENST00000442975.2 ENST00000458126.2 ENST00000556102.2 |
CDKN3 |
cyclin-dependent kinase inhibitor 3 |
| chr13_+_76334498 | 1.79 |
ENST00000534657.1 |
LMO7 |
LIM domain 7 |
| chr5_+_40679584 | 1.78 |
ENST00000302472.3 |
PTGER4 |
prostaglandin E receptor 4 (subtype EP4) |
| chr17_-_8059638 | 1.77 |
ENST00000584202.1 ENST00000354903.5 ENST00000577253.1 |
PER1 |
period circadian clock 1 |
| chr7_+_8008418 | 1.76 |
ENST00000223145.5 |
GLCCI1 |
glucocorticoid induced transcript 1 |
| chr2_+_20646824 | 1.76 |
ENST00000272233.4 |
RHOB |
ras homolog family member B |
| chr11_+_64879317 | 1.74 |
ENST00000526809.1 ENST00000279263.7 ENST00000524986.1 ENST00000534371.1 ENST00000540748.1 ENST00000525385.1 ENST00000345348.5 ENST00000531321.1 ENST00000529414.1 ENST00000526085.1 ENST00000530750.1 |
TM7SF2 |
transmembrane 7 superfamily member 2 |
| chr5_-_159546396 | 1.74 |
ENST00000523662.1 ENST00000456329.3 ENST00000307063.7 |
PWWP2A |
PWWP domain containing 2A |
| chr1_-_182361327 | 1.74 |
ENST00000331872.6 ENST00000311223.5 |
GLUL |
glutamate-ammonia ligase |
| chr17_-_66453562 | 1.73 |
ENST00000262139.5 ENST00000546360.1 |
WIPI1 |
WD repeat domain, phosphoinositide interacting 1 |
| chr14_+_24583836 | 1.69 |
ENST00000559115.1 ENST00000558215.1 ENST00000557810.1 ENST00000561375.1 ENST00000446197.3 ENST00000559796.1 ENST00000560713.1 ENST00000560901.1 ENST00000559382.1 |
DCAF11 |
DDB1 and CUL4 associated factor 11 |
| chrX_-_101771645 | 1.68 |
ENST00000289373.4 |
TMSB15A |
thymosin beta 15a |
| chr1_-_19229248 | 1.68 |
ENST00000375341.3 |
ALDH4A1 |
aldehyde dehydrogenase 4 family, member A1 |
| chr14_+_24584508 | 1.67 |
ENST00000559354.1 ENST00000560459.1 ENST00000559593.1 ENST00000396941.4 ENST00000396936.1 |
DCAF11 |
DDB1 and CUL4 associated factor 11 |
| chr8_-_23712312 | 1.66 |
ENST00000290271.2 |
STC1 |
stanniocalcin 1 |
| chr15_+_41523417 | 1.65 |
ENST00000560397.1 |
CHP1 |
calcineurin-like EF-hand protein 1 |
| chr17_-_48278983 | 1.65 |
ENST00000225964.5 |
COL1A1 |
collagen, type I, alpha 1 |
| chr1_-_19229014 | 1.64 |
ENST00000538839.1 ENST00000290597.5 |
ALDH4A1 |
aldehyde dehydrogenase 4 family, member A1 |
| chr2_+_191745535 | 1.64 |
ENST00000320717.3 |
GLS |
glutaminase |
| chr3_-_197686847 | 1.64 |
ENST00000265239.6 |
IQCG |
IQ motif containing G |
| chr20_-_30311703 | 1.63 |
ENST00000450273.1 ENST00000456404.1 ENST00000420488.1 ENST00000439267.1 |
BCL2L1 |
BCL2-like 1 |
| chr16_-_88729473 | 1.62 |
ENST00000301012.3 ENST00000569177.1 |
MVD |
mevalonate (diphospho) decarboxylase |
| chr5_+_151151504 | 1.61 |
ENST00000356245.3 ENST00000507878.2 |
G3BP1 |
GTPase activating protein (SH3 domain) binding protein 1 |
| chr1_-_27816556 | 1.61 |
ENST00000536657.1 |
WASF2 |
WAS protein family, member 2 |
| chr17_+_4613918 | 1.61 |
ENST00000574954.1 ENST00000346341.2 ENST00000572457.1 ENST00000381488.6 ENST00000412477.3 ENST00000571428.1 ENST00000575877.1 |
ARRB2 |
arrestin, beta 2 |
| chr6_+_26045603 | 1.61 |
ENST00000540144.1 |
HIST1H3C |
histone cluster 1, H3c |
| chr14_+_104394770 | 1.59 |
ENST00000409874.4 ENST00000339063.5 |
TDRD9 |
tudor domain containing 9 |
| chr3_-_105588231 | 1.58 |
ENST00000545639.1 ENST00000394027.3 ENST00000438603.1 ENST00000447441.1 ENST00000443752.1 |
CBLB |
Cbl proto-oncogene B, E3 ubiquitin protein ligase |
| chr5_-_150138061 | 1.58 |
ENST00000521533.1 ENST00000424236.1 |
DCTN4 |
dynactin 4 (p62) |
| chr1_-_182360918 | 1.57 |
ENST00000339526.4 |
GLUL |
glutamate-ammonia ligase |
| chr1_+_159750776 | 1.57 |
ENST00000368107.1 |
DUSP23 |
dual specificity phosphatase 23 |
| chr7_-_6048650 | 1.56 |
ENST00000382321.4 ENST00000406569.3 |
PMS2 |
PMS2 postmeiotic segregation increased 2 (S. cerevisiae) |
| chr9_-_73029540 | 1.56 |
ENST00000377126.2 |
KLF9 |
Kruppel-like factor 9 |
| chr19_+_1249869 | 1.56 |
ENST00000591446.2 |
MIDN |
midnolin |
| chr19_-_40931891 | 1.56 |
ENST00000357949.4 |
SERTAD1 |
SERTA domain containing 1 |
| chr2_-_232645977 | 1.55 |
ENST00000409772.1 |
PDE6D |
phosphodiesterase 6D, cGMP-specific, rod, delta |
| chr11_-_67120974 | 1.54 |
ENST00000539074.1 ENST00000312419.3 |
POLD4 |
polymerase (DNA-directed), delta 4, accessory subunit |
| chr3_-_186288097 | 1.53 |
ENST00000446782.1 |
TBCCD1 |
TBCC domain containing 1 |
| chr1_+_159750720 | 1.52 |
ENST00000368109.1 ENST00000368108.3 |
DUSP23 |
dual specificity phosphatase 23 |
| chr2_-_232646015 | 1.52 |
ENST00000287600.4 |
PDE6D |
phosphodiesterase 6D, cGMP-specific, rod, delta |
| chr7_+_149571045 | 1.51 |
ENST00000479613.1 ENST00000606024.1 ENST00000464662.1 ENST00000425642.2 |
ATP6V0E2 |
ATPase, H+ transporting V0 subunit e2 |
| chr3_+_8543561 | 1.51 |
ENST00000397386.3 |
LMCD1 |
LIM and cysteine-rich domains 1 |
| chr6_+_160183492 | 1.51 |
ENST00000541436.1 |
ACAT2 |
acetyl-CoA acetyltransferase 2 |
| chrX_-_62974941 | 1.51 |
ENST00000374872.1 ENST00000253401.6 ENST00000374870.4 |
ARHGEF9 |
Cdc42 guanine nucleotide exchange factor (GEF) 9 |
| chr19_+_1269324 | 1.49 |
ENST00000589710.1 ENST00000588230.1 ENST00000413636.2 ENST00000586472.1 ENST00000589686.1 ENST00000444172.2 ENST00000587323.1 ENST00000320936.5 ENST00000587896.1 ENST00000589235.1 ENST00000591659.1 |
CIRBP |
cold inducible RNA binding protein |
| chr1_+_41174988 | 1.48 |
ENST00000372652.1 |
NFYC |
nuclear transcription factor Y, gamma |
| chr1_-_182360498 | 1.48 |
ENST00000417584.2 |
GLUL |
glutamate-ammonia ligase |
| chr3_+_111393501 | 1.47 |
ENST00000393934.3 |
PLCXD2 |
phosphatidylinositol-specific phospholipase C, X domain containing 2 |
| chr7_+_100209979 | 1.47 |
ENST00000493970.1 ENST00000379527.2 |
MOSPD3 |
motile sperm domain containing 3 |
| chr5_-_137667526 | 1.46 |
ENST00000503022.1 |
CDC25C |
cell division cycle 25C |
| chr11_+_64781575 | 1.46 |
ENST00000246747.4 ENST00000529384.1 |
ARL2 |
ADP-ribosylation factor-like 2 |
| chr16_+_50775948 | 1.46 |
ENST00000569681.1 ENST00000569418.1 ENST00000540145.1 |
CYLD |
cylindromatosis (turban tumor syndrome) |
| chr1_+_213123976 | 1.46 |
ENST00000366965.2 ENST00000366967.2 |
VASH2 |
vasohibin 2 |
| chr20_-_48770174 | 1.45 |
ENST00000341698.2 |
TMEM189-UBE2V1 |
TMEM189-UBE2V1 readthrough |
| chr17_+_26646175 | 1.45 |
ENST00000583381.1 ENST00000582113.1 ENST00000582384.1 |
TMEM97 |
transmembrane protein 97 |
| chr14_+_53019822 | 1.44 |
ENST00000321662.6 |
GPR137C |
G protein-coupled receptor 137C |
| chr1_+_145477060 | 1.44 |
ENST00000369308.3 |
LIX1L |
Lix1 homolog (mouse)-like |
| chr1_-_27339317 | 1.43 |
ENST00000289166.5 |
FAM46B |
family with sequence similarity 46, member B |
| chr17_+_4613776 | 1.43 |
ENST00000269260.2 |
ARRB2 |
arrestin, beta 2 |
| chr7_+_100209725 | 1.42 |
ENST00000223054.4 |
MOSPD3 |
motile sperm domain containing 3 |
| chr12_+_117176113 | 1.41 |
ENST00000319176.7 |
RNFT2 |
ring finger protein, transmembrane 2 |
| chr12_+_7052974 | 1.41 |
ENST00000544681.1 ENST00000537087.1 |
C12orf57 |
chromosome 12 open reading frame 57 |
| chr14_+_29236269 | 1.40 |
ENST00000313071.4 |
FOXG1 |
forkhead box G1 |
| chr12_+_7053172 | 1.39 |
ENST00000229281.5 |
C12orf57 |
chromosome 12 open reading frame 57 |
| chr17_+_61699766 | 1.37 |
ENST00000579585.1 ENST00000584573.1 ENST00000361733.3 ENST00000361357.3 |
MAP3K3 |
mitogen-activated protein kinase kinase kinase 3 |
| chr20_-_32308028 | 1.36 |
ENST00000409299.3 ENST00000217398.3 ENST00000344022.3 |
PXMP4 |
peroxisomal membrane protein 4, 24kDa |
| chr12_+_117176090 | 1.35 |
ENST00000257575.4 ENST00000407967.3 ENST00000392549.2 |
RNFT2 |
ring finger protein, transmembrane 2 |
| chr17_+_26646121 | 1.35 |
ENST00000226230.6 |
TMEM97 |
transmembrane protein 97 |
| chr2_-_239148599 | 1.34 |
ENST00000409182.1 ENST00000409002.3 ENST00000450098.1 ENST00000409356.1 ENST00000409160.3 ENST00000409574.1 ENST00000272937.5 |
HES6 |
hes family bHLH transcription factor 6 |
| chr11_-_62599505 | 1.34 |
ENST00000377897.4 ENST00000394690.1 ENST00000541317.1 ENST00000294179.3 |
STX5 |
syntaxin 5 |
| chr16_+_50775971 | 1.34 |
ENST00000311559.9 ENST00000564326.1 ENST00000566206.1 |
CYLD |
cylindromatosis (turban tumor syndrome) |
| chr19_+_36606654 | 1.33 |
ENST00000588385.1 ENST00000585746.1 |
TBCB |
tubulin folding cofactor B |
| chr22_-_37172111 | 1.32 |
ENST00000417951.2 ENST00000430701.1 ENST00000433985.2 |
IFT27 |
intraflagellar transport 27 homolog (Chlamydomonas) |
| chr2_-_73298802 | 1.32 |
ENST00000411783.1 ENST00000410065.1 ENST00000442582.1 ENST00000272433.2 |
SFXN5 |
sideroflexin 5 |
| chr3_+_172468505 | 1.31 |
ENST00000427830.1 ENST00000417960.1 ENST00000428567.1 ENST00000366090.2 ENST00000426894.1 |
ECT2 |
epithelial cell transforming sequence 2 oncogene |
| chr1_-_145470383 | 1.31 |
ENST00000369314.1 ENST00000369313.3 |
POLR3GL |
polymerase (RNA) III (DNA directed) polypeptide G (32kD)-like |
| chr9_-_35815013 | 1.30 |
ENST00000259667.5 |
HINT2 |
histidine triad nucleotide binding protein 2 |
| chr7_-_6048702 | 1.29 |
ENST00000265849.7 |
PMS2 |
PMS2 postmeiotic segregation increased 2 (S. cerevisiae) |
| chr12_-_123717643 | 1.29 |
ENST00000541437.1 ENST00000606320.1 |
MPHOSPH9 |
M-phase phosphoprotein 9 |
| chr8_+_97506033 | 1.28 |
ENST00000518385.1 |
SDC2 |
syndecan 2 |
| chr19_+_33463210 | 1.28 |
ENST00000590281.1 |
C19orf40 |
chromosome 19 open reading frame 40 |
| chr2_-_131099897 | 1.28 |
ENST00000409127.1 ENST00000437688.2 ENST00000259229.2 |
CCDC115 |
coiled-coil domain containing 115 |
| chr12_+_7053228 | 1.27 |
ENST00000540506.2 |
C12orf57 |
chromosome 12 open reading frame 57 |
| chr13_+_76334795 | 1.26 |
ENST00000526202.1 ENST00000465261.2 |
LMO7 |
LIM domain 7 |
| chr1_-_27816641 | 1.25 |
ENST00000430629.2 |
WASF2 |
WAS protein family, member 2 |
| chr11_+_64781657 | 1.25 |
ENST00000533729.1 |
ARL2 |
ADP-ribosylation factor-like 2 |
| chr6_-_85474219 | 1.24 |
ENST00000369663.5 |
TBX18 |
T-box 18 |
| chr12_-_107380846 | 1.23 |
ENST00000548101.1 ENST00000550496.1 ENST00000552029.1 |
MTERFD3 |
MTERF domain containing 3 |
| chr6_+_42018614 | 1.22 |
ENST00000465926.1 ENST00000482432.1 |
TAF8 |
TAF8 RNA polymerase II, TATA box binding protein (TBP)-associated factor, 43kDa |
| chr1_-_163172625 | 1.22 |
ENST00000527988.1 ENST00000531476.1 ENST00000530507.1 |
RGS5 |
regulator of G-protein signaling 5 |
| chr22_-_37172191 | 1.22 |
ENST00000340630.5 |
IFT27 |
intraflagellar transport 27 homolog (Chlamydomonas) |
| chr12_-_54673871 | 1.22 |
ENST00000209875.4 |
CBX5 |
chromobox homolog 5 |
| chr12_+_79258444 | 1.21 |
ENST00000261205.4 |
SYT1 |
synaptotagmin I |
| chr5_-_168727786 | 1.21 |
ENST00000332966.8 |
SLIT3 |
slit homolog 3 (Drosophila) |
| chr16_+_69458428 | 1.21 |
ENST00000512062.1 ENST00000307892.8 |
CYB5B |
cytochrome b5 type B (outer mitochondrial membrane) |
| chr19_+_3572758 | 1.20 |
ENST00000416526.1 |
HMG20B |
high mobility group 20B |
| chr7_+_100210133 | 1.19 |
ENST00000393950.2 ENST00000424091.2 |
MOSPD3 |
motile sperm domain containing 3 |
| chr17_+_58755184 | 1.19 |
ENST00000589222.1 ENST00000407086.3 ENST00000390652.5 |
BCAS3 |
breast carcinoma amplified sequence 3 |
| chr8_+_37620097 | 1.19 |
ENST00000328195.3 ENST00000523358.1 ENST00000523187.1 |
PROSC |
proline synthetase co-transcribed homolog (bacterial) |
| chr19_+_36606354 | 1.19 |
ENST00000589996.1 ENST00000591296.1 |
TBCB |
tubulin folding cofactor B |
| chr19_+_50270219 | 1.19 |
ENST00000354293.5 ENST00000359032.5 |
AP2A1 |
adaptor-related protein complex 2, alpha 1 subunit |
| chr17_-_19281203 | 1.18 |
ENST00000487415.2 |
B9D1 |
B9 protein domain 1 |
| chr1_+_64239657 | 1.18 |
ENST00000371080.1 ENST00000371079.1 |
ROR1 |
receptor tyrosine kinase-like orphan receptor 1 |
| chr17_-_57232525 | 1.17 |
ENST00000583380.1 ENST00000580541.1 ENST00000578105.1 ENST00000437036.2 |
SKA2 |
spindle and kinetochore associated complex subunit 2 |
| chr19_-_55972936 | 1.17 |
ENST00000425675.2 ENST00000589080.1 ENST00000085068.3 |
ISOC2 |
isochorismatase domain containing 2 |
| chr9_+_74526532 | 1.17 |
ENST00000486911.2 |
C9orf85 |
chromosome 9 open reading frame 85 |
| chr19_-_14228541 | 1.17 |
ENST00000590853.1 ENST00000308677.4 |
PRKACA |
protein kinase, cAMP-dependent, catalytic, alpha |
| chr19_-_54663473 | 1.16 |
ENST00000222224.3 |
LENG1 |
leukocyte receptor cluster (LRC) member 1 |
| chr14_+_100842735 | 1.16 |
ENST00000554998.1 ENST00000402312.3 ENST00000335290.6 ENST00000554175.1 |
WDR25 |
WD repeat domain 25 |
| chr9_+_99212403 | 1.16 |
ENST00000375251.3 ENST00000375249.4 |
HABP4 |
hyaluronan binding protein 4 |
| chr19_+_41103063 | 1.16 |
ENST00000308370.7 |
LTBP4 |
latent transforming growth factor beta binding protein 4 |
| chr20_+_44441215 | 1.16 |
ENST00000356455.4 ENST00000405520.1 |
UBE2C |
ubiquitin-conjugating enzyme E2C |
| chr12_-_120315074 | 1.16 |
ENST00000261833.7 ENST00000392521.2 |
CIT |
citron (rho-interacting, serine/threonine kinase 21) |
| chr3_-_42003479 | 1.16 |
ENST00000420927.1 |
ULK4 |
unc-51 like kinase 4 |
| chr11_-_31531121 | 1.15 |
ENST00000532287.1 ENST00000526776.1 ENST00000534812.1 ENST00000529749.1 ENST00000278200.1 ENST00000530023.1 ENST00000533642.1 |
IMMP1L |
IMP1 inner mitochondrial membrane peptidase-like (S. cerevisiae) |
| chr5_-_110848189 | 1.15 |
ENST00000296632.3 ENST00000512160.1 ENST00000509887.1 |
STARD4 |
StAR-related lipid transfer (START) domain containing 4 |
| chr14_-_100772862 | 1.14 |
ENST00000359232.3 |
SLC25A29 |
solute carrier family 25 (mitochondrial carnitine/acylcarnitine carrier), member 29 |
| chr6_+_89791507 | 1.14 |
ENST00000354922.3 |
PNRC1 |
proline-rich nuclear receptor coactivator 1 |
| chr5_-_137667459 | 1.14 |
ENST00000415130.2 ENST00000356505.3 ENST00000357274.3 ENST00000348983.3 ENST00000323760.6 |
CDC25C |
cell division cycle 25C |
| chrX_-_99665262 | 1.13 |
ENST00000373034.4 ENST00000255531.7 |
PCDH19 |
protocadherin 19 |
| chr8_+_38854368 | 1.13 |
ENST00000466936.1 |
ADAM9 |
ADAM metallopeptidase domain 9 |
| chr3_+_8543533 | 1.13 |
ENST00000454244.1 |
LMCD1 |
LIM and cysteine-rich domains 1 |
| chr7_+_29603394 | 1.12 |
ENST00000319694.2 |
PRR15 |
proline rich 15 |
| chr19_-_18433910 | 1.12 |
ENST00000594828.3 ENST00000593829.1 |
LSM4 |
LSM4 homolog, U6 small nuclear RNA associated (S. cerevisiae) |
| chr12_-_107380910 | 1.11 |
ENST00000392830.2 ENST00000240050.4 |
MTERFD3 |
MTERF domain containing 3 |
| chr1_+_6845578 | 1.10 |
ENST00000467404.2 ENST00000439411.2 |
CAMTA1 |
calmodulin binding transcription activator 1 |
| chr19_-_10679644 | 1.10 |
ENST00000393599.2 |
CDKN2D |
cyclin-dependent kinase inhibitor 2D (p19, inhibits CDK4) |
| chr5_+_98109322 | 1.10 |
ENST00000513185.1 |
RGMB |
repulsive guidance molecule family member b |
| chr22_-_42486747 | 1.10 |
ENST00000602404.1 |
NDUFA6 |
NADH dehydrogenase (ubiquinone) 1 alpha subcomplex, 6, 14kDa |
| chr6_+_31126291 | 1.08 |
ENST00000376257.3 ENST00000376255.4 |
TCF19 |
transcription factor 19 |
| chr13_+_76334567 | 1.08 |
ENST00000321797.8 |
LMO7 |
LIM domain 7 |
| chr11_-_61582579 | 1.08 |
ENST00000539419.1 ENST00000545245.1 ENST00000545405.1 ENST00000542506.1 |
FADS1 |
fatty acid desaturase 1 |
| chr11_-_124981475 | 1.07 |
ENST00000532156.1 ENST00000532407.1 ENST00000279968.4 ENST00000527766.1 ENST00000529583.1 ENST00000524373.1 ENST00000527271.1 ENST00000526175.1 ENST00000529609.1 ENST00000533273.1 ENST00000531909.1 ENST00000529530.1 |
TMEM218 |
transmembrane protein 218 |
| chr17_-_38574169 | 1.07 |
ENST00000423485.1 |
TOP2A |
topoisomerase (DNA) II alpha 170kDa |
| chr11_+_71791849 | 1.07 |
ENST00000423494.2 ENST00000539587.1 ENST00000538478.1 ENST00000324866.7 ENST00000439209.1 |
LRTOMT |
leucine rich transmembrane and O-methyltransferase domain containing |
| chr20_+_44441304 | 1.07 |
ENST00000352551.5 |
UBE2C |
ubiquitin-conjugating enzyme E2C |
| chr5_-_168727713 | 1.07 |
ENST00000404867.3 |
SLIT3 |
slit homolog 3 (Drosophila) |
| chr12_+_110011571 | 1.07 |
ENST00000539696.1 ENST00000228510.3 ENST00000392727.3 |
MVK |
mevalonate kinase |
| chr3_+_172468472 | 1.06 |
ENST00000232458.5 ENST00000392692.3 |
ECT2 |
epithelial cell transforming sequence 2 oncogene |
| chr17_+_66509019 | 1.06 |
ENST00000585981.1 ENST00000589480.1 ENST00000585815.1 |
PRKAR1A |
protein kinase, cAMP-dependent, regulatory, type I, alpha |
| chr19_+_2476116 | 1.06 |
ENST00000215631.4 ENST00000587345.1 |
GADD45B |
growth arrest and DNA-damage-inducible, beta |
| chr8_+_11660227 | 1.04 |
ENST00000443614.2 ENST00000525900.1 |
FDFT1 |
farnesyl-diphosphate farnesyltransferase 1 |
| chr5_+_172483347 | 1.04 |
ENST00000522692.1 ENST00000296953.2 ENST00000540014.1 ENST00000520420.1 |
CREBRF |
CREB3 regulatory factor |
| chr19_+_1103936 | 1.04 |
ENST00000354171.8 ENST00000589115.1 |
GPX4 |
glutathione peroxidase 4 |
| chr10_+_60272814 | 1.04 |
ENST00000373886.3 |
BICC1 |
bicaudal C homolog 1 (Drosophila) |
| chr11_+_71791693 | 1.03 |
ENST00000289488.2 ENST00000447974.1 |
LRTOMT |
leucine rich transmembrane and O-methyltransferase domain containing |
| chr9_-_130829588 | 1.03 |
ENST00000373078.4 |
NAIF1 |
nuclear apoptosis inducing factor 1 |
| chr4_-_83821676 | 1.03 |
ENST00000355196.2 ENST00000507676.1 ENST00000506495.1 ENST00000507051.1 |
SEC31A |
SEC31 homolog A (S. cerevisiae) |
| chr17_-_74236382 | 1.03 |
ENST00000592271.1 ENST00000319945.6 ENST00000269391.6 |
RNF157 |
ring finger protein 157 |
| chrX_+_16964985 | 1.03 |
ENST00000303843.7 |
REPS2 |
RALBP1 associated Eps domain containing 2 |
| chr11_+_67798363 | 1.03 |
ENST00000525628.1 |
NDUFS8 |
NADH dehydrogenase (ubiquinone) Fe-S protein 8, 23kDa (NADH-coenzyme Q reductase) |
| chr12_+_79258547 | 1.02 |
ENST00000457153.2 |
SYT1 |
synaptotagmin I |
Gene Ontology Analysis
Gene overrepresentation in biological_process category:
| Log-likelihood per target | Total log-likelihood | Term | Description |
|---|---|---|---|
| 1.6 | 4.8 | GO:0006542 | glutamine biosynthetic process(GO:0006542) |
| 1.4 | 5.5 | GO:0006210 | pyrimidine nucleobase catabolic process(GO:0006208) thymine catabolic process(GO:0006210) thymine metabolic process(GO:0019859) |
| 1.1 | 3.3 | GO:1990108 | protein linear deubiquitination(GO:1990108) |
| 1.1 | 3.2 | GO:0019287 | isopentenyl diphosphate biosynthetic process, mevalonate pathway(GO:0019287) |
| 0.8 | 0.8 | GO:0031443 | fast-twitch skeletal muscle fiber contraction(GO:0031443) |
| 0.7 | 2.2 | GO:0098746 | fast, calcium ion-dependent exocytosis of neurotransmitter(GO:0098746) |
| 0.7 | 2.1 | GO:1902616 | acyl carnitine transport(GO:0006844) histidine transport(GO:0015817) L-histidine transmembrane transport(GO:0089709) L-histidine transport(GO:1902024) acyl carnitine transmembrane transport(GO:1902616) |
| 0.7 | 2.1 | GO:0030327 | prenylated protein catabolic process(GO:0030327) |
| 0.7 | 5.5 | GO:0021678 | third ventricle development(GO:0021678) |
| 0.7 | 2.8 | GO:2000729 | positive regulation of mesenchymal cell proliferation involved in ureter development(GO:2000729) |
| 0.7 | 4.6 | GO:0051414 | response to cortisol(GO:0051414) |
| 0.6 | 1.9 | GO:2000298 | regulation of Rho-dependent protein serine/threonine kinase activity(GO:2000298) |
| 0.6 | 2.5 | GO:0061030 | epithelial cell differentiation involved in mammary gland alveolus development(GO:0061030) |
| 0.6 | 3.1 | GO:0042078 | germ-line stem cell division(GO:0042078) male germ-line stem cell asymmetric division(GO:0048133) germline stem cell asymmetric division(GO:0098728) |
| 0.6 | 1.9 | GO:0046167 | glycerol-3-phosphate biosynthetic process(GO:0046167) |
| 0.6 | 1.2 | GO:1900126 | negative regulation of hyaluronan biosynthetic process(GO:1900126) |
| 0.6 | 1.8 | GO:2000417 | negative regulation of eosinophil migration(GO:2000417) |
| 0.6 | 1.8 | GO:0034241 | macrophage fusion(GO:0034238) regulation of macrophage fusion(GO:0034239) positive regulation of macrophage fusion(GO:0034241) |
| 0.6 | 1.7 | GO:0048203 | vesicle targeting, trans-Golgi to endosome(GO:0048203) |
| 0.6 | 2.9 | GO:0002032 | desensitization of G-protein coupled receptor protein signaling pathway by arrestin(GO:0002032) |
| 0.6 | 3.3 | GO:0010133 | proline catabolic process to glutamate(GO:0010133) |
| 0.6 | 2.2 | GO:0035441 | cell migration involved in vasculogenesis(GO:0035441) metanephric glomerulus morphogenesis(GO:0072275) metanephric glomerulus vasculature morphogenesis(GO:0072276) metanephric glomerular capillary formation(GO:0072277) |
| 0.5 | 1.6 | GO:0044691 | tooth eruption(GO:0044691) |
| 0.5 | 2.1 | GO:0043456 | regulation of pentose-phosphate shunt(GO:0043456) |
| 0.5 | 2.9 | GO:1903758 | regulation of transcription from RNA polymerase II promoter by histone modification(GO:1903756) negative regulation of transcription from RNA polymerase II promoter by histone modification(GO:1903758) |
| 0.5 | 4.3 | GO:0031536 | positive regulation of exit from mitosis(GO:0031536) |
| 0.5 | 2.4 | GO:0008204 | ergosterol biosynthetic process(GO:0006696) ergosterol metabolic process(GO:0008204) |
| 0.5 | 1.9 | GO:0009236 | cobalamin biosynthetic process(GO:0009236) |
| 0.5 | 3.3 | GO:2000035 | regulation of stem cell division(GO:2000035) |
| 0.5 | 1.4 | GO:0060823 | canonical Wnt signaling pathway involved in neural plate anterior/posterior pattern formation(GO:0060823) |
| 0.4 | 1.3 | GO:0043105 | regulation of GTP cyclohydrolase I activity(GO:0043095) negative regulation of GTP cyclohydrolase I activity(GO:0043105) |
| 0.4 | 1.6 | GO:0072344 | rescue of stalled ribosome(GO:0072344) |
| 0.4 | 1.1 | GO:1904253 | positive regulation of bile acid biosynthetic process(GO:0070859) positive regulation of bile acid metabolic process(GO:1904253) |
| 0.4 | 1.1 | GO:2000777 | positive regulation of proteasomal ubiquitin-dependent protein catabolic process involved in cellular response to hypoxia(GO:2000777) |
| 0.4 | 2.3 | GO:0006842 | tricarboxylic acid transport(GO:0006842) citrate transport(GO:0015746) |
| 0.4 | 1.1 | GO:0090427 | activation of meiosis(GO:0090427) |
| 0.4 | 1.5 | GO:0006064 | glucuronate catabolic process(GO:0006064) glucuronate catabolic process to xylulose 5-phosphate(GO:0019640) xylulose 5-phosphate metabolic process(GO:0051167) xylulose 5-phosphate biosynthetic process(GO:1901159) |
| 0.4 | 1.8 | GO:0045338 | farnesyl diphosphate metabolic process(GO:0045338) |
| 0.3 | 1.0 | GO:1900169 | regulation of glucocorticoid mediated signaling pathway(GO:1900169) |
| 0.3 | 0.7 | GO:0080154 | regulation of fertilization(GO:0080154) |
| 0.3 | 2.0 | GO:0097498 | endothelial tube lumen extension(GO:0097498) |
| 0.3 | 1.3 | GO:0010730 | negative regulation of hydrogen peroxide biosynthetic process(GO:0010730) |
| 0.3 | 0.9 | GO:0071930 | negative regulation of transcription involved in G1/S transition of mitotic cell cycle(GO:0071930) |
| 0.3 | 0.9 | GO:0090076 | relaxation of skeletal muscle(GO:0090076) |
| 0.3 | 0.9 | GO:0035494 | SNARE complex disassembly(GO:0035494) |
| 0.3 | 0.9 | GO:0006059 | hexitol metabolic process(GO:0006059) |
| 0.3 | 1.8 | GO:0051684 | maintenance of Golgi location(GO:0051684) |
| 0.3 | 1.2 | GO:0002904 | positive regulation of B cell apoptotic process(GO:0002904) |
| 0.3 | 1.2 | GO:1902361 | mitochondrial pyruvate transport(GO:0006850) mitochondrial pyruvate transmembrane transport(GO:1902361) |
| 0.3 | 1.4 | GO:0042822 | pyridoxal phosphate metabolic process(GO:0042822) |
| 0.3 | 1.4 | GO:0046449 | creatinine metabolic process(GO:0046449) |
| 0.3 | 1.1 | GO:0060434 | bronchus morphogenesis(GO:0060434) |
| 0.3 | 0.8 | GO:0046104 | thymidine metabolic process(GO:0046104) pyrimidine deoxyribonucleoside metabolic process(GO:0046125) |
| 0.3 | 1.4 | GO:0032474 | otolith morphogenesis(GO:0032474) |
| 0.3 | 0.8 | GO:0033591 | response to L-ascorbic acid(GO:0033591) |
| 0.3 | 2.1 | GO:0032417 | positive regulation of sodium:proton antiporter activity(GO:0032417) |
| 0.3 | 0.5 | GO:1990086 | lens fiber cell apoptotic process(GO:1990086) |
| 0.3 | 1.3 | GO:0044240 | multicellular organism lipid catabolic process(GO:0044240) |
| 0.3 | 1.6 | GO:1903300 | negative regulation of glucokinase activity(GO:0033132) negative regulation of hexokinase activity(GO:1903300) |
| 0.3 | 2.6 | GO:0019050 | suppression by virus of host apoptotic process(GO:0019050) modulation by virus of host apoptotic process(GO:0039526) |
| 0.3 | 0.8 | GO:1904760 | myofibroblast differentiation(GO:0036446) regulation of myofibroblast differentiation(GO:1904760) |
| 0.3 | 1.3 | GO:0048861 | leukemia inhibitory factor signaling pathway(GO:0048861) |
| 0.2 | 0.2 | GO:0071698 | olfactory placode formation(GO:0030910) olfactory placode development(GO:0071698) olfactory placode morphogenesis(GO:0071699) |
| 0.2 | 0.7 | GO:0046707 | IDP metabolic process(GO:0046707) IDP catabolic process(GO:0046709) |
| 0.2 | 1.7 | GO:2000323 | negative regulation of glucocorticoid receptor signaling pathway(GO:2000323) |
| 0.2 | 4.3 | GO:0016446 | somatic hypermutation of immunoglobulin genes(GO:0016446) |
| 0.2 | 1.0 | GO:0030718 | germ-line stem cell population maintenance(GO:0030718) |
| 0.2 | 0.7 | GO:0003275 | apoptotic process involved in outflow tract morphogenesis(GO:0003275) regulation of apoptotic process involved in outflow tract morphogenesis(GO:1902256) |
| 0.2 | 2.4 | GO:0007288 | sperm axoneme assembly(GO:0007288) |
| 0.2 | 1.7 | GO:0055129 | L-proline biosynthetic process(GO:0055129) |
| 0.2 | 0.9 | GO:0032415 | regulation of sodium:proton antiporter activity(GO:0032415) |
| 0.2 | 0.4 | GO:0071877 | regulation of adrenergic receptor signaling pathway(GO:0071877) |
| 0.2 | 0.4 | GO:0007023 | post-chaperonin tubulin folding pathway(GO:0007023) |
| 0.2 | 0.4 | GO:0042816 | vitamin B6 metabolic process(GO:0042816) |
| 0.2 | 0.4 | GO:0046490 | isopentenyl diphosphate biosynthetic process(GO:0009240) isopentenyl diphosphate metabolic process(GO:0046490) |
| 0.2 | 1.3 | GO:0008218 | bioluminescence(GO:0008218) |
| 0.2 | 1.1 | GO:0007525 | somatic muscle development(GO:0007525) |
| 0.2 | 0.8 | GO:0019626 | short-chain fatty acid catabolic process(GO:0019626) |
| 0.2 | 0.6 | GO:0019417 | sulfur oxidation(GO:0019417) |
| 0.2 | 0.6 | GO:0019085 | early viral transcription(GO:0019085) |
| 0.2 | 0.8 | GO:0016476 | regulation of embryonic cell shape(GO:0016476) |
| 0.2 | 0.2 | GO:0098989 | NMDA selective glutamate receptor signaling pathway(GO:0098989) |
| 0.2 | 0.8 | GO:0097368 | establishment of Sertoli cell barrier(GO:0097368) |
| 0.2 | 0.8 | GO:1901675 | negative regulation of histone H3-K27 acetylation(GO:1901675) |
| 0.2 | 0.2 | GO:0072229 | proximal convoluted tubule development(GO:0072019) metanephric proximal convoluted tubule development(GO:0072229) |
| 0.2 | 0.2 | GO:0060136 | embryonic process involved in female pregnancy(GO:0060136) |
| 0.2 | 2.0 | GO:0031087 | deadenylation-independent decapping of nuclear-transcribed mRNA(GO:0031087) |
| 0.2 | 0.4 | GO:0060236 | regulation of mitotic spindle organization(GO:0060236) |
| 0.2 | 1.2 | GO:0071638 | negative regulation of monocyte chemotactic protein-1 production(GO:0071638) |
| 0.2 | 3.3 | GO:0051988 | regulation of attachment of spindle microtubules to kinetochore(GO:0051988) |
| 0.2 | 1.0 | GO:1905098 | negative regulation of guanyl-nucleotide exchange factor activity(GO:1905098) |
| 0.2 | 0.8 | GO:1904448 | negative regulation of gamma-aminobutyric acid secretion(GO:0014053) aspartate secretion(GO:0061528) regulation of aspartate secretion(GO:1904448) positive regulation of aspartate secretion(GO:1904450) |
| 0.2 | 0.8 | GO:0046725 | negative regulation by virus of viral protein levels in host cell(GO:0046725) negative regulation of metanephric nephron tubule epithelial cell differentiation(GO:0072308) |
| 0.2 | 3.4 | GO:0007021 | tubulin complex assembly(GO:0007021) |
| 0.2 | 5.9 | GO:2001275 | positive regulation of glucose import in response to insulin stimulus(GO:2001275) |
| 0.2 | 9.2 | GO:0045744 | negative regulation of G-protein coupled receptor protein signaling pathway(GO:0045744) |
| 0.2 | 0.7 | GO:1900224 | positive regulation of nodal signaling pathway involved in determination of lateral mesoderm left/right asymmetry(GO:1900224) |
| 0.2 | 3.7 | GO:0019614 | catechol-containing compound catabolic process(GO:0019614) catecholamine catabolic process(GO:0042424) |
| 0.2 | 0.4 | GO:0006106 | fumarate metabolic process(GO:0006106) |
| 0.2 | 0.5 | GO:1901301 | regulation of cargo loading into COPII-coated vesicle(GO:1901301) |
| 0.2 | 0.2 | GO:0010807 | regulation of synaptic vesicle priming(GO:0010807) |
| 0.2 | 4.1 | GO:0002347 | response to tumor cell(GO:0002347) |
| 0.2 | 1.6 | GO:0001886 | endothelial cell morphogenesis(GO:0001886) |
| 0.2 | 0.7 | GO:0010816 | substance P catabolic process(GO:0010814) calcitonin catabolic process(GO:0010816) endothelin maturation(GO:0034959) |
| 0.2 | 2.6 | GO:0045835 | negative regulation of meiotic nuclear division(GO:0045835) |
| 0.2 | 0.9 | GO:0046116 | queuosine biosynthetic process(GO:0008616) queuosine metabolic process(GO:0046116) |
| 0.2 | 0.9 | GO:0030047 | actin modification(GO:0030047) |
| 0.2 | 1.2 | GO:0007621 | negative regulation of female receptivity(GO:0007621) |
| 0.2 | 0.2 | GO:0035026 | leading edge cell differentiation(GO:0035026) |
| 0.2 | 7.0 | GO:0071711 | basement membrane organization(GO:0071711) |
| 0.2 | 1.4 | GO:1903142 | positive regulation of endothelial cell development(GO:1901552) positive regulation of establishment of endothelial barrier(GO:1903142) |
| 0.2 | 0.5 | GO:0045876 | positive regulation of sister chromatid cohesion(GO:0045876) |
| 0.2 | 0.7 | GO:0060830 | ciliary receptor clustering involved in smoothened signaling pathway(GO:0060830) |
| 0.2 | 0.3 | GO:0072385 | minus-end-directed organelle transport along microtubule(GO:0072385) |
| 0.2 | 0.2 | GO:0051029 | rRNA import into mitochondrion(GO:0035928) rRNA transport(GO:0051029) |
| 0.2 | 0.5 | GO:0002276 | basophil activation involved in immune response(GO:0002276) |
| 0.2 | 0.5 | GO:0009405 | pathogenesis(GO:0009405) |
| 0.2 | 1.0 | GO:0034421 | post-translational protein acetylation(GO:0034421) |
| 0.2 | 4.2 | GO:0070886 | positive regulation of calcineurin-NFAT signaling cascade(GO:0070886) |
| 0.2 | 0.5 | GO:0043314 | negative regulation of neutrophil degranulation(GO:0043314) |
| 0.2 | 0.5 | GO:0021524 | visceral motor neuron differentiation(GO:0021524) |
| 0.2 | 0.3 | GO:2000177 | regulation of neural precursor cell proliferation(GO:2000177) |
| 0.2 | 2.5 | GO:0034063 | stress granule assembly(GO:0034063) |
| 0.2 | 0.5 | GO:0006114 | glycerol biosynthetic process(GO:0006114) |
| 0.2 | 0.5 | GO:1904482 | response to tetrahydrofolate(GO:1904481) cellular response to tetrahydrofolate(GO:1904482) |
| 0.2 | 0.5 | GO:0036071 | N-glycan fucosylation(GO:0036071) |
| 0.2 | 0.6 | GO:0030070 | insulin processing(GO:0030070) |
| 0.2 | 1.2 | GO:0097577 | intracellular sequestering of iron ion(GO:0006880) sequestering of iron ion(GO:0097577) |
| 0.1 | 0.9 | GO:2000322 | regulation of glucocorticoid receptor signaling pathway(GO:2000322) |
| 0.1 | 0.1 | GO:2000646 | positive regulation of receptor catabolic process(GO:2000646) |
| 0.1 | 0.3 | GO:0006982 | response to lipid hydroperoxide(GO:0006982) |
| 0.1 | 0.3 | GO:0036166 | phenotypic switching(GO:0036166) regulation of phenotypic switching(GO:1900239) |
| 0.1 | 1.0 | GO:0045007 | depurination(GO:0045007) |
| 0.1 | 0.7 | GO:0051490 | negative regulation of filopodium assembly(GO:0051490) |
| 0.1 | 0.6 | GO:0060392 | negative regulation of SMAD protein import into nucleus(GO:0060392) |
| 0.1 | 0.4 | GO:0030860 | neuroblast division in subventricular zone(GO:0021849) regulation of polarized epithelial cell differentiation(GO:0030860) |
| 0.1 | 1.1 | GO:0006627 | protein processing involved in protein targeting to mitochondrion(GO:0006627) |
| 0.1 | 1.7 | GO:0016584 | nucleosome positioning(GO:0016584) |
| 0.1 | 0.3 | GO:1904431 | positive regulation of t-circle formation(GO:1904431) |
| 0.1 | 0.1 | GO:0006267 | pre-replicative complex assembly involved in nuclear cell cycle DNA replication(GO:0006267) pre-replicative complex assembly(GO:0036388) pre-replicative complex assembly involved in cell cycle DNA replication(GO:1902299) |
| 0.1 | 0.3 | GO:0060252 | positive regulation of glial cell proliferation(GO:0060252) |
| 0.1 | 0.6 | GO:0006574 | valine catabolic process(GO:0006574) |
| 0.1 | 1.1 | GO:2000042 | negative regulation of double-strand break repair via homologous recombination(GO:2000042) |
| 0.1 | 0.8 | GO:0034182 | regulation of maintenance of sister chromatid cohesion(GO:0034091) regulation of maintenance of mitotic sister chromatid cohesion(GO:0034182) |
| 0.1 | 1.0 | GO:2001223 | negative regulation of neuron migration(GO:2001223) |
| 0.1 | 1.4 | GO:0048280 | vesicle fusion with Golgi apparatus(GO:0048280) |
| 0.1 | 1.5 | GO:0015939 | pantothenate metabolic process(GO:0015939) |
| 0.1 | 0.5 | GO:0019322 | pentose biosynthetic process(GO:0019322) |
| 0.1 | 0.4 | GO:0043137 | DNA replication, removal of RNA primer(GO:0043137) |
| 0.1 | 0.4 | GO:1903225 | negative regulation of endodermal cell differentiation(GO:1903225) |
| 0.1 | 0.4 | GO:0032289 | central nervous system myelin formation(GO:0032289) |
| 0.1 | 0.3 | GO:0032687 | negative regulation of interferon-alpha production(GO:0032687) |
| 0.1 | 0.4 | GO:0019243 | methylglyoxal catabolic process to D-lactate via S-lactoyl-glutathione(GO:0019243) methylglyoxal catabolic process(GO:0051596) methylglyoxal catabolic process to lactate(GO:0061727) |
| 0.1 | 0.1 | GO:0000022 | mitotic spindle elongation(GO:0000022) |
| 0.1 | 0.7 | GO:0001315 | age-dependent response to oxidative stress(GO:0001306) age-dependent response to reactive oxygen species(GO:0001315) regulation of systemic arterial blood pressure by acetylcholine(GO:0003068) vasodilation by acetylcholine involved in regulation of systemic arterial blood pressure(GO:0003069) regulation of systemic arterial blood pressure by neurotransmitter(GO:0003070) age-dependent general metabolic decline(GO:0007571) |
| 0.1 | 1.0 | GO:2001033 | negative regulation of double-strand break repair via nonhomologous end joining(GO:2001033) |
| 0.1 | 0.1 | GO:0060926 | cardiac pacemaker cell differentiation(GO:0060920) cardiac pacemaker cell development(GO:0060926) |
| 0.1 | 1.2 | GO:0014877 | response to muscle inactivity involved in regulation of muscle adaptation(GO:0014877) response to denervation involved in regulation of muscle adaptation(GO:0014894) |
| 0.1 | 1.1 | GO:0046618 | drug export(GO:0046618) |
| 0.1 | 0.5 | GO:0072137 | condensed mesenchymal cell proliferation(GO:0072137) |
| 0.1 | 0.4 | GO:0031548 | regulation of brain-derived neurotrophic factor receptor signaling pathway(GO:0031548) |
| 0.1 | 0.1 | GO:0003166 | bundle of His development(GO:0003166) |
| 0.1 | 0.4 | GO:0001983 | regulation of systemic arterial blood pressure by carotid sinus baroreceptor feedback(GO:0001978) baroreceptor response to increased systemic arterial blood pressure(GO:0001983) |
| 0.1 | 3.2 | GO:0051457 | maintenance of protein location in nucleus(GO:0051457) |
| 0.1 | 2.2 | GO:0007175 | negative regulation of epidermal growth factor-activated receptor activity(GO:0007175) |
| 0.1 | 0.5 | GO:0033512 | L-lysine catabolic process to acetyl-CoA via saccharopine(GO:0033512) |
| 0.1 | 8.2 | GO:0015701 | bicarbonate transport(GO:0015701) |
| 0.1 | 0.5 | GO:0036292 | DNA rewinding(GO:0036292) |
| 0.1 | 0.6 | GO:1903377 | negative regulation of oxidative stress-induced neuron intrinsic apoptotic signaling pathway(GO:1903377) |
| 0.1 | 0.6 | GO:0015808 | L-alanine transport(GO:0015808) |
| 0.1 | 1.6 | GO:0019695 | choline metabolic process(GO:0019695) |
| 0.1 | 0.4 | GO:0006566 | threonine metabolic process(GO:0006566) |
| 0.1 | 0.2 | GO:0007161 | calcium-independent cell-matrix adhesion(GO:0007161) |
| 0.1 | 0.6 | GO:0010735 | positive regulation of transcription via serum response element binding(GO:0010735) |
| 0.1 | 0.4 | GO:0009138 | pyrimidine nucleoside diphosphate metabolic process(GO:0009138) |
| 0.1 | 0.7 | GO:0032803 | regulation of low-density lipoprotein particle receptor catabolic process(GO:0032803) |
| 0.1 | 0.7 | GO:0043461 | proton-transporting ATP synthase complex assembly(GO:0043461) proton-transporting ATP synthase complex biogenesis(GO:0070272) |
| 0.1 | 0.6 | GO:0051012 | microtubule sliding(GO:0051012) |
| 0.1 | 1.3 | GO:0007042 | lysosomal lumen acidification(GO:0007042) |
| 0.1 | 0.3 | GO:0048808 | male genitalia morphogenesis(GO:0048808) male anatomical structure morphogenesis(GO:0090598) |
| 0.1 | 0.8 | GO:0032000 | positive regulation of fatty acid beta-oxidation(GO:0032000) |
| 0.1 | 1.2 | GO:0006564 | L-serine biosynthetic process(GO:0006564) |
| 0.1 | 1.9 | GO:0033234 | negative regulation of protein sumoylation(GO:0033234) |
| 0.1 | 1.0 | GO:2001200 | positive regulation of dendritic cell differentiation(GO:2001200) |
| 0.1 | 1.7 | GO:0033539 | fatty acid beta-oxidation using acyl-CoA dehydrogenase(GO:0033539) |
| 0.1 | 1.2 | GO:0046886 | positive regulation of hormone biosynthetic process(GO:0046886) |
| 0.1 | 0.3 | GO:0090187 | positive regulation of pancreatic juice secretion(GO:0090187) |
| 0.1 | 1.1 | GO:0030263 | apoptotic chromosome condensation(GO:0030263) regulation of single stranded viral RNA replication via double stranded DNA intermediate(GO:0045091) |
| 0.1 | 1.1 | GO:0035583 | sequestering of TGFbeta in extracellular matrix(GO:0035583) |
| 0.1 | 0.5 | GO:0019255 | glucose 1-phosphate metabolic process(GO:0019255) |
| 0.1 | 0.5 | GO:0001554 | luteolysis(GO:0001554) |
| 0.1 | 0.9 | GO:0071896 | protein localization to adherens junction(GO:0071896) |
| 0.1 | 0.6 | GO:1903232 | melanosome assembly(GO:1903232) |
| 0.1 | 2.2 | GO:1900745 | positive regulation of p38MAPK cascade(GO:1900745) |
| 0.1 | 0.8 | GO:0001955 | blood vessel maturation(GO:0001955) |
| 0.1 | 2.4 | GO:0019372 | lipoxygenase pathway(GO:0019372) |
| 0.1 | 0.3 | GO:0001928 | regulation of exocyst assembly(GO:0001928) regulation of exocyst localization(GO:0060178) |
| 0.1 | 0.6 | GO:0010756 | positive regulation of plasminogen activation(GO:0010756) |
| 0.1 | 4.8 | GO:0006336 | DNA replication-independent nucleosome assembly(GO:0006336) DNA replication-independent nucleosome organization(GO:0034724) |
| 0.1 | 1.3 | GO:1900747 | negative regulation of vascular endothelial growth factor signaling pathway(GO:1900747) |
| 0.1 | 0.9 | GO:0051415 | interphase microtubule nucleation by interphase microtubule organizing center(GO:0051415) microtubule nucleation by microtubule organizing center(GO:0051418) |
| 0.1 | 0.3 | GO:1902303 | regulation of heart rate by hormone(GO:0003064) negative regulation of potassium ion export(GO:1902303) |
| 0.1 | 3.3 | GO:0042776 | mitochondrial ATP synthesis coupled proton transport(GO:0042776) |
| 0.1 | 1.5 | GO:0060155 | platelet dense granule organization(GO:0060155) |
| 0.1 | 0.6 | GO:2000074 | regulation of type B pancreatic cell development(GO:2000074) |
| 0.1 | 0.4 | GO:1901355 | response to rapamycin(GO:1901355) |
| 0.1 | 3.9 | GO:0006298 | mismatch repair(GO:0006298) |
| 0.1 | 0.4 | GO:0009447 | putrescine catabolic process(GO:0009447) |
| 0.1 | 0.3 | GO:0070541 | response to platinum ion(GO:0070541) |
| 0.1 | 2.3 | GO:0000920 | cell separation after cytokinesis(GO:0000920) |
| 0.1 | 1.0 | GO:1903540 | neurotransmitter receptor transport to postsynaptic membrane(GO:0098969) establishment of protein localization to postsynaptic membrane(GO:1903540) |
| 0.1 | 0.2 | GO:2000097 | regulation of smooth muscle cell-matrix adhesion(GO:2000097) |
| 0.1 | 4.7 | GO:0045026 | plasma membrane fusion(GO:0045026) |
| 0.1 | 1.2 | GO:0048194 | Golgi vesicle budding(GO:0048194) |
| 0.1 | 0.7 | GO:0006611 | protein export from nucleus(GO:0006611) |
| 0.1 | 0.5 | GO:0046600 | negative regulation of centriole replication(GO:0046600) |
| 0.1 | 12.1 | GO:0000079 | regulation of cyclin-dependent protein serine/threonine kinase activity(GO:0000079) |
| 0.1 | 0.6 | GO:0051344 | regulation of cyclic-nucleotide phosphodiesterase activity(GO:0051342) negative regulation of cyclic-nucleotide phosphodiesterase activity(GO:0051344) |
| 0.1 | 2.4 | GO:0051497 | negative regulation of stress fiber assembly(GO:0051497) |
| 0.1 | 0.4 | GO:0001957 | intramembranous ossification(GO:0001957) direct ossification(GO:0036072) |
| 0.1 | 0.5 | GO:0035519 | protein K29-linked ubiquitination(GO:0035519) |
| 0.1 | 0.8 | GO:0006552 | leucine catabolic process(GO:0006552) |
| 0.1 | 0.4 | GO:0002331 | pre-B cell allelic exclusion(GO:0002331) |
| 0.1 | 1.2 | GO:1901621 | negative regulation of smoothened signaling pathway involved in dorsal/ventral neural tube patterning(GO:1901621) |
| 0.1 | 0.1 | GO:1904030 | negative regulation of cyclin-dependent protein kinase activity(GO:1904030) |
| 0.1 | 1.1 | GO:0036155 | acylglycerol acyl-chain remodeling(GO:0036155) |
| 0.1 | 4.5 | GO:0035735 | intraciliary transport involved in cilium morphogenesis(GO:0035735) |
| 0.1 | 1.1 | GO:2000096 | positive regulation of Wnt signaling pathway, planar cell polarity pathway(GO:2000096) |
| 0.1 | 1.1 | GO:0051895 | negative regulation of focal adhesion assembly(GO:0051895) |
| 0.1 | 0.7 | GO:0007258 | JUN phosphorylation(GO:0007258) |
| 0.1 | 0.4 | GO:0034124 | regulation of MyD88-dependent toll-like receptor signaling pathway(GO:0034124) |
| 0.1 | 0.1 | GO:1905244 | regulation of modification of synaptic structure(GO:1905244) |
| 0.1 | 1.4 | GO:0033962 | cytoplasmic mRNA processing body assembly(GO:0033962) |
| 0.1 | 1.0 | GO:0061158 | 3'-UTR-mediated mRNA destabilization(GO:0061158) |
| 0.1 | 0.2 | GO:0048478 | replication fork protection(GO:0048478) |
| 0.1 | 0.9 | GO:1902669 | positive regulation of axon guidance(GO:1902669) |
| 0.1 | 0.3 | GO:0070318 | positive regulation of G0 to G1 transition(GO:0070318) |
| 0.1 | 0.6 | GO:0043388 | positive regulation of DNA binding(GO:0043388) |
| 0.1 | 1.6 | GO:0043486 | histone exchange(GO:0043486) |
| 0.1 | 0.4 | GO:0045204 | MAPK export from nucleus(GO:0045204) |
| 0.1 | 0.1 | GO:0034443 | regulation of lipoprotein oxidation(GO:0034442) negative regulation of lipoprotein oxidation(GO:0034443) regulation of plasma lipoprotein particle oxidation(GO:0034444) negative regulation of plasma lipoprotein particle oxidation(GO:0034445) |
| 0.1 | 1.0 | GO:0007097 | nuclear migration(GO:0007097) |
| 0.1 | 1.1 | GO:0061157 | mRNA destabilization(GO:0061157) |
| 0.1 | 0.3 | GO:0007468 | regulation of rhodopsin gene expression(GO:0007468) positive regulation of rhodopsin gene expression(GO:0045872) |
| 0.1 | 0.1 | GO:1904781 | positive regulation of protein localization to centrosome(GO:1904781) |
| 0.1 | 1.0 | GO:0070050 | neuron cellular homeostasis(GO:0070050) |
| 0.1 | 0.7 | GO:2000774 | positive regulation of cellular senescence(GO:2000774) |
| 0.1 | 0.2 | GO:0032618 | interleukin-15 production(GO:0032618) |
| 0.1 | 0.2 | GO:1904772 | hepatocyte homeostasis(GO:0036333) response to tetrachloromethane(GO:1904772) |
| 0.1 | 0.6 | GO:0018103 | protein C-linked glycosylation(GO:0018103) peptidyl-tryptophan modification(GO:0018211) protein C-linked glycosylation via tryptophan(GO:0018317) protein C-linked glycosylation via 2'-alpha-mannosyl-L-tryptophan(GO:0018406) |
| 0.1 | 1.6 | GO:0007035 | vacuolar acidification(GO:0007035) |
| 0.1 | 0.4 | GO:0007079 | mitotic chromosome movement towards spindle pole(GO:0007079) |
| 0.1 | 0.1 | GO:1903626 | positive regulation of apoptotic DNA fragmentation(GO:1902512) positive regulation of DNA catabolic process(GO:1903626) |
| 0.1 | 0.2 | GO:0086097 | phospholipase C-activating angiotensin-activated signaling pathway(GO:0086097) |
| 0.1 | 1.0 | GO:0042532 | negative regulation of tyrosine phosphorylation of STAT protein(GO:0042532) |
| 0.1 | 0.9 | GO:0035520 | monoubiquitinated protein deubiquitination(GO:0035520) |
| 0.1 | 0.5 | GO:1903608 | protein localization to cytoplasmic stress granule(GO:1903608) |
| 0.1 | 1.2 | GO:0009081 | branched-chain amino acid metabolic process(GO:0009081) branched-chain amino acid catabolic process(GO:0009083) |
| 0.1 | 1.5 | GO:0036109 | alpha-linolenic acid metabolic process(GO:0036109) |
| 0.1 | 0.8 | GO:0071394 | cellular response to testosterone stimulus(GO:0071394) |
| 0.1 | 0.7 | GO:0000290 | deadenylation-dependent decapping of nuclear-transcribed mRNA(GO:0000290) |
| 0.1 | 1.0 | GO:2001135 | regulation of endocytic recycling(GO:2001135) |
| 0.1 | 0.3 | GO:0060743 | epithelial cell maturation involved in prostate gland development(GO:0060743) |
| 0.1 | 1.8 | GO:0000038 | very long-chain fatty acid metabolic process(GO:0000038) |
| 0.1 | 0.3 | GO:0009052 | pentose-phosphate shunt, non-oxidative branch(GO:0009052) |
| 0.1 | 0.2 | GO:1904636 | response to ionomycin(GO:1904636) cellular response to ionomycin(GO:1904637) negative regulation of synapse maturation(GO:2000297) |
| 0.1 | 0.6 | GO:0017062 | respiratory chain complex III assembly(GO:0017062) mitochondrial respiratory chain complex III assembly(GO:0034551) mitochondrial respiratory chain complex III biogenesis(GO:0097033) |
| 0.1 | 1.2 | GO:0090110 | cargo loading into COPII-coated vesicle(GO:0090110) |
| 0.1 | 0.3 | GO:0033031 | positive regulation of neutrophil apoptotic process(GO:0033031) |
| 0.1 | 0.3 | GO:2000825 | positive regulation of androgen receptor activity(GO:2000825) |
| 0.1 | 0.1 | GO:0032776 | DNA methylation on cytosine(GO:0032776) C-5 methylation of cytosine(GO:0090116) |
| 0.1 | 0.5 | GO:0097500 | receptor localization to nonmotile primary cilium(GO:0097500) |
| 0.1 | 1.4 | GO:0031297 | replication fork processing(GO:0031297) |
| 0.1 | 0.4 | GO:0006499 | N-terminal protein myristoylation(GO:0006499) |
| 0.1 | 0.2 | GO:0010360 | negative regulation of anion channel activity(GO:0010360) Golgi to plasma membrane CFTR protein transport(GO:0043000) |
| 0.1 | 0.4 | GO:0035984 | response to trichostatin A(GO:0035983) cellular response to trichostatin A(GO:0035984) |
| 0.1 | 1.3 | GO:2001222 | regulation of neuron migration(GO:2001222) |
| 0.1 | 1.3 | GO:0032780 | negative regulation of ATPase activity(GO:0032780) |
| 0.1 | 0.4 | GO:0006102 | isocitrate metabolic process(GO:0006102) |
| 0.1 | 4.3 | GO:0032392 | DNA geometric change(GO:0032392) |
| 0.1 | 1.4 | GO:0071447 | cellular response to hydroperoxide(GO:0071447) |
| 0.1 | 0.2 | GO:0090403 | oxidative stress-induced premature senescence(GO:0090403) |
| 0.1 | 0.6 | GO:0006610 | ribosomal protein import into nucleus(GO:0006610) |
| 0.1 | 0.2 | GO:0033364 | mast cell secretory granule organization(GO:0033364) |
| 0.1 | 4.0 | GO:0006120 | mitochondrial electron transport, NADH to ubiquinone(GO:0006120) |
| 0.1 | 1.4 | GO:0016578 | histone deubiquitination(GO:0016578) |
| 0.1 | 0.1 | GO:1903936 | response to sodium arsenite(GO:1903935) cellular response to sodium arsenite(GO:1903936) |
| 0.1 | 2.6 | GO:0070911 | global genome nucleotide-excision repair(GO:0070911) |
| 0.1 | 1.0 | GO:0045974 | miRNA mediated inhibition of translation(GO:0035278) negative regulation of translation, ncRNA-mediated(GO:0040033) regulation of translation, ncRNA-mediated(GO:0045974) |
| 0.1 | 0.1 | GO:0071677 | positive regulation of mononuclear cell migration(GO:0071677) |
| 0.1 | 0.2 | GO:1904526 | regulation of microtubule binding(GO:1904526) |
| 0.1 | 0.1 | GO:2001034 | positive regulation of double-strand break repair via nonhomologous end joining(GO:2001034) |
| 0.1 | 0.2 | GO:1904566 | response to 1-oleoyl-sn-glycerol 3-phosphate(GO:1904565) cellular response to 1-oleoyl-sn-glycerol 3-phosphate(GO:1904566) |
| 0.1 | 0.2 | GO:0061762 | CAMKK-AMPK signaling cascade(GO:0061762) |
| 0.1 | 0.8 | GO:0032516 | positive regulation of phosphoprotein phosphatase activity(GO:0032516) |
| 0.1 | 0.6 | GO:0035608 | protein deglutamylation(GO:0035608) |
| 0.1 | 0.2 | GO:2000374 | regulation of oxygen metabolic process(GO:2000374) |
| 0.1 | 0.1 | GO:0046103 | adenosine catabolic process(GO:0006154) inosine biosynthetic process(GO:0046103) |
| 0.1 | 0.2 | GO:0051106 | regulation of DNA ligation(GO:0051105) positive regulation of DNA ligation(GO:0051106) |
| 0.1 | 0.2 | GO:0060152 | peroxisome localization(GO:0060151) microtubule-based peroxisome localization(GO:0060152) |
| 0.1 | 0.2 | GO:0038178 | complement component C5a signaling pathway(GO:0038178) |
| 0.1 | 1.0 | GO:0034453 | microtubule anchoring(GO:0034453) |
| 0.1 | 0.9 | GO:0051281 | positive regulation of release of sequestered calcium ion into cytosol(GO:0051281) |
| 0.1 | 1.3 | GO:0045601 | regulation of endothelial cell differentiation(GO:0045601) |
| 0.1 | 0.3 | GO:0045541 | negative regulation of cholesterol biosynthetic process(GO:0045541) negative regulation of cholesterol metabolic process(GO:0090206) |
| 0.1 | 0.3 | GO:0070562 | regulation of vitamin D receptor signaling pathway(GO:0070562) |
| 0.1 | 0.2 | GO:0007231 | osmosensory signaling pathway(GO:0007231) |
| 0.1 | 1.1 | GO:1901663 | ubiquinone biosynthetic process(GO:0006744) quinone biosynthetic process(GO:1901663) |
| 0.1 | 2.1 | GO:0097352 | autophagosome maturation(GO:0097352) |
| 0.1 | 0.1 | GO:0033590 | response to cobalamin(GO:0033590) |
| 0.1 | 0.7 | GO:2000675 | negative regulation of type B pancreatic cell apoptotic process(GO:2000675) |
| 0.1 | 0.2 | GO:0071418 | cellular response to amine stimulus(GO:0071418) |
| 0.1 | 0.9 | GO:0006388 | tRNA splicing, via endonucleolytic cleavage and ligation(GO:0006388) |
| 0.1 | 0.5 | GO:0015840 | urea transport(GO:0015840) |
| 0.1 | 0.8 | GO:0006004 | fucose metabolic process(GO:0006004) |
| 0.1 | 1.1 | GO:0042113 | B cell activation(GO:0042113) |
| 0.1 | 0.2 | GO:0046416 | D-amino acid metabolic process(GO:0046416) |
| 0.1 | 0.4 | GO:0071461 | cellular response to redox state(GO:0071461) |
| 0.1 | 1.0 | GO:0090383 | phagosome acidification(GO:0090383) |
| 0.0 | 0.2 | GO:0009438 | methylglyoxal metabolic process(GO:0009438) |
| 0.0 | 0.6 | GO:0036066 | protein O-linked fucosylation(GO:0036066) |
| 0.0 | 0.1 | GO:0070213 | protein auto-ADP-ribosylation(GO:0070213) |
| 0.0 | 0.5 | GO:0031145 | anaphase-promoting complex-dependent catabolic process(GO:0031145) |
| 0.0 | 0.5 | GO:0051775 | response to redox state(GO:0051775) |
| 0.0 | 0.8 | GO:0035493 | SNARE complex assembly(GO:0035493) |
| 0.0 | 1.1 | GO:0008608 | attachment of spindle microtubules to kinetochore(GO:0008608) |
| 0.0 | 0.2 | GO:0006543 | glutamine catabolic process(GO:0006543) |
| 0.0 | 1.0 | GO:0034643 | establishment of mitochondrion localization, microtubule-mediated(GO:0034643) mitochondrion transport along microtubule(GO:0047497) |
| 0.0 | 1.1 | GO:0048240 | sperm capacitation(GO:0048240) |
| 0.0 | 0.4 | GO:0010457 | centriole-centriole cohesion(GO:0010457) |
| 0.0 | 0.4 | GO:0051382 | kinetochore assembly(GO:0051382) |
| 0.0 | 0.5 | GO:1904153 | negative regulation of protein exit from endoplasmic reticulum(GO:0070862) negative regulation of retrograde protein transport, ER to cytosol(GO:1904153) |
| 0.0 | 0.5 | GO:0017182 | peptidyl-diphthamide metabolic process(GO:0017182) peptidyl-diphthamide biosynthetic process from peptidyl-histidine(GO:0017183) |
| 0.0 | 1.4 | GO:1900273 | positive regulation of long-term synaptic potentiation(GO:1900273) |
| 0.0 | 1.0 | GO:0032012 | regulation of ARF protein signal transduction(GO:0032012) |
| 0.0 | 0.2 | GO:2000781 | positive regulation of double-strand break repair(GO:2000781) |
| 0.0 | 0.2 | GO:0014886 | transition between slow and fast fiber(GO:0014886) |
| 0.0 | 0.2 | GO:0048388 | endosomal lumen acidification(GO:0048388) |
| 0.0 | 0.5 | GO:0070884 | regulation of calcineurin-NFAT signaling cascade(GO:0070884) |
| 0.0 | 0.2 | GO:0050779 | RNA destabilization(GO:0050779) |
| 0.0 | 1.3 | GO:0014002 | astrocyte development(GO:0014002) |
| 0.0 | 0.4 | GO:0030643 | cellular phosphate ion homeostasis(GO:0030643) cellular trivalent inorganic anion homeostasis(GO:0072502) |
| 0.0 | 0.6 | GO:0048251 | elastic fiber assembly(GO:0048251) |
| 0.0 | 1.3 | GO:0030199 | collagen fibril organization(GO:0030199) |
| 0.0 | 0.1 | GO:0010836 | negative regulation of protein ADP-ribosylation(GO:0010836) |
| 0.0 | 0.2 | GO:0009439 | cyanate metabolic process(GO:0009439) cyanate catabolic process(GO:0009440) |
| 0.0 | 0.2 | GO:0045648 | positive regulation of erythrocyte differentiation(GO:0045648) |
| 0.0 | 0.1 | GO:0043376 | regulation of CD8-positive, alpha-beta T cell differentiation(GO:0043376) |
| 0.0 | 3.7 | GO:0000045 | autophagosome assembly(GO:0000045) |
| 0.0 | 0.1 | GO:0006537 | glutamate biosynthetic process(GO:0006537) |
| 0.0 | 0.6 | GO:0007096 | regulation of exit from mitosis(GO:0007096) |
| 0.0 | 0.2 | GO:0042126 | nitrate metabolic process(GO:0042126) |
| 0.0 | 0.4 | GO:0045793 | positive regulation of cell size(GO:0045793) |
| 0.0 | 0.2 | GO:1903772 | virus maturation(GO:0019075) regulation of viral budding via host ESCRT complex(GO:1903772) |
| 0.0 | 0.4 | GO:0032196 | transposition(GO:0032196) |
| 0.0 | 1.4 | GO:0035307 | positive regulation of dephosphorylation(GO:0035306) positive regulation of protein dephosphorylation(GO:0035307) |
| 0.0 | 0.0 | GO:2001032 | regulation of double-strand break repair via nonhomologous end joining(GO:2001032) |
| 0.0 | 0.2 | GO:0010499 | proteasomal ubiquitin-independent protein catabolic process(GO:0010499) |
| 0.0 | 1.2 | GO:0043046 | DNA methylation involved in gamete generation(GO:0043046) |
| 0.0 | 0.2 | GO:2000010 | positive regulation of protein localization to cell surface(GO:2000010) |
| 0.0 | 1.8 | GO:0038128 | ERBB2 signaling pathway(GO:0038128) |
| 0.0 | 0.1 | GO:0045906 | negative regulation of vasoconstriction(GO:0045906) negative regulation of vascular smooth muscle contraction(GO:1904694) |
| 0.0 | 0.9 | GO:0060074 | synapse maturation(GO:0060074) |
| 0.0 | 0.2 | GO:0032484 | Ral protein signal transduction(GO:0032484) regulation of Ral protein signal transduction(GO:0032485) |
| 0.0 | 0.3 | GO:0035630 | bone mineralization involved in bone maturation(GO:0035630) |
| 0.0 | 0.2 | GO:0015853 | adenine transport(GO:0015853) |
| 0.0 | 0.5 | GO:0006103 | 2-oxoglutarate metabolic process(GO:0006103) |
| 0.0 | 1.4 | GO:0051131 | chaperone-mediated protein complex assembly(GO:0051131) |
| 0.0 | 0.3 | GO:0070777 | D-aspartate transport(GO:0070777) D-aspartate import(GO:0070779) |
| 0.0 | 0.3 | GO:0035694 | mitochondrial protein catabolic process(GO:0035694) |
| 0.0 | 0.1 | GO:0051387 | negative regulation of neurotrophin TRK receptor signaling pathway(GO:0051387) |
| 0.0 | 0.2 | GO:0045198 | establishment of epithelial cell apical/basal polarity(GO:0045198) |
| 0.0 | 1.0 | GO:0030252 | growth hormone secretion(GO:0030252) |
| 0.0 | 0.1 | GO:0051953 | negative regulation of amine transport(GO:0051953) |
| 0.0 | 0.2 | GO:2000301 | negative regulation of synaptic vesicle exocytosis(GO:2000301) |
| 0.0 | 0.6 | GO:0000715 | nucleotide-excision repair, DNA damage recognition(GO:0000715) |
| 0.0 | 0.2 | GO:1900364 | negative regulation of mRNA polyadenylation(GO:1900364) |
| 0.0 | 0.2 | GO:0016081 | synaptic vesicle docking(GO:0016081) |
| 0.0 | 3.5 | GO:0035308 | negative regulation of protein dephosphorylation(GO:0035308) |
| 0.0 | 0.2 | GO:0071898 | regulation of estrogen receptor binding(GO:0071898) negative regulation of estrogen receptor binding(GO:0071899) |
| 0.0 | 0.3 | GO:0016926 | protein desumoylation(GO:0016926) |
| 0.0 | 0.3 | GO:0060012 | synaptic transmission, glycinergic(GO:0060012) |
| 0.0 | 1.2 | GO:0045742 | positive regulation of epidermal growth factor receptor signaling pathway(GO:0045742) |
| 0.0 | 0.3 | GO:0009414 | response to water deprivation(GO:0009414) |
| 0.0 | 0.1 | GO:0046947 | hydroxylysine metabolic process(GO:0046946) hydroxylysine biosynthetic process(GO:0046947) |
| 0.0 | 0.1 | GO:0052651 | monoacylglycerol metabolic process(GO:0046462) monoacylglycerol catabolic process(GO:0052651) |
| 0.0 | 0.6 | GO:1904355 | positive regulation of telomere capping(GO:1904355) |
| 0.0 | 0.7 | GO:0035024 | negative regulation of Rho protein signal transduction(GO:0035024) |
| 0.0 | 0.2 | GO:0019509 | L-methionine biosynthetic process from methylthioadenosine(GO:0019509) |
| 0.0 | 0.4 | GO:0061087 | positive regulation of histone H3-K27 methylation(GO:0061087) |
| 0.0 | 0.3 | GO:0021546 | rhombomere development(GO:0021546) |
| 0.0 | 0.2 | GO:0036438 | maintenance of lens transparency(GO:0036438) |
| 0.0 | 0.5 | GO:0043248 | proteasome assembly(GO:0043248) |
| 0.0 | 0.4 | GO:0036010 | protein localization to endosome(GO:0036010) |
| 0.0 | 0.4 | GO:0042340 | keratan sulfate catabolic process(GO:0042340) |
| 0.0 | 0.1 | GO:0003285 | septum secundum development(GO:0003285) |
| 0.0 | 0.3 | GO:0009957 | epidermal cell fate specification(GO:0009957) |
| 0.0 | 0.1 | GO:0044313 | protein K6-linked deubiquitination(GO:0044313) |
| 0.0 | 0.1 | GO:0006050 | mannosamine metabolic process(GO:0006050) N-acetylmannosamine metabolic process(GO:0006051) |
| 0.0 | 0.1 | GO:0002254 | kinin cascade(GO:0002254) plasma kallikrein-kinin cascade(GO:0002353) |
| 0.0 | 0.2 | GO:0010760 | negative regulation of macrophage chemotaxis(GO:0010760) |
| 0.0 | 0.2 | GO:0051293 | establishment of spindle localization(GO:0051293) |
| 0.0 | 0.4 | GO:0006449 | regulation of translational termination(GO:0006449) |
| 0.0 | 0.6 | GO:0030207 | chondroitin sulfate catabolic process(GO:0030207) |
| 0.0 | 0.2 | GO:0035965 | cardiolipin acyl-chain remodeling(GO:0035965) |
| 0.0 | 0.6 | GO:2000272 | negative regulation of receptor activity(GO:2000272) |
| 0.0 | 0.1 | GO:0060017 | parathyroid gland development(GO:0060017) |
| 0.0 | 0.5 | GO:0042167 | porphyrin-containing compound catabolic process(GO:0006787) tetrapyrrole catabolic process(GO:0033015) heme catabolic process(GO:0042167) pigment catabolic process(GO:0046149) |
| 0.0 | 0.3 | GO:0086024 | adrenergic receptor signaling pathway involved in positive regulation of heart rate(GO:0086024) |
| 0.0 | 0.1 | GO:1902613 | regulation of anti-Mullerian hormone signaling pathway(GO:1902612) negative regulation of anti-Mullerian hormone signaling pathway(GO:1902613) anti-Mullerian hormone signaling pathway(GO:1990262) |
| 0.0 | 1.8 | GO:0050885 | neuromuscular process controlling balance(GO:0050885) |
| 0.0 | 0.0 | GO:0006286 | base-excision repair, base-free sugar-phosphate removal(GO:0006286) DNA dephosphorylation(GO:0098502) |
| 0.0 | 0.2 | GO:0043587 | tongue morphogenesis(GO:0043587) |
| 0.0 | 0.1 | GO:0021979 | hypothalamus cell differentiation(GO:0021979) |
| 0.0 | 1.3 | GO:0051865 | protein autoubiquitination(GO:0051865) |
| 0.0 | 0.6 | GO:0033617 | mitochondrial respiratory chain complex IV assembly(GO:0033617) mitochondrial respiratory chain complex IV biogenesis(GO:0097034) |
| 0.0 | 0.5 | GO:0036315 | cellular response to sterol(GO:0036315) |
| 0.0 | 0.3 | GO:0045725 | positive regulation of glycogen biosynthetic process(GO:0045725) |
| 0.0 | 0.8 | GO:0032467 | positive regulation of cytokinesis(GO:0032467) |
| 0.0 | 0.1 | GO:0008628 | hormone-mediated apoptotic signaling pathway(GO:0008628) |
| 0.0 | 0.1 | GO:0002731 | negative regulation of dendritic cell cytokine production(GO:0002731) regulation of intracellular transport of viral material(GO:1901252) negative regulation of intracellular transport of viral material(GO:1901253) |
| 0.0 | 0.2 | GO:0051452 | intracellular pH reduction(GO:0051452) |
| 0.0 | 0.9 | GO:0045724 | positive regulation of cilium assembly(GO:0045724) |
| 0.0 | 0.4 | GO:0060965 | negative regulation of gene silencing by miRNA(GO:0060965) |
| 0.0 | 0.6 | GO:0031643 | positive regulation of myelination(GO:0031643) |
| 0.0 | 0.3 | GO:0061099 | negative regulation of protein tyrosine kinase activity(GO:0061099) |
| 0.0 | 1.2 | GO:0035666 | TRIF-dependent toll-like receptor signaling pathway(GO:0035666) |
| 0.0 | 0.2 | GO:1902018 | negative regulation of cilium assembly(GO:1902018) |
| 0.0 | 0.3 | GO:0001778 | plasma membrane repair(GO:0001778) |
| 0.0 | 0.3 | GO:2000574 | regulation of microtubule motor activity(GO:2000574) |
| 0.0 | 0.8 | GO:0097178 | ruffle assembly(GO:0097178) |
| 0.0 | 0.9 | GO:0000303 | response to superoxide(GO:0000303) |
| 0.0 | 0.2 | GO:0060620 | regulation of cholesterol import(GO:0060620) regulation of sterol import(GO:2000909) |
| 0.0 | 0.6 | GO:0007213 | G-protein coupled acetylcholine receptor signaling pathway(GO:0007213) |
| 0.0 | 0.1 | GO:1901727 | positive regulation of histone deacetylase activity(GO:1901727) |
| 0.0 | 0.5 | GO:0061154 | endothelial tube morphogenesis(GO:0061154) |
| 0.0 | 0.2 | GO:0060088 | auditory receptor cell stereocilium organization(GO:0060088) |
| 0.0 | 0.1 | GO:0061370 | testosterone biosynthetic process(GO:0061370) |
| 0.0 | 0.3 | GO:0071361 | cellular response to ethanol(GO:0071361) |
| 0.0 | 0.1 | GO:1902445 | regulation of mitochondrial membrane permeability involved in programmed necrotic cell death(GO:1902445) |
| 0.0 | 0.4 | GO:0006044 | N-acetylglucosamine metabolic process(GO:0006044) |
| 0.0 | 0.7 | GO:0043968 | histone H2A acetylation(GO:0043968) |
| 0.0 | 0.1 | GO:0045900 | negative regulation of translational elongation(GO:0045900) |
| 0.0 | 0.6 | GO:0051290 | protein heterotetramerization(GO:0051290) |
| 0.0 | 0.2 | GO:2000197 | regulation of ribonucleoprotein complex localization(GO:2000197) |
| 0.0 | 0.3 | GO:0001961 | positive regulation of cytokine-mediated signaling pathway(GO:0001961) positive regulation of response to cytokine stimulus(GO:0060760) |
| 0.0 | 0.3 | GO:0035518 | histone H2A monoubiquitination(GO:0035518) |
| 0.0 | 0.3 | GO:0030050 | vesicle transport along actin filament(GO:0030050) actin filament-based transport(GO:0099515) |
| 0.0 | 0.3 | GO:0071108 | protein K48-linked deubiquitination(GO:0071108) |
| 0.0 | 0.5 | GO:0006635 | fatty acid beta-oxidation(GO:0006635) |
| 0.0 | 0.2 | GO:0019441 | tryptophan catabolic process to kynurenine(GO:0019441) kynurenine metabolic process(GO:0070189) |
| 0.0 | 0.1 | GO:0003322 | pancreatic A cell development(GO:0003322) |
| 0.0 | 0.5 | GO:0007250 | activation of NF-kappaB-inducing kinase activity(GO:0007250) |
| 0.0 | 0.1 | GO:0006642 | triglyceride mobilization(GO:0006642) |
| 0.0 | 0.3 | GO:0032802 | low-density lipoprotein particle receptor catabolic process(GO:0032802) |
| 0.0 | 0.1 | GO:0071422 | thiosulfate transport(GO:0015709) oxaloacetate transport(GO:0015729) malate transport(GO:0015743) succinate transport(GO:0015744) succinate transmembrane transport(GO:0071422) malate transmembrane transport(GO:0071423) oxaloacetate(2-) transmembrane transport(GO:1902356) |
| 0.0 | 0.1 | GO:0015015 | heparan sulfate proteoglycan biosynthetic process, enzymatic modification(GO:0015015) |
| 0.0 | 0.7 | GO:2000273 | positive regulation of receptor activity(GO:2000273) |
| 0.0 | 2.2 | GO:0051436 | negative regulation of ubiquitin-protein ligase activity involved in mitotic cell cycle(GO:0051436) |
| 0.0 | 0.1 | GO:1902527 | positive regulation of protein monoubiquitination(GO:1902527) |
| 0.0 | 2.0 | GO:0006890 | retrograde vesicle-mediated transport, Golgi to ER(GO:0006890) |
| 0.0 | 0.1 | GO:0016260 | selenocysteine biosynthetic process(GO:0016260) |
| 0.0 | 0.4 | GO:0043153 | entrainment of circadian clock by photoperiod(GO:0043153) |
| 0.0 | 0.1 | GO:0070460 | thyroid-stimulating hormone secretion(GO:0070460) regulation of thyroid-stimulating hormone secretion(GO:2000612) |
| 0.0 | 0.5 | GO:0070935 | 3'-UTR-mediated mRNA stabilization(GO:0070935) |
| 0.0 | 0.1 | GO:0090650 | response to oxygen-glucose deprivation(GO:0090649) cellular response to oxygen-glucose deprivation(GO:0090650) |
| 0.0 | 0.1 | GO:0002023 | reduction of food intake in response to dietary excess(GO:0002023) |
| 0.0 | 0.2 | GO:1904668 | positive regulation of ubiquitin protein ligase activity(GO:1904668) |
| 0.0 | 0.1 | GO:0035751 | regulation of lysosomal lumen pH(GO:0035751) |
| 0.0 | 0.5 | GO:0046856 | phosphatidylinositol dephosphorylation(GO:0046856) |
| 0.0 | 1.2 | GO:0006301 | postreplication repair(GO:0006301) |
| 0.0 | 0.1 | GO:0072369 | regulation of lipid transport by positive regulation of transcription from RNA polymerase II promoter(GO:0072369) |
| 0.0 | 0.3 | GO:0042407 | cristae formation(GO:0042407) |
| 0.0 | 0.4 | GO:0035774 | positive regulation of insulin secretion involved in cellular response to glucose stimulus(GO:0035774) |
| 0.0 | 0.1 | GO:0010835 | regulation of protein ADP-ribosylation(GO:0010835) |
| 0.0 | 0.1 | GO:0072386 | plus-end-directed vesicle transport along microtubule(GO:0072383) plus-end-directed organelle transport along microtubule(GO:0072386) |
| 0.0 | 0.2 | GO:0044275 | cellular carbohydrate catabolic process(GO:0044275) |
| 0.0 | 0.2 | GO:0042073 | intraciliary transport(GO:0042073) |
| 0.0 | 0.1 | GO:1902766 | skeletal muscle satellite cell migration(GO:1902766) |
| 0.0 | 0.1 | GO:0034505 | tooth mineralization(GO:0034505) |
| 0.0 | 1.4 | GO:0043966 | histone H3 acetylation(GO:0043966) |
| 0.0 | 0.1 | GO:0098907 | protein localization to T-tubule(GO:0036371) regulation of SA node cell action potential(GO:0098907) |
| 0.0 | 1.5 | GO:0006342 | chromatin silencing(GO:0006342) |
| 0.0 | 0.1 | GO:0006408 | snRNA export from nucleus(GO:0006408) |
| 0.0 | 0.7 | GO:0034599 | cellular response to oxidative stress(GO:0034599) |
| 0.0 | 0.4 | GO:0003351 | epithelial cilium movement(GO:0003351) |
| 0.0 | 0.2 | GO:0006228 | UTP biosynthetic process(GO:0006228) |
| 0.0 | 0.1 | GO:0035799 | ureter maturation(GO:0035799) |
| 0.0 | 0.6 | GO:0032008 | positive regulation of TOR signaling(GO:0032008) |
| 0.0 | 1.0 | GO:0007520 | myoblast fusion(GO:0007520) |
| 0.0 | 0.2 | GO:0000395 | mRNA 5'-splice site recognition(GO:0000395) |
| 0.0 | 0.1 | GO:0071810 | regulation of fever generation by regulation of prostaglandin secretion(GO:0071810) positive regulation of fever generation by positive regulation of prostaglandin secretion(GO:0071812) positive regulation of ERK1 and ERK2 cascade via TNFSF11-mediated signaling(GO:0071848) regulation of fever generation by prostaglandin secretion(GO:0100009) |
| 0.0 | 0.1 | GO:0000188 | inactivation of MAPK activity(GO:0000188) |
| 0.0 | 0.7 | GO:0006904 | vesicle docking involved in exocytosis(GO:0006904) |
| 0.0 | 0.2 | GO:0034498 | early endosome to Golgi transport(GO:0034498) |
| 0.0 | 0.4 | GO:0016048 | detection of temperature stimulus(GO:0016048) |
| 0.0 | 0.4 | GO:0042474 | middle ear morphogenesis(GO:0042474) |
| 0.0 | 0.1 | GO:0002949 | tRNA threonylcarbamoyladenosine modification(GO:0002949) |
| 0.0 | 0.1 | GO:0072675 | multinuclear osteoclast differentiation(GO:0072674) osteoclast fusion(GO:0072675) |
| 0.0 | 0.9 | GO:0000413 | protein peptidyl-prolyl isomerization(GO:0000413) |
| 0.0 | 0.1 | GO:0035973 | pexophagy(GO:0030242) aggrephagy(GO:0035973) |
| 0.0 | 0.8 | GO:1901385 | regulation of voltage-gated calcium channel activity(GO:1901385) |
| 0.0 | 0.1 | GO:0030951 | establishment or maintenance of microtubule cytoskeleton polarity(GO:0030951) |
| 0.0 | 0.0 | GO:0061055 | myotome development(GO:0061055) |
| 0.0 | 0.1 | GO:0045903 | positive regulation of translational fidelity(GO:0045903) |
| 0.0 | 0.7 | GO:0048488 | synaptic vesicle endocytosis(GO:0048488) |
| 0.0 | 0.7 | GO:1904837 | beta-catenin-TCF complex assembly(GO:1904837) |
| 0.0 | 0.2 | GO:0075522 | IRES-dependent viral translational initiation(GO:0075522) |
| 0.0 | 0.1 | GO:0010763 | positive regulation of fibroblast migration(GO:0010763) |
| 0.0 | 0.2 | GO:0061635 | regulation of protein complex stability(GO:0061635) |
| 0.0 | 0.4 | GO:0051412 | response to corticosterone(GO:0051412) |
| 0.0 | 0.1 | GO:0010866 | regulation of triglyceride biosynthetic process(GO:0010866) |
| 0.0 | 0.2 | GO:0034113 | heterotypic cell-cell adhesion(GO:0034113) |
| 0.0 | 0.1 | GO:0006556 | S-adenosylmethionine biosynthetic process(GO:0006556) |
| 0.0 | 0.3 | GO:0010524 | positive regulation of calcium ion transport into cytosol(GO:0010524) |
| 0.0 | 0.3 | GO:1901661 | quinone metabolic process(GO:1901661) |
| 0.0 | 0.3 | GO:0006622 | protein targeting to lysosome(GO:0006622) |
| 0.0 | 0.1 | GO:2000359 | regulation of binding of sperm to zona pellucida(GO:2000359) negative regulation of binding of sperm to zona pellucida(GO:2000360) |
| 0.0 | 0.1 | GO:0032962 | positive regulation of inositol trisphosphate biosynthetic process(GO:0032962) |
| 0.0 | 0.3 | GO:0070536 | protein K63-linked deubiquitination(GO:0070536) |
| 0.0 | 0.1 | GO:0000066 | mitochondrial ornithine transport(GO:0000066) |
| 0.0 | 0.2 | GO:0015801 | aromatic amino acid transport(GO:0015801) |
| 0.0 | 0.3 | GO:0045199 | maintenance of apical/basal cell polarity(GO:0035090) maintenance of epithelial cell apical/basal polarity(GO:0045199) |
| 0.0 | 0.1 | GO:0045717 | negative regulation of fatty acid biosynthetic process(GO:0045717) |
| 0.0 | 0.9 | GO:0055092 | cholesterol homeostasis(GO:0042632) sterol homeostasis(GO:0055092) |
| 0.0 | 0.1 | GO:1901029 | negative regulation of mitochondrial outer membrane permeabilization involved in apoptotic signaling pathway(GO:1901029) |
| 0.0 | 0.8 | GO:0030835 | negative regulation of actin filament depolymerization(GO:0030835) |
| 0.0 | 0.0 | GO:0021696 | cerebellar cortex morphogenesis(GO:0021696) |
| 0.0 | 0.5 | GO:0060338 | regulation of type I interferon-mediated signaling pathway(GO:0060338) |
| 0.0 | 0.2 | GO:0015937 | coenzyme A biosynthetic process(GO:0015937) |
| 0.0 | 0.1 | GO:0072047 | proximal/distal pattern formation involved in nephron development(GO:0072047) specification of nephron tubule identity(GO:0072081) specification of loop of Henle identity(GO:0072086) |
| 0.0 | 0.4 | GO:0051123 | RNA polymerase II transcriptional preinitiation complex assembly(GO:0051123) |
| 0.0 | 0.0 | GO:1900017 | positive regulation of cytokine production involved in inflammatory response(GO:1900017) |
| 0.0 | 0.1 | GO:0036115 | fatty-acyl-CoA catabolic process(GO:0036115) |
| 0.0 | 0.0 | GO:0006287 | base-excision repair, gap-filling(GO:0006287) |
| 0.0 | 0.1 | GO:0021548 | pons development(GO:0021548) |
| 0.0 | 0.1 | GO:0043931 | ossification involved in bone maturation(GO:0043931) |
| 0.0 | 0.3 | GO:0006607 | NLS-bearing protein import into nucleus(GO:0006607) |
| 0.0 | 0.4 | GO:0090003 | regulation of establishment of protein localization to plasma membrane(GO:0090003) |
| 0.0 | 2.0 | GO:0006805 | xenobiotic metabolic process(GO:0006805) |
| 0.0 | 0.3 | GO:0046597 | negative regulation of viral entry into host cell(GO:0046597) |
| 0.0 | 0.1 | GO:0042048 | olfactory behavior(GO:0042048) |
| 0.0 | 0.2 | GO:0072321 | chaperone-mediated protein transport(GO:0072321) |
| 0.0 | 0.0 | GO:0010624 | regulation of Schwann cell proliferation(GO:0010624) negative regulation of Schwann cell proliferation(GO:0010626) |
| 0.0 | 0.1 | GO:0033145 | positive regulation of intracellular steroid hormone receptor signaling pathway(GO:0033145) positive regulation of intracellular estrogen receptor signaling pathway(GO:0033148) |
| 0.0 | 0.1 | GO:0017196 | N-terminal peptidyl-methionine acetylation(GO:0017196) |
| 0.0 | 0.0 | GO:0006404 | RNA import into nucleus(GO:0006404) snRNA transport(GO:0051030) |
| 0.0 | 0.7 | GO:0006695 | cholesterol biosynthetic process(GO:0006695) |
| 0.0 | 0.5 | GO:0033120 | positive regulation of RNA splicing(GO:0033120) |
| 0.0 | 0.4 | GO:0009435 | NAD biosynthetic process(GO:0009435) |
| 0.0 | 0.1 | GO:0006572 | tyrosine catabolic process(GO:0006572) |
| 0.0 | 0.0 | GO:0030578 | PML body organization(GO:0030578) |
| 0.0 | 0.1 | GO:0060907 | positive regulation of macrophage cytokine production(GO:0060907) |
| 0.0 | 0.2 | GO:0000387 | spliceosomal snRNP assembly(GO:0000387) |
| 0.0 | 0.6 | GO:0035329 | hippo signaling(GO:0035329) |
| 0.0 | 0.1 | GO:0045668 | negative regulation of osteoblast differentiation(GO:0045668) |
| 0.0 | 0.1 | GO:0009298 | GDP-mannose biosynthetic process(GO:0009298) |
| 0.0 | 0.4 | GO:0000470 | maturation of LSU-rRNA(GO:0000470) |
| 0.0 | 2.3 | GO:0000184 | nuclear-transcribed mRNA catabolic process, nonsense-mediated decay(GO:0000184) |
| 0.0 | 0.8 | GO:0032481 | positive regulation of type I interferon production(GO:0032481) |
| 0.0 | 0.1 | GO:1903027 | regulation of opsonization(GO:1903027) |
| 0.0 | 0.1 | GO:0009249 | protein lipoylation(GO:0009249) |
| 0.0 | 0.2 | GO:0032418 | lysosome localization(GO:0032418) |
| 0.0 | 0.1 | GO:0008340 | determination of adult lifespan(GO:0008340) |
| 0.0 | 0.0 | GO:0010957 | negative regulation of vitamin D biosynthetic process(GO:0010957) negative regulation of vitamin metabolic process(GO:0046137) |
| 0.0 | 0.3 | GO:0061418 | regulation of transcription from RNA polymerase II promoter in response to hypoxia(GO:0061418) |
| 0.0 | 0.3 | GO:2001044 | regulation of integrin-mediated signaling pathway(GO:2001044) |
| 0.0 | 0.0 | GO:0032958 | inositol phosphate biosynthetic process(GO:0032958) |
| 0.0 | 0.7 | GO:0042147 | retrograde transport, endosome to Golgi(GO:0042147) |
| 0.0 | 0.2 | GO:0045116 | protein neddylation(GO:0045116) |
| 0.0 | 0.0 | GO:0071847 | TNFSF11-mediated signaling pathway(GO:0071847) |
| 0.0 | 0.0 | GO:0072182 | regulation of nephron tubule epithelial cell differentiation(GO:0072182) positive regulation of nephron tubule epithelial cell differentiation(GO:2000768) |
| 0.0 | 0.3 | GO:0006370 | 7-methylguanosine mRNA capping(GO:0006370) |
| 0.0 | 0.0 | GO:0006272 | leading strand elongation(GO:0006272) |
| 0.0 | 0.0 | GO:0072163 | ureteric bud development(GO:0001657) mesonephros development(GO:0001823) mesonephric epithelium development(GO:0072163) mesonephric tubule development(GO:0072164) |
| 0.0 | 0.1 | GO:0031274 | positive regulation of pseudopodium assembly(GO:0031274) |
| 0.0 | 0.1 | GO:0001658 | branching involved in ureteric bud morphogenesis(GO:0001658) |
| 0.0 | 0.1 | GO:0014827 | intestine smooth muscle contraction(GO:0014827) |
| 0.0 | 0.1 | GO:0000414 | regulation of histone H3-K36 methylation(GO:0000414) |
| 0.0 | 0.3 | GO:0006308 | DNA catabolic process(GO:0006308) |
Gene overrepresentation in cellular_component category:
| Log-likelihood per target | Total log-likelihood | Term | Description |
|---|---|---|---|
| 0.5 | 2.3 | GO:0097149 | centralspindlin complex(GO:0097149) |
| 0.4 | 2.1 | GO:0060200 | clathrin-sculpted acetylcholine transport vesicle(GO:0060200) clathrin-sculpted acetylcholine transport vesicle membrane(GO:0060201) |
| 0.4 | 1.6 | GO:0043625 | delta DNA polymerase complex(GO:0043625) |
| 0.4 | 1.2 | GO:0042720 | mitochondrial inner membrane peptidase complex(GO:0042720) |
| 0.4 | 3.0 | GO:0032389 | MutLalpha complex(GO:0032389) |
| 0.4 | 1.1 | GO:0009330 | DNA topoisomerase complex (ATP-hydrolyzing)(GO:0009330) |
| 0.3 | 4.8 | GO:0005583 | fibrillar collagen trimer(GO:0005583) banded collagen fibril(GO:0098643) |
| 0.3 | 1.2 | GO:0008043 | intracellular ferritin complex(GO:0008043) ferritin complex(GO:0070288) |
| 0.3 | 1.2 | GO:0097135 | cyclin E2-CDK2 complex(GO:0097135) |
| 0.3 | 0.9 | GO:0031021 | interphase microtubule organizing center(GO:0031021) |
| 0.3 | 1.8 | GO:0097129 | cyclin D2-CDK4 complex(GO:0097129) |
| 0.3 | 0.9 | GO:0035189 | Rb-E2F complex(GO:0035189) |
| 0.3 | 2.0 | GO:0005947 | mitochondrial alpha-ketoglutarate dehydrogenase complex(GO:0005947) |
| 0.3 | 6.5 | GO:0097386 | glial cell projection(GO:0097386) |
| 0.3 | 0.8 | GO:1990298 | mitotic checkpoint complex(GO:0033597) bub1-bub3 complex(GO:1990298) |
| 0.3 | 1.9 | GO:0002177 | manchette(GO:0002177) |
| 0.3 | 0.8 | GO:0060053 | neurofilament cytoskeleton(GO:0060053) |
| 0.2 | 2.4 | GO:0030991 | intraciliary transport particle A(GO:0030991) |
| 0.2 | 0.7 | GO:0043224 | nuclear SCF ubiquitin ligase complex(GO:0043224) |
| 0.2 | 0.5 | GO:0042585 | germinal vesicle(GO:0042585) |
| 0.2 | 0.9 | GO:0031251 | PAN complex(GO:0031251) |
| 0.2 | 0.9 | GO:0070044 | synaptobrevin 2-SNAP-25-syntaxin-1a complex(GO:0070044) |
| 0.2 | 3.5 | GO:0012510 | trans-Golgi network transport vesicle membrane(GO:0012510) |
| 0.2 | 9.9 | GO:0044298 | neuronal cell body membrane(GO:0032809) cell body membrane(GO:0044298) |
| 0.2 | 5.3 | GO:0005942 | phosphatidylinositol 3-kinase complex(GO:0005942) |
| 0.2 | 0.6 | GO:0071598 | neuronal ribonucleoprotein granule(GO:0071598) |
| 0.2 | 1.0 | GO:0010370 | perinucleolar chromocenter(GO:0010370) |
| 0.2 | 0.8 | GO:0005967 | mitochondrial pyruvate dehydrogenase complex(GO:0005967) |
| 0.2 | 1.2 | GO:0071547 | piP-body(GO:0071547) |
| 0.2 | 0.8 | GO:0032144 | 4-aminobutyrate transaminase complex(GO:0032144) |
| 0.2 | 2.4 | GO:0005869 | dynactin complex(GO:0005869) |
| 0.2 | 2.9 | GO:0031209 | SCAR complex(GO:0031209) |
| 0.2 | 0.7 | GO:0031302 | intrinsic component of endosome membrane(GO:0031302) |
| 0.2 | 3.9 | GO:0005952 | cAMP-dependent protein kinase complex(GO:0005952) |
| 0.2 | 0.5 | GO:0031933 | telomeric heterochromatin(GO:0031933) |
| 0.2 | 1.9 | GO:0016602 | CCAAT-binding factor complex(GO:0016602) |
| 0.2 | 1.2 | GO:0042406 | extrinsic component of endoplasmic reticulum membrane(GO:0042406) |
| 0.2 | 0.7 | GO:0032301 | MutSalpha complex(GO:0032301) |
| 0.2 | 0.8 | GO:0005726 | perichromatin fibrils(GO:0005726) |
| 0.2 | 0.2 | GO:0097124 | cyclin A2-CDK2 complex(GO:0097124) |
| 0.2 | 0.6 | GO:0097362 | MCM8-MCM9 complex(GO:0097362) |
| 0.2 | 0.3 | GO:1990726 | Lsm1-7-Pat1 complex(GO:1990726) |
| 0.2 | 3.5 | GO:0097225 | sperm midpiece(GO:0097225) |
| 0.2 | 1.7 | GO:0005688 | U6 snRNP(GO:0005688) |
| 0.2 | 6.0 | GO:0005680 | anaphase-promoting complex(GO:0005680) |
| 0.1 | 0.6 | GO:0034751 | aryl hydrocarbon receptor complex(GO:0034751) |
| 0.1 | 0.4 | GO:0032777 | Piccolo NuA4 histone acetyltransferase complex(GO:0032777) |
| 0.1 | 1.4 | GO:0072669 | tRNA-splicing ligase complex(GO:0072669) |
| 0.1 | 0.1 | GO:0005656 | nuclear pre-replicative complex(GO:0005656) pre-replicative complex(GO:0036387) |
| 0.1 | 0.4 | GO:0005900 | oncostatin-M receptor complex(GO:0005900) |
| 0.1 | 0.4 | GO:0032299 | ribonuclease H2 complex(GO:0032299) |
| 0.1 | 2.8 | GO:0045263 | proton-transporting ATP synthase complex, coupling factor F(o)(GO:0045263) |
| 0.1 | 0.9 | GO:1990635 | proximal dendrite(GO:1990635) |
| 0.1 | 1.4 | GO:0016593 | Cdc73/Paf1 complex(GO:0016593) |
| 0.1 | 13.7 | GO:0005758 | mitochondrial intermembrane space(GO:0005758) |
| 0.1 | 0.7 | GO:0032444 | activin responsive factor complex(GO:0032444) |
| 0.1 | 2.1 | GO:0031616 | spindle pole centrosome(GO:0031616) |
| 0.1 | 2.0 | GO:0008290 | F-actin capping protein complex(GO:0008290) |
| 0.1 | 0.9 | GO:0097025 | MPP7-DLG1-LIN7 complex(GO:0097025) |
| 0.1 | 1.1 | GO:0042382 | paraspeckles(GO:0042382) |
| 0.1 | 2.2 | GO:0000812 | Swr1 complex(GO:0000812) |
| 0.1 | 0.8 | GO:0000138 | Golgi trans cisterna(GO:0000138) |
| 0.1 | 0.4 | GO:1990075 | periciliary membrane compartment(GO:1990075) |
| 0.1 | 0.3 | GO:0032133 | chromosome passenger complex(GO:0032133) |
| 0.1 | 0.5 | GO:0070876 | SOSS complex(GO:0070876) |
| 0.1 | 0.4 | GO:0032937 | SREBP-SCAP-Insig complex(GO:0032937) |
| 0.1 | 0.4 | GO:0033186 | CAF-1 complex(GO:0033186) |
| 0.1 | 0.4 | GO:0097513 | myosin II filament(GO:0097513) |
| 0.1 | 0.6 | GO:0070435 | Shc-EGFR complex(GO:0070435) |
| 0.1 | 4.3 | GO:0080008 | Cul4-RING E3 ubiquitin ligase complex(GO:0080008) |
| 0.1 | 1.3 | GO:0070775 | H3 histone acetyltransferase complex(GO:0070775) MOZ/MORF histone acetyltransferase complex(GO:0070776) |
| 0.1 | 0.7 | GO:0000015 | phosphopyruvate hydratase complex(GO:0000015) |
| 0.1 | 1.5 | GO:0000788 | nuclear nucleosome(GO:0000788) |
| 0.1 | 7.2 | GO:0010494 | cytoplasmic stress granule(GO:0010494) |
| 0.1 | 1.0 | GO:0072357 | PTW/PP1 phosphatase complex(GO:0072357) |
| 0.1 | 1.1 | GO:0033588 | Elongator holoenzyme complex(GO:0033588) |
| 0.1 | 0.2 | GO:0002139 | stereocilia coupling link(GO:0002139) |
| 0.1 | 0.5 | GO:0035838 | growing cell tip(GO:0035838) |
| 0.1 | 1.5 | GO:0031618 | nuclear pericentric heterochromatin(GO:0031618) |
| 0.1 | 0.5 | GO:0005744 | mitochondrial inner membrane presequence translocase complex(GO:0005744) |
| 0.1 | 0.4 | GO:0032300 | mismatch repair complex(GO:0032300) |
| 0.1 | 1.3 | GO:0098647 | collagen type VI trimer(GO:0005589) collagen beaded filament(GO:0098647) |
| 0.1 | 0.5 | GO:0030992 | intraciliary transport particle B(GO:0030992) |
| 0.1 | 0.5 | GO:0031262 | Ndc80 complex(GO:0031262) |
| 0.1 | 0.5 | GO:1990131 | Gtr1-Gtr2 GTPase complex(GO:1990131) |
| 0.1 | 0.5 | GO:0031515 | tRNA (m1A) methyltransferase complex(GO:0031515) |
| 0.1 | 0.3 | GO:0043291 | RAVE complex(GO:0043291) |
| 0.1 | 1.3 | GO:0033177 | proton-transporting two-sector ATPase complex, proton-transporting domain(GO:0033177) proton-transporting V-type ATPase, V0 domain(GO:0033179) |
| 0.1 | 3.6 | GO:0005605 | basal lamina(GO:0005605) |
| 0.1 | 0.3 | GO:0016935 | glycine-gated chloride channel complex(GO:0016935) |
| 0.1 | 0.4 | GO:0002169 | 3-methylcrotonyl-CoA carboxylase complex, mitochondrial(GO:0002169) methylcrotonoyl-CoA carboxylase complex(GO:1905202) |
| 0.1 | 1.9 | GO:0030127 | COPII vesicle coat(GO:0030127) |
| 0.1 | 0.4 | GO:0005971 | ribonucleoside-diphosphate reductase complex(GO:0005971) |
| 0.1 | 2.4 | GO:0032391 | photoreceptor connecting cilium(GO:0032391) |
| 0.1 | 0.5 | GO:0005840 | ribosome(GO:0005840) |
| 0.1 | 0.7 | GO:0035686 | sperm fibrous sheath(GO:0035686) |
| 0.1 | 0.3 | GO:1990730 | VCP-NSFL1C complex(GO:1990730) |
| 0.1 | 0.5 | GO:0071817 | MMXD complex(GO:0071817) |
| 0.1 | 3.4 | GO:0005669 | transcription factor TFIID complex(GO:0005669) |
| 0.1 | 0.6 | GO:0016272 | prefoldin complex(GO:0016272) |
| 0.1 | 1.9 | GO:0000786 | nucleosome(GO:0000786) |
| 0.1 | 1.0 | GO:0097136 | Bcl-2 family protein complex(GO:0097136) |
| 0.1 | 0.4 | GO:0001652 | granular component(GO:0001652) |
| 0.1 | 1.8 | GO:0005732 | small nucleolar ribonucleoprotein complex(GO:0005732) |
| 0.1 | 0.6 | GO:0071986 | Ragulator complex(GO:0071986) |
| 0.1 | 1.1 | GO:0005662 | DNA replication factor A complex(GO:0005662) |
| 0.1 | 0.9 | GO:0030126 | COPI vesicle coat(GO:0030126) |
| 0.1 | 2.1 | GO:0031305 | intrinsic component of mitochondrial inner membrane(GO:0031304) integral component of mitochondrial inner membrane(GO:0031305) |
| 0.1 | 0.9 | GO:0097546 | ciliary base(GO:0097546) |
| 0.1 | 3.1 | GO:0097542 | ciliary tip(GO:0097542) |
| 0.1 | 0.7 | GO:0044233 | ER-mitochondrion membrane contact site(GO:0044233) |
| 0.1 | 2.4 | GO:0000159 | protein phosphatase type 2A complex(GO:0000159) |
| 0.1 | 0.8 | GO:0070938 | contractile ring(GO:0070938) |
| 0.1 | 1.5 | GO:0034045 | pre-autophagosomal structure membrane(GO:0034045) |
| 0.1 | 1.0 | GO:0000124 | SAGA complex(GO:0000124) |
| 0.1 | 0.4 | GO:0097452 | GAIT complex(GO:0097452) |
| 0.1 | 0.4 | GO:0000275 | mitochondrial proton-transporting ATP synthase complex, catalytic core F(1)(GO:0000275) |
| 0.1 | 0.3 | GO:1902937 | inward rectifier potassium channel complex(GO:1902937) |
| 0.1 | 1.5 | GO:0035327 | transcriptionally active chromatin(GO:0035327) |
| 0.1 | 1.0 | GO:0005814 | centriole(GO:0005814) |
| 0.1 | 1.2 | GO:0005832 | chaperonin-containing T-complex(GO:0005832) |
| 0.1 | 1.5 | GO:0071565 | nBAF complex(GO:0071565) |
| 0.1 | 0.6 | GO:0034464 | BBSome(GO:0034464) |
| 0.1 | 0.6 | GO:0071953 | elastic fiber(GO:0071953) |
| 0.1 | 1.7 | GO:0031233 | intrinsic component of external side of plasma membrane(GO:0031233) |
| 0.1 | 0.3 | GO:0070381 | endosome to plasma membrane transport vesicle(GO:0070381) |
| 0.1 | 0.1 | GO:0098837 | postsynaptic recycling endosome(GO:0098837) |
| 0.1 | 0.4 | GO:0033165 | interphotoreceptor matrix(GO:0033165) |
| 0.1 | 0.2 | GO:0070557 | PCNA-p21 complex(GO:0070557) |
| 0.1 | 3.3 | GO:0005747 | mitochondrial respiratory chain complex I(GO:0005747) NADH dehydrogenase complex(GO:0030964) respiratory chain complex I(GO:0045271) |
| 0.0 | 0.8 | GO:0000346 | transcription export complex(GO:0000346) |
| 0.0 | 1.4 | GO:0046658 | anchored component of plasma membrane(GO:0046658) |
| 0.0 | 0.4 | GO:0032593 | insulin-responsive compartment(GO:0032593) |
| 0.0 | 1.8 | GO:0035861 | site of double-strand break(GO:0035861) |
| 0.0 | 1.1 | GO:0001527 | microfibril(GO:0001527) fibril(GO:0043205) |
| 0.0 | 3.1 | GO:0031201 | SNARE complex(GO:0031201) |
| 0.0 | 0.2 | GO:0044305 | calyx of Held(GO:0044305) |
| 0.0 | 0.7 | GO:0030008 | TRAPP complex(GO:0030008) |
| 0.0 | 4.7 | GO:0005776 | autophagosome(GO:0005776) |
| 0.0 | 0.3 | GO:0033503 | HULC complex(GO:0033503) |
| 0.0 | 4.2 | GO:0005811 | lipid particle(GO:0005811) |
| 0.0 | 1.5 | GO:0008180 | COP9 signalosome(GO:0008180) |
| 0.0 | 0.7 | GO:0043220 | Schmidt-Lanterman incisure(GO:0043220) |
| 0.0 | 0.2 | GO:0032798 | Swi5-Sfr1 complex(GO:0032798) |
| 0.0 | 0.7 | GO:0030285 | integral component of synaptic vesicle membrane(GO:0030285) intrinsic component of synaptic vesicle membrane(GO:0098563) |
| 0.0 | 1.1 | GO:0005666 | DNA-directed RNA polymerase III complex(GO:0005666) |
| 0.0 | 1.7 | GO:0101002 | ficolin-1-rich granule(GO:0101002) ficolin-1-rich granule lumen(GO:1904813) |
| 0.0 | 0.1 | GO:0005677 | chromatin silencing complex(GO:0005677) |
| 0.0 | 1.1 | GO:0034451 | centriolar satellite(GO:0034451) |
| 0.0 | 0.2 | GO:0030140 | trans-Golgi network transport vesicle(GO:0030140) |
| 0.0 | 0.5 | GO:0035145 | exon-exon junction complex(GO:0035145) |
| 0.0 | 0.6 | GO:0000177 | cytoplasmic exosome (RNase complex)(GO:0000177) |
| 0.0 | 0.4 | GO:0031083 | BLOC-1 complex(GO:0031083) |
| 0.0 | 8.0 | GO:0043197 | dendritic spine(GO:0043197) |
| 0.0 | 0.0 | GO:1990769 | proximal neuron projection(GO:1990769) |
| 0.0 | 4.6 | GO:0090575 | RNA polymerase II transcription factor complex(GO:0090575) |
| 0.0 | 1.9 | GO:0009925 | basal plasma membrane(GO:0009925) |
| 0.0 | 0.0 | GO:0044609 | DBIRD complex(GO:0044609) |
| 0.0 | 0.5 | GO:0019773 | proteasome core complex, alpha-subunit complex(GO:0019773) |
| 0.0 | 0.3 | GO:0065010 | extracellular membrane-bounded organelle(GO:0065010) |
| 0.0 | 0.8 | GO:0000930 | gamma-tubulin complex(GO:0000930) |
| 0.0 | 0.1 | GO:0070552 | BRISC complex(GO:0070552) |
| 0.0 | 2.5 | GO:0032155 | cell division site(GO:0032153) cleavage furrow(GO:0032154) cell division site part(GO:0032155) cell surface furrow(GO:0097610) |
| 0.0 | 0.1 | GO:0031213 | RSF complex(GO:0031213) |
| 0.0 | 0.9 | GO:0071339 | MLL1/2 complex(GO:0044665) MLL1 complex(GO:0071339) |
| 0.0 | 0.1 | GO:0030934 | anchoring collagen complex(GO:0030934) |
| 0.0 | 0.1 | GO:0009331 | glycerol-3-phosphate dehydrogenase complex(GO:0009331) |
| 0.0 | 2.1 | GO:0005871 | kinesin complex(GO:0005871) |
| 0.0 | 0.2 | GO:0008537 | proteasome activator complex(GO:0008537) |
| 0.0 | 0.6 | GO:0005839 | proteasome core complex(GO:0005839) |
| 0.0 | 1.0 | GO:0070822 | Sin3-type complex(GO:0070822) |
| 0.0 | 0.7 | GO:0044447 | axoneme part(GO:0044447) |
| 0.0 | 0.4 | GO:0016471 | vacuolar proton-transporting V-type ATPase complex(GO:0016471) |
| 0.0 | 15.2 | GO:0005759 | mitochondrial matrix(GO:0005759) |
| 0.0 | 0.6 | GO:0005885 | Arp2/3 protein complex(GO:0005885) |
| 0.0 | 0.1 | GO:0034365 | discoidal high-density lipoprotein particle(GO:0034365) |
| 0.0 | 0.7 | GO:0005689 | U12-type spliceosomal complex(GO:0005689) |
| 0.0 | 0.1 | GO:0002193 | MAML1-RBP-Jkappa- ICN1 complex(GO:0002193) |
| 0.0 | 2.2 | GO:0005604 | basement membrane(GO:0005604) |
| 0.0 | 0.1 | GO:0005742 | mitochondrial outer membrane translocase complex(GO:0005742) |
| 0.0 | 0.9 | GO:0016592 | mediator complex(GO:0016592) |
| 0.0 | 0.2 | GO:0030905 | retromer, tubulation complex(GO:0030905) |
| 0.0 | 0.1 | GO:0000176 | nuclear exosome (RNase complex)(GO:0000176) |
| 0.0 | 0.5 | GO:0005665 | DNA-directed RNA polymerase II, core complex(GO:0005665) |
| 0.0 | 0.2 | GO:0071541 | eukaryotic translation initiation factor 3 complex, eIF3m(GO:0071541) |
| 0.0 | 0.1 | GO:0048269 | methionine adenosyltransferase complex(GO:0048269) |
| 0.0 | 0.3 | GO:1902562 | NuA4 histone acetyltransferase complex(GO:0035267) H4/H2A histone acetyltransferase complex(GO:0043189) H4 histone acetyltransferase complex(GO:1902562) |
| 0.0 | 0.1 | GO:0030915 | Smc5-Smc6 complex(GO:0030915) |
| 0.0 | 0.4 | GO:0036038 | MKS complex(GO:0036038) |
| 0.0 | 0.4 | GO:0008540 | proteasome regulatory particle, base subcomplex(GO:0008540) |
| 0.0 | 3.0 | GO:0008021 | synaptic vesicle(GO:0008021) |
| 0.0 | 0.1 | GO:0000306 | extrinsic component of vacuolar membrane(GO:0000306) extrinsic component of endosome membrane(GO:0031313) |
| 0.0 | 0.3 | GO:0042470 | melanosome(GO:0042470) pigment granule(GO:0048770) |
| 0.0 | 0.6 | GO:0043596 | nuclear replication fork(GO:0043596) |
| 0.0 | 0.4 | GO:0005847 | mRNA cleavage and polyadenylation specificity factor complex(GO:0005847) |
| 0.0 | 1.1 | GO:0005834 | heterotrimeric G-protein complex(GO:0005834) |
| 0.0 | 0.2 | GO:0005671 | Ada2/Gcn5/Ada3 transcription activator complex(GO:0005671) |
| 0.0 | 0.3 | GO:0008385 | IkappaB kinase complex(GO:0008385) |
| 0.0 | 0.4 | GO:0097346 | INO80-type complex(GO:0097346) |
| 0.0 | 1.2 | GO:0036126 | sperm flagellum(GO:0036126) |
| 0.0 | 0.8 | GO:0005876 | spindle microtubule(GO:0005876) |
| 0.0 | 0.2 | GO:0016461 | unconventional myosin complex(GO:0016461) |
| 0.0 | 0.2 | GO:0005579 | membrane attack complex(GO:0005579) |
| 0.0 | 0.1 | GO:0042555 | MCM complex(GO:0042555) |
| 0.0 | 3.1 | GO:0042579 | peroxisome(GO:0005777) microbody(GO:0042579) |
| 0.0 | 0.1 | GO:1990124 | messenger ribonucleoprotein complex(GO:1990124) |
| 0.0 | 0.1 | GO:0030663 | COPI-coated vesicle membrane(GO:0030663) |
| 0.0 | 0.0 | GO:0097504 | Gemini of coiled bodies(GO:0097504) |
| 0.0 | 0.6 | GO:0045171 | intercellular bridge(GO:0045171) |
| 0.0 | 1.8 | GO:0031093 | platelet alpha granule lumen(GO:0031093) |
| 0.0 | 0.0 | GO:0016533 | cyclin-dependent protein kinase 5 holoenzyme complex(GO:0016533) |
| 0.0 | 1.6 | GO:0030496 | midbody(GO:0030496) |
| 0.0 | 1.0 | GO:0030315 | T-tubule(GO:0030315) |
| 0.0 | 0.3 | GO:0005719 | nuclear euchromatin(GO:0005719) |
| 0.0 | 0.5 | GO:0005881 | cytoplasmic microtubule(GO:0005881) |
| 0.0 | 0.6 | GO:0001772 | immunological synapse(GO:0001772) |
| 0.0 | 0.0 | GO:0031261 | DNA replication preinitiation complex(GO:0031261) |
| 0.0 | 0.0 | GO:0019008 | molybdopterin synthase complex(GO:0019008) |
| 0.0 | 1.6 | GO:0000932 | cytoplasmic mRNA processing body(GO:0000932) |
| 0.0 | 0.9 | GO:0072686 | mitotic spindle(GO:0072686) |
| 0.0 | 0.1 | GO:0035631 | CD40 receptor complex(GO:0035631) |
| 0.0 | 0.1 | GO:0031254 | uropod(GO:0001931) cell trailing edge(GO:0031254) |
| 0.0 | 0.3 | GO:0005697 | telomerase holoenzyme complex(GO:0005697) |
| 0.0 | 1.3 | GO:0097517 | stress fiber(GO:0001725) contractile actin filament bundle(GO:0097517) |
| 0.0 | 0.4 | GO:0032281 | AMPA glutamate receptor complex(GO:0032281) |
| 0.0 | 2.4 | GO:0005667 | transcription factor complex(GO:0005667) |
| 0.0 | 1.4 | GO:0015934 | large ribosomal subunit(GO:0015934) |
| 0.0 | 0.1 | GO:0035371 | microtubule plus-end(GO:0035371) |
| 0.0 | 0.1 | GO:0030897 | HOPS complex(GO:0030897) |
| 0.0 | 1.9 | GO:0030426 | growth cone(GO:0030426) |
| 0.0 | 0.2 | GO:0031307 | integral component of mitochondrial outer membrane(GO:0031307) |
| 0.0 | 0.1 | GO:0005641 | nuclear envelope lumen(GO:0005641) |
| 0.0 | 0.2 | GO:0000813 | ESCRT I complex(GO:0000813) |
| 0.0 | 0.2 | GO:0016235 | aggresome(GO:0016235) |
| 0.0 | 0.1 | GO:0030014 | CCR4-NOT complex(GO:0030014) |
| 0.0 | 3.4 | GO:0005743 | mitochondrial inner membrane(GO:0005743) |
| 0.0 | 0.4 | GO:0005891 | voltage-gated calcium channel complex(GO:0005891) |
| 0.0 | 0.1 | GO:0000502 | proteasome complex(GO:0000502) |
| 0.0 | 0.1 | GO:0035985 | senescence-associated heterochromatin focus(GO:0035985) |
| 0.0 | 0.8 | GO:0000118 | histone deacetylase complex(GO:0000118) |
| 0.0 | 0.7 | GO:0031519 | PcG protein complex(GO:0031519) |
| 0.0 | 0.1 | GO:0000123 | histone acetyltransferase complex(GO:0000123) |
| 0.0 | 5.4 | GO:0005739 | mitochondrion(GO:0005739) |
| 0.0 | 3.2 | GO:0005929 | cilium(GO:0005929) |
Gene overrepresentation in molecular_function category:
| Log-likelihood per target | Total log-likelihood | Term | Description |
|---|---|---|---|
| 1.6 | 4.8 | GO:0016211 | glutamate-ammonia ligase activity(GO:0004356) ammonia ligase activity(GO:0016211) acid-ammonia (or amide) ligase activity(GO:0016880) |
| 1.0 | 3.0 | GO:0031859 | platelet activating factor receptor binding(GO:0031859) |
| 0.7 | 2.1 | GO:0015227 | acyl carnitine transmembrane transporter activity(GO:0015227) |
| 0.6 | 2.5 | GO:0047066 | phospholipid-hydroperoxide glutathione peroxidase activity(GO:0047066) |
| 0.6 | 1.9 | GO:0004370 | glycerol kinase activity(GO:0004370) |
| 0.6 | 2.2 | GO:0005017 | platelet-derived growth factor-activated receptor activity(GO:0005017) |
| 0.5 | 1.6 | GO:0050613 | delta14-sterol reductase activity(GO:0050613) |
| 0.5 | 2.1 | GO:0046538 | bisphosphoglycerate mutase activity(GO:0004082) phosphoglycerate mutase activity(GO:0004619) 2,3-bisphosphoglycerate-dependent phosphoglycerate mutase activity(GO:0046538) |
| 0.5 | 3.5 | GO:0032138 | single base insertion or deletion binding(GO:0032138) |
| 0.5 | 2.4 | GO:0098519 | nucleotide phosphatase activity, acting on free nucleotides(GO:0098519) |
| 0.5 | 5.8 | GO:0046935 | 1-phosphatidylinositol-3-kinase regulator activity(GO:0046935) |
| 0.5 | 1.9 | GO:0051996 | farnesyl-diphosphate farnesyltransferase activity(GO:0004310) squalene synthase activity(GO:0051996) |
| 0.4 | 3.9 | GO:0043237 | laminin-1 binding(GO:0043237) |
| 0.4 | 1.7 | GO:0003985 | acetyl-CoA C-acetyltransferase activity(GO:0003985) |
| 0.4 | 1.3 | GO:0044549 | GTP cyclohydrolase binding(GO:0044549) |
| 0.4 | 1.2 | GO:0004103 | choline kinase activity(GO:0004103) |
| 0.4 | 3.7 | GO:0016206 | catechol O-methyltransferase activity(GO:0016206) |
| 0.4 | 1.2 | GO:0031751 | D4 dopamine receptor binding(GO:0031751) |
| 0.4 | 1.2 | GO:0010698 | acetyltransferase activator activity(GO:0010698) |
| 0.4 | 4.8 | GO:0048407 | platelet-derived growth factor binding(GO:0048407) |
| 0.4 | 1.2 | GO:0008534 | oxidized purine nucleobase lesion DNA N-glycosylase activity(GO:0008534) |
| 0.4 | 3.1 | GO:0048495 | Roundabout binding(GO:0048495) |
| 0.4 | 1.1 | GO:0034739 | histone deacetylase activity (H4-K16 specific)(GO:0034739) |
| 0.4 | 2.3 | GO:0015142 | citrate transmembrane transporter activity(GO:0015137) tricarboxylic acid transmembrane transporter activity(GO:0015142) |
| 0.4 | 2.2 | GO:0030348 | syntaxin-3 binding(GO:0030348) |
| 0.4 | 1.8 | GO:0004161 | dimethylallyltranstransferase activity(GO:0004161) geranyltranstransferase activity(GO:0004337) |
| 0.4 | 1.1 | GO:0061505 | DNA topoisomerase type II (ATP-hydrolyzing) activity(GO:0003918) DNA topoisomerase II activity(GO:0061505) |
| 0.4 | 1.8 | GO:0004594 | pantothenate kinase activity(GO:0004594) |
| 0.4 | 3.2 | GO:0016290 | palmitoyl-CoA hydrolase activity(GO:0016290) |
| 0.3 | 7.1 | GO:0008510 | sodium:bicarbonate symporter activity(GO:0008510) |
| 0.3 | 4.7 | GO:0019870 | potassium channel inhibitor activity(GO:0019870) |
| 0.3 | 10.3 | GO:0001965 | G-protein alpha-subunit binding(GO:0001965) |
| 0.3 | 1.9 | GO:0004735 | pyrroline-5-carboxylate reductase activity(GO:0004735) |
| 0.3 | 8.3 | GO:0000062 | fatty-acyl-CoA binding(GO:0000062) |
| 0.3 | 0.9 | GO:0005483 | soluble NSF attachment protein activity(GO:0005483) |
| 0.3 | 1.2 | GO:0004874 | aryl hydrocarbon receptor activity(GO:0004874) |
| 0.3 | 0.8 | GO:0004797 | thymidine kinase activity(GO:0004797) |
| 0.3 | 1.6 | GO:0004045 | aminoacyl-tRNA hydrolase activity(GO:0004045) |
| 0.3 | 0.8 | GO:0003955 | NAD(P)H dehydrogenase (quinone) activity(GO:0003955) |
| 0.3 | 0.8 | GO:0015928 | alpha-L-fucosidase activity(GO:0004560) fucosidase activity(GO:0015928) |
| 0.3 | 0.3 | GO:0016453 | C-acetyltransferase activity(GO:0016453) |
| 0.3 | 1.0 | GO:0004616 | phosphogluconate dehydrogenase (decarboxylating) activity(GO:0004616) |
| 0.3 | 1.3 | GO:0004647 | phosphoserine phosphatase activity(GO:0004647) |
| 0.3 | 0.8 | GO:0052810 | 1-phosphatidylinositol-5-kinase activity(GO:0052810) |
| 0.3 | 2.3 | GO:0016670 | oxidoreductase activity, acting on a sulfur group of donors, oxygen as acceptor(GO:0016670) |
| 0.2 | 3.2 | GO:1990380 | Lys48-specific deubiquitinase activity(GO:1990380) |
| 0.2 | 5.9 | GO:0005095 | GTPase inhibitor activity(GO:0005095) |
| 0.2 | 0.7 | GO:0003826 | alpha-ketoacid dehydrogenase activity(GO:0003826) 3-methyl-2-oxobutanoate dehydrogenase (2-methylpropanoyl-transferring) activity(GO:0003863) |
| 0.2 | 0.5 | GO:0031749 | D2 dopamine receptor binding(GO:0031749) |
| 0.2 | 0.9 | GO:0000285 | 1-phosphatidylinositol-3-phosphate 5-kinase activity(GO:0000285) |
| 0.2 | 0.7 | GO:0052811 | 1-phosphatidylinositol-3-phosphate 4-kinase activity(GO:0052811) |
| 0.2 | 1.8 | GO:0004957 | prostaglandin E receptor activity(GO:0004957) |
| 0.2 | 0.7 | GO:0004174 | electron-transferring-flavoprotein dehydrogenase activity(GO:0004174) oxidoreductase activity, acting on the CH-NH group of donors, quinone or similar compound as acceptor(GO:0016649) |
| 0.2 | 1.1 | GO:0044378 | non-sequence-specific DNA binding, bending(GO:0044378) |
| 0.2 | 1.9 | GO:0034235 | GPI anchor binding(GO:0034235) |
| 0.2 | 2.1 | GO:0042731 | PH domain binding(GO:0042731) |
| 0.2 | 1.0 | GO:0050436 | microfibril binding(GO:0050436) |
| 0.2 | 0.6 | GO:0097158 | pre-mRNA intronic pyrimidine-rich binding(GO:0097158) |
| 0.2 | 0.6 | GO:0030550 | acetylcholine receptor inhibitor activity(GO:0030550) |
| 0.2 | 0.6 | GO:0004157 | dihydropyrimidinase activity(GO:0004157) |
| 0.2 | 1.2 | GO:0042030 | ATPase inhibitor activity(GO:0042030) |
| 0.2 | 0.6 | GO:0004032 | alditol:NADP+ 1-oxidoreductase activity(GO:0004032) |
| 0.2 | 1.1 | GO:0015307 | drug:proton antiporter activity(GO:0015307) |
| 0.2 | 0.8 | GO:0030395 | lactose binding(GO:0030395) |
| 0.2 | 0.8 | GO:0003867 | 4-aminobutyrate transaminase activity(GO:0003867) succinate-semialdehyde dehydrogenase binding(GO:0032145) (S)-3-amino-2-methylpropionate transaminase activity(GO:0047298) |
| 0.2 | 1.1 | GO:0016823 | hydrolase activity, acting on acid carbon-carbon bonds(GO:0016822) hydrolase activity, acting on acid carbon-carbon bonds, in ketonic substances(GO:0016823) |
| 0.2 | 0.6 | GO:0016899 | oxidoreductase activity, acting on the CH-OH group of donors, oxygen as acceptor(GO:0016899) |
| 0.2 | 0.7 | GO:0034584 | piRNA binding(GO:0034584) |
| 0.2 | 1.4 | GO:0050815 | phosphoserine binding(GO:0050815) |
| 0.2 | 1.2 | GO:1904929 | coreceptor activity involved in Wnt signaling pathway, planar cell polarity pathway(GO:1904929) |
| 0.2 | 0.8 | GO:0032795 | heterotrimeric G-protein binding(GO:0032795) |
| 0.2 | 0.6 | GO:0033981 | D-dopachrome decarboxylase activity(GO:0033981) |
| 0.2 | 1.5 | GO:0008158 | hedgehog receptor activity(GO:0008158) |
| 0.2 | 0.6 | GO:0043398 | HLH domain binding(GO:0043398) |
| 0.2 | 0.6 | GO:0061769 | ribosylnicotinamide kinase activity(GO:0050262) ribosylnicotinate kinase activity(GO:0061769) |
| 0.2 | 0.5 | GO:0046921 | glycoprotein 6-alpha-L-fucosyltransferase activity(GO:0008424) alpha-(1->6)-fucosyltransferase activity(GO:0046921) |
| 0.1 | 3.6 | GO:0004029 | aldehyde dehydrogenase (NAD) activity(GO:0004029) |
| 0.1 | 1.6 | GO:0051434 | BH3 domain binding(GO:0051434) |
| 0.1 | 0.4 | GO:0008969 | phosphohistidine phosphatase activity(GO:0008969) |
| 0.1 | 0.9 | GO:0008479 | queuine tRNA-ribosyltransferase activity(GO:0008479) |
| 0.1 | 1.2 | GO:0050833 | pyruvate transmembrane transporter activity(GO:0050833) |
| 0.1 | 0.4 | GO:0045294 | alpha-catenin binding(GO:0045294) |
| 0.1 | 0.7 | GO:0004306 | ethanolamine-phosphate cytidylyltransferase activity(GO:0004306) |
| 0.1 | 1.8 | GO:0045159 | myosin II binding(GO:0045159) |
| 0.1 | 0.4 | GO:0004915 | interleukin-6 receptor activity(GO:0004915) leukemia inhibitory factor receptor activity(GO:0004923) interleukin-6 binding(GO:0019981) |
| 0.1 | 0.8 | GO:0004096 | catalase activity(GO:0004096) |
| 0.1 | 0.4 | GO:0004676 | 3-phosphoinositide-dependent protein kinase activity(GO:0004676) |
| 0.1 | 0.5 | GO:0004449 | isocitrate dehydrogenase (NAD+) activity(GO:0004449) |
| 0.1 | 0.4 | GO:0004416 | hydroxyacylglutathione hydrolase activity(GO:0004416) |
| 0.1 | 2.4 | GO:0005225 | volume-sensitive anion channel activity(GO:0005225) |
| 0.1 | 0.5 | GO:0015616 | DNA translocase activity(GO:0015616) |
| 0.1 | 0.8 | GO:0003998 | acylphosphatase activity(GO:0003998) |
| 0.1 | 1.4 | GO:0050072 | m7G(5')pppN diphosphatase activity(GO:0050072) |
| 0.1 | 0.4 | GO:0005169 | neurotrophin TRKB receptor binding(GO:0005169) |
| 0.1 | 1.5 | GO:0070181 | small ribosomal subunit rRNA binding(GO:0070181) |
| 0.1 | 1.0 | GO:0004784 | superoxide dismutase activity(GO:0004784) oxidoreductase activity, acting on superoxide radicals as acceptor(GO:0016721) |
| 0.1 | 0.5 | GO:0035651 | AP-3 adaptor complex binding(GO:0035651) |
| 0.1 | 1.2 | GO:0031730 | CCR5 chemokine receptor binding(GO:0031730) |
| 0.1 | 2.7 | GO:0004862 | cAMP-dependent protein kinase inhibitor activity(GO:0004862) |
| 0.1 | 1.6 | GO:0008199 | ferric iron binding(GO:0008199) |
| 0.1 | 0.7 | GO:0016909 | JUN kinase activity(GO:0004705) SAP kinase activity(GO:0016909) |
| 0.1 | 0.9 | GO:0030346 | protein phosphatase 2B binding(GO:0030346) |
| 0.1 | 0.7 | GO:0004771 | sterol esterase activity(GO:0004771) |
| 0.1 | 13.1 | GO:0004722 | protein serine/threonine phosphatase activity(GO:0004722) |
| 0.1 | 5.9 | GO:0061650 | ubiquitin conjugating enzyme activity(GO:0061631) ubiquitin-like protein conjugating enzyme activity(GO:0061650) |
| 0.1 | 1.6 | GO:0004726 | non-membrane spanning protein tyrosine phosphatase activity(GO:0004726) |
| 0.1 | 1.0 | GO:0005167 | neurotrophin TRK receptor binding(GO:0005167) |
| 0.1 | 0.9 | GO:0070740 | tubulin-glutamic acid ligase activity(GO:0070740) |
| 0.1 | 1.4 | GO:0098505 | G-rich strand telomeric DNA binding(GO:0098505) |
| 0.1 | 0.7 | GO:0004634 | phosphopyruvate hydratase activity(GO:0004634) |
| 0.1 | 0.6 | GO:0004095 | carnitine O-palmitoyltransferase activity(GO:0004095) |
| 0.1 | 0.6 | GO:0015180 | L-alanine transmembrane transporter activity(GO:0015180) alanine transmembrane transporter activity(GO:0022858) |
| 0.1 | 3.7 | GO:0070577 | lysine-acetylated histone binding(GO:0070577) |
| 0.1 | 0.7 | GO:0004468 | lysine N-acetyltransferase activity, acting on acetyl phosphate as donor(GO:0004468) |
| 0.1 | 0.4 | GO:0005220 | inositol 1,4,5-trisphosphate-sensitive calcium-release channel activity(GO:0005220) |
| 0.1 | 0.3 | GO:0016731 | ferredoxin-NADP+ reductase activity(GO:0004324) NADPH-adrenodoxin reductase activity(GO:0015039) oxidoreductase activity, acting on iron-sulfur proteins as donors(GO:0016730) oxidoreductase activity, acting on iron-sulfur proteins as donors, NAD or NADP as acceptor(GO:0016731) |
| 0.1 | 2.6 | GO:0046933 | proton-transporting ATP synthase activity, rotational mechanism(GO:0046933) |
| 0.1 | 0.5 | GO:0070905 | serine binding(GO:0070905) |
| 0.1 | 0.4 | GO:0052836 | inositol 5-diphosphate pentakisphosphate 5-kinase activity(GO:0052836) inositol diphosphate tetrakisphosphate kinase activity(GO:0052839) |
| 0.1 | 0.4 | GO:0031716 | calcitonin receptor binding(GO:0031716) |
| 0.1 | 0.3 | GO:0050571 | 1,5-anhydro-D-fructose reductase activity(GO:0050571) |
| 0.1 | 0.2 | GO:0000253 | 3-keto sterol reductase activity(GO:0000253) |
| 0.1 | 0.5 | GO:0008597 | calcium-dependent protein serine/threonine phosphatase regulator activity(GO:0008597) |
| 0.1 | 0.5 | GO:0008607 | phosphorylase kinase regulator activity(GO:0008607) |
| 0.1 | 2.0 | GO:0004861 | cyclin-dependent protein serine/threonine kinase inhibitor activity(GO:0004861) |
| 0.1 | 0.4 | GO:0009041 | uridylate kinase activity(GO:0009041) |
| 0.1 | 0.4 | GO:0004523 | RNA-DNA hybrid ribonuclease activity(GO:0004523) |
| 0.1 | 1.7 | GO:0004551 | nucleotide diphosphatase activity(GO:0004551) |
| 0.1 | 0.6 | GO:0061649 | ubiquitinated histone binding(GO:0061649) |
| 0.1 | 0.6 | GO:0004844 | uracil DNA N-glycosylase activity(GO:0004844) deaminated base DNA N-glycosylase activity(GO:0097506) |
| 0.1 | 1.0 | GO:0031386 | protein tag(GO:0031386) |
| 0.1 | 2.2 | GO:0070300 | phosphatidic acid binding(GO:0070300) |
| 0.1 | 0.4 | GO:0004485 | methylcrotonoyl-CoA carboxylase activity(GO:0004485) |
| 0.1 | 0.3 | GO:0060422 | peptidyl-dipeptidase inhibitor activity(GO:0060422) |
| 0.1 | 0.5 | GO:0003747 | translation release factor activity(GO:0003747) translation termination factor activity(GO:0008079) |
| 0.1 | 0.2 | GO:0032139 | dinucleotide insertion or deletion binding(GO:0032139) |
| 0.1 | 0.6 | GO:0017077 | oxidative phosphorylation uncoupler activity(GO:0017077) |
| 0.1 | 0.3 | GO:0004335 | galactokinase activity(GO:0004335) |
| 0.1 | 0.8 | GO:0019788 | NEDD8 transferase activity(GO:0019788) |
| 0.1 | 1.1 | GO:0001075 | transcription factor activity, RNA polymerase II core promoter sequence-specific binding involved in preinitiation complex assembly(GO:0001075) |
| 0.1 | 0.2 | GO:0015173 | aromatic amino acid transmembrane transporter activity(GO:0015173) |
| 0.1 | 2.0 | GO:0080025 | phosphatidylinositol-3,5-bisphosphate binding(GO:0080025) |
| 0.1 | 6.2 | GO:0019003 | GDP binding(GO:0019003) |
| 0.1 | 1.4 | GO:0070403 | NAD+ binding(GO:0070403) |
| 0.1 | 3.4 | GO:0003785 | actin monomer binding(GO:0003785) |
| 0.1 | 0.2 | GO:0001596 | angiotensin type I receptor activity(GO:0001596) |
| 0.1 | 0.5 | GO:0097371 | MDM2/MDM4 family protein binding(GO:0097371) |
| 0.1 | 0.4 | GO:1902444 | riboflavin binding(GO:1902444) |
| 0.1 | 0.3 | GO:0019862 | IgA binding(GO:0019862) |
| 0.1 | 0.2 | GO:0030366 | molybdopterin synthase activity(GO:0030366) |
| 0.1 | 0.4 | GO:0032564 | adenyl deoxyribonucleotide binding(GO:0032558) dATP binding(GO:0032564) |
| 0.1 | 0.8 | GO:0019531 | oxalate transmembrane transporter activity(GO:0019531) |
| 0.1 | 0.6 | GO:0034597 | phosphatidylinositol-4,5-bisphosphate 4-phosphatase activity(GO:0034597) |
| 0.1 | 0.2 | GO:0010309 | acireductone dioxygenase [iron(II)-requiring] activity(GO:0010309) |
| 0.1 | 1.0 | GO:0019215 | intermediate filament binding(GO:0019215) |
| 0.1 | 4.2 | GO:0050136 | NADH dehydrogenase (ubiquinone) activity(GO:0008137) NADH dehydrogenase (quinone) activity(GO:0050136) |
| 0.1 | 0.5 | GO:0030983 | mismatched DNA binding(GO:0030983) |
| 0.1 | 0.5 | GO:0048039 | ubiquinone binding(GO:0048039) |
| 0.1 | 0.5 | GO:0017162 | aryl hydrocarbon receptor binding(GO:0017162) |
| 0.1 | 1.2 | GO:0004691 | cAMP-dependent protein kinase activity(GO:0004691) |
| 0.1 | 0.3 | GO:0004727 | prenylated protein tyrosine phosphatase activity(GO:0004727) |
| 0.1 | 0.3 | GO:0030292 | protein tyrosine kinase inhibitor activity(GO:0030292) |
| 0.1 | 0.2 | GO:0001147 | transcription termination site sequence-specific DNA binding(GO:0001147) transcription termination site DNA binding(GO:0001160) |
| 0.1 | 1.2 | GO:0035925 | mRNA 3'-UTR AU-rich region binding(GO:0035925) |
| 0.1 | 0.6 | GO:0005078 | MAP-kinase scaffold activity(GO:0005078) |
| 0.1 | 0.3 | GO:0004999 | vasoactive intestinal polypeptide receptor activity(GO:0004999) |
| 0.1 | 1.2 | GO:0086008 | voltage-gated potassium channel activity involved in cardiac muscle cell action potential repolarization(GO:0086008) |
| 0.1 | 0.5 | GO:0044323 | retinoic acid-responsive element binding(GO:0044323) |
| 0.1 | 1.6 | GO:0008301 | DNA binding, bending(GO:0008301) |
| 0.1 | 0.7 | GO:0019784 | NEDD8-specific protease activity(GO:0019784) |
| 0.1 | 1.2 | GO:0016655 | oxidoreductase activity, acting on NAD(P)H, quinone or similar compound as acceptor(GO:0016655) |
| 0.1 | 0.2 | GO:0010314 | phosphatidylinositol-5-phosphate binding(GO:0010314) |
| 0.1 | 0.2 | GO:0034353 | RNA pyrophosphohydrolase activity(GO:0034353) |
| 0.1 | 0.2 | GO:0015207 | ATP:ADP antiporter activity(GO:0005471) adenine transmembrane transporter activity(GO:0015207) |
| 0.1 | 0.6 | GO:1990948 | ligase inhibitor activity(GO:0055104) ubiquitin ligase inhibitor activity(GO:1990948) |
| 0.1 | 0.4 | GO:0001517 | N-acetylglucosamine 6-O-sulfotransferase activity(GO:0001517) |
| 0.1 | 0.2 | GO:0061676 | importin-alpha family protein binding(GO:0061676) |
| 0.1 | 0.4 | GO:0004614 | phosphoglucomutase activity(GO:0004614) |
| 0.1 | 2.9 | GO:0005484 | SNAP receptor activity(GO:0005484) |
| 0.1 | 0.3 | GO:0033743 | peptide-methionine (R)-S-oxide reductase activity(GO:0033743) |
| 0.1 | 0.2 | GO:0004878 | complement component C5a receptor activity(GO:0004878) |
| 0.1 | 1.4 | GO:0035497 | cAMP response element binding(GO:0035497) |
| 0.1 | 0.3 | GO:0017108 | 5'-flap endonuclease activity(GO:0017108) |
| 0.1 | 1.0 | GO:0001104 | RNA polymerase II transcription cofactor activity(GO:0001104) |
| 0.1 | 1.2 | GO:0035615 | clathrin adaptor activity(GO:0035615) endocytic adaptor activity(GO:0098748) |
| 0.1 | 1.5 | GO:0000993 | RNA polymerase II core binding(GO:0000993) |
| 0.1 | 1.3 | GO:0001223 | transcription coactivator binding(GO:0001223) |
| 0.1 | 1.4 | GO:0046961 | proton-transporting ATPase activity, rotational mechanism(GO:0046961) |
| 0.1 | 0.2 | GO:0016784 | 3-mercaptopyruvate sulfurtransferase activity(GO:0016784) |
| 0.1 | 0.3 | GO:0070137 | ubiquitin-like protein-specific endopeptidase activity(GO:0070137) SUMO-specific endopeptidase activity(GO:0070139) |
| 0.1 | 2.2 | GO:0043015 | gamma-tubulin binding(GO:0043015) |
| 0.1 | 0.4 | GO:0061133 | endopeptidase activator activity(GO:0061133) |
| 0.1 | 0.3 | GO:0034191 | apolipoprotein A-I receptor binding(GO:0034191) |
| 0.1 | 0.2 | GO:0097100 | supercoiled DNA binding(GO:0097100) |
| 0.1 | 0.7 | GO:0030618 | transforming growth factor beta receptor, pathway-specific cytoplasmic mediator activity(GO:0030618) |
| 0.1 | 2.1 | GO:0070566 | adenylyltransferase activity(GO:0070566) |
| 0.1 | 0.3 | GO:0016888 | endodeoxyribonuclease activity, producing 5'-phosphomonoesters(GO:0016888) |
| 0.1 | 3.7 | GO:0019212 | phosphatase inhibitor activity(GO:0019212) |
| 0.1 | 0.2 | GO:0004852 | uroporphyrinogen-III synthase activity(GO:0004852) |
| 0.1 | 3.6 | GO:0004407 | histone deacetylase activity(GO:0004407) protein deacetylase activity(GO:0033558) |
| 0.1 | 1.6 | GO:0071949 | FAD binding(GO:0071949) |
| 0.1 | 2.2 | GO:0004003 | ATP-dependent DNA helicase activity(GO:0004003) |
| 0.1 | 0.2 | GO:0047696 | beta-adrenergic receptor kinase activity(GO:0047696) |
| 0.0 | 0.2 | GO:0004359 | glutaminase activity(GO:0004359) |
| 0.0 | 1.1 | GO:0097602 | cullin family protein binding(GO:0097602) |
| 0.0 | 10.2 | GO:0017124 | SH3 domain binding(GO:0017124) |
| 0.0 | 1.7 | GO:0003887 | DNA-directed DNA polymerase activity(GO:0003887) |
| 0.0 | 0.2 | GO:0016934 | extracellular-glycine-gated ion channel activity(GO:0016933) extracellular-glycine-gated chloride channel activity(GO:0016934) |
| 0.0 | 0.2 | GO:0004074 | biliverdin reductase activity(GO:0004074) |
| 0.0 | 2.8 | GO:0019208 | phosphatase regulator activity(GO:0019208) |
| 0.0 | 1.6 | GO:0004709 | MAP kinase kinase kinase activity(GO:0004709) |
| 0.0 | 2.2 | GO:0050699 | WW domain binding(GO:0050699) |
| 0.0 | 0.3 | GO:0005131 | growth hormone receptor binding(GO:0005131) |
| 0.0 | 0.3 | GO:0046912 | transferase activity, transferring acyl groups, acyl groups converted into alkyl on transfer(GO:0046912) |
| 0.0 | 1.0 | GO:0017127 | cholesterol transporter activity(GO:0017127) |
| 0.0 | 3.0 | GO:0004712 | protein serine/threonine/tyrosine kinase activity(GO:0004712) |
| 0.0 | 0.3 | GO:0015501 | glutamate:sodium symporter activity(GO:0015501) |
| 0.0 | 0.3 | GO:0035374 | chondroitin sulfate binding(GO:0035374) |
| 0.0 | 0.1 | GO:0045127 | N-acetylglucosamine kinase activity(GO:0045127) |
| 0.0 | 0.1 | GO:0031826 | type 2A serotonin receptor binding(GO:0031826) |
| 0.0 | 0.1 | GO:0004618 | phosphoglycerate kinase activity(GO:0004618) |
| 0.0 | 0.9 | GO:0017091 | AU-rich element binding(GO:0017091) |
| 0.0 | 0.4 | GO:0016863 | intramolecular oxidoreductase activity, transposing C=C bonds(GO:0016863) |
| 0.0 | 0.1 | GO:0031752 | D5 dopamine receptor binding(GO:0031752) |
| 0.0 | 0.1 | GO:0097027 | ligase regulator activity(GO:0055103) ubiquitin-protein transferase regulator activity(GO:0055106) ubiquitin-protein transferase activator activity(GO:0097027) |
| 0.0 | 0.3 | GO:0016717 | oxidoreductase activity, acting on paired donors, with oxidation of a pair of donors resulting in the reduction of molecular oxygen to two molecules of water(GO:0016717) |
| 0.0 | 0.1 | GO:0032557 | UTP:glucose-1-phosphate uridylyltransferase activity(GO:0003983) pyrimidine ribonucleotide binding(GO:0032557) UTP-monosaccharide-1-phosphate uridylyltransferase activity(GO:0051748) |
| 0.0 | 0.2 | GO:0003691 | double-stranded telomeric DNA binding(GO:0003691) |
| 0.0 | 0.5 | GO:0010385 | double-stranded methylated DNA binding(GO:0010385) |
| 0.0 | 0.2 | GO:1990460 | leptin receptor binding(GO:1990460) |
| 0.0 | 0.8 | GO:0016538 | cyclin-dependent protein serine/threonine kinase regulator activity(GO:0016538) |
| 0.0 | 3.6 | GO:0004860 | protein kinase inhibitor activity(GO:0004860) |
| 0.0 | 0.8 | GO:0003678 | DNA helicase activity(GO:0003678) |
| 0.0 | 0.2 | GO:0004803 | transposase activity(GO:0004803) |
| 0.0 | 0.3 | GO:0004128 | cytochrome-b5 reductase activity, acting on NAD(P)H(GO:0004128) |
| 0.0 | 1.3 | GO:0043531 | ADP binding(GO:0043531) |
| 0.0 | 1.7 | GO:0030544 | Hsp70 protein binding(GO:0030544) |
| 0.0 | 0.7 | GO:0102391 | decanoate--CoA ligase activity(GO:0102391) |
| 0.0 | 1.0 | GO:0005086 | ARF guanyl-nucleotide exchange factor activity(GO:0005086) |
| 0.0 | 0.0 | GO:0070728 | leucine binding(GO:0070728) |
| 0.0 | 0.4 | GO:0004016 | adenylate cyclase activity(GO:0004016) |
| 0.0 | 0.3 | GO:0004887 | thyroid hormone receptor activity(GO:0004887) |
| 0.0 | 0.1 | GO:0015439 | heme-transporting ATPase activity(GO:0015439) |
| 0.0 | 1.0 | GO:0098641 | cadherin binding involved in cell-cell adhesion(GO:0098641) |
| 0.0 | 0.4 | GO:0035173 | histone kinase activity(GO:0035173) |
| 0.0 | 0.5 | GO:0031683 | G-protein beta/gamma-subunit complex binding(GO:0031683) |
| 0.0 | 0.7 | GO:0034185 | apolipoprotein binding(GO:0034185) |
| 0.0 | 0.1 | GO:0031811 | G-protein coupled nucleotide receptor binding(GO:0031811) P2Y1 nucleotide receptor binding(GO:0031812) |
| 0.0 | 0.1 | GO:0034602 | oxoglutarate dehydrogenase (NAD+) activity(GO:0034602) |
| 0.0 | 0.1 | GO:0004140 | dephospho-CoA kinase activity(GO:0004140) |
| 0.0 | 0.1 | GO:0033867 | Fas-activated serine/threonine kinase activity(GO:0033867) |
| 0.0 | 0.3 | GO:0035005 | 1-phosphatidylinositol-4-phosphate 3-kinase activity(GO:0035005) |
| 0.0 | 0.1 | GO:1904288 | BAT3 complex binding(GO:1904288) |
| 0.0 | 1.1 | GO:1990841 | promoter-specific chromatin binding(GO:1990841) |
| 0.0 | 0.2 | GO:0016744 | transferase activity, transferring aldehyde or ketonic groups(GO:0016744) |
| 0.0 | 0.4 | GO:0001135 | transcription factor activity, RNA polymerase II transcription factor recruiting(GO:0001135) |
| 0.0 | 1.9 | GO:0070888 | E-box binding(GO:0070888) |
| 0.0 | 1.0 | GO:0048487 | beta-tubulin binding(GO:0048487) |
| 0.0 | 0.1 | GO:0035473 | lipase binding(GO:0035473) |
| 0.0 | 0.1 | GO:0017089 | glycolipid transporter activity(GO:0017089) |
| 0.0 | 0.7 | GO:0031690 | adrenergic receptor binding(GO:0031690) |
| 0.0 | 0.2 | GO:0004882 | androgen receptor activity(GO:0004882) |
| 0.0 | 0.1 | GO:0035034 | histone acetyltransferase regulator activity(GO:0035034) |
| 0.0 | 0.5 | GO:0016641 | oxidoreductase activity, acting on the CH-NH2 group of donors, oxygen as acceptor(GO:0016641) |
| 0.0 | 2.1 | GO:0070491 | repressing transcription factor binding(GO:0070491) |
| 0.0 | 0.2 | GO:0001665 | alpha-N-acetylgalactosaminide alpha-2,6-sialyltransferase activity(GO:0001665) |
| 0.0 | 0.2 | GO:0008109 | N-acetyllactosaminide beta-1,6-N-acetylglucosaminyltransferase activity(GO:0008109) |
| 0.0 | 0.2 | GO:0003886 | DNA (cytosine-5-)-methyltransferase activity(GO:0003886) |
| 0.0 | 0.7 | GO:0003684 | damaged DNA binding(GO:0003684) |
| 0.0 | 0.6 | GO:0008253 | 5'-nucleotidase activity(GO:0008253) |
| 0.0 | 0.2 | GO:0005113 | patched binding(GO:0005113) |
| 0.0 | 0.1 | GO:0019210 | kinase inhibitor activity(GO:0019210) |
| 0.0 | 0.1 | GO:0005136 | interleukin-4 receptor binding(GO:0005136) |
| 0.0 | 1.0 | GO:0008139 | nuclear localization sequence binding(GO:0008139) |
| 0.0 | 1.7 | GO:0005507 | copper ion binding(GO:0005507) |
| 0.0 | 1.3 | GO:0030507 | spectrin binding(GO:0030507) |
| 0.0 | 1.3 | GO:0031491 | nucleosome binding(GO:0031491) |
| 0.0 | 0.3 | GO:0042975 | peroxisome proliferator activated receptor binding(GO:0042975) |
| 0.0 | 0.2 | GO:0032050 | clathrin heavy chain binding(GO:0032050) |
| 0.0 | 1.7 | GO:0004402 | histone acetyltransferase activity(GO:0004402) |
| 0.0 | 0.2 | GO:0008321 | Ral guanyl-nucleotide exchange factor activity(GO:0008321) |
| 0.0 | 0.8 | GO:0001106 | RNA polymerase II transcription corepressor activity(GO:0001106) |
| 0.0 | 3.6 | GO:0042393 | histone binding(GO:0042393) |
| 0.0 | 0.3 | GO:0008430 | selenium binding(GO:0008430) |
| 0.0 | 0.2 | GO:0005087 | Ran guanyl-nucleotide exchange factor activity(GO:0005087) |
| 0.0 | 0.3 | GO:0000268 | peroxisome targeting sequence binding(GO:0000268) |
| 0.0 | 0.8 | GO:0004298 | threonine-type endopeptidase activity(GO:0004298) threonine-type peptidase activity(GO:0070003) |
| 0.0 | 0.6 | GO:0017075 | syntaxin-1 binding(GO:0017075) |
| 0.0 | 0.1 | GO:0008195 | phosphatidate phosphatase activity(GO:0008195) |
| 0.0 | 0.1 | GO:0015131 | thiosulfate transmembrane transporter activity(GO:0015117) oxaloacetate transmembrane transporter activity(GO:0015131) succinate transmembrane transporter activity(GO:0015141) |
| 0.0 | 0.1 | GO:0004756 | selenide, water dikinase activity(GO:0004756) phosphotransferase activity, paired acceptors(GO:0016781) |
| 0.0 | 0.4 | GO:0008190 | eukaryotic initiation factor 4E binding(GO:0008190) |
| 0.0 | 0.3 | GO:0043422 | protein kinase B binding(GO:0043422) |
| 0.0 | 0.1 | GO:0035800 | deubiquitinase activator activity(GO:0035800) |
| 0.0 | 0.5 | GO:0016776 | phosphotransferase activity, phosphate group as acceptor(GO:0016776) |
| 0.0 | 0.4 | GO:0005024 | transforming growth factor beta-activated receptor activity(GO:0005024) |
| 0.0 | 0.1 | GO:0004994 | somatostatin receptor activity(GO:0004994) |
| 0.0 | 0.1 | GO:0008475 | procollagen-lysine 5-dioxygenase activity(GO:0008475) procollagen glucosyltransferase activity(GO:0033823) |
| 0.0 | 1.1 | GO:0015026 | coreceptor activity(GO:0015026) |
| 0.0 | 2.3 | GO:0043130 | ubiquitin binding(GO:0043130) |
| 0.0 | 0.1 | GO:0061578 | Lys63-specific deubiquitinase activity(GO:0061578) |
| 0.0 | 0.3 | GO:0097109 | neuroligin family protein binding(GO:0097109) |
| 0.0 | 0.1 | GO:0051033 | nucleic acid transmembrane transporter activity(GO:0051032) RNA transmembrane transporter activity(GO:0051033) |
| 0.0 | 1.2 | GO:0005546 | phosphatidylinositol-4,5-bisphosphate binding(GO:0005546) |
| 0.0 | 2.2 | GO:0017048 | Rho GTPase binding(GO:0017048) |
| 0.0 | 0.1 | GO:0051525 | NFAT protein binding(GO:0051525) |
| 0.0 | 0.1 | GO:0001602 | pancreatic polypeptide receptor activity(GO:0001602) |
| 0.0 | 0.2 | GO:0016174 | NAD(P)H oxidase activity(GO:0016174) |
| 0.0 | 0.1 | GO:0070991 | medium-chain-acyl-CoA dehydrogenase activity(GO:0070991) |
| 0.0 | 0.2 | GO:0045545 | syndecan binding(GO:0045545) |
| 0.0 | 0.1 | GO:0043522 | leucine zipper domain binding(GO:0043522) |
| 0.0 | 0.4 | GO:0047372 | acylglycerol lipase activity(GO:0047372) |
| 0.0 | 0.2 | GO:0008097 | 5S rRNA binding(GO:0008097) |
| 0.0 | 0.3 | GO:0000339 | RNA cap binding(GO:0000339) |
| 0.0 | 0.3 | GO:0008429 | phosphatidylethanolamine binding(GO:0008429) |
| 0.0 | 0.3 | GO:0032266 | phosphatidylinositol-3-phosphate binding(GO:0032266) |
| 0.0 | 0.4 | GO:0016646 | oxidoreductase activity, acting on the CH-NH group of donors, NAD or NADP as acceptor(GO:0016646) |
| 0.0 | 0.1 | GO:0003854 | 3-beta-hydroxy-delta5-steroid dehydrogenase activity(GO:0003854) |
| 0.0 | 0.3 | GO:0046966 | thyroid hormone receptor binding(GO:0046966) |
| 0.0 | 0.1 | GO:0008853 | exodeoxyribonuclease III activity(GO:0008853) |
| 0.0 | 0.2 | GO:0060072 | large conductance calcium-activated potassium channel activity(GO:0060072) |
| 0.0 | 1.1 | GO:0016859 | cis-trans isomerase activity(GO:0016859) |
| 0.0 | 0.2 | GO:0033613 | activating transcription factor binding(GO:0033613) |
| 0.0 | 0.7 | GO:0004181 | metallocarboxypeptidase activity(GO:0004181) |
| 0.0 | 0.1 | GO:0016434 | rRNA (cytosine) methyltransferase activity(GO:0016434) |
| 0.0 | 0.1 | GO:1990932 | 5.8S rRNA binding(GO:1990932) |
| 0.0 | 1.2 | GO:0000980 | RNA polymerase II distal enhancer sequence-specific DNA binding(GO:0000980) |
| 0.0 | 1.3 | GO:0032947 | protein complex scaffold(GO:0032947) |
| 0.0 | 0.1 | GO:0005047 | signal recognition particle binding(GO:0005047) |
| 0.0 | 0.1 | GO:0003828 | alpha-N-acetylneuraminate alpha-2,8-sialyltransferase activity(GO:0003828) |
| 0.0 | 2.0 | GO:0003777 | microtubule motor activity(GO:0003777) |
| 0.0 | 1.1 | GO:0048306 | calcium-dependent protein binding(GO:0048306) |
| 0.0 | 1.0 | GO:0003899 | DNA-directed RNA polymerase activity(GO:0003899) RNA polymerase activity(GO:0034062) |
| 0.0 | 0.1 | GO:1901612 | cardiolipin binding(GO:1901612) |
| 0.0 | 0.5 | GO:0097493 | structural molecule activity conferring elasticity(GO:0097493) |
| 0.0 | 0.2 | GO:0003910 | DNA ligase (ATP) activity(GO:0003910) |
| 0.0 | 0.4 | GO:0008331 | high voltage-gated calcium channel activity(GO:0008331) |
| 0.0 | 0.1 | GO:1990599 | 3' overhang single-stranded DNA endodeoxyribonuclease activity(GO:1990599) |
| 0.0 | 0.2 | GO:0034237 | protein kinase A regulatory subunit binding(GO:0034237) |
| 0.0 | 6.9 | GO:0030695 | GTPase regulator activity(GO:0030695) |
| 0.0 | 0.1 | GO:0001515 | opioid peptide activity(GO:0001515) |
| 0.0 | 0.1 | GO:0042799 | histone methyltransferase activity (H4-K20 specific)(GO:0042799) |
| 0.0 | 0.3 | GO:0050431 | transforming growth factor beta binding(GO:0050431) |
| 0.0 | 0.2 | GO:0004716 | receptor signaling protein tyrosine kinase activity(GO:0004716) |
| 0.0 | 0.1 | GO:0047045 | testosterone 17-beta-dehydrogenase (NADP+) activity(GO:0047045) |
| 0.0 | 0.1 | GO:0030060 | L-malate dehydrogenase activity(GO:0030060) |
| 0.0 | 0.5 | GO:0005520 | insulin-like growth factor binding(GO:0005520) |
| 0.0 | 2.0 | GO:0005525 | GTP binding(GO:0005525) |
| 0.0 | 0.7 | GO:0017046 | peptide hormone binding(GO:0017046) |
| 0.0 | 0.2 | GO:0070064 | proline-rich region binding(GO:0070064) |
| 0.0 | 0.8 | GO:0030374 | ligand-dependent nuclear receptor transcription coactivator activity(GO:0030374) |
| 0.0 | 0.4 | GO:0008191 | metalloendopeptidase inhibitor activity(GO:0008191) |
| 0.0 | 0.2 | GO:0001221 | transcription cofactor binding(GO:0001221) |
| 0.0 | 0.3 | GO:0045309 | protein phosphorylated amino acid binding(GO:0045309) |
| 0.0 | 0.1 | GO:0004707 | MAP kinase activity(GO:0004707) |
| 0.0 | 0.4 | GO:0097200 | cysteine-type endopeptidase activity involved in execution phase of apoptosis(GO:0097200) |
| 0.0 | 0.1 | GO:0031728 | CCR3 chemokine receptor binding(GO:0031728) |
| 0.0 | 0.3 | GO:0030331 | estrogen receptor binding(GO:0030331) |
| 0.0 | 3.6 | GO:0061630 | ubiquitin protein ligase activity(GO:0061630) |
| 0.0 | 0.1 | GO:0004185 | serine-type carboxypeptidase activity(GO:0004185) |
| 0.0 | 0.1 | GO:0008467 | [heparan sulfate]-glucosamine 3-sulfotransferase 1 activity(GO:0008467) |
| 0.0 | 0.1 | GO:0015450 | P-P-bond-hydrolysis-driven protein transmembrane transporter activity(GO:0015450) |
| 0.0 | 0.3 | GO:0001871 | pattern binding(GO:0001871) polysaccharide binding(GO:0030247) |
| 0.0 | 0.1 | GO:0003988 | acetyl-CoA C-acyltransferase activity(GO:0003988) |
| 0.0 | 0.8 | GO:0016836 | hydro-lyase activity(GO:0016836) |
| 0.0 | 3.7 | GO:0003924 | GTPase activity(GO:0003924) |
| 0.0 | 0.3 | GO:0015929 | hexosaminidase activity(GO:0015929) |
| 0.0 | 0.1 | GO:0000064 | L-ornithine transmembrane transporter activity(GO:0000064) |
| 0.0 | 0.1 | GO:0051998 | carboxyl-O-methyltransferase activity(GO:0010340) protein carboxyl O-methyltransferase activity(GO:0051998) |
| 0.0 | 3.3 | GO:0004842 | ubiquitin-protein transferase activity(GO:0004842) |
| 0.0 | 0.2 | GO:0004550 | nucleoside diphosphate kinase activity(GO:0004550) |
| 0.0 | 0.1 | GO:0031871 | proteinase activated receptor binding(GO:0031871) |
| 0.0 | 0.4 | GO:0043539 | protein serine/threonine kinase activator activity(GO:0043539) |
| 0.0 | 0.3 | GO:0005158 | insulin receptor binding(GO:0005158) |
| 0.0 | 0.1 | GO:0016286 | small conductance calcium-activated potassium channel activity(GO:0016286) |
| 0.0 | 0.3 | GO:0042169 | SH2 domain binding(GO:0042169) |
| 0.0 | 0.1 | GO:0015106 | bicarbonate transmembrane transporter activity(GO:0015106) |
| 0.0 | 0.2 | GO:0019905 | syntaxin binding(GO:0019905) |
| 0.0 | 0.2 | GO:0004535 | poly(A)-specific ribonuclease activity(GO:0004535) |
| 0.0 | 0.4 | GO:0003713 | transcription coactivator activity(GO:0003713) |
| 0.0 | 0.0 | GO:0052856 | NADHX epimerase activity(GO:0052856) NADPHX epimerase activity(GO:0052857) |
| 0.0 | 0.1 | GO:0015129 | lactate transmembrane transporter activity(GO:0015129) |
| 0.0 | 0.1 | GO:0004536 | deoxyribonuclease activity(GO:0004536) |
| 0.0 | 0.3 | GO:0004653 | polypeptide N-acetylgalactosaminyltransferase activity(GO:0004653) |
| 0.0 | 0.1 | GO:0004996 | thyroid-stimulating hormone receptor activity(GO:0004996) |
| 0.0 | 2.0 | GO:0003714 | transcription corepressor activity(GO:0003714) |
Gene overrepresentation in C2:CP category:
| Log-likelihood per target | Total log-likelihood | Term | Description |
|---|---|---|---|
| 0.2 | 2.5 | PID RHOA PATHWAY | RhoA signaling pathway |
| 0.1 | 2.9 | PID NFKAPPAB ATYPICAL PATHWAY | Atypical NF-kappaB pathway |
| 0.1 | 11.3 | PID TCPTP PATHWAY | Signaling events mediated by TCPTP |
| 0.1 | 4.0 | PID LYMPH ANGIOGENESIS PATHWAY | VEGFR3 signaling in lymphatic endothelium |
| 0.1 | 5.1 | PID CD40 PATHWAY | CD40/CD40L signaling |
| 0.1 | 7.5 | NABA BASEMENT MEMBRANES | Genes encoding structural components of basement membranes |
| 0.1 | 8.1 | PID PLK1 PATHWAY | PLK1 signaling events |
| 0.1 | 3.9 | ST ERK1 ERK2 MAPK PATHWAY | ERK1/ERK2 MAPK Pathway |
| 0.1 | 3.6 | ST WNT CA2 CYCLIC GMP PATHWAY | Wnt/Ca2+/cyclic GMP signaling. |
| 0.1 | 3.1 | PID P38 MKK3 6PATHWAY | p38 MAPK signaling pathway |
| 0.1 | 2.8 | PID ARF 3PATHWAY | Arf1 pathway |
| 0.1 | 1.0 | PID P38 GAMMA DELTA PATHWAY | Signaling mediated by p38-gamma and p38-delta |
| 0.1 | 3.3 | PID NFKAPPAB CANONICAL PATHWAY | Canonical NF-kappaB pathway |
| 0.1 | 1.9 | SIG CD40PATHWAYMAP | Genes related to CD40 signaling |
| 0.1 | 0.2 | PID NFAT 3PATHWAY | Role of Calcineurin-dependent NFAT signaling in lymphocytes |
| 0.1 | 0.6 | PID RANBP2 PATHWAY | Sumoylation by RanBP2 regulates transcriptional repression |
| 0.1 | 2.1 | SA G1 AND S PHASES | Cdk2, 4, and 6 bind cyclin D in G1, while cdk2/cyclin E promotes the G1/S transition. |
| 0.1 | 2.4 | PID VEGFR1 PATHWAY | VEGFR1 specific signals |
| 0.1 | 1.5 | PID S1P S1P2 PATHWAY | S1P2 pathway |
| 0.1 | 1.1 | PID HDAC CLASSIII PATHWAY | Signaling events mediated by HDAC Class III |
| 0.1 | 1.1 | PID DELTA NP63 PATHWAY | Validated transcriptional targets of deltaNp63 isoforms |
| 0.1 | 1.2 | PID RET PATHWAY | Signaling events regulated by Ret tyrosine kinase |
| 0.1 | 1.0 | PID PRL SIGNALING EVENTS PATHWAY | Signaling events mediated by PRL |
| 0.1 | 1.4 | PID TAP63 PATHWAY | Validated transcriptional targets of TAp63 isoforms |
| 0.1 | 2.1 | PID IL12 STAT4 PATHWAY | IL12 signaling mediated by STAT4 |
| 0.0 | 0.5 | ST TYPE I INTERFERON PATHWAY | Type I Interferon (alpha/beta IFN) Pathway |
| 0.0 | 3.0 | PID AURORA B PATHWAY | Aurora B signaling |
| 0.0 | 6.3 | PID MYC REPRESS PATHWAY | Validated targets of C-MYC transcriptional repression |
| 0.0 | 1.1 | PID CIRCADIAN PATHWAY | Circadian rhythm pathway |
| 0.0 | 1.7 | PID TCR CALCIUM PATHWAY | Calcium signaling in the CD4+ TCR pathway |
| 0.0 | 2.5 | NABA PROTEOGLYCANS | Genes encoding proteoglycans |
| 0.0 | 0.2 | PID EPHA2 FWD PATHWAY | EPHA2 forward signaling |
| 0.0 | 4.0 | PID E2F PATHWAY | E2F transcription factor network |
| 0.0 | 1.4 | PID INTEGRIN1 PATHWAY | Beta1 integrin cell surface interactions |
| 0.0 | 1.7 | PID ERBB4 PATHWAY | ErbB4 signaling events |
| 0.0 | 1.9 | PID SHP2 PATHWAY | SHP2 signaling |
| 0.0 | 2.5 | PID HNF3B PATHWAY | FOXA2 and FOXA3 transcription factor networks |
| 0.0 | 0.0 | PID ERB GENOMIC PATHWAY | Validated nuclear estrogen receptor beta network |
| 0.0 | 2.4 | PID INTEGRIN A4B1 PATHWAY | Alpha4 beta1 integrin signaling events |
| 0.0 | 0.6 | PID AURORA A PATHWAY | Aurora A signaling |
| 0.0 | 1.2 | PID P38 MK2 PATHWAY | p38 signaling mediated by MAPKAP kinases |
| 0.0 | 0.9 | PID HES HEY PATHWAY | Notch-mediated HES/HEY network |
| 0.0 | 3.5 | PID PDGFRB PATHWAY | PDGFR-beta signaling pathway |
| 0.0 | 0.9 | PID NETRIN PATHWAY | Netrin-mediated signaling events |
| 0.0 | 0.4 | PID WNT CANONICAL PATHWAY | Canonical Wnt signaling pathway |
| 0.0 | 1.2 | PID RAC1 REG PATHWAY | Regulation of RAC1 activity |
| 0.0 | 0.9 | PID PTP1B PATHWAY | Signaling events mediated by PTP1B |
| 0.0 | 1.8 | PID REG GR PATHWAY | Glucocorticoid receptor regulatory network |
| 0.0 | 1.1 | PID HIF1A PATHWAY | Hypoxic and oxygen homeostasis regulation of HIF-1-alpha |
| 0.0 | 1.1 | PID P73PATHWAY | p73 transcription factor network |
| 0.0 | 0.9 | PID AR TF PATHWAY | Regulation of Androgen receptor activity |
| 0.0 | 1.7 | PID IL4 2PATHWAY | IL4-mediated signaling events |
| 0.0 | 0.3 | SA B CELL RECEPTOR COMPLEXES | Antigen binding to B cell receptors activates protein tyrosine kinases, such as the Src family, which ultimate activate MAP kinases. |
| 0.0 | 0.8 | PID ARF6 PATHWAY | Arf6 signaling events |
| 0.0 | 0.7 | PID CONE PATHWAY | Visual signal transduction: Cones |
| 0.0 | 1.2 | PID HEDGEHOG GLI PATHWAY | Hedgehog signaling events mediated by Gli proteins |
| 0.0 | 1.5 | PID HNF3A PATHWAY | FOXA1 transcription factor network |
| 0.0 | 0.1 | PID ERBB1 RECEPTOR PROXIMAL PATHWAY | EGF receptor (ErbB1) signaling pathway |
| 0.0 | 1.2 | PID CDC42 REG PATHWAY | Regulation of CDC42 activity |
| 0.0 | 0.5 | PID HIV NEF PATHWAY | HIV-1 Nef: Negative effector of Fas and TNF-alpha |
| 0.0 | 0.5 | PID LYSOPHOSPHOLIPID PATHWAY | LPA receptor mediated events |
| 0.0 | 0.2 | PID CXCR4 PATHWAY | CXCR4-mediated signaling events |
| 0.0 | 3.2 | NABA ECM GLYCOPROTEINS | Genes encoding structural ECM glycoproteins |
| 0.0 | 0.1 | PID ALK2 PATHWAY | ALK2 signaling events |
| 0.0 | 0.2 | PID ERBB2 ERBB3 PATHWAY | ErbB2/ErbB3 signaling events |
| 0.0 | 0.4 | PID ATR PATHWAY | ATR signaling pathway |
| 0.0 | 0.0 | SIG PIP3 SIGNALING IN CARDIAC MYOCTES | Genes related to PIP3 signaling in cardiac myocytes |
| 0.0 | 0.3 | PID NFAT TFPATHWAY | Calcineurin-regulated NFAT-dependent transcription in lymphocytes |
| 0.0 | 0.1 | PID NECTIN PATHWAY | Nectin adhesion pathway |
Gene overrepresentation in C2:CP:REACTOME category:
| Log-likelihood per target | Total log-likelihood | Term | Description |
|---|---|---|---|
| 0.3 | 5.8 | REACTOME IL 7 SIGNALING | Genes involved in Interleukin-7 signaling |
| 0.3 | 7.9 | REACTOME BRANCHED CHAIN AMINO ACID CATABOLISM | Genes involved in Branched-chain amino acid catabolism |
| 0.3 | 3.4 | REACTOME REMOVAL OF THE FLAP INTERMEDIATE FROM THE C STRAND | Genes involved in Removal of the Flap Intermediate from the C-strand |
| 0.3 | 8.0 | REACTOME AMINO ACID SYNTHESIS AND INTERCONVERSION TRANSAMINATION | Genes involved in Amino acid synthesis and interconversion (transamination) |
| 0.2 | 4.0 | REACTOME PLATELET ADHESION TO EXPOSED COLLAGEN | Genes involved in Platelet Adhesion to exposed collagen |
| 0.2 | 4.2 | REACTOME THE NLRP3 INFLAMMASOME | Genes involved in The NLRP3 inflammasome |
| 0.2 | 5.9 | REACTOME CHOLESTEROL BIOSYNTHESIS | Genes involved in Cholesterol biosynthesis |
| 0.2 | 0.2 | REACTOME GLUTAMATE NEUROTRANSMITTER RELEASE CYCLE | Genes involved in Glutamate Neurotransmitter Release Cycle |
| 0.2 | 1.6 | REACTOME SIGNALING BY EGFR IN CANCER | Genes involved in Signaling by EGFR in Cancer |
| 0.2 | 6.3 | REACTOME INHIBITION OF THE PROTEOLYTIC ACTIVITY OF APC C REQUIRED FOR THE ONSET OF ANAPHASE BY MITOTIC SPINDLE CHECKPOINT COMPONENTS | Genes involved in Inhibition of the proteolytic activity of APC/C required for the onset of anaphase by mitotic spindle checkpoint components |
| 0.2 | 3.9 | REACTOME GLUCAGON SIGNALING IN METABOLIC REGULATION | Genes involved in Glucagon signaling in metabolic regulation |
| 0.2 | 1.8 | REACTOME PROSTANOID LIGAND RECEPTORS | Genes involved in Prostanoid ligand receptors |
| 0.2 | 4.9 | REACTOME BOTULINUM NEUROTOXICITY | Genes involved in Botulinum neurotoxicity |
| 0.2 | 4.2 | REACTOME POST CHAPERONIN TUBULIN FOLDING PATHWAY | Genes involved in Post-chaperonin tubulin folding pathway |
| 0.2 | 2.8 | REACTOME IL 6 SIGNALING | Genes involved in Interleukin-6 signaling |
| 0.1 | 9.7 | REACTOME G ALPHA Z SIGNALLING EVENTS | Genes involved in G alpha (z) signalling events |
| 0.1 | 3.4 | REACTOME THROMBIN SIGNALLING THROUGH PROTEINASE ACTIVATED RECEPTORS PARS | Genes involved in Thrombin signalling through proteinase activated receptors (PARs) |
| 0.1 | 1.8 | REACTOME VITAMIN B5 PANTOTHENATE METABOLISM | Genes involved in Vitamin B5 (pantothenate) metabolism |
| 0.1 | 1.5 | REACTOME ERKS ARE INACTIVATED | Genes involved in ERKs are inactivated |
| 0.1 | 2.4 | REACTOME MRNA DECAY BY 5 TO 3 EXORIBONUCLEASE | Genes involved in mRNA Decay by 5' to 3' Exoribonuclease |
| 0.1 | 5.6 | REACTOME CREB PHOSPHORYLATION THROUGH THE ACTIVATION OF RAS | Genes involved in CREB phosphorylation through the activation of Ras |
| 0.1 | 2.7 | REACTOME FORMATION OF ATP BY CHEMIOSMOTIC COUPLING | Genes involved in Formation of ATP by chemiosmotic coupling |
| 0.1 | 1.6 | REACTOME INFLAMMASOMES | Genes involved in Inflammasomes |
| 0.1 | 1.5 | REACTOME TRAF6 MEDIATED IRF7 ACTIVATION IN TLR7 8 OR 9 SIGNALING | Genes involved in TRAF6 mediated IRF7 activation in TLR7/8 or 9 signaling |
| 0.1 | 2.1 | REACTOME G2 M DNA DAMAGE CHECKPOINT | Genes involved in G2/M DNA damage checkpoint |
| 0.1 | 1.9 | REACTOME MITOCHONDRIAL FATTY ACID BETA OXIDATION | Genes involved in Mitochondrial Fatty Acid Beta-Oxidation |
| 0.1 | 5.3 | REACTOME NEGATIVE REGULATORS OF RIG I MDA5 SIGNALING | Genes involved in Negative regulators of RIG-I/MDA5 signaling |
| 0.1 | 1.3 | REACTOME CDC6 ASSOCIATION WITH THE ORC ORIGIN COMPLEX | Genes involved in CDC6 association with the ORC:origin complex |
| 0.1 | 3.8 | REACTOME ANTIGEN ACTIVATES B CELL RECEPTOR LEADING TO GENERATION OF SECOND MESSENGERS | Genes involved in Antigen Activates B Cell Receptor Leading to Generation of Second Messengers |
| 0.1 | 0.5 | REACTOME APC CDC20 MEDIATED DEGRADATION OF NEK2A | Genes involved in APC-Cdc20 mediated degradation of Nek2A |
| 0.1 | 2.0 | REACTOME RETROGRADE NEUROTROPHIN SIGNALLING | Genes involved in Retrograde neurotrophin signalling |
| 0.1 | 0.9 | REACTOME REGULATION OF ORNITHINE DECARBOXYLASE ODC | Genes involved in Regulation of ornithine decarboxylase (ODC) |
| 0.1 | 0.7 | REACTOME ACTIVATED AMPK STIMULATES FATTY ACID OXIDATION IN MUSCLE | Genes involved in Activated AMPK stimulates fatty-acid oxidation in muscle |
| 0.1 | 0.9 | REACTOME COPI MEDIATED TRANSPORT | Genes involved in COPI Mediated Transport |
| 0.1 | 1.0 | REACTOME SYNTHESIS OF PIPS AT THE LATE ENDOSOME MEMBRANE | Genes involved in Synthesis of PIPs at the late endosome membrane |
| 0.1 | 1.2 | REACTOME ROLE OF DCC IN REGULATING APOPTOSIS | Genes involved in Role of DCC in regulating apoptosis |
| 0.1 | 0.8 | REACTOME P53 DEPENDENT G1 DNA DAMAGE RESPONSE | Genes involved in p53-Dependent G1 DNA Damage Response |
| 0.1 | 0.5 | REACTOME REGULATION OF INSULIN SECRETION BY ACETYLCHOLINE | Genes involved in Regulation of Insulin Secretion by Acetylcholine |
| 0.1 | 1.6 | REACTOME APOPTOSIS INDUCED DNA FRAGMENTATION | Genes involved in Apoptosis induced DNA fragmentation |
| 0.1 | 1.6 | REACTOME ALPHA LINOLENIC ACID ALA METABOLISM | Genes involved in alpha-linolenic acid (ALA) metabolism |
| 0.1 | 4.2 | REACTOME NETRIN1 SIGNALING | Genes involved in Netrin-1 signaling |
| 0.1 | 3.4 | REACTOME A TETRASACCHARIDE LINKER SEQUENCE IS REQUIRED FOR GAG SYNTHESIS | Genes involved in A tetrasaccharide linker sequence is required for GAG synthesis |
| 0.1 | 1.8 | REACTOME SYNTHESIS OF PE | Genes involved in Synthesis of PE |
| 0.1 | 6.5 | REACTOME G ALPHA1213 SIGNALLING EVENTS | Genes involved in G alpha (12/13) signalling events |
| 0.1 | 0.9 | REACTOME DEPOSITION OF NEW CENPA CONTAINING NUCLEOSOMES AT THE CENTROMERE | Genes involved in Deposition of New CENPA-containing Nucleosomes at the Centromere |
| 0.1 | 1.1 | REACTOME ACTIVATION OF THE AP1 FAMILY OF TRANSCRIPTION FACTORS | Genes involved in Activation of the AP-1 family of transcription factors |
| 0.1 | 0.3 | REACTOME NRAGE SIGNALS DEATH THROUGH JNK | Genes involved in NRAGE signals death through JNK |
| 0.1 | 6.3 | REACTOME RESPIRATORY ELECTRON TRANSPORT ATP SYNTHESIS BY CHEMIOSMOTIC COUPLING AND HEAT PRODUCTION BY UNCOUPLING PROTEINS | Genes involved in Respiratory electron transport, ATP synthesis by chemiosmotic coupling, and heat production by uncoupling proteins. |
| 0.1 | 2.4 | REACTOME KINESINS | Genes involved in Kinesins |
| 0.1 | 0.5 | REACTOME SYNTHESIS OF PIPS AT THE EARLY ENDOSOME MEMBRANE | Genes involved in Synthesis of PIPs at the early endosome membrane |
| 0.1 | 0.4 | REACTOME RECYCLING PATHWAY OF L1 | Genes involved in Recycling pathway of L1 |
| 0.1 | 0.2 | REACTOME INTERACTIONS OF VPR WITH HOST CELLULAR PROTEINS | Genes involved in Interactions of Vpr with host cellular proteins |
| 0.1 | 0.6 | REACTOME SCF BETA TRCP MEDIATED DEGRADATION OF EMI1 | Genes involved in SCF-beta-TrCP mediated degradation of Emi1 |
| 0.1 | 0.8 | REACTOME TETRAHYDROBIOPTERIN BH4 SYNTHESIS RECYCLING SALVAGE AND REGULATION | Genes involved in Tetrahydrobiopterin (BH4) synthesis, recycling, salvage and regulation |
| 0.1 | 0.1 | REACTOME CIRCADIAN REPRESSION OF EXPRESSION BY REV ERBA | Genes involved in Circadian Repression of Expression by REV-ERBA |
| 0.1 | 1.9 | REACTOME ENERGY DEPENDENT REGULATION OF MTOR BY LKB1 AMPK | Genes involved in Energy dependent regulation of mTOR by LKB1-AMPK |
| 0.1 | 0.6 | REACTOME SIGNAL ATTENUATION | Genes involved in Signal attenuation |
| 0.1 | 6.2 | REACTOME FACTORS INVOLVED IN MEGAKARYOCYTE DEVELOPMENT AND PLATELET PRODUCTION | Genes involved in Factors involved in megakaryocyte development and platelet production |
| 0.1 | 4.4 | REACTOME LOSS OF NLP FROM MITOTIC CENTROSOMES | Genes involved in Loss of Nlp from mitotic centrosomes |
| 0.1 | 7.8 | REACTOME TRANSPORT OF INORGANIC CATIONS ANIONS AND AMINO ACIDS OLIGOPEPTIDES | Genes involved in Transport of inorganic cations/anions and amino acids/oligopeptides |
| 0.1 | 1.1 | REACTOME CITRIC ACID CYCLE TCA CYCLE | Genes involved in Citric acid cycle (TCA cycle) |
| 0.1 | 1.4 | REACTOME SYNTHESIS OF PIPS AT THE PLASMA MEMBRANE | Genes involved in Synthesis of PIPs at the plasma membrane |
| 0.0 | 1.3 | REACTOME DARPP 32 EVENTS | Genes involved in DARPP-32 events |
| 0.0 | 1.7 | REACTOME CASPASE MEDIATED CLEAVAGE OF CYTOSKELETAL PROTEINS | Genes involved in Caspase-mediated cleavage of cytoskeletal proteins |
| 0.0 | 0.5 | REACTOME DESTABILIZATION OF MRNA BY KSRP | Genes involved in Destabilization of mRNA by KSRP |
| 0.0 | 0.8 | REACTOME BASE FREE SUGAR PHOSPHATE REMOVAL VIA THE SINGLE NUCLEOTIDE REPLACEMENT PATHWAY | Genes involved in Base-free sugar-phosphate removal via the single-nucleotide replacement pathway |
| 0.0 | 0.6 | REACTOME RNA POL III CHAIN ELONGATION | Genes involved in RNA Polymerase III Chain Elongation |
| 0.0 | 2.5 | REACTOME MRNA SPLICING MINOR PATHWAY | Genes involved in mRNA Splicing - Minor Pathway |
| 0.0 | 1.3 | REACTOME REGULATION OF HYPOXIA INDUCIBLE FACTOR HIF BY OXYGEN | Genes involved in Regulation of Hypoxia-inducible Factor (HIF) by Oxygen |
| 0.0 | 1.0 | REACTOME STEROID HORMONES | Genes involved in Steroid hormones |
| 0.0 | 0.9 | REACTOME ORGANIC CATION ANION ZWITTERION TRANSPORT | Genes involved in Organic cation/anion/zwitterion transport |
| 0.0 | 0.5 | REACTOME NOTCH HLH TRANSCRIPTION PATHWAY | Genes involved in Notch-HLH transcription pathway |
| 0.0 | 0.7 | REACTOME GABA SYNTHESIS RELEASE REUPTAKE AND DEGRADATION | Genes involved in GABA synthesis, release, reuptake and degradation |
| 0.0 | 0.3 | REACTOME SIGNAL REGULATORY PROTEIN SIRP FAMILY INTERACTIONS | Genes involved in Signal regulatory protein (SIRP) family interactions |
| 0.0 | 1.1 | REACTOME LYSOSOME VESICLE BIOGENESIS | Genes involved in Lysosome Vesicle Biogenesis |
| 0.0 | 0.5 | REACTOME CELL DEATH SIGNALLING VIA NRAGE NRIF AND NADE | Genes involved in Cell death signalling via NRAGE, NRIF and NADE |
| 0.0 | 0.7 | REACTOME SEMA4D INDUCED CELL MIGRATION AND GROWTH CONE COLLAPSE | Genes involved in Sema4D induced cell migration and growth-cone collapse |
| 0.0 | 0.6 | REACTOME INHIBITION OF VOLTAGE GATED CA2 CHANNELS VIA GBETA GAMMA SUBUNITS | Genes involved in Inhibition of voltage gated Ca2+ channels via Gbeta/gamma subunits |
| 0.0 | 0.5 | REACTOME CTNNB1 PHOSPHORYLATION CASCADE | Genes involved in Beta-catenin phosphorylation cascade |
| 0.0 | 0.1 | REACTOME SPRY REGULATION OF FGF SIGNALING | Genes involved in Spry regulation of FGF signaling |
| 0.0 | 0.3 | REACTOME APOBEC3G MEDIATED RESISTANCE TO HIV1 INFECTION | Genes involved in APOBEC3G mediated resistance to HIV-1 infection |
| 0.0 | 0.5 | REACTOME DESTABILIZATION OF MRNA BY BRF1 | Genes involved in Destabilization of mRNA by Butyrate Response Factor 1 (BRF1) |
| 0.0 | 0.8 | REACTOME RNA POL I TRANSCRIPTION TERMINATION | Genes involved in RNA Polymerase I Transcription Termination |
| 0.0 | 1.9 | REACTOME APC C CDC20 MEDIATED DEGRADATION OF MITOTIC PROTEINS | Genes involved in APC/C:Cdc20 mediated degradation of mitotic proteins |
| 0.0 | 0.5 | REACTOME SIGNALING BY FGFR1 FUSION MUTANTS | Genes involved in Signaling by FGFR1 fusion mutants |
| 0.0 | 0.4 | REACTOME KERATAN SULFATE DEGRADATION | Genes involved in Keratan sulfate degradation |
| 0.0 | 0.7 | REACTOME DOWNREGULATION OF SMAD2 3 SMAD4 TRANSCRIPTIONAL ACTIVITY | Genes involved in Downregulation of SMAD2/3:SMAD4 transcriptional activity |
| 0.0 | 1.4 | REACTOME TRANS GOLGI NETWORK VESICLE BUDDING | Genes involved in trans-Golgi Network Vesicle Budding |
| 0.0 | 2.3 | REACTOME MRNA SPLICING | Genes involved in mRNA Splicing |
| 0.0 | 0.7 | REACTOME G1 PHASE | Genes involved in G1 Phase |
| 0.0 | 1.4 | REACTOME TRANSPORT TO THE GOLGI AND SUBSEQUENT MODIFICATION | Genes involved in Transport to the Golgi and subsequent modification |
| 0.0 | 0.5 | REACTOME FANCONI ANEMIA PATHWAY | Genes involved in Fanconi Anemia pathway |
| 0.0 | 1.4 | REACTOME NCAM1 INTERACTIONS | Genes involved in NCAM1 interactions |
| 0.0 | 0.6 | REACTOME INSULIN SYNTHESIS AND PROCESSING | Genes involved in Insulin Synthesis and Processing |
| 0.0 | 0.2 | REACTOME PRE NOTCH TRANSCRIPTION AND TRANSLATION | Genes involved in Pre-NOTCH Transcription and Translation |
| 0.0 | 0.8 | REACTOME SYNTHESIS AND INTERCONVERSION OF NUCLEOTIDE DI AND TRIPHOSPHATES | Genes involved in Synthesis and interconversion of nucleotide di- and triphosphates |
| 0.0 | 9.4 | REACTOME GENERIC TRANSCRIPTION PATHWAY | Genes involved in Generic Transcription Pathway |
| 0.0 | 0.8 | REACTOME PYRIMIDINE METABOLISM | Genes involved in Pyrimidine metabolism |
| 0.0 | 0.3 | REACTOME GLUCAGON TYPE LIGAND RECEPTORS | Genes involved in Glucagon-type ligand receptors |
| 0.0 | 0.2 | REACTOME PURINE CATABOLISM | Genes involved in Purine catabolism |
| 0.0 | 0.2 | REACTOME GRB2 SOS PROVIDES LINKAGE TO MAPK SIGNALING FOR INTERGRINS | Genes involved in GRB2:SOS provides linkage to MAPK signaling for Intergrins |
| 0.0 | 2.4 | REACTOME SIGNALING BY RHO GTPASES | Genes involved in Signaling by Rho GTPases |
| 0.0 | 0.2 | REACTOME FORMATION OF TRANSCRIPTION COUPLED NER TC NER REPAIR COMPLEX | Genes involved in Formation of transcription-coupled NER (TC-NER) repair complex |
| 0.0 | 0.3 | REACTOME P38MAPK EVENTS | Genes involved in p38MAPK events |
| 0.0 | 0.4 | REACTOME CELL EXTRACELLULAR MATRIX INTERACTIONS | Genes involved in Cell-extracellular matrix interactions |
| 0.0 | 0.5 | REACTOME INSULIN RECEPTOR RECYCLING | Genes involved in Insulin receptor recycling |
| 0.0 | 0.2 | REACTOME CHONDROITIN SULFATE BIOSYNTHESIS | Genes involved in Chondroitin sulfate biosynthesis |
| 0.0 | 2.2 | REACTOME METABOLISM OF AMINO ACIDS AND DERIVATIVES | Genes involved in Metabolism of amino acids and derivatives |
| 0.0 | 2.3 | REACTOME NONSENSE MEDIATED DECAY ENHANCED BY THE EXON JUNCTION COMPLEX | Genes involved in Nonsense Mediated Decay Enhanced by the Exon Junction Complex |
| 0.0 | 0.5 | REACTOME LIGAND GATED ION CHANNEL TRANSPORT | Genes involved in Ligand-gated ion channel transport |
| 0.0 | 0.6 | REACTOME PROTEIN FOLDING | Genes involved in Protein folding |
| 0.0 | 0.2 | REACTOME FORMATION OF THE TERNARY COMPLEX AND SUBSEQUENTLY THE 43S COMPLEX | Genes involved in Formation of the ternary complex, and subsequently, the 43S complex |