Project
Epithelial-Mesenchymal Transition, human (Scheel, 2011)
Navigation
Downloads
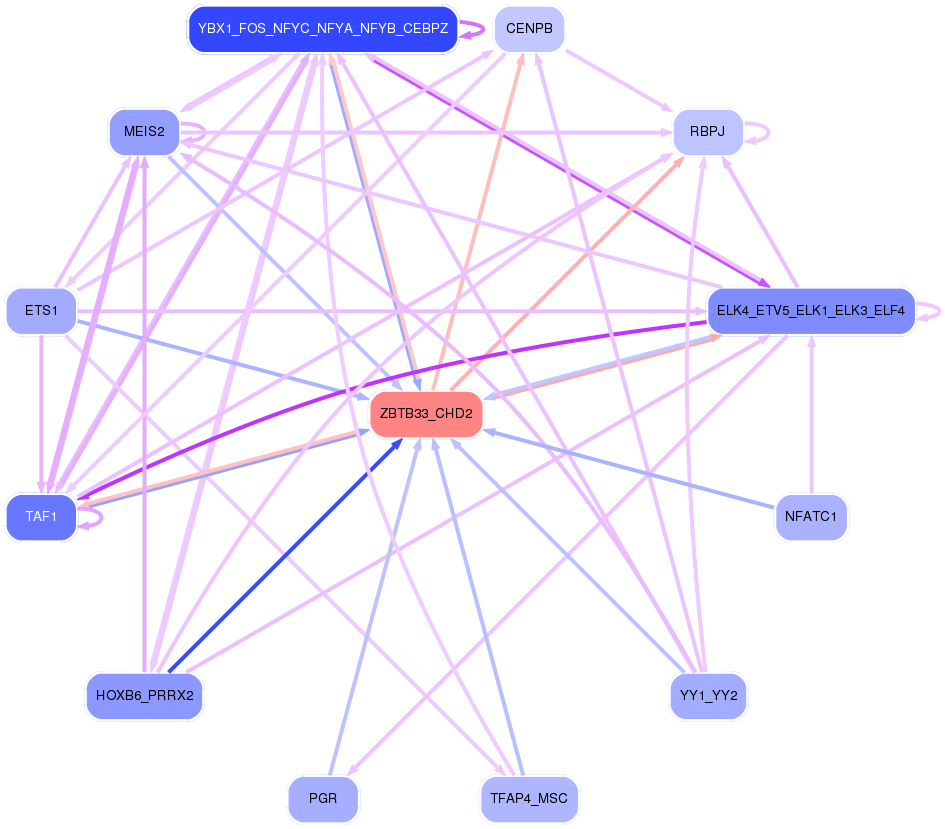
Results for ZBTB33_CHD2
Z-value: 2.04
Motif logo
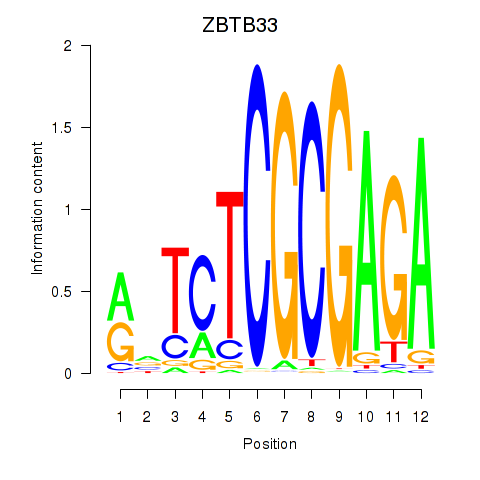
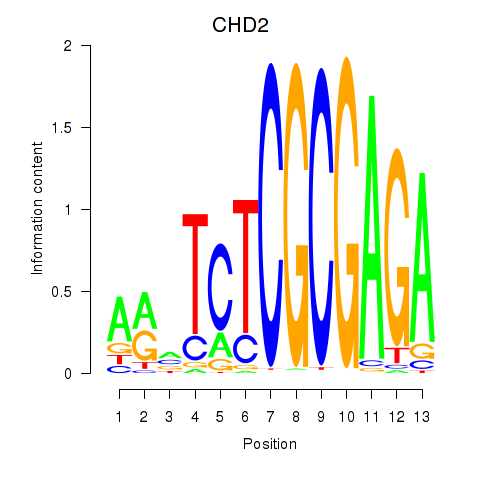
Transcription factors associated with ZBTB33_CHD2
| Gene Symbol | Gene ID | Gene Info |
|---|---|---|
|
ZBTB33
|
ENSG00000177485.6 | ZBTB33 |
|
CHD2
|
ENSG00000173575.14 | CHD2 |
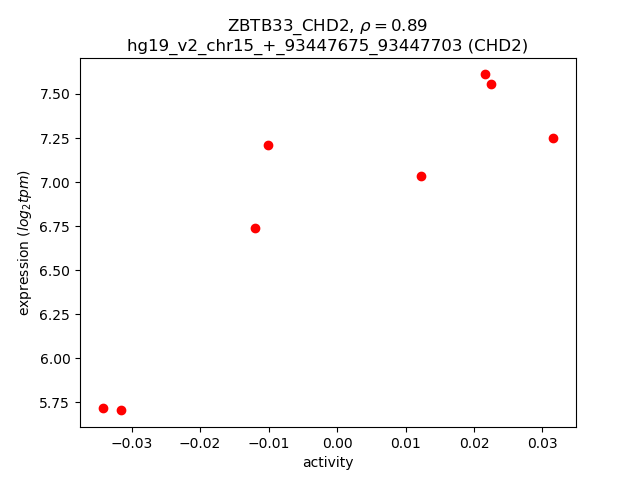
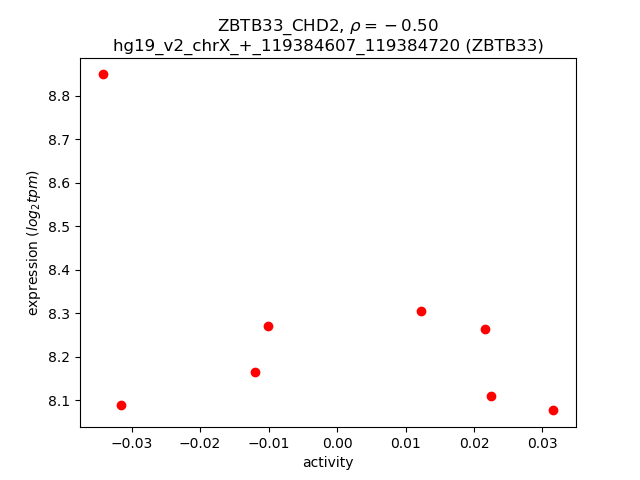
Activity-expression correlation:
| Gene | Promoter | Pearson corr. coef. | P-value | Plot |
|---|---|---|---|---|
| CHD2 | hg19_v2_chr15_+_93447675_93447703 | 0.89 | 3.1e-03 | Click! |
| ZBTB33 | hg19_v2_chrX_+_119384607_119384720 | -0.50 | 2.1e-01 | Click! |
Activity profile of ZBTB33_CHD2 motif
Sorted Z-values of ZBTB33_CHD2 motif
Network of associatons between targets according to the STRING database.

First level regulatory network of ZBTB33_CHD2
| Promoter | Score | Transcript | Gene | Gene Info |
|---|---|---|---|---|
| chr15_-_48937982 | 2.08 |
ENST00000316623.5 |
FBN1 |
fibrillin 1 |
| chr3_+_42642106 | 1.64 |
ENST00000232978.8 |
NKTR |
natural killer-tumor recognition sequence |
| chr5_+_169010638 | 1.45 |
ENST00000265295.4 ENST00000506574.1 ENST00000515224.1 ENST00000508247.1 ENST00000513941.1 |
SPDL1 |
spindle apparatus coiled-coil protein 1 |
| chr2_-_20101701 | 1.18 |
ENST00000402414.1 ENST00000333610.3 |
TTC32 |
tetratricopeptide repeat domain 32 |
| chr8_+_16884740 | 1.15 |
ENST00000318063.5 |
MICU3 |
mitochondrial calcium uptake family, member 3 |
| chr2_-_20101385 | 1.13 |
ENST00000431392.1 |
TTC32 |
tetratricopeptide repeat domain 32 |
| chr14_-_92413727 | 1.13 |
ENST00000267620.10 |
FBLN5 |
fibulin 5 |
| chr13_+_115047097 | 1.12 |
ENST00000351487.5 |
UPF3A |
UPF3 regulator of nonsense transcripts homolog A (yeast) |
| chr14_+_104394770 | 1.10 |
ENST00000409874.4 ENST00000339063.5 |
TDRD9 |
tudor domain containing 9 |
| chr15_+_78730622 | 1.07 |
ENST00000560440.1 |
IREB2 |
iron-responsive element binding protein 2 |
| chr17_-_4167142 | 1.03 |
ENST00000570535.1 ENST00000574367.1 ENST00000341657.4 ENST00000433651.1 |
ANKFY1 |
ankyrin repeat and FYVE domain containing 1 |
| chr3_-_145878954 | 0.90 |
ENST00000282903.5 ENST00000360060.3 |
PLOD2 |
procollagen-lysine, 2-oxoglutarate 5-dioxygenase 2 |
| chr1_-_92371839 | 0.89 |
ENST00000370399.2 |
TGFBR3 |
transforming growth factor, beta receptor III |
| chr7_-_2272566 | 0.83 |
ENST00000402746.1 ENST00000265854.7 ENST00000429779.1 ENST00000399654.2 |
MAD1L1 |
MAD1 mitotic arrest deficient-like 1 (yeast) |
| chr15_+_22833482 | 0.81 |
ENST00000453949.2 |
TUBGCP5 |
tubulin, gamma complex associated protein 5 |
| chr2_-_85555355 | 0.78 |
ENST00000282120.2 ENST00000398263.2 |
TGOLN2 |
trans-golgi network protein 2 |
| chr13_+_115047053 | 0.76 |
ENST00000375299.3 |
UPF3A |
UPF3 regulator of nonsense transcripts homolog A (yeast) |
| chr21_+_47518011 | 0.75 |
ENST00000300527.4 ENST00000357838.4 ENST00000310645.5 |
COL6A2 |
collagen, type VI, alpha 2 |
| chr1_+_179923873 | 0.74 |
ENST00000367607.3 ENST00000491495.2 |
CEP350 |
centrosomal protein 350kDa |
| chr1_+_26146397 | 0.74 |
ENST00000374303.2 ENST00000533762.1 ENST00000529116.1 ENST00000474295.1 ENST00000488327.2 ENST00000472643.1 ENST00000526894.1 ENST00000524618.1 ENST00000374307.5 |
MTFR1L |
mitochondrial fission regulator 1-like |
| chr2_-_85555086 | 0.72 |
ENST00000444342.2 ENST00000409232.3 ENST00000409015.1 |
TGOLN2 |
trans-golgi network protein 2 |
| chr2_-_85555385 | 0.70 |
ENST00000377386.3 |
TGOLN2 |
trans-golgi network protein 2 |
| chr10_+_124768482 | 0.70 |
ENST00000368869.4 ENST00000358776.4 |
ACADSB |
acyl-CoA dehydrogenase, short/branched chain |
| chr20_-_61569227 | 0.68 |
ENST00000266070.4 ENST00000395335.2 ENST00000266071.5 |
DIDO1 |
death inducer-obliterator 1 |
| chr4_+_17812525 | 0.67 |
ENST00000251496.2 |
NCAPG |
non-SMC condensin I complex, subunit G |
| chr1_+_232940643 | 0.66 |
ENST00000418460.1 |
MAP10 |
microtubule-associated protein 10 |
| chr1_+_26146674 | 0.64 |
ENST00000525713.1 ENST00000374301.3 |
MTFR1L |
mitochondrial fission regulator 1-like |
| chr17_-_53046058 | 0.63 |
ENST00000571584.1 ENST00000299335.3 |
COX11 |
cytochrome c oxidase assembly homolog 11 (yeast) |
| chr5_+_118407053 | 0.62 |
ENST00000311085.8 ENST00000539542.1 |
DMXL1 |
Dmx-like 1 |
| chr4_-_17812309 | 0.61 |
ENST00000382247.1 ENST00000536863.1 |
DCAF16 |
DDB1 and CUL4 associated factor 16 |
| chr3_-_185826286 | 0.60 |
ENST00000537818.1 ENST00000422039.1 ENST00000434744.1 |
ETV5 |
ets variant 5 |
| chr7_-_128171123 | 0.59 |
ENST00000608477.1 |
RP11-212P7.2 |
RP11-212P7.2 |
| chrX_+_152760397 | 0.58 |
ENST00000331595.4 ENST00000431891.1 |
BGN |
biglycan |
| chr15_+_22833395 | 0.57 |
ENST00000283645.4 |
TUBGCP5 |
tubulin, gamma complex associated protein 5 |
| chr19_+_12273866 | 0.57 |
ENST00000425827.1 ENST00000439995.1 ENST00000343979.4 ENST00000398616.2 ENST00000418338.1 |
ZNF136 |
zinc finger protein 136 |
| chr5_+_176449684 | 0.57 |
ENST00000506693.1 ENST00000358149.3 ENST00000512315.1 ENST00000503425.1 |
ZNF346 |
zinc finger protein 346 |
| chr17_+_53046096 | 0.57 |
ENST00000376352.2 ENST00000299341.4 ENST00000405898.1 ENST00000434978.2 ENST00000398391.2 |
STXBP4 |
syntaxin binding protein 4 |
| chr16_-_25269134 | 0.56 |
ENST00000328086.7 |
ZKSCAN2 |
zinc finger with KRAB and SCAN domains 2 |
| chr10_+_89419370 | 0.55 |
ENST00000361175.4 ENST00000456849.1 |
PAPSS2 |
3'-phosphoadenosine 5'-phosphosulfate synthase 2 |
| chr6_+_116575329 | 0.53 |
ENST00000430252.2 ENST00000540275.1 ENST00000448740.2 |
DSE RP3-486I3.7 |
dermatan sulfate epimerase RP3-486I3.7 |
| chr4_-_103749179 | 0.52 |
ENST00000502690.1 |
UBE2D3 |
ubiquitin-conjugating enzyme E2D 3 |
| chr15_-_64126084 | 0.52 |
ENST00000560316.1 ENST00000443617.2 ENST00000560462.1 ENST00000558532.1 ENST00000561400.1 |
HERC1 |
HECT and RLD domain containing E3 ubiquitin protein ligase family member 1 |
| chr15_-_48470544 | 0.51 |
ENST00000267836.6 |
MYEF2 |
myelin expression factor 2 |
| chr12_+_117176113 | 0.50 |
ENST00000319176.7 |
RNFT2 |
ring finger protein, transmembrane 2 |
| chr6_-_116575226 | 0.50 |
ENST00000420283.1 |
TSPYL4 |
TSPY-like 4 |
| chr3_-_108308241 | 0.50 |
ENST00000295746.8 |
KIAA1524 |
KIAA1524 |
| chr5_+_134181625 | 0.50 |
ENST00000394976.3 |
C5orf24 |
chromosome 5 open reading frame 24 |
| chr13_-_21750659 | 0.50 |
ENST00000400018.3 ENST00000314759.5 |
SKA3 |
spindle and kinetochore associated complex subunit 3 |
| chr20_-_34330129 | 0.49 |
ENST00000397370.3 ENST00000528062.3 ENST00000407261.4 ENST00000374038.3 ENST00000361162.6 |
RBM39 |
RNA binding motif protein 39 |
| chr3_+_32280159 | 0.48 |
ENST00000458535.2 ENST00000307526.3 |
CMTM8 |
CKLF-like MARVEL transmembrane domain containing 8 |
| chr16_+_2014993 | 0.48 |
ENST00000564014.1 |
SNHG9 |
small nucleolar RNA host gene 9 (non-protein coding) |
| chr16_-_67867749 | 0.47 |
ENST00000566758.1 ENST00000445712.2 ENST00000219172.3 ENST00000564817.1 |
CENPT |
centromere protein T |
| chr4_+_26321284 | 0.47 |
ENST00000506956.1 ENST00000512671.1 ENST00000345843.3 ENST00000342295.1 |
RBPJ |
recombination signal binding protein for immunoglobulin kappa J region |
| chr9_+_6413317 | 0.47 |
ENST00000276893.5 ENST00000381373.3 |
UHRF2 |
ubiquitin-like with PHD and ring finger domains 2, E3 ubiquitin protein ligase |
| chr13_+_24153488 | 0.47 |
ENST00000382258.4 ENST00000382263.3 |
TNFRSF19 |
tumor necrosis factor receptor superfamily, member 19 |
| chr12_+_117176090 | 0.46 |
ENST00000257575.4 ENST00000407967.3 ENST00000392549.2 |
RNFT2 |
ring finger protein, transmembrane 2 |
| chr1_-_6614565 | 0.46 |
ENST00000377705.5 |
NOL9 |
nucleolar protein 9 |
| chr8_+_104383728 | 0.46 |
ENST00000330295.5 |
CTHRC1 |
collagen triple helix repeat containing 1 |
| chr20_+_30946106 | 0.45 |
ENST00000375687.4 ENST00000542461.1 |
ASXL1 |
additional sex combs like 1 (Drosophila) |
| chr5_+_134181755 | 0.44 |
ENST00000504727.1 ENST00000435259.2 ENST00000508791.1 |
C5orf24 |
chromosome 5 open reading frame 24 |
| chr13_+_42846272 | 0.44 |
ENST00000025301.2 |
AKAP11 |
A kinase (PRKA) anchor protein 11 |
| chr7_+_120702819 | 0.44 |
ENST00000423795.1 |
CPED1 |
cadherin-like and PC-esterase domain containing 1 |
| chr13_+_76210448 | 0.42 |
ENST00000377499.5 |
LMO7 |
LIM domain 7 |
| chr2_+_170683942 | 0.42 |
ENST00000272793.5 |
UBR3 |
ubiquitin protein ligase E3 component n-recognin 3 (putative) |
| chr16_+_89724434 | 0.41 |
ENST00000568929.1 |
SPATA33 |
spermatogenesis associated 33 |
| chr6_+_35995531 | 0.40 |
ENST00000229794.4 |
MAPK14 |
mitogen-activated protein kinase 14 |
| chr17_-_37607497 | 0.40 |
ENST00000394287.3 ENST00000300651.6 |
MED1 |
mediator complex subunit 1 |
| chr17_+_27717415 | 0.40 |
ENST00000583121.1 ENST00000261716.3 |
TAOK1 |
TAO kinase 1 |
| chr8_+_37963011 | 0.40 |
ENST00000250635.7 ENST00000517719.1 ENST00000545394.1 |
ASH2L |
ash2 (absent, small, or homeotic)-like (Drosophila) |
| chr4_-_103748880 | 0.40 |
ENST00000453744.2 ENST00000349311.8 |
UBE2D3 |
ubiquitin-conjugating enzyme E2D 3 |
| chr12_-_118406777 | 0.40 |
ENST00000339824.5 |
KSR2 |
kinase suppressor of ras 2 |
| chr2_+_170683979 | 0.39 |
ENST00000418381.1 |
UBR3 |
ubiquitin protein ligase E3 component n-recognin 3 (putative) |
| chr1_-_70820357 | 0.39 |
ENST00000370944.4 ENST00000262346.6 |
ANKRD13C |
ankyrin repeat domain 13C |
| chr5_+_138940742 | 0.39 |
ENST00000398733.3 ENST00000253815.2 ENST00000505007.1 |
UBE2D2 |
ubiquitin-conjugating enzyme E2D 2 |
| chr6_+_35995552 | 0.38 |
ENST00000468133.1 |
MAPK14 |
mitogen-activated protein kinase 14 |
| chr5_-_140700322 | 0.38 |
ENST00000313368.5 |
TAF7 |
TAF7 RNA polymerase II, TATA box binding protein (TBP)-associated factor, 55kDa |
| chr3_-_185826855 | 0.38 |
ENST00000306376.5 |
ETV5 |
ets variant 5 |
| chr8_+_37963311 | 0.37 |
ENST00000428278.2 ENST00000521652.1 |
ASH2L |
ash2 (absent, small, or homeotic)-like (Drosophila) |
| chr22_+_45809560 | 0.37 |
ENST00000342894.3 ENST00000538017.1 |
RIBC2 |
RIB43A domain with coiled-coils 2 |
| chr8_-_62627057 | 0.37 |
ENST00000519234.1 ENST00000379449.6 ENST00000379454.4 ENST00000518068.1 ENST00000517856.1 ENST00000356457.5 |
ASPH |
aspartate beta-hydroxylase |
| chr19_-_37263693 | 0.37 |
ENST00000591344.1 |
ZNF850 |
zinc finger protein 850 |
| chr21_+_45285050 | 0.37 |
ENST00000291572.8 |
AGPAT3 |
1-acylglycerol-3-phosphate O-acyltransferase 3 |
| chr16_+_89724263 | 0.36 |
ENST00000564238.1 |
SPATA33 |
spermatogenesis associated 33 |
| chr4_-_178363581 | 0.36 |
ENST00000264595.2 |
AGA |
aspartylglucosaminidase |
| chr14_+_61447832 | 0.36 |
ENST00000354886.2 ENST00000267488.4 |
SLC38A6 |
solute carrier family 38, member 6 |
| chr5_-_127418755 | 0.35 |
ENST00000501702.2 ENST00000501173.2 ENST00000514573.1 ENST00000499346.2 ENST00000606251.1 |
CTC-228N24.3 |
CTC-228N24.3 |
| chr5_+_176449726 | 0.35 |
ENST00000261948.4 ENST00000511834.1 ENST00000503039.1 |
ZNF346 |
zinc finger protein 346 |
| chr3_+_8543393 | 0.35 |
ENST00000157600.3 ENST00000415597.1 ENST00000535732.1 |
LMCD1 |
LIM and cysteine-rich domains 1 |
| chr3_+_180319918 | 0.35 |
ENST00000296015.4 ENST00000491380.1 ENST00000412756.2 ENST00000382584.4 |
TTC14 |
tetratricopeptide repeat domain 14 |
| chr1_+_104068312 | 0.34 |
ENST00000524631.1 ENST00000531883.1 ENST00000533099.1 ENST00000527062.1 |
RNPC3 |
RNA-binding region (RNP1, RRM) containing 3 |
| chrX_-_107019181 | 0.34 |
ENST00000315660.4 ENST00000372384.2 ENST00000502650.1 ENST00000506724.1 |
TSC22D3 |
TSC22 domain family, member 3 |
| chr19_-_8579030 | 0.34 |
ENST00000255616.8 ENST00000393927.4 |
ZNF414 |
zinc finger protein 414 |
| chr9_+_139971921 | 0.33 |
ENST00000409858.3 |
UAP1L1 |
UDP-N-acteylglucosamine pyrophosphorylase 1-like 1 |
| chrX_-_19905703 | 0.33 |
ENST00000397821.3 |
SH3KBP1 |
SH3-domain kinase binding protein 1 |
| chr6_+_35995488 | 0.33 |
ENST00000229795.3 |
MAPK14 |
mitogen-activated protein kinase 14 |
| chr7_-_158497431 | 0.33 |
ENST00000449727.2 ENST00000409339.3 ENST00000409423.1 ENST00000356309.3 |
NCAPG2 |
non-SMC condensin II complex, subunit G2 |
| chr19_+_37341260 | 0.32 |
ENST00000589046.1 |
ZNF345 |
zinc finger protein 345 |
| chr6_+_33168637 | 0.32 |
ENST00000374677.3 |
SLC39A7 |
solute carrier family 39 (zinc transporter), member 7 |
| chr3_-_42642560 | 0.32 |
ENST00000417572.1 |
SEC22C |
SEC22 vesicle trafficking protein homolog C (S. cerevisiae) |
| chr15_-_85197501 | 0.32 |
ENST00000434634.2 |
WDR73 |
WD repeat domain 73 |
| chr2_+_201676908 | 0.31 |
ENST00000409226.1 ENST00000452790.2 |
BZW1 |
basic leucine zipper and W2 domains 1 |
| chr5_-_130970723 | 0.31 |
ENST00000308008.6 ENST00000296859.6 ENST00000507093.1 ENST00000510071.1 ENST00000509018.1 ENST00000307984.5 |
RAPGEF6 |
Rap guanine nucleotide exchange factor (GEF) 6 |
| chr1_+_111991474 | 0.30 |
ENST00000369722.3 |
ATP5F1 |
ATP synthase, H+ transporting, mitochondrial Fo complex, subunit B1 |
| chr11_+_58346584 | 0.30 |
ENST00000316059.6 |
ZFP91 |
ZFP91 zinc finger protein |
| chrX_+_41193407 | 0.30 |
ENST00000457138.2 ENST00000441189.2 |
DDX3X |
DEAD (Asp-Glu-Ala-Asp) box helicase 3, X-linked |
| chr1_+_26147319 | 0.29 |
ENST00000374300.3 |
MTFR1L |
mitochondrial fission regulator 1-like |
| chr6_+_33168597 | 0.29 |
ENST00000374675.3 |
SLC39A7 |
solute carrier family 39 (zinc transporter), member 7 |
| chr11_+_6625046 | 0.29 |
ENST00000396751.2 |
ILK |
integrin-linked kinase |
| chrX_-_53711064 | 0.29 |
ENST00000342160.3 ENST00000446750.1 |
HUWE1 |
HECT, UBA and WWE domain containing 1, E3 ubiquitin protein ligase |
| chr14_+_61447927 | 0.28 |
ENST00000451406.1 |
SLC38A6 |
solute carrier family 38, member 6 |
| chr1_+_22379179 | 0.28 |
ENST00000315554.8 ENST00000421089.2 |
CDC42 |
cell division cycle 42 |
| chr1_+_246887349 | 0.28 |
ENST00000366510.3 |
SCCPDH |
saccharopine dehydrogenase (putative) |
| chr15_+_75315896 | 0.28 |
ENST00000342932.3 ENST00000564923.1 ENST00000569562.1 ENST00000568649.1 |
PPCDC |
phosphopantothenoylcysteine decarboxylase |
| chr19_+_39936317 | 0.28 |
ENST00000598725.1 |
SUPT5H |
suppressor of Ty 5 homolog (S. cerevisiae) |
| chr3_+_49044798 | 0.28 |
ENST00000438660.1 ENST00000608424.1 ENST00000415265.2 |
WDR6 |
WD repeat domain 6 |
| chr9_+_19049372 | 0.28 |
ENST00000380527.1 |
RRAGA |
Ras-related GTP binding A |
| chr16_+_89724188 | 0.27 |
ENST00000301031.4 ENST00000566204.1 ENST00000579310.1 |
SPATA33 |
spermatogenesis associated 33 |
| chr17_+_6347761 | 0.27 |
ENST00000250056.8 ENST00000571373.1 ENST00000570337.2 ENST00000572595.2 ENST00000576056.1 |
FAM64A |
family with sequence similarity 64, member A |
| chr4_+_140374961 | 0.27 |
ENST00000305626.5 |
RAB33B |
RAB33B, member RAS oncogene family |
| chr11_+_6624955 | 0.27 |
ENST00000299421.4 ENST00000537806.1 |
ILK |
integrin-linked kinase |
| chr4_-_2366525 | 0.27 |
ENST00000515169.1 ENST00000515312.1 |
ZFYVE28 |
zinc finger, FYVE domain containing 28 |
| chr3_+_8543561 | 0.27 |
ENST00000397386.3 |
LMCD1 |
LIM and cysteine-rich domains 1 |
| chr12_+_27091426 | 0.27 |
ENST00000546072.1 ENST00000327214.5 |
FGFR1OP2 |
FGFR1 oncogene partner 2 |
| chr11_+_93474786 | 0.27 |
ENST00000331239.4 ENST00000533585.1 ENST00000528099.1 ENST00000354421.3 ENST00000540113.1 ENST00000530620.1 ENST00000527003.1 ENST00000531650.1 ENST00000530279.1 |
C11orf54 |
chromosome 11 open reading frame 54 |
| chr4_+_139936905 | 0.27 |
ENST00000280614.2 |
CCRN4L |
CCR4 carbon catabolite repression 4-like (S. cerevisiae) |
| chr3_+_42642211 | 0.26 |
ENST00000442970.1 ENST00000445842.1 |
NKTR |
natural killer-tumor recognition sequence |
| chr6_-_7313381 | 0.26 |
ENST00000489567.1 ENST00000479365.1 ENST00000462112.1 ENST00000397511.2 ENST00000534851.1 ENST00000474597.1 ENST00000244763.4 |
SSR1 |
signal sequence receptor, alpha |
| chr17_+_6347729 | 0.26 |
ENST00000572447.1 |
FAM64A |
family with sequence similarity 64, member A |
| chr11_+_6624970 | 0.26 |
ENST00000420936.2 ENST00000528995.1 |
ILK |
integrin-linked kinase |
| chr2_+_24714729 | 0.26 |
ENST00000406961.1 ENST00000405141.1 |
NCOA1 |
nuclear receptor coactivator 1 |
| chr17_+_34900737 | 0.26 |
ENST00000304718.4 ENST00000485685.2 |
GGNBP2 |
gametogenetin binding protein 2 |
| chr5_-_159846399 | 0.26 |
ENST00000297151.4 |
SLU7 |
SLU7 splicing factor homolog (S. cerevisiae) |
| chr7_+_75677354 | 0.26 |
ENST00000461263.2 ENST00000315758.5 ENST00000443006.1 |
MDH2 |
malate dehydrogenase 2, NAD (mitochondrial) |
| chr12_-_80328700 | 0.26 |
ENST00000550107.1 |
PPP1R12A |
protein phosphatase 1, regulatory subunit 12A |
| chr4_+_128886424 | 0.25 |
ENST00000398965.1 |
C4orf29 |
chromosome 4 open reading frame 29 |
| chr8_+_81398444 | 0.25 |
ENST00000455036.3 ENST00000426744.2 |
ZBTB10 |
zinc finger and BTB domain containing 10 |
| chr7_+_2443202 | 0.25 |
ENST00000258711.6 |
CHST12 |
carbohydrate (chondroitin 4) sulfotransferase 12 |
| chr20_-_3767324 | 0.25 |
ENST00000379751.4 |
CENPB |
centromere protein B, 80kDa |
| chr1_-_165738072 | 0.25 |
ENST00000481278.1 |
TMCO1 |
transmembrane and coiled-coil domains 1 |
| chr18_+_59854480 | 0.25 |
ENST00000256858.6 ENST00000398130.2 |
KIAA1468 |
KIAA1468 |
| chr9_-_136214877 | 0.25 |
ENST00000446777.1 ENST00000343730.5 ENST00000344469.5 ENST00000371999.1 ENST00000494177.2 ENST00000457204.2 |
MED22 |
mediator complex subunit 22 |
| chr5_+_138629628 | 0.25 |
ENST00000508689.1 ENST00000514528.1 |
MATR3 |
matrin 3 |
| chr4_-_83821676 | 0.25 |
ENST00000355196.2 ENST00000507676.1 ENST00000506495.1 ENST00000507051.1 |
SEC31A |
SEC31 homolog A (S. cerevisiae) |
| chr19_-_53696587 | 0.25 |
ENST00000396424.3 ENST00000600412.1 |
ZNF665 |
zinc finger protein 665 |
| chr20_+_44044717 | 0.24 |
ENST00000279036.6 ENST00000279035.9 ENST00000372689.5 ENST00000545755.1 ENST00000341555.5 ENST00000535404.1 ENST00000543458.2 ENST00000432270.1 |
PIGT |
phosphatidylinositol glycan anchor biosynthesis, class T |
| chr1_+_40974395 | 0.24 |
ENST00000358527.2 ENST00000372703.1 ENST00000420209.1 |
EXO5 |
exonuclease 5 |
| chr8_+_182368 | 0.24 |
ENST00000522866.1 ENST00000398612.1 |
ZNF596 |
zinc finger protein 596 |
| chr1_-_6295975 | 0.24 |
ENST00000343813.5 ENST00000362035.3 |
ICMT |
isoprenylcysteine carboxyl methyltransferase |
| chr19_+_35168547 | 0.24 |
ENST00000502743.1 ENST00000509528.1 ENST00000506901.1 |
ZNF302 |
zinc finger protein 302 |
| chr17_+_15602891 | 0.24 |
ENST00000421016.1 ENST00000593105.1 ENST00000580259.1 ENST00000583566.1 ENST00000472486.1 ENST00000395894.2 ENST00000581529.1 ENST00000579694.1 ENST00000580393.1 ENST00000585194.1 ENST00000583031.1 ENST00000464847.2 |
ZNF286A |
Homo sapiens zinc finger protein 286A (ZNF286A), transcript variant 6, mRNA. |
| chr2_-_207629997 | 0.24 |
ENST00000454776.2 |
MDH1B |
malate dehydrogenase 1B, NAD (soluble) |
| chr19_-_53757941 | 0.23 |
ENST00000594517.1 ENST00000601413.1 ENST00000594681.1 |
ZNF677 |
zinc finger protein 677 |
| chr10_+_54074033 | 0.23 |
ENST00000373970.3 |
DKK1 |
dickkopf WNT signaling pathway inhibitor 1 |
| chr17_-_18585541 | 0.23 |
ENST00000285274.5 ENST00000545289.1 ENST00000580145.1 |
ZNF286B |
zinc finger protein 286B |
| chr19_+_39936267 | 0.23 |
ENST00000359191.6 |
SUPT5H |
suppressor of Ty 5 homolog (S. cerevisiae) |
| chr6_+_52285131 | 0.23 |
ENST00000433625.2 |
EFHC1 |
EF-hand domain (C-terminal) containing 1 |
| chr15_+_44580899 | 0.23 |
ENST00000559222.1 ENST00000299957.6 |
CASC4 |
cancer susceptibility candidate 4 |
| chr12_+_56661033 | 0.23 |
ENST00000433805.2 |
COQ10A |
coenzyme Q10 homolog A (S. cerevisiae) |
| chr19_+_39936186 | 0.23 |
ENST00000432763.2 ENST00000402194.2 ENST00000601515.1 |
SUPT5H |
suppressor of Ty 5 homolog (S. cerevisiae) |
| chr9_+_130213774 | 0.23 |
ENST00000373324.4 ENST00000323301.4 |
LRSAM1 |
leucine rich repeat and sterile alpha motif containing 1 |
| chr15_+_66797627 | 0.22 |
ENST00000565627.1 ENST00000564179.1 |
ZWILCH |
zwilch kinetochore protein |
| chr20_-_25604811 | 0.22 |
ENST00000304788.3 |
NANP |
N-acetylneuraminic acid phosphatase |
| chr3_+_108308513 | 0.22 |
ENST00000361582.3 |
DZIP3 |
DAZ interacting zinc finger protein 3 |
| chr4_+_25378826 | 0.22 |
ENST00000315368.3 |
ANAPC4 |
anaphase promoting complex subunit 4 |
| chr16_-_73082274 | 0.22 |
ENST00000268489.5 |
ZFHX3 |
zinc finger homeobox 3 |
| chr14_+_102027688 | 0.22 |
ENST00000510508.4 ENST00000359323.3 |
DIO3 |
deiodinase, iodothyronine, type III |
| chr4_-_103749205 | 0.22 |
ENST00000508249.1 |
UBE2D3 |
ubiquitin-conjugating enzyme E2D 3 |
| chr7_-_50518022 | 0.22 |
ENST00000356889.4 ENST00000420829.1 ENST00000448788.1 ENST00000395556.2 ENST00000422854.1 ENST00000435566.1 ENST00000433017.1 |
FIGNL1 |
fidgetin-like 1 |
| chr15_-_56757329 | 0.22 |
ENST00000260453.3 |
MNS1 |
meiosis-specific nuclear structural 1 |
| chr15_+_44580955 | 0.22 |
ENST00000345795.2 ENST00000360824.3 |
CASC4 |
cancer susceptibility candidate 4 |
| chr12_+_102513950 | 0.22 |
ENST00000378128.3 ENST00000327680.2 ENST00000541394.1 ENST00000543784.1 |
PARPBP |
PARP1 binding protein |
| chr5_+_75699149 | 0.22 |
ENST00000379730.3 |
IQGAP2 |
IQ motif containing GTPase activating protein 2 |
| chr2_+_120770645 | 0.21 |
ENST00000443902.2 |
EPB41L5 |
erythrocyte membrane protein band 4.1 like 5 |
| chr5_-_36152031 | 0.21 |
ENST00000296603.4 |
LMBRD2 |
LMBR1 domain containing 2 |
| chr20_+_48429356 | 0.21 |
ENST00000361573.2 ENST00000541138.1 ENST00000539601.1 |
SLC9A8 |
solute carrier family 9, subfamily A (NHE8, cation proton antiporter 8), member 8 |
| chr19_+_35168633 | 0.21 |
ENST00000505365.2 |
ZNF302 |
zinc finger protein 302 |
| chr1_+_40974431 | 0.21 |
ENST00000296380.4 ENST00000432259.1 ENST00000418186.1 |
EXO5 |
exonuclease 5 |
| chr5_+_75699040 | 0.21 |
ENST00000274364.6 |
IQGAP2 |
IQ motif containing GTPase activating protein 2 |
| chr9_+_130213762 | 0.21 |
ENST00000300417.6 |
LRSAM1 |
leucine rich repeat and sterile alpha motif containing 1 |
| chr11_+_62104897 | 0.21 |
ENST00000415229.2 ENST00000535727.1 ENST00000301776.5 |
ASRGL1 |
asparaginase like 1 |
| chr12_-_57940904 | 0.21 |
ENST00000550954.1 ENST00000434715.3 ENST00000546670.1 ENST00000543672.1 |
DCTN2 |
dynactin 2 (p50) |
| chr10_+_93170081 | 0.21 |
ENST00000446394.1 ENST00000371681.4 ENST00000298068.5 |
HECTD2 |
HECT domain containing E3 ubiquitin protein ligase 2 |
| chr1_-_159894319 | 0.21 |
ENST00000320307.4 |
TAGLN2 |
transgelin 2 |
| chrX_-_13752675 | 0.21 |
ENST00000380579.1 ENST00000458511.2 ENST00000519885.1 ENST00000358231.5 ENST00000518847.1 ENST00000453655.2 ENST00000359680.5 |
TRAPPC2 |
trafficking protein particle complex 2 |
| chr1_-_167906020 | 0.21 |
ENST00000458574.1 |
MPC2 |
mitochondrial pyruvate carrier 2 |
| chr4_+_25378912 | 0.21 |
ENST00000510092.1 ENST00000505991.1 |
ANAPC4 |
anaphase promoting complex subunit 4 |
| chr10_-_7661623 | 0.21 |
ENST00000298441.6 |
ITIH5 |
inter-alpha-trypsin inhibitor heavy chain family, member 5 |
| chr10_+_127408263 | 0.20 |
ENST00000337623.3 |
C10orf137 |
erythroid differentiation regulatory factor 1 |
| chr19_+_9251052 | 0.20 |
ENST00000247956.6 ENST00000360385.3 |
ZNF317 |
zinc finger protein 317 |
| chr19_-_36980455 | 0.20 |
ENST00000454319.1 ENST00000392170.2 |
ZNF566 |
zinc finger protein 566 |
| chr5_+_138629337 | 0.20 |
ENST00000394805.3 ENST00000512876.1 ENST00000513678.1 |
MATR3 |
matrin 3 |
| chr11_-_118436707 | 0.20 |
ENST00000264020.2 ENST00000264021.3 |
IFT46 |
intraflagellar transport 46 homolog (Chlamydomonas) |
| chr12_-_29534074 | 0.20 |
ENST00000546839.1 ENST00000360150.4 ENST00000552155.1 ENST00000550353.1 ENST00000548441.1 ENST00000552132.1 |
ERGIC2 |
ERGIC and golgi 2 |
| chr12_-_12849073 | 0.20 |
ENST00000332427.2 ENST00000540796.1 |
GPR19 |
G protein-coupled receptor 19 |
| chrX_+_48660287 | 0.20 |
ENST00000444343.2 ENST00000376610.2 ENST00000334136.5 ENST00000376619.2 |
HDAC6 |
histone deacetylase 6 |
| chr19_-_36980337 | 0.20 |
ENST00000434377.2 ENST00000424129.2 ENST00000452939.1 ENST00000427002.1 |
ZNF566 |
zinc finger protein 566 |
| chr2_+_201676256 | 0.20 |
ENST00000452206.1 ENST00000410110.2 ENST00000409600.1 |
BZW1 |
basic leucine zipper and W2 domains 1 |
| chr6_+_31707725 | 0.20 |
ENST00000375755.3 ENST00000375742.3 ENST00000375750.3 ENST00000425703.1 ENST00000534153.4 ENST00000375703.3 ENST00000375740.3 |
MSH5 |
mutS homolog 5 |
| chr15_-_48470558 | 0.20 |
ENST00000324324.7 |
MYEF2 |
myelin expression factor 2 |
| chr12_-_54019755 | 0.20 |
ENST00000588078.1 ENST00000551480.2 ENST00000548118.2 ENST00000456903.4 ENST00000591834.1 |
ATF7 RP11-793H13.10 |
activating transcription factor 7 Uncharacterized protein |
Gene Ontology Analysis
Gene overrepresentation in biological_process category:
| Log-likelihood per target | Total log-likelihood | Term | Description |
|---|---|---|---|
| 0.4 | 2.2 | GO:0035582 | sequestering of BMP in extracellular matrix(GO:0035582) |
| 0.3 | 0.9 | GO:0046946 | hydroxylysine metabolic process(GO:0046946) hydroxylysine biosynthetic process(GO:0046947) |
| 0.2 | 0.5 | GO:2000179 | positive regulation of neural precursor cell proliferation(GO:2000179) |
| 0.2 | 0.7 | GO:1901189 | positive regulation of ephrin receptor signaling pathway(GO:1901189) positive regulation of canonical Wnt signaling pathway involved in cardiac muscle cell fate commitment(GO:1901297) positive regulation of canonical Wnt signaling pathway involved in heart development(GO:1905068) |
| 0.2 | 0.2 | GO:1905066 | regulation of canonical Wnt signaling pathway involved in cardiac muscle cell fate commitment(GO:1901295) regulation of canonical Wnt signaling pathway involved in heart development(GO:1905066) |
| 0.2 | 0.9 | GO:0034699 | transforming growth factor beta receptor complex assembly(GO:0007181) response to luteinizing hormone(GO:0034699) |
| 0.2 | 1.1 | GO:0014835 | myoblast differentiation involved in skeletal muscle regeneration(GO:0014835) |
| 0.2 | 1.0 | GO:0048133 | germ-line stem cell division(GO:0042078) male germ-line stem cell asymmetric division(GO:0048133) germline stem cell asymmetric division(GO:0098728) |
| 0.2 | 1.0 | GO:0090235 | regulation of metaphase plate congression(GO:0090235) |
| 0.2 | 1.5 | GO:0051415 | interphase microtubule nucleation by interphase microtubule organizing center(GO:0051415) microtubule nucleation by microtubule organizing center(GO:0051418) |
| 0.2 | 0.8 | GO:0071596 | ubiquitin-dependent protein catabolic process via the N-end rule pathway(GO:0071596) |
| 0.1 | 0.4 | GO:0035359 | negative regulation of peroxisome proliferator activated receptor signaling pathway(GO:0035359) |
| 0.1 | 1.0 | GO:0048549 | positive regulation of pinocytosis(GO:0048549) |
| 0.1 | 0.5 | GO:0000103 | sulfate assimilation(GO:0000103) |
| 0.1 | 0.7 | GO:0002154 | thyroid hormone mediated signaling pathway(GO:0002154) |
| 0.1 | 0.4 | GO:0032203 | telomere formation via telomerase(GO:0032203) |
| 0.1 | 1.8 | GO:0034501 | protein localization to kinetochore(GO:0034501) |
| 0.1 | 0.4 | GO:0071336 | submandibular salivary gland formation(GO:0060661) hair follicle cell proliferation(GO:0071335) regulation of hair follicle cell proliferation(GO:0071336) positive regulation of hair follicle cell proliferation(GO:0071338) |
| 0.1 | 0.1 | GO:0097084 | vascular smooth muscle cell development(GO:0097084) |
| 0.1 | 0.6 | GO:0033132 | negative regulation of glucokinase activity(GO:0033132) negative regulation of hexokinase activity(GO:1903300) |
| 0.1 | 0.4 | GO:1902361 | mitochondrial pyruvate transport(GO:0006850) mitochondrial pyruvate transmembrane transport(GO:1902361) |
| 0.1 | 0.6 | GO:0010216 | maintenance of DNA methylation(GO:0010216) |
| 0.1 | 0.4 | GO:0042264 | peptidyl-aspartic acid hydroxylation(GO:0042264) |
| 0.1 | 1.1 | GO:0048251 | elastic fiber assembly(GO:0048251) |
| 0.1 | 0.3 | GO:0033140 | negative regulation of peptidyl-serine phosphorylation of STAT protein(GO:0033140) |
| 0.1 | 2.2 | GO:0006895 | Golgi to endosome transport(GO:0006895) |
| 0.1 | 0.2 | GO:0021538 | epithalamus development(GO:0021538) habenula development(GO:0021986) |
| 0.1 | 0.4 | GO:0070086 | ubiquitin-dependent endocytosis(GO:0070086) |
| 0.1 | 0.4 | GO:0043504 | mitochondrial DNA repair(GO:0043504) |
| 0.1 | 0.1 | GO:0018312 | peptidyl-serine ADP-ribosylation(GO:0018312) |
| 0.1 | 0.3 | GO:0036369 | transcription factor catabolic process(GO:0036369) |
| 0.1 | 0.4 | GO:0015853 | adenine transport(GO:0015853) |
| 0.1 | 0.5 | GO:0043932 | ossification involved in bone remodeling(GO:0043932) |
| 0.1 | 0.2 | GO:0002023 | reduction of food intake in response to dietary excess(GO:0002023) |
| 0.1 | 0.2 | GO:1901895 | negative regulation of calcium-transporting ATPase activity(GO:1901895) |
| 0.1 | 0.1 | GO:0033387 | putrescine biosynthetic process from ornithine(GO:0033387) |
| 0.1 | 1.2 | GO:0034587 | piRNA metabolic process(GO:0034587) |
| 0.1 | 0.2 | GO:1904059 | regulation of locomotor rhythm(GO:1904059) |
| 0.1 | 0.2 | GO:0007509 | mesoderm migration involved in gastrulation(GO:0007509) |
| 0.1 | 0.2 | GO:0072369 | regulation of lipid transport by positive regulation of transcription from RNA polymerase II promoter(GO:0072369) |
| 0.1 | 0.2 | GO:0009443 | pyridoxal 5'-phosphate salvage(GO:0009443) |
| 0.1 | 0.2 | GO:0002949 | tRNA threonylcarbamoyladenosine modification(GO:0002949) |
| 0.1 | 0.4 | GO:0035507 | regulation of myosin-light-chain-phosphatase activity(GO:0035507) |
| 0.1 | 0.2 | GO:0090034 | regulation of chaperone-mediated protein complex assembly(GO:0090034) positive regulation of chaperone-mediated protein complex assembly(GO:0090035) |
| 0.0 | 0.1 | GO:0006427 | histidyl-tRNA aminoacylation(GO:0006427) |
| 0.0 | 0.1 | GO:0035610 | protein side chain deglutamylation(GO:0035610) |
| 0.0 | 0.1 | GO:1901725 | positive regulation of deacetylase activity(GO:0090045) regulation of histone deacetylase activity(GO:1901725) positive regulation of histone deacetylase activity(GO:1901727) |
| 0.0 | 0.7 | GO:0006108 | malate metabolic process(GO:0006108) |
| 0.0 | 1.0 | GO:0007076 | mitotic chromosome condensation(GO:0007076) |
| 0.0 | 0.6 | GO:1903608 | protein localization to cytoplasmic stress granule(GO:1903608) |
| 0.0 | 0.6 | GO:0070070 | proton-transporting V-type ATPase complex assembly(GO:0070070) vacuolar proton-transporting V-type ATPase complex assembly(GO:0070072) |
| 0.0 | 0.7 | GO:0051256 | mitotic spindle midzone assembly(GO:0051256) |
| 0.0 | 0.3 | GO:0031999 | negative regulation of fatty acid beta-oxidation(GO:0031999) |
| 0.0 | 1.3 | GO:0006851 | mitochondrial calcium ion transport(GO:0006851) |
| 0.0 | 0.1 | GO:0006617 | SRP-dependent cotranslational protein targeting to membrane, signal sequence recognition(GO:0006617) |
| 0.0 | 0.2 | GO:0060979 | vasculogenesis involved in coronary vascular morphogenesis(GO:0060979) |
| 0.0 | 0.3 | GO:0006620 | posttranslational protein targeting to membrane(GO:0006620) |
| 0.0 | 0.1 | GO:2000646 | positive regulation of receptor catabolic process(GO:2000646) |
| 0.0 | 0.1 | GO:0016094 | polyprenol biosynthetic process(GO:0016094) |
| 0.0 | 0.3 | GO:0001920 | negative regulation of receptor recycling(GO:0001920) |
| 0.0 | 0.7 | GO:0039692 | single stranded viral RNA replication via double stranded DNA intermediate(GO:0039692) |
| 0.0 | 0.2 | GO:0006272 | leading strand elongation(GO:0006272) |
| 0.0 | 0.3 | GO:1903433 | regulation of constitutive secretory pathway(GO:1903433) |
| 0.0 | 0.2 | GO:0033512 | L-lysine catabolic process to acetyl-CoA via saccharopine(GO:0033512) |
| 0.0 | 2.1 | GO:0000413 | protein peptidyl-prolyl isomerization(GO:0000413) |
| 0.0 | 0.3 | GO:2001137 | positive regulation of endocytic recycling(GO:2001137) |
| 0.0 | 1.1 | GO:0030208 | dermatan sulfate biosynthetic process(GO:0030208) |
| 0.0 | 0.4 | GO:0015846 | polyamine transport(GO:0015846) |
| 0.0 | 0.3 | GO:0070236 | negative regulation of activation-induced cell death of T cells(GO:0070236) |
| 0.0 | 0.2 | GO:2000255 | negative regulation of male germ cell proliferation(GO:2000255) |
| 0.0 | 0.5 | GO:0001766 | membrane raft polarization(GO:0001766) membrane raft distribution(GO:0031580) |
| 0.0 | 0.5 | GO:0021702 | cerebellar Purkinje cell layer formation(GO:0021694) cerebellar Purkinje cell differentiation(GO:0021702) |
| 0.0 | 0.1 | GO:0071140 | resolution of recombination intermediates(GO:0071139) resolution of mitotic recombination intermediates(GO:0071140) |
| 0.0 | 0.6 | GO:0046349 | amino sugar biosynthetic process(GO:0046349) |
| 0.0 | 0.3 | GO:0000389 | mRNA 3'-splice site recognition(GO:0000389) |
| 0.0 | 0.1 | GO:1901301 | regulation of cargo loading into COPII-coated vesicle(GO:1901301) |
| 0.0 | 0.1 | GO:0030718 | germ-line stem cell population maintenance(GO:0030718) |
| 0.0 | 0.8 | GO:0045663 | positive regulation of myoblast differentiation(GO:0045663) |
| 0.0 | 0.5 | GO:0000463 | maturation of LSU-rRNA from tricistronic rRNA transcript (SSU-rRNA, 5.8S rRNA, LSU-rRNA)(GO:0000463) |
| 0.0 | 0.0 | GO:1904674 | positive regulation of somatic stem cell population maintenance(GO:1904674) |
| 0.0 | 0.1 | GO:0006433 | glutamyl-tRNA aminoacylation(GO:0006424) prolyl-tRNA aminoacylation(GO:0006433) |
| 0.0 | 0.2 | GO:0048388 | endosomal lumen acidification(GO:0048388) |
| 0.0 | 0.2 | GO:0071043 | CUT catabolic process(GO:0071034) CUT metabolic process(GO:0071043) |
| 0.0 | 0.1 | GO:0060057 | apoptotic process involved in mammary gland involution(GO:0060057) positive regulation of apoptotic process involved in mammary gland involution(GO:0060058) apoptotic process involved in embryonic digit morphogenesis(GO:1902263) positive regulation of apoptotic process involved in morphogenesis(GO:1902339) positive regulation of apoptotic DNA fragmentation(GO:1902512) regulation of mammary gland involution(GO:1903519) positive regulation of mammary gland involution(GO:1903521) positive regulation of apoptotic process involved in development(GO:1904747) |
| 0.0 | 0.1 | GO:0060931 | sinoatrial node cell development(GO:0060931) |
| 0.0 | 0.5 | GO:0000244 | spliceosomal tri-snRNP complex assembly(GO:0000244) |
| 0.0 | 0.4 | GO:0006621 | protein retention in ER lumen(GO:0006621) |
| 0.0 | 0.3 | GO:0048280 | vesicle fusion with Golgi apparatus(GO:0048280) |
| 0.0 | 0.1 | GO:0035441 | cell migration involved in vasculogenesis(GO:0035441) |
| 0.0 | 0.1 | GO:0002101 | tRNA wobble cytosine modification(GO:0002101) |
| 0.0 | 0.1 | GO:0070681 | glutaminyl-tRNAGln biosynthesis via transamidation(GO:0070681) |
| 0.0 | 0.3 | GO:0006983 | ER overload response(GO:0006983) |
| 0.0 | 1.9 | GO:0035666 | TRIF-dependent toll-like receptor signaling pathway(GO:0035666) |
| 0.0 | 0.1 | GO:1903862 | positive regulation of oxidative phosphorylation(GO:1903862) |
| 0.0 | 0.2 | GO:0016255 | attachment of GPI anchor to protein(GO:0016255) |
| 0.0 | 0.1 | GO:1903778 | protein localization to vacuolar membrane(GO:1903778) |
| 0.0 | 0.8 | GO:0070208 | protein heterotrimerization(GO:0070208) |
| 0.0 | 1.6 | GO:0000266 | mitochondrial fission(GO:0000266) |
| 0.0 | 0.1 | GO:0048250 | mitochondrial iron ion transport(GO:0048250) |
| 0.0 | 0.2 | GO:0048478 | replication fork protection(GO:0048478) |
| 0.0 | 0.8 | GO:0070886 | positive regulation of calcineurin-NFAT signaling cascade(GO:0070886) |
| 0.0 | 0.2 | GO:0006651 | diacylglycerol biosynthetic process(GO:0006651) |
| 0.0 | 0.3 | GO:2000042 | negative regulation of double-strand break repair via homologous recombination(GO:2000042) |
| 0.0 | 0.1 | GO:1901804 | beta-glucoside metabolic process(GO:1901804) beta-glucoside catabolic process(GO:1901805) positive regulation of neuronal action potential(GO:1904457) |
| 0.0 | 0.1 | GO:1990180 | mitochondrial tRNA 3'-end processing(GO:1990180) |
| 0.0 | 0.6 | GO:0019336 | phenol-containing compound catabolic process(GO:0019336) |
| 0.0 | 0.1 | GO:0048698 | negative regulation of collateral sprouting in absence of injury(GO:0048698) |
| 0.0 | 0.1 | GO:0002188 | translation reinitiation(GO:0002188) |
| 0.0 | 0.1 | GO:1902568 | positive regulation of eosinophil degranulation(GO:0043311) positive regulation of eosinophil activation(GO:1902568) |
| 0.0 | 0.1 | GO:1903964 | monounsaturated fatty acid metabolic process(GO:1903964) monounsaturated fatty acid biosynthetic process(GO:1903966) |
| 0.0 | 0.1 | GO:0034146 | toll-like receptor 5 signaling pathway(GO:0034146) |
| 0.0 | 0.4 | GO:0098719 | sodium ion import across plasma membrane(GO:0098719) sodium ion import into cell(GO:1990118) |
| 0.0 | 0.3 | GO:0001833 | inner cell mass cell proliferation(GO:0001833) |
| 0.0 | 0.0 | GO:0070601 | centromeric sister chromatid cohesion(GO:0070601) |
| 0.0 | 0.3 | GO:0033227 | dsRNA transport(GO:0033227) |
| 0.0 | 0.1 | GO:0021526 | medial motor column neuron differentiation(GO:0021526) |
| 0.0 | 0.1 | GO:0031064 | negative regulation of histone deacetylation(GO:0031064) |
| 0.0 | 0.2 | GO:0010499 | proteasomal ubiquitin-independent protein catabolic process(GO:0010499) |
| 0.0 | 0.1 | GO:0043321 | regulation of natural killer cell degranulation(GO:0043321) positive regulation of natural killer cell degranulation(GO:0043323) |
| 0.0 | 0.1 | GO:0033490 | cholesterol biosynthetic process via desmosterol(GO:0033489) cholesterol biosynthetic process via lathosterol(GO:0033490) |
| 0.0 | 0.2 | GO:0006528 | asparagine metabolic process(GO:0006528) |
| 0.0 | 0.7 | GO:0034453 | microtubule anchoring(GO:0034453) |
| 0.0 | 0.2 | GO:1901419 | regulation of response to alcohol(GO:1901419) |
| 0.0 | 0.1 | GO:0016476 | regulation of embryonic cell shape(GO:0016476) |
| 0.0 | 0.4 | GO:0034063 | stress granule assembly(GO:0034063) |
| 0.0 | 0.1 | GO:0072086 | specification of loop of Henle identity(GO:0072086) |
| 0.0 | 0.1 | GO:0031291 | Ran protein signal transduction(GO:0031291) |
| 0.0 | 0.2 | GO:0010890 | positive regulation of sequestering of triglyceride(GO:0010890) |
| 0.0 | 0.1 | GO:0006177 | GMP biosynthetic process(GO:0006177) |
| 0.0 | 0.4 | GO:0090557 | establishment of endothelial intestinal barrier(GO:0090557) |
| 0.0 | 0.5 | GO:0071539 | protein localization to centrosome(GO:0071539) |
| 0.0 | 0.4 | GO:0016024 | CDP-diacylglycerol biosynthetic process(GO:0016024) |
| 0.0 | 0.1 | GO:0051083 | 'de novo' cotranslational protein folding(GO:0051083) |
| 0.0 | 0.3 | GO:1904263 | positive regulation of TORC1 signaling(GO:1904263) |
| 0.0 | 0.1 | GO:0006286 | base-excision repair, base-free sugar-phosphate removal(GO:0006286) |
| 0.0 | 0.1 | GO:0045204 | MAPK export from nucleus(GO:0045204) |
| 0.0 | 0.1 | GO:0072134 | nephrogenic mesenchyme morphogenesis(GO:0072134) |
| 0.0 | 0.1 | GO:0018343 | protein farnesylation(GO:0018343) |
| 0.0 | 0.1 | GO:0072244 | metanephric glomerular epithelium development(GO:0072244) metanephric glomerular visceral epithelial cell differentiation(GO:0072248) metanephric glomerular visceral epithelial cell development(GO:0072249) metanephric glomerular epithelial cell differentiation(GO:0072312) metanephric glomerular epithelial cell development(GO:0072313) |
| 0.0 | 0.1 | GO:0006933 | negative regulation of cell adhesion involved in substrate-bound cell migration(GO:0006933) |
| 0.0 | 0.2 | GO:1903943 | regulation of hepatocyte apoptotic process(GO:1903943) negative regulation of hepatocyte apoptotic process(GO:1903944) |
| 0.0 | 0.1 | GO:1990868 | response to chemokine(GO:1990868) cellular response to chemokine(GO:1990869) |
| 0.0 | 0.1 | GO:1900748 | positive regulation of vascular endothelial growth factor signaling pathway(GO:1900748) |
| 0.0 | 0.1 | GO:0002572 | pro-T cell differentiation(GO:0002572) |
| 0.0 | 0.1 | GO:0035494 | SNARE complex disassembly(GO:0035494) |
| 0.0 | 0.1 | GO:1902953 | positive regulation of ER to Golgi vesicle-mediated transport(GO:1902953) |
| 0.0 | 0.1 | GO:0044376 | RNA polymerase II complex import to nucleus(GO:0044376) RNA polymerase III complex localization to nucleus(GO:1990022) |
| 0.0 | 0.7 | GO:0071577 | zinc II ion transmembrane transport(GO:0071577) |
| 0.0 | 0.1 | GO:0015798 | myo-inositol transport(GO:0015798) |
| 0.0 | 0.1 | GO:0098528 | skeletal muscle fiber differentiation(GO:0098528) |
| 0.0 | 0.2 | GO:0045040 | protein import into mitochondrial outer membrane(GO:0045040) |
| 0.0 | 0.2 | GO:0021869 | forebrain ventricular zone progenitor cell division(GO:0021869) |
| 0.0 | 0.1 | GO:0046826 | negative regulation of protein export from nucleus(GO:0046826) |
| 0.0 | 0.1 | GO:0010446 | response to alkaline pH(GO:0010446) |
| 0.0 | 0.1 | GO:0019918 | peptidyl-arginine methylation, to symmetrical-dimethyl arginine(GO:0019918) |
| 0.0 | 0.1 | GO:1990253 | cellular response to leucine starvation(GO:1990253) |
| 0.0 | 0.1 | GO:0060283 | negative regulation of oocyte development(GO:0060283) negative regulation of oocyte maturation(GO:1900194) |
| 0.0 | 0.2 | GO:0048227 | plasma membrane to endosome transport(GO:0048227) |
| 0.0 | 0.0 | GO:0043137 | DNA replication, removal of RNA primer(GO:0043137) |
| 0.0 | 0.2 | GO:0090110 | cargo loading into COPII-coated vesicle(GO:0090110) |
| 0.0 | 0.1 | GO:1902255 | positive regulation of intrinsic apoptotic signaling pathway by p53 class mediator(GO:1902255) |
| 0.0 | 0.0 | GO:0046601 | positive regulation of centriole replication(GO:0046601) |
| 0.0 | 0.8 | GO:1904837 | beta-catenin-TCF complex assembly(GO:1904837) |
| 0.0 | 0.2 | GO:0003356 | regulation of cilium beat frequency(GO:0003356) |
| 0.0 | 0.3 | GO:0007175 | negative regulation of epidermal growth factor-activated receptor activity(GO:0007175) |
| 0.0 | 0.2 | GO:0007253 | cytoplasmic sequestering of NF-kappaB(GO:0007253) |
| 0.0 | 0.1 | GO:1902659 | regulation of glucose mediated signaling pathway(GO:1902659) |
| 0.0 | 0.1 | GO:0006335 | DNA replication-dependent nucleosome assembly(GO:0006335) DNA replication-dependent nucleosome organization(GO:0034723) |
| 0.0 | 0.4 | GO:0051290 | protein heterotetramerization(GO:0051290) |
| 0.0 | 0.0 | GO:0019521 | aldonic acid metabolic process(GO:0019520) D-gluconate metabolic process(GO:0019521) |
| 0.0 | 0.2 | GO:0070986 | left/right axis specification(GO:0070986) |
| 0.0 | 0.0 | GO:1902616 | acyl carnitine transport(GO:0006844) acyl carnitine transmembrane transport(GO:1902616) |
| 0.0 | 0.3 | GO:2000009 | negative regulation of protein localization to cell surface(GO:2000009) |
| 0.0 | 0.2 | GO:0016446 | somatic hypermutation of immunoglobulin genes(GO:0016446) |
| 0.0 | 0.0 | GO:2000698 | positive regulation of epithelial cell differentiation involved in kidney development(GO:2000698) positive regulation of nephron tubule epithelial cell differentiation(GO:2000768) |
| 0.0 | 0.1 | GO:0061470 | T follicular helper cell differentiation(GO:0061470) |
| 0.0 | 0.1 | GO:0001731 | formation of translation preinitiation complex(GO:0001731) |
| 0.0 | 0.1 | GO:0006449 | regulation of translational termination(GO:0006449) |
| 0.0 | 1.0 | GO:0006826 | iron ion transport(GO:0006826) |
| 0.0 | 0.1 | GO:0000395 | mRNA 5'-splice site recognition(GO:0000395) |
| 0.0 | 0.0 | GO:0009257 | 10-formyltetrahydrofolate biosynthetic process(GO:0009257) |
| 0.0 | 0.1 | GO:0070571 | negative regulation of axon regeneration(GO:0048681) negative regulation of neuron projection regeneration(GO:0070571) |
| 0.0 | 0.2 | GO:0035414 | negative regulation of catenin import into nucleus(GO:0035414) |
| 0.0 | 0.1 | GO:0032455 | nerve growth factor processing(GO:0032455) |
| 0.0 | 0.0 | GO:0006669 | sphinganine-1-phosphate biosynthetic process(GO:0006669) |
| 0.0 | 0.4 | GO:0006359 | regulation of transcription from RNA polymerase III promoter(GO:0006359) |
| 0.0 | 0.5 | GO:1902808 | positive regulation of cell cycle G1/S phase transition(GO:1902808) |
| 0.0 | 0.0 | GO:2000816 | negative regulation of mitotic sister chromatid separation(GO:2000816) |
| 0.0 | 0.2 | GO:0006298 | mismatch repair(GO:0006298) |
| 0.0 | 0.5 | GO:0035735 | intraciliary transport involved in cilium morphogenesis(GO:0035735) |
| 0.0 | 0.1 | GO:0007135 | meiosis II(GO:0007135) |
| 0.0 | 0.1 | GO:0006657 | CDP-choline pathway(GO:0006657) |
| 0.0 | 0.1 | GO:0019626 | short-chain fatty acid catabolic process(GO:0019626) |
| 0.0 | 0.1 | GO:0010990 | regulation of SMAD protein complex assembly(GO:0010990) negative regulation of SMAD protein complex assembly(GO:0010991) |
| 0.0 | 0.1 | GO:0035520 | monoubiquitinated protein deubiquitination(GO:0035520) |
| 0.0 | 0.1 | GO:2000348 | regulation of CD40 signaling pathway(GO:2000348) |
| 0.0 | 0.1 | GO:1900746 | regulation of vascular endothelial growth factor signaling pathway(GO:1900746) |
| 0.0 | 0.1 | GO:0031163 | iron-sulfur cluster assembly(GO:0016226) metallo-sulfur cluster assembly(GO:0031163) |
| 0.0 | 0.0 | GO:1903630 | regulation of aminoacyl-tRNA ligase activity(GO:1903630) |
| 0.0 | 0.1 | GO:0045347 | negative regulation of MHC class II biosynthetic process(GO:0045347) |
| 0.0 | 0.4 | GO:0006517 | protein deglycosylation(GO:0006517) |
Gene overrepresentation in cellular_component category:
| Log-likelihood per target | Total log-likelihood | Term | Description |
|---|---|---|---|
| 0.2 | 0.6 | GO:0043291 | RAVE complex(GO:0043291) |
| 0.2 | 0.8 | GO:0034673 | inhibin-betaglycan-ActRII complex(GO:0034673) |
| 0.2 | 0.7 | GO:0032044 | DSIF complex(GO:0032044) |
| 0.2 | 1.1 | GO:0071547 | piP-body(GO:0071547) |
| 0.2 | 1.5 | GO:0000923 | equatorial microtubule organizing center(GO:0000923) |
| 0.1 | 1.0 | GO:0044352 | pinosome(GO:0044352) macropinosome(GO:0044354) |
| 0.1 | 0.7 | GO:0002193 | MAML1-RBP-Jkappa- ICN1 complex(GO:0002193) |
| 0.1 | 1.4 | GO:0000796 | condensin complex(GO:0000796) |
| 0.1 | 1.9 | GO:0000940 | condensed chromosome outer kinetochore(GO:0000940) |
| 0.1 | 1.1 | GO:0071953 | elastic fiber(GO:0071953) |
| 0.1 | 2.2 | GO:0001527 | microfibril(GO:0001527) fibril(GO:0043205) |
| 0.1 | 0.4 | GO:1990423 | RZZ complex(GO:1990423) |
| 0.1 | 0.5 | GO:0032541 | cortical endoplasmic reticulum(GO:0032541) |
| 0.1 | 0.9 | GO:0044666 | MLL3/4 complex(GO:0044666) |
| 0.1 | 0.3 | GO:0005971 | ribonucleoside-diphosphate reductase complex(GO:0005971) |
| 0.1 | 1.9 | GO:0035145 | exon-exon junction complex(GO:0035145) |
| 0.1 | 0.8 | GO:1990023 | mitotic spindle midzone(GO:1990023) |
| 0.1 | 2.2 | GO:0030140 | trans-Golgi network transport vesicle(GO:0030140) |
| 0.0 | 0.2 | GO:0042765 | GPI-anchor transamidase complex(GO:0042765) |
| 0.0 | 0.3 | GO:1990131 | Gtr1-Gtr2 GTPase complex(GO:1990131) |
| 0.0 | 0.4 | GO:0000322 | storage vacuole(GO:0000322) |
| 0.0 | 0.2 | GO:0060187 | cell pole(GO:0060187) |
| 0.0 | 0.0 | GO:1902636 | kinociliary basal body(GO:1902636) |
| 0.0 | 0.2 | GO:0034274 | Atg12-Atg5-Atg16 complex(GO:0034274) |
| 0.0 | 0.4 | GO:0098554 | cytoplasmic side of endoplasmic reticulum membrane(GO:0098554) |
| 0.0 | 0.2 | GO:0020018 | ciliary pocket(GO:0020016) ciliary pocket membrane(GO:0020018) |
| 0.0 | 0.5 | GO:0000788 | nuclear nucleosome(GO:0000788) |
| 0.0 | 0.5 | GO:0005869 | dynactin complex(GO:0005869) |
| 0.0 | 0.3 | GO:0072357 | PTW/PP1 phosphatase complex(GO:0072357) |
| 0.0 | 0.1 | GO:0030956 | glutamyl-tRNA(Gln) amidotransferase complex(GO:0030956) |
| 0.0 | 0.2 | GO:0000836 | Hrd1p ubiquitin ligase complex(GO:0000836) |
| 0.0 | 0.1 | GO:0005965 | protein farnesyltransferase complex(GO:0005965) |
| 0.0 | 0.1 | GO:0031436 | BRCA1-BARD1 complex(GO:0031436) |
| 0.0 | 0.2 | GO:0032311 | angiogenin-PRI complex(GO:0032311) |
| 0.0 | 0.1 | GO:0033186 | CAF-1 complex(GO:0033186) |
| 0.0 | 0.1 | GO:0032937 | SREBP-SCAP-Insig complex(GO:0032937) |
| 0.0 | 0.2 | GO:0008622 | epsilon DNA polymerase complex(GO:0008622) |
| 0.0 | 0.1 | GO:0045160 | myosin I complex(GO:0045160) |
| 0.0 | 0.4 | GO:0032300 | mismatch repair complex(GO:0032300) |
| 0.0 | 0.2 | GO:0032777 | Piccolo NuA4 histone acetyltransferase complex(GO:0032777) |
| 0.0 | 0.3 | GO:0000780 | condensed nuclear chromosome, centromeric region(GO:0000780) |
| 0.0 | 0.2 | GO:0008024 | cyclin/CDK positive transcription elongation factor complex(GO:0008024) |
| 0.0 | 0.1 | GO:0044614 | nuclear pore cytoplasmic filaments(GO:0044614) |
| 0.0 | 0.2 | GO:0000408 | EKC/KEOPS complex(GO:0000408) |
| 0.0 | 1.0 | GO:0043034 | costamere(GO:0043034) |
| 0.0 | 0.1 | GO:0032279 | axonemal microtubule(GO:0005879) asymmetric synapse(GO:0032279) |
| 0.0 | 0.1 | GO:1990745 | EARP complex(GO:1990745) |
| 0.0 | 0.1 | GO:0097422 | tubular endosome(GO:0097422) |
| 0.0 | 0.2 | GO:0005853 | eukaryotic translation elongation factor 1 complex(GO:0005853) |
| 0.0 | 0.5 | GO:0030992 | intraciliary transport particle B(GO:0030992) |
| 0.0 | 0.2 | GO:0016602 | CCAAT-binding factor complex(GO:0016602) |
| 0.0 | 0.1 | GO:0070436 | Grb2-EGFR complex(GO:0070436) |
| 0.0 | 0.4 | GO:0005852 | eukaryotic translation initiation factor 3 complex(GO:0005852) |
| 0.0 | 0.6 | GO:0005680 | anaphase-promoting complex(GO:0005680) |
| 0.0 | 0.1 | GO:0097452 | GAIT complex(GO:0097452) |
| 0.0 | 0.2 | GO:0031298 | replication fork protection complex(GO:0031298) |
| 0.0 | 0.1 | GO:0016011 | dystroglycan complex(GO:0016011) sarcoglycan complex(GO:0016012) |
| 0.0 | 0.1 | GO:0070044 | synaptobrevin 2-SNAP-25-syntaxin-1a complex(GO:0070044) |
| 0.0 | 0.0 | GO:0071159 | NF-kappaB complex(GO:0071159) |
| 0.0 | 0.1 | GO:0005786 | signal recognition particle, endoplasmic reticulum targeting(GO:0005786) |
| 0.0 | 0.1 | GO:0016272 | prefoldin complex(GO:0016272) |
| 0.0 | 0.1 | GO:0032010 | phagolysosome(GO:0032010) |
| 0.0 | 0.2 | GO:0030008 | TRAPP complex(GO:0030008) |
| 0.0 | 0.5 | GO:0080008 | Cul4-RING E3 ubiquitin ligase complex(GO:0080008) |
| 0.0 | 1.1 | GO:0072686 | mitotic spindle(GO:0072686) |
| 0.0 | 0.3 | GO:0046930 | pore complex(GO:0046930) |
| 0.0 | 0.2 | GO:0000176 | nuclear exosome (RNase complex)(GO:0000176) |
| 0.0 | 0.2 | GO:0030127 | COPII vesicle coat(GO:0030127) |
| 0.0 | 0.0 | GO:0032299 | ribonuclease H2 complex(GO:0032299) |
Gene overrepresentation in molecular_function category:
| Log-likelihood per target | Total log-likelihood | Term | Description |
|---|---|---|---|
| 0.4 | 1.1 | GO:0030350 | iron-responsive element binding(GO:0030350) |
| 0.3 | 0.9 | GO:0008475 | procollagen-lysine 5-dioxygenase activity(GO:0008475) procollagen glucosyltransferase activity(GO:0033823) |
| 0.2 | 1.4 | GO:0043515 | kinetochore binding(GO:0043515) |
| 0.2 | 2.2 | GO:0030023 | extracellular matrix constituent conferring elasticity(GO:0030023) |
| 0.2 | 0.5 | GO:0004781 | adenylylsulfate kinase activity(GO:0004020) sulfate adenylyltransferase activity(GO:0004779) sulfate adenylyltransferase (ATP) activity(GO:0004781) |
| 0.2 | 0.7 | GO:0061628 | H3K27me3 modified histone binding(GO:0061628) |
| 0.2 | 0.5 | GO:0030626 | U12 snRNA binding(GO:0030626) |
| 0.2 | 0.5 | GO:0045145 | single-stranded DNA 5'-3' exodeoxyribonuclease activity(GO:0045145) |
| 0.1 | 1.9 | GO:0016018 | cyclosporin A binding(GO:0016018) |
| 0.1 | 0.4 | GO:0004597 | peptide-aspartate beta-dioxygenase activity(GO:0004597) |
| 0.1 | 0.4 | GO:0032427 | GBD domain binding(GO:0032427) |
| 0.1 | 1.6 | GO:0051011 | microtubule minus-end binding(GO:0051011) |
| 0.1 | 1.1 | GO:0051525 | NFAT protein binding(GO:0051525) |
| 0.1 | 0.4 | GO:0010861 | thyroid hormone receptor activator activity(GO:0010861) thyroid hormone receptor coactivator activity(GO:0030375) |
| 0.1 | 0.7 | GO:0030060 | L-malate dehydrogenase activity(GO:0030060) |
| 0.1 | 0.5 | GO:0051731 | polynucleotide 5'-hydroxyl-kinase activity(GO:0051731) |
| 0.1 | 0.9 | GO:0005114 | type II transforming growth factor beta receptor binding(GO:0005114) |
| 0.1 | 0.2 | GO:0008798 | beta-aspartyl-peptidase activity(GO:0008798) |
| 0.1 | 0.3 | GO:0061731 | ribonucleoside-diphosphate reductase activity, thioredoxin disulfide as acceptor(GO:0004748) oxidoreductase activity, acting on CH or CH2 groups, disulfide as acceptor(GO:0016728) ribonucleoside-diphosphate reductase activity(GO:0061731) |
| 0.1 | 0.3 | GO:0000386 | second spliceosomal transesterification activity(GO:0000386) |
| 0.1 | 0.2 | GO:0031685 | adenosine receptor binding(GO:0031685) |
| 0.1 | 0.2 | GO:0005173 | stem cell factor receptor binding(GO:0005173) |
| 0.1 | 0.7 | GO:0000150 | recombinase activity(GO:0000150) |
| 0.1 | 0.2 | GO:0031403 | pyridoxal kinase activity(GO:0008478) lithium ion binding(GO:0031403) |
| 0.1 | 0.5 | GO:0008297 | single-stranded DNA exodeoxyribonuclease activity(GO:0008297) |
| 0.1 | 0.2 | GO:0036137 | kynurenine-oxoglutarate transaminase activity(GO:0016212) kynurenine aminotransferase activity(GO:0036137) |
| 0.1 | 0.2 | GO:0042903 | tubulin deacetylase activity(GO:0042903) |
| 0.0 | 0.1 | GO:0004821 | histidine-tRNA ligase activity(GO:0004821) |
| 0.0 | 0.3 | GO:0051032 | nucleic acid transmembrane transporter activity(GO:0051032) RNA transmembrane transporter activity(GO:0051033) |
| 0.0 | 0.1 | GO:0090541 | MIT domain binding(GO:0090541) |
| 0.0 | 0.2 | GO:0003923 | GPI-anchor transamidase activity(GO:0003923) |
| 0.0 | 0.4 | GO:0050833 | pyruvate transmembrane transporter activity(GO:0050833) |
| 0.0 | 0.1 | GO:1990404 | protein ADP-ribosylase activity(GO:1990404) |
| 0.0 | 0.2 | GO:0047757 | chondroitin-glucuronate 5-epimerase activity(GO:0047757) |
| 0.0 | 2.1 | GO:0005487 | nucleocytoplasmic transporter activity(GO:0005487) |
| 0.0 | 0.2 | GO:0071987 | WD40-repeat domain binding(GO:0071987) |
| 0.0 | 0.1 | GO:0002094 | polyprenyltransferase activity(GO:0002094) |
| 0.0 | 0.3 | GO:0047756 | chondroitin 4-sulfotransferase activity(GO:0047756) |
| 0.0 | 0.4 | GO:0043533 | inositol 1,3,4,5 tetrakisphosphate binding(GO:0043533) |
| 0.0 | 0.2 | GO:0019776 | Atg8 ligase activity(GO:0019776) |
| 0.0 | 0.3 | GO:0050733 | RS domain binding(GO:0050733) |
| 0.0 | 0.2 | GO:0032138 | single base insertion or deletion binding(GO:0032138) |
| 0.0 | 0.1 | GO:0004769 | steroid delta-isomerase activity(GO:0004769) |
| 0.0 | 0.2 | GO:0004666 | prostaglandin-endoperoxide synthase activity(GO:0004666) |
| 0.0 | 0.4 | GO:0071933 | Arp2/3 complex binding(GO:0071933) |
| 0.0 | 0.3 | GO:0016206 | catechol O-methyltransferase activity(GO:0016206) |
| 0.0 | 0.3 | GO:0008379 | thioredoxin peroxidase activity(GO:0008379) |
| 0.0 | 0.3 | GO:0043426 | MRF binding(GO:0043426) |
| 0.0 | 0.7 | GO:0003995 | acyl-CoA dehydrogenase activity(GO:0003995) |
| 0.0 | 0.2 | GO:0004800 | thyroxine 5'-deiodinase activity(GO:0004800) |
| 0.0 | 0.6 | GO:0005225 | volume-sensitive anion channel activity(GO:0005225) |
| 0.0 | 0.8 | GO:0042800 | histone methyltransferase activity (H3-K4 specific)(GO:0042800) |
| 0.0 | 0.1 | GO:0004827 | glutamate-tRNA ligase activity(GO:0004818) proline-tRNA ligase activity(GO:0004827) |
| 0.0 | 0.2 | GO:0004949 | cannabinoid receptor activity(GO:0004949) |
| 0.0 | 0.3 | GO:0015288 | porin activity(GO:0015288) |
| 0.0 | 0.4 | GO:0015386 | potassium:proton antiporter activity(GO:0015386) |
| 0.0 | 0.1 | GO:0030627 | pre-mRNA 5'-splice site binding(GO:0030627) |
| 0.0 | 0.5 | GO:0042975 | peroxisome proliferator activated receptor binding(GO:0042975) |
| 0.0 | 0.1 | GO:0035033 | histone deacetylase regulator activity(GO:0035033) |
| 0.0 | 0.1 | GO:0015439 | heme-transporting ATPase activity(GO:0015439) |
| 0.0 | 0.1 | GO:0008309 | double-stranded DNA exodeoxyribonuclease activity(GO:0008309) |
| 0.0 | 0.1 | GO:0050567 | glutaminyl-tRNA synthase (glutamine-hydrolyzing) activity(GO:0050567) |
| 0.0 | 0.1 | GO:0008523 | sodium-dependent multivitamin transmembrane transporter activity(GO:0008523) |
| 0.0 | 0.1 | GO:0004660 | protein farnesyltransferase activity(GO:0004660) |
| 0.0 | 0.5 | GO:0019911 | structural constituent of myelin sheath(GO:0019911) |
| 0.0 | 0.2 | GO:0051998 | carboxyl-O-methyltransferase activity(GO:0010340) protein carboxyl O-methyltransferase activity(GO:0051998) |
| 0.0 | 0.3 | GO:0070569 | uridylyltransferase activity(GO:0070569) |
| 0.0 | 0.1 | GO:0004307 | diacylglycerol cholinephosphotransferase activity(GO:0004142) ethanolaminephosphotransferase activity(GO:0004307) |
| 0.0 | 0.4 | GO:0070181 | small ribosomal subunit rRNA binding(GO:0070181) |
| 0.0 | 0.1 | GO:0008184 | glycogen phosphorylase activity(GO:0008184) |
| 0.0 | 0.3 | GO:1990825 | sequence-specific mRNA binding(GO:1990825) |
| 0.0 | 0.3 | GO:0019237 | centromeric DNA binding(GO:0019237) |
| 0.0 | 0.1 | GO:0008192 | RNA guanylyltransferase activity(GO:0008192) |
| 0.0 | 0.1 | GO:0071074 | eukaryotic initiation factor eIF2 binding(GO:0071074) |
| 0.0 | 0.3 | GO:0033592 | RNA strand annealing activity(GO:0033592) |
| 0.0 | 1.4 | GO:0061631 | ubiquitin conjugating enzyme activity(GO:0061631) |
| 0.0 | 0.1 | GO:0003989 | acetyl-CoA carboxylase activity(GO:0003989) |
| 0.0 | 0.1 | GO:0004492 | methylmalonyl-CoA decarboxylase activity(GO:0004492) |
| 0.0 | 0.1 | GO:0004802 | transketolase activity(GO:0004802) |
| 0.0 | 0.2 | GO:0004522 | ribonuclease A activity(GO:0004522) |
| 0.0 | 0.1 | GO:0050254 | rhodopsin kinase activity(GO:0050254) |
| 0.0 | 0.0 | GO:0035529 | NADH pyrophosphatase activity(GO:0035529) |
| 0.0 | 0.7 | GO:0005086 | ARF guanyl-nucleotide exchange factor activity(GO:0005086) |
| 0.0 | 0.4 | GO:1904264 | ubiquitin protein ligase activity involved in ERAD pathway(GO:1904264) |
| 0.0 | 0.3 | GO:0050291 | sphingosine N-acyltransferase activity(GO:0050291) |
| 0.0 | 0.1 | GO:0004348 | glucosylceramidase activity(GO:0004348) |
| 0.0 | 0.2 | GO:0055104 | ligase inhibitor activity(GO:0055104) ubiquitin ligase inhibitor activity(GO:1990948) |
| 0.0 | 0.2 | GO:0010997 | anaphase-promoting complex binding(GO:0010997) |
| 0.0 | 0.2 | GO:0035005 | 1-phosphatidylinositol-4-phosphate 3-kinase activity(GO:0035005) |
| 0.0 | 0.3 | GO:0017162 | aryl hydrocarbon receptor binding(GO:0017162) |
| 0.0 | 0.1 | GO:0016230 | sphingomyelin phosphodiesterase activator activity(GO:0016230) |
| 0.0 | 0.1 | GO:0016428 | tRNA (cytosine-5-)-methyltransferase activity(GO:0016428) |
| 0.0 | 0.1 | GO:0051021 | GDP-dissociation inhibitor binding(GO:0051021) Rho GDP-dissociation inhibitor binding(GO:0051022) |
| 0.0 | 0.1 | GO:0035241 | protein-arginine omega-N monomethyltransferase activity(GO:0035241) |
| 0.0 | 0.1 | GO:0019798 | procollagen-proline 4-dioxygenase activity(GO:0004656) procollagen-proline dioxygenase activity(GO:0019798) |
| 0.0 | 0.7 | GO:0005385 | zinc ion transmembrane transporter activity(GO:0005385) |
| 0.0 | 0.1 | GO:0010698 | acetyltransferase activator activity(GO:0010698) |
| 0.0 | 0.2 | GO:0039706 | co-receptor binding(GO:0039706) |
| 0.0 | 0.1 | GO:0001165 | RNA polymerase I upstream control element sequence-specific DNA binding(GO:0001165) |
| 0.0 | 0.1 | GO:0005483 | soluble NSF attachment protein activity(GO:0005483) |
| 0.0 | 0.0 | GO:0004487 | methylenetetrahydrofolate dehydrogenase (NAD+) activity(GO:0004487) |
| 0.0 | 0.2 | GO:0030983 | mismatched DNA binding(GO:0030983) |
| 0.0 | 0.5 | GO:0015002 | cytochrome-c oxidase activity(GO:0004129) heme-copper terminal oxidase activity(GO:0015002) oxidoreductase activity, acting on a heme group of donors, oxygen as acceptor(GO:0016676) |
| 0.0 | 0.1 | GO:0016215 | stearoyl-CoA 9-desaturase activity(GO:0004768) acyl-CoA desaturase activity(GO:0016215) |
| 0.0 | 0.0 | GO:0001160 | transcription termination site sequence-specific DNA binding(GO:0001147) transcription termination site DNA binding(GO:0001160) |
| 0.0 | 0.1 | GO:0017040 | ceramidase activity(GO:0017040) |
| 0.0 | 0.0 | GO:0017095 | heparan sulfate 6-O-sulfotransferase activity(GO:0017095) |
| 0.0 | 0.1 | GO:0048039 | ubiquinone binding(GO:0048039) |
| 0.0 | 0.1 | GO:0031752 | D5 dopamine receptor binding(GO:0031752) |
| 0.0 | 0.2 | GO:0010314 | phosphatidylinositol-5-phosphate binding(GO:0010314) |
| 0.0 | 0.2 | GO:0047429 | nucleoside-triphosphate diphosphatase activity(GO:0047429) |
| 0.0 | 0.1 | GO:0070087 | chromo shadow domain binding(GO:0070087) |
| 0.0 | 0.0 | GO:0016427 | tRNA (cytosine) methyltransferase activity(GO:0016427) |
| 0.0 | 0.1 | GO:0008821 | crossover junction endodeoxyribonuclease activity(GO:0008821) |
| 0.0 | 0.0 | GO:0015227 | acyl carnitine transmembrane transporter activity(GO:0015227) |
| 0.0 | 0.1 | GO:0030292 | protein tyrosine kinase inhibitor activity(GO:0030292) |
| 0.0 | 1.1 | GO:0004004 | ATP-dependent RNA helicase activity(GO:0004004) |
| 0.0 | 0.1 | GO:0005471 | ATP:ADP antiporter activity(GO:0005471) adenine transmembrane transporter activity(GO:0015207) |
| 0.0 | 0.4 | GO:0003841 | 1-acylglycerol-3-phosphate O-acyltransferase activity(GO:0003841) |
| 0.0 | 0.1 | GO:0031826 | type 2A serotonin receptor binding(GO:0031826) |
| 0.0 | 0.1 | GO:0046975 | histone methyltransferase activity (H3-K36 specific)(GO:0046975) |
| 0.0 | 0.4 | GO:0008157 | protein phosphatase 1 binding(GO:0008157) |
| 0.0 | 0.0 | GO:0008481 | sphinganine kinase activity(GO:0008481) D-erythro-sphingosine kinase activity(GO:0017050) |
| 0.0 | 0.0 | GO:0005136 | interleukin-4 receptor binding(GO:0005136) |
| 0.0 | 0.5 | GO:0005031 | tumor necrosis factor-activated receptor activity(GO:0005031) death receptor activity(GO:0005035) |
| 0.0 | 0.3 | GO:0070300 | phosphatidic acid binding(GO:0070300) |
| 0.0 | 0.1 | GO:0004865 | protein serine/threonine phosphatase inhibitor activity(GO:0004865) |
| 0.0 | 0.1 | GO:0008312 | 7S RNA binding(GO:0008312) |
| 0.0 | 0.1 | GO:0061649 | ubiquitinated histone binding(GO:0061649) |
| 0.0 | 0.2 | GO:0048306 | calcium-dependent protein binding(GO:0048306) |
| 0.0 | 0.1 | GO:0016884 | carbon-nitrogen ligase activity, with glutamine as amido-N-donor(GO:0016884) |
| 0.0 | 0.2 | GO:0004726 | non-membrane spanning protein tyrosine phosphatase activity(GO:0004726) |
| 0.0 | 0.1 | GO:0004075 | biotin carboxylase activity(GO:0004075) |
| 0.0 | 0.0 | GO:0004102 | choline O-acetyltransferase activity(GO:0004102) |
| 0.0 | 0.0 | GO:0032422 | purine-rich negative regulatory element binding(GO:0032422) |
| 0.0 | 0.0 | GO:0004449 | isocitrate dehydrogenase (NAD+) activity(GO:0004449) |
| 0.0 | 0.2 | GO:0004185 | serine-type carboxypeptidase activity(GO:0004185) |
| 0.0 | 0.3 | GO:0005521 | lamin binding(GO:0005521) |
| 0.0 | 0.3 | GO:0070530 | K63-linked polyubiquitin binding(GO:0070530) |
| 0.0 | 0.1 | GO:0004176 | ATP-dependent peptidase activity(GO:0004176) |
Gene overrepresentation in C2:CP category:
| Log-likelihood per target | Total log-likelihood | Term | Description |
|---|---|---|---|
| 0.1 | 1.9 | PID INTEGRIN5 PATHWAY | Beta5 beta6 beta7 and beta8 integrin cell surface interactions |
| 0.0 | 1.6 | PID NFKAPPAB CANONICAL PATHWAY | Canonical NF-kappaB pathway |
| 0.0 | 0.5 | PID S1P S1P4 PATHWAY | S1P4 pathway |
| 0.0 | 1.1 | PID P38 MKK3 6PATHWAY | p38 MAPK signaling pathway |
| 0.0 | 0.9 | SA PTEN PATHWAY | PTEN is a tumor suppressor that dephosphorylates the lipid messenger phosphatidylinositol triphosphate. |
| 0.0 | 0.2 | PID AVB3 INTEGRIN PATHWAY | Integrins in angiogenesis |
| 0.0 | 0.6 | PID TOLL ENDOGENOUS PATHWAY | Endogenous TLR signaling |
| 0.0 | 0.9 | PID PS1 PATHWAY | Presenilin action in Notch and Wnt signaling |
| 0.0 | 0.7 | ST GA12 PATHWAY | G alpha 12 Pathway |
| 0.0 | 0.6 | PID INSULIN GLUCOSE PATHWAY | Insulin-mediated glucose transport |
| 0.0 | 0.9 | PID ERBB1 INTERNALIZATION PATHWAY | Internalization of ErbB1 |
| 0.0 | 1.0 | PID AURORA B PATHWAY | Aurora B signaling |
| 0.0 | 0.6 | PID RXR VDR PATHWAY | RXR and RAR heterodimerization with other nuclear receptor |
| 0.0 | 0.2 | PID THROMBIN PAR4 PATHWAY | PAR4-mediated thrombin signaling events |
| 0.0 | 0.7 | NABA COLLAGENS | Genes encoding collagen proteins |
| 0.0 | 1.7 | PID MYC ACTIV PATHWAY | Validated targets of C-MYC transcriptional activation |
| 0.0 | 0.1 | PID RANBP2 PATHWAY | Sumoylation by RanBP2 regulates transcriptional repression |
Gene overrepresentation in C2:CP:REACTOME category:
| Log-likelihood per target | Total log-likelihood | Term | Description |
|---|---|---|---|
| 0.1 | 1.6 | REACTOME RECRUITMENT OF NUMA TO MITOTIC CENTROSOMES | Genes involved in Recruitment of NuMA to mitotic centrosomes |
| 0.1 | 1.1 | REACTOME DSCAM INTERACTIONS | Genes involved in DSCAM interactions |
| 0.1 | 0.7 | REACTOME NOTCH HLH TRANSCRIPTION PATHWAY | Genes involved in Notch-HLH transcription pathway |
| 0.0 | 2.0 | REACTOME OXYGEN DEPENDENT PROLINE HYDROXYLATION OF HYPOXIA INDUCIBLE FACTOR ALPHA | Genes involved in Oxygen-dependent Proline Hydroxylation of Hypoxia-inducible Factor Alpha |
| 0.0 | 0.2 | REACTOME PEPTIDE CHAIN ELONGATION | Genes involved in Peptide chain elongation |
| 0.0 | 0.8 | REACTOME CELL EXTRACELLULAR MATRIX INTERACTIONS | Genes involved in Cell-extracellular matrix interactions |
| 0.0 | 2.5 | REACTOME GOLGI ASSOCIATED VESICLE BIOGENESIS | Genes involved in Golgi Associated Vesicle Biogenesis |
| 0.0 | 0.7 | REACTOME ZINC TRANSPORTERS | Genes involved in Zinc transporters |
| 0.0 | 0.8 | REACTOME CHONDROITIN SULFATE BIOSYNTHESIS | Genes involved in Chondroitin sulfate biosynthesis |
| 0.0 | 0.4 | REACTOME CD28 DEPENDENT VAV1 PATHWAY | Genes involved in CD28 dependent Vav1 pathway |
| 0.0 | 0.7 | REACTOME CIRCADIAN REPRESSION OF EXPRESSION BY REV ERBA | Genes involved in Circadian Repression of Expression by REV-ERBA |
| 0.0 | 1.6 | REACTOME COLLAGEN FORMATION | Genes involved in Collagen formation |
| 0.0 | 0.7 | REACTOME ABORTIVE ELONGATION OF HIV1 TRANSCRIPT IN THE ABSENCE OF TAT | Genes involved in Abortive elongation of HIV-1 transcript in the absence of Tat |
| 0.0 | 0.5 | REACTOME CYTOSOLIC SULFONATION OF SMALL MOLECULES | Genes involved in Cytosolic sulfonation of small molecules |
| 0.0 | 0.5 | REACTOME CITRIC ACID CYCLE TCA CYCLE | Genes involved in Citric acid cycle (TCA cycle) |
| 0.0 | 2.1 | REACTOME MITOTIC PROMETAPHASE | Genes involved in Mitotic Prometaphase |
| 0.0 | 0.1 | REACTOME CROSS PRESENTATION OF SOLUBLE EXOGENOUS ANTIGENS ENDOSOMES | Genes involved in Cross-presentation of soluble exogenous antigens (endosomes) |
| 0.0 | 0.4 | REACTOME EXTENSION OF TELOMERES | Genes involved in Extension of Telomeres |
| 0.0 | 0.2 | REACTOME ROLE OF DCC IN REGULATING APOPTOSIS | Genes involved in Role of DCC in regulating apoptosis |
| 0.0 | 0.3 | REACTOME G1 S SPECIFIC TRANSCRIPTION | Genes involved in G1/S-Specific Transcription |
| 0.0 | 0.3 | REACTOME BMAL1 CLOCK NPAS2 ACTIVATES CIRCADIAN EXPRESSION | Genes involved in BMAL1:CLOCK/NPAS2 Activates Circadian Expression |
| 0.0 | 1.5 | REACTOME INTEGRIN CELL SURFACE INTERACTIONS | Genes involved in Integrin cell surface interactions |