Project
ENCODE cell lines, expression (Ernst 2011)
Navigation
Downloads
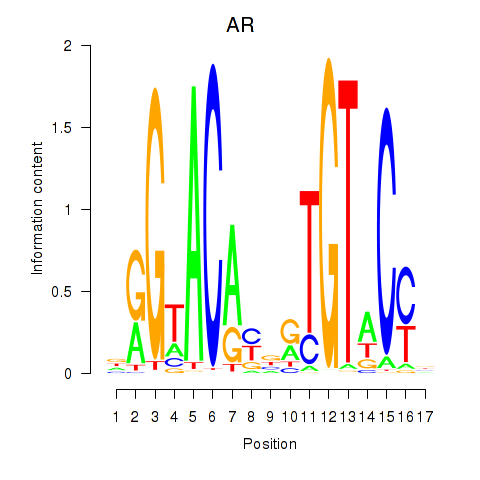
Results for AR_NR3C2
Z-value: 1.30
Motif logo

Transcription factors associated with AR_NR3C2
| Gene Symbol | Gene ID | Gene Info |
|---|---|---|
|
AR
|
ENSG00000169083.11 | AR |
|
NR3C2
|
ENSG00000151623.10 | NR3C2 |
Activity-expression correlation:
| Gene | Promoter | Pearson corr. coef. | P-value | Plot |
|---|---|---|---|---|
| AR | hg19_v2_chrX_+_66764375_66764465 | 0.29 | 2.7e-01 | Click! |
| NR3C2 | hg19_v2_chr4_-_149365827_149365870, hg19_v2_chr4_-_149363662_149363688 | 0.16 | 5.5e-01 | Click! |
Activity profile of AR_NR3C2 motif
Sorted Z-values of AR_NR3C2 motif
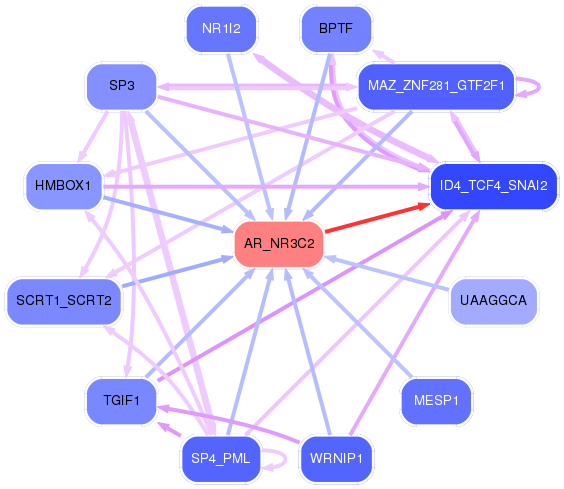
Network of associatons between targets according to the STRING database.

First level regulatory network of AR_NR3C2
| Promoter | Score | Transcript | Gene | Gene Info |
|---|---|---|---|---|
| chr16_+_56659687 | 8.85 |
ENST00000568293.1 ENST00000330439.6 |
MT1E |
metallothionein 1E |
| chr16_+_56642041 | 7.52 |
ENST00000245185.5 |
MT2A |
metallothionein 2A |
| chr16_+_56642489 | 6.60 |
ENST00000561491.1 |
MT2A |
metallothionein 2A |
| chr16_+_56716336 | 6.21 |
ENST00000394485.4 ENST00000562939.1 |
MT1X |
metallothionein 1X |
| chr8_-_49834299 | 5.21 |
ENST00000396822.1 |
SNAI2 |
snail family zinc finger 2 |
| chr8_-_49833978 | 4.83 |
ENST00000020945.1 |
SNAI2 |
snail family zinc finger 2 |
| chr7_-_94285402 | 3.04 |
ENST00000428696.2 ENST00000445866.2 |
SGCE |
sarcoglycan, epsilon |
| chr7_-_94285511 | 3.03 |
ENST00000265735.7 |
SGCE |
sarcoglycan, epsilon |
| chr2_+_238395879 | 2.84 |
ENST00000445024.2 ENST00000338530.4 ENST00000409373.1 |
MLPH |
melanophilin |
| chr2_+_238395803 | 2.74 |
ENST00000264605.3 |
MLPH |
melanophilin |
| chr16_+_56672571 | 2.72 |
ENST00000290705.8 |
MT1A |
metallothionein 1A |
| chr16_+_56666563 | 2.61 |
ENST00000570233.1 |
MT1M |
metallothionein 1M |
| chr4_+_75310851 | 2.50 |
ENST00000395748.3 ENST00000264487.2 |
AREG |
amphiregulin |
| chr11_+_18287721 | 2.48 |
ENST00000356524.4 |
SAA1 |
serum amyloid A1 |
| chr11_+_18287801 | 2.38 |
ENST00000532858.1 ENST00000405158.2 |
SAA1 |
serum amyloid A1 |
| chr4_+_75311019 | 2.38 |
ENST00000502307.1 |
AREG |
amphiregulin |
| chr4_+_75480629 | 2.35 |
ENST00000380846.3 |
AREGB |
amphiregulin B |
| chr7_-_94285472 | 1.56 |
ENST00000437425.2 ENST00000447873.1 ENST00000415788.2 |
SGCE |
sarcoglycan, epsilon |
| chr5_+_140186647 | 1.24 |
ENST00000512229.2 ENST00000356878.4 ENST00000530339.1 |
PCDHA4 |
protocadherin alpha 4 |
| chr8_+_9046503 | 1.08 |
ENST00000512942.2 |
RP11-10A14.5 |
RP11-10A14.5 |
| chrX_+_17755563 | 0.99 |
ENST00000380045.3 ENST00000380041.3 ENST00000380043.3 ENST00000398080.1 |
SCML1 |
sex comb on midleg-like 1 (Drosophila) |
| chr18_+_56530136 | 0.89 |
ENST00000591083.1 |
ZNF532 |
zinc finger protein 532 |
| chr18_+_7754957 | 0.83 |
ENST00000400053.4 |
PTPRM |
protein tyrosine phosphatase, receptor type, M |
| chr6_-_111927062 | 0.74 |
ENST00000359831.4 |
TRAF3IP2 |
TRAF3 interacting protein 2 |
| chrX_+_2609317 | 0.73 |
ENST00000381187.3 ENST00000381184.1 |
CD99 |
CD99 molecule |
| chrX_+_2609356 | 0.70 |
ENST00000381180.3 ENST00000449611.1 |
CD99 |
CD99 molecule |
| chrX_+_2609207 | 0.66 |
ENST00000381192.3 |
CD99 |
CD99 molecule |
| chr12_+_53443680 | 0.65 |
ENST00000314250.6 ENST00000451358.1 |
TENC1 |
tensin like C1 domain containing phosphatase (tensin 2) |
| chr7_+_94285637 | 0.62 |
ENST00000482108.1 ENST00000488574.1 |
PEG10 |
paternally expressed 10 |
| chr16_+_67207838 | 0.61 |
ENST00000566871.1 ENST00000268605.7 |
NOL3 |
nucleolar protein 3 (apoptosis repressor with CARD domain) |
| chr1_-_145715565 | 0.55 |
ENST00000369288.2 ENST00000369290.1 ENST00000401557.3 |
CD160 |
CD160 molecule |
| chr12_+_125549925 | 0.54 |
ENST00000316519.6 |
AACS |
acetoacetyl-CoA synthetase |
| chr16_-_66584059 | 0.53 |
ENST00000417693.3 ENST00000544898.1 ENST00000569718.1 ENST00000527284.1 ENST00000299697.7 ENST00000451102.2 |
TK2 |
thymidine kinase 2, mitochondrial |
| chr8_-_62602327 | 0.52 |
ENST00000445642.3 ENST00000517847.2 ENST00000389204.4 ENST00000517661.1 ENST00000517903.1 ENST00000522603.1 ENST00000522349.1 ENST00000522835.1 ENST00000541428.1 ENST00000518306.1 |
ASPH |
aspartate beta-hydroxylase |
| chr14_-_107211459 | 0.51 |
ENST00000390636.2 |
IGHV3-73 |
immunoglobulin heavy variable 3-73 |
| chr16_+_67207872 | 0.51 |
ENST00000563258.1 ENST00000568146.1 |
NOL3 |
nucleolar protein 3 (apoptosis repressor with CARD domain) |
| chr22_+_23046750 | 0.51 |
ENST00000390307.2 |
IGLV3-22 |
immunoglobulin lambda variable 3-22 (gene/pseudogene) |
| chr15_+_31658349 | 0.45 |
ENST00000558844.1 |
KLF13 |
Kruppel-like factor 13 |
| chr12_+_125549973 | 0.44 |
ENST00000536752.1 ENST00000261686.6 |
AACS |
acetoacetyl-CoA synthetase |
| chr12_+_53443963 | 0.43 |
ENST00000546602.1 ENST00000552570.1 ENST00000549700.1 |
TENC1 |
tensin like C1 domain containing phosphatase (tensin 2) |
| chr8_+_91013577 | 0.42 |
ENST00000220764.2 |
DECR1 |
2,4-dienoyl CoA reductase 1, mitochondrial |
| chr19_+_35630344 | 0.39 |
ENST00000455515.2 |
FXYD1 |
FXYD domain containing ion transport regulator 1 |
| chr1_-_27693349 | 0.36 |
ENST00000374040.3 ENST00000357582.2 ENST00000493901.1 |
MAP3K6 |
mitogen-activated protein kinase kinase kinase 6 |
| chr17_+_41323204 | 0.33 |
ENST00000542611.1 ENST00000590996.1 ENST00000389312.4 ENST00000589872.1 |
NBR1 |
neighbor of BRCA1 gene 1 |
| chr12_+_66582919 | 0.33 |
ENST00000545837.1 ENST00000457197.2 |
IRAK3 |
interleukin-1 receptor-associated kinase 3 |
| chr11_-_506739 | 0.33 |
ENST00000529306.1 ENST00000438658.2 ENST00000527485.1 ENST00000397615.2 ENST00000397614.1 |
RNH1 |
ribonuclease/angiogenin inhibitor 1 |
| chr17_-_19290117 | 0.30 |
ENST00000497081.2 |
MFAP4 |
microfibrillar-associated protein 4 |
| chr4_-_8442438 | 0.28 |
ENST00000356406.5 ENST00000413009.2 |
ACOX3 |
acyl-CoA oxidase 3, pristanoyl |
| chr17_+_38333263 | 0.27 |
ENST00000456989.2 ENST00000543876.1 ENST00000544503.1 ENST00000264644.6 ENST00000538884.1 |
RAPGEFL1 |
Rap guanine nucleotide exchange factor (GEF)-like 1 |
| chr2_+_27435179 | 0.27 |
ENST00000606999.1 ENST00000405489.3 |
ATRAID |
all-trans retinoic acid-induced differentiation factor |
| chr19_+_57874835 | 0.25 |
ENST00000543226.1 ENST00000596755.1 ENST00000282282.3 ENST00000597658.1 |
TRAPPC2P1 ZNF547 AC003002.4 |
trafficking protein particle complex 2 pseudogene 1 zinc finger protein 547 Uncharacterized protein |
| chr8_-_21669826 | 0.23 |
ENST00000517328.1 |
GFRA2 |
GDNF family receptor alpha 2 |
| chr19_-_8408139 | 0.22 |
ENST00000330915.3 ENST00000593649.1 ENST00000595639.1 |
KANK3 |
KN motif and ankyrin repeat domains 3 |
| chr17_-_19290483 | 0.20 |
ENST00000395592.2 ENST00000299610.4 |
MFAP4 |
microfibrillar-associated protein 4 |
| chr12_-_10251603 | 0.20 |
ENST00000457018.2 |
CLEC1A |
C-type lectin domain family 1, member A |
| chr8_+_91013676 | 0.19 |
ENST00000519410.1 ENST00000522161.1 ENST00000517761.1 ENST00000520227.1 |
DECR1 |
2,4-dienoyl CoA reductase 1, mitochondrial |
| chr1_+_22979676 | 0.16 |
ENST00000432749.2 ENST00000314933.6 |
C1QB |
complement component 1, q subcomponent, B chain |
| chr1_+_22979474 | 0.16 |
ENST00000509305.1 |
C1QB |
complement component 1, q subcomponent, B chain |
| chr19_+_35630926 | 0.15 |
ENST00000588081.1 ENST00000589121.1 |
FXYD1 |
FXYD domain containing ion transport regulator 1 |
| chr3_-_58563094 | 0.13 |
ENST00000464064.1 |
FAM107A |
family with sequence similarity 107, member A |
| chr19_+_35630628 | 0.13 |
ENST00000588715.1 ENST00000588607.1 |
FXYD1 |
FXYD domain containing ion transport regulator 1 |
| chr19_+_58570605 | 0.12 |
ENST00000359978.6 ENST00000401053.4 ENST00000439855.2 ENST00000313434.5 ENST00000511556.1 ENST00000506786.1 |
ZNF135 |
zinc finger protein 135 |
| chr16_-_67978016 | 0.10 |
ENST00000264005.5 |
LCAT |
lecithin-cholesterol acyltransferase |
| chr17_-_16472483 | 0.09 |
ENST00000395824.1 ENST00000448349.2 ENST00000395825.3 |
ZNF287 |
zinc finger protein 287 |
| chr15_+_42694573 | 0.08 |
ENST00000397200.4 ENST00000569827.1 |
CAPN3 |
calpain 3, (p94) |
| chr1_+_76262552 | 0.08 |
ENST00000263187.3 |
MSH4 |
mutS homolog 4 |
| chr22_+_19939026 | 0.07 |
ENST00000406520.3 |
COMT |
catechol-O-methyltransferase |
| chr19_-_14117074 | 0.06 |
ENST00000588885.1 ENST00000254325.4 |
RFX1 |
regulatory factor X, 1 (influences HLA class II expression) |
| chr12_-_56615693 | 0.06 |
ENST00000394013.2 ENST00000345093.4 ENST00000551711.1 ENST00000552656.1 |
RNF41 |
ring finger protein 41 |
| chr11_+_114270752 | 0.05 |
ENST00000540163.1 |
RBM7 |
RNA binding motif protein 7 |
| chr5_-_179499086 | 0.05 |
ENST00000261947.4 |
RNF130 |
ring finger protein 130 |
| chr2_+_242577027 | 0.05 |
ENST00000402096.1 ENST00000404914.3 |
ATG4B |
autophagy related 4B, cysteine peptidase |
| chr12_-_11002063 | 0.05 |
ENST00000544994.1 ENST00000228811.4 ENST00000540107.1 |
PRR4 |
proline rich 4 (lacrimal) |
| chr5_-_179499108 | 0.04 |
ENST00000521389.1 |
RNF130 |
ring finger protein 130 |
| chr19_+_54704610 | 0.02 |
ENST00000302907.4 |
RPS9 |
ribosomal protein S9 |
| chr4_-_69215467 | 0.01 |
ENST00000579690.1 |
YTHDC1 |
YTH domain containing 1 |
| chr2_+_102953608 | 0.01 |
ENST00000311734.2 ENST00000409584.1 |
IL1RL1 |
interleukin 1 receptor-like 1 |
| chr3_+_13521665 | 0.00 |
ENST00000295757.3 ENST00000402259.1 ENST00000402271.1 ENST00000446613.2 ENST00000404548.1 ENST00000404040.1 |
HDAC11 |
histone deacetylase 11 |
| chr5_-_179498703 | 0.00 |
ENST00000522208.2 |
RNF130 |
ring finger protein 130 |
Gene Ontology Analysis
Gene overrepresentation in C2:CP category:
| Log-likelihood per target | Total log-likelihood | Term | Description |
|---|---|---|---|
| 0.1 | 4.9 | PID TOLL ENDOGENOUS PATHWAY | Endogenous TLR signaling |
| 0.1 | 4.9 | PID ERBB NETWORK PATHWAY | ErbB receptor signaling network |
| 0.1 | 14.1 | PID AP1 PATHWAY | AP-1 transcription factor network |
| 0.1 | 9.2 | PID KIT PATHWAY | Signaling events mediated by Stem cell factor receptor (c-Kit) |
Gene overrepresentation in molecular_function category:
| Log-likelihood per target | Total log-likelihood | Term | Description |
|---|---|---|---|
| 1.1 | 14.1 | GO:0046870 | cadmium ion binding(GO:0046870) |
| 0.2 | 0.5 | GO:0004137 | deoxycytidine kinase activity(GO:0004137) thymidine kinase activity(GO:0004797) |
| 0.2 | 0.6 | GO:0008670 | 2,4-dienoyl-CoA reductase (NADPH) activity(GO:0008670) |
| 0.1 | 1.1 | GO:0035877 | death effector domain binding(GO:0035877) |
| 0.1 | 4.9 | GO:0042056 | chemoattractant activity(GO:0042056) |
| 0.1 | 1.0 | GO:0047760 | butyrate-CoA ligase activity(GO:0047760) |
| 0.1 | 4.9 | GO:0005154 | epidermal growth factor receptor binding(GO:0005154) |
| 0.1 | 9.9 | GO:0003705 | transcription factor activity, RNA polymerase II distal enhancer sequence-specific binding(GO:0003705) |
| 0.1 | 5.6 | GO:0017022 | myosin binding(GO:0017022) |
| 0.1 | 0.3 | GO:0016402 | pristanoyl-CoA oxidase activity(GO:0016402) |
| 0.0 | 0.5 | GO:0032393 | MHC class I receptor activity(GO:0032393) |
| 0.0 | 0.2 | GO:0016167 | glial cell-derived neurotrophic factor receptor activity(GO:0016167) |
| 0.0 | 0.8 | GO:0019198 | transmembrane receptor protein tyrosine phosphatase activity(GO:0005001) transmembrane receptor protein phosphatase activity(GO:0019198) |
| 0.0 | 0.1 | GO:0034186 | apolipoprotein A-I binding(GO:0034186) |
| 0.0 | 20.1 | GO:0008270 | zinc ion binding(GO:0008270) |
| 0.0 | 0.5 | GO:0016706 | oxidoreductase activity, acting on paired donors, with incorporation or reduction of molecular oxygen, 2-oxoglutarate as one donor, and incorporation of one atom each of oxygen into both donors(GO:0016706) |
| 0.0 | 0.5 | GO:0003823 | antigen binding(GO:0003823) |
| 0.0 | 0.7 | GO:0017080 | sodium channel regulator activity(GO:0017080) |
| 0.0 | 0.4 | GO:0004709 | MAP kinase kinase kinase activity(GO:0004709) |
Gene overrepresentation in C2:CP:REACTOME category:
| Log-likelihood per target | Total log-likelihood | Term | Description |
|---|---|---|---|
| 0.2 | 4.9 | REACTOME RIP MEDIATED NFKB ACTIVATION VIA DAI | Genes involved in RIP-mediated NFkB activation via DAI |
| 0.1 | 14.1 | REACTOME INTERFERON GAMMA SIGNALING | Genes involved in Interferon gamma signaling |
| 0.0 | 0.6 | REACTOME MITOCHONDRIAL FATTY ACID BETA OXIDATION | Genes involved in Mitochondrial Fatty Acid Beta-Oxidation |
| 0.0 | 0.3 | REACTOME CREATION OF C4 AND C2 ACTIVATORS | Genes involved in Creation of C4 and C2 activators |
| 0.0 | 0.5 | REACTOME G1 S SPECIFIC TRANSCRIPTION | Genes involved in G1/S-Specific Transcription |
Gene overrepresentation in biological_process category:
| Log-likelihood per target | Total log-likelihood | Term | Description |
|---|---|---|---|
| 3.3 | 10.0 | GO:0070563 | negative regulation of vitamin D receptor signaling pathway(GO:0070563) |
| 2.8 | 14.1 | GO:1990169 | detoxification of copper ion(GO:0010273) stress response to copper ion(GO:1990169) |
| 1.0 | 6.2 | GO:0036018 | cellular response to erythropoietin(GO:0036018) |
| 0.6 | 4.9 | GO:0060744 | thelarche(GO:0042695) mammary gland branching involved in thelarche(GO:0060744) |
| 0.6 | 14.2 | GO:0071294 | cellular response to zinc ion(GO:0071294) |
| 0.4 | 5.6 | GO:0030050 | vesicle transport along actin filament(GO:0030050) |
| 0.4 | 1.1 | GO:0014876 | response to injury involved in regulation of muscle adaptation(GO:0014876) |
| 0.2 | 0.5 | GO:0018197 | peptidyl-aspartic acid modification(GO:0018197) peptidyl-aspartic acid hydroxylation(GO:0042264) |
| 0.2 | 1.0 | GO:0034201 | response to oleic acid(GO:0034201) |
| 0.1 | 0.5 | GO:0046104 | thymidine metabolic process(GO:0046104) pyrimidine deoxyribonucleoside metabolic process(GO:0046125) |
| 0.1 | 4.9 | GO:0050716 | positive regulation of interleukin-1 secretion(GO:0050716) |
| 0.1 | 0.7 | GO:0010734 | protein glutathionylation(GO:0010731) regulation of protein glutathionylation(GO:0010732) negative regulation of protein glutathionylation(GO:0010734) |
| 0.1 | 0.3 | GO:0010936 | negative regulation of macrophage cytokine production(GO:0010936) |
| 0.0 | 0.5 | GO:0048251 | elastic fiber assembly(GO:0048251) |
| 0.0 | 0.4 | GO:0045647 | negative regulation of erythrocyte differentiation(GO:0045647) |
| 0.0 | 0.7 | GO:0002230 | positive regulation of defense response to virus by host(GO:0002230) |
| 0.0 | 0.8 | GO:0010842 | retina layer formation(GO:0010842) |
| 0.0 | 0.2 | GO:0033689 | negative regulation of osteoblast proliferation(GO:0033689) |
| 0.0 | 0.1 | GO:0090107 | regulation of high-density lipoprotein particle assembly(GO:0090107) |
| 0.0 | 0.2 | GO:0035860 | glial cell-derived neurotrophic factor receptor signaling pathway(GO:0035860) |
| 0.0 | 6.8 | GO:0007160 | cell-matrix adhesion(GO:0007160) |
| 0.0 | 0.3 | GO:0033539 | fatty acid beta-oxidation using acyl-CoA dehydrogenase(GO:0033539) |
| 0.0 | 0.1 | GO:0031337 | cellular response to phosphate starvation(GO:0016036) positive regulation of sulfur amino acid metabolic process(GO:0031337) positive regulation of homocysteine metabolic process(GO:0050668) |
| 0.0 | 0.1 | GO:0070315 | G1 to G0 transition involved in cell differentiation(GO:0070315) |
Gene overrepresentation in cellular_component category:
| Log-likelihood per target | Total log-likelihood | Term | Description |
|---|---|---|---|
| 1.0 | 7.6 | GO:0016012 | sarcoglycan complex(GO:0016012) |
| 0.2 | 4.9 | GO:0071682 | endocytic vesicle lumen(GO:0071682) |
| 0.1 | 0.5 | GO:0032541 | cortical endoplasmic reticulum(GO:0032541) |
| 0.1 | 0.3 | GO:0005602 | complement component C1 complex(GO:0005602) |
| 0.1 | 4.9 | GO:0033116 | endoplasmic reticulum-Golgi intermediate compartment membrane(GO:0033116) |
| 0.1 | 0.5 | GO:0071953 | elastic fiber(GO:0071953) |
| 0.0 | 5.6 | GO:0030864 | cortical actin cytoskeleton(GO:0030864) |
| 0.0 | 0.7 | GO:0005890 | sodium:potassium-exchanging ATPase complex(GO:0005890) |
| 0.0 | 30.5 | GO:0048471 | perinuclear region of cytoplasm(GO:0048471) |
| 0.0 | 0.5 | GO:0046658 | anchored component of plasma membrane(GO:0046658) |
| 0.0 | 0.1 | GO:0005713 | recombination nodule(GO:0005713) |
| 0.0 | 7.5 | GO:0000790 | nuclear chromatin(GO:0000790) |
| 0.0 | 1.1 | GO:0016529 | sarcoplasmic reticulum(GO:0016529) |