Project
ENCODE cell lines, expression (Ernst 2011)
Navigation
Downloads
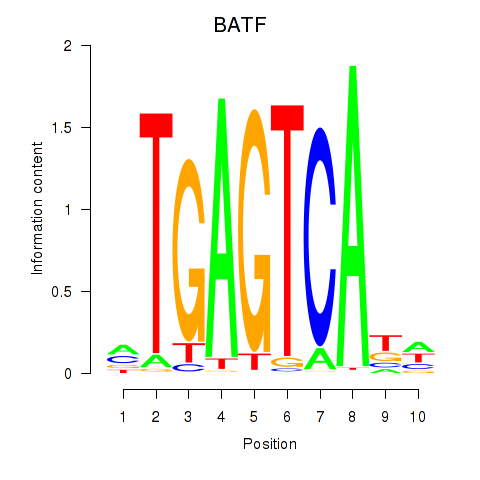
Results for BATF
Z-value: 1.39
Motif logo
Transcription factors associated with BATF
| Gene Symbol | Gene ID | Gene Info |
|---|---|---|
|
BATF
|
ENSG00000156127.6 | BATF |
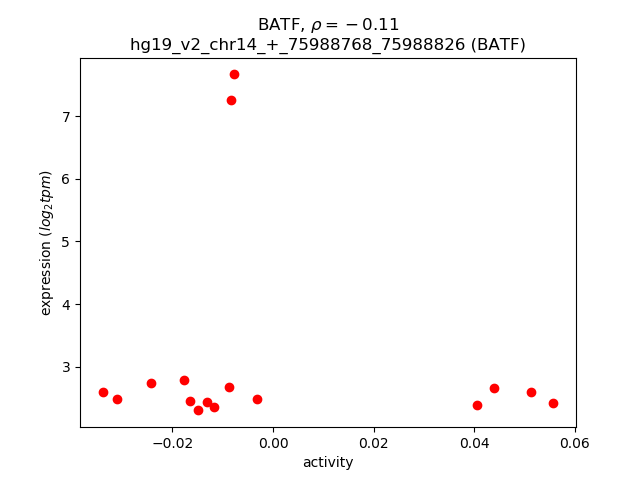
Activity-expression correlation:
| Gene | Promoter | Pearson corr. coef. | P-value | Plot |
|---|---|---|---|---|
| BATF | hg19_v2_chr14_+_75988768_75988826 | -0.11 | 6.8e-01 | Click! |
Activity profile of BATF motif
Sorted Z-values of BATF motif
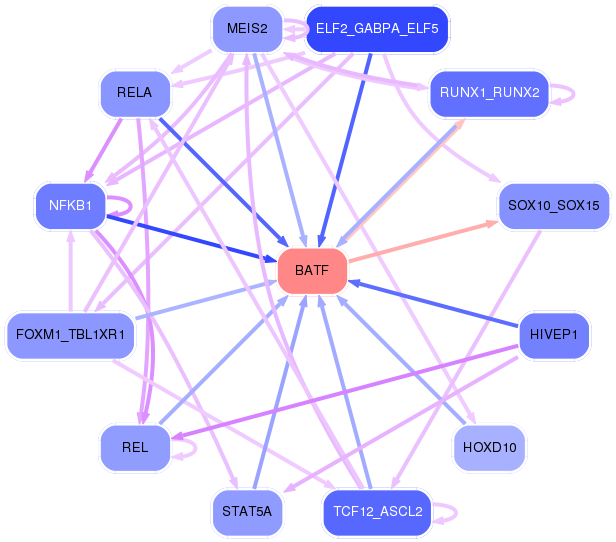
Network of associatons between targets according to the STRING database.

First level regulatory network of BATF
| Promoter | Score | Transcript | Gene | Gene Info |
|---|---|---|---|---|
| chr18_+_21452804 | 9.61 |
ENST00000269217.6 |
LAMA3 |
laminin, alpha 3 |
| chr18_+_21452964 | 8.61 |
ENST00000587184.1 |
LAMA3 |
laminin, alpha 3 |
| chr1_-_209824643 | 5.12 |
ENST00000391911.1 ENST00000415782.1 |
LAMB3 |
laminin, beta 3 |
| chr12_-_52845910 | 4.85 |
ENST00000252252.3 |
KRT6B |
keratin 6B |
| chr18_+_61442629 | 4.03 |
ENST00000398019.2 ENST00000540675.1 |
SERPINB7 |
serpin peptidase inhibitor, clade B (ovalbumin), member 7 |
| chr2_-_113594279 | 4.01 |
ENST00000416750.1 ENST00000418817.1 ENST00000263341.2 |
IL1B |
interleukin 1, beta |
| chr19_-_51504411 | 3.81 |
ENST00000593490.1 |
KLK8 |
kallikrein-related peptidase 8 |
| chr1_-_151965048 | 3.73 |
ENST00000368809.1 |
S100A10 |
S100 calcium binding protein A10 |
| chr1_+_153003671 | 3.18 |
ENST00000307098.4 |
SPRR1B |
small proline-rich protein 1B |
| chr17_-_39769005 | 3.17 |
ENST00000301653.4 ENST00000593067.1 |
KRT16 |
keratin 16 |
| chr1_-_59043166 | 2.87 |
ENST00000371225.2 |
TACSTD2 |
tumor-associated calcium signal transducer 2 |
| chr17_-_39677971 | 2.84 |
ENST00000393976.2 |
KRT15 |
keratin 15 |
| chr6_-_138428613 | 2.82 |
ENST00000421351.3 |
PERP |
PERP, TP53 apoptosis effector |
| chr12_+_13349650 | 2.65 |
ENST00000256951.5 ENST00000431267.2 ENST00000542474.1 ENST00000544053.1 |
EMP1 |
epithelial membrane protein 1 |
| chr7_+_129932974 | 2.63 |
ENST00000445470.2 ENST00000222482.4 ENST00000492072.1 ENST00000473956.1 ENST00000493259.1 ENST00000486598.1 |
CPA4 |
carboxypeptidase A4 |
| chr2_+_102618428 | 2.54 |
ENST00000457817.1 |
IL1R2 |
interleukin 1 receptor, type II |
| chr4_-_143226979 | 2.46 |
ENST00000514525.1 |
INPP4B |
inositol polyphosphate-4-phosphatase, type II, 105kDa |
| chr12_+_56324756 | 2.44 |
ENST00000331886.5 ENST00000555090.1 |
DGKA |
diacylglycerol kinase, alpha 80kDa |
| chr19_-_39264072 | 2.35 |
ENST00000599035.1 ENST00000378626.4 |
LGALS7 |
lectin, galactoside-binding, soluble, 7 |
| chr18_+_61445007 | 2.32 |
ENST00000447428.1 ENST00000546027.1 |
SERPINB7 |
serpin peptidase inhibitor, clade B (ovalbumin), member 7 |
| chr19_+_38755203 | 2.23 |
ENST00000587090.1 ENST00000454580.3 |
SPINT2 |
serine peptidase inhibitor, Kunitz type, 2 |
| chr19_+_38755042 | 2.20 |
ENST00000301244.7 |
SPINT2 |
serine peptidase inhibitor, Kunitz type, 2 |
| chr1_-_153588765 | 2.19 |
ENST00000368701.1 ENST00000344616.2 |
S100A14 |
S100 calcium binding protein A14 |
| chr19_+_39279838 | 2.14 |
ENST00000314980.4 |
LGALS7B |
lectin, galactoside-binding, soluble, 7B |
| chr11_-_119993979 | 2.14 |
ENST00000524816.3 ENST00000525327.1 |
TRIM29 |
tripartite motif containing 29 |
| chr2_-_113542063 | 2.13 |
ENST00000263339.3 |
IL1A |
interleukin 1, alpha |
| chr14_-_67859422 | 2.12 |
ENST00000556532.1 |
PLEK2 |
pleckstrin 2 |
| chr4_-_143227088 | 2.08 |
ENST00000511838.1 |
INPP4B |
inositol polyphosphate-4-phosphatase, type II, 105kDa |
| chr9_+_33795533 | 2.07 |
ENST00000379405.3 |
PRSS3 |
protease, serine, 3 |
| chr16_+_56685796 | 2.05 |
ENST00000334346.2 ENST00000562399.1 |
MT1B |
metallothionein 1B |
| chr4_-_143481822 | 1.99 |
ENST00000510812.1 |
INPP4B |
inositol polyphosphate-4-phosphatase, type II, 105kDa |
| chr19_-_51487071 | 1.93 |
ENST00000391807.1 ENST00000593904.1 |
KLK7 |
kallikrein-related peptidase 7 |
| chr3_-_151034734 | 1.92 |
ENST00000260843.4 |
GPR87 |
G protein-coupled receptor 87 |
| chr7_+_55177416 | 1.91 |
ENST00000450046.1 ENST00000454757.2 |
EGFR |
epidermal growth factor receptor |
| chr7_-_24797546 | 1.91 |
ENST00000414428.1 ENST00000419307.1 ENST00000342947.3 |
DFNA5 |
deafness, autosomal dominant 5 |
| chr7_+_48128194 | 1.87 |
ENST00000416681.1 ENST00000331803.4 ENST00000432131.1 |
UPP1 |
uridine phosphorylase 1 |
| chr1_+_223889285 | 1.86 |
ENST00000433674.2 |
CAPN2 |
calpain 2, (m/II) large subunit |
| chr7_+_48128316 | 1.86 |
ENST00000341253.4 |
UPP1 |
uridine phosphorylase 1 |
| chr17_+_48609903 | 1.72 |
ENST00000268933.3 |
EPN3 |
epsin 3 |
| chr1_+_183155373 | 1.69 |
ENST00000493293.1 ENST00000264144.4 |
LAMC2 |
laminin, gamma 2 |
| chr20_-_43883197 | 1.69 |
ENST00000338380.2 |
SLPI |
secretory leukocyte peptidase inhibitor |
| chr2_+_192141611 | 1.66 |
ENST00000392316.1 |
MYO1B |
myosin IB |
| chr4_+_169753156 | 1.62 |
ENST00000393726.3 ENST00000507735.1 |
PALLD |
palladin, cytoskeletal associated protein |
| chr5_-_150948414 | 1.62 |
ENST00000261800.5 |
FAT2 |
FAT atypical cadherin 2 |
| chr1_+_44398943 | 1.53 |
ENST00000372359.5 ENST00000414809.3 |
ARTN |
artemin |
| chr16_+_56642489 | 1.51 |
ENST00000561491.1 |
MT2A |
metallothionein 2A |
| chr11_-_119993734 | 1.48 |
ENST00000533302.1 |
TRIM29 |
tripartite motif containing 29 |
| chr16_+_56642041 | 1.47 |
ENST00000245185.5 |
MT2A |
metallothionein 2A |
| chr11_-_33744487 | 1.39 |
ENST00000426650.2 |
CD59 |
CD59 molecule, complement regulatory protein |
| chr1_+_46640750 | 1.38 |
ENST00000372003.1 |
TSPAN1 |
tetraspanin 1 |
| chr2_+_234590556 | 1.36 |
ENST00000373426.3 |
UGT1A7 |
UDP glucuronosyltransferase 1 family, polypeptide A7 |
| chr11_+_101983176 | 1.35 |
ENST00000524575.1 |
YAP1 |
Yes-associated protein 1 |
| chr15_+_41136216 | 1.35 |
ENST00000562057.1 ENST00000344051.4 |
SPINT1 |
serine peptidase inhibitor, Kunitz type 1 |
| chr17_-_7493390 | 1.34 |
ENST00000538513.2 ENST00000570788.1 ENST00000250055.2 |
SOX15 |
SRY (sex determining region Y)-box 15 |
| chr3_-_127455200 | 1.31 |
ENST00000398101.3 |
MGLL |
monoglyceride lipase |
| chr1_+_158979792 | 1.30 |
ENST00000359709.3 ENST00000430894.2 |
IFI16 |
interferon, gamma-inducible protein 16 |
| chr15_+_41136586 | 1.29 |
ENST00000431806.1 |
SPINT1 |
serine peptidase inhibitor, Kunitz type 1 |
| chr1_+_86889769 | 1.29 |
ENST00000370565.4 |
CLCA2 |
chloride channel accessory 2 |
| chr20_+_4667094 | 1.27 |
ENST00000424424.1 ENST00000457586.1 |
PRNP |
prion protein |
| chr1_+_152956549 | 1.27 |
ENST00000307122.2 |
SPRR1A |
small proline-rich protein 1A |
| chr3_+_30647994 | 1.26 |
ENST00000295754.5 |
TGFBR2 |
transforming growth factor, beta receptor II (70/80kDa) |
| chr20_+_43803517 | 1.25 |
ENST00000243924.3 |
PI3 |
peptidase inhibitor 3, skin-derived |
| chr17_+_18625336 | 1.23 |
ENST00000395671.4 ENST00000571542.1 ENST00000395672.2 ENST00000414850.2 ENST00000424146.2 |
TRIM16L |
tripartite motif containing 16-like |
| chr11_-_102668879 | 1.23 |
ENST00000315274.6 |
MMP1 |
matrix metallopeptidase 1 (interstitial collagenase) |
| chr10_+_88728189 | 1.21 |
ENST00000416348.1 |
ADIRF |
adipogenesis regulatory factor |
| chr2_-_106013400 | 1.20 |
ENST00000409807.1 |
FHL2 |
four and a half LIM domains 2 |
| chr11_-_33743952 | 1.20 |
ENST00000534312.1 |
CD59 |
CD59 molecule, complement regulatory protein |
| chr1_+_158979686 | 1.19 |
ENST00000368132.3 ENST00000295809.7 |
IFI16 |
interferon, gamma-inducible protein 16 |
| chr2_-_220119280 | 1.17 |
ENST00000392088.2 |
TUBA4A |
tubulin, alpha 4a |
| chr19_-_45909585 | 1.17 |
ENST00000593226.1 ENST00000418234.2 |
PPP1R13L |
protein phosphatase 1, regulatory subunit 13 like |
| chr11_+_394196 | 1.15 |
ENST00000331563.2 ENST00000531857.1 |
PKP3 |
plakophilin 3 |
| chr11_-_104972158 | 1.15 |
ENST00000598974.1 ENST00000593315.1 ENST00000594519.1 ENST00000415981.2 ENST00000525374.1 ENST00000375707.1 |
CASP1 CARD16 CARD17 |
caspase 1, apoptosis-related cysteine peptidase caspase recruitment domain family, member 16 caspase recruitment domain family, member 17 |
| chr20_+_19867150 | 1.14 |
ENST00000255006.6 |
RIN2 |
Ras and Rab interactor 2 |
| chr15_+_71145578 | 1.12 |
ENST00000544974.2 ENST00000558546.1 |
LRRC49 |
leucine rich repeat containing 49 |
| chr3_-_32022733 | 1.12 |
ENST00000438237.2 ENST00000396556.2 |
OSBPL10 |
oxysterol binding protein-like 10 |
| chr5_+_135394840 | 1.11 |
ENST00000503087.1 |
TGFBI |
transforming growth factor, beta-induced, 68kDa |
| chr12_-_85306594 | 1.09 |
ENST00000266682.5 |
SLC6A15 |
solute carrier family 6 (neutral amino acid transporter), member 15 |
| chr4_+_47487285 | 1.08 |
ENST00000273859.3 ENST00000504445.1 |
ATP10D |
ATPase, class V, type 10D |
| chr2_-_86094764 | 1.07 |
ENST00000393808.3 |
ST3GAL5 |
ST3 beta-galactoside alpha-2,3-sialyltransferase 5 |
| chr7_-_80551671 | 1.07 |
ENST00000419255.2 ENST00000544525.1 |
SEMA3C |
sema domain, immunoglobulin domain (Ig), short basic domain, secreted, (semaphorin) 3C |
| chr20_-_56286479 | 1.06 |
ENST00000265626.4 |
PMEPA1 |
prostate transmembrane protein, androgen induced 1 |
| chr4_+_169842707 | 1.05 |
ENST00000503290.1 |
PALLD |
palladin, cytoskeletal associated protein |
| chr3_+_30648066 | 1.04 |
ENST00000359013.4 |
TGFBR2 |
transforming growth factor, beta receptor II (70/80kDa) |
| chr1_+_158979680 | 1.04 |
ENST00000368131.4 ENST00000340979.6 |
IFI16 |
interferon, gamma-inducible protein 16 |
| chr22_+_45148432 | 1.03 |
ENST00000389774.2 ENST00000396119.2 ENST00000336963.4 ENST00000356099.6 ENST00000412433.1 |
ARHGAP8 |
Rho GTPase activating protein 8 |
| chr6_+_30852130 | 1.02 |
ENST00000428153.2 ENST00000376568.3 ENST00000452441.1 ENST00000515219.1 |
DDR1 |
discoidin domain receptor tyrosine kinase 1 |
| chr17_+_73717407 | 1.01 |
ENST00000579662.1 |
ITGB4 |
integrin, beta 4 |
| chr1_+_233765353 | 1.01 |
ENST00000366620.1 |
KCNK1 |
potassium channel, subfamily K, member 1 |
| chr6_-_46703430 | 0.99 |
ENST00000537365.1 |
PLA2G7 |
phospholipase A2, group VII (platelet-activating factor acetylhydrolase, plasma) |
| chr6_+_121756809 | 0.99 |
ENST00000282561.3 |
GJA1 |
gap junction protein, alpha 1, 43kDa |
| chr1_-_153521597 | 0.99 |
ENST00000368712.1 |
S100A3 |
S100 calcium binding protein A3 |
| chr4_-_10023095 | 0.97 |
ENST00000264784.3 |
SLC2A9 |
solute carrier family 2 (facilitated glucose transporter), member 9 |
| chr11_-_6341844 | 0.96 |
ENST00000303927.3 |
PRKCDBP |
protein kinase C, delta binding protein |
| chr9_+_706842 | 0.95 |
ENST00000382293.3 |
KANK1 |
KN motif and ankyrin repeat domains 1 |
| chr11_+_35198118 | 0.92 |
ENST00000525211.1 ENST00000526000.1 ENST00000279452.6 ENST00000527889.1 |
CD44 |
CD44 molecule (Indian blood group) |
| chr16_+_57662138 | 0.92 |
ENST00000562414.1 ENST00000561969.1 ENST00000562631.1 ENST00000563445.1 ENST00000565338.1 ENST00000567702.1 |
GPR56 |
G protein-coupled receptor 56 |
| chr6_-_56507586 | 0.92 |
ENST00000439203.1 ENST00000518935.1 ENST00000446842.2 ENST00000370765.6 ENST00000244364.6 |
DST |
dystonin |
| chr18_+_61637159 | 0.91 |
ENST00000397985.2 ENST00000353706.2 ENST00000542677.1 ENST00000397988.3 ENST00000448851.1 |
SERPINB8 |
serpin peptidase inhibitor, clade B (ovalbumin), member 8 |
| chr2_+_234621551 | 0.90 |
ENST00000608381.1 ENST00000373414.3 |
UGT1A1 UGT1A5 |
UDP glucuronosyltransferase 1 family, polypeptide A8 UDP glucuronosyltransferase 1 family, polypeptide A5 |
| chr2_+_102615416 | 0.90 |
ENST00000393414.2 |
IL1R2 |
interleukin 1 receptor, type II |
| chr2_-_85637459 | 0.89 |
ENST00000409921.1 |
CAPG |
capping protein (actin filament), gelsolin-like |
| chr5_-_175843524 | 0.88 |
ENST00000502877.1 |
CLTB |
clathrin, light chain B |
| chr4_-_36246060 | 0.87 |
ENST00000303965.4 |
ARAP2 |
ArfGAP with RhoGAP domain, ankyrin repeat and PH domain 2 |
| chr4_+_74735102 | 0.87 |
ENST00000395761.3 |
CXCL1 |
chemokine (C-X-C motif) ligand 1 (melanoma growth stimulating activity, alpha) |
| chr19_-_51523412 | 0.87 |
ENST00000391805.1 ENST00000599077.1 |
KLK10 |
kallikrein-related peptidase 10 |
| chr3_-_49395705 | 0.86 |
ENST00000419349.1 |
GPX1 |
glutathione peroxidase 1 |
| chr19_-_44285401 | 0.86 |
ENST00000262888.3 |
KCNN4 |
potassium intermediate/small conductance calcium-activated channel, subfamily N, member 4 |
| chr1_-_152009460 | 0.85 |
ENST00000271638.2 |
S100A11 |
S100 calcium binding protein A11 |
| chr20_+_4666882 | 0.84 |
ENST00000379440.4 ENST00000430350.2 |
PRNP |
prion protein |
| chr11_-_2950642 | 0.84 |
ENST00000314222.4 |
PHLDA2 |
pleckstrin homology-like domain, family A, member 2 |
| chr15_+_52155001 | 0.83 |
ENST00000544199.1 |
TMOD3 |
tropomodulin 3 (ubiquitous) |
| chr3_+_105085734 | 0.83 |
ENST00000306107.5 |
ALCAM |
activated leukocyte cell adhesion molecule |
| chr5_+_125695805 | 0.81 |
ENST00000513040.1 |
GRAMD3 |
GRAM domain containing 3 |
| chr1_-_153113927 | 0.81 |
ENST00000368752.4 |
SPRR2B |
small proline-rich protein 2B |
| chr2_+_201450591 | 0.81 |
ENST00000374700.2 |
AOX1 |
aldehyde oxidase 1 |
| chr16_+_56691838 | 0.80 |
ENST00000394501.2 |
MT1F |
metallothionein 1F |
| chr16_+_57662419 | 0.80 |
ENST00000388812.4 ENST00000538815.1 ENST00000456916.1 ENST00000567154.1 ENST00000388813.5 ENST00000562558.1 ENST00000566271.2 |
GPR56 |
G protein-coupled receptor 56 |
| chr17_+_48712206 | 0.79 |
ENST00000427699.1 ENST00000285238.8 |
ABCC3 |
ATP-binding cassette, sub-family C (CFTR/MRP), member 3 |
| chr9_+_75766652 | 0.79 |
ENST00000257497.6 |
ANXA1 |
annexin A1 |
| chr9_+_130911770 | 0.78 |
ENST00000372998.1 |
LCN2 |
lipocalin 2 |
| chr2_-_85641162 | 0.78 |
ENST00000447219.2 ENST00000409670.1 ENST00000409724.1 |
CAPG |
capping protein (actin filament), gelsolin-like |
| chr2_-_151344172 | 0.77 |
ENST00000375734.2 ENST00000263895.4 ENST00000454202.1 |
RND3 |
Rho family GTPase 3 |
| chr16_+_56691606 | 0.76 |
ENST00000334350.6 |
MT1F |
metallothionein 1F |
| chr16_+_56691911 | 0.76 |
ENST00000568475.1 |
MT1F |
metallothionein 1F |
| chr5_-_175843569 | 0.76 |
ENST00000310418.4 ENST00000345807.2 |
CLTB |
clathrin, light chain B |
| chr11_+_131240373 | 0.76 |
ENST00000374791.3 ENST00000436745.1 |
NTM |
neurotrimin |
| chr11_-_65667997 | 0.75 |
ENST00000312562.2 ENST00000534222.1 |
FOSL1 |
FOS-like antigen 1 |
| chr11_+_5710919 | 0.75 |
ENST00000379965.3 ENST00000425490.1 |
TRIM22 |
tripartite motif containing 22 |
| chr3_-_149095652 | 0.74 |
ENST00000305366.3 |
TM4SF1 |
transmembrane 4 L six family member 1 |
| chr1_-_153521714 | 0.73 |
ENST00000368713.3 |
S100A3 |
S100 calcium binding protein A3 |
| chr18_+_56338750 | 0.72 |
ENST00000345724.3 |
MALT1 |
mucosa associated lymphoid tissue lymphoma translocation gene 1 |
| chr6_-_32784687 | 0.71 |
ENST00000447394.1 ENST00000438763.2 |
HLA-DOB |
major histocompatibility complex, class II, DO beta |
| chr8_-_145016692 | 0.71 |
ENST00000357649.2 |
PLEC |
plectin |
| chr3_-_48632593 | 0.71 |
ENST00000454817.1 ENST00000328333.8 |
COL7A1 |
collagen, type VII, alpha 1 |
| chr12_+_9144626 | 0.71 |
ENST00000543895.1 |
KLRG1 |
killer cell lectin-like receptor subfamily G, member 1 |
| chr22_+_31488433 | 0.71 |
ENST00000455608.1 |
SMTN |
smoothelin |
| chr9_+_130911723 | 0.70 |
ENST00000277480.2 ENST00000373013.2 ENST00000540948.1 |
LCN2 |
lipocalin 2 |
| chr7_-_87856303 | 0.70 |
ENST00000394641.3 |
SRI |
sorcin |
| chr16_-_11680759 | 0.69 |
ENST00000571459.1 ENST00000570798.1 ENST00000572255.1 ENST00000574763.1 ENST00000574703.1 ENST00000571277.1 ENST00000381810.3 |
LITAF |
lipopolysaccharide-induced TNF factor |
| chr14_+_58666824 | 0.69 |
ENST00000254286.4 |
ACTR10 |
actin-related protein 10 homolog (S. cerevisiae) |
| chr16_-_84538218 | 0.69 |
ENST00000562447.1 ENST00000565765.1 ENST00000535580.1 ENST00000343629.6 |
TLDC1 |
TBC/LysM-associated domain containing 1 |
| chr17_+_73717551 | 0.69 |
ENST00000450894.3 |
ITGB4 |
integrin, beta 4 |
| chr1_+_158985457 | 0.68 |
ENST00000567661.1 ENST00000474473.1 |
IFI16 |
interferon, gamma-inducible protein 16 |
| chr12_+_56324933 | 0.67 |
ENST00000549629.1 ENST00000555218.1 |
DGKA |
diacylglycerol kinase, alpha 80kDa |
| chr5_+_66124590 | 0.67 |
ENST00000490016.2 ENST00000403666.1 ENST00000450827.1 |
MAST4 |
microtubule associated serine/threonine kinase family member 4 |
| chr19_-_51523275 | 0.67 |
ENST00000309958.3 |
KLK10 |
kallikrein-related peptidase 10 |
| chr18_+_56338618 | 0.67 |
ENST00000348428.3 |
MALT1 |
mucosa associated lymphoid tissue lymphoma translocation gene 1 |
| chr19_-_45982076 | 0.67 |
ENST00000423698.2 |
ERCC1 |
excision repair cross-complementing rodent repair deficiency, complementation group 1 (includes overlapping antisense sequence) |
| chr12_-_15104040 | 0.67 |
ENST00000541644.1 ENST00000545895.1 |
ARHGDIB |
Rho GDP dissociation inhibitor (GDI) beta |
| chr11_-_33744256 | 0.67 |
ENST00000415002.2 ENST00000437761.2 ENST00000445143.2 |
CD59 |
CD59 molecule, complement regulatory protein |
| chr11_+_121163466 | 0.66 |
ENST00000527762.1 ENST00000534230.1 ENST00000392789.2 |
SC5D |
sterol-C5-desaturase |
| chr1_+_201252580 | 0.66 |
ENST00000367324.3 ENST00000263946.3 |
PKP1 |
plakophilin 1 (ectodermal dysplasia/skin fragility syndrome) |
| chr6_-_2842087 | 0.65 |
ENST00000537185.1 |
SERPINB1 |
serpin peptidase inhibitor, clade B (ovalbumin), member 1 |
| chr20_-_56265680 | 0.65 |
ENST00000414037.1 |
PMEPA1 |
prostate transmembrane protein, androgen induced 1 |
| chr14_+_55590646 | 0.65 |
ENST00000553493.1 |
LGALS3 |
lectin, galactoside-binding, soluble, 3 |
| chr1_+_26605618 | 0.64 |
ENST00000270792.5 |
SH3BGRL3 |
SH3 domain binding glutamic acid-rich protein like 3 |
| chr1_-_205290865 | 0.63 |
ENST00000367157.3 |
NUAK2 |
NUAK family, SNF1-like kinase, 2 |
| chr18_-_33702078 | 0.63 |
ENST00000586829.1 |
SLC39A6 |
solute carrier family 39 (zinc transporter), member 6 |
| chr11_-_6341724 | 0.63 |
ENST00000530979.1 |
PRKCDBP |
protein kinase C, delta binding protein |
| chr8_-_145025044 | 0.62 |
ENST00000322810.4 |
PLEC |
plectin |
| chr16_-_10652993 | 0.62 |
ENST00000536829.1 |
EMP2 |
epithelial membrane protein 2 |
| chr11_-_65667884 | 0.61 |
ENST00000448083.2 ENST00000531493.1 ENST00000532401.1 |
FOSL1 |
FOS-like antigen 1 |
| chr8_-_42065187 | 0.60 |
ENST00000270189.6 ENST00000352041.3 ENST00000220809.4 |
PLAT |
plasminogen activator, tissue |
| chr2_+_113763031 | 0.60 |
ENST00000259211.6 |
IL36A |
interleukin 36, alpha |
| chr1_-_169337176 | 0.60 |
ENST00000472647.1 ENST00000367811.3 |
NME7 |
NME/NM23 family member 7 |
| chr19_-_42463418 | 0.59 |
ENST00000600292.1 ENST00000601078.1 ENST00000601891.1 ENST00000222008.6 |
RABAC1 |
Rab acceptor 1 (prenylated) |
| chr15_-_71146480 | 0.59 |
ENST00000299213.8 |
LARP6 |
La ribonucleoprotein domain family, member 6 |
| chr9_-_21335356 | 0.59 |
ENST00000359039.4 |
KLHL9 |
kelch-like family member 9 |
| chr14_-_102771462 | 0.59 |
ENST00000522874.1 |
MOK |
MOK protein kinase |
| chr3_+_158787041 | 0.59 |
ENST00000471575.1 ENST00000476809.1 ENST00000485419.1 |
IQCJ-SCHIP1 |
IQCJ-SCHIP1 readthrough |
| chr3_+_36421826 | 0.59 |
ENST00000273183.3 |
STAC |
SH3 and cysteine rich domain |
| chr17_+_1936687 | 0.59 |
ENST00000570477.1 |
DPH1 |
diphthamide biosynthesis 1 |
| chr11_-_104817919 | 0.58 |
ENST00000533252.1 |
CASP4 |
caspase 4, apoptosis-related cysteine peptidase |
| chr6_-_84140757 | 0.58 |
ENST00000541327.1 ENST00000369705.3 ENST00000543031.1 |
ME1 |
malic enzyme 1, NADP(+)-dependent, cytosolic |
| chr6_-_2842219 | 0.57 |
ENST00000380739.5 |
SERPINB1 |
serpin peptidase inhibitor, clade B (ovalbumin), member 1 |
| chr14_+_94577074 | 0.57 |
ENST00000444961.1 ENST00000448882.1 ENST00000557098.1 ENST00000554800.1 ENST00000556544.1 ENST00000298902.5 ENST00000555819.1 ENST00000557634.1 ENST00000555744.1 |
IFI27 |
interferon, alpha-inducible protein 27 |
| chr5_+_36608422 | 0.56 |
ENST00000381918.3 |
SLC1A3 |
solute carrier family 1 (glial high affinity glutamate transporter), member 3 |
| chr7_+_134528635 | 0.56 |
ENST00000445569.2 |
CALD1 |
caldesmon 1 |
| chr21_-_27542972 | 0.56 |
ENST00000346798.3 ENST00000439274.2 ENST00000354192.3 ENST00000348990.5 ENST00000357903.3 ENST00000358918.3 ENST00000359726.3 |
APP |
amyloid beta (A4) precursor protein |
| chr3_-_46735132 | 0.55 |
ENST00000415953.1 |
ALS2CL |
ALS2 C-terminal like |
| chr13_+_78109804 | 0.55 |
ENST00000535157.1 |
SCEL |
sciellin |
| chr13_+_78109884 | 0.54 |
ENST00000377246.3 ENST00000349847.3 |
SCEL |
sciellin |
| chr12_-_10573149 | 0.54 |
ENST00000381904.2 ENST00000381903.2 ENST00000396439.2 |
KLRC3 |
killer cell lectin-like receptor subfamily C, member 3 |
| chr19_+_6531010 | 0.54 |
ENST00000245817.3 |
TNFSF9 |
tumor necrosis factor (ligand) superfamily, member 9 |
| chr22_+_23046750 | 0.54 |
ENST00000390307.2 |
IGLV3-22 |
immunoglobulin lambda variable 3-22 (gene/pseudogene) |
| chr7_+_142457315 | 0.54 |
ENST00000486171.1 ENST00000311737.7 |
PRSS1 |
protease, serine, 1 (trypsin 1) |
| chr12_+_75874460 | 0.53 |
ENST00000266659.3 |
GLIPR1 |
GLI pathogenesis-related 1 |
| chr1_-_6420737 | 0.53 |
ENST00000541130.1 ENST00000377845.3 |
ACOT7 |
acyl-CoA thioesterase 7 |
| chr12_-_33049690 | 0.53 |
ENST00000070846.6 ENST00000340811.4 |
PKP2 |
plakophilin 2 |
| chrX_-_153141302 | 0.53 |
ENST00000361699.4 ENST00000543994.1 ENST00000370057.3 ENST00000538883.1 ENST00000361981.3 |
L1CAM |
L1 cell adhesion molecule |
| chr9_+_71819927 | 0.52 |
ENST00000535702.1 |
TJP2 |
tight junction protein 2 |
| chr17_+_74381343 | 0.52 |
ENST00000392496.3 |
SPHK1 |
sphingosine kinase 1 |
| chr17_-_38657849 | 0.52 |
ENST00000254051.6 |
TNS4 |
tensin 4 |
| chr1_+_26503894 | 0.51 |
ENST00000361530.6 ENST00000374253.5 |
CNKSR1 |
connector enhancer of kinase suppressor of Ras 1 |
| chr15_-_72523924 | 0.51 |
ENST00000566809.1 ENST00000567087.1 ENST00000569050.1 ENST00000568883.1 |
PKM |
pyruvate kinase, muscle |
| chr1_+_26606608 | 0.51 |
ENST00000319041.6 |
SH3BGRL3 |
SH3 domain binding glutamic acid-rich protein like 3 |
| chr1_+_169337172 | 0.51 |
ENST00000367807.3 ENST00000367808.3 ENST00000329281.2 ENST00000420531.1 |
BLZF1 |
basic leucine zipper nuclear factor 1 |
| chr2_+_234545092 | 0.51 |
ENST00000344644.5 |
UGT1A10 |
UDP glucuronosyltransferase 1 family, polypeptide A10 |
| chr21_+_42798094 | 0.50 |
ENST00000398598.3 ENST00000455164.2 ENST00000424365.1 |
MX1 |
myxovirus (influenza virus) resistance 1, interferon-inducible protein p78 (mouse) |
| chr11_-_108408895 | 0.50 |
ENST00000443411.1 ENST00000533052.1 |
EXPH5 |
exophilin 5 |
Gene Ontology Analysis
Gene overrepresentation in C2:CP category:
| Log-likelihood per target | Total log-likelihood | Term | Description |
|---|---|---|---|
| 0.0 | 1.4 | PID PLK1 PATHWAY | PLK1 signaling events |
| 0.0 | 0.7 | PID P38 ALPHA BETA PATHWAY | Regulation of p38-alpha and p38-beta |
Gene overrepresentation in molecular_function category:
| Log-likelihood per target | Total log-likelihood | Term | Description |
|---|---|---|---|
| 0.2 | 0.7 | GO:0008330 | protein tyrosine/threonine phosphatase activity(GO:0008330) |
| 0.2 | 0.5 | GO:0034353 | RNA pyrophosphohydrolase activity(GO:0034353) |
| 0.1 | 0.3 | GO:1990404 | protein ADP-ribosylase activity(GO:1990404) |
| 0.1 | 1.6 | GO:0001134 | transcription factor activity, transcription factor recruiting(GO:0001134) |
| 0.1 | 0.8 | GO:0016813 | hydrolase activity, acting on carbon-nitrogen (but not peptide) bonds, in linear amidines(GO:0016813) |
| 0.0 | 0.2 | GO:0004013 | adenosylhomocysteinase activity(GO:0004013) trialkylsulfonium hydrolase activity(GO:0016802) |
| 0.0 | 1.7 | GO:0008138 | protein tyrosine/serine/threonine phosphatase activity(GO:0008138) |
| 0.0 | 0.1 | GO:0016434 | rRNA (cytosine) methyltransferase activity(GO:0016434) |
| 0.0 | 0.5 | GO:0030957 | Tat protein binding(GO:0030957) |
| 0.0 | 0.1 | GO:0098770 | FBXO family protein binding(GO:0098770) |
| 0.0 | 0.1 | GO:0003689 | DNA clamp loader activity(GO:0003689) protein-DNA loading ATPase activity(GO:0033170) |
| 0.0 | 0.2 | GO:0005078 | MAP-kinase scaffold activity(GO:0005078) |
| 0.0 | 0.3 | GO:0004012 | phospholipid-translocating ATPase activity(GO:0004012) |
| 0.0 | 0.4 | GO:0016922 | ligand-dependent nuclear receptor binding(GO:0016922) |
Gene overrepresentation in biological_process category:
| Log-likelihood per target | Total log-likelihood | Term | Description |
|---|---|---|---|
| 0.1 | 2.4 | GO:0071850 | mitotic cell cycle arrest(GO:0071850) |
| 0.1 | 0.3 | GO:0018312 | peptidyl-serine ADP-ribosylation(GO:0018312) |
| 0.1 | 0.8 | GO:0006931 | substrate-dependent cell migration, cell attachment to substrate(GO:0006931) |
| 0.1 | 0.8 | GO:0000050 | urea cycle(GO:0000050) |
| 0.0 | 1.6 | GO:1902895 | positive regulation of pri-miRNA transcription from RNA polymerase II promoter(GO:1902895) |
| 0.0 | 0.1 | GO:0035720 | intraciliary anterograde transport(GO:0035720) |
| 0.0 | 0.2 | GO:0033353 | S-adenosylmethionine cycle(GO:0033353) |
| 0.0 | 0.1 | GO:0051462 | cortisol secretion(GO:0043400) positive regulation of corticotropin secretion(GO:0051461) regulation of cortisol secretion(GO:0051462) negative regulation of glucagon secretion(GO:0070093) cellular response to cocaine(GO:0071314) positive regulation of corticosterone secretion(GO:2000854) |
| 0.0 | 0.1 | GO:1901895 | negative regulation of calcium-transporting ATPase activity(GO:1901895) |
| 0.0 | 0.1 | GO:1902523 | positive regulation of protein K63-linked ubiquitination(GO:1902523) |
| 0.0 | 0.5 | GO:0071028 | nuclear RNA surveillance(GO:0071027) nuclear mRNA surveillance(GO:0071028) |
| 0.0 | 0.7 | GO:0007567 | parturition(GO:0007567) |
| 0.0 | 0.2 | GO:0090074 | negative regulation of protein homodimerization activity(GO:0090074) |
| 0.0 | 0.5 | GO:0031163 | iron-sulfur cluster assembly(GO:0016226) metallo-sulfur cluster assembly(GO:0031163) |
| 0.0 | 0.2 | GO:1902474 | positive regulation of protein localization to synapse(GO:1902474) |
| 0.0 | 0.2 | GO:0006384 | transcription initiation from RNA polymerase III promoter(GO:0006384) |
| 0.0 | 0.1 | GO:0043163 | cell envelope organization(GO:0043163) external encapsulating structure organization(GO:0045229) |
| 0.0 | 2.7 | GO:0021987 | cerebral cortex development(GO:0021987) |
| 0.0 | 0.1 | GO:0070475 | rRNA base methylation(GO:0070475) |
| 0.0 | 0.5 | GO:0097352 | autophagosome maturation(GO:0097352) |
| 0.0 | 0.4 | GO:0002076 | osteoblast development(GO:0002076) |
| 0.0 | 0.3 | GO:0034204 | lipid translocation(GO:0034204) phospholipid translocation(GO:0045332) |
Gene overrepresentation in cellular_component category:
| Log-likelihood per target | Total log-likelihood | Term | Description |
|---|---|---|---|
| 2.9 | 23.3 | GO:0005610 | laminin-5 complex(GO:0005610) |
| 0.6 | 1.9 | GO:0097489 | multivesicular body, internal vesicle lumen(GO:0097489) |
| 0.6 | 1.7 | GO:0005607 | laminin-2 complex(GO:0005607) |
| 0.3 | 3.1 | GO:0030057 | desmosome(GO:0030057) |
| 0.3 | 5.4 | GO:0031362 | anchored component of external side of plasma membrane(GO:0031362) |
| 0.3 | 1.7 | GO:0072557 | IPAF inflammasome complex(GO:0072557) |
| 0.3 | 1.4 | GO:0032449 | CBM complex(GO:0032449) |
| 0.3 | 1.9 | GO:0097209 | epidermal lamellar body(GO:0097209) |
| 0.3 | 1.4 | GO:0071148 | TEAD-1-YAP complex(GO:0071148) |
| 0.3 | 2.3 | GO:0070022 | transforming growth factor beta receptor homodimeric complex(GO:0070022) |
| 0.2 | 11.7 | GO:0001533 | cornified envelope(GO:0001533) |
| 0.2 | 4.3 | GO:0030056 | hemidesmosome(GO:0030056) |
| 0.2 | 1.0 | GO:1902937 | inward rectifier potassium channel complex(GO:1902937) |
| 0.2 | 1.1 | GO:0044326 | dendritic spine neck(GO:0044326) |
| 0.1 | 1.0 | GO:1990761 | growth cone lamellipodium(GO:1990761) |
| 0.1 | 0.7 | GO:1990425 | ryanodine receptor complex(GO:1990425) |
| 0.1 | 0.9 | GO:0035692 | macrophage migration inhibitory factor receptor complex(GO:0035692) |
| 0.1 | 0.4 | GO:0044393 | microspike(GO:0044393) |
| 0.1 | 0.7 | GO:0098560 | cytoplasmic side of late endosome membrane(GO:0098560) |
| 0.1 | 4.6 | GO:0045095 | keratin filament(GO:0045095) |
| 0.1 | 1.6 | GO:0008290 | F-actin capping protein complex(GO:0008290) |
| 0.1 | 0.4 | GO:0070032 | synaptobrevin 2-SNAP-25-syntaxin-1a-complexin I complex(GO:0070032) |
| 0.1 | 0.7 | GO:0000110 | nucleotide-excision repair factor 1 complex(GO:0000110) ERCC4-ERCC1 complex(GO:0070522) |
| 0.1 | 0.7 | GO:0071438 | invadopodium membrane(GO:0071438) |
| 0.1 | 1.4 | GO:0030130 | clathrin coat of trans-Golgi network vesicle(GO:0030130) |
| 0.1 | 3.4 | GO:0009925 | basal plasma membrane(GO:0009925) |
| 0.1 | 0.4 | GO:0005889 | hydrogen:potassium-exchanging ATPase complex(GO:0005889) |
| 0.1 | 0.4 | GO:0044354 | pinosome(GO:0044352) macropinosome(GO:0044354) |
| 0.1 | 0.9 | GO:0097413 | Lewy body(GO:0097413) |
| 0.1 | 0.2 | GO:0044609 | DBIRD complex(GO:0044609) |
| 0.1 | 0.8 | GO:0005916 | fascia adherens(GO:0005916) |
| 0.1 | 2.4 | GO:0031258 | lamellipodium membrane(GO:0031258) |
| 0.1 | 0.1 | GO:0042272 | nuclear RNA export factor complex(GO:0042272) |
| 0.1 | 0.3 | GO:0000221 | vacuolar proton-transporting V-type ATPase, V1 domain(GO:0000221) |
| 0.1 | 4.0 | GO:0005882 | intermediate filament(GO:0005882) |
| 0.1 | 1.8 | GO:1904724 | tertiary granule lumen(GO:1904724) |
| 0.1 | 6.3 | GO:0005913 | cell-cell adherens junction(GO:0005913) |
| 0.0 | 0.1 | GO:0097058 | CRLF-CLCF1 complex(GO:0097058) CNTFR-CLCF1 complex(GO:0097059) |
| 0.0 | 0.9 | GO:0034663 | endoplasmic reticulum chaperone complex(GO:0034663) |
| 0.0 | 0.2 | GO:0032010 | phagolysosome(GO:0032010) |
| 0.0 | 0.1 | GO:0002079 | inner acrosomal membrane(GO:0002079) outer acrosomal membrane(GO:0002081) |
| 0.0 | 0.1 | GO:0097443 | sorting endosome(GO:0097443) |
| 0.0 | 0.4 | GO:0005827 | polar microtubule(GO:0005827) |
| 0.0 | 0.3 | GO:0000235 | astral microtubule(GO:0000235) aster(GO:0005818) |
| 0.0 | 0.7 | GO:0097038 | perinuclear endoplasmic reticulum(GO:0097038) |
| 0.0 | 0.6 | GO:0005869 | dynactin complex(GO:0005869) |
| 0.0 | 0.2 | GO:0031313 | extrinsic component of endosome membrane(GO:0031313) |
| 0.0 | 0.2 | GO:0045121 | membrane raft(GO:0045121) membrane microdomain(GO:0098857) |
| 0.0 | 0.2 | GO:1990075 | periciliary membrane compartment(GO:1990075) |
| 0.0 | 0.6 | GO:0030478 | actin cap(GO:0030478) |
| 0.0 | 0.4 | GO:0008250 | oligosaccharyltransferase complex(GO:0008250) |
| 0.0 | 1.8 | GO:0002102 | podosome(GO:0002102) |
| 0.0 | 0.2 | GO:0030991 | intraciliary transport particle A(GO:0030991) |
| 0.0 | 1.0 | GO:0097228 | sperm principal piece(GO:0097228) |
| 0.0 | 0.9 | GO:0034362 | low-density lipoprotein particle(GO:0034362) |
| 0.0 | 0.2 | GO:0000172 | ribonuclease MRP complex(GO:0000172) |
| 0.0 | 0.5 | GO:0030669 | clathrin-coated endocytic vesicle membrane(GO:0030669) |
| 0.0 | 0.3 | GO:0042587 | glycogen granule(GO:0042587) |
| 0.0 | 0.3 | GO:0071437 | invadopodium(GO:0071437) |
| 0.0 | 0.1 | GO:0033553 | rDNA heterochromatin(GO:0033553) |
| 0.0 | 0.2 | GO:0033269 | internode region of axon(GO:0033269) |
| 0.0 | 0.1 | GO:0036502 | Derlin-1-VIMP complex(GO:0036502) |
| 0.0 | 0.1 | GO:0070110 | ciliary neurotrophic factor receptor complex(GO:0070110) |
| 0.0 | 0.3 | GO:0005955 | calcineurin complex(GO:0005955) |
| 0.0 | 0.2 | GO:0005652 | nuclear lamina(GO:0005652) |
| 0.0 | 0.2 | GO:0070187 | telosome(GO:0070187) |
| 0.0 | 0.4 | GO:0017119 | Golgi transport complex(GO:0017119) |
| 0.0 | 0.6 | GO:0090533 | cation-transporting ATPase complex(GO:0090533) |
| 0.0 | 0.6 | GO:0044295 | axonal growth cone(GO:0044295) |
| 0.0 | 0.1 | GO:0044530 | supraspliceosomal complex(GO:0044530) |
| 0.0 | 0.4 | GO:0032433 | filopodium tip(GO:0032433) |
| 0.0 | 0.2 | GO:0005854 | nascent polypeptide-associated complex(GO:0005854) |
| 0.0 | 0.7 | GO:0031092 | platelet alpha granule membrane(GO:0031092) |
| 0.0 | 0.3 | GO:0036038 | MKS complex(GO:0036038) |
| 0.0 | 2.2 | GO:0005604 | basement membrane(GO:0005604) |
| 0.0 | 0.2 | GO:0097452 | GAIT complex(GO:0097452) |
| 0.0 | 0.3 | GO:0000815 | ESCRT III complex(GO:0000815) |
| 0.0 | 0.4 | GO:0005885 | Arp2/3 protein complex(GO:0005885) |
| 0.0 | 0.1 | GO:0097149 | centralspindlin complex(GO:0097149) |
| 0.0 | 0.1 | GO:0030905 | retromer, tubulation complex(GO:0030905) |
| 0.0 | 0.4 | GO:0031082 | BLOC complex(GO:0031082) |
| 0.0 | 0.2 | GO:0005884 | actin filament(GO:0005884) |
| 0.0 | 0.1 | GO:0097524 | sperm plasma membrane(GO:0097524) |
| 0.0 | 0.2 | GO:0008541 | proteasome regulatory particle, lid subcomplex(GO:0008541) |
| 0.0 | 0.1 | GO:0035976 | AP1 complex(GO:0035976) |
| 0.0 | 0.8 | GO:0031463 | Cul3-RING ubiquitin ligase complex(GO:0031463) |
| 0.0 | 0.1 | GO:0097025 | MPP7-DLG1-LIN7 complex(GO:0097025) |
| 0.0 | 0.1 | GO:1990682 | CSF1-CSF1R complex(GO:1990682) |
| 0.0 | 3.2 | GO:0019897 | extrinsic component of plasma membrane(GO:0019897) |
| 0.0 | 0.1 | GO:0030870 | Mre11 complex(GO:0030870) |
| 0.0 | 0.8 | GO:0031430 | M band(GO:0031430) |
| 0.0 | 1.1 | GO:0030175 | filopodium(GO:0030175) |
| 0.0 | 0.5 | GO:0000159 | protein phosphatase type 2A complex(GO:0000159) |
| 0.0 | 0.1 | GO:0033061 | DNA recombinase mediator complex(GO:0033061) Rad51B-Rad51C-Rad51D-XRCC2 complex(GO:0033063) |
| 0.0 | 0.2 | GO:0000800 | lateral element(GO:0000800) |
| 0.0 | 0.3 | GO:0005796 | Golgi lumen(GO:0005796) |
| 0.0 | 0.3 | GO:0033202 | Ino80 complex(GO:0031011) DNA helicase complex(GO:0033202) |
| 0.0 | 0.1 | GO:0097487 | multivesicular body, internal vesicle(GO:0097487) |
| 0.0 | 0.1 | GO:0043564 | Ku70:Ku80 complex(GO:0043564) |
| 0.0 | 0.6 | GO:0045171 | intercellular bridge(GO:0045171) |
| 0.0 | 0.0 | GO:0045273 | mitochondrial respiratory chain complex II, succinate dehydrogenase complex (ubiquinone)(GO:0005749) succinate dehydrogenase complex (ubiquinone)(GO:0045257) respiratory chain complex II(GO:0045273) succinate dehydrogenase complex(GO:0045281) fumarate reductase complex(GO:0045283) |
| 0.0 | 0.3 | GO:0097546 | ciliary base(GO:0097546) |
Gene overrepresentation in C2:CP:REACTOME category:
| Log-likelihood per target | Total log-likelihood | Term | Description |
|---|---|---|---|
| 0.0 | 1.6 | REACTOME YAP1 AND WWTR1 TAZ STIMULATED GENE EXPRESSION | Genes involved in YAP1- and WWTR1 (TAZ)-stimulated gene expression |
Gene overrepresentation in cellular_component category:
| Log-likelihood per target | Total log-likelihood | Term | Description |
|---|---|---|---|
| 0.3 | 1.6 | GO:0071148 | TEAD-1-YAP complex(GO:0071148) |
| 0.0 | 0.4 | GO:0035976 | AP1 complex(GO:0035976) |
| 0.0 | 0.3 | GO:0072546 | ER membrane protein complex(GO:0072546) |
| 0.0 | 0.1 | GO:0005663 | DNA replication factor C complex(GO:0005663) |
| 0.0 | 0.1 | GO:0032021 | NELF complex(GO:0032021) |
| 0.0 | 0.3 | GO:0005869 | dynactin complex(GO:0005869) |
| 0.0 | 0.1 | GO:0098554 | cytoplasmic side of endoplasmic reticulum membrane(GO:0098554) |
| 0.0 | 0.1 | GO:0070652 | HAUS complex(GO:0070652) |
| 0.0 | 0.5 | GO:0032839 | dendrite cytoplasm(GO:0032839) |
| 0.0 | 0.1 | GO:0043196 | varicosity(GO:0043196) |
| 0.0 | 0.1 | GO:0044292 | dendrite terminus(GO:0044292) |
| 0.0 | 1.1 | GO:0072686 | mitotic spindle(GO:0072686) |
| 0.0 | 0.1 | GO:0000836 | Hrd1p ubiquitin ligase complex(GO:0000836) |
Gene overrepresentation in biological_process category:
| Log-likelihood per target | Total log-likelihood | Term | Description |
|---|---|---|---|
| 1.6 | 6.4 | GO:0090362 | positive regulation of platelet-derived growth factor production(GO:0090362) |
| 1.3 | 4.0 | GO:0060559 | positive regulation of vitamin metabolic process(GO:0046136) positive regulation of vitamin D biosynthetic process(GO:0060557) positive regulation of calcidiol 1-monooxygenase activity(GO:0060559) |
| 1.1 | 4.4 | GO:0060672 | epithelial cell differentiation involved in embryonic placenta development(GO:0060671) epithelial cell morphogenesis involved in placental branching(GO:0060672) |
| 1.0 | 28.5 | GO:0031581 | hemidesmosome assembly(GO:0031581) |
| 0.9 | 3.7 | GO:0006218 | uridine catabolic process(GO:0006218) uridine metabolic process(GO:0046108) |
| 0.9 | 3.4 | GO:0050712 | negative regulation of interleukin-1 alpha production(GO:0032690) negative regulation of interleukin-1 alpha secretion(GO:0050712) |
| 0.8 | 3.2 | GO:0001971 | negative regulation of activation of membrane attack complex(GO:0001971) |
| 0.8 | 2.3 | GO:0002661 | B cell tolerance induction(GO:0002514) regulation of B cell tolerance induction(GO:0002661) positive regulation of B cell tolerance induction(GO:0002663) |
| 0.7 | 2.1 | GO:1902938 | regulation of intracellular calcium activated chloride channel activity(GO:1902938) |
| 0.6 | 1.9 | GO:0043006 | activation of phospholipase A2 activity by calcium-mediated signaling(GO:0043006) |
| 0.6 | 3.0 | GO:0010273 | detoxification of copper ion(GO:0010273) stress response to copper ion(GO:1990169) |
| 0.5 | 3.8 | GO:0031642 | negative regulation of myelination(GO:0031642) |
| 0.5 | 1.4 | GO:0001923 | B-1 B cell differentiation(GO:0001923) |
| 0.4 | 1.3 | GO:0070318 | myoblast development(GO:0048627) positive regulation of G0 to G1 transition(GO:0070318) |
| 0.4 | 4.5 | GO:0002934 | desmosome organization(GO:0002934) |
| 0.4 | 2.9 | GO:0090191 | negative regulation of branching involved in ureteric bud morphogenesis(GO:0090191) |
| 0.3 | 1.0 | GO:0010652 | regulation of cell communication by chemical coupling(GO:0010645) positive regulation of cell communication by chemical coupling(GO:0010652) |
| 0.3 | 1.9 | GO:0002760 | positive regulation of antimicrobial peptide production(GO:0002225) positive regulation of antimicrobial humoral response(GO:0002760) positive regulation of antibacterial peptide production(GO:0002803) |
| 0.3 | 0.9 | GO:2000393 | negative regulation of lamellipodium morphogenesis(GO:2000393) |
| 0.3 | 1.9 | GO:2000391 | positive regulation of neutrophil extravasation(GO:2000391) |
| 0.3 | 1.5 | GO:0061146 | Peyer's patch morphogenesis(GO:0061146) |
| 0.3 | 1.5 | GO:0015688 | iron chelate transport(GO:0015688) siderophore transport(GO:0015891) |
| 0.3 | 2.9 | GO:0051552 | flavone metabolic process(GO:0051552) |
| 0.3 | 1.1 | GO:0050705 | regulation of interleukin-1 alpha secretion(GO:0050705) |
| 0.3 | 0.8 | GO:0006145 | purine nucleobase catabolic process(GO:0006145) |
| 0.3 | 1.4 | GO:0060449 | bud elongation involved in lung branching(GO:0060449) |
| 0.3 | 0.8 | GO:2001280 | positive regulation of prostaglandin biosynthetic process(GO:0031394) negative regulation of phospholipase A2 activity(GO:1900138) positive regulation of unsaturated fatty acid biosynthetic process(GO:2001280) |
| 0.2 | 1.5 | GO:0015820 | leucine transport(GO:0015820) |
| 0.2 | 4.9 | GO:0001765 | membrane raft assembly(GO:0001765) |
| 0.2 | 1.2 | GO:0055011 | atrial cardiac muscle cell differentiation(GO:0055011) atrial cardiac muscle cell development(GO:0055014) |
| 0.2 | 0.7 | GO:0002581 | negative regulation of antigen processing and presentation of peptide or polysaccharide antigen via MHC class II(GO:0002581) |
| 0.2 | 0.7 | GO:2000282 | regulation of cellular amine catabolic process(GO:0033241) negative regulation of cellular amine catabolic process(GO:0033242) negative regulation of the force of heart contraction(GO:0098736) regulation of arginine catabolic process(GO:1900081) negative regulation of arginine catabolic process(GO:1900082) regulation of citrulline biosynthetic process(GO:1903248) negative regulation of citrulline biosynthetic process(GO:1903249) regulation of cellular amino acid biosynthetic process(GO:2000282) negative regulation of cellular amino acid biosynthetic process(GO:2000283) |
| 0.2 | 3.4 | GO:0051546 | keratinocyte migration(GO:0051546) |
| 0.2 | 1.4 | GO:0007296 | vitellogenesis(GO:0007296) |
| 0.2 | 0.5 | GO:0060067 | cervix development(GO:0060067) |
| 0.2 | 0.7 | GO:2000521 | negative regulation of immunological synapse formation(GO:2000521) |
| 0.2 | 1.1 | GO:0003350 | pulmonary myocardium development(GO:0003350) |
| 0.2 | 0.2 | GO:0031960 | response to corticosteroid(GO:0031960) response to glucocorticoid(GO:0051384) |
| 0.2 | 1.0 | GO:0071873 | response to norepinephrine(GO:0071873) cellular response to norepinephrine stimulus(GO:0071874) |
| 0.2 | 1.2 | GO:0072719 | cellular response to cisplatin(GO:0072719) |
| 0.2 | 1.3 | GO:2000124 | regulation of endocannabinoid signaling pathway(GO:2000124) |
| 0.2 | 2.6 | GO:0060670 | branching involved in labyrinthine layer morphogenesis(GO:0060670) |
| 0.2 | 0.7 | GO:0038195 | urokinase plasminogen activator signaling pathway(GO:0038195) |
| 0.2 | 3.1 | GO:0032060 | bleb assembly(GO:0032060) |
| 0.2 | 4.4 | GO:0071294 | cellular response to zinc ion(GO:0071294) |
| 0.2 | 0.5 | GO:0046521 | sphingoid catabolic process(GO:0046521) |
| 0.2 | 0.9 | GO:0018158 | response to symbiont(GO:0009608) response to symbiotic bacterium(GO:0009609) protein oxidation(GO:0018158) |
| 0.2 | 1.9 | GO:0030322 | stabilization of membrane potential(GO:0030322) |
| 0.2 | 0.7 | GO:0071461 | cellular response to redox state(GO:0071461) |
| 0.2 | 0.7 | GO:0045110 | intermediate filament bundle assembly(GO:0045110) |
| 0.2 | 0.3 | GO:0030220 | platelet formation(GO:0030220) platelet morphogenesis(GO:0036344) |
| 0.2 | 0.5 | GO:0070638 | nicotinamide riboside catabolic process(GO:0006738) inosine metabolic process(GO:0046102) nicotinamide riboside metabolic process(GO:0046495) pyridine nucleoside metabolic process(GO:0070637) pyridine nucleoside catabolic process(GO:0070638) |
| 0.2 | 1.1 | GO:0006880 | intracellular sequestering of iron ion(GO:0006880) sequestering of iron ion(GO:0097577) |
| 0.2 | 0.8 | GO:0015722 | canalicular bile acid transport(GO:0015722) |
| 0.2 | 0.5 | GO:0086092 | regulation of the force of heart contraction by cardiac conduction(GO:0086092) |
| 0.2 | 4.7 | GO:0007398 | ectoderm development(GO:0007398) |
| 0.2 | 0.5 | GO:0050703 | interleukin-1 alpha secretion(GO:0050703) |
| 0.1 | 3.2 | GO:0003334 | keratinocyte development(GO:0003334) |
| 0.1 | 1.7 | GO:0010990 | regulation of SMAD protein complex assembly(GO:0010990) negative regulation of SMAD protein complex assembly(GO:0010991) |
| 0.1 | 0.7 | GO:0033489 | cholesterol biosynthetic process via desmosterol(GO:0033489) cholesterol biosynthetic process via lathosterol(GO:0033490) |
| 0.1 | 1.0 | GO:0046469 | platelet activating factor metabolic process(GO:0046469) |
| 0.1 | 0.8 | GO:0051694 | pointed-end actin filament capping(GO:0051694) |
| 0.1 | 3.2 | GO:0046339 | diacylglycerol metabolic process(GO:0046339) |
| 0.1 | 0.5 | GO:0045065 | cytotoxic T cell differentiation(GO:0045065) |
| 0.1 | 1.1 | GO:0001574 | ganglioside biosynthetic process(GO:0001574) |
| 0.1 | 0.4 | GO:0042270 | protection from natural killer cell mediated cytotoxicity(GO:0042270) |
| 0.1 | 0.5 | GO:1900533 | medium-chain fatty-acyl-CoA catabolic process(GO:0036114) long-chain fatty-acyl-CoA catabolic process(GO:0036116) palmitic acid metabolic process(GO:1900533) palmitic acid biosynthetic process(GO:1900535) |
| 0.1 | 0.4 | GO:0009407 | toxin catabolic process(GO:0009407) secondary metabolite catabolic process(GO:0090487) |
| 0.1 | 0.9 | GO:1900625 | regulation of monocyte aggregation(GO:1900623) positive regulation of monocyte aggregation(GO:1900625) |
| 0.1 | 0.4 | GO:0052250 | modulation of signal transduction in other organism(GO:0044501) modulation by symbiont of host signal transduction pathway(GO:0052027) modulation of signal transduction in other organism involved in symbiotic interaction(GO:0052250) modulation by symbiont of host I-kappaB kinase/NF-kappaB cascade(GO:0085032) |
| 0.1 | 0.4 | GO:0000738 | DNA catabolic process, exonucleolytic(GO:0000738) |
| 0.1 | 1.2 | GO:0071847 | TNFSF11-mediated signaling pathway(GO:0071847) |
| 0.1 | 0.6 | GO:0033383 | geranyl diphosphate metabolic process(GO:0033383) geranyl diphosphate biosynthetic process(GO:0033384) farnesyl diphosphate biosynthetic process(GO:0045337) |
| 0.1 | 0.3 | GO:0030187 | melatonin metabolic process(GO:0030186) melatonin biosynthetic process(GO:0030187) |
| 0.1 | 1.0 | GO:0061302 | smooth muscle cell-matrix adhesion(GO:0061302) |
| 0.1 | 0.5 | GO:1902044 | regulation of Fas signaling pathway(GO:1902044) |
| 0.1 | 0.7 | GO:0031914 | negative regulation of synaptic plasticity(GO:0031914) |
| 0.1 | 0.4 | GO:0042986 | positive regulation of amyloid precursor protein biosynthetic process(GO:0042986) |
| 0.1 | 0.7 | GO:0000720 | pyrimidine dimer repair by nucleotide-excision repair(GO:0000720) positive regulation of t-circle formation(GO:1904431) |
| 0.1 | 0.1 | GO:0061055 | myotome development(GO:0061055) |
| 0.1 | 2.2 | GO:0090026 | positive regulation of monocyte chemotaxis(GO:0090026) |
| 0.1 | 0.3 | GO:0002188 | translation reinitiation(GO:0002188) |
| 0.1 | 0.2 | GO:2000320 | negative regulation of T-helper 17 type immune response(GO:2000317) negative regulation of T-helper 17 cell differentiation(GO:2000320) |
| 0.1 | 0.3 | GO:1903028 | positive regulation of opsonization(GO:1903028) |
| 0.1 | 10.2 | GO:0070268 | cornification(GO:0070268) |
| 0.1 | 0.4 | GO:0010701 | positive regulation of norepinephrine secretion(GO:0010701) |
| 0.1 | 0.5 | GO:1900041 | negative regulation of interleukin-2 secretion(GO:1900041) |
| 0.1 | 4.9 | GO:0042149 | cellular response to glucose starvation(GO:0042149) |
| 0.1 | 0.2 | GO:0035640 | exploration behavior(GO:0035640) locomotory exploration behavior(GO:0035641) |
| 0.1 | 6.2 | GO:0036092 | phosphatidylinositol-3-phosphate biosynthetic process(GO:0036092) |
| 0.1 | 0.5 | GO:0015840 | urea transport(GO:0015840) |
| 0.1 | 0.6 | GO:0006741 | NADP biosynthetic process(GO:0006741) |
| 0.1 | 2.5 | GO:0009235 | cobalamin metabolic process(GO:0009235) |
| 0.1 | 0.4 | GO:0044860 | protein localization to plasma membrane raft(GO:0044860) protein transport into plasma membrane raft(GO:0044861) |
| 0.1 | 1.5 | GO:0035589 | G-protein coupled purinergic nucleotide receptor signaling pathway(GO:0035589) |
| 0.1 | 0.8 | GO:0070494 | regulation of thrombin receptor signaling pathway(GO:0070494) negative regulation of thrombin receptor signaling pathway(GO:0070495) |
| 0.1 | 0.4 | GO:0046502 | uroporphyrinogen III biosynthetic process(GO:0006780) uroporphyrinogen III metabolic process(GO:0046502) |
| 0.1 | 0.4 | GO:0043473 | pigmentation(GO:0043473) |
| 0.1 | 0.8 | GO:0031346 | positive regulation of cell projection organization(GO:0031346) |
| 0.1 | 1.1 | GO:0046415 | urate metabolic process(GO:0046415) |
| 0.1 | 0.5 | GO:0042866 | pyruvate biosynthetic process(GO:0042866) |
| 0.1 | 0.6 | GO:0006537 | glutamate biosynthetic process(GO:0006537) gamma-aminobutyric acid biosynthetic process(GO:0009449) |
| 0.1 | 0.4 | GO:0036493 | positive regulation of translation in response to endoplasmic reticulum stress(GO:0036493) |
| 0.1 | 0.2 | GO:0060381 | regulation of single-stranded telomeric DNA binding(GO:0060380) positive regulation of single-stranded telomeric DNA binding(GO:0060381) positive regulation of telomeric DNA binding(GO:1904744) |
| 0.1 | 1.5 | GO:0071803 | positive regulation of podosome assembly(GO:0071803) |
| 0.1 | 0.6 | GO:0017183 | peptidyl-diphthamide metabolic process(GO:0017182) peptidyl-diphthamide biosynthetic process from peptidyl-histidine(GO:0017183) |
| 0.1 | 0.3 | GO:1903237 | negative regulation of leukocyte tethering or rolling(GO:1903237) |
| 0.1 | 0.3 | GO:0002296 | T-helper 1 cell lineage commitment(GO:0002296) |
| 0.1 | 1.4 | GO:0036150 | phosphatidylserine acyl-chain remodeling(GO:0036150) |
| 0.1 | 0.3 | GO:0050428 | purine ribonucleoside bisphosphate biosynthetic process(GO:0034036) 3'-phosphoadenosine 5'-phosphosulfate biosynthetic process(GO:0050428) |
| 0.1 | 1.1 | GO:0016540 | protein autoprocessing(GO:0016540) |
| 0.1 | 0.6 | GO:1903265 | positive regulation of tumor necrosis factor-mediated signaling pathway(GO:1903265) |
| 0.1 | 0.6 | GO:0071578 | zinc II ion transmembrane import(GO:0071578) |
| 0.1 | 0.2 | GO:0006049 | UDP-N-acetylglucosamine catabolic process(GO:0006049) |
| 0.1 | 0.2 | GO:0097264 | self proteolysis(GO:0097264) |
| 0.1 | 0.2 | GO:0009298 | GDP-mannose biosynthetic process(GO:0009298) |
| 0.1 | 0.7 | GO:0035457 | cellular response to interferon-alpha(GO:0035457) |
| 0.1 | 1.0 | GO:0003215 | cardiac right ventricle morphogenesis(GO:0003215) |
| 0.1 | 0.2 | GO:0034334 | adherens junction maintenance(GO:0034334) |
| 0.1 | 0.2 | GO:2000253 | positive regulation of feeding behavior(GO:2000253) |
| 0.1 | 0.2 | GO:2000687 | negative regulation of rubidium ion transport(GO:2000681) negative regulation of rubidium ion transmembrane transporter activity(GO:2000687) |
| 0.1 | 0.4 | GO:0015693 | magnesium ion transport(GO:0015693) |
| 0.1 | 0.1 | GO:0098905 | regulation of bundle of His cell action potential(GO:0098905) |
| 0.1 | 0.3 | GO:0014718 | regulation of satellite cell activation involved in skeletal muscle regeneration(GO:0014717) positive regulation of satellite cell activation involved in skeletal muscle regeneration(GO:0014718) satellite cell activation involved in skeletal muscle regeneration(GO:0014901) |
| 0.1 | 3.2 | GO:0007157 | heterophilic cell-cell adhesion via plasma membrane cell adhesion molecules(GO:0007157) |
| 0.1 | 0.5 | GO:1902412 | regulation of mitotic cytokinesis(GO:1902412) |
| 0.1 | 0.2 | GO:0044571 | [2Fe-2S] cluster assembly(GO:0044571) |
| 0.1 | 0.2 | GO:0046121 | deoxyribonucleoside catabolic process(GO:0046121) |
| 0.1 | 0.3 | GO:0002084 | protein depalmitoylation(GO:0002084) |
| 0.1 | 0.5 | GO:0060020 | Bergmann glial cell differentiation(GO:0060020) |
| 0.1 | 0.4 | GO:0008090 | retrograde axonal transport(GO:0008090) |
| 0.1 | 0.2 | GO:0035606 | peptidyl-cysteine S-trans-nitrosylation(GO:0035606) |
| 0.1 | 0.7 | GO:0060712 | spongiotrophoblast layer development(GO:0060712) |
| 0.1 | 0.6 | GO:0006657 | CDP-choline pathway(GO:0006657) |
| 0.1 | 0.3 | GO:0016078 | tRNA catabolic process(GO:0016078) |
| 0.0 | 0.3 | GO:0010756 | positive regulation of plasminogen activation(GO:0010756) |
| 0.0 | 0.1 | GO:0048295 | positive regulation of isotype switching to IgE isotypes(GO:0048295) |
| 0.0 | 0.7 | GO:0060347 | heart trabecula formation(GO:0060347) |
| 0.0 | 0.2 | GO:0005986 | sucrose biosynthetic process(GO:0005986) |
| 0.0 | 0.1 | GO:0071896 | protein localization to adherens junction(GO:0071896) |
| 0.0 | 2.6 | GO:0060113 | inner ear receptor cell differentiation(GO:0060113) |
| 0.0 | 0.2 | GO:0038165 | oncostatin-M-mediated signaling pathway(GO:0038165) |
| 0.0 | 0.5 | GO:0003373 | dynamin polymerization involved in membrane fission(GO:0003373) dynamin polymerization involved in mitochondrial fission(GO:0003374) |
| 0.0 | 0.1 | GO:0019287 | isopentenyl diphosphate biosynthetic process, mevalonate pathway(GO:0019287) |
| 0.0 | 0.1 | GO:0019605 | benzoate metabolic process(GO:0018874) butyrate metabolic process(GO:0019605) |
| 0.0 | 0.1 | GO:1903336 | negative regulation of vacuolar transport(GO:1903336) |
| 0.0 | 0.1 | GO:0010975 | regulation of neuron projection development(GO:0010975) |
| 0.0 | 0.1 | GO:1990523 | bone regeneration(GO:1990523) |
| 0.0 | 0.2 | GO:0070317 | negative regulation of G0 to G1 transition(GO:0070317) |
| 0.0 | 0.1 | GO:1905224 | clathrin-coated pit assembly(GO:1905224) |
| 0.0 | 0.1 | GO:1901873 | regulation of post-translational protein modification(GO:1901873) |
| 0.0 | 0.1 | GO:1900368 | regulation of RNA interference(GO:1900368) negative regulation of RNA interference(GO:1900369) |
| 0.0 | 0.4 | GO:0043374 | CD8-positive, alpha-beta T cell differentiation(GO:0043374) |
| 0.0 | 0.1 | GO:0036155 | acylglycerol acyl-chain remodeling(GO:0036155) |
| 0.0 | 0.2 | GO:1900748 | positive regulation of vascular endothelial growth factor signaling pathway(GO:1900748) |
| 0.0 | 0.6 | GO:0031639 | plasminogen activation(GO:0031639) |
| 0.0 | 0.2 | GO:0072656 | maintenance of protein location in mitochondrion(GO:0072656) |
| 0.0 | 0.4 | GO:1902172 | keratinocyte apoptotic process(GO:0097283) regulation of keratinocyte apoptotic process(GO:1902172) |
| 0.0 | 0.1 | GO:1903236 | regulation of leukocyte tethering or rolling(GO:1903236) positive regulation of leukocyte tethering or rolling(GO:1903238) |
| 0.0 | 0.2 | GO:1902766 | skeletal muscle satellite cell migration(GO:1902766) |
| 0.0 | 0.5 | GO:0090136 | epithelial cell-cell adhesion(GO:0090136) |
| 0.0 | 0.3 | GO:0070995 | NADPH oxidation(GO:0070995) |
| 0.0 | 0.2 | GO:0009438 | methylglyoxal metabolic process(GO:0009438) |
| 0.0 | 0.2 | GO:0006207 | 'de novo' pyrimidine nucleobase biosynthetic process(GO:0006207) pyrimidine nucleobase biosynthetic process(GO:0019856) |
| 0.0 | 0.1 | GO:0071105 | response to interleukin-11(GO:0071105) |
| 0.0 | 0.4 | GO:1902455 | negative regulation of stem cell population maintenance(GO:1902455) |
| 0.0 | 0.3 | GO:0019835 | cytolysis(GO:0019835) |
| 0.0 | 0.1 | GO:0032755 | positive regulation of interleukin-6 production(GO:0032755) |
| 0.0 | 0.3 | GO:1901727 | positive regulation of histone deacetylase activity(GO:1901727) |
| 0.0 | 0.9 | GO:0034204 | lipid translocation(GO:0034204) phospholipid translocation(GO:0045332) |
| 0.0 | 0.2 | GO:0016128 | ergosterol biosynthetic process(GO:0006696) ergosterol metabolic process(GO:0008204) phytosteroid metabolic process(GO:0016128) phytosteroid biosynthetic process(GO:0016129) |
| 0.0 | 0.2 | GO:0070966 | nuclear-transcribed mRNA catabolic process, no-go decay(GO:0070966) |
| 0.0 | 0.1 | GO:0018406 | protein C-linked glycosylation(GO:0018103) peptidyl-tryptophan modification(GO:0018211) protein C-linked glycosylation via tryptophan(GO:0018317) protein C-linked glycosylation via 2'-alpha-mannosyl-L-tryptophan(GO:0018406) |
| 0.0 | 0.1 | GO:0002913 | positive regulation of T cell anergy(GO:0002669) positive regulation of lymphocyte anergy(GO:0002913) protein K29-linked ubiquitination(GO:0035519) |
| 0.0 | 0.1 | GO:0097089 | methyl-branched fatty acid metabolic process(GO:0097089) |
| 0.0 | 0.1 | GO:0030644 | cellular chloride ion homeostasis(GO:0030644) retinal cell programmed cell death(GO:0046666) |
| 0.0 | 0.1 | GO:0007619 | courtship behavior(GO:0007619) |
| 0.0 | 0.2 | GO:0010735 | positive regulation of transcription via serum response element binding(GO:0010735) |
| 0.0 | 0.2 | GO:0007023 | post-chaperonin tubulin folding pathway(GO:0007023) |
| 0.0 | 0.4 | GO:0006089 | lactate metabolic process(GO:0006089) |
| 0.0 | 0.3 | GO:0035269 | protein O-linked mannosylation(GO:0035269) |
| 0.0 | 0.1 | GO:0034698 | response to gonadotropin(GO:0034698) |
| 0.0 | 0.1 | GO:0046498 | S-adenosylhomocysteine metabolic process(GO:0046498) |
| 0.0 | 0.3 | GO:0010917 | negative regulation of mitochondrial membrane potential(GO:0010917) |
| 0.0 | 0.5 | GO:0000183 | chromatin silencing at rDNA(GO:0000183) |
| 0.0 | 0.3 | GO:0071798 | response to prostaglandin D(GO:0071798) cellular response to prostaglandin D stimulus(GO:0071799) |
| 0.0 | 0.4 | GO:1903204 | negative regulation of oxidative stress-induced neuron death(GO:1903204) |
| 0.0 | 0.2 | GO:0098501 | polynucleotide dephosphorylation(GO:0098501) |
| 0.0 | 2.6 | GO:1900181 | negative regulation of protein localization to nucleus(GO:1900181) |
| 0.0 | 0.3 | GO:0001660 | fever generation(GO:0001660) |
| 0.0 | 0.1 | GO:1904578 | response to thapsigargin(GO:1904578) cellular response to thapsigargin(GO:1904579) |
| 0.0 | 0.1 | GO:0015783 | GDP-fucose transport(GO:0015783) purine nucleotide-sugar transport(GO:0036079) |
| 0.0 | 0.4 | GO:0031115 | negative regulation of microtubule polymerization(GO:0031115) |
| 0.0 | 0.1 | GO:0071139 | resolution of recombination intermediates(GO:0071139) resolution of mitotic recombination intermediates(GO:0071140) |
| 0.0 | 0.1 | GO:0042361 | menaquinone catabolic process(GO:0042361) vitamin K catabolic process(GO:0042377) |
| 0.0 | 0.3 | GO:1901673 | regulation of mitotic spindle assembly(GO:1901673) |
| 0.0 | 0.2 | GO:0030091 | protein repair(GO:0030091) |
| 0.0 | 0.1 | GO:1901318 | negative regulation of sperm motility(GO:1901318) |
| 0.0 | 0.2 | GO:0021523 | somatic motor neuron differentiation(GO:0021523) |
| 0.0 | 0.1 | GO:0030718 | germ-line stem cell population maintenance(GO:0030718) |
| 0.0 | 0.2 | GO:0043305 | negative regulation of mast cell degranulation(GO:0043305) |
| 0.0 | 0.0 | GO:0051919 | positive regulation of fibrinolysis(GO:0051919) |
| 0.0 | 0.1 | GO:2000418 | positive regulation of eosinophil migration(GO:2000418) |
| 0.0 | 0.2 | GO:1901475 | pyruvate transport(GO:0006848) pyruvate transmembrane transport(GO:1901475) |
| 0.0 | 0.1 | GO:0001798 | positive regulation of type IIa hypersensitivity(GO:0001798) positive regulation of type II hypersensitivity(GO:0002894) |
| 0.0 | 0.1 | GO:0000912 | assembly of actomyosin apparatus involved in cytokinesis(GO:0000912) actomyosin contractile ring assembly(GO:0000915) actomyosin contractile ring organization(GO:0044837) |
| 0.0 | 0.1 | GO:1902231 | positive regulation of intrinsic apoptotic signaling pathway in response to DNA damage(GO:1902231) |
| 0.0 | 0.1 | GO:0070120 | ciliary neurotrophic factor-mediated signaling pathway(GO:0070120) |
| 0.0 | 0.3 | GO:0051014 | actin filament severing(GO:0051014) |
| 0.0 | 0.4 | GO:0003351 | epithelial cilium movement(GO:0003351) |
| 0.0 | 0.1 | GO:0032416 | negative regulation of sodium:proton antiporter activity(GO:0032416) |
| 0.0 | 0.3 | GO:0031987 | locomotion involved in locomotory behavior(GO:0031987) |
| 0.0 | 0.1 | GO:2001206 | positive regulation of osteoclast development(GO:2001206) |
| 0.0 | 0.6 | GO:0046825 | regulation of protein export from nucleus(GO:0046825) |
| 0.0 | 0.8 | GO:0019731 | antibacterial humoral response(GO:0019731) |
| 0.0 | 0.6 | GO:0071425 | hematopoietic stem cell proliferation(GO:0071425) |
| 0.0 | 0.1 | GO:0030581 | intracellular transport of viral protein in host cell(GO:0019060) symbiont intracellular protein transport in host(GO:0030581) intracellular protein transport in other organism involved in symbiotic interaction(GO:0051708) |
| 0.0 | 0.2 | GO:0061512 | protein localization to cilium(GO:0061512) |
| 0.0 | 0.2 | GO:0032020 | ISG15-protein conjugation(GO:0032020) |
| 0.0 | 2.1 | GO:0006892 | post-Golgi vesicle-mediated transport(GO:0006892) |
| 0.0 | 0.1 | GO:1904429 | regulation of t-circle formation(GO:1904429) |
| 0.0 | 0.1 | GO:0060633 | negative regulation of transcription initiation from RNA polymerase II promoter(GO:0060633) |
| 0.0 | 0.1 | GO:0000389 | mRNA 3'-splice site recognition(GO:0000389) |
| 0.0 | 0.1 | GO:0033089 | positive regulation of T cell differentiation in thymus(GO:0033089) positive regulation of thymocyte aggregation(GO:2000400) |
| 0.0 | 0.2 | GO:0035583 | sequestering of TGFbeta in extracellular matrix(GO:0035583) |
| 0.0 | 0.1 | GO:0019805 | quinolinate biosynthetic process(GO:0019805) |
| 0.0 | 0.1 | GO:0043653 | mitochondrial fragmentation involved in apoptotic process(GO:0043653) |
| 0.0 | 0.0 | GO:2001027 | negative regulation of endothelial cell chemotaxis(GO:2001027) |
| 0.0 | 0.2 | GO:0010745 | negative regulation of macrophage derived foam cell differentiation(GO:0010745) |
| 0.0 | 0.1 | GO:0006122 | mitochondrial electron transport, ubiquinol to cytochrome c(GO:0006122) |
| 0.0 | 0.1 | GO:0033234 | negative regulation of protein sumoylation(GO:0033234) |
| 0.0 | 0.1 | GO:0071724 | toll-like receptor TLR6:TLR2 signaling pathway(GO:0038124) response to diacyl bacterial lipopeptide(GO:0071724) cellular response to diacyl bacterial lipopeptide(GO:0071726) |
| 0.0 | 0.1 | GO:0001545 | primary ovarian follicle growth(GO:0001545) |
| 0.0 | 0.1 | GO:0002101 | tRNA wobble cytosine modification(GO:0002101) |
| 0.0 | 0.8 | GO:0008038 | neuron recognition(GO:0008038) |
| 0.0 | 0.1 | GO:1990564 | protein polyufmylation(GO:1990564) protein K69-linked ufmylation(GO:1990592) |
| 0.0 | 0.1 | GO:0045938 | positive regulation of circadian sleep/wake cycle, sleep(GO:0045938) |
| 0.0 | 0.0 | GO:0009726 | detection of endogenous stimulus(GO:0009726) |
| 0.0 | 0.1 | GO:0048793 | pronephros development(GO:0048793) |
| 0.0 | 0.3 | GO:0009756 | carbohydrate mediated signaling(GO:0009756) |
| 0.0 | 0.1 | GO:0035845 | photoreceptor cell outer segment organization(GO:0035845) |
| 0.0 | 0.2 | GO:0048096 | chromatin-mediated maintenance of transcription(GO:0048096) |
| 0.0 | 2.8 | GO:0016573 | histone acetylation(GO:0016573) |
| 0.0 | 0.8 | GO:0050911 | detection of chemical stimulus involved in sensory perception of smell(GO:0050911) |
| 0.0 | 0.2 | GO:0060716 | labyrinthine layer blood vessel development(GO:0060716) |
| 0.0 | 0.0 | GO:0021987 | cerebral cortex development(GO:0021987) |
| 0.0 | 0.2 | GO:0046069 | cGMP catabolic process(GO:0046069) |
| 0.0 | 1.1 | GO:0030574 | collagen catabolic process(GO:0030574) |
| 0.0 | 0.2 | GO:0075522 | IRES-dependent viral translational initiation(GO:0075522) |
| 0.0 | 0.0 | GO:0003095 | pressure natriuresis(GO:0003095) |
| 0.0 | 0.4 | GO:0034629 | cellular protein complex localization(GO:0034629) |
| 0.0 | 0.2 | GO:0089711 | L-glutamate transmembrane transport(GO:0089711) |
| 0.0 | 0.1 | GO:0001675 | acrosome assembly(GO:0001675) |
| 0.0 | 0.0 | GO:0072386 | plus-end-directed vesicle transport along microtubule(GO:0072383) plus-end-directed organelle transport along microtubule(GO:0072386) |
| 0.0 | 0.1 | GO:0030207 | chondroitin sulfate catabolic process(GO:0030207) |
| 0.0 | 0.0 | GO:0033341 | regulation of collagen binding(GO:0033341) |
| 0.0 | 0.0 | GO:0010025 | wax biosynthetic process(GO:0010025) wax metabolic process(GO:0010166) |
| 0.0 | 0.1 | GO:0019064 | fusion of virus membrane with host plasma membrane(GO:0019064) membrane fusion involved in viral entry into host cell(GO:0039663) multi-organism membrane fusion(GO:0044800) |
| 0.0 | 0.1 | GO:0006729 | tetrahydrobiopterin biosynthetic process(GO:0006729) tetrahydrobiopterin metabolic process(GO:0046146) |
| 0.0 | 0.1 | GO:0001764 | neuron migration(GO:0001764) |
| 0.0 | 0.1 | GO:0008286 | insulin receptor signaling pathway(GO:0008286) |
| 0.0 | 0.4 | GO:0032897 | negative regulation of viral transcription(GO:0032897) |
| 0.0 | 0.1 | GO:0019732 | antifungal humoral response(GO:0019732) |
| 0.0 | 0.1 | GO:1905229 | thyroid-stimulating hormone signaling pathway(GO:0038194) cellular response to glycoprotein(GO:1904588) cellular response to thyrotropin-releasing hormone(GO:1905229) |
| 0.0 | 0.1 | GO:0032515 | negative regulation of phosphoprotein phosphatase activity(GO:0032515) |
| 0.0 | 0.1 | GO:2001189 | negative regulation of T cell activation via T cell receptor contact with antigen bound to MHC molecule on antigen presenting cell(GO:2001189) |
| 0.0 | 0.3 | GO:0006469 | negative regulation of protein kinase activity(GO:0006469) negative regulation of kinase activity(GO:0033673) negative regulation of transferase activity(GO:0051348) |
| 0.0 | 0.1 | GO:0038203 | TORC2 signaling(GO:0038203) |
| 0.0 | 0.0 | GO:0001575 | globoside metabolic process(GO:0001575) |
| 0.0 | 0.4 | GO:0043567 | regulation of insulin-like growth factor receptor signaling pathway(GO:0043567) |
| 0.0 | 0.0 | GO:1902715 | positive regulation of interferon-gamma secretion(GO:1902715) |
| 0.0 | 0.4 | GO:0007035 | vacuolar acidification(GO:0007035) |
| 0.0 | 0.5 | GO:0070206 | protein trimerization(GO:0070206) |
| 0.0 | 0.1 | GO:0042670 | retinal cone cell differentiation(GO:0042670) retinal cone cell development(GO:0046549) |
| 0.0 | 0.0 | GO:0097211 | response to gonadotropin-releasing hormone(GO:0097210) cellular response to gonadotropin-releasing hormone(GO:0097211) |
| 0.0 | 0.1 | GO:0051012 | microtubule sliding(GO:0051012) |
| 0.0 | 0.0 | GO:0061370 | testosterone biosynthetic process(GO:0061370) |
| 0.0 | 0.3 | GO:0061003 | positive regulation of dendritic spine morphogenesis(GO:0061003) |
| 0.0 | 0.0 | GO:0019532 | oxalate transport(GO:0019532) |
| 0.0 | 1.3 | GO:0007156 | homophilic cell adhesion via plasma membrane adhesion molecules(GO:0007156) |
| 0.0 | 0.1 | GO:0001539 | cilium or flagellum-dependent cell motility(GO:0001539) |
| 0.0 | 0.0 | GO:0070459 | prolactin secretion(GO:0070459) |
| 0.0 | 0.1 | GO:0035826 | rubidium ion transport(GO:0035826) regulation of rubidium ion transport(GO:2000680) |
| 0.0 | 0.3 | GO:0043153 | entrainment of circadian clock by photoperiod(GO:0043153) |
| 0.0 | 0.0 | GO:1901164 | negative regulation of trophoblast cell migration(GO:1901164) |
| 0.0 | 0.1 | GO:0039536 | negative regulation of RIG-I signaling pathway(GO:0039536) |
| 0.0 | 0.4 | GO:0034314 | Arp2/3 complex-mediated actin nucleation(GO:0034314) |
| 0.0 | 0.1 | GO:0019852 | L-ascorbic acid metabolic process(GO:0019852) |
| 0.0 | 0.0 | GO:0034197 | acylglycerol transport(GO:0034196) triglyceride transport(GO:0034197) |
Gene overrepresentation in molecular_function category:
| Log-likelihood per target | Total log-likelihood | Term | Description |
|---|---|---|---|
| 1.3 | 6.5 | GO:0052828 | phosphatidylinositol-3,4-bisphosphate 4-phosphatase activity(GO:0016316) inositol-1,3,4-trisphosphate 4-phosphatase activity(GO:0017161) phosphatidylinositol-4,5-bisphosphate 4-phosphatase activity(GO:0034597) inositol-3,4-bisphosphate 4-phosphatase activity(GO:0052828) |
| 0.9 | 3.7 | GO:0004850 | uridine phosphorylase activity(GO:0004850) |
| 0.7 | 3.4 | GO:0004910 | interleukin-1, Type II, blocking receptor activity(GO:0004910) |
| 0.6 | 2.3 | GO:0005026 | transforming growth factor beta receptor activity, type II(GO:0005026) |
| 0.4 | 1.9 | GO:0005006 | epidermal growth factor-activated receptor activity(GO:0005006) |
| 0.4 | 7.2 | GO:0005149 | interleukin-1 receptor binding(GO:0005149) |
| 0.4 | 2.1 | GO:1903135 | cupric ion binding(GO:1903135) |
| 0.3 | 7.6 | GO:0098641 | cadherin binding involved in cell-cell adhesion(GO:0098641) |
| 0.2 | 0.7 | GO:0030377 | urokinase plasminogen activator receptor activity(GO:0030377) |
| 0.2 | 0.7 | GO:0036487 | nitric-oxide synthase inhibitor activity(GO:0036487) |
| 0.2 | 3.1 | GO:0030280 | structural constituent of epidermis(GO:0030280) |
| 0.2 | 1.1 | GO:0015193 | L-proline transmembrane transporter activity(GO:0015193) |
| 0.2 | 1.0 | GO:0038062 | protein tyrosine kinase collagen receptor activity(GO:0038062) |
| 0.2 | 1.0 | GO:0086075 | gap junction channel activity involved in cardiac conduction electrical coupling(GO:0086075) |
| 0.2 | 3.3 | GO:0004143 | diacylglycerol kinase activity(GO:0004143) |
| 0.2 | 18.3 | GO:0004867 | serine-type endopeptidase inhibitor activity(GO:0004867) |
| 0.2 | 2.2 | GO:0038132 | neuregulin binding(GO:0038132) |
| 0.2 | 0.5 | GO:0004731 | purine-nucleoside phosphorylase activity(GO:0004731) |
| 0.1 | 1.6 | GO:0032050 | clathrin heavy chain binding(GO:0032050) |
| 0.1 | 1.1 | GO:0003847 | 1-alkyl-2-acetylglycerophosphocholine esterase activity(GO:0003847) |
| 0.1 | 0.4 | GO:0016672 | oxidoreductase activity, acting on a sulfur group of donors, quinone or similar compound as acceptor(GO:0016672) glutathione dehydrogenase (ascorbate) activity(GO:0045174) methylarsonate reductase activity(GO:0050610) |
| 0.1 | 0.7 | GO:0016717 | oxidoreductase activity, acting on paired donors, with oxidation of a pair of donors resulting in the reduction of molecular oxygen to two molecules of water(GO:0016717) |
| 0.1 | 1.8 | GO:0030215 | semaphorin receptor binding(GO:0030215) |
| 0.1 | 0.5 | GO:0004743 | pyruvate kinase activity(GO:0004743) |
| 0.1 | 0.4 | GO:0008859 | exoribonuclease II activity(GO:0008859) |
| 0.1 | 1.7 | GO:0050700 | CARD domain binding(GO:0050700) |
| 0.1 | 0.6 | GO:0004161 | dimethylallyltranstransferase activity(GO:0004161) geranyltranstransferase activity(GO:0004337) |
| 0.1 | 0.6 | GO:0004105 | choline-phosphate cytidylyltransferase activity(GO:0004105) |
| 0.1 | 2.4 | GO:0051371 | muscle alpha-actinin binding(GO:0051371) |
| 0.1 | 0.5 | GO:0016286 | small conductance calcium-activated potassium channel activity(GO:0016286) |
| 0.1 | 1.0 | GO:0022841 | potassium ion leak channel activity(GO:0022841) |
| 0.1 | 1.0 | GO:1901702 | urate transmembrane transporter activity(GO:0015143) salt transmembrane transporter activity(GO:1901702) |
| 0.1 | 2.2 | GO:0030898 | actin-dependent ATPase activity(GO:0030898) |
| 0.1 | 0.6 | GO:0004471 | malate dehydrogenase (decarboxylating) (NAD+) activity(GO:0004471) malate dehydrogenase (decarboxylating) (NADP+) activity(GO:0004473) oxaloacetate decarboxylase activity(GO:0008948) |
| 0.1 | 0.3 | GO:0098519 | nucleotide phosphatase activity, acting on free nucleotides(GO:0098519) |
| 0.1 | 0.7 | GO:1990599 | 3' overhang single-stranded DNA endodeoxyribonuclease activity(GO:1990599) |
| 0.1 | 0.4 | GO:0015254 | glycerol channel activity(GO:0015254) |
| 0.1 | 0.6 | GO:0000285 | 1-phosphatidylinositol-3-phosphate 5-kinase activity(GO:0000285) |
| 0.1 | 0.5 | GO:0060961 | phospholipase D inhibitor activity(GO:0060961) |
| 0.1 | 2.2 | GO:0080025 | phosphatidylinositol-3,5-bisphosphate binding(GO:0080025) |
| 0.1 | 2.6 | GO:0004181 | metallocarboxypeptidase activity(GO:0004181) |
| 0.1 | 1.3 | GO:0005229 | intracellular calcium activated chloride channel activity(GO:0005229) |
| 0.1 | 1.1 | GO:0047372 | acylglycerol lipase activity(GO:0047372) |
| 0.1 | 0.5 | GO:0008481 | sphinganine kinase activity(GO:0008481) D-erythro-sphingosine kinase activity(GO:0017050) |
| 0.1 | 1.1 | GO:0003836 | beta-galactoside (CMP) alpha-2,3-sialyltransferase activity(GO:0003836) |
| 0.1 | 0.6 | GO:0015501 | glutamate:sodium symporter activity(GO:0015501) |
| 0.1 | 0.5 | GO:1990254 | keratin filament binding(GO:1990254) |
| 0.1 | 0.2 | GO:0019828 | aspartic-type endopeptidase inhibitor activity(GO:0019828) |
| 0.1 | 2.7 | GO:0001848 | complement binding(GO:0001848) |
| 0.1 | 0.6 | GO:0008559 | xenobiotic-transporting ATPase activity(GO:0008559) |
| 0.1 | 1.5 | GO:0001608 | G-protein coupled nucleotide receptor activity(GO:0001608) G-protein coupled purinergic nucleotide receptor activity(GO:0045028) |
| 0.1 | 1.0 | GO:0019855 | calcium channel inhibitor activity(GO:0019855) |
| 0.1 | 2.9 | GO:0004198 | calcium-dependent cysteine-type endopeptidase activity(GO:0004198) |
| 0.1 | 0.7 | GO:0005094 | Rho GDP-dissociation inhibitor activity(GO:0005094) |
| 0.1 | 0.5 | GO:0043546 | molybdopterin cofactor binding(GO:0043546) |
| 0.1 | 0.4 | GO:0019531 | oxalate transmembrane transporter activity(GO:0019531) |
| 0.1 | 0.2 | GO:0004924 | oncostatin-M receptor activity(GO:0004924) |
| 0.1 | 0.6 | GO:0036042 | long-chain fatty acyl-CoA binding(GO:0036042) |
| 0.1 | 0.2 | GO:0003827 | alpha-1,3-mannosylglycoprotein 2-beta-N-acetylglucosaminyltransferase activity(GO:0003827) |
| 0.1 | 0.2 | GO:0004719 | protein-L-isoaspartate (D-aspartate) O-methyltransferase activity(GO:0004719) |
| 0.1 | 0.5 | GO:0004563 | beta-N-acetylhexosaminidase activity(GO:0004563) |
| 0.1 | 1.8 | GO:0070064 | proline-rich region binding(GO:0070064) |
| 0.1 | 0.3 | GO:0004687 | myosin light chain kinase activity(GO:0004687) |
| 0.1 | 0.5 | GO:0086083 | cell adhesive protein binding involved in bundle of His cell-Purkinje myocyte communication(GO:0086083) |
| 0.1 | 0.4 | GO:0004459 | lactate dehydrogenase activity(GO:0004457) L-lactate dehydrogenase activity(GO:0004459) |
| 0.1 | 0.6 | GO:0031994 | insulin-like growth factor I binding(GO:0031994) |
| 0.1 | 0.9 | GO:0045236 | CXCR chemokine receptor binding(GO:0045236) |
| 0.1 | 0.4 | GO:0019863 | IgE binding(GO:0019863) |
| 0.1 | 0.4 | GO:0005432 | calcium:sodium antiporter activity(GO:0005432) |
| 0.1 | 0.3 | GO:0004839 | ubiquitin activating enzyme activity(GO:0004839) |
| 0.1 | 0.2 | GO:0004139 | deoxyribose-phosphate aldolase activity(GO:0004139) |
| 0.0 | 0.4 | GO:0008093 | cytoskeletal adaptor activity(GO:0008093) |
| 0.0 | 0.2 | GO:0005314 | high-affinity glutamate transmembrane transporter activity(GO:0005314) |
| 0.0 | 0.2 | GO:0005477 | pyruvate secondary active transmembrane transporter activity(GO:0005477) |
| 0.0 | 0.1 | GO:0008332 | low voltage-gated calcium channel activity(GO:0008332) |
| 0.0 | 0.1 | GO:0004087 | carbamoyl-phosphate synthase (ammonia) activity(GO:0004087) carbamoyl-phosphate synthase (glutamine-hydrolyzing) activity(GO:0004088) |
| 0.0 | 0.1 | GO:0005127 | ciliary neurotrophic factor receptor binding(GO:0005127) |
| 0.0 | 0.2 | GO:0042132 | fructose 1,6-bisphosphate 1-phosphatase activity(GO:0042132) |
| 0.0 | 1.1 | GO:0030506 | ankyrin binding(GO:0030506) |
| 0.0 | 1.1 | GO:0004012 | phospholipid-translocating ATPase activity(GO:0004012) |
| 0.0 | 0.1 | GO:0008386 | cholesterol monooxygenase (side-chain-cleaving) activity(GO:0008386) |
| 0.0 | 0.1 | GO:0004915 | interleukin-6 receptor activity(GO:0004915) interleukin-6 binding(GO:0019981) |
| 0.0 | 0.4 | GO:0004579 | dolichyl-diphosphooligosaccharide-protein glycotransferase activity(GO:0004579) |
| 0.0 | 2.4 | GO:0017112 | Rab guanyl-nucleotide exchange factor activity(GO:0017112) |
| 0.0 | 0.3 | GO:0004882 | androgen receptor activity(GO:0004882) |
| 0.0 | 0.3 | GO:0008172 | S-methyltransferase activity(GO:0008172) |
| 0.0 | 0.3 | GO:0016206 | catechol O-methyltransferase activity(GO:0016206) |
| 0.0 | 6.9 | GO:0005200 | structural constituent of cytoskeleton(GO:0005200) |
| 0.0 | 0.3 | GO:0035727 | lysophosphatidic acid binding(GO:0035727) |
| 0.0 | 0.4 | GO:0046703 | natural killer cell lectin-like receptor binding(GO:0046703) |
| 0.0 | 0.4 | GO:0000774 | adenyl-nucleotide exchange factor activity(GO:0000774) |
| 0.0 | 0.2 | GO:0052740 | 1-acyl-2-lysophosphatidylserine acylhydrolase activity(GO:0052740) |
| 0.0 | 0.4 | GO:0005005 | transmembrane-ephrin receptor activity(GO:0005005) |
| 0.0 | 1.8 | GO:0005080 | protein kinase C binding(GO:0005080) |
| 0.0 | 0.1 | GO:0004060 | arylamine N-acetyltransferase activity(GO:0004060) |
| 0.0 | 0.9 | GO:0051010 | microtubule plus-end binding(GO:0051010) |
| 0.0 | 0.4 | GO:0001730 | 2'-5'-oligoadenylate synthetase activity(GO:0001730) |
| 0.0 | 0.4 | GO:0003696 | satellite DNA binding(GO:0003696) |
| 0.0 | 1.1 | GO:0005548 | phospholipid transporter activity(GO:0005548) |
| 0.0 | 0.5 | GO:0032395 | MHC class II receptor activity(GO:0032395) |
| 0.0 | 0.6 | GO:0005385 | zinc ion transmembrane transporter activity(GO:0005385) |
| 0.0 | 0.3 | GO:0004499 | N,N-dimethylaniline monooxygenase activity(GO:0004499) |
| 0.0 | 0.2 | GO:0016176 | superoxide-generating NADPH oxidase activator activity(GO:0016176) |
| 0.0 | 24.5 | GO:0005198 | structural molecule activity(GO:0005198) |
| 0.0 | 1.1 | GO:0004385 | guanylate kinase activity(GO:0004385) |
| 0.0 | 1.5 | GO:0050699 | WW domain binding(GO:0050699) |
| 0.0 | 0.5 | GO:0044548 | S100 protein binding(GO:0044548) |
| 0.0 | 0.2 | GO:0048101 | calcium- and calmodulin-regulated 3',5'-cyclic-GMP phosphodiesterase activity(GO:0048101) |
| 0.0 | 0.1 | GO:1900750 | glutathione binding(GO:0043295) oligopeptide binding(GO:1900750) |
| 0.0 | 0.1 | GO:0003726 | double-stranded RNA adenosine deaminase activity(GO:0003726) |
| 0.0 | 0.1 | GO:0004694 | eukaryotic translation initiation factor 2alpha kinase activity(GO:0004694) |
| 0.0 | 0.3 | GO:0043426 | MRF binding(GO:0043426) |
| 0.0 | 0.1 | GO:0004505 | phenylalanine 4-monooxygenase activity(GO:0004505) |
| 0.0 | 0.2 | GO:0043208 | glycosphingolipid binding(GO:0043208) |
| 0.0 | 0.1 | GO:0003846 | 2-acylglycerol O-acyltransferase activity(GO:0003846) |
| 0.0 | 0.0 | GO:0052812 | phosphatidylinositol-3,4-bisphosphate 5-kinase activity(GO:0052812) |
| 0.0 | 0.5 | GO:0005540 | hyaluronic acid binding(GO:0005540) |
| 0.0 | 0.2 | GO:0008970 | phosphatidylcholine 1-acylhydrolase activity(GO:0008970) |
| 0.0 | 0.5 | GO:0043522 | leucine zipper domain binding(GO:0043522) |
| 0.0 | 0.3 | GO:0032407 | MutSalpha complex binding(GO:0032407) |
| 0.0 | 0.4 | GO:0017017 | MAP kinase tyrosine/serine/threonine phosphatase activity(GO:0017017) |
| 0.0 | 3.0 | GO:0004222 | metalloendopeptidase activity(GO:0004222) |
| 0.0 | 0.3 | GO:0019784 | NEDD8-specific protease activity(GO:0019784) |
| 0.0 | 0.1 | GO:0005457 | GDP-fucose transmembrane transporter activity(GO:0005457) purine nucleotide-sugar transmembrane transporter activity(GO:0036080) |
| 0.0 | 0.3 | GO:0033038 | bitter taste receptor activity(GO:0033038) |
| 0.0 | 0.3 | GO:0033192 | calmodulin-dependent protein phosphatase activity(GO:0033192) |
| 0.0 | 0.2 | GO:0042296 | ISG15 transferase activity(GO:0042296) |
| 0.0 | 0.1 | GO:0016312 | inositol bisphosphate phosphatase activity(GO:0016312) |
| 0.0 | 0.7 | GO:0005547 | phosphatidylinositol-3,4,5-trisphosphate binding(GO:0005547) |
| 0.0 | 0.1 | GO:0004917 | interleukin-7 receptor activity(GO:0004917) |
| 0.0 | 0.5 | GO:0048018 | receptor agonist activity(GO:0048018) |
| 0.0 | 0.6 | GO:0005523 | tropomyosin binding(GO:0005523) |
| 0.0 | 0.2 | GO:0016868 | intramolecular transferase activity, phosphotransferases(GO:0016868) |
| 0.0 | 0.5 | GO:0005527 | macrolide binding(GO:0005527) FK506 binding(GO:0005528) |
| 0.0 | 3.2 | GO:0044325 | ion channel binding(GO:0044325) |
| 0.0 | 0.1 | GO:0004906 | interferon-gamma receptor activity(GO:0004906) |
| 0.0 | 1.0 | GO:0042379 | chemokine receptor binding(GO:0042379) |
| 0.0 | 0.3 | GO:0045295 | gamma-catenin binding(GO:0045295) |
| 0.0 | 0.1 | GO:0003998 | acylphosphatase activity(GO:0003998) |
| 0.0 | 1.2 | GO:0043621 | protein self-association(GO:0043621) |
| 0.0 | 0.2 | GO:0008158 | hedgehog receptor activity(GO:0008158) |
| 0.0 | 0.2 | GO:0019158 | glucokinase activity(GO:0004340) hexokinase activity(GO:0004396) fructokinase activity(GO:0008865) mannokinase activity(GO:0019158) |
| 0.0 | 0.1 | GO:1990460 | leptin receptor binding(GO:1990460) |
| 0.0 | 0.2 | GO:0016846 | carbon-sulfur lyase activity(GO:0016846) |
| 0.0 | 0.5 | GO:0071837 | HMG box domain binding(GO:0071837) |
| 0.0 | 0.3 | GO:0000993 | RNA polymerase II core binding(GO:0000993) |
| 0.0 | 0.1 | GO:0008553 | hydrogen-exporting ATPase activity, phosphorylative mechanism(GO:0008553) |
| 0.0 | 0.5 | GO:0017134 | fibroblast growth factor binding(GO:0017134) |
| 0.0 | 0.1 | GO:0001847 | opsonin receptor activity(GO:0001847) peptidoglycan receptor activity(GO:0016019) |
| 0.0 | 0.1 | GO:0008467 | [heparan sulfate]-glucosamine 3-sulfotransferase 1 activity(GO:0008467) |
| 0.0 | 0.1 | GO:0000995 | transcription factor activity, core RNA polymerase III binding(GO:0000995) |
| 0.0 | 0.2 | GO:0008430 | selenium binding(GO:0008430) |
| 0.0 | 0.1 | GO:0004963 | follicle-stimulating hormone receptor activity(GO:0004963) |
| 0.0 | 0.1 | GO:0004415 | hyalurononglucosaminidase activity(GO:0004415) |
| 0.0 | 0.8 | GO:0004984 | olfactory receptor activity(GO:0004984) |
| 0.0 | 0.2 | GO:0038191 | neuropilin binding(GO:0038191) |
| 0.0 | 0.2 | GO:0004526 | ribonuclease P activity(GO:0004526) |
| 0.0 | 0.1 | GO:0004321 | fatty-acyl-CoA synthase activity(GO:0004321) |
| 0.0 | 0.1 | GO:0043141 | ATP-dependent 5'-3' DNA helicase activity(GO:0043141) |
| 0.0 | 0.0 | GO:0008177 | succinate dehydrogenase (ubiquinone) activity(GO:0008177) 3 iron, 4 sulfur cluster binding(GO:0051538) |
| 0.0 | 0.1 | GO:0038051 | glucocorticoid receptor activity(GO:0004883) glucocorticoid-activated RNA polymerase II transcription factor binding transcription factor activity(GO:0038051) |
| 0.0 | 0.2 | GO:0031402 | sodium ion binding(GO:0031402) |
| 0.0 | 0.8 | GO:0004693 | cyclin-dependent protein serine/threonine kinase activity(GO:0004693) |
| 0.0 | 0.0 | GO:0080019 | fatty-acyl-CoA reductase (alcohol-forming) activity(GO:0080019) |
| 0.0 | 0.1 | GO:0001042 | RNA polymerase I core binding(GO:0001042) |
| 0.0 | 0.2 | GO:0008510 | sodium:bicarbonate symporter activity(GO:0008510) |
| 0.0 | 0.1 | GO:0017040 | ceramidase activity(GO:0017040) |
| 0.0 | 0.2 | GO:0005545 | 1-phosphatidylinositol binding(GO:0005545) |
| 0.0 | 0.1 | GO:0030107 | HLA-A specific inhibitory MHC class I receptor activity(GO:0030107) |
| 0.0 | 0.0 | GO:0018685 | alkane 1-monooxygenase activity(GO:0018685) |
| 0.0 | 0.1 | GO:0023024 | MHC class I protein complex binding(GO:0023024) |
| 0.0 | 2.0 | GO:0001078 | transcriptional repressor activity, RNA polymerase II core promoter proximal region sequence-specific binding(GO:0001078) |
| 0.0 | 0.4 | GO:0051019 | mitogen-activated protein kinase binding(GO:0051019) |
| 0.0 | 0.0 | GO:0005124 | scavenger receptor binding(GO:0005124) |
| 0.0 | 0.2 | GO:0008331 | high voltage-gated calcium channel activity(GO:0008331) |
| 0.0 | 0.3 | GO:0036442 | hydrogen-exporting ATPase activity(GO:0036442) proton-transporting ATPase activity, rotational mechanism(GO:0046961) |
| 0.0 | 0.0 | GO:0048156 | tau protein binding(GO:0048156) |
| 0.0 | 0.1 | GO:0008121 | ubiquinol-cytochrome-c reductase activity(GO:0008121) oxidoreductase activity, acting on diphenols and related substances as donors, cytochrome as acceptor(GO:0016681) |
| 0.0 | 0.1 | GO:0061665 | SUMO ligase activity(GO:0061665) |
| 0.0 | 0.0 | GO:0004461 | lactose synthase activity(GO:0004461) |
| 0.0 | 0.0 | GO:0004574 | oligo-1,6-glucosidase activity(GO:0004574) |
| 0.0 | 0.6 | GO:0050681 | androgen receptor binding(GO:0050681) |
| 0.0 | 0.2 | GO:0004115 | 3',5'-cyclic-AMP phosphodiesterase activity(GO:0004115) |
| 0.0 | 0.1 | GO:0008821 | crossover junction endodeoxyribonuclease activity(GO:0008821) |
| 0.0 | 1.4 | GO:0051015 | actin filament binding(GO:0051015) |
| 0.0 | 0.1 | GO:0016427 | tRNA (cytosine) methyltransferase activity(GO:0016427) |
| 0.0 | 0.4 | GO:0042287 | MHC protein binding(GO:0042287) |
Gene overrepresentation in C2:CP:REACTOME category:
| Log-likelihood per target | Total log-likelihood | Term | Description |
|---|---|---|---|
| 0.4 | 5.9 | REACTOME SYNTHESIS OF PIPS AT THE EARLY ENDOSOME MEMBRANE | Genes involved in Synthesis of PIPs at the early endosome membrane |
| 0.3 | 3.7 | REACTOME PYRIMIDINE CATABOLISM | Genes involved in Pyrimidine catabolism |
| 0.2 | 27.9 | REACTOME CELL JUNCTION ORGANIZATION | Genes involved in Cell junction organization |
| 0.2 | 1.3 | REACTOME PURINE CATABOLISM | Genes involved in Purine catabolism |
| 0.2 | 0.2 | REACTOME REGULATION OF APOPTOSIS | Genes involved in Regulation of Apoptosis |
| 0.1 | 8.3 | REACTOME IL1 SIGNALING | Genes involved in Interleukin-1 signaling |
| 0.1 | 1.0 | REACTOME TANDEM PORE DOMAIN POTASSIUM CHANNELS | Genes involved in Tandem pore domain potassium channels |
| 0.1 | 3.0 | REACTOME TGF BETA RECEPTOR SIGNALING IN EMT EPITHELIAL TO MESENCHYMAL TRANSITION | Genes involved in TGF-beta receptor signaling in EMT (epithelial to mesenchymal transition) |
| 0.1 | 1.9 | REACTOME APOPTOTIC CLEAVAGE OF CELL ADHESION PROTEINS | Genes involved in Apoptotic cleavage of cell adhesion proteins |
| 0.1 | 2.0 | REACTOME GAP JUNCTION DEGRADATION | Genes involved in Gap junction degradation |
| 0.1 | 4.3 | REACTOME EFFECTS OF PIP2 HYDROLYSIS | Genes involved in Effects of PIP2 hydrolysis |
| 0.1 | 1.8 | REACTOME THE NLRP3 INFLAMMASOME | Genes involved in The NLRP3 inflammasome |
| 0.1 | 1.4 | REACTOME HYALURONAN UPTAKE AND DEGRADATION | Genes involved in Hyaluronan uptake and degradation |
| 0.1 | 1.9 | REACTOME SHC1 EVENTS IN EGFR SIGNALING | Genes involved in SHC1 events in EGFR signaling |
| 0.1 | 1.1 | REACTOME SIGNALING BY HIPPO | Genes involved in Signaling by Hippo |
| 0.1 | 4.1 | REACTOME NCAM1 INTERACTIONS | Genes involved in NCAM1 interactions |
| 0.1 | 2.4 | REACTOME BASIGIN INTERACTIONS | Genes involved in Basigin interactions |
| 0.1 | 1.5 | REACTOME POST CHAPERONIN TUBULIN FOLDING PATHWAY | Genes involved in Post-chaperonin tubulin folding pathway |
| 0.0 | 2.2 | REACTOME INTERFERON ALPHA BETA SIGNALING | Genes involved in Interferon alpha/beta signaling |
| 0.0 | 0.9 | REACTOME ACTIVATION OF RAC | Genes involved in Activation of Rac |
| 0.0 | 1.1 | REACTOME DOWNREGULATION OF TGF BETA RECEPTOR SIGNALING | Genes involved in Downregulation of TGF-beta receptor signaling |
| 0.0 | 0.6 | REACTOME ZINC TRANSPORTERS | Genes involved in Zinc transporters |
| 0.0 | 0.9 | REACTOME ADVANCED GLYCOSYLATION ENDPRODUCT RECEPTOR SIGNALING | Genes involved in Advanced glycosylation endproduct receptor signaling |
| 0.0 | 0.6 | REACTOME FACILITATIVE NA INDEPENDENT GLUCOSE TRANSPORTERS | Genes involved in Facilitative Na+-independent glucose transporters |
| 0.0 | 2.4 | REACTOME INTERFERON GAMMA SIGNALING | Genes involved in Interferon gamma signaling |
| 0.0 | 0.8 | REACTOME FORMATION OF INCISION COMPLEX IN GG NER | Genes involved in Formation of incision complex in GG-NER |
| 0.0 | 0.6 | REACTOME AMINO ACID TRANSPORT ACROSS THE PLASMA MEMBRANE | Genes involved in Amino acid transport across the plasma membrane |
| 0.0 | 0.8 | REACTOME POST TRANSLATIONAL MODIFICATION SYNTHESIS OF GPI ANCHORED PROTEINS | Genes involved in Post-translational modification: synthesis of GPI-anchored proteins |
| 0.0 | 0.1 | REACTOME BINDING AND ENTRY OF HIV VIRION | Genes involved in Binding and entry of HIV virion |
| 0.0 | 0.4 | REACTOME ENDOGENOUS STEROLS | Genes involved in Endogenous sterols |
| 0.0 | 0.3 | REACTOME DOPAMINE NEUROTRANSMITTER RELEASE CYCLE | Genes involved in Dopamine Neurotransmitter Release Cycle |
| 0.0 | 0.5 | REACTOME AMINO ACID AND OLIGOPEPTIDE SLC TRANSPORTERS | Genes involved in Amino acid and oligopeptide SLC transporters |
| 0.0 | 0.4 | REACTOME PYRUVATE METABOLISM | Genes involved in Pyruvate metabolism |
| 0.0 | 0.3 | REACTOME SYNTHESIS SECRETION AND DEACYLATION OF GHRELIN | Genes involved in Synthesis, Secretion, and Deacylation of Ghrelin |
| 0.0 | 0.5 | REACTOME NOD1 2 SIGNALING PATHWAY | Genes involved in NOD1/2 Signaling Pathway |
| 0.0 | 0.2 | REACTOME BILE SALT AND ORGANIC ANION SLC TRANSPORTERS | Genes involved in Bile salt and organic anion SLC transporters |
| 0.0 | 0.6 | REACTOME ASSOCIATION OF TRIC CCT WITH TARGET PROTEINS DURING BIOSYNTHESIS | Genes involved in Association of TriC/CCT with target proteins during biosynthesis |
| 0.0 | 0.2 | REACTOME ABACAVIR TRANSPORT AND METABOLISM | Genes involved in Abacavir transport and metabolism |
| 0.0 | 0.3 | REACTOME NEF MEDIATES DOWN MODULATION OF CELL SURFACE RECEPTORS BY RECRUITING THEM TO CLATHRIN ADAPTERS | Genes involved in Nef-mediates down modulation of cell surface receptors by recruiting them to clathrin adapters |
| 0.0 | 0.2 | REACTOME SYNTHESIS OF PIPS AT THE GOLGI MEMBRANE | Genes involved in Synthesis of PIPs at the Golgi membrane |
| 0.0 | 0.5 | REACTOME RECYCLING PATHWAY OF L1 | Genes involved in Recycling pathway of L1 |
| 0.0 | 0.7 | REACTOME ION TRANSPORT BY P TYPE ATPASES | Genes involved in Ion transport by P-type ATPases |
| 0.0 | 0.3 | REACTOME BMAL1 CLOCK NPAS2 ACTIVATES CIRCADIAN EXPRESSION | Genes involved in BMAL1:CLOCK/NPAS2 Activates Circadian Expression |
| 0.0 | 0.1 | REACTOME ENOS ACTIVATION AND REGULATION | Genes involved in eNOS activation and regulation |
| 0.0 | 0.1 | REACTOME ER PHAGOSOME PATHWAY | Genes involved in ER-Phagosome pathway |
| 0.0 | 0.5 | REACTOME COLLAGEN FORMATION | Genes involved in Collagen formation |
| 0.0 | 0.4 | REACTOME ABC FAMILY PROTEINS MEDIATED TRANSPORT | Genes involved in ABC-family proteins mediated transport |
| 0.0 | 0.3 | REACTOME SIGNALING BY FGFR1 FUSION MUTANTS | Genes involved in Signaling by FGFR1 fusion mutants |
Gene overrepresentation in C2:CP category:
| Log-likelihood per target | Total log-likelihood | Term | Description |
|---|---|---|---|
| 1.2 | 27.2 | PID INTEGRIN4 PATHWAY | Alpha6 beta4 integrin-ligand interactions |
| 0.2 | 4.7 | PID ANTHRAX PATHWAY | Cellular roles of Anthrax toxin |
| 0.1 | 5.3 | PID GLYPICAN 1PATHWAY | Glypican 1 network |
| 0.1 | 4.7 | PID IL1 PATHWAY | IL1-mediated signaling events |
| 0.1 | 2.3 | PID SYNDECAN 3 PATHWAY | Syndecan-3-mediated signaling events |
| 0.1 | 0.1 | ST INTERFERON GAMMA PATHWAY | Interferon gamma pathway. |
| 0.1 | 4.5 | PID DELTA NP63 PATHWAY | Validated transcriptional targets of deltaNp63 isoforms |
| 0.0 | 1.2 | PID ARF 3PATHWAY | Arf1 pathway |
| 0.0 | 1.4 | PID NFKAPPAB CANONICAL PATHWAY | Canonical NF-kappaB pathway |
| 0.0 | 3.7 | PID NFAT TFPATHWAY | Calcineurin-regulated NFAT-dependent transcription in lymphocytes |
| 0.0 | 0.8 | SA G1 AND S PHASES | Cdk2, 4, and 6 bind cyclin D in G1, while cdk2/cyclin E promotes the G1/S transition. |
| 0.0 | 11.7 | NABA ECM REGULATORS | Genes encoding enzymes and their regulators involved in the remodeling of the extracellular matrix |
| 0.0 | 1.2 | PID HDAC CLASSIII PATHWAY | Signaling events mediated by HDAC Class III |
| 0.0 | 0.7 | PID ALK2 PATHWAY | ALK2 signaling events |
| 0.0 | 0.3 | ST IL 13 PATHWAY | Interleukin 13 (IL-13) Pathway |
| 0.0 | 1.9 | PID INTEGRIN3 PATHWAY | Beta3 integrin cell surface interactions |
| 0.0 | 1.5 | PID AJDISS 2PATHWAY | Posttranslational regulation of adherens junction stability and dissassembly |
| 0.0 | 1.3 | PID TAP63 PATHWAY | Validated transcriptional targets of TAp63 isoforms |
| 0.0 | 2.0 | PID AP1 PATHWAY | AP-1 transcription factor network |
| 0.0 | 1.1 | PID RAS PATHWAY | Regulation of Ras family activation |
| 0.0 | 8.4 | NABA SECRETED FACTORS | Genes encoding secreted soluble factors |
| 0.0 | 0.5 | PID AVB3 OPN PATHWAY | Osteopontin-mediated events |
| 0.0 | 0.4 | PID NETRIN PATHWAY | Netrin-mediated signaling events |
| 0.0 | 0.4 | SIG PIP3 SIGNALING IN CARDIAC MYOCTES | Genes related to PIP3 signaling in cardiac myocytes |
| 0.0 | 3.0 | NABA ECM AFFILIATED | Genes encoding proteins affiliated structurally or functionally to extracellular matrix proteins |
| 0.0 | 1.2 | PID AURORA B PATHWAY | Aurora B signaling |
| 0.0 | 0.4 | PID SYNDECAN 2 PATHWAY | Syndecan-2-mediated signaling events |
| 0.0 | 0.3 | PID CIRCADIAN PATHWAY | Circadian rhythm pathway |
| 0.0 | 0.5 | PID INTEGRIN1 PATHWAY | Beta1 integrin cell surface interactions |
| 0.0 | 0.4 | ST PHOSPHOINOSITIDE 3 KINASE PATHWAY | PI3K Pathway |
| 0.0 | 0.3 | ST INTERLEUKIN 4 PATHWAY | Interleukin 4 (IL-4) Pathway |
| 0.0 | 0.6 | PID LIS1 PATHWAY | Lissencephaly gene (LIS1) in neuronal migration and development |
| 0.0 | 0.5 | PID IL3 PATHWAY | IL3-mediated signaling events |
| 0.0 | 0.8 | PID FAK PATHWAY | Signaling events mediated by focal adhesion kinase |
| 0.0 | 0.7 | PID ARF6 PATHWAY | Arf6 signaling events |
| 0.0 | 0.5 | SIG CHEMOTAXIS | Genes related to chemotaxis |
| 0.0 | 0.9 | PID P53 REGULATION PATHWAY | p53 pathway |
| 0.0 | 0.3 | PID ALPHA SYNUCLEIN PATHWAY | Alpha-synuclein signaling |
| 0.0 | 0.1 | ST STAT3 PATHWAY | STAT3 Pathway |