Project
ENCODE cell lines, expression (Ernst 2011)
Navigation
Downloads
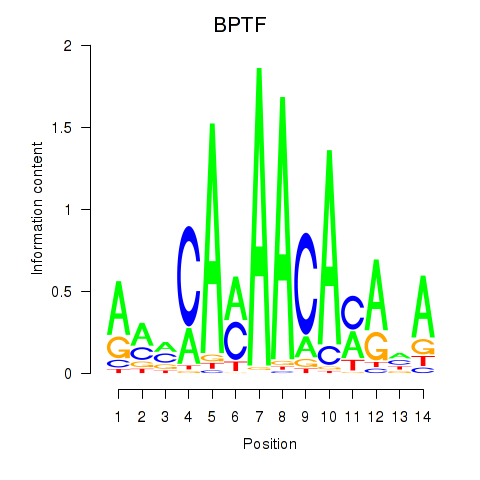
Results for BPTF
Z-value: 1.52
Motif logo
Transcription factors associated with BPTF
| Gene Symbol | Gene ID | Gene Info |
|---|---|---|
|
BPTF
|
ENSG00000171634.12 | BPTF |
Activity-expression correlation:
| Gene | Promoter | Pearson corr. coef. | P-value | Plot |
|---|---|---|---|---|
| BPTF | hg19_v2_chr17_+_65821780_65821826 | 0.17 | 5.2e-01 | Click! |
Activity profile of BPTF motif
Sorted Z-values of BPTF motif
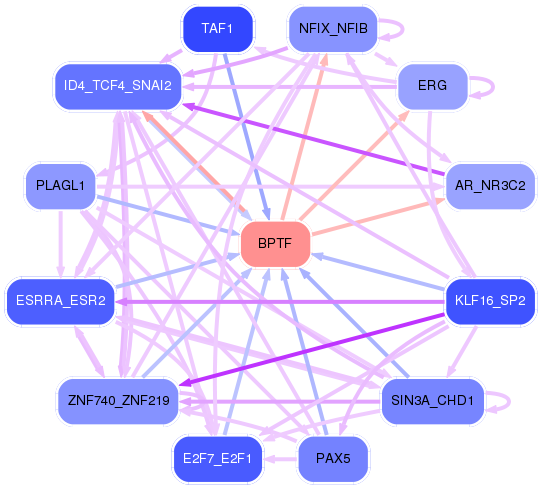
Network of associatons between targets according to the STRING database.

First level regulatory network of BPTF
| Promoter | Score | Transcript | Gene | Gene Info |
|---|---|---|---|---|
| chrY_+_2709906 | 4.32 |
ENST00000430575.1 |
RPS4Y1 |
ribosomal protein S4, Y-linked 1 |
| chr11_+_114168085 | 3.50 |
ENST00000541754.1 |
NNMT |
nicotinamide N-methyltransferase |
| chr7_-_150329421 | 3.19 |
ENST00000493969.1 ENST00000328902.5 |
GIMAP6 |
GTPase, IMAP family member 6 |
| chr11_+_114128522 | 2.44 |
ENST00000535401.1 |
NNMT |
nicotinamide N-methyltransferase |
| chr1_+_151030234 | 2.25 |
ENST00000368921.3 |
MLLT11 |
myeloid/lymphoid or mixed-lineage leukemia (trithorax homolog, Drosophila); translocated to, 11 |
| chr4_-_186877806 | 2.18 |
ENST00000355634.5 |
SORBS2 |
sorbin and SH3 domain containing 2 |
| chr17_-_62097927 | 2.14 |
ENST00000578313.1 ENST00000584084.1 ENST00000579788.1 ENST00000579687.1 ENST00000578379.1 ENST00000578892.1 ENST00000412356.1 ENST00000418105.1 |
ICAM2 |
intercellular adhesion molecule 2 |
| chr12_+_75874984 | 1.93 |
ENST00000550491.1 |
GLIPR1 |
GLI pathogenesis-related 1 |
| chr17_-_62084241 | 1.91 |
ENST00000449662.2 |
ICAM2 |
intercellular adhesion molecule 2 |
| chr4_+_90823130 | 1.89 |
ENST00000508372.1 |
MMRN1 |
multimerin 1 |
| chr7_+_102553430 | 1.89 |
ENST00000339431.4 ENST00000249377.4 |
LRRC17 |
leucine rich repeat containing 17 |
| chrY_+_22918021 | 1.83 |
ENST00000288666.5 |
RPS4Y2 |
ribosomal protein S4, Y-linked 2 |
| chr12_+_75874580 | 1.81 |
ENST00000456650.3 |
GLIPR1 |
GLI pathogenesis-related 1 |
| chr18_-_52989525 | 1.68 |
ENST00000457482.3 |
TCF4 |
transcription factor 4 |
| chr18_-_53303123 | 1.65 |
ENST00000569357.1 ENST00000565124.1 ENST00000398339.1 |
TCF4 |
transcription factor 4 |
| chr18_-_53089723 | 1.56 |
ENST00000561992.1 ENST00000562512.2 |
TCF4 |
transcription factor 4 |
| chr2_-_56150910 | 1.50 |
ENST00000424836.2 ENST00000438672.1 ENST00000440439.1 ENST00000429909.1 ENST00000424207.1 ENST00000452337.1 ENST00000355426.3 ENST00000439193.1 ENST00000421664.1 |
EFEMP1 |
EGF containing fibulin-like extracellular matrix protein 1 |
| chr9_+_116207007 | 1.49 |
ENST00000374140.2 |
RGS3 |
regulator of G-protein signaling 3 |
| chrX_+_99899180 | 1.46 |
ENST00000373004.3 |
SRPX2 |
sushi-repeat containing protein, X-linked 2 |
| chr6_-_46922659 | 1.44 |
ENST00000265417.7 |
GPR116 |
G protein-coupled receptor 116 |
| chr8_-_13134045 | 1.40 |
ENST00000512044.2 |
DLC1 |
deleted in liver cancer 1 |
| chr3_+_173302222 | 1.39 |
ENST00000361589.4 |
NLGN1 |
neuroligin 1 |
| chr9_+_75766652 | 1.35 |
ENST00000257497.6 |
ANXA1 |
annexin A1 |
| chr3_-_114343768 | 1.35 |
ENST00000393785.2 |
ZBTB20 |
zinc finger and BTB domain containing 20 |
| chr18_-_52989217 | 1.30 |
ENST00000570287.2 |
TCF4 |
transcription factor 4 |
| chr2_-_175712270 | 1.28 |
ENST00000295497.7 ENST00000444394.1 |
CHN1 |
chimerin 1 |
| chr2_+_33359646 | 1.28 |
ENST00000390003.4 ENST00000418533.2 |
LTBP1 |
latent transforming growth factor beta binding protein 1 |
| chr7_+_93551011 | 1.28 |
ENST00000248564.5 |
GNG11 |
guanine nucleotide binding protein (G protein), gamma 11 |
| chr17_-_76870126 | 1.26 |
ENST00000586057.1 |
TIMP2 |
TIMP metallopeptidase inhibitor 2 |
| chr8_-_82395461 | 1.24 |
ENST00000256104.4 |
FABP4 |
fatty acid binding protein 4, adipocyte |
| chr17_-_62097904 | 1.19 |
ENST00000583366.1 |
ICAM2 |
intercellular adhesion molecule 2 |
| chr2_+_33359687 | 1.19 |
ENST00000402934.1 ENST00000404525.1 ENST00000407925.1 |
LTBP1 |
latent transforming growth factor beta binding protein 1 |
| chr5_-_94417339 | 1.11 |
ENST00000429576.2 ENST00000508509.1 ENST00000510732.1 |
MCTP1 |
multiple C2 domains, transmembrane 1 |
| chr7_-_50860565 | 1.11 |
ENST00000403097.1 |
GRB10 |
growth factor receptor-bound protein 10 |
| chr3_-_114035026 | 1.10 |
ENST00000570269.1 |
RP11-553L6.5 |
RP11-553L6.5 |
| chr19_-_48752812 | 1.09 |
ENST00000359009.4 |
CARD8 |
caspase recruitment domain family, member 8 |
| chr2_-_151344172 | 1.06 |
ENST00000375734.2 ENST00000263895.4 ENST00000454202.1 |
RND3 |
Rho family GTPase 3 |
| chr18_-_53255766 | 1.05 |
ENST00000566286.1 ENST00000564999.1 ENST00000566279.1 ENST00000354452.3 ENST00000356073.4 |
TCF4 |
transcription factor 4 |
| chr8_-_27457494 | 1.04 |
ENST00000521770.1 |
CLU |
clusterin |
| chr11_-_61647935 | 1.04 |
ENST00000531956.1 |
FADS3 |
fatty acid desaturase 3 |
| chr14_-_55658323 | 1.02 |
ENST00000554067.1 ENST00000247191.2 |
DLGAP5 |
discs, large (Drosophila) homolog-associated protein 5 |
| chrY_+_2709527 | 1.02 |
ENST00000250784.8 |
RPS4Y1 |
ribosomal protein S4, Y-linked 1 |
| chr17_-_76870222 | 1.00 |
ENST00000585421.1 |
TIMP2 |
TIMP metallopeptidase inhibitor 2 |
| chr4_-_159080806 | 1.00 |
ENST00000590648.1 |
FAM198B |
family with sequence similarity 198, member B |
| chr3_+_159557637 | 1.00 |
ENST00000445224.2 |
SCHIP1 |
schwannomin interacting protein 1 |
| chrY_+_22737678 | 0.99 |
ENST00000382772.3 |
EIF1AY |
eukaryotic translation initiation factor 1A, Y-linked |
| chr9_-_88715044 | 0.98 |
ENST00000388711.3 ENST00000466178.1 |
GOLM1 |
golgi membrane protein 1 |
| chr18_-_53253112 | 0.98 |
ENST00000568673.1 ENST00000562847.1 ENST00000568147.1 |
TCF4 |
transcription factor 4 |
| chr10_+_89420706 | 0.98 |
ENST00000427144.2 |
PAPSS2 |
3'-phosphoadenosine 5'-phosphosulfate synthase 2 |
| chr3_+_158787041 | 0.97 |
ENST00000471575.1 ENST00000476809.1 ENST00000485419.1 |
IQCJ-SCHIP1 |
IQCJ-SCHIP1 readthrough |
| chr9_+_116267536 | 0.94 |
ENST00000374136.1 |
RGS3 |
regulator of G-protein signaling 3 |
| chr1_-_85930823 | 0.93 |
ENST00000284031.8 ENST00000539042.1 |
DDAH1 |
dimethylarginine dimethylaminohydrolase 1 |
| chr8_+_38585704 | 0.93 |
ENST00000519416.1 ENST00000520615.1 |
TACC1 |
transforming, acidic coiled-coil containing protein 1 |
| chrX_+_102611373 | 0.92 |
ENST00000372661.3 ENST00000372656.3 |
WBP5 |
WW domain binding protein 5 |
| chr18_-_53253323 | 0.92 |
ENST00000540999.1 ENST00000563888.2 |
TCF4 |
transcription factor 4 |
| chr1_+_43766642 | 0.92 |
ENST00000372476.3 |
TIE1 |
tyrosine kinase with immunoglobulin-like and EGF-like domains 1 |
| chr3_-_33260707 | 0.88 |
ENST00000309558.3 |
SUSD5 |
sushi domain containing 5 |
| chr15_+_83776137 | 0.88 |
ENST00000322019.9 |
TM6SF1 |
transmembrane 6 superfamily member 1 |
| chrX_-_100914781 | 0.86 |
ENST00000431597.1 ENST00000458024.1 ENST00000413506.1 ENST00000440675.1 ENST00000328766.5 ENST00000356824.4 |
ARMCX2 |
armadillo repeat containing, X-linked 2 |
| chr20_+_45338126 | 0.85 |
ENST00000359271.2 |
SLC2A10 |
solute carrier family 2 (facilitated glucose transporter), member 10 |
| chr22_-_17680472 | 0.85 |
ENST00000330232.4 |
CECR1 |
cat eye syndrome chromosome region, candidate 1 |
| chr15_-_55657428 | 0.85 |
ENST00000568543.1 |
CCPG1 |
cell cycle progression 1 |
| chrX_+_66764375 | 0.85 |
ENST00000374690.3 |
AR |
androgen receptor |
| chr12_+_121647868 | 0.84 |
ENST00000359949.7 ENST00000541532.1 ENST00000543171.1 ENST00000538701.1 |
P2RX4 |
purinergic receptor P2X, ligand-gated ion channel, 4 |
| chr1_-_201342364 | 0.83 |
ENST00000236918.7 ENST00000367317.4 ENST00000367315.2 ENST00000360372.4 |
TNNT2 |
troponin T type 2 (cardiac) |
| chr4_-_186697044 | 0.82 |
ENST00000437304.2 |
SORBS2 |
sorbin and SH3 domain containing 2 |
| chr4_-_5021164 | 0.81 |
ENST00000506508.1 ENST00000509419.1 ENST00000307746.4 |
CYTL1 |
cytokine-like 1 |
| chr9_-_14313641 | 0.80 |
ENST00000380953.1 |
NFIB |
nuclear factor I/B |
| chr12_+_29376673 | 0.80 |
ENST00000547116.1 |
FAR2 |
fatty acyl CoA reductase 2 |
| chr12_+_29376592 | 0.79 |
ENST00000182377.4 |
FAR2 |
fatty acyl CoA reductase 2 |
| chr20_+_43160409 | 0.79 |
ENST00000372894.3 ENST00000372892.3 ENST00000372891.3 |
PKIG |
protein kinase (cAMP-dependent, catalytic) inhibitor gamma |
| chr5_-_39425222 | 0.79 |
ENST00000320816.6 |
DAB2 |
Dab, mitogen-responsive phosphoprotein, homolog 2 (Drosophila) |
| chr5_-_39425290 | 0.78 |
ENST00000545653.1 |
DAB2 |
Dab, mitogen-responsive phosphoprotein, homolog 2 (Drosophila) |
| chr3_-_114343039 | 0.78 |
ENST00000481632.1 |
ZBTB20 |
zinc finger and BTB domain containing 20 |
| chr3_+_171757346 | 0.77 |
ENST00000421757.1 ENST00000415807.2 ENST00000392699.1 |
FNDC3B |
fibronectin type III domain containing 3B |
| chr22_+_31002779 | 0.77 |
ENST00000215838.3 |
TCN2 |
transcobalamin II |
| chr1_+_145524891 | 0.76 |
ENST00000369304.3 |
ITGA10 |
integrin, alpha 10 |
| chr1_+_66458072 | 0.75 |
ENST00000423207.2 |
PDE4B |
phosphodiesterase 4B, cAMP-specific |
| chr19_-_48753104 | 0.74 |
ENST00000447740.2 |
CARD8 |
caspase recruitment domain family, member 8 |
| chrY_+_22737604 | 0.73 |
ENST00000361365.2 |
EIF1AY |
eukaryotic translation initiation factor 1A, Y-linked |
| chr2_+_201980827 | 0.72 |
ENST00000309955.3 ENST00000443227.1 ENST00000341222.6 ENST00000355558.4 ENST00000340870.5 ENST00000341582.6 |
CFLAR |
CASP8 and FADD-like apoptosis regulator |
| chr2_+_102928009 | 0.71 |
ENST00000404917.2 ENST00000447231.1 |
IL1RL1 |
interleukin 1 receptor-like 1 |
| chr9_-_14313893 | 0.71 |
ENST00000380921.3 ENST00000380959.3 |
NFIB |
nuclear factor I/B |
| chr21_-_40033618 | 0.71 |
ENST00000417133.2 ENST00000398910.1 ENST00000442448.1 |
ERG |
v-ets avian erythroblastosis virus E26 oncogene homolog |
| chr20_+_43160458 | 0.70 |
ENST00000372889.1 ENST00000372887.1 ENST00000372882.3 |
PKIG |
protein kinase (cAMP-dependent, catalytic) inhibitor gamma |
| chr13_-_33859819 | 0.70 |
ENST00000336934.5 |
STARD13 |
StAR-related lipid transfer (START) domain containing 13 |
| chr11_-_78052923 | 0.69 |
ENST00000340149.2 |
GAB2 |
GRB2-associated binding protein 2 |
| chr18_-_5544241 | 0.69 |
ENST00000341928.2 ENST00000540638.2 |
EPB41L3 |
erythrocyte membrane protein band 4.1-like 3 |
| chr1_-_114301755 | 0.68 |
ENST00000393357.2 ENST00000369596.2 ENST00000446739.1 |
PHTF1 |
putative homeodomain transcription factor 1 |
| chr15_+_96876340 | 0.68 |
ENST00000453270.2 |
NR2F2 |
nuclear receptor subfamily 2, group F, member 2 |
| chr7_+_39663485 | 0.67 |
ENST00000436179.1 |
RALA |
v-ral simian leukemia viral oncogene homolog A (ras related) |
| chr1_-_114301503 | 0.66 |
ENST00000447664.2 |
PHTF1 |
putative homeodomain transcription factor 1 |
| chr18_-_5540471 | 0.64 |
ENST00000581833.1 ENST00000544123.1 ENST00000342933.3 ENST00000400111.3 ENST00000585142.1 |
EPB41L3 |
erythrocyte membrane protein band 4.1-like 3 |
| chr4_-_186696425 | 0.64 |
ENST00000430503.1 ENST00000319454.6 ENST00000450341.1 |
SORBS2 |
sorbin and SH3 domain containing 2 |
| chr13_-_36920872 | 0.64 |
ENST00000451493.1 |
SPG20 |
spastic paraplegia 20 (Troyer syndrome) |
| chr7_+_134430212 | 0.64 |
ENST00000436461.2 |
CALD1 |
caldesmon 1 |
| chr1_+_21877753 | 0.64 |
ENST00000374832.1 |
ALPL |
alkaline phosphatase, liver/bone/kidney |
| chr11_-_33891362 | 0.63 |
ENST00000395833.3 |
LMO2 |
LIM domain only 2 (rhombotin-like 1) |
| chr4_+_157997273 | 0.63 |
ENST00000541722.1 ENST00000512619.1 |
GLRB |
glycine receptor, beta |
| chr6_+_121756809 | 0.63 |
ENST00000282561.3 |
GJA1 |
gap junction protein, alpha 1, 43kDa |
| chr1_+_101702417 | 0.63 |
ENST00000305352.6 |
S1PR1 |
sphingosine-1-phosphate receptor 1 |
| chr1_-_114301960 | 0.62 |
ENST00000369598.1 ENST00000369600.1 |
PHTF1 |
putative homeodomain transcription factor 1 |
| chr18_-_53070913 | 0.62 |
ENST00000568186.1 ENST00000564228.1 |
TCF4 |
transcription factor 4 |
| chr11_+_62104897 | 0.62 |
ENST00000415229.2 ENST00000535727.1 ENST00000301776.5 |
ASRGL1 |
asparaginase like 1 |
| chr9_-_16870704 | 0.62 |
ENST00000380672.4 ENST00000380667.2 ENST00000380666.2 ENST00000486514.1 |
BNC2 |
basonuclin 2 |
| chr12_+_29302119 | 0.61 |
ENST00000536681.3 |
FAR2 |
fatty acyl CoA reductase 2 |
| chr3_+_98482175 | 0.61 |
ENST00000485391.1 ENST00000492254.1 |
ST3GAL6 |
ST3 beta-galactoside alpha-2,3-sialyltransferase 6 |
| chr2_-_188312971 | 0.61 |
ENST00000410068.1 ENST00000447403.1 ENST00000410102.1 |
CALCRL |
calcitonin receptor-like |
| chr9_+_27109133 | 0.61 |
ENST00000519097.1 ENST00000380036.4 |
TEK |
TEK tyrosine kinase, endothelial |
| chr8_-_122653630 | 0.61 |
ENST00000303924.4 |
HAS2 |
hyaluronan synthase 2 |
| chr9_-_13279406 | 0.61 |
ENST00000546205.1 |
MPDZ |
multiple PDZ domain protein |
| chr3_-_81792780 | 0.60 |
ENST00000489715.1 |
GBE1 |
glucan (1,4-alpha-), branching enzyme 1 |
| chr6_+_153019069 | 0.59 |
ENST00000532295.1 |
MYCT1 |
myc target 1 |
| chr5_-_16738451 | 0.59 |
ENST00000274203.9 ENST00000515803.1 |
MYO10 |
myosin X |
| chr5_-_111091948 | 0.58 |
ENST00000447165.2 |
NREP |
neuronal regeneration related protein |
| chr14_-_27066960 | 0.58 |
ENST00000539517.2 |
NOVA1 |
neuro-oncological ventral antigen 1 |
| chr10_-_33623564 | 0.58 |
ENST00000374875.1 ENST00000374822.4 |
NRP1 |
neuropilin 1 |
| chr17_+_17082842 | 0.58 |
ENST00000579361.1 |
MPRIP |
myosin phosphatase Rho interacting protein |
| chr8_-_17555164 | 0.58 |
ENST00000297488.6 |
MTUS1 |
microtubule associated tumor suppressor 1 |
| chr7_+_134551583 | 0.57 |
ENST00000435928.1 |
CALD1 |
caldesmon 1 |
| chr1_-_155881156 | 0.56 |
ENST00000539040.1 ENST00000368323.3 |
RIT1 |
Ras-like without CAAX 1 |
| chr6_-_152958521 | 0.56 |
ENST00000367255.5 ENST00000265368.4 ENST00000448038.1 ENST00000341594.5 |
SYNE1 |
spectrin repeat containing, nuclear envelope 1 |
| chr7_-_95064264 | 0.56 |
ENST00000536183.1 ENST00000433091.2 ENST00000222572.3 |
PON2 |
paraoxonase 2 |
| chr6_+_153019023 | 0.56 |
ENST00000367245.5 ENST00000529453.1 |
MYCT1 |
myc target 1 |
| chr1_-_227505289 | 0.56 |
ENST00000366765.3 |
CDC42BPA |
CDC42 binding protein kinase alpha (DMPK-like) |
| chr11_-_63376013 | 0.56 |
ENST00000540943.1 |
PLA2G16 |
phospholipase A2, group XVI |
| chr1_-_57045228 | 0.55 |
ENST00000371250.3 |
PPAP2B |
phosphatidic acid phosphatase type 2B |
| chr9_-_16727978 | 0.55 |
ENST00000418777.1 ENST00000468187.2 |
BNC2 |
basonuclin 2 |
| chr21_-_28338732 | 0.54 |
ENST00000284987.5 |
ADAMTS5 |
ADAM metallopeptidase with thrombospondin type 1 motif, 5 |
| chr7_-_38670957 | 0.54 |
ENST00000325590.5 ENST00000428293.2 |
AMPH |
amphiphysin |
| chr14_+_104029278 | 0.54 |
ENST00000472726.2 ENST00000409074.2 ENST00000440963.1 ENST00000556253.2 ENST00000247618.4 |
RP11-73M18.2 APOPT1 |
Kinesin light chain 1 apoptogenic 1, mitochondrial |
| chr2_-_106013400 | 0.53 |
ENST00000409807.1 |
FHL2 |
four and a half LIM domains 2 |
| chr14_-_55658252 | 0.53 |
ENST00000395425.2 |
DLGAP5 |
discs, large (Drosophila) homolog-associated protein 5 |
| chr5_-_172756506 | 0.53 |
ENST00000265087.4 |
STC2 |
stanniocalcin 2 |
| chr16_+_3068393 | 0.52 |
ENST00000573001.1 |
TNFRSF12A |
tumor necrosis factor receptor superfamily, member 12A |
| chr7_-_143599207 | 0.52 |
ENST00000355951.2 ENST00000479870.1 ENST00000478172.1 |
FAM115A |
family with sequence similarity 115, member A |
| chr8_-_17579726 | 0.52 |
ENST00000381861.3 |
MTUS1 |
microtubule associated tumor suppressor 1 |
| chr3_+_148583043 | 0.52 |
ENST00000296046.3 |
CPA3 |
carboxypeptidase A3 (mast cell) |
| chr11_-_73693875 | 0.52 |
ENST00000536983.1 |
UCP2 |
uncoupling protein 2 (mitochondrial, proton carrier) |
| chr10_+_17272608 | 0.51 |
ENST00000421459.2 |
VIM |
vimentin |
| chr7_-_38671098 | 0.51 |
ENST00000356264.2 |
AMPH |
amphiphysin |
| chr1_+_223889285 | 0.51 |
ENST00000433674.2 |
CAPN2 |
calpain 2, (m/II) large subunit |
| chr9_-_14180778 | 0.51 |
ENST00000380924.1 ENST00000543693.1 |
NFIB |
nuclear factor I/B |
| chr5_+_82767583 | 0.51 |
ENST00000512590.2 ENST00000513960.1 ENST00000513984.1 ENST00000502527.2 |
VCAN |
versican |
| chr5_+_53751445 | 0.50 |
ENST00000302005.1 |
HSPB3 |
heat shock 27kDa protein 3 |
| chr14_-_75422280 | 0.50 |
ENST00000238607.6 ENST00000553716.1 |
PGF |
placental growth factor |
| chr7_-_47579188 | 0.50 |
ENST00000398879.1 ENST00000355730.3 ENST00000442536.2 ENST00000458317.2 |
TNS3 |
tensin 3 |
| chr5_+_82767487 | 0.49 |
ENST00000343200.5 ENST00000342785.4 |
VCAN |
versican |
| chr19_+_8483272 | 0.49 |
ENST00000602117.1 |
MARCH2 |
membrane-associated ring finger (C3HC4) 2, E3 ubiquitin protein ligase |
| chr4_+_41614909 | 0.49 |
ENST00000509454.1 ENST00000396595.3 ENST00000381753.4 |
LIMCH1 |
LIM and calponin homology domains 1 |
| chr7_+_55433131 | 0.48 |
ENST00000254770.2 |
LANCL2 |
LanC lantibiotic synthetase component C-like 2 (bacterial) |
| chr9_-_13175823 | 0.48 |
ENST00000545857.1 |
MPDZ |
multiple PDZ domain protein |
| chr18_-_25616519 | 0.48 |
ENST00000399380.3 |
CDH2 |
cadherin 2, type 1, N-cadherin (neuronal) |
| chr5_-_146833485 | 0.48 |
ENST00000398514.3 |
DPYSL3 |
dihydropyrimidinase-like 3 |
| chr15_+_63335899 | 0.48 |
ENST00000561266.1 |
TPM1 |
tropomyosin 1 (alpha) |
| chr1_-_101360331 | 0.48 |
ENST00000416479.1 ENST00000370113.3 |
EXTL2 |
exostosin-like glycosyltransferase 2 |
| chr15_-_77363441 | 0.48 |
ENST00000346495.2 ENST00000424443.3 ENST00000561277.1 |
TSPAN3 |
tetraspanin 3 |
| chr15_-_77363513 | 0.48 |
ENST00000267970.4 |
TSPAN3 |
tetraspanin 3 |
| chr2_+_201170703 | 0.47 |
ENST00000358677.5 |
SPATS2L |
spermatogenesis associated, serine-rich 2-like |
| chr15_-_77363375 | 0.47 |
ENST00000559494.1 |
TSPAN3 |
tetraspanin 3 |
| chr14_+_85996471 | 0.47 |
ENST00000330753.4 |
FLRT2 |
fibronectin leucine rich transmembrane protein 2 |
| chr4_+_26585538 | 0.47 |
ENST00000264866.4 |
TBC1D19 |
TBC1 domain family, member 19 |
| chr17_-_34313685 | 0.46 |
ENST00000435911.2 ENST00000586216.1 ENST00000394509.4 |
CCL14 |
chemokine (C-C motif) ligand 14 |
| chr1_+_246887349 | 0.46 |
ENST00000366510.3 |
SCCPDH |
saccharopine dehydrogenase (putative) |
| chr5_+_162932554 | 0.46 |
ENST00000321757.6 ENST00000421814.2 ENST00000518095.1 |
MAT2B |
methionine adenosyltransferase II, beta |
| chr9_-_13279563 | 0.45 |
ENST00000541718.1 |
MPDZ |
multiple PDZ domain protein |
| chr1_+_220863187 | 0.45 |
ENST00000294889.5 |
C1orf115 |
chromosome 1 open reading frame 115 |
| chr13_-_41240717 | 0.45 |
ENST00000379561.5 |
FOXO1 |
forkhead box O1 |
| chr16_+_30387141 | 0.45 |
ENST00000566955.1 |
MYLPF |
myosin light chain, phosphorylatable, fast skeletal muscle |
| chr13_+_102104980 | 0.45 |
ENST00000545560.2 |
ITGBL1 |
integrin, beta-like 1 (with EGF-like repeat domains) |
| chr3_-_16524357 | 0.45 |
ENST00000432519.1 |
RFTN1 |
raftlin, lipid raft linker 1 |
| chr10_+_115438920 | 0.45 |
ENST00000429617.1 ENST00000369331.4 |
CASP7 |
caspase 7, apoptosis-related cysteine peptidase |
| chr20_-_17539456 | 0.44 |
ENST00000544874.1 ENST00000377868.2 |
BFSP1 |
beaded filament structural protein 1, filensin |
| chr9_+_90112590 | 0.44 |
ENST00000472284.1 |
DAPK1 |
death-associated protein kinase 1 |
| chr2_-_99279928 | 0.44 |
ENST00000414521.2 |
MGAT4A |
mannosyl (alpha-1,3-)-glycoprotein beta-1,4-N-acetylglucosaminyltransferase, isozyme A |
| chr1_+_214776516 | 0.44 |
ENST00000366955.3 |
CENPF |
centromere protein F, 350/400kDa |
| chr2_+_102456277 | 0.44 |
ENST00000421882.1 |
MAP4K4 |
mitogen-activated protein kinase kinase kinase kinase 4 |
| chr22_-_29075853 | 0.44 |
ENST00000397906.2 |
TTC28 |
tetratricopeptide repeat domain 28 |
| chr14_+_100842735 | 0.44 |
ENST00000554998.1 ENST00000402312.3 ENST00000335290.6 ENST00000554175.1 |
WDR25 |
WD repeat domain 25 |
| chr2_+_48757278 | 0.43 |
ENST00000404752.1 ENST00000406226.1 |
STON1 |
stonin 1 |
| chr2_+_102508955 | 0.43 |
ENST00000414004.2 |
FLJ20373 |
FLJ20373 |
| chr2_+_46844290 | 0.42 |
ENST00000238892.3 |
CRIPT |
cysteine-rich PDZ-binding protein |
| chr12_+_16064106 | 0.42 |
ENST00000428559.2 |
DERA |
deoxyribose-phosphate aldolase (putative) |
| chr12_+_120972147 | 0.42 |
ENST00000325954.4 ENST00000542438.1 |
RNF10 |
ring finger protein 10 |
| chr15_+_63354769 | 0.42 |
ENST00000558910.1 |
TPM1 |
tropomyosin 1 (alpha) |
| chr4_-_156875003 | 0.42 |
ENST00000433477.3 |
CTSO |
cathepsin O |
| chrX_-_38186811 | 0.42 |
ENST00000318842.7 |
RPGR |
retinitis pigmentosa GTPase regulator |
| chr16_-_28621353 | 0.42 |
ENST00000567512.1 |
SULT1A1 |
sulfotransferase family, cytosolic, 1A, phenol-preferring, member 1 |
| chr9_+_92219919 | 0.42 |
ENST00000252506.6 ENST00000375769.1 |
GADD45G |
growth arrest and DNA-damage-inducible, gamma |
| chr12_+_10365404 | 0.41 |
ENST00000266458.5 ENST00000421801.2 ENST00000544284.1 ENST00000545047.1 ENST00000543602.1 ENST00000545887.1 |
GABARAPL1 |
GABA(A) receptor-associated protein like 1 |
| chr12_+_26348246 | 0.41 |
ENST00000422622.2 |
SSPN |
sarcospan |
| chr1_+_39796810 | 0.41 |
ENST00000289893.4 |
MACF1 |
microtubule-actin crosslinking factor 1 |
| chr14_+_85996507 | 0.41 |
ENST00000554746.1 |
FLRT2 |
fibronectin leucine rich transmembrane protein 2 |
| chr1_+_101185290 | 0.40 |
ENST00000370119.4 ENST00000347652.2 ENST00000294728.2 ENST00000370115.1 |
VCAM1 |
vascular cell adhesion molecule 1 |
| chr1_-_12677714 | 0.40 |
ENST00000376223.2 |
DHRS3 |
dehydrogenase/reductase (SDR family) member 3 |
| chr17_-_39968855 | 0.40 |
ENST00000355468.3 ENST00000590496.1 |
LEPREL4 |
leprecan-like 4 |
| chr9_+_35792151 | 0.40 |
ENST00000342694.2 |
NPR2 |
natriuretic peptide receptor B/guanylate cyclase B (atrionatriuretic peptide receptor B) |
| chr12_+_26274917 | 0.40 |
ENST00000538142.1 |
SSPN |
sarcospan |
| chr3_-_52569023 | 0.40 |
ENST00000307076.4 |
NT5DC2 |
5'-nucleotidase domain containing 2 |
| chr1_-_151965048 | 0.39 |
ENST00000368809.1 |
S100A10 |
S100 calcium binding protein A10 |
Gene Ontology Analysis
Gene overrepresentation in biological_process category:
| Log-likelihood per target | Total log-likelihood | Term | Description |
|---|---|---|---|
| 0.7 | 2.2 | GO:0010166 | wax biosynthetic process(GO:0010025) wax metabolic process(GO:0010166) |
| 0.5 | 5.9 | GO:0034356 | NAD biosynthesis via nicotinamide riboside salvage pathway(GO:0034356) |
| 0.5 | 1.4 | GO:0098923 | retrograde trans-synaptic signaling by soluble gas(GO:0098923) trans-synaptic signaling by soluble gas(GO:0099543) trans-synaptic signaling by trans-synaptic complex(GO:0099545) |
| 0.5 | 2.3 | GO:0032487 | regulation of Rap protein signal transduction(GO:0032487) |
| 0.5 | 1.4 | GO:0031394 | positive regulation of prostaglandin biosynthetic process(GO:0031394) negative regulation of phospholipase A2 activity(GO:1900138) positive regulation of unsaturated fatty acid biosynthetic process(GO:2001280) |
| 0.4 | 1.6 | GO:0035026 | leading edge cell differentiation(GO:0035026) |
| 0.4 | 1.9 | GO:0048539 | bone marrow development(GO:0048539) |
| 0.3 | 1.0 | GO:0097112 | gamma-aminobutyric acid receptor clustering(GO:0097112) |
| 0.3 | 0.9 | GO:0000412 | histone peptidyl-prolyl isomerization(GO:0000412) |
| 0.3 | 2.0 | GO:0021730 | trigeminal sensory nucleus development(GO:0021730) principal sensory nucleus of trigeminal nerve development(GO:0021740) negative regulation of epithelial cell proliferation involved in lung morphogenesis(GO:2000795) |
| 0.3 | 0.8 | GO:0060599 | lateral sprouting involved in mammary gland duct morphogenesis(GO:0060599) |
| 0.3 | 2.5 | GO:0035583 | sequestering of TGFbeta in extracellular matrix(GO:0035583) |
| 0.3 | 1.5 | GO:0007079 | mitotic chromosome movement towards spindle pole(GO:0007079) |
| 0.2 | 1.0 | GO:0000103 | sulfate assimilation(GO:0000103) |
| 0.2 | 1.7 | GO:0048050 | post-embryonic eye morphogenesis(GO:0048050) |
| 0.2 | 0.7 | GO:0043328 | protein targeting to vacuole involved in ubiquitin-dependent protein catabolic process via the multivesicular body sorting pathway(GO:0043328) |
| 0.2 | 1.0 | GO:0009956 | radial pattern formation(GO:0009956) |
| 0.2 | 0.6 | GO:0071529 | cementum mineralization(GO:0071529) |
| 0.2 | 0.6 | GO:0010645 | regulation of cell communication by chemical coupling(GO:0010645) positive regulation of cell communication by chemical coupling(GO:0010652) |
| 0.2 | 0.6 | GO:0003241 | growth involved in heart morphogenesis(GO:0003241) |
| 0.2 | 0.2 | GO:0003289 | septum primum development(GO:0003284) atrial septum primum morphogenesis(GO:0003289) |
| 0.2 | 0.8 | GO:0032972 | regulation of muscle filament sliding speed(GO:0032972) |
| 0.2 | 1.3 | GO:0002175 | protein localization to paranode region of axon(GO:0002175) |
| 0.2 | 1.8 | GO:0050713 | negative regulation of interleukin-1 beta secretion(GO:0050713) |
| 0.2 | 0.9 | GO:0021649 | vestibulocochlear nerve structural organization(GO:0021649) positive regulation of cytokine activity(GO:0060301) ganglion morphogenesis(GO:0061552) endothelial tip cell fate specification(GO:0097102) VEGF-activated neuropilin signaling pathway involved in axon guidance(GO:1902378) dorsal root ganglion morphogenesis(GO:1904835) otic placode development(GO:1905040) |
| 0.2 | 0.7 | GO:0006556 | S-adenosylmethionine biosynthetic process(GO:0006556) |
| 0.2 | 1.0 | GO:1902998 | macrophage proliferation(GO:0061517) microglial cell proliferation(GO:0061518) regulation of neuronal signal transduction(GO:1902847) positive regulation of neurofibrillary tangle assembly(GO:1902998) |
| 0.2 | 0.8 | GO:2001106 | regulation of Rho guanyl-nucleotide exchange factor activity(GO:2001106) |
| 0.2 | 0.5 | GO:2000809 | positive regulation of synaptic vesicle clustering(GO:2000809) |
| 0.2 | 0.6 | GO:0048698 | negative regulation of collateral sprouting in absence of injury(GO:0048698) |
| 0.2 | 0.9 | GO:0046121 | deoxyribonucleoside catabolic process(GO:0046121) |
| 0.2 | 0.9 | GO:0061343 | cell adhesion involved in heart morphogenesis(GO:0061343) |
| 0.2 | 3.1 | GO:0051901 | positive regulation of mitochondrial depolarization(GO:0051901) |
| 0.2 | 1.5 | GO:1903943 | regulation of hepatocyte apoptotic process(GO:1903943) negative regulation of hepatocyte apoptotic process(GO:1903944) |
| 0.2 | 0.8 | GO:0032227 | negative regulation of synaptic transmission, dopaminergic(GO:0032227) negative regulation of dopamine uptake involved in synaptic transmission(GO:0051585) norepinephrine uptake(GO:0051620) regulation of norepinephrine uptake(GO:0051621) negative regulation of norepinephrine uptake(GO:0051622) negative regulation of catecholamine uptake involved in synaptic transmission(GO:0051945) regulation of glutathione peroxidase activity(GO:1903282) positive regulation of glutathione peroxidase activity(GO:1903284) positive regulation of hydrogen peroxide catabolic process(GO:1903285) regulation of peroxidase activity(GO:2000468) positive regulation of peroxidase activity(GO:2000470) |
| 0.1 | 1.3 | GO:0090050 | positive regulation of cell migration involved in sprouting angiogenesis(GO:0090050) |
| 0.1 | 0.7 | GO:0097498 | endothelial tube lumen extension(GO:0097498) |
| 0.1 | 0.5 | GO:0034344 | type III interferon production(GO:0034343) regulation of type III interferon production(GO:0034344) |
| 0.1 | 0.4 | GO:1904924 | negative regulation of mitophagy in response to mitochondrial depolarization(GO:1904924) |
| 0.1 | 0.5 | GO:0045875 | negative regulation of sister chromatid cohesion(GO:0045875) |
| 0.1 | 0.4 | GO:1904647 | response to rotenone(GO:1904647) |
| 0.1 | 0.9 | GO:0048014 | Tie signaling pathway(GO:0048014) |
| 0.1 | 0.7 | GO:0038172 | interleukin-33-mediated signaling pathway(GO:0038172) |
| 0.1 | 0.6 | GO:1900127 | renal water absorption(GO:0070295) positive regulation of hyaluronan biosynthetic process(GO:1900127) |
| 0.1 | 0.1 | GO:0006828 | manganese ion transport(GO:0006828) |
| 0.1 | 0.1 | GO:0050653 | chondroitin sulfate proteoglycan biosynthetic process, polysaccharide chain biosynthetic process(GO:0050653) |
| 0.1 | 0.5 | GO:0019276 | UDP-N-acetylgalactosamine metabolic process(GO:0019276) |
| 0.1 | 0.7 | GO:0010724 | regulation of definitive erythrocyte differentiation(GO:0010724) |
| 0.1 | 0.7 | GO:0003199 | endocardial cushion to mesenchymal transition involved in heart valve formation(GO:0003199) |
| 0.1 | 0.9 | GO:0003065 | positive regulation of heart rate by epinephrine(GO:0003065) |
| 0.1 | 0.8 | GO:0098989 | NMDA selective glutamate receptor signaling pathway(GO:0098989) |
| 0.1 | 0.5 | GO:0071874 | cellular response to norepinephrine stimulus(GO:0071874) |
| 0.1 | 1.3 | GO:1900119 | positive regulation of execution phase of apoptosis(GO:1900119) |
| 0.1 | 0.5 | GO:0055014 | atrial cardiac muscle cell differentiation(GO:0055011) atrial cardiac muscle cell development(GO:0055014) |
| 0.1 | 0.3 | GO:0002025 | vasodilation by norepinephrine-epinephrine involved in regulation of systemic arterial blood pressure(GO:0002025) |
| 0.1 | 0.2 | GO:0014734 | skeletal muscle hypertrophy(GO:0014734) regulation of skeletal muscle hypertrophy(GO:1904204) |
| 0.1 | 0.4 | GO:1900194 | negative regulation of oocyte maturation(GO:1900194) |
| 0.1 | 0.8 | GO:0048386 | positive regulation of retinoic acid receptor signaling pathway(GO:0048386) |
| 0.1 | 0.3 | GO:1900158 | negative regulation of osteoclast proliferation(GO:0090291) negative regulation of bone mineralization involved in bone maturation(GO:1900158) |
| 0.1 | 0.3 | GO:1901535 | regulation of DNA demethylation(GO:1901535) negative regulation of DNA demethylation(GO:1901536) |
| 0.1 | 3.3 | GO:0003298 | physiological muscle hypertrophy(GO:0003298) physiological cardiac muscle hypertrophy(GO:0003301) cell growth involved in cardiac muscle cell development(GO:0061049) |
| 0.1 | 0.3 | GO:0021569 | rhombomere 3 development(GO:0021569) |
| 0.1 | 1.1 | GO:0042118 | endothelial cell activation(GO:0042118) |
| 0.1 | 0.5 | GO:0001692 | histamine metabolic process(GO:0001692) |
| 0.1 | 0.6 | GO:0032596 | protein transport within lipid bilayer(GO:0032594) protein transport into membrane raft(GO:0032596) |
| 0.1 | 0.5 | GO:1902617 | response to fluoride(GO:1902617) |
| 0.1 | 0.1 | GO:1902957 | negative regulation of mitochondrial electron transport, NADH to ubiquinone(GO:1902957) |
| 0.1 | 0.5 | GO:0035407 | histone H3-T11 phosphorylation(GO:0035407) |
| 0.1 | 0.2 | GO:0010701 | positive regulation of norepinephrine secretion(GO:0010701) |
| 0.1 | 0.4 | GO:0021564 | vagus nerve development(GO:0021564) |
| 0.1 | 0.8 | GO:0015889 | cobalamin transport(GO:0015889) |
| 0.1 | 1.1 | GO:0046325 | negative regulation of glucose import(GO:0046325) |
| 0.1 | 0.3 | GO:2001206 | positive regulation of osteoclast development(GO:2001206) |
| 0.1 | 0.1 | GO:0070213 | protein auto-ADP-ribosylation(GO:0070213) |
| 0.1 | 0.1 | GO:1905244 | regulation of modification of synaptic structure(GO:1905244) |
| 0.1 | 0.5 | GO:0060754 | positive regulation of mast cell chemotaxis(GO:0060754) |
| 0.1 | 0.3 | GO:0001519 | peptide amidation(GO:0001519) protein amidation(GO:0018032) peptide modification(GO:0031179) |
| 0.1 | 0.3 | GO:0071802 | negative regulation of podosome assembly(GO:0071802) |
| 0.1 | 0.6 | GO:0006880 | intracellular sequestering of iron ion(GO:0006880) sequestering of iron ion(GO:0097577) |
| 0.1 | 1.3 | GO:2000480 | negative regulation of cAMP-dependent protein kinase activity(GO:2000480) |
| 0.1 | 0.2 | GO:0003099 | positive regulation of the force of heart contraction by chemical signal(GO:0003099) |
| 0.1 | 0.3 | GO:0038195 | urokinase plasminogen activator signaling pathway(GO:0038195) |
| 0.1 | 0.4 | GO:0018243 | protein O-linked glycosylation via threonine(GO:0018243) |
| 0.1 | 0.6 | GO:0006528 | asparagine metabolic process(GO:0006528) |
| 0.1 | 0.2 | GO:0032804 | negative regulation of low-density lipoprotein particle receptor catabolic process(GO:0032804) |
| 0.1 | 0.3 | GO:0006710 | androgen catabolic process(GO:0006710) |
| 0.1 | 0.2 | GO:0061055 | myotome development(GO:0061055) |
| 0.1 | 0.3 | GO:1904491 | protein localization to ciliary transition zone(GO:1904491) |
| 0.1 | 0.7 | GO:0045329 | carnitine biosynthetic process(GO:0045329) |
| 0.1 | 0.5 | GO:0046485 | ether lipid metabolic process(GO:0046485) |
| 0.1 | 0.5 | GO:0015760 | hexose phosphate transport(GO:0015712) glucose-6-phosphate transport(GO:0015760) |
| 0.1 | 1.2 | GO:0050872 | white fat cell differentiation(GO:0050872) |
| 0.1 | 0.4 | GO:0015862 | uridine transport(GO:0015862) |
| 0.1 | 1.1 | GO:0040015 | negative regulation of multicellular organism growth(GO:0040015) |
| 0.1 | 1.9 | GO:0050650 | chondroitin sulfate proteoglycan biosynthetic process(GO:0050650) |
| 0.1 | 0.1 | GO:0001574 | ganglioside biosynthetic process(GO:0001574) |
| 0.1 | 0.4 | GO:1990822 | basic amino acid transmembrane transport(GO:1990822) |
| 0.1 | 0.2 | GO:0060279 | regulation of ovulation(GO:0060278) positive regulation of ovulation(GO:0060279) |
| 0.1 | 0.3 | GO:0019065 | receptor-mediated endocytosis of virus by host cell(GO:0019065) endocytosis involved in viral entry into host cell(GO:0075509) |
| 0.1 | 0.4 | GO:1902897 | regulation of postsynaptic density protein 95 clustering(GO:1902897) |
| 0.1 | 0.9 | GO:0043116 | negative regulation of vascular permeability(GO:0043116) |
| 0.1 | 0.4 | GO:0001765 | membrane raft assembly(GO:0001765) |
| 0.1 | 0.5 | GO:0006931 | substrate-dependent cell migration, cell attachment to substrate(GO:0006931) |
| 0.1 | 0.5 | GO:0072734 | response to staurosporine(GO:0072733) cellular response to staurosporine(GO:0072734) |
| 0.1 | 1.6 | GO:0050427 | purine ribonucleoside bisphosphate metabolic process(GO:0034035) 3'-phosphoadenosine 5'-phosphosulfate metabolic process(GO:0050427) |
| 0.1 | 0.7 | GO:0090292 | nuclear matrix anchoring at nuclear membrane(GO:0090292) |
| 0.1 | 0.3 | GO:0045918 | negative regulation of cytolysis(GO:0045918) |
| 0.1 | 0.2 | GO:0007525 | somatic muscle development(GO:0007525) |
| 0.1 | 0.2 | GO:0051835 | positive regulation of synapse structural plasticity(GO:0051835) |
| 0.1 | 0.7 | GO:0006451 | selenocysteine incorporation(GO:0001514) translational readthrough(GO:0006451) |
| 0.1 | 0.2 | GO:0018103 | protein C-linked glycosylation(GO:0018103) peptidyl-tryptophan modification(GO:0018211) protein C-linked glycosylation via tryptophan(GO:0018317) protein C-linked glycosylation via 2'-alpha-mannosyl-L-tryptophan(GO:0018406) |
| 0.1 | 0.4 | GO:0070294 | renal sodium ion absorption(GO:0070294) |
| 0.1 | 0.2 | GO:0035752 | lysosomal lumen pH elevation(GO:0035752) |
| 0.1 | 0.4 | GO:1901419 | regulation of response to alcohol(GO:1901419) |
| 0.1 | 0.2 | GO:0060392 | negative regulation of SMAD protein import into nucleus(GO:0060392) |
| 0.1 | 0.3 | GO:0021814 | cell motility involved in cerebral cortex radial glia guided migration(GO:0021814) |
| 0.1 | 0.8 | GO:0039532 | negative regulation of viral-induced cytoplasmic pattern recognition receptor signaling pathway(GO:0039532) |
| 0.1 | 0.2 | GO:0016925 | protein sumoylation(GO:0016925) |
| 0.1 | 0.1 | GO:0017196 | N-terminal peptidyl-methionine acetylation(GO:0017196) |
| 0.1 | 0.2 | GO:0090135 | actin filament branching(GO:0090135) protein localization to cell leading edge(GO:1902463) |
| 0.1 | 0.3 | GO:0044858 | plasma membrane raft distribution(GO:0044855) plasma membrane raft localization(GO:0044856) plasma membrane raft polarization(GO:0044858) regulation of plasma membrane raft polarization(GO:1903906) |
| 0.1 | 0.2 | GO:0042357 | thiamine diphosphate metabolic process(GO:0042357) |
| 0.1 | 2.3 | GO:0000188 | inactivation of MAPK activity(GO:0000188) |
| 0.1 | 0.7 | GO:0051382 | kinetochore assembly(GO:0051382) |
| 0.1 | 0.2 | GO:1902462 | regulation of mesenchymal stem cell proliferation(GO:1902460) positive regulation of mesenchymal stem cell proliferation(GO:1902462) |
| 0.1 | 0.2 | GO:1901509 | regulation of endothelial tube morphogenesis(GO:1901509) |
| 0.1 | 0.2 | GO:0034127 | regulation of MyD88-independent toll-like receptor signaling pathway(GO:0034127) negative regulation of MyD88-independent toll-like receptor signaling pathway(GO:0034128) |
| 0.1 | 0.4 | GO:0010626 | regulation of Schwann cell proliferation(GO:0010624) negative regulation of Schwann cell proliferation(GO:0010626) |
| 0.1 | 0.2 | GO:0035964 | COPI-coated vesicle budding(GO:0035964) Golgi transport vesicle coating(GO:0048200) COPI coating of Golgi vesicle(GO:0048205) |
| 0.1 | 0.5 | GO:0061179 | negative regulation of insulin secretion involved in cellular response to glucose stimulus(GO:0061179) |
| 0.1 | 0.3 | GO:0006436 | tryptophanyl-tRNA aminoacylation(GO:0006436) |
| 0.1 | 0.4 | GO:0098735 | positive regulation of the force of heart contraction(GO:0098735) |
| 0.0 | 0.1 | GO:1900157 | iron assimilation(GO:0033212) iron assimilation by chelation and transport(GO:0033214) regulation of bone mineralization involved in bone maturation(GO:1900157) positive regulation of bone mineralization involved in bone maturation(GO:1900159) positive regulation of bone development(GO:1903012) negative regulation of tumor necrosis factor (ligand) superfamily member 11 production(GO:2000308) |
| 0.0 | 1.1 | GO:0043586 | tongue development(GO:0043586) |
| 0.0 | 0.3 | GO:0051012 | microtubule sliding(GO:0051012) |
| 0.0 | 0.7 | GO:0070307 | lens fiber cell development(GO:0070307) |
| 0.0 | 1.4 | GO:0051491 | positive regulation of filopodium assembly(GO:0051491) |
| 0.0 | 0.5 | GO:0070129 | regulation of mitochondrial translation(GO:0070129) |
| 0.0 | 0.2 | GO:2000676 | positive regulation of type B pancreatic cell apoptotic process(GO:2000676) |
| 0.0 | 0.2 | GO:0060613 | fat pad development(GO:0060613) |
| 0.0 | 0.2 | GO:0097084 | vascular smooth muscle cell development(GO:0097084) |
| 0.0 | 0.3 | GO:0061740 | protein targeting to lysosome involved in chaperone-mediated autophagy(GO:0061740) |
| 0.0 | 0.2 | GO:0042713 | sperm ejaculation(GO:0042713) |
| 0.0 | 0.3 | GO:0045079 | negative regulation of chemokine biosynthetic process(GO:0045079) |
| 0.0 | 2.2 | GO:0032728 | positive regulation of interferon-beta production(GO:0032728) |
| 0.0 | 0.1 | GO:0032289 | central nervous system myelin formation(GO:0032289) |
| 0.0 | 0.1 | GO:0001897 | cytolysis by symbiont of host cells(GO:0001897) hemolysis by symbiont of host erythrocytes(GO:0019836) hemolysis in other organism(GO:0044179) hemolysis in other organism involved in symbiotic interaction(GO:0052331) |
| 0.0 | 0.1 | GO:0016322 | neuron remodeling(GO:0016322) |
| 0.0 | 0.2 | GO:0021691 | cerebellar Purkinje cell layer maturation(GO:0021691) |
| 0.0 | 0.4 | GO:0050689 | negative regulation of defense response to virus by host(GO:0050689) |
| 0.0 | 0.4 | GO:0036066 | protein O-linked fucosylation(GO:0036066) |
| 0.0 | 0.1 | GO:0001923 | B-1 B cell differentiation(GO:0001923) |
| 0.0 | 0.4 | GO:0034285 | response to sucrose(GO:0009744) response to disaccharide(GO:0034285) |
| 0.0 | 0.1 | GO:0044208 | 'de novo' AMP biosynthetic process(GO:0044208) |
| 0.0 | 0.3 | GO:1904550 | chemotaxis to arachidonic acid(GO:0034670) response to arachidonic acid(GO:1904550) |
| 0.0 | 0.1 | GO:0038193 | thromboxane A2 signaling pathway(GO:0038193) |
| 0.0 | 0.2 | GO:2001153 | regulation of renal water transport(GO:2001151) positive regulation of renal water transport(GO:2001153) |
| 0.0 | 0.8 | GO:0090110 | cargo loading into COPII-coated vesicle(GO:0090110) |
| 0.0 | 0.2 | GO:0001306 | age-dependent response to oxidative stress(GO:0001306) age-dependent response to reactive oxygen species(GO:0001315) regulation of systemic arterial blood pressure by acetylcholine(GO:0003068) vasodilation by acetylcholine involved in regulation of systemic arterial blood pressure(GO:0003069) regulation of systemic arterial blood pressure by neurotransmitter(GO:0003070) age-dependent general metabolic decline(GO:0007571) |
| 0.0 | 1.2 | GO:0000042 | protein targeting to Golgi(GO:0000042) |
| 0.0 | 0.7 | GO:0001780 | neutrophil homeostasis(GO:0001780) |
| 0.0 | 0.1 | GO:0006348 | chromatin silencing at telomere(GO:0006348) |
| 0.0 | 0.2 | GO:0009137 | purine nucleoside diphosphate catabolic process(GO:0009137) purine ribonucleoside diphosphate catabolic process(GO:0009181) |
| 0.0 | 0.1 | GO:0007497 | posterior midgut development(GO:0007497) positive regulation of penile erection(GO:0060406) endothelin receptor signaling pathway(GO:0086100) |
| 0.0 | 0.4 | GO:0051451 | myoblast migration(GO:0051451) |
| 0.0 | 1.3 | GO:0071377 | cellular response to glucagon stimulus(GO:0071377) |
| 0.0 | 0.5 | GO:0034393 | positive regulation of smooth muscle cell apoptotic process(GO:0034393) |
| 0.0 | 0.2 | GO:0002318 | myeloid progenitor cell differentiation(GO:0002318) |
| 0.0 | 0.3 | GO:0032057 | negative regulation of translational initiation in response to stress(GO:0032057) |
| 0.0 | 0.8 | GO:0000185 | activation of MAPKKK activity(GO:0000185) |
| 0.0 | 1.0 | GO:0097503 | sialylation(GO:0097503) |
| 0.0 | 1.0 | GO:0008045 | motor neuron axon guidance(GO:0008045) |
| 0.0 | 0.4 | GO:0060391 | positive regulation of SMAD protein import into nucleus(GO:0060391) |
| 0.0 | 0.1 | GO:0030242 | pexophagy(GO:0030242) |
| 0.0 | 0.1 | GO:1903487 | regulation of lactation(GO:1903487) |
| 0.0 | 0.2 | GO:0007093 | mitotic cell cycle checkpoint(GO:0007093) |
| 0.0 | 8.6 | GO:0065004 | protein-DNA complex assembly(GO:0065004) |
| 0.0 | 1.0 | GO:0051894 | positive regulation of focal adhesion assembly(GO:0051894) |
| 0.0 | 0.1 | GO:0035880 | embryonic nail plate morphogenesis(GO:0035880) |
| 0.0 | 0.3 | GO:0016098 | monoterpenoid metabolic process(GO:0016098) |
| 0.0 | 0.1 | GO:1902856 | negative regulation of nonmotile primary cilium assembly(GO:1902856) |
| 0.0 | 0.1 | GO:0010936 | negative regulation of macrophage cytokine production(GO:0010936) |
| 0.0 | 0.2 | GO:0018095 | protein polyglutamylation(GO:0018095) |
| 0.0 | 0.2 | GO:0043652 | engulfment of apoptotic cell(GO:0043652) |
| 0.0 | 6.1 | GO:0002223 | stimulatory C-type lectin receptor signaling pathway(GO:0002223) |
| 0.0 | 0.1 | GO:2001162 | histone H3-K79 methylation(GO:0034729) regulation of histone H3-K79 methylation(GO:2001160) positive regulation of histone H3-K79 methylation(GO:2001162) |
| 0.0 | 0.2 | GO:0048254 | snoRNA localization(GO:0048254) |
| 0.0 | 0.1 | GO:0001971 | negative regulation of activation of membrane attack complex(GO:0001971) |
| 0.0 | 0.1 | GO:0051106 | positive regulation of DNA ligation(GO:0051106) |
| 0.0 | 0.2 | GO:2000158 | positive regulation of ubiquitin-specific protease activity(GO:2000158) |
| 0.0 | 0.2 | GO:0006311 | meiotic gene conversion(GO:0006311) |
| 0.0 | 0.1 | GO:1900039 | positive regulation of cellular response to hypoxia(GO:1900039) |
| 0.0 | 0.3 | GO:0035860 | glial cell-derived neurotrophic factor receptor signaling pathway(GO:0035860) |
| 0.0 | 0.2 | GO:0006651 | diacylglycerol biosynthetic process(GO:0006651) |
| 0.0 | 0.4 | GO:0001778 | plasma membrane repair(GO:0001778) |
| 0.0 | 0.3 | GO:0034587 | piRNA metabolic process(GO:0034587) |
| 0.0 | 0.5 | GO:0032802 | low-density lipoprotein particle receptor catabolic process(GO:0032802) |
| 0.0 | 0.1 | GO:0032511 | late endosome to vacuole transport via multivesicular body sorting pathway(GO:0032511) |
| 0.0 | 0.4 | GO:0031032 | actomyosin structure organization(GO:0031032) |
| 0.0 | 0.3 | GO:0051315 | establishment or maintenance of microtubule cytoskeleton polarity(GO:0030951) attachment of mitotic spindle microtubules to kinetochore(GO:0051315) |
| 0.0 | 0.2 | GO:0035934 | corticosterone secretion(GO:0035934) regulation of corticosterone secretion(GO:2000852) |
| 0.0 | 0.1 | GO:1901620 | regulation of smoothened signaling pathway involved in dorsal/ventral neural tube patterning(GO:1901620) negative regulation of smoothened signaling pathway involved in dorsal/ventral neural tube patterning(GO:1901621) |
| 0.0 | 4.6 | GO:0006614 | SRP-dependent cotranslational protein targeting to membrane(GO:0006614) |
| 0.0 | 0.2 | GO:0046208 | spermine catabolic process(GO:0046208) |
| 0.0 | 0.6 | GO:0097067 | cellular response to thyroid hormone stimulus(GO:0097067) |
| 0.0 | 0.4 | GO:0060044 | negative regulation of cardiac muscle tissue growth(GO:0055022) negative regulation of cardiac muscle cell proliferation(GO:0060044) negative regulation of heart growth(GO:0061117) |
| 0.0 | 0.1 | GO:0009304 | tRNA transcription(GO:0009304) 5S class rRNA transcription from RNA polymerase III type 1 promoter(GO:0042791) tRNA transcription from RNA polymerase III promoter(GO:0042797) |
| 0.0 | 0.1 | GO:0036363 | transforming growth factor beta activation(GO:0036363) |
| 0.0 | 0.4 | GO:0006995 | cellular response to nitrogen starvation(GO:0006995) cellular response to nitrogen levels(GO:0043562) |
| 0.0 | 0.9 | GO:0043001 | Golgi to plasma membrane protein transport(GO:0043001) |
| 0.0 | 0.5 | GO:0019372 | lipoxygenase pathway(GO:0019372) |
| 0.0 | 0.1 | GO:0010909 | regulation of heparan sulfate proteoglycan biosynthetic process(GO:0010908) positive regulation of heparan sulfate proteoglycan biosynthetic process(GO:0010909) canonical Wnt signaling pathway involved in positive regulation of epithelial to mesenchymal transition(GO:0044334) positive regulation of proteoglycan biosynthetic process(GO:1902730) |
| 0.0 | 0.1 | GO:0018874 | benzoate metabolic process(GO:0018874) butyrate metabolic process(GO:0019605) |
| 0.0 | 0.2 | GO:2000304 | positive regulation of sphingolipid biosynthetic process(GO:0090154) positive regulation of ceramide biosynthetic process(GO:2000304) |
| 0.0 | 0.2 | GO:2000042 | negative regulation of double-strand break repair via homologous recombination(GO:2000042) |
| 0.0 | 0.1 | GO:0019060 | intracellular transport of viral protein in host cell(GO:0019060) symbiont intracellular protein transport in host(GO:0030581) intracellular protein transport in other organism involved in symbiotic interaction(GO:0051708) |
| 0.0 | 0.2 | GO:0006689 | ganglioside catabolic process(GO:0006689) |
| 0.0 | 0.4 | GO:0006893 | Golgi to plasma membrane transport(GO:0006893) |
| 0.0 | 0.0 | GO:0099590 | neurotransmitter receptor internalization(GO:0099590) |
| 0.0 | 0.1 | GO:0009189 | dTTP biosynthetic process(GO:0006235) deoxyribonucleoside diphosphate metabolic process(GO:0009186) deoxyribonucleoside diphosphate biosynthetic process(GO:0009189) pyrimidine deoxyribonucleoside triphosphate biosynthetic process(GO:0009212) |
| 0.0 | 0.4 | GO:0002003 | angiotensin maturation(GO:0002003) |
| 0.0 | 0.3 | GO:0046007 | negative regulation of activated T cell proliferation(GO:0046007) |
| 0.0 | 0.2 | GO:0048227 | plasma membrane to endosome transport(GO:0048227) |
| 0.0 | 0.1 | GO:0060335 | positive regulation of response to interferon-gamma(GO:0060332) positive regulation of interferon-gamma-mediated signaling pathway(GO:0060335) |
| 0.0 | 0.3 | GO:0000028 | ribosomal small subunit assembly(GO:0000028) |
| 0.0 | 0.1 | GO:0006477 | protein sulfation(GO:0006477) |
| 0.0 | 0.2 | GO:2000124 | regulation of endocannabinoid signaling pathway(GO:2000124) |
| 0.0 | 0.6 | GO:0035584 | calcium-mediated signaling using intracellular calcium source(GO:0035584) |
| 0.0 | 0.1 | GO:0090308 | regulation of methylation-dependent chromatin silencing(GO:0090308) |
| 0.0 | 0.2 | GO:0034501 | protein localization to kinetochore(GO:0034501) |
| 0.0 | 0.1 | GO:0045897 | positive regulation of transcription during mitosis(GO:0045897) |
| 0.0 | 0.1 | GO:0002018 | renin-angiotensin regulation of aldosterone production(GO:0002018) |
| 0.0 | 0.0 | GO:0072019 | proximal convoluted tubule development(GO:0072019) metanephric proximal convoluted tubule development(GO:0072229) |
| 0.0 | 0.0 | GO:0002361 | CD4-positive, CD25-positive, alpha-beta regulatory T cell differentiation(GO:0002361) |
| 0.0 | 0.2 | GO:0046784 | viral mRNA export from host cell nucleus(GO:0046784) |
| 0.0 | 0.1 | GO:0018094 | protein polyglycylation(GO:0018094) |
| 0.0 | 0.3 | GO:1900025 | negative regulation of substrate adhesion-dependent cell spreading(GO:1900025) |
| 0.0 | 0.4 | GO:0007250 | activation of NF-kappaB-inducing kinase activity(GO:0007250) |
| 0.0 | 0.2 | GO:1904646 | cellular response to beta-amyloid(GO:1904646) |
| 0.0 | 0.0 | GO:0061739 | protein lipidation involved in autophagosome assembly(GO:0061739) |
| 0.0 | 0.1 | GO:0016241 | regulation of macroautophagy(GO:0016241) |
| 0.0 | 0.2 | GO:0033299 | secretion of lysosomal enzymes(GO:0033299) |
| 0.0 | 0.2 | GO:0036159 | inner dynein arm assembly(GO:0036159) |
| 0.0 | 0.1 | GO:0090315 | negative regulation of protein targeting to membrane(GO:0090315) |
| 0.0 | 0.1 | GO:0044458 | motile cilium assembly(GO:0044458) |
| 0.0 | 0.1 | GO:0071279 | cellular response to cobalt ion(GO:0071279) |
| 0.0 | 0.4 | GO:0071447 | cellular response to hydroperoxide(GO:0071447) |
| 0.0 | 0.1 | GO:0032483 | regulation of Rab protein signal transduction(GO:0032483) |
| 0.0 | 0.1 | GO:0002643 | regulation of tolerance induction(GO:0002643) |
| 0.0 | 0.1 | GO:0050668 | cellular response to phosphate starvation(GO:0016036) positive regulation of sulfur amino acid metabolic process(GO:0031337) positive regulation of homocysteine metabolic process(GO:0050668) |
| 0.0 | 0.1 | GO:0060010 | Sertoli cell fate commitment(GO:0060010) |
| 0.0 | 0.2 | GO:0018026 | peptidyl-lysine monomethylation(GO:0018026) |
| 0.0 | 0.1 | GO:0099566 | regulation of postsynaptic cytosolic calcium ion concentration(GO:0099566) |
| 0.0 | 0.8 | GO:0000413 | protein peptidyl-prolyl isomerization(GO:0000413) |
| 0.0 | 0.2 | GO:0000301 | retrograde transport, vesicle recycling within Golgi(GO:0000301) |
| 0.0 | 0.1 | GO:0007042 | lysosomal lumen acidification(GO:0007042) |
| 0.0 | 0.2 | GO:0000715 | nucleotide-excision repair, DNA damage recognition(GO:0000715) |
| 0.0 | 0.4 | GO:0006491 | N-glycan processing(GO:0006491) |
| 0.0 | 0.8 | GO:0045026 | plasma membrane fusion(GO:0045026) |
| 0.0 | 0.1 | GO:1904430 | negative regulation of t-circle formation(GO:1904430) |
| 0.0 | 0.2 | GO:0007175 | negative regulation of epidermal growth factor-activated receptor activity(GO:0007175) |
| 0.0 | 0.2 | GO:0042572 | retinol metabolic process(GO:0042572) |
| 0.0 | 0.1 | GO:0043555 | regulation of translation in response to stress(GO:0043555) |
| 0.0 | 0.1 | GO:0034196 | acylglycerol transport(GO:0034196) triglyceride transport(GO:0034197) |
| 0.0 | 0.1 | GO:0043323 | regulation of natural killer cell degranulation(GO:0043321) positive regulation of natural killer cell degranulation(GO:0043323) |
| 0.0 | 0.3 | GO:2000114 | regulation of establishment of cell polarity(GO:2000114) |
| 0.0 | 0.1 | GO:0032621 | interleukin-18 production(GO:0032621) regulation of interleukin-18 production(GO:0032661) |
| 0.0 | 0.2 | GO:0051988 | regulation of attachment of spindle microtubules to kinetochore(GO:0051988) |
| 0.0 | 0.1 | GO:0003183 | mitral valve development(GO:0003174) mitral valve morphogenesis(GO:0003183) |
| 0.0 | 0.3 | GO:0045199 | maintenance of apical/basal cell polarity(GO:0035090) maintenance of epithelial cell apical/basal polarity(GO:0045199) |
| 0.0 | 0.2 | GO:0007567 | parturition(GO:0007567) |
| 0.0 | 0.1 | GO:0080009 | mRNA methylation(GO:0080009) |
| 0.0 | 0.3 | GO:0034975 | protein folding in endoplasmic reticulum(GO:0034975) |
| 0.0 | 0.1 | GO:0045324 | late endosome to vacuole transport(GO:0045324) |
| 0.0 | 0.0 | GO:0045631 | regulation of auditory receptor cell differentiation(GO:0045607) regulation of mechanoreceptor differentiation(GO:0045631) regulation of inner ear receptor cell differentiation(GO:2000980) |
| 0.0 | 0.1 | GO:0019732 | antifungal humoral response(GO:0019732) |
| 0.0 | 0.0 | GO:0021766 | hippocampus development(GO:0021766) |
| 0.0 | 0.1 | GO:1990403 | embryonic brain development(GO:1990403) |
| 0.0 | 0.2 | GO:0045040 | protein import into mitochondrial outer membrane(GO:0045040) |
| 0.0 | 0.1 | GO:0002326 | B cell lineage commitment(GO:0002326) immunoglobulin V(D)J recombination(GO:0033152) |
| 0.0 | 0.1 | GO:0042360 | vitamin E metabolic process(GO:0042360) |
| 0.0 | 0.1 | GO:0051189 | Mo-molybdopterin cofactor biosynthetic process(GO:0006777) Mo-molybdopterin cofactor metabolic process(GO:0019720) molybdopterin cofactor biosynthetic process(GO:0032324) molybdopterin cofactor metabolic process(GO:0043545) prosthetic group metabolic process(GO:0051189) |
| 0.0 | 0.3 | GO:0006895 | Golgi to endosome transport(GO:0006895) |
| 0.0 | 0.1 | GO:0031087 | deadenylation-independent decapping of nuclear-transcribed mRNA(GO:0031087) |
| 0.0 | 0.1 | GO:0046116 | queuosine biosynthetic process(GO:0008616) queuosine metabolic process(GO:0046116) |
| 0.0 | 0.2 | GO:0060746 | maternal behavior(GO:0042711) parental behavior(GO:0060746) |
| 0.0 | 0.1 | GO:0010836 | negative regulation of protein ADP-ribosylation(GO:0010836) |
| 0.0 | 0.1 | GO:0032071 | regulation of endodeoxyribonuclease activity(GO:0032071) |
| 0.0 | 0.0 | GO:0060370 | susceptibility to T cell mediated cytotoxicity(GO:0060370) |
| 0.0 | 0.1 | GO:0030579 | ubiquitin-dependent SMAD protein catabolic process(GO:0030579) |
| 0.0 | 0.1 | GO:0032489 | regulation of Cdc42 protein signal transduction(GO:0032489) |
| 0.0 | 0.1 | GO:0042428 | serotonin metabolic process(GO:0042428) |
| 0.0 | 0.1 | GO:0045065 | cytotoxic T cell differentiation(GO:0045065) |
| 0.0 | 0.2 | GO:0061684 | chaperone-mediated autophagy(GO:0061684) |
| 0.0 | 0.1 | GO:0046013 | regulation of T cell homeostatic proliferation(GO:0046013) |
| 0.0 | 0.2 | GO:0006261 | DNA-dependent DNA replication(GO:0006261) |
| 0.0 | 0.0 | GO:1990022 | RNA polymerase II complex import to nucleus(GO:0044376) RNA polymerase III complex localization to nucleus(GO:1990022) |
| 0.0 | 2.0 | GO:0002576 | platelet degranulation(GO:0002576) |
| 0.0 | 0.1 | GO:2000342 | negative regulation of chemokine (C-X-C motif) ligand 2 production(GO:2000342) |
| 0.0 | 0.3 | GO:0043403 | skeletal muscle tissue regeneration(GO:0043403) |
| 0.0 | 0.1 | GO:0061083 | regulation of protein refolding(GO:0061083) negative regulation of protein refolding(GO:0061084) negative regulation of protein folding(GO:1903333) |
| 0.0 | 0.0 | GO:0045332 | lipid translocation(GO:0034204) phospholipid translocation(GO:0045332) |
| 0.0 | 0.4 | GO:0042246 | tissue regeneration(GO:0042246) |
| 0.0 | 0.1 | GO:0009256 | 10-formyltetrahydrofolate metabolic process(GO:0009256) |
| 0.0 | 0.1 | GO:0046600 | negative regulation of centriole replication(GO:0046600) |
| 0.0 | 0.1 | GO:0036414 | protein citrullination(GO:0018101) histone citrullination(GO:0036414) |
| 0.0 | 0.1 | GO:0042796 | snRNA transcription from RNA polymerase III promoter(GO:0042796) |
| 0.0 | 0.2 | GO:0043243 | positive regulation of protein complex disassembly(GO:0043243) |
| 0.0 | 0.1 | GO:1904936 | cerebral cortex GABAergic interneuron migration(GO:0021853) interneuron migration(GO:1904936) |
| 0.0 | 0.0 | GO:0010890 | positive regulation of sequestering of triglyceride(GO:0010890) |
| 0.0 | 0.1 | GO:0006983 | ER overload response(GO:0006983) |
| 0.0 | 0.1 | GO:0014824 | artery smooth muscle contraction(GO:0014824) |
| 0.0 | 0.0 | GO:0048936 | peripheral nervous system neuron axonogenesis(GO:0048936) |
| 0.0 | 0.1 | GO:0044275 | cellular carbohydrate catabolic process(GO:0044275) |
| 0.0 | 0.0 | GO:0051490 | negative regulation of filopodium assembly(GO:0051490) |
| 0.0 | 0.4 | GO:0009250 | glycogen biosynthetic process(GO:0005978) glucan biosynthetic process(GO:0009250) |
| 0.0 | 0.2 | GO:0030593 | neutrophil chemotaxis(GO:0030593) |
| 0.0 | 0.3 | GO:0007520 | myoblast fusion(GO:0007520) |
| 0.0 | 0.4 | GO:0060411 | cardiac septum morphogenesis(GO:0060411) |
| 0.0 | 0.1 | GO:0002181 | cytoplasmic translation(GO:0002181) |
| 0.0 | 0.1 | GO:0016191 | synaptic vesicle uncoating(GO:0016191) |
| 0.0 | 0.1 | GO:0072520 | seminiferous tubule development(GO:0072520) |
| 0.0 | 0.1 | GO:1903385 | regulation of homophilic cell adhesion(GO:1903385) |
| 0.0 | 0.0 | GO:1990641 | response to iron ion starvation(GO:1990641) |
| 0.0 | 0.9 | GO:0030521 | androgen receptor signaling pathway(GO:0030521) |
| 0.0 | 0.0 | GO:0048840 | otolith development(GO:0048840) |
| 0.0 | 0.1 | GO:1902036 | regulation of hematopoietic stem cell differentiation(GO:1902036) |
| 0.0 | 0.1 | GO:0045793 | positive regulation of cell size(GO:0045793) |
| 0.0 | 0.4 | GO:0000083 | regulation of transcription involved in G1/S transition of mitotic cell cycle(GO:0000083) |
| 0.0 | 0.5 | GO:0019722 | calcium-mediated signaling(GO:0019722) |
| 0.0 | 0.2 | GO:0033141 | positive regulation of peptidyl-serine phosphorylation of STAT protein(GO:0033141) |
| 0.0 | 0.0 | GO:0006421 | asparaginyl-tRNA aminoacylation(GO:0006421) |
| 0.0 | 0.1 | GO:0043654 | recognition of apoptotic cell(GO:0043654) |
| 0.0 | 0.0 | GO:0098759 | response to interleukin-8(GO:0098758) cellular response to interleukin-8(GO:0098759) |
| 0.0 | 0.0 | GO:2001237 | negative regulation of extrinsic apoptotic signaling pathway(GO:2001237) |
| 0.0 | 0.1 | GO:0007076 | mitotic chromosome condensation(GO:0007076) |
| 0.0 | 0.1 | GO:0007289 | spermatid nucleus differentiation(GO:0007289) |
| 0.0 | 0.1 | GO:0045008 | depyrimidination(GO:0045008) |
Gene overrepresentation in cellular_component category:
| Log-likelihood per target | Total log-likelihood | Term | Description |
|---|---|---|---|
| 0.3 | 1.0 | GO:0016935 | glycine-gated chloride channel complex(GO:0016935) |
| 0.3 | 0.8 | GO:0034680 | integrin alpha10-beta1 complex(GO:0034680) |
| 0.2 | 0.7 | GO:0048269 | methionine adenosyltransferase complex(GO:0048269) |
| 0.2 | 1.4 | GO:0031313 | extrinsic component of endosome membrane(GO:0031313) |
| 0.2 | 4.6 | GO:0031254 | uropod(GO:0001931) cell trailing edge(GO:0031254) |
| 0.2 | 0.5 | GO:0000308 | cytoplasmic cyclin-dependent protein kinase holoenzyme complex(GO:0000308) |
| 0.2 | 1.6 | GO:0070022 | transforming growth factor beta receptor homodimeric complex(GO:0070022) |
| 0.2 | 2.0 | GO:0044300 | cerebellar mossy fiber(GO:0044300) |
| 0.2 | 1.0 | GO:0065010 | extracellular membrane-bounded organelle(GO:0065010) |
| 0.2 | 0.2 | GO:0072563 | endothelial microparticle(GO:0072563) |
| 0.1 | 2.2 | GO:0030478 | actin cap(GO:0030478) |
| 0.1 | 0.8 | GO:1990584 | cardiac Troponin complex(GO:1990584) |
| 0.1 | 0.3 | GO:0005826 | actomyosin contractile ring(GO:0005826) |
| 0.1 | 0.4 | GO:0071065 | alpha9-beta1 integrin-vascular cell adhesion molecule-1 complex(GO:0071065) |
| 0.1 | 0.4 | GO:0036194 | muscle cell projection(GO:0036194) muscle cell projection membrane(GO:0036195) |
| 0.1 | 1.3 | GO:0033270 | paranode region of axon(GO:0033270) |
| 0.1 | 2.3 | GO:0032433 | filopodium tip(GO:0032433) |
| 0.1 | 0.9 | GO:0016012 | sarcoglycan complex(GO:0016012) |
| 0.1 | 1.3 | GO:0072559 | NLRP3 inflammasome complex(GO:0072559) |
| 0.1 | 1.6 | GO:0042583 | chromaffin granule(GO:0042583) |
| 0.1 | 7.1 | GO:0022627 | cytosolic small ribosomal subunit(GO:0022627) |
| 0.1 | 2.4 | GO:0005779 | integral component of peroxisomal membrane(GO:0005779) intrinsic component of peroxisomal membrane(GO:0031231) |
| 0.1 | 0.7 | GO:0000813 | ESCRT I complex(GO:0000813) |
| 0.1 | 1.5 | GO:0031616 | spindle pole centrosome(GO:0031616) |
| 0.1 | 1.8 | GO:0043220 | Schmidt-Lanterman incisure(GO:0043220) |
| 0.1 | 0.9 | GO:0002116 | semaphorin receptor complex(GO:0002116) |
| 0.1 | 0.6 | GO:0034993 | microtubule organizing center attachment site(GO:0034992) LINC complex(GO:0034993) |
| 0.1 | 0.2 | GO:0034673 | inhibin-betaglycan-ActRII complex(GO:0034673) |
| 0.1 | 0.5 | GO:1990812 | growth cone filopodium(GO:1990812) |
| 0.1 | 0.1 | GO:0031523 | Myb complex(GO:0031523) |
| 0.1 | 0.6 | GO:0097539 | ciliary transition fiber(GO:0097539) |
| 0.1 | 0.2 | GO:0000818 | nuclear MIS12/MIND complex(GO:0000818) |
| 0.1 | 0.2 | GO:0043511 | inhibin complex(GO:0043511) inhibin A complex(GO:0043512) |
| 0.1 | 1.2 | GO:0097342 | ripoptosome(GO:0097342) |
| 0.1 | 1.4 | GO:0043205 | microfibril(GO:0001527) fibril(GO:0043205) |
| 0.1 | 0.2 | GO:0060203 | clathrin-sculpted glutamate transport vesicle(GO:0060199) clathrin-sculpted glutamate transport vesicle membrane(GO:0060203) |
| 0.1 | 0.2 | GO:0031166 | integral component of vacuolar membrane(GO:0031166) |
| 0.1 | 0.9 | GO:0005916 | fascia adherens(GO:0005916) |
| 0.1 | 0.2 | GO:0033185 | dolichol-phosphate-mannose synthase complex(GO:0033185) |
| 0.1 | 0.4 | GO:0000015 | phosphopyruvate hydratase complex(GO:0000015) |
| 0.1 | 0.3 | GO:0033263 | CORVET complex(GO:0033263) |
| 0.1 | 0.8 | GO:0098647 | collagen type VI trimer(GO:0005589) collagen beaded filament(GO:0098647) |
| 0.1 | 0.4 | GO:0070852 | cell body fiber(GO:0070852) |
| 0.1 | 0.2 | GO:1990423 | RZZ complex(GO:1990423) |
| 0.1 | 0.9 | GO:0032059 | bleb(GO:0032059) |
| 0.1 | 1.0 | GO:0031229 | integral component of nuclear inner membrane(GO:0005639) intrinsic component of nuclear inner membrane(GO:0031229) nuclear membrane part(GO:0044453) |
| 0.1 | 0.2 | GO:0042567 | insulin-like growth factor ternary complex(GO:0042567) |
| 0.1 | 0.3 | GO:0046696 | lipopolysaccharide receptor complex(GO:0046696) |
| 0.1 | 0.2 | GO:0031262 | Ndc80 complex(GO:0031262) |
| 0.0 | 0.1 | GO:0032302 | MutSbeta complex(GO:0032302) |
| 0.0 | 0.3 | GO:1902560 | GMP reductase complex(GO:1902560) |
| 0.0 | 0.1 | GO:0034271 | phosphatidylinositol 3-kinase complex, class III, type I(GO:0034271) phosphatidylinositol 3-kinase complex, class III, type II(GO:0034272) |
| 0.0 | 0.1 | GO:0016327 | apicolateral plasma membrane(GO:0016327) |
| 0.0 | 1.2 | GO:0016010 | dystrophin-associated glycoprotein complex(GO:0016010) glycoprotein complex(GO:0090665) |
| 0.0 | 0.2 | GO:0005876 | spindle microtubule(GO:0005876) |
| 0.0 | 0.2 | GO:0000940 | condensed chromosome outer kinetochore(GO:0000940) |
| 0.0 | 0.2 | GO:0001940 | male pronucleus(GO:0001940) |
| 0.0 | 0.2 | GO:0071012 | catalytic step 1 spliceosome(GO:0071012) |
| 0.0 | 0.6 | GO:0097470 | ribbon synapse(GO:0097470) |
| 0.0 | 0.2 | GO:0035032 | phosphatidylinositol 3-kinase complex, class III(GO:0035032) |
| 0.0 | 1.0 | GO:0042641 | actomyosin(GO:0042641) |
| 0.0 | 0.2 | GO:0031510 | SUMO activating enzyme complex(GO:0031510) |
| 0.0 | 0.5 | GO:0097512 | cardiac myofibril(GO:0097512) |
| 0.0 | 0.1 | GO:0098837 | postsynaptic recycling endosome(GO:0098837) |
| 0.0 | 0.1 | GO:1990393 | 3M complex(GO:1990393) |
| 0.0 | 0.3 | GO:0014802 | terminal cisterna(GO:0014802) |
| 0.0 | 0.2 | GO:0031430 | M band(GO:0031430) |
| 0.0 | 0.8 | GO:0005859 | muscle myosin complex(GO:0005859) |
| 0.0 | 0.1 | GO:0032133 | chromosome passenger complex(GO:0032133) |
| 0.0 | 3.3 | GO:0005811 | lipid particle(GO:0005811) |
| 0.0 | 0.3 | GO:1990589 | ATF4-CREB1 transcription factor complex(GO:1990589) |
| 0.0 | 0.3 | GO:0071438 | invadopodium membrane(GO:0071438) |
| 0.0 | 0.1 | GO:0005873 | plus-end kinesin complex(GO:0005873) |
| 0.0 | 0.2 | GO:0097208 | alveolar lamellar body(GO:0097208) |
| 0.0 | 0.3 | GO:0005851 | eukaryotic translation initiation factor 2B complex(GO:0005851) |
| 0.0 | 0.1 | GO:0019008 | molybdopterin synthase complex(GO:0019008) |
| 0.0 | 0.3 | GO:0031467 | Cul7-RING ubiquitin ligase complex(GO:0031467) |
| 0.0 | 0.5 | GO:0097038 | perinuclear endoplasmic reticulum(GO:0097038) |
| 0.0 | 6.9 | GO:0032993 | protein-DNA complex(GO:0032993) |
| 0.0 | 0.2 | GO:0032311 | angiogenin-PRI complex(GO:0032311) |
| 0.0 | 0.3 | GO:0034464 | BBSome(GO:0034464) |
| 0.0 | 0.3 | GO:0042589 | zymogen granule membrane(GO:0042589) |
| 0.0 | 2.0 | GO:0035577 | azurophil granule membrane(GO:0035577) |
| 0.0 | 0.2 | GO:0071546 | pi-body(GO:0071546) |
| 0.0 | 1.7 | GO:0005801 | cis-Golgi network(GO:0005801) |
| 0.0 | 0.7 | GO:0030127 | COPII vesicle coat(GO:0030127) |
| 0.0 | 0.7 | GO:0005640 | nuclear outer membrane(GO:0005640) |
| 0.0 | 4.7 | GO:0030018 | Z disc(GO:0030018) |
| 0.0 | 0.2 | GO:0098839 | postsynaptic density membrane(GO:0098839) |
| 0.0 | 0.2 | GO:0043240 | Fanconi anaemia nuclear complex(GO:0043240) |
| 0.0 | 0.2 | GO:0033061 | DNA recombinase mediator complex(GO:0033061) Rad51B-Rad51C-Rad51D-XRCC2 complex(GO:0033063) |
| 0.0 | 0.1 | GO:0036396 | MIS complex(GO:0036396) mRNA editing complex(GO:0045293) |
| 0.0 | 0.1 | GO:0097149 | centralspindlin complex(GO:0097149) |
| 0.0 | 0.2 | GO:0044218 | other organism cell membrane(GO:0044218) other organism membrane(GO:0044279) |
| 0.0 | 0.1 | GO:0055087 | Ski complex(GO:0055087) |
| 0.0 | 0.2 | GO:0005742 | mitochondrial outer membrane translocase complex(GO:0005742) |
| 0.0 | 0.3 | GO:0005614 | interstitial matrix(GO:0005614) |
| 0.0 | 0.1 | GO:0043541 | UDP-N-acetylglucosamine transferase complex(GO:0043541) |
| 0.0 | 0.2 | GO:0000347 | THO complex(GO:0000347) THO complex part of transcription export complex(GO:0000445) |
| 0.0 | 0.1 | GO:0000243 | commitment complex(GO:0000243) |
| 0.0 | 0.5 | GO:0030122 | AP-2 adaptor complex(GO:0030122) |
| 0.0 | 0.3 | GO:0000780 | condensed nuclear chromosome, centromeric region(GO:0000780) |
| 0.0 | 0.1 | GO:0097224 | sperm connecting piece(GO:0097224) |
| 0.0 | 0.2 | GO:0034098 | VCP-NPL4-UFD1 AAA ATPase complex(GO:0034098) |
| 0.0 | 1.8 | GO:0035580 | specific granule lumen(GO:0035580) |
| 0.0 | 1.7 | GO:0030864 | cortical actin cytoskeleton(GO:0030864) |
| 0.0 | 0.3 | GO:0036038 | MKS complex(GO:0036038) |
| 0.0 | 1.3 | GO:0097610 | cleavage furrow(GO:0032154) cell surface furrow(GO:0097610) |
| 0.0 | 0.3 | GO:0005687 | U4 snRNP(GO:0005687) |
| 0.0 | 0.2 | GO:0030126 | COPI vesicle coat(GO:0030126) |
| 0.0 | 0.4 | GO:0008074 | guanylate cyclase complex, soluble(GO:0008074) |
| 0.0 | 0.3 | GO:0019774 | proteasome core complex, beta-subunit complex(GO:0019774) |
| 0.0 | 0.2 | GO:0035686 | sperm fibrous sheath(GO:0035686) |
| 0.0 | 0.2 | GO:0033180 | proton-transporting V-type ATPase, V1 domain(GO:0033180) |
| 0.0 | 0.5 | GO:0032839 | dendrite cytoplasm(GO:0032839) |
| 0.0 | 0.2 | GO:0097136 | Bcl-2 family protein complex(GO:0097136) |
| 0.0 | 0.1 | GO:0097447 | dendritic tree(GO:0097447) |
| 0.0 | 0.4 | GO:0016580 | Sin3 complex(GO:0016580) |
| 0.0 | 0.2 | GO:0070531 | BRCA1-A complex(GO:0070531) |
| 0.0 | 0.1 | GO:0032444 | activin responsive factor complex(GO:0032444) |
| 0.0 | 0.0 | GO:0034991 | nuclear meiotic cohesin complex(GO:0034991) |
| 0.0 | 0.2 | GO:0072546 | ER membrane protein complex(GO:0072546) |
| 0.0 | 0.1 | GO:0071144 | SMAD2-SMAD3 protein complex(GO:0071144) |
| 0.0 | 0.2 | GO:0008385 | IkappaB kinase complex(GO:0008385) |
| 0.0 | 0.0 | GO:0070195 | growth hormone receptor complex(GO:0070195) |
| 0.0 | 0.1 | GO:0031083 | BLOC-1 complex(GO:0031083) |
| 0.0 | 0.1 | GO:0071817 | MMXD complex(GO:0071817) |
| 0.0 | 0.1 | GO:0002178 | palmitoyltransferase complex(GO:0002178) |
| 0.0 | 1.4 | GO:0031093 | platelet alpha granule lumen(GO:0031093) |
| 0.0 | 0.2 | GO:0036452 | ESCRT complex(GO:0036452) |
| 0.0 | 0.3 | GO:0005685 | U1 snRNP(GO:0005685) |
| 0.0 | 0.6 | GO:0043198 | dendritic shaft(GO:0043198) |
| 0.0 | 0.4 | GO:0009925 | basal plasma membrane(GO:0009925) |
| 0.0 | 0.2 | GO:0031089 | platelet dense granule lumen(GO:0031089) |
| 0.0 | 0.5 | GO:0000777 | condensed chromosome kinetochore(GO:0000777) |
| 0.0 | 0.5 | GO:1904115 | axon cytoplasm(GO:1904115) |
| 0.0 | 0.1 | GO:0005854 | nascent polypeptide-associated complex(GO:0005854) |
| 0.0 | 0.1 | GO:0043218 | compact myelin(GO:0043218) |
| 0.0 | 1.0 | GO:0001750 | photoreceptor outer segment(GO:0001750) |
| 0.0 | 0.4 | GO:0098791 | trans-Golgi network(GO:0005802) Golgi subcompartment(GO:0098791) |
| 0.0 | 0.1 | GO:0043203 | axon hillock(GO:0043203) |
| 0.0 | 0.0 | GO:0097361 | CIA complex(GO:0097361) |
| 0.0 | 0.5 | GO:0005834 | heterotrimeric G-protein complex(GO:0005834) |
| 0.0 | 0.4 | GO:0097346 | INO80-type complex(GO:0097346) |
| 0.0 | 0.3 | GO:0005665 | DNA-directed RNA polymerase II, core complex(GO:0005665) |
| 0.0 | 0.0 | GO:0043293 | apoptosome(GO:0043293) |
| 0.0 | 0.1 | GO:0000322 | storage vacuole(GO:0000322) |
| 0.0 | 0.3 | GO:0060170 | ciliary membrane(GO:0060170) |
| 0.0 | 0.0 | GO:0030891 | VCB complex(GO:0030891) |
| 0.0 | 0.1 | GO:0016471 | vacuolar proton-transporting V-type ATPase complex(GO:0016471) |
| 0.0 | 0.1 | GO:0043190 | ATP-binding cassette (ABC) transporter complex(GO:0043190) |
| 0.0 | 0.1 | GO:0031465 | Cul4B-RING E3 ubiquitin ligase complex(GO:0031465) |
| 0.0 | 0.2 | GO:0030662 | coated vesicle membrane(GO:0030662) |
| 0.0 | 0.6 | GO:0005798 | Golgi-associated vesicle(GO:0005798) |
| 0.0 | 1.6 | GO:0070382 | exocytic vesicle(GO:0070382) |
| 0.0 | 0.1 | GO:0000124 | SAGA complex(GO:0000124) |
Gene overrepresentation in C2:CP category:
| Log-likelihood per target | Total log-likelihood | Term | Description |
|---|---|---|---|
| 0.1 | 10.9 | PID AR PATHWAY | Coregulation of Androgen receptor activity |
| 0.1 | 4.2 | PID INTEGRIN2 PATHWAY | Beta2 integrin cell surface interactions |
| 0.1 | 1.4 | PID VEGF VEGFR PATHWAY | VEGF and VEGFR signaling network |
| 0.1 | 1.4 | SA FAS SIGNALING | The TNF-type receptor Fas induces apoptosis on ligand binding. |
| 0.0 | 2.5 | PID AURORA A PATHWAY | Aurora A signaling |
| 0.0 | 2.1 | PID EPHRINB REV PATHWAY | Ephrin B reverse signaling |
| 0.0 | 1.2 | PID TOLL ENDOGENOUS PATHWAY | Endogenous TLR signaling |
| 0.0 | 0.1 | ST T CELL SIGNAL TRANSDUCTION | T Cell Signal Transduction |
| 0.0 | 2.5 | PID HNF3A PATHWAY | FOXA1 transcription factor network |
| 0.0 | 1.6 | PID RET PATHWAY | Signaling events regulated by Ret tyrosine kinase |
| 0.0 | 0.3 | PID NECTIN PATHWAY | Nectin adhesion pathway |
| 0.0 | 0.5 | PID P38 GAMMA DELTA PATHWAY | Signaling mediated by p38-gamma and p38-delta |
| 0.0 | 1.2 | PID NETRIN PATHWAY | Netrin-mediated signaling events |
| 0.0 | 1.1 | PID NCADHERIN PATHWAY | N-cadherin signaling events |
| 0.0 | 1.3 | PID ERBB1 INTERNALIZATION PATHWAY | Internalization of ErbB1 |
| 0.0 | 0.7 | PID HDAC CLASSIII PATHWAY | Signaling events mediated by HDAC Class III |
| 0.0 | 0.6 | PID EPHB FWD PATHWAY | EPHB forward signaling |
| 0.0 | 0.2 | PID RHOA PATHWAY | RhoA signaling pathway |
| 0.0 | 5.2 | NABA ECM GLYCOPROTEINS | Genes encoding structural ECM glycoproteins |
| 0.0 | 1.2 | PID RAC1 REG PATHWAY | Regulation of RAC1 activity |
| 0.0 | 1.4 | PID SHP2 PATHWAY | SHP2 signaling |
| 0.0 | 1.2 | PID ARF6 TRAFFICKING PATHWAY | Arf6 trafficking events |
| 0.0 | 0.9 | PID FRA PATHWAY | Validated transcriptional targets of AP1 family members Fra1 and Fra2 |
| 0.0 | 0.8 | PID FOXM1 PATHWAY | FOXM1 transcription factor network |
| 0.0 | 0.5 | SA CASPASE CASCADE | Apoptosis is mediated by caspases, cysteine proteases arranged in a proteolytic cascade. |
| 0.0 | 0.5 | PID FAK PATHWAY | Signaling events mediated by focal adhesion kinase |
| 0.0 | 0.1 | SA TRKA RECEPTOR | The TrkA receptor binds nerve growth factor to activate MAP kinase pathways and promote cell growth. |
| 0.0 | 0.2 | PID ATM PATHWAY | ATM pathway |
| 0.0 | 0.2 | PID INSULIN GLUCOSE PATHWAY | Insulin-mediated glucose transport |
| 0.0 | 1.2 | PID REG GR PATHWAY | Glucocorticoid receptor regulatory network |
| 0.0 | 0.4 | PID ARF 3PATHWAY | Arf1 pathway |
| 0.0 | 0.5 | PID GLYPICAN 1PATHWAY | Glypican 1 network |
| 0.0 | 1.0 | PID AP1 PATHWAY | AP-1 transcription factor network |
| 0.0 | 0.6 | PID ALPHA SYNUCLEIN PATHWAY | Alpha-synuclein signaling |
| 0.0 | 0.6 | PID MAPK TRK PATHWAY | Trk receptor signaling mediated by the MAPK pathway |
| 0.0 | 0.9 | PID ILK PATHWAY | Integrin-linked kinase signaling |
| 0.0 | 0.4 | PID P38 MKK3 6PATHWAY | p38 MAPK signaling pathway |
| 0.0 | 0.3 | PID SMAD2 3PATHWAY | Regulation of cytoplasmic and nuclear SMAD2/3 signaling |
| 0.0 | 0.2 | PID PRL SIGNALING EVENTS PATHWAY | Signaling events mediated by PRL |
| 0.0 | 0.3 | PID AMB2 NEUTROPHILS PATHWAY | amb2 Integrin signaling |
| 0.0 | 0.3 | PID BETA CATENIN DEG PATHWAY | Degradation of beta catenin |
| 0.0 | 0.0 | SIG PIP3 SIGNALING IN B LYMPHOCYTES | Genes related to PIP3 signaling in B lymphocytes |
| 0.0 | 0.2 | PID WNT NONCANONICAL PATHWAY | Noncanonical Wnt signaling pathway |
| 0.0 | 0.2 | PID P38 MK2 PATHWAY | p38 signaling mediated by MAPKAP kinases |
| 0.0 | 0.2 | PID HEDGEHOG GLI PATHWAY | Hedgehog signaling events mediated by Gli proteins |
| 0.0 | 0.4 | PID ALK1 PATHWAY | ALK1 signaling events |
| 0.0 | 0.1 | PID SYNDECAN 2 PATHWAY | Syndecan-2-mediated signaling events |
| 0.0 | 0.3 | PID TAP63 PATHWAY | Validated transcriptional targets of TAp63 isoforms |
| 0.0 | 0.2 | PID FOXO PATHWAY | FoxO family signaling |
| 0.0 | 0.5 | PID AURORA B PATHWAY | Aurora B signaling |
Gene overrepresentation in molecular_function category:
| Log-likelihood per target | Total log-likelihood | Term | Description |
|---|---|---|---|
| 1.5 | 5.9 | GO:0008112 | nicotinamide N-methyltransferase activity(GO:0008112) pyridine N-methyltransferase activity(GO:0030760) |
| 0.8 | 9.8 | GO:0001087 | transcription factor activity, sequence-specific DNA binding, RNA polymerase recruiting(GO:0001011) transcription factor activity, TFIIB-class binding(GO:0001087) |
| 0.7 | 2.2 | GO:0080019 | fatty-acyl-CoA reductase (alcohol-forming) activity(GO:0080019) |
| 0.7 | 2.0 | GO:0032089 | NACHT domain binding(GO:0032089) |
| 0.5 | 2.5 | GO:0050436 | microfibril binding(GO:0050436) |
| 0.3 | 1.0 | GO:0004781 | adenylylsulfate kinase activity(GO:0004020) sulfate adenylyltransferase activity(GO:0004779) sulfate adenylyltransferase (ATP) activity(GO:0004781) |
| 0.3 | 0.9 | GO:0004139 | deoxyribose-phosphate aldolase activity(GO:0004139) |
| 0.3 | 1.5 | GO:0005006 | epidermal growth factor-activated receptor activity(GO:0005006) |
| 0.3 | 1.6 | GO:0019834 | phospholipase A2 inhibitor activity(GO:0019834) |
| 0.2 | 0.7 | GO:0002113 | interleukin-33 binding(GO:0002113) |
| 0.2 | 1.4 | GO:0004882 | androgen receptor activity(GO:0004882) |
| 0.2 | 0.9 | GO:0052798 | beta-galactoside alpha-2,3-sialyltransferase activity(GO:0052798) |
| 0.2 | 0.2 | GO:0043515 | kinetochore binding(GO:0043515) |
| 0.2 | 0.6 | GO:0008798 | beta-aspartyl-peptidase activity(GO:0008798) |
| 0.2 | 0.6 | GO:0050501 | hyaluronan synthase activity(GO:0050501) |
| 0.2 | 0.8 | GO:0008336 | gamma-butyrobetaine dioxygenase activity(GO:0008336) |
| 0.2 | 0.6 | GO:0102007 | lactonohydrolase activity(GO:0046573) acyl-L-homoserine-lactone lactonohydrolase activity(GO:0102007) |
| 0.2 | 0.9 | GO:0016403 | dimethylargininase activity(GO:0016403) |
| 0.2 | 0.9 | GO:0016934 | extracellular-glycine-gated ion channel activity(GO:0016933) extracellular-glycine-gated chloride channel activity(GO:0016934) |
| 0.2 | 0.6 | GO:0004948 | calcitonin receptor activity(GO:0004948) |
| 0.2 | 0.8 | GO:0098639 | collagen binding involved in cell-matrix adhesion(GO:0098639) |
| 0.2 | 0.8 | GO:0060961 | phospholipase D inhibitor activity(GO:0060961) |
| 0.1 | 0.6 | GO:0004346 | glucose-6-phosphatase activity(GO:0004346) sugar-terminal-phosphatase activity(GO:0050309) |
| 0.1 | 3.7 | GO:0008093 | cytoskeletal adaptor activity(GO:0008093) |
| 0.1 | 0.8 | GO:0047685 | amine sulfotransferase activity(GO:0047685) |
| 0.1 | 0.9 | GO:0047894 | flavonol 3-sulfotransferase activity(GO:0047894) |
| 0.1 | 0.6 | GO:0086075 | gap junction channel activity involved in cardiac conduction electrical coupling(GO:0086075) |
| 0.1 | 0.6 | GO:0047237 | glucuronylgalactosylproteoglycan 4-beta-N-acetylgalactosaminyltransferase activity(GO:0047237) |
| 0.1 | 0.6 | GO:0052740 | 1-acyl-2-lysophosphatidylserine acylhydrolase activity(GO:0052740) |
| 0.1 | 0.3 | GO:0030377 | urokinase plasminogen activator receptor activity(GO:0030377) |
| 0.1 | 0.8 | GO:0038085 | vascular endothelial growth factor binding(GO:0038085) |
| 0.1 | 0.3 | GO:0004939 | beta-adrenergic receptor activity(GO:0004939) |
| 0.1 | 0.8 | GO:0030172 | troponin C binding(GO:0030172) |
| 0.1 | 1.4 | GO:0042043 | neurexin family protein binding(GO:0042043) |
| 0.1 | 0.6 | GO:0004800 | thyroxine 5'-deiodinase activity(GO:0004800) |
| 0.1 | 0.9 | GO:0060002 | plus-end directed microfilament motor activity(GO:0060002) |
| 0.1 | 2.1 | GO:0035615 | clathrin adaptor activity(GO:0035615) endocytic adaptor activity(GO:0098748) |
| 0.1 | 0.7 | GO:0030267 | hydroxypyruvate reductase activity(GO:0016618) glyoxylate reductase (NADP) activity(GO:0030267) |
| 0.1 | 0.6 | GO:0004035 | alkaline phosphatase activity(GO:0004035) |
| 0.1 | 6.6 | GO:0019843 | rRNA binding(GO:0019843) |
| 0.1 | 0.5 | GO:0035402 | histone kinase activity (H3-T11 specific)(GO:0035402) |
| 0.1 | 1.0 | GO:0004931 | extracellular ATP-gated cation channel activity(GO:0004931) ATP-gated ion channel activity(GO:0035381) |
| 0.1 | 0.5 | GO:1990254 | keratin filament binding(GO:1990254) |
| 0.1 | 0.3 | GO:0004598 | peptidylglycine monooxygenase activity(GO:0004504) peptidylamidoglycolate lyase activity(GO:0004598) |
| 0.1 | 2.0 | GO:0008191 | metalloendopeptidase inhibitor activity(GO:0008191) |
| 0.1 | 0.2 | GO:0004157 | dihydropyrimidinase activity(GO:0004157) |
| 0.1 | 0.6 | GO:0035374 | chondroitin sulfate binding(GO:0035374) |
| 0.1 | 0.5 | GO:0017077 | oxidative phosphorylation uncoupler activity(GO:0017077) |
| 0.1 | 0.7 | GO:0004062 | aryl sulfotransferase activity(GO:0004062) |
| 0.1 | 0.4 | GO:0016941 | natriuretic peptide receptor activity(GO:0016941) |
| 0.1 | 0.3 | GO:0048248 | CXCR3 chemokine receptor binding(GO:0048248) |
| 0.1 | 0.8 | GO:0031419 | cobalamin binding(GO:0031419) |
| 0.1 | 0.2 | GO:0070699 | type II activin receptor binding(GO:0070699) |
| 0.1 | 0.7 | GO:0031995 | insulin-like growth factor II binding(GO:0031995) |
| 0.1 | 0.2 | GO:0034236 | protein kinase A catalytic subunit binding(GO:0034236) |
| 0.1 | 0.2 | GO:0047631 | ADP-ribose diphosphatase activity(GO:0047631) |
| 0.1 | 1.3 | GO:0004862 | cAMP-dependent protein kinase inhibitor activity(GO:0004862) |
| 0.1 | 0.2 | GO:0004307 | ethanolaminephosphotransferase activity(GO:0004307) |
| 0.1 | 0.2 | GO:0050119 | N-acetylglucosamine deacetylase activity(GO:0050119) |
| 0.1 | 0.2 | GO:0070996 | type 1 melanocortin receptor binding(GO:0070996) |
| 0.1 | 0.2 | GO:0004582 | dolichyl-phosphate beta-D-mannosyltransferase activity(GO:0004582) |
| 0.1 | 0.4 | GO:0004634 | phosphopyruvate hydratase activity(GO:0004634) |
| 0.1 | 0.2 | GO:0016230 | sphingomyelin phosphodiesterase activator activity(GO:0016230) |
| 0.1 | 1.7 | GO:0005528 | macrolide binding(GO:0005527) FK506 binding(GO:0005528) |
| 0.1 | 0.2 | GO:0052895 | norspermine:oxygen oxidoreductase activity(GO:0052894) N1-acetylspermine:oxygen oxidoreductase (N1-acetylspermidine-forming) activity(GO:0052895) |
| 0.1 | 1.0 | GO:0004745 | retinol dehydrogenase activity(GO:0004745) |
| 0.1 | 0.3 | GO:0003960 | NADPH:quinone reductase activity(GO:0003960) |
| 0.1 | 0.4 | GO:0005068 | transmembrane receptor protein tyrosine kinase adaptor activity(GO:0005068) |
| 0.1 | 0.8 | GO:0005172 | vascular endothelial growth factor receptor binding(GO:0005172) |
| 0.1 | 0.4 | GO:0004111 | creatine kinase activity(GO:0004111) |
| 0.1 | 0.2 | GO:0032422 | purine-rich negative regulatory element binding(GO:0032422) |
| 0.1 | 0.2 | GO:0004937 | alpha1-adrenergic receptor activity(GO:0004937) |
| 0.1 | 0.2 | GO:0015616 | DNA translocase activity(GO:0015616) |
| 0.1 | 0.4 | GO:0035614 | snRNA stem-loop binding(GO:0035614) |
| 0.1 | 0.5 | GO:0051425 | PTB domain binding(GO:0051425) |
| 0.1 | 0.3 | GO:0004830 | tryptophan-tRNA ligase activity(GO:0004830) |
| 0.0 | 0.1 | GO:0000404 | heteroduplex DNA loop binding(GO:0000404) double-strand/single-strand DNA junction binding(GO:0000406) dinucleotide repeat insertion binding(GO:0032181) |
| 0.0 | 1.5 | GO:0005540 | hyaluronic acid binding(GO:0005540) |
| 0.0 | 0.3 | GO:0016657 | GMP reductase activity(GO:0003920) oxidoreductase activity, acting on NAD(P)H, nitrogenous group as acceptor(GO:0016657) |
| 0.0 | 0.3 | GO:0030621 | U4 snRNA binding(GO:0030621) |
| 0.0 | 0.1 | GO:0008267 | poly-glutamine tract binding(GO:0008267) |
| 0.0 | 1.0 | GO:0005523 | tropomyosin binding(GO:0005523) |
| 0.0 | 0.2 | GO:0052795 | exo-alpha-(2->3)-sialidase activity(GO:0052794) exo-alpha-(2->6)-sialidase activity(GO:0052795) exo-alpha-(2->8)-sialidase activity(GO:0052796) |
| 0.0 | 0.3 | GO:0005134 | interleukin-2 receptor binding(GO:0005134) |
| 0.0 | 0.1 | GO:0000995 | transcription factor activity, core RNA polymerase III binding(GO:0000995) |
| 0.0 | 0.3 | GO:0008454 | alpha-1,3-mannosylglycoprotein 4-beta-N-acetylglucosaminyltransferase activity(GO:0008454) |
| 0.0 | 0.1 | GO:0001784 | phosphotyrosine binding(GO:0001784) |
| 0.0 | 1.0 | GO:0050750 | low-density lipoprotein particle receptor binding(GO:0050750) |
| 0.0 | 0.1 | GO:0015439 | heme-transporting ATPase activity(GO:0015439) |
| 0.0 | 0.3 | GO:0001225 | RNA polymerase II transcription coactivator binding(GO:0001225) |
| 0.0 | 0.2 | GO:0070740 | tubulin-glutamic acid ligase activity(GO:0070740) |
| 0.0 | 0.2 | GO:0039552 | RIG-I binding(GO:0039552) |
| 0.0 | 0.3 | GO:0016167 | glial cell-derived neurotrophic factor receptor activity(GO:0016167) |
| 0.0 | 0.1 | GO:0004960 | thromboxane receptor activity(GO:0004960) thromboxane A2 receptor activity(GO:0004961) |
| 0.0 | 0.1 | GO:0001069 | regulatory region RNA binding(GO:0001069) |
| 0.0 | 0.6 | GO:0016641 | oxidoreductase activity, acting on the CH-NH2 group of donors, oxygen as acceptor(GO:0016641) |
| 0.0 | 0.4 | GO:0046703 | natural killer cell lectin-like receptor binding(GO:0046703) |
| 0.0 | 0.2 | GO:0098821 | inhibin binding(GO:0034711) BMP receptor activity(GO:0098821) |
| 0.0 | 0.4 | GO:0015174 | basic amino acid transmembrane transporter activity(GO:0015174) |
| 0.0 | 0.1 | GO:0070644 | vitamin D response element binding(GO:0070644) |
| 0.0 | 0.6 | GO:0045499 | chemorepellent activity(GO:0045499) |
| 0.0 | 0.3 | GO:0016778 | diphosphotransferase activity(GO:0016778) |
| 0.0 | 0.1 | GO:0004962 | endothelin receptor activity(GO:0004962) |
| 0.0 | 0.4 | GO:0046625 | sphingolipid binding(GO:0046625) |
| 0.0 | 0.2 | GO:0005119 | smoothened binding(GO:0005119) |
| 0.0 | 0.5 | GO:0045294 | alpha-catenin binding(GO:0045294) |
| 0.0 | 0.1 | GO:0016820 | hydrolase activity, acting on acid anhydrides, catalyzing transmembrane movement of substances(GO:0016820) |
| 0.0 | 1.1 | GO:0097200 | cysteine-type endopeptidase activity involved in execution phase of apoptosis(GO:0097200) |
| 0.0 | 0.7 | GO:0001223 | transcription coactivator binding(GO:0001223) |
| 0.0 | 0.4 | GO:0001135 | transcription factor activity, RNA polymerase II transcription factor recruiting(GO:0001135) |
| 0.0 | 0.1 | GO:0042954 | lipoprotein transporter activity(GO:0042954) |
| 0.0 | 0.1 | GO:0070697 | activin receptor binding(GO:0070697) |
| 0.0 | 0.2 | GO:0035800 | deubiquitinase activator activity(GO:0035800) |
| 0.0 | 0.5 | GO:0031957 | very long-chain fatty acid-CoA ligase activity(GO:0031957) |
| 0.0 | 0.3 | GO:0019237 | centromeric DNA binding(GO:0019237) |
| 0.0 | 0.1 | GO:0032184 | SUMO polymer binding(GO:0032184) |
| 0.0 | 0.1 | GO:0016842 | amidine-lyase activity(GO:0016842) |
| 0.0 | 0.4 | GO:0030957 | Tat protein binding(GO:0030957) |
| 0.0 | 0.1 | GO:0008466 | glycogenin glucosyltransferase activity(GO:0008466) |
| 0.0 | 0.3 | GO:0016290 | palmitoyl-CoA hydrolase activity(GO:0016290) |
| 0.0 | 0.3 | GO:1990226 | histone methyltransferase binding(GO:1990226) |
| 0.0 | 0.4 | GO:0000774 | adenyl-nucleotide exchange factor activity(GO:0000774) |
| 0.0 | 1.2 | GO:0005544 | calcium-dependent phospholipid binding(GO:0005544) |
| 0.0 | 1.1 | GO:0004198 | calcium-dependent cysteine-type endopeptidase activity(GO:0004198) |
| 0.0 | 0.2 | GO:0004839 | ubiquitin activating enzyme activity(GO:0004839) |
| 0.0 | 0.2 | GO:0042577 | lipid phosphatase activity(GO:0042577) |
| 0.0 | 0.1 | GO:0016422 | mRNA (2'-O-methyladenosine-N6-)-methyltransferase activity(GO:0016422) |
| 0.0 | 0.1 | GO:0031962 | mineralocorticoid receptor binding(GO:0031962) |
| 0.0 | 0.8 | GO:0043015 | gamma-tubulin binding(GO:0043015) |
| 0.0 | 0.4 | GO:0008494 | translation activator activity(GO:0008494) |
| 0.0 | 4.2 | GO:0005178 | integrin binding(GO:0005178) |
| 0.0 | 0.2 | GO:0004118 | cGMP-stimulated cyclic-nucleotide phosphodiesterase activity(GO:0004118) |
| 0.0 | 0.2 | GO:0004017 | adenylate kinase activity(GO:0004017) |
| 0.0 | 0.1 | GO:0010858 | calcium-dependent protein kinase regulator activity(GO:0010858) |
| 0.0 | 0.1 | GO:0001596 | angiotensin type I receptor activity(GO:0001596) |
| 0.0 | 0.7 | GO:0005521 | lamin binding(GO:0005521) |
| 0.0 | 1.8 | GO:0004714 | transmembrane receptor protein tyrosine kinase activity(GO:0004714) |
| 0.0 | 0.1 | GO:0070735 | protein-glycine ligase activity(GO:0070735) |
| 0.0 | 1.1 | GO:0042169 | SH2 domain binding(GO:0042169) |
| 0.0 | 0.1 | GO:0055104 | ligase inhibitor activity(GO:0055104) ubiquitin ligase inhibitor activity(GO:1990948) |
| 0.0 | 0.2 | GO:0004784 | superoxide dismutase activity(GO:0004784) oxidoreductase activity, acting on superoxide radicals as acceptor(GO:0016721) |
| 0.0 | 0.3 | GO:0004653 | polypeptide N-acetylgalactosaminyltransferase activity(GO:0004653) |
| 0.0 | 0.1 | GO:0061649 | ubiquitinated histone binding(GO:0061649) |
| 0.0 | 0.7 | GO:0046875 | ephrin receptor binding(GO:0046875) |
| 0.0 | 0.2 | GO:0051434 | BH3 domain binding(GO:0051434) |
| 0.0 | 0.9 | GO:0001972 | retinoic acid binding(GO:0001972) |
| 0.0 | 0.1 | GO:0001517 | N-acetylglucosamine 6-O-sulfotransferase activity(GO:0001517) |
| 0.0 | 0.6 | GO:0017075 | syntaxin-1 binding(GO:0017075) |
| 0.0 | 0.1 | GO:0030613 | oxidoreductase activity, acting on phosphorus or arsenic in donors(GO:0030613) oxidoreductase activity, acting on phosphorus or arsenic in donors, disulfide as acceptor(GO:0030614) |
| 0.0 | 0.9 | GO:0005158 | insulin receptor binding(GO:0005158) |
| 0.0 | 0.1 | GO:0031705 | bombesin receptor binding(GO:0031705) |
| 0.0 | 1.0 | GO:0005504 | fatty acid binding(GO:0005504) |
| 0.0 | 0.3 | GO:0032036 | myosin heavy chain binding(GO:0032036) |
| 0.0 | 0.0 | GO:0004402 | histone acetyltransferase activity(GO:0004402) |
| 0.0 | 1.5 | GO:0003743 | translation initiation factor activity(GO:0003743) |
| 0.0 | 0.3 | GO:0030676 | Rac guanyl-nucleotide exchange factor activity(GO:0030676) |
| 0.0 | 0.3 | GO:0055056 | D-glucose transmembrane transporter activity(GO:0055056) |
| 0.0 | 0.4 | GO:0005337 | nucleoside transmembrane transporter activity(GO:0005337) |
| 0.0 | 0.1 | GO:0060230 | lipoprotein lipase activator activity(GO:0060230) |
| 0.0 | 0.1 | GO:0047045 | testosterone 17-beta-dehydrogenase (NADP+) activity(GO:0047045) |
| 0.0 | 0.1 | GO:0099583 | neurotransmitter receptor activity involved in regulation of postsynaptic membrane potential(GO:0099529) neurotransmitter receptor activity involved in regulation of postsynaptic cytosolic calcium ion concentration(GO:0099583) transmitter-gated ion channel activity involved in regulation of postsynaptic membrane potential(GO:1904315) |
| 0.0 | 0.1 | GO:0019784 | NEDD8-specific protease activity(GO:0019784) |
| 0.0 | 0.1 | GO:0030197 | extracellular matrix constituent, lubricant activity(GO:0030197) |
| 0.0 | 0.1 | GO:0004488 | methenyltetrahydrofolate cyclohydrolase activity(GO:0004477) methylenetetrahydrofolate dehydrogenase (NAD+) activity(GO:0004487) methylenetetrahydrofolate dehydrogenase (NADP+) activity(GO:0004488) |
| 0.0 | 0.1 | GO:0050145 | nucleoside phosphate kinase activity(GO:0050145) |
| 0.0 | 0.1 | GO:0031826 | type 2A serotonin receptor binding(GO:0031826) |
| 0.0 | 0.1 | GO:0034875 | oxidoreductase activity, acting on CH or CH2 groups, quinone or similar compound as acceptor(GO:0033695) caffeine oxidase activity(GO:0034875) |
| 0.0 | 0.1 | GO:0031433 | telethonin binding(GO:0031433) |
| 0.0 | 0.1 | GO:0004618 | phosphoglycerate kinase activity(GO:0004618) |
| 0.0 | 0.1 | GO:0032558 | adenyl deoxyribonucleotide binding(GO:0032558) dATP binding(GO:0032564) |
| 0.0 | 0.1 | GO:0001875 | lipopolysaccharide receptor activity(GO:0001875) |
| 0.0 | 0.3 | GO:0097602 | cullin family protein binding(GO:0097602) |
| 0.0 | 0.6 | GO:0001102 | RNA polymerase II activating transcription factor binding(GO:0001102) |
| 0.0 | 0.1 | GO:0004647 | phosphoserine phosphatase activity(GO:0004647) |
| 0.0 | 0.9 | GO:0004693 | cyclin-dependent protein serine/threonine kinase activity(GO:0004693) |
| 0.0 | 0.0 | GO:0034714 | type III transforming growth factor beta receptor binding(GO:0034714) |
| 0.0 | 1.0 | GO:0097110 | scaffold protein binding(GO:0097110) |
| 0.0 | 1.2 | GO:0008307 | structural constituent of muscle(GO:0008307) |
| 0.0 | 0.1 | GO:0004739 | pyruvate dehydrogenase (acetyl-transferring) activity(GO:0004739) |
| 0.0 | 0.1 | GO:0016206 | catechol O-methyltransferase activity(GO:0016206) |
| 0.0 | 0.4 | GO:0046933 | proton-transporting ATP synthase activity, rotational mechanism(GO:0046933) |
| 0.0 | 0.4 | GO:0005212 | structural constituent of eye lens(GO:0005212) |
| 0.0 | 0.1 | GO:0008479 | queuine tRNA-ribosyltransferase activity(GO:0008479) |
| 0.0 | 0.1 | GO:0045159 | myosin II binding(GO:0045159) |
| 0.0 | 0.4 | GO:0070840 | dynein complex binding(GO:0070840) |
| 0.0 | 0.2 | GO:0031402 | sodium ion binding(GO:0031402) |
| 0.0 | 0.1 | GO:0019976 | interleukin-2 receptor activity(GO:0004911) interleukin-2 binding(GO:0019976) |
| 0.0 | 0.8 | GO:0050681 | androgen receptor binding(GO:0050681) |
| 0.0 | 0.2 | GO:0047372 | acylglycerol lipase activity(GO:0047372) |
| 0.0 | 0.0 | GO:0004958 | prostaglandin F receptor activity(GO:0004958) |
| 0.0 | 0.3 | GO:0001055 | RNA polymerase II activity(GO:0001055) |
| 0.0 | 0.1 | GO:0032027 | myosin light chain binding(GO:0032027) |
| 0.0 | 0.1 | GO:0004126 | cytidine deaminase activity(GO:0004126) |
| 0.0 | 0.2 | GO:0003906 | DNA-(apurinic or apyrimidinic site) lyase activity(GO:0003906) |
| 0.0 | 0.1 | GO:0042731 | PH domain binding(GO:0042731) |
| 0.0 | 0.1 | GO:0008253 | 5'-nucleotidase activity(GO:0008253) |
| 0.0 | 0.0 | GO:0003835 | beta-galactoside alpha-2,6-sialyltransferase activity(GO:0003835) |
| 0.0 | 0.2 | GO:0045504 | dynein heavy chain binding(GO:0045504) |
| 0.0 | 0.1 | GO:0015111 | iodide transmembrane transporter activity(GO:0015111) |
| 0.0 | 0.1 | GO:0043139 | 5'-3' DNA helicase activity(GO:0043139) |
| 0.0 | 0.2 | GO:0005132 | type I interferon receptor binding(GO:0005132) |
| 0.0 | 0.1 | GO:0032356 | oxidized DNA binding(GO:0032356) |
| 0.0 | 0.2 | GO:0015929 | hexosaminidase activity(GO:0015929) |
| 0.0 | 1.7 | GO:0005539 | glycosaminoglycan binding(GO:0005539) |
| 0.0 | 0.2 | GO:0031005 | filamin binding(GO:0031005) |
| 0.0 | 0.2 | GO:0050699 | WW domain binding(GO:0050699) |
| 0.0 | 0.4 | GO:0030507 | spectrin binding(GO:0030507) |
| 0.0 | 0.1 | GO:0000987 | RNA polymerase II core promoter proximal region sequence-specific DNA binding(GO:0000978) core promoter proximal region sequence-specific DNA binding(GO:0000987) core promoter proximal region DNA binding(GO:0001159) |
| 0.0 | 0.2 | GO:0005251 | delayed rectifier potassium channel activity(GO:0005251) |
| 0.0 | 0.1 | GO:0004668 | protein-arginine deiminase activity(GO:0004668) |
| 0.0 | 1.1 | GO:0043130 | ubiquitin binding(GO:0043130) |
| 0.0 | 0.0 | GO:0052810 | 1-phosphatidylinositol-5-kinase activity(GO:0052810) |
| 0.0 | 0.0 | GO:0004531 | deoxyribonuclease II activity(GO:0004531) |
| 0.0 | 0.1 | GO:0032393 | MHC class I receptor activity(GO:0032393) |
| 0.0 | 0.2 | GO:0070628 | proteasome binding(GO:0070628) |
| 0.0 | 0.3 | GO:0000146 | microfilament motor activity(GO:0000146) |
Gene overrepresentation in C2:CP:REACTOME category:
| Log-likelihood per target | Total log-likelihood | Term | Description |
|---|---|---|---|
| 0.2 | 10.3 | REACTOME MYOGENESIS | Genes involved in Myogenesis |
| 0.1 | 2.6 | REACTOME GAP JUNCTION DEGRADATION | Genes involved in Gap junction degradation |
| 0.1 | 3.4 | REACTOME CYTOSOLIC SULFONATION OF SMALL MOLECULES | Genes involved in Cytosolic sulfonation of small molecules |
| 0.1 | 6.4 | REACTOME PHASE II CONJUGATION | Genes involved in Phase II conjugation |
| 0.1 | 2.7 | REACTOME DEGRADATION OF THE EXTRACELLULAR MATRIX | Genes involved in Degradation of the extracellular matrix |
| 0.1 | 0.6 | REACTOME MEMBRANE BINDING AND TARGETTING OF GAG PROTEINS | Genes involved in Membrane binding and targetting of GAG proteins |
| 0.1 | 1.8 | REACTOME CS DS DEGRADATION | Genes involved in CS/DS degradation |
| 0.1 | 1.7 | REACTOME CRMPS IN SEMA3A SIGNALING | Genes involved in CRMPs in Sema3A signaling |
| 0.1 | 2.1 | REACTOME PEROXISOMAL LIPID METABOLISM | Genes involved in Peroxisomal lipid metabolism |
| 0.1 | 4.7 | REACTOME FORMATION OF THE TERNARY COMPLEX AND SUBSEQUENTLY THE 43S COMPLEX | Genes involved in Formation of the ternary complex, and subsequently, the 43S complex |
| 0.1 | 0.1 | REACTOME RIP MEDIATED NFKB ACTIVATION VIA DAI | Genes involved in RIP-mediated NFkB activation via DAI |
| 0.1 | 1.3 | REACTOME G BETA GAMMA SIGNALLING THROUGH PLC BETA | Genes involved in G beta:gamma signalling through PLC beta |
| 0.1 | 1.8 | REACTOME RNA POL III TRANSCRIPTION TERMINATION | Genes involved in RNA Polymerase III Transcription Termination |
| 0.1 | 3.4 | REACTOME SMOOTH MUSCLE CONTRACTION | Genes involved in Smooth Muscle Contraction |
| 0.1 | 1.1 | REACTOME SIGNAL ATTENUATION | Genes involved in Signal attenuation |
| 0.1 | 0.6 | REACTOME COMMON PATHWAY | Genes involved in Common Pathway |
| 0.1 | 1.1 | REACTOME PRE NOTCH PROCESSING IN GOLGI | Genes involved in Pre-NOTCH Processing in Golgi |
| 0.0 | 1.4 | REACTOME HORMONE SENSITIVE LIPASE HSL MEDIATED TRIACYLGLYCEROL HYDROLYSIS | Genes involved in Hormone-sensitive lipase (HSL)-mediated triacylglycerol hydrolysis |
| 0.0 | 0.9 | REACTOME TRANSCRIPTIONAL REGULATION OF WHITE ADIPOCYTE DIFFERENTIATION | Genes involved in Transcriptional Regulation of White Adipocyte Differentiation |
| 0.0 | 0.6 | REACTOME DCC MEDIATED ATTRACTIVE SIGNALING | Genes involved in DCC mediated attractive signaling |
| 0.0 | 1.2 | REACTOME TRAF6 MEDIATED NFKB ACTIVATION | Genes involved in TRAF6 mediated NF-kB activation |
| 0.0 | 0.5 | REACTOME ROLE OF DCC IN REGULATING APOPTOSIS | Genes involved in Role of DCC in regulating apoptosis |
| 0.0 | 0.6 | REACTOME ACYL CHAIN REMODELLING OF PS | Genes involved in Acyl chain remodelling of PS |
| 0.0 | 1.0 | REACTOME EXTRINSIC PATHWAY FOR APOPTOSIS | Genes involved in Extrinsic Pathway for Apoptosis |
| 0.0 | 0.8 | REACTOME TIE2 SIGNALING | Genes involved in Tie2 Signaling |
| 0.0 | 0.4 | REACTOME TRAF6 MEDIATED INDUCTION OF TAK1 COMPLEX | Genes involved in TRAF6 mediated induction of TAK1 complex |
| 0.0 | 4.2 | REACTOME INTEGRIN CELL SURFACE INTERACTIONS | Genes involved in Integrin cell surface interactions |
| 0.0 | 0.6 | REACTOME P38MAPK EVENTS | Genes involved in p38MAPK events |
| 0.0 | 1.0 | REACTOME CASPASE MEDIATED CLEAVAGE OF CYTOSKELETAL PROTEINS | Genes involved in Caspase-mediated cleavage of cytoskeletal proteins |
| 0.0 | 0.3 | REACTOME SYNTHESIS OF PIPS AT THE LATE ENDOSOME MEMBRANE | Genes involved in Synthesis of PIPs at the late endosome membrane |
| 0.0 | 0.8 | REACTOME CELL EXTRACELLULAR MATRIX INTERACTIONS | Genes involved in Cell-extracellular matrix interactions |
| 0.0 | 0.5 | REACTOME SIGNALLING TO P38 VIA RIT AND RIN | Genes involved in Signalling to p38 via RIT and RIN |
| 0.0 | 0.9 | REACTOME SIGNALING BY FGFR1 FUSION MUTANTS | Genes involved in Signaling by FGFR1 fusion mutants |
| 0.0 | 0.5 | REACTOME PEPTIDE HORMONE BIOSYNTHESIS | Genes involved in Peptide hormone biosynthesis |
| 0.0 | 0.1 | REACTOME VIF MEDIATED DEGRADATION OF APOBEC3G | Genes involved in Vif-mediated degradation of APOBEC3G |
| 0.0 | 3.0 | REACTOME RESPONSE TO ELEVATED PLATELET CYTOSOLIC CA2 | Genes involved in Response to elevated platelet cytosolic Ca2+ |
| 0.0 | 0.6 | REACTOME AMINE DERIVED HORMONES | Genes involved in Amine-derived hormones |
| 0.0 | 3.2 | REACTOME PPARA ACTIVATES GENE EXPRESSION | Genes involved in PPARA Activates Gene Expression |
| 0.0 | 0.1 | REACTOME PEPTIDE CHAIN ELONGATION | Genes involved in Peptide chain elongation |
| 0.0 | 0.5 | REACTOME REGULATION OF INSULIN LIKE GROWTH FACTOR IGF ACTIVITY BY INSULIN LIKE GROWTH FACTOR BINDING PROTEINS IGFBPS | Genes involved in Regulation of Insulin-like Growth Factor (IGF) Activity by Insulin-like Growth Factor Binding Proteins (IGFBPs) |
| 0.0 | 0.1 | REACTOME SEMA3A PLEXIN REPULSION SIGNALING BY INHIBITING INTEGRIN ADHESION | Genes involved in SEMA3A-Plexin repulsion signaling by inhibiting Integrin adhesion |
| 0.0 | 0.3 | REACTOME VIRAL MESSENGER RNA SYNTHESIS | Genes involved in Viral Messenger RNA Synthesis |
| 0.0 | 0.6 | REACTOME REGULATION OF GENE EXPRESSION IN BETA CELLS | Genes involved in Regulation of gene expression in beta cells |
| 0.0 | 0.6 | REACTOME ANTIGEN PRESENTATION FOLDING ASSEMBLY AND PEPTIDE LOADING OF CLASS I MHC | Genes involved in Antigen Presentation: Folding, assembly and peptide loading of class I MHC |
| 0.0 | 0.2 | REACTOME ASSOCIATION OF TRIC CCT WITH TARGET PROTEINS DURING BIOSYNTHESIS | Genes involved in Association of TriC/CCT with target proteins during biosynthesis |
| 0.0 | 0.1 | REACTOME NEPHRIN INTERACTIONS | Genes involved in Nephrin interactions |
| 0.0 | 0.3 | REACTOME HYALURONAN METABOLISM | Genes involved in Hyaluronan metabolism |
| 0.0 | 0.2 | REACTOME SIGNALING BY FGFR3 MUTANTS | Genes involved in Signaling by FGFR3 mutants |
| 0.0 | 0.4 | REACTOME REGULATION OF COMPLEMENT CASCADE | Genes involved in Regulation of Complement cascade |
| 0.0 | 0.1 | REACTOME SYNTHESIS OF BILE ACIDS AND BILE SALTS VIA 24 HYDROXYCHOLESTEROL | Genes involved in Synthesis of bile acids and bile salts via 24-hydroxycholesterol |
| 0.0 | 0.2 | REACTOME COPI MEDIATED TRANSPORT | Genes involved in COPI Mediated Transport |
| 0.0 | 0.4 | REACTOME SIGNALING BY NODAL | Genes involved in Signaling by NODAL |
| 0.0 | 0.3 | REACTOME CREB PHOSPHORYLATION THROUGH THE ACTIVATION OF CAMKII | Genes involved in CREB phosphorylation through the activation of CaMKII |
| 0.0 | 0.3 | REACTOME N GLYCAN ANTENNAE ELONGATION | Genes involved in N-Glycan antennae elongation |
| 0.0 | 0.1 | REACTOME RETROGRADE NEUROTROPHIN SIGNALLING | Genes involved in Retrograde neurotrophin signalling |
| 0.0 | 0.3 | REACTOME PROLACTIN RECEPTOR SIGNALING | Genes involved in Prolactin receptor signaling |
| 0.0 | 0.3 | REACTOME ACTIVATION OF BH3 ONLY PROTEINS | Genes involved in Activation of BH3-only proteins |
| 0.0 | 0.2 | REACTOME INTRINSIC PATHWAY FOR APOPTOSIS | Genes involved in Intrinsic Pathway for Apoptosis |
| 0.0 | 0.1 | REACTOME ANDROGEN BIOSYNTHESIS | Genes involved in Androgen biosynthesis |
| 0.0 | 0.2 | REACTOME TRAF6 MEDIATED IRF7 ACTIVATION | Genes involved in TRAF6 mediated IRF7 activation |
| 0.0 | 0.1 | REACTOME PROSTANOID LIGAND RECEPTORS | Genes involved in Prostanoid ligand receptors |
| 0.0 | 0.3 | REACTOME REGULATION OF IFNA SIGNALING | Genes involved in Regulation of IFNA signaling |
| 0.0 | 0.3 | REACTOME CYCLIN A B1 ASSOCIATED EVENTS DURING G2 M TRANSITION | Genes involved in Cyclin A/B1 associated events during G2/M transition |
| 0.0 | 0.3 | REACTOME KINESINS | Genes involved in Kinesins |
| 0.0 | 0.2 | REACTOME SYNTHESIS OF SUBSTRATES IN N GLYCAN BIOSYTHESIS | Genes involved in Synthesis of substrates in N-glycan biosythesis |
| 0.0 | 0.1 | REACTOME CHONDROITIN SULFATE BIOSYNTHESIS | Genes involved in Chondroitin sulfate biosynthesis |