Project
ENCODE cell lines, expression (Ernst 2011)
Navigation
Downloads
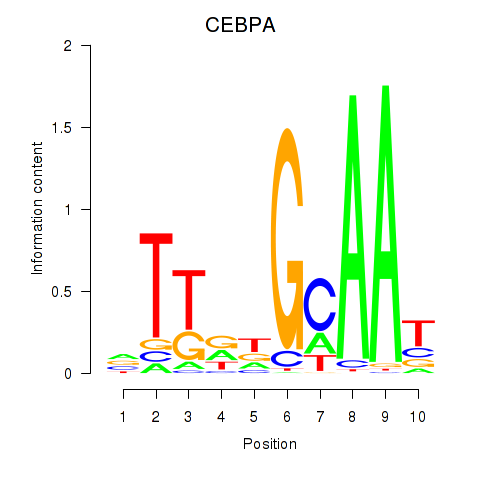
Results for CEBPA
Z-value: 0.81
Motif logo
Transcription factors associated with CEBPA
| Gene Symbol | Gene ID | Gene Info |
|---|---|---|
|
CEBPA
|
ENSG00000245848.2 | CEBPA |
Activity-expression correlation:
| Gene | Promoter | Pearson corr. coef. | P-value | Plot |
|---|---|---|---|---|
| CEBPA | hg19_v2_chr19_-_33793430_33793470 | 0.65 | 6.9e-03 | Click! |
Activity profile of CEBPA motif
Sorted Z-values of CEBPA motif
Network of associatons between targets according to the STRING database.

First level regulatory network of CEBPA
| Promoter | Score | Transcript | Gene | Gene Info |
|---|---|---|---|---|
| chr12_+_69742121 | 3.19 |
ENST00000261267.2 ENST00000549690.1 ENST00000548839.1 |
LYZ |
lysozyme |
| chr4_-_155533787 | 2.61 |
ENST00000407946.1 ENST00000405164.1 ENST00000336098.3 ENST00000393846.2 ENST00000404648.3 ENST00000443553.1 |
FGG |
fibrinogen gamma chain |
| chr3_-_148939835 | 2.35 |
ENST00000264613.6 |
CP |
ceruloplasmin (ferroxidase) |
| chr19_-_6720686 | 2.34 |
ENST00000245907.6 |
C3 |
complement component 3 |
| chr17_-_7018128 | 2.29 |
ENST00000380952.2 ENST00000254850.7 |
ASGR2 |
asialoglycoprotein receptor 2 |
| chr17_-_7017968 | 2.27 |
ENST00000355035.5 |
ASGR2 |
asialoglycoprotein receptor 2 |
| chr16_+_72088376 | 2.02 |
ENST00000570083.1 ENST00000355906.5 ENST00000398131.2 ENST00000569639.1 ENST00000564499.1 ENST00000357763.4 ENST00000562526.1 ENST00000565574.1 ENST00000568417.2 ENST00000356967.5 |
HP HPR |
haptoglobin haptoglobin-related protein |
| chr19_-_48389651 | 1.95 |
ENST00000222002.3 |
SULT2A1 |
sulfotransferase family, cytosolic, 2A, dehydroepiandrosterone (DHEA)-preferring, member 1 |
| chr14_+_95078714 | 1.87 |
ENST00000393078.3 ENST00000393080.4 ENST00000467132.1 |
SERPINA3 |
serpin peptidase inhibitor, clade A (alpha-1 antiproteinase, antitrypsin), member 3 |
| chr2_-_21266935 | 1.81 |
ENST00000233242.1 |
APOB |
apolipoprotein B |
| chr3_+_186330712 | 1.78 |
ENST00000411641.2 ENST00000273784.5 |
AHSG |
alpha-2-HS-glycoprotein |
| chr10_+_5005598 | 1.50 |
ENST00000442997.1 |
AKR1C1 |
aldo-keto reductase family 1, member C1 |
| chr10_+_5005445 | 1.45 |
ENST00000380872.4 |
AKR1C1 |
aldo-keto reductase family 1, member C1 |
| chr12_-_123201337 | 1.38 |
ENST00000528880.2 |
HCAR3 |
hydroxycarboxylic acid receptor 3 |
| chr17_+_27369918 | 1.35 |
ENST00000323372.4 |
PIPOX |
pipecolic acid oxidase |
| chr6_+_31895480 | 1.33 |
ENST00000418949.2 ENST00000383177.3 ENST00000477310.1 |
C2 CFB |
complement component 2 Complement factor B; Uncharacterized protein; cDNA FLJ55673, highly similar to Complement factor B |
| chr6_+_31895467 | 1.33 |
ENST00000556679.1 ENST00000456570.1 |
CFB CFB |
complement factor B Complement factor B; Uncharacterized protein; cDNA FLJ55673, highly similar to Complement factor B |
| chr17_+_72427477 | 1.29 |
ENST00000342648.5 ENST00000481232.1 |
GPRC5C |
G protein-coupled receptor, family C, group 5, member C |
| chr13_-_46679185 | 1.29 |
ENST00000439329.3 |
CPB2 |
carboxypeptidase B2 (plasma) |
| chr13_-_46679144 | 1.28 |
ENST00000181383.4 |
CPB2 |
carboxypeptidase B2 (plasma) |
| chr2_+_228678550 | 1.28 |
ENST00000409189.3 ENST00000358813.4 |
CCL20 |
chemokine (C-C motif) ligand 20 |
| chr17_+_72426891 | 1.27 |
ENST00000392627.1 |
GPRC5C |
G protein-coupled receptor, family C, group 5, member C |
| chr4_+_74301880 | 1.25 |
ENST00000395792.2 ENST00000226359.2 |
AFP |
alpha-fetoprotein |
| chr20_+_34802295 | 1.23 |
ENST00000432603.1 |
EPB41L1 |
erythrocyte membrane protein band 4.1-like 1 |
| chr6_+_31895254 | 1.20 |
ENST00000299367.5 ENST00000442278.2 |
C2 |
complement component 2 |
| chr11_-_18258342 | 1.14 |
ENST00000278222.4 |
SAA4 |
serum amyloid A4, constitutive |
| chr12_-_123187890 | 1.08 |
ENST00000328880.5 |
HCAR2 |
hydroxycarboxylic acid receptor 2 |
| chr20_+_56136136 | 1.02 |
ENST00000319441.4 ENST00000543666.1 |
PCK1 |
phosphoenolpyruvate carboxykinase 1 (soluble) |
| chr16_+_82090028 | 1.01 |
ENST00000568090.1 |
HSD17B2 |
hydroxysteroid (17-beta) dehydrogenase 2 |
| chr3_-_49726486 | 0.99 |
ENST00000449682.2 |
MST1 |
macrophage stimulating 1 (hepatocyte growth factor-like) |
| chr16_-_55866997 | 0.98 |
ENST00000360526.3 ENST00000361503.4 |
CES1 |
carboxylesterase 1 |
| chr11_+_116700614 | 0.96 |
ENST00000375345.1 |
APOC3 |
apolipoprotein C-III |
| chr11_+_116700600 | 0.95 |
ENST00000227667.3 |
APOC3 |
apolipoprotein C-III |
| chr4_-_10023095 | 0.94 |
ENST00000264784.3 |
SLC2A9 |
solute carrier family 2 (facilitated glucose transporter), member 9 |
| chr10_+_114133773 | 0.93 |
ENST00000354655.4 |
ACSL5 |
acyl-CoA synthetase long-chain family member 5 |
| chr2_-_99279928 | 0.92 |
ENST00000414521.2 |
MGAT4A |
mannosyl (alpha-1,3-)-glycoprotein beta-1,4-N-acetylglucosaminyltransferase, isozyme A |
| chr11_+_22689648 | 0.92 |
ENST00000278187.3 |
GAS2 |
growth arrest-specific 2 |
| chrX_-_131623982 | 0.88 |
ENST00000370844.1 |
MBNL3 |
muscleblind-like splicing regulator 3 |
| chr1_+_169079823 | 0.86 |
ENST00000367813.3 |
ATP1B1 |
ATPase, Na+/K+ transporting, beta 1 polypeptide |
| chr2_+_128177458 | 0.86 |
ENST00000409048.1 ENST00000422777.3 |
PROC |
protein C (inactivator of coagulation factors Va and VIIIa) |
| chr12_+_100897130 | 0.80 |
ENST00000551379.1 ENST00000188403.7 ENST00000551184.1 |
NR1H4 |
nuclear receptor subfamily 1, group H, member 4 |
| chr19_-_4540486 | 0.79 |
ENST00000306390.6 |
LRG1 |
leucine-rich alpha-2-glycoprotein 1 |
| chrX_-_131623874 | 0.74 |
ENST00000436215.1 |
MBNL3 |
muscleblind-like splicing regulator 3 |
| chr4_+_184020398 | 0.74 |
ENST00000403733.3 ENST00000378925.3 |
WWC2 |
WW and C2 domain containing 2 |
| chr9_+_130911770 | 0.71 |
ENST00000372998.1 |
LCN2 |
lipocalin 2 |
| chr10_-_116444371 | 0.71 |
ENST00000533213.2 ENST00000369252.4 |
ABLIM1 |
actin binding LIM protein 1 |
| chr21_+_34775181 | 0.70 |
ENST00000290219.6 |
IFNGR2 |
interferon gamma receptor 2 (interferon gamma transducer 1) |
| chr20_-_43883197 | 0.70 |
ENST00000338380.2 |
SLPI |
secretory leukocyte peptidase inhibitor |
| chr12_+_21207503 | 0.69 |
ENST00000545916.1 |
SLCO1B7 |
solute carrier organic anion transporter family, member 1B7 (non-functional) |
| chr9_+_130911723 | 0.69 |
ENST00000277480.2 ENST00000373013.2 ENST00000540948.1 |
LCN2 |
lipocalin 2 |
| chr6_-_53409890 | 0.68 |
ENST00000229416.6 |
GCLC |
glutamate-cysteine ligase, catalytic subunit |
| chr11_+_22696314 | 0.67 |
ENST00000532398.1 ENST00000433790.1 |
GAS2 |
growth arrest-specific 2 |
| chr17_+_2699697 | 0.66 |
ENST00000254695.8 ENST00000366401.4 ENST00000542807.1 |
RAP1GAP2 |
RAP1 GTPase activating protein 2 |
| chr12_+_19358228 | 0.63 |
ENST00000424268.1 ENST00000543806.1 |
PLEKHA5 |
pleckstrin homology domain containing, family A member 5 |
| chr12_-_71551652 | 0.62 |
ENST00000546561.1 |
TSPAN8 |
tetraspanin 8 |
| chr3_-_194072019 | 0.61 |
ENST00000429275.1 ENST00000323830.3 |
CPN2 |
carboxypeptidase N, polypeptide 2 |
| chr17_-_76124711 | 0.58 |
ENST00000306591.7 ENST00000590602.1 |
TMC6 |
transmembrane channel-like 6 |
| chr19_+_11350278 | 0.57 |
ENST00000252453.8 |
C19orf80 |
chromosome 19 open reading frame 80 |
| chr2_-_113594279 | 0.57 |
ENST00000416750.1 ENST00000418817.1 ENST00000263341.2 |
IL1B |
interleukin 1, beta |
| chr2_+_102608306 | 0.55 |
ENST00000332549.3 |
IL1R2 |
interleukin 1 receptor, type II |
| chr3_+_124303472 | 0.54 |
ENST00000291478.5 |
KALRN |
kalirin, RhoGEF kinase |
| chr3_-_47517302 | 0.54 |
ENST00000441517.2 ENST00000545718.1 |
SCAP |
SREBF chaperone |
| chr2_+_234590556 | 0.54 |
ENST00000373426.3 |
UGT1A7 |
UDP glucuronosyltransferase 1 family, polypeptide A7 |
| chr1_+_207277590 | 0.54 |
ENST00000367070.3 |
C4BPA |
complement component 4 binding protein, alpha |
| chrX_-_20236970 | 0.53 |
ENST00000379548.4 |
RPS6KA3 |
ribosomal protein S6 kinase, 90kDa, polypeptide 3 |
| chrX_+_46937745 | 0.52 |
ENST00000397180.1 ENST00000457380.1 ENST00000352078.4 |
RGN |
regucalcin |
| chr1_+_93913713 | 0.52 |
ENST00000604705.1 ENST00000370253.2 |
FNBP1L |
formin binding protein 1-like |
| chr1_+_93913665 | 0.51 |
ENST00000271234.7 ENST00000370256.4 ENST00000260506.8 |
FNBP1L |
formin binding protein 1-like |
| chr10_-_45474237 | 0.50 |
ENST00000448778.1 ENST00000298295.3 |
C10orf10 |
chromosome 10 open reading frame 10 |
| chr17_-_76124812 | 0.49 |
ENST00000592063.1 ENST00000589271.1 ENST00000322933.4 ENST00000589553.1 |
TMC6 |
transmembrane channel-like 6 |
| chr12_-_96390063 | 0.49 |
ENST00000541929.1 |
HAL |
histidine ammonia-lyase |
| chr2_-_166930131 | 0.47 |
ENST00000303395.4 ENST00000409050.1 ENST00000423058.2 ENST00000375405.3 |
SCN1A |
sodium channel, voltage-gated, type I, alpha subunit |
| chr17_-_34308524 | 0.47 |
ENST00000293275.3 |
CCL16 |
chemokine (C-C motif) ligand 16 |
| chr12_-_71551868 | 0.46 |
ENST00000247829.3 |
TSPAN8 |
tetraspanin 8 |
| chr8_+_97597148 | 0.46 |
ENST00000521590.1 |
SDC2 |
syndecan 2 |
| chr2_+_143635067 | 0.45 |
ENST00000264170.4 |
KYNU |
kynureninase |
| chr12_-_96390108 | 0.45 |
ENST00000538703.1 ENST00000261208.3 |
HAL |
histidine ammonia-lyase |
| chr6_+_30848557 | 0.45 |
ENST00000460944.2 ENST00000324771.8 |
DDR1 |
discoidin domain receptor tyrosine kinase 1 |
| chr10_+_114710516 | 0.44 |
ENST00000542695.1 ENST00000346198.4 |
TCF7L2 |
transcription factor 7-like 2 (T-cell specific, HMG-box) |
| chr18_-_28622774 | 0.44 |
ENST00000434452.1 |
DSC3 |
desmocollin 3 |
| chr2_-_43453734 | 0.42 |
ENST00000282388.3 |
ZFP36L2 |
ZFP36 ring finger protein-like 2 |
| chr16_+_8814563 | 0.42 |
ENST00000425191.2 ENST00000569156.1 |
ABAT |
4-aminobutyrate aminotransferase |
| chr20_+_25388293 | 0.40 |
ENST00000262460.4 ENST00000429262.2 |
GINS1 |
GINS complex subunit 1 (Psf1 homolog) |
| chr6_+_167704798 | 0.40 |
ENST00000230256.3 |
UNC93A |
unc-93 homolog A (C. elegans) |
| chr13_+_78109804 | 0.40 |
ENST00000535157.1 |
SCEL |
sciellin |
| chr13_+_78109884 | 0.39 |
ENST00000377246.3 ENST00000349847.3 |
SCEL |
sciellin |
| chr2_+_234580525 | 0.39 |
ENST00000609637.1 |
UGT1A1 |
UDP glucuronosyltransferase 1 family, polypeptide A8 |
| chr7_-_100239132 | 0.39 |
ENST00000223051.3 ENST00000431692.1 |
TFR2 |
transferrin receptor 2 |
| chr18_-_28622699 | 0.39 |
ENST00000360428.4 |
DSC3 |
desmocollin 3 |
| chr2_+_234580499 | 0.39 |
ENST00000354728.4 |
UGT1A9 |
UDP glucuronosyltransferase 1 family, polypeptide A9 |
| chr12_+_21168630 | 0.38 |
ENST00000421593.2 |
SLCO1B7 |
solute carrier organic anion transporter family, member 1B7 (non-functional) |
| chr3_+_124303539 | 0.38 |
ENST00000428018.2 |
KALRN |
kalirin, RhoGEF kinase |
| chr7_+_1126437 | 0.37 |
ENST00000413368.1 ENST00000397092.1 |
GPER1 |
G protein-coupled estrogen receptor 1 |
| chr4_-_186732048 | 0.37 |
ENST00000448662.2 ENST00000439049.1 ENST00000420158.1 ENST00000431808.1 ENST00000319471.9 |
SORBS2 |
sorbin and SH3 domain containing 2 |
| chr7_-_56101826 | 0.37 |
ENST00000421626.1 |
PSPH |
phosphoserine phosphatase |
| chr1_+_52682052 | 0.36 |
ENST00000371591.1 |
ZFYVE9 |
zinc finger, FYVE domain containing 9 |
| chr17_-_74350230 | 0.35 |
ENST00000446526.3 ENST00000324684.4 |
PRPSAP1 |
phosphoribosyl pyrophosphate synthetase-associated protein 1 |
| chr9_-_99382065 | 0.35 |
ENST00000265659.2 ENST00000375241.1 ENST00000375236.1 |
CDC14B |
cell division cycle 14B |
| chr1_+_229440129 | 0.34 |
ENST00000366688.3 |
SPHAR |
S-phase response (cyclin related) |
| chr7_+_26191809 | 0.34 |
ENST00000056233.3 |
NFE2L3 |
nuclear factor, erythroid 2-like 3 |
| chr6_+_167704838 | 0.34 |
ENST00000366829.2 |
UNC93A |
unc-93 homolog A (C. elegans) |
| chr12_-_10251539 | 0.33 |
ENST00000420265.2 |
CLEC1A |
C-type lectin domain family 1, member A |
| chr4_-_186877502 | 0.33 |
ENST00000431902.1 ENST00000284776.7 ENST00000415274.1 |
SORBS2 |
sorbin and SH3 domain containing 2 |
| chr2_+_234545092 | 0.32 |
ENST00000344644.5 |
UGT1A10 |
UDP glucuronosyltransferase 1 family, polypeptide A10 |
| chr7_+_1126461 | 0.32 |
ENST00000297469.3 |
GPER1 |
G protein-coupled estrogen receptor 1 |
| chr1_-_231560790 | 0.32 |
ENST00000366641.3 |
EGLN1 |
egl-9 family hypoxia-inducible factor 1 |
| chr11_-_10590118 | 0.32 |
ENST00000529598.1 |
LYVE1 |
lymphatic vessel endothelial hyaluronan receptor 1 |
| chr1_-_153029980 | 0.32 |
ENST00000392653.2 |
SPRR2A |
small proline-rich protein 2A |
| chr18_-_19283649 | 0.32 |
ENST00000584464.1 ENST00000578270.1 |
ABHD3 |
abhydrolase domain containing 3 |
| chr3_+_118892362 | 0.32 |
ENST00000497685.1 ENST00000264234.3 |
UPK1B |
uroplakin 1B |
| chr19_+_33865218 | 0.31 |
ENST00000585933.2 |
CEBPG |
CCAAT/enhancer binding protein (C/EBP), gamma |
| chr1_-_147142557 | 0.31 |
ENST00000369238.6 |
ACP6 |
acid phosphatase 6, lysophosphatidic |
| chr12_-_10251603 | 0.30 |
ENST00000457018.2 |
CLEC1A |
C-type lectin domain family 1, member A |
| chr19_+_56652556 | 0.30 |
ENST00000337080.3 |
ZNF444 |
zinc finger protein 444 |
| chr12_-_53074182 | 0.30 |
ENST00000252244.3 |
KRT1 |
keratin 1 |
| chr2_-_112614424 | 0.30 |
ENST00000427997.1 |
ANAPC1 |
anaphase promoting complex subunit 1 |
| chr11_+_7597639 | 0.30 |
ENST00000533792.1 |
PPFIBP2 |
PTPRF interacting protein, binding protein 2 (liprin beta 2) |
| chr16_+_2588012 | 0.29 |
ENST00000354836.5 ENST00000389224.3 |
PDPK1 |
3-phosphoinositide dependent protein kinase-1 |
| chr4_+_75230853 | 0.29 |
ENST00000244869.2 |
EREG |
epiregulin |
| chr15_-_42840961 | 0.29 |
ENST00000563454.1 ENST00000397130.3 ENST00000570160.1 ENST00000323443.2 |
LRRC57 |
leucine rich repeat containing 57 |
| chrX_+_49644470 | 0.29 |
ENST00000508866.2 |
USP27X |
ubiquitin specific peptidase 27, X-linked |
| chr6_+_126240442 | 0.29 |
ENST00000448104.1 ENST00000438495.1 ENST00000444128.1 |
NCOA7 |
nuclear receptor coactivator 7 |
| chr1_-_173020056 | 0.28 |
ENST00000239468.2 ENST00000404377.3 |
TNFSF18 |
tumor necrosis factor (ligand) superfamily, member 18 |
| chr2_+_163200598 | 0.28 |
ENST00000437150.2 ENST00000453113.2 |
GCA |
grancalcin, EF-hand calcium binding protein |
| chr1_-_67142710 | 0.28 |
ENST00000502413.2 |
AL139147.1 |
Uncharacterized protein |
| chr7_+_138482695 | 0.28 |
ENST00000422794.2 ENST00000397602.3 ENST00000442682.2 ENST00000458494.1 ENST00000413208.1 |
TMEM213 |
transmembrane protein 213 |
| chr14_+_39703084 | 0.27 |
ENST00000553728.1 |
RP11-407N17.3 |
cTAGE family member 5 isoform 4 |
| chr3_+_12392971 | 0.27 |
ENST00000287820.6 |
PPARG |
peroxisome proliferator-activated receptor gamma |
| chr17_-_79895154 | 0.27 |
ENST00000405481.4 ENST00000585215.1 ENST00000577624.1 ENST00000403172.4 |
PYCR1 |
pyrroline-5-carboxylate reductase 1 |
| chrX_-_110654147 | 0.27 |
ENST00000358070.4 |
DCX |
doublecortin |
| chr12_-_10251576 | 0.26 |
ENST00000315330.4 |
CLEC1A |
C-type lectin domain family 1, member A |
| chr1_+_57320437 | 0.26 |
ENST00000361249.3 |
C8A |
complement component 8, alpha polypeptide |
| chr18_-_61329118 | 0.26 |
ENST00000332821.8 ENST00000283752.5 |
SERPINB3 |
serpin peptidase inhibitor, clade B (ovalbumin), member 3 |
| chr1_+_117544366 | 0.26 |
ENST00000256652.4 ENST00000369470.1 |
CD101 |
CD101 molecule |
| chr2_+_90060377 | 0.26 |
ENST00000436451.2 |
IGKV6D-21 |
immunoglobulin kappa variable 6D-21 (non-functional) |
| chr19_-_17375541 | 0.25 |
ENST00000252597.3 |
USHBP1 |
Usher syndrome 1C binding protein 1 |
| chr16_-_58585513 | 0.25 |
ENST00000245138.4 ENST00000567285.1 |
CNOT1 |
CCR4-NOT transcription complex, subunit 1 |
| chr1_-_152297679 | 0.25 |
ENST00000368799.1 |
FLG |
filaggrin |
| chr6_-_30043539 | 0.25 |
ENST00000376751.3 ENST00000244360.6 |
RNF39 |
ring finger protein 39 |
| chr17_-_38859996 | 0.24 |
ENST00000264651.2 |
KRT24 |
keratin 24 |
| chr18_-_32924372 | 0.24 |
ENST00000261332.6 ENST00000399061.3 |
ZNF24 |
zinc finger protein 24 |
| chr22_+_40573921 | 0.24 |
ENST00000454349.2 ENST00000335727.9 |
TNRC6B |
trinucleotide repeat containing 6B |
| chr1_+_152486950 | 0.24 |
ENST00000368790.3 |
CRCT1 |
cysteine-rich C-terminal 1 |
| chr3_+_186435137 | 0.24 |
ENST00000447445.1 |
KNG1 |
kininogen 1 |
| chr20_+_1099233 | 0.24 |
ENST00000246015.4 ENST00000335877.6 ENST00000438768.2 |
PSMF1 |
proteasome (prosome, macropain) inhibitor subunit 1 (PI31) |
| chr19_-_46272462 | 0.23 |
ENST00000317578.6 |
SIX5 |
SIX homeobox 5 |
| chr2_+_143635222 | 0.23 |
ENST00000375773.2 ENST00000409512.1 ENST00000410015.2 |
KYNU |
kynureninase |
| chr17_-_79895097 | 0.23 |
ENST00000402252.2 ENST00000583564.1 ENST00000585244.1 ENST00000337943.5 ENST00000579698.1 |
PYCR1 |
pyrroline-5-carboxylate reductase 1 |
| chr8_+_119294456 | 0.23 |
ENST00000366457.2 |
AC023590.1 |
Uncharacterized protein |
| chr7_-_15601595 | 0.23 |
ENST00000342526.3 |
AGMO |
alkylglycerol monooxygenase |
| chr6_+_126102292 | 0.23 |
ENST00000368357.3 |
NCOA7 |
nuclear receptor coactivator 7 |
| chr1_-_67519782 | 0.22 |
ENST00000235345.5 |
SLC35D1 |
solute carrier family 35 (UDP-GlcA/UDP-GalNAc transporter), member D1 |
| chr17_+_1665253 | 0.22 |
ENST00000254722.4 |
SERPINF1 |
serpin peptidase inhibitor, clade F (alpha-2 antiplasmin, pigment epithelium derived factor), member 1 |
| chr16_-_21436459 | 0.22 |
ENST00000448012.2 ENST00000504841.2 ENST00000419180.2 |
NPIPB3 |
nuclear pore complex interacting protein family, member B3 |
| chr4_-_139163491 | 0.22 |
ENST00000280612.5 |
SLC7A11 |
solute carrier family 7 (anionic amino acid transporter light chain, xc- system), member 11 |
| chr1_+_110162448 | 0.22 |
ENST00000342115.4 ENST00000469039.2 ENST00000474459.1 ENST00000528667.1 |
AMPD2 |
adenosine monophosphate deaminase 2 |
| chr2_+_102721023 | 0.22 |
ENST00000409589.1 ENST00000409329.1 |
IL1R1 |
interleukin 1 receptor, type I |
| chr3_+_118905564 | 0.22 |
ENST00000460625.1 |
UPK1B |
uroplakin 1B |
| chr1_+_12524965 | 0.22 |
ENST00000471923.1 |
VPS13D |
vacuolar protein sorting 13 homolog D (S. cerevisiae) |
| chr2_+_223289208 | 0.21 |
ENST00000321276.7 |
SGPP2 |
sphingosine-1-phosphate phosphatase 2 |
| chr3_-_66551397 | 0.21 |
ENST00000383703.3 |
LRIG1 |
leucine-rich repeats and immunoglobulin-like domains 1 |
| chr18_+_18943554 | 0.21 |
ENST00000580732.2 |
GREB1L |
growth regulation by estrogen in breast cancer-like |
| chr2_-_239197238 | 0.21 |
ENST00000254657.3 |
PER2 |
period circadian clock 2 |
| chr2_+_234545148 | 0.21 |
ENST00000373445.1 |
UGT1A10 |
UDP glucuronosyltransferase 1 family, polypeptide A10 |
| chr12_-_46662772 | 0.20 |
ENST00000549049.1 ENST00000439706.1 ENST00000398637.5 |
SLC38A1 |
solute carrier family 38, member 1 |
| chr20_+_32150140 | 0.20 |
ENST00000344201.3 ENST00000346541.3 ENST00000397800.1 ENST00000397798.2 ENST00000492345.1 |
CBFA2T2 |
core-binding factor, runt domain, alpha subunit 2; translocated to, 2 |
| chr15_-_74501310 | 0.20 |
ENST00000423167.2 ENST00000432245.2 |
STRA6 |
stimulated by retinoic acid 6 |
| chr20_+_46130601 | 0.20 |
ENST00000341724.6 |
NCOA3 |
nuclear receptor coactivator 3 |
| chr6_+_150920999 | 0.20 |
ENST00000367328.1 ENST00000367326.1 |
PLEKHG1 |
pleckstrin homology domain containing, family G (with RhoGef domain) member 1 |
| chr16_-_30457048 | 0.20 |
ENST00000500504.2 ENST00000542752.1 |
SEPHS2 |
selenophosphate synthetase 2 |
| chr10_-_27444143 | 0.20 |
ENST00000477432.1 |
YME1L1 |
YME1-like 1 ATPase |
| chr4_-_90756769 | 0.20 |
ENST00000345009.4 ENST00000505199.1 ENST00000502987.1 |
SNCA |
synuclein, alpha (non A4 component of amyloid precursor) |
| chr19_-_15442701 | 0.20 |
ENST00000594841.1 ENST00000601941.1 |
BRD4 |
bromodomain containing 4 |
| chr12_+_57623477 | 0.19 |
ENST00000557487.1 ENST00000555634.1 ENST00000556689.1 |
SHMT2 |
serine hydroxymethyltransferase 2 (mitochondrial) |
| chr2_+_70056762 | 0.19 |
ENST00000282570.3 |
GMCL1 |
germ cell-less, spermatogenesis associated 1 |
| chr11_-_59633951 | 0.19 |
ENST00000257264.3 |
TCN1 |
transcobalamin I (vitamin B12 binding protein, R binder family) |
| chr18_-_61311485 | 0.19 |
ENST00000436264.1 ENST00000356424.6 ENST00000341074.5 |
SERPINB4 |
serpin peptidase inhibitor, clade B (ovalbumin), member 4 |
| chr15_-_74501360 | 0.18 |
ENST00000323940.5 |
STRA6 |
stimulated by retinoic acid 6 |
| chr1_+_110546700 | 0.18 |
ENST00000359172.3 ENST00000393614.4 |
AHCYL1 |
adenosylhomocysteinase-like 1 |
| chr10_-_29923893 | 0.18 |
ENST00000355867.4 |
SVIL |
supervillin |
| chr15_-_51397473 | 0.18 |
ENST00000327536.5 |
TNFAIP8L3 |
tumor necrosis factor, alpha-induced protein 8-like 3 |
| chr11_-_10590238 | 0.18 |
ENST00000256178.3 |
LYVE1 |
lymphatic vessel endothelial hyaluronan receptor 1 |
| chr14_-_24610779 | 0.18 |
ENST00000560403.1 ENST00000419198.2 ENST00000216799.4 |
EMC9 |
ER membrane protein complex subunit 9 |
| chr3_-_66551351 | 0.17 |
ENST00000273261.3 |
LRIG1 |
leucine-rich repeats and immunoglobulin-like domains 1 |
| chr5_-_16742330 | 0.17 |
ENST00000505695.1 ENST00000427430.2 |
MYO10 |
myosin X |
| chr4_-_10686475 | 0.17 |
ENST00000226951.6 |
CLNK |
cytokine-dependent hematopoietic cell linker |
| chr11_+_62495541 | 0.17 |
ENST00000530625.1 ENST00000513247.2 |
TTC9C |
tetratricopeptide repeat domain 9C |
| chrX_-_70474910 | 0.17 |
ENST00000373988.1 ENST00000373998.1 |
ZMYM3 |
zinc finger, MYM-type 3 |
| chr22_+_46481861 | 0.17 |
ENST00000360737.3 |
FLJ27365 |
hsa-mir-4763 |
| chr2_+_74056147 | 0.17 |
ENST00000394070.2 ENST00000536064.1 |
STAMBP |
STAM binding protein |
| chr4_-_116034979 | 0.16 |
ENST00000264363.2 |
NDST4 |
N-deacetylase/N-sulfotransferase (heparan glucosaminyl) 4 |
| chr14_+_32798547 | 0.16 |
ENST00000557354.1 ENST00000557102.1 ENST00000557272.1 |
AKAP6 |
A kinase (PRKA) anchor protein 6 |
| chr3_-_197300194 | 0.16 |
ENST00000358186.2 ENST00000431056.1 |
BDH1 |
3-hydroxybutyrate dehydrogenase, type 1 |
| chr1_+_117963209 | 0.16 |
ENST00000449370.2 |
MAN1A2 |
mannosidase, alpha, class 1A, member 2 |
| chr7_-_80141328 | 0.16 |
ENST00000398291.3 |
GNAT3 |
guanine nucleotide binding protein, alpha transducing 3 |
| chr1_-_92952433 | 0.16 |
ENST00000294702.5 |
GFI1 |
growth factor independent 1 transcription repressor |
| chr1_-_186649543 | 0.16 |
ENST00000367468.5 |
PTGS2 |
prostaglandin-endoperoxide synthase 2 (prostaglandin G/H synthase and cyclooxygenase) |
| chr7_+_95115210 | 0.16 |
ENST00000428113.1 ENST00000325885.5 |
ASB4 |
ankyrin repeat and SOCS box containing 4 |
| chr17_-_60142609 | 0.16 |
ENST00000397786.2 |
MED13 |
mediator complex subunit 13 |
| chr17_+_38465441 | 0.16 |
ENST00000577646.1 ENST00000254066.5 |
RARA |
retinoic acid receptor, alpha |
Gene Ontology Analysis
Gene overrepresentation in molecular_function category:
| Log-likelihood per target | Total log-likelihood | Term | Description |
|---|---|---|---|
| 1.0 | 4.0 | GO:0047006 | 17-alpha,20-alpha-dihydroxypregn-4-en-3-one dehydrogenase activity(GO:0047006) |
| 0.6 | 4.6 | GO:0004873 | asialoglycoprotein receptor activity(GO:0004873) |
| 0.5 | 3.3 | GO:0003796 | lysozyme activity(GO:0003796) |
| 0.5 | 1.9 | GO:0070653 | high-density lipoprotein particle receptor binding(GO:0070653) |
| 0.5 | 1.8 | GO:0035473 | lipase binding(GO:0035473) |
| 0.4 | 1.3 | GO:0031731 | CCR6 chemokine receptor binding(GO:0031731) |
| 0.3 | 1.0 | GO:0004611 | phosphoenolpyruvate carboxykinase activity(GO:0004611) phosphoenolpyruvate carboxykinase (GTP) activity(GO:0004613) |
| 0.3 | 2.0 | GO:0030492 | hemoglobin binding(GO:0030492) |
| 0.3 | 2.0 | GO:0050294 | steroid sulfotransferase activity(GO:0050294) |
| 0.3 | 0.8 | GO:1902122 | chenodeoxycholic acid binding(GO:1902122) |
| 0.3 | 2.4 | GO:0016724 | ferroxidase activity(GO:0004322) oxidoreductase activity, oxidizing metal ions, oxygen as acceptor(GO:0016724) |
| 0.2 | 0.9 | GO:0016841 | ammonia-lyase activity(GO:0016841) |
| 0.2 | 0.7 | GO:0017082 | mineralocorticoid receptor activity(GO:0017082) |
| 0.2 | 1.3 | GO:0016647 | oxidoreductase activity, acting on the CH-NH group of donors, oxygen as acceptor(GO:0016647) |
| 0.2 | 1.0 | GO:0004771 | sterol esterase activity(GO:0004771) methylumbelliferyl-acetate deacetylase activity(GO:0047374) |
| 0.2 | 0.7 | GO:0016823 | hydrolase activity, acting on acid carbon-carbon bonds(GO:0016822) hydrolase activity, acting on acid carbon-carbon bonds, in ketonic substances(GO:0016823) |
| 0.1 | 0.7 | GO:0004906 | interferon-gamma receptor activity(GO:0004906) |
| 0.1 | 0.9 | GO:0008454 | alpha-1,3-mannosylglycoprotein 4-beta-N-acetylglucosaminyltransferase activity(GO:0008454) |
| 0.1 | 0.5 | GO:0004735 | pyrroline-5-carboxylate reductase activity(GO:0004735) |
| 0.1 | 0.3 | GO:0004676 | 3-phosphoinositide-dependent protein kinase activity(GO:0004676) |
| 0.1 | 0.6 | GO:0004910 | interleukin-1, Type II, blocking receptor activity(GO:0004910) |
| 0.1 | 0.4 | GO:0032145 | 4-aminobutyrate transaminase activity(GO:0003867) succinate-semialdehyde dehydrogenase binding(GO:0032145) (S)-3-amino-2-methylpropionate transaminase activity(GO:0047298) |
| 0.1 | 3.0 | GO:0004181 | metallocarboxypeptidase activity(GO:0004181) |
| 0.1 | 0.4 | GO:0004998 | transferrin receptor activity(GO:0004998) |
| 0.1 | 0.9 | GO:1901702 | urate transmembrane transporter activity(GO:0015143) salt transmembrane transporter activity(GO:1901702) |
| 0.1 | 0.4 | GO:0038062 | protein tyrosine kinase collagen receptor activity(GO:0038062) |
| 0.1 | 0.1 | GO:0004618 | phosphoglycerate kinase activity(GO:0004618) |
| 0.1 | 0.6 | GO:0004372 | glycine hydroxymethyltransferase activity(GO:0004372) threonine aldolase activity(GO:0004793) L-allo-threonine aldolase activity(GO:0008732) |
| 0.1 | 0.4 | GO:0004647 | phosphoserine phosphatase activity(GO:0004647) |
| 0.1 | 0.2 | GO:0016781 | selenide, water dikinase activity(GO:0004756) phosphotransferase activity, paired acceptors(GO:0016781) |
| 0.1 | 0.3 | GO:0052740 | 1-acyl-2-lysophosphatidylserine acylhydrolase activity(GO:0052740) |
| 0.1 | 0.6 | GO:0010314 | phosphatidylinositol-5-phosphate binding(GO:0010314) |
| 0.1 | 0.4 | GO:0016812 | hydrolase activity, acting on carbon-nitrogen (but not peptide) bonds, in cyclic amides(GO:0016812) |
| 0.1 | 0.4 | GO:0004749 | ribose phosphate diphosphokinase activity(GO:0004749) |
| 0.1 | 0.2 | GO:0004909 | interleukin-1, Type I, activating receptor activity(GO:0004909) |
| 0.1 | 0.2 | GO:0003858 | 3-hydroxybutyrate dehydrogenase activity(GO:0003858) |
| 0.1 | 0.9 | GO:0005391 | sodium:potassium-exchanging ATPase activity(GO:0005391) |
| 0.0 | 0.3 | GO:0050692 | DBD domain binding(GO:0050692) |
| 0.0 | 1.8 | GO:0001972 | retinoic acid binding(GO:0001972) |
| 0.0 | 0.6 | GO:0030280 | structural constituent of epidermis(GO:0030280) |
| 0.0 | 0.2 | GO:0005294 | neutral L-amino acid secondary active transmembrane transporter activity(GO:0005294) |
| 0.0 | 1.0 | GO:0015125 | bile acid transmembrane transporter activity(GO:0015125) |
| 0.0 | 0.2 | GO:0050473 | arachidonate 15-lipoxygenase activity(GO:0050473) |
| 0.0 | 0.2 | GO:0060961 | phospholipase D inhibitor activity(GO:0060961) |
| 0.0 | 0.9 | GO:0030676 | Rac guanyl-nucleotide exchange factor activity(GO:0030676) |
| 0.0 | 0.6 | GO:0016595 | glutamate binding(GO:0016595) |
| 0.0 | 0.7 | GO:0070016 | armadillo repeat domain binding(GO:0070016) |
| 0.0 | 0.5 | GO:0031543 | peptidyl-proline dioxygenase activity(GO:0031543) |
| 0.0 | 0.1 | GO:0019862 | IgA binding(GO:0019862) |
| 0.0 | 3.5 | GO:0004867 | serine-type endopeptidase inhibitor activity(GO:0004867) |
| 0.0 | 0.1 | GO:0030375 | thyroid hormone receptor activator activity(GO:0010861) thyroid hormone receptor coactivator activity(GO:0030375) |
| 0.0 | 0.2 | GO:0016714 | oxidoreductase activity, acting on paired donors, with incorporation or reduction of molecular oxygen, reduced pteridine as one donor, and incorporation of one atom of oxygen(GO:0016714) |
| 0.0 | 0.2 | GO:0016802 | adenosylhomocysteinase activity(GO:0004013) trialkylsulfonium hydrolase activity(GO:0016802) |
| 0.0 | 0.3 | GO:0061578 | Lys63-specific deubiquitinase activity(GO:0061578) |
| 0.0 | 0.6 | GO:0005149 | interleukin-1 receptor binding(GO:0005149) |
| 0.0 | 0.2 | GO:0015165 | pyrimidine nucleotide-sugar transmembrane transporter activity(GO:0015165) |
| 0.0 | 0.2 | GO:0015016 | [heparan sulfate]-glucosamine N-sulfotransferase activity(GO:0015016) |
| 0.0 | 0.1 | GO:0035276 | aldehyde oxidase activity(GO:0004031) ethanol binding(GO:0035276) |
| 0.0 | 0.1 | GO:0016639 | oxidoreductase activity, acting on the CH-NH2 group of donors, NAD or NADP as acceptor(GO:0016639) |
| 0.0 | 0.4 | GO:0043138 | 3'-5' DNA helicase activity(GO:0043138) |
| 0.0 | 0.2 | GO:0004176 | ATP-dependent peptidase activity(GO:0004176) |
| 0.0 | 0.1 | GO:0061752 | telomeric repeat-containing RNA binding(GO:0061752) |
| 0.0 | 0.4 | GO:0035925 | mRNA 3'-UTR AU-rich region binding(GO:0035925) |
| 0.0 | 0.6 | GO:1905030 | voltage-gated sodium channel activity(GO:0005248) voltage-gated ion channel activity involved in regulation of postsynaptic membrane potential(GO:1905030) |
| 0.0 | 0.2 | GO:0047623 | AMP deaminase activity(GO:0003876) adenosine-phosphate deaminase activity(GO:0047623) |
| 0.0 | 0.2 | GO:0039706 | co-receptor binding(GO:0039706) |
| 0.0 | 0.3 | GO:0003993 | acid phosphatase activity(GO:0003993) |
| 0.0 | 0.1 | GO:0008336 | gamma-butyrobetaine dioxygenase activity(GO:0008336) |
| 0.0 | 0.5 | GO:0016922 | ligand-dependent nuclear receptor binding(GO:0016922) |
| 0.0 | 0.2 | GO:0008526 | phosphatidylinositol transporter activity(GO:0008526) |
| 0.0 | 5.5 | GO:0004252 | serine-type endopeptidase activity(GO:0004252) |
| 0.0 | 0.1 | GO:0004915 | interleukin-6 receptor activity(GO:0004915) interleukin-6 binding(GO:0019981) |
| 0.0 | 0.2 | GO:0060002 | plus-end directed microfilament motor activity(GO:0060002) |
| 0.0 | 0.5 | GO:0008093 | cytoskeletal adaptor activity(GO:0008093) |
| 0.0 | 0.3 | GO:0102391 | decanoate--CoA ligase activity(GO:0102391) |
| 0.0 | 0.1 | GO:0099580 | ion antiporter activity involved in regulation of postsynaptic membrane potential(GO:0099580) |
| 0.0 | 0.1 | GO:0004119 | cGMP-inhibited cyclic-nucleotide phosphodiesterase activity(GO:0004119) |
| 0.0 | 0.1 | GO:0050816 | phosphothreonine binding(GO:0050816) |
| 0.0 | 0.2 | GO:0031419 | cobalamin binding(GO:0031419) |
| 0.0 | 0.0 | GO:0003883 | CTP synthase activity(GO:0003883) |
| 0.0 | 0.1 | GO:0048101 | calcium- and calmodulin-regulated 3',5'-cyclic-GMP phosphodiesterase activity(GO:0048101) |
| 0.0 | 0.4 | GO:0005545 | 1-phosphatidylinositol binding(GO:0005545) |
| 0.0 | 0.5 | GO:0005540 | hyaluronic acid binding(GO:0005540) |
| 0.0 | 0.2 | GO:0004571 | mannosyl-oligosaccharide 1,2-alpha-mannosidase activity(GO:0004571) |
| 0.0 | 0.2 | GO:0005283 | sodium:amino acid symporter activity(GO:0005283) |
| 0.0 | 0.1 | GO:0005138 | ciliary neurotrophic factor receptor binding(GO:0005127) interleukin-6 receptor binding(GO:0005138) |
| 0.0 | 0.7 | GO:0030374 | ligand-dependent nuclear receptor transcription coactivator activity(GO:0030374) |
| 0.0 | 0.5 | GO:0043027 | cysteine-type endopeptidase inhibitor activity involved in apoptotic process(GO:0043027) |
| 0.0 | 0.1 | GO:0001758 | retinal dehydrogenase activity(GO:0001758) |
| 0.0 | 0.2 | GO:0008179 | adenylate cyclase binding(GO:0008179) |
| 0.0 | 0.1 | GO:0004705 | JUN kinase activity(GO:0004705) SAP kinase activity(GO:0016909) |
| 0.0 | 0.2 | GO:0000774 | adenyl-nucleotide exchange factor activity(GO:0000774) |
| 0.0 | 0.1 | GO:0051032 | nucleic acid transmembrane transporter activity(GO:0051032) RNA transmembrane transporter activity(GO:0051033) |
| 0.0 | 0.1 | GO:0032051 | clathrin light chain binding(GO:0032051) |
| 0.0 | 0.2 | GO:0070628 | proteasome binding(GO:0070628) |
| 0.0 | 0.1 | GO:0043546 | molybdopterin cofactor binding(GO:0043546) |
| 0.0 | 0.3 | GO:0008301 | DNA binding, bending(GO:0008301) |
| 0.0 | 0.6 | GO:0005160 | transforming growth factor beta receptor binding(GO:0005160) |
Gene overrepresentation in cellular_component category:
| Log-likelihood per target | Total log-likelihood | Term | Description |
|---|---|---|---|
| 0.5 | 2.0 | GO:0031838 | haptoglobin-hemoglobin complex(GO:0031838) |
| 0.5 | 3.7 | GO:0034363 | intermediate-density lipoprotein particle(GO:0034363) |
| 0.2 | 2.6 | GO:0005577 | fibrinogen complex(GO:0005577) |
| 0.1 | 0.4 | GO:0032144 | 4-aminobutyrate transaminase complex(GO:0032144) |
| 0.1 | 0.4 | GO:0000811 | GINS complex(GO:0000811) |
| 0.1 | 0.2 | GO:0098576 | lumenal side of membrane(GO:0098576) |
| 0.1 | 0.4 | GO:0034663 | endoplasmic reticulum chaperone complex(GO:0034663) |
| 0.1 | 0.4 | GO:0070369 | beta-catenin-TCF7L2 complex(GO:0070369) |
| 0.1 | 0.6 | GO:0070552 | BRISC complex(GO:0070552) |
| 0.1 | 7.8 | GO:0035578 | azurophil granule lumen(GO:0035578) |
| 0.1 | 0.7 | GO:0032432 | stress fiber(GO:0001725) actin filament bundle(GO:0032432) contractile actin filament bundle(GO:0097517) |
| 0.1 | 0.7 | GO:0044327 | dendritic spine head(GO:0044327) |
| 0.0 | 0.9 | GO:0005890 | sodium:potassium-exchanging ATPase complex(GO:0005890) |
| 0.0 | 0.6 | GO:1990712 | HFE-transferrin receptor complex(GO:1990712) |
| 0.0 | 2.4 | GO:0001533 | cornified envelope(GO:0001533) |
| 0.0 | 0.4 | GO:0043203 | axon hillock(GO:0043203) |
| 0.0 | 0.6 | GO:0001518 | voltage-gated sodium channel complex(GO:0001518) |
| 0.0 | 0.2 | GO:0014701 | junctional sarcoplasmic reticulum membrane(GO:0014701) |
| 0.0 | 0.1 | GO:0001405 | presequence translocase-associated import motor(GO:0001405) |
| 0.0 | 0.3 | GO:0005579 | membrane attack complex(GO:0005579) |
| 0.0 | 0.2 | GO:0031466 | Cul5-RING ubiquitin ligase complex(GO:0031466) |
| 0.0 | 0.2 | GO:0036449 | microtubule minus-end(GO:0036449) |
| 0.0 | 0.3 | GO:0030015 | CCR4-NOT core complex(GO:0030015) |
| 0.0 | 8.4 | GO:0005788 | endoplasmic reticulum lumen(GO:0005788) |
| 0.0 | 0.1 | GO:0031213 | RSF complex(GO:0031213) |
| 0.0 | 0.1 | GO:1990452 | Parkin-FBXW7-Cul1 ubiquitin ligase complex(GO:1990452) |
| 0.0 | 0.1 | GO:0005896 | interleukin-6 receptor complex(GO:0005896) |
| 0.0 | 0.1 | GO:0097679 | other organism cytoplasm(GO:0097679) |
| 0.0 | 0.2 | GO:0072546 | ER membrane protein complex(GO:0072546) |
| 0.0 | 0.7 | GO:0005719 | nuclear euchromatin(GO:0005719) |
| 0.0 | 0.1 | GO:0097058 | CRLF-CLCF1 complex(GO:0097058) |
| 0.0 | 0.1 | GO:0044352 | pinosome(GO:0044352) macropinosome(GO:0044354) |
| 0.0 | 0.1 | GO:0005863 | striated muscle myosin thick filament(GO:0005863) |
Gene overrepresentation in C2:CP category:
| Log-likelihood per target | Total log-likelihood | Term | Description |
|---|---|---|---|
| 0.1 | 2.8 | PID ERB GENOMIC PATHWAY | Validated nuclear estrogen receptor beta network |
| 0.1 | 2.5 | ST G ALPHA S PATHWAY | G alpha s Pathway |
| 0.1 | 2.9 | PID INTEGRIN2 PATHWAY | Beta2 integrin cell surface interactions |
| 0.1 | 2.8 | PID AMB2 NEUTROPHILS PATHWAY | amb2 Integrin signaling |
| 0.0 | 1.0 | SA PROGRAMMED CELL DEATH | Programmed cell death, or apoptosis, eliminates damaged or unneeded cells. |
| 0.0 | 2.4 | PID HNF3B PATHWAY | FOXA2 and FOXA3 transcription factor networks |
| 0.0 | 1.2 | PID RXR VDR PATHWAY | RXR and RAR heterodimerization with other nuclear receptor |
| 0.0 | 0.6 | PID IL1 PATHWAY | IL1-mediated signaling events |
| 0.0 | 1.6 | PID BMP PATHWAY | BMP receptor signaling |
| 0.0 | 1.6 | PID PI3K PLC TRK PATHWAY | Trk receptor signaling mediated by PI3K and PLC-gamma |
| 0.0 | 0.5 | SA CASPASE CASCADE | Apoptosis is mediated by caspases, cysteine proteases arranged in a proteolytic cascade. |
| 0.0 | 3.0 | PID CMYB PATHWAY | C-MYB transcription factor network |
| 0.0 | 0.5 | PID ARF6 DOWNSTREAM PATHWAY | Arf6 downstream pathway |
| 0.0 | 0.5 | SA B CELL RECEPTOR COMPLEXES | Antigen binding to B cell receptors activates protein tyrosine kinases, such as the Src family, which ultimate activate MAP kinases. |
| 0.0 | 1.8 | PID HIF1 TFPATHWAY | HIF-1-alpha transcription factor network |
| 0.0 | 1.9 | PID E2F PATHWAY | E2F transcription factor network |
| 0.0 | 0.6 | SA MMP CYTOKINE CONNECTION | Cytokines can induce activation of matrix metalloproteinases, which degrade extracellular matrix. |
| 0.0 | 0.6 | PID CD40 PATHWAY | CD40/CD40L signaling |
| 0.0 | 0.7 | PID ERBB4 PATHWAY | ErbB4 signaling events |
| 0.0 | 0.5 | PID SYNDECAN 2 PATHWAY | Syndecan-2-mediated signaling events |
Gene overrepresentation in biological_process category:
| Log-likelihood per target | Total log-likelihood | Term | Description |
|---|---|---|---|
| 0.8 | 2.3 | GO:0001798 | positive regulation of type IIa hypersensitivity(GO:0001798) positive regulation of type II hypersensitivity(GO:0002894) |
| 0.7 | 2.0 | GO:2000296 | negative regulation of hydrogen peroxide catabolic process(GO:2000296) |
| 0.7 | 3.3 | GO:0016998 | cell wall macromolecule catabolic process(GO:0016998) |
| 0.6 | 2.6 | GO:0003331 | regulation of extracellular matrix constituent secretion(GO:0003330) positive regulation of extracellular matrix constituent secretion(GO:0003331) |
| 0.6 | 1.9 | GO:2000909 | regulation of cholesterol import(GO:0060620) negative regulation of cholesterol import(GO:0060621) regulation of sterol import(GO:2000909) negative regulation of sterol import(GO:2000910) |
| 0.4 | 1.3 | GO:0019474 | L-lysine catabolic process to acetyl-CoA(GO:0019474) L-lysine catabolic process(GO:0019477) L-lysine metabolic process(GO:0046440) |
| 0.4 | 1.3 | GO:0045362 | regulation of interleukin-1 biosynthetic process(GO:0045360) positive regulation of interleukin-1 biosynthetic process(GO:0045362) |
| 0.4 | 2.9 | GO:0071395 | response to jasmonic acid(GO:0009753) cellular response to jasmonic acid stimulus(GO:0071395) |
| 0.3 | 0.9 | GO:0019556 | histidine catabolic process to glutamate and formamide(GO:0019556) histidine catabolic process to glutamate and formate(GO:0019557) formamide metabolic process(GO:0043606) |
| 0.3 | 0.9 | GO:0044537 | regulation of circulating fibrinogen levels(GO:0044537) |
| 0.3 | 1.4 | GO:0015891 | iron chelate transport(GO:0015688) siderophore transport(GO:0015891) |
| 0.3 | 0.8 | GO:0072615 | nitrogen catabolite regulation of transcription from RNA polymerase II promoter(GO:0001079) nitrogen catabolite activation of transcription from RNA polymerase II promoter(GO:0001080) regulation of urea metabolic process(GO:0034255) intracellular bile acid receptor signaling pathway(GO:0038185) interleukin-17 secretion(GO:0072615) nitrogen catabolite regulation of transcription(GO:0090293) nitrogen catabolite activation of transcription(GO:0090294) regulation of nitrogen cycle metabolic process(GO:1903314) positive regulation of glutamate metabolic process(GO:2000213) regulation of ammonia assimilation cycle(GO:2001248) positive regulation of ammonia assimilation cycle(GO:2001250) |
| 0.3 | 1.0 | GO:1904640 | response to methionine(GO:1904640) |
| 0.3 | 1.8 | GO:0010269 | response to selenium ion(GO:0010269) |
| 0.2 | 0.7 | GO:0030264 | nuclear fragmentation involved in apoptotic nuclear change(GO:0030264) positive regulation of cardiac vascular smooth muscle cell differentiation(GO:2000724) |
| 0.2 | 2.5 | GO:2000427 | positive regulation of apoptotic cell clearance(GO:2000427) |
| 0.2 | 0.7 | GO:0097052 | tryptophan catabolic process to acetyl-CoA(GO:0019442) L-kynurenine metabolic process(GO:0097052) |
| 0.2 | 1.1 | GO:0033031 | positive regulation of neutrophil apoptotic process(GO:0033031) |
| 0.2 | 0.9 | GO:0044861 | protein transport into plasma membrane raft(GO:0044861) positive regulation of potassium ion import(GO:1903288) |
| 0.2 | 1.8 | GO:0051552 | flavone metabolic process(GO:0051552) |
| 0.2 | 0.6 | GO:0046136 | positive regulation of vitamin metabolic process(GO:0046136) positive regulation of vitamin D biosynthetic process(GO:0060557) positive regulation of calcidiol 1-monooxygenase activity(GO:0060559) |
| 0.2 | 0.9 | GO:0060125 | negative regulation of growth hormone secretion(GO:0060125) |
| 0.2 | 0.5 | GO:0019853 | L-ascorbic acid biosynthetic process(GO:0019853) negative regulation of DNA catabolic process(GO:1903625) regulation of aminoacyl-tRNA ligase activity(GO:1903630) |
| 0.2 | 0.7 | GO:0097068 | response to thyroxine(GO:0097068) response to L-phenylalanine derivative(GO:1904386) |
| 0.2 | 3.0 | GO:0090331 | negative regulation of platelet aggregation(GO:0090331) |
| 0.1 | 0.6 | GO:0050712 | negative regulation of interleukin-1 alpha production(GO:0032690) negative regulation of interleukin-1 alpha secretion(GO:0050712) |
| 0.1 | 0.4 | GO:0032474 | otolith morphogenesis(GO:0032474) |
| 0.1 | 0.5 | GO:0090206 | negative regulation of cholesterol biosynthetic process(GO:0045541) negative regulation of cholesterol metabolic process(GO:0090206) |
| 0.1 | 0.7 | GO:0035331 | negative regulation of hippo signaling(GO:0035331) |
| 0.1 | 0.6 | GO:0097460 | ferrous iron import into cell(GO:0097460) ferrous iron import across plasma membrane(GO:0098707) |
| 0.1 | 1.0 | GO:0051791 | medium-chain fatty acid metabolic process(GO:0051791) |
| 0.1 | 0.3 | GO:0042700 | luteinizing hormone signaling pathway(GO:0042700) |
| 0.1 | 0.4 | GO:0071279 | cellular response to cobalt ion(GO:0071279) |
| 0.1 | 1.0 | GO:0006703 | estrogen biosynthetic process(GO:0006703) |
| 0.1 | 2.4 | GO:0006825 | copper ion transport(GO:0006825) |
| 0.1 | 1.0 | GO:0030050 | vesicle transport along actin filament(GO:0030050) |
| 0.1 | 0.6 | GO:0019264 | glycine biosynthetic process from serine(GO:0019264) |
| 0.1 | 0.5 | GO:0006561 | proline biosynthetic process(GO:0006561) L-proline biosynthetic process(GO:0055129) |
| 0.1 | 1.2 | GO:0042448 | ovulation from ovarian follicle(GO:0001542) progesterone metabolic process(GO:0042448) |
| 0.1 | 0.3 | GO:0051342 | regulation of cyclic-nucleotide phosphodiesterase activity(GO:0051342) negative regulation of cyclic-nucleotide phosphodiesterase activity(GO:0051344) |
| 0.1 | 0.2 | GO:0050917 | sensory perception of umami taste(GO:0050917) |
| 0.1 | 0.2 | GO:1902723 | negative regulation of skeletal muscle cell proliferation(GO:0014859) negative regulation of skeletal muscle satellite cell proliferation(GO:1902723) |
| 0.1 | 4.6 | GO:0018279 | protein N-linked glycosylation via asparagine(GO:0018279) |
| 0.1 | 0.4 | GO:0061143 | alveolar primary septum development(GO:0061143) |
| 0.1 | 1.5 | GO:0030277 | maintenance of gastrointestinal epithelium(GO:0030277) |
| 0.1 | 0.4 | GO:1902730 | regulation of heparan sulfate proteoglycan biosynthetic process(GO:0010908) positive regulation of heparan sulfate proteoglycan biosynthetic process(GO:0010909) canonical Wnt signaling pathway involved in positive regulation of epithelial to mesenchymal transition(GO:0044334) positive regulation of proteoglycan biosynthetic process(GO:1902730) |
| 0.1 | 1.8 | GO:0006907 | pinocytosis(GO:0006907) |
| 0.1 | 0.2 | GO:2000661 | positive regulation of interleukin-1-mediated signaling pathway(GO:2000661) |
| 0.1 | 0.3 | GO:2000320 | negative regulation of T-helper 17 type immune response(GO:2000317) negative regulation of T-helper 17 cell differentiation(GO:2000320) |
| 0.1 | 0.6 | GO:0061458 | reproductive system development(GO:0061458) |
| 0.1 | 2.0 | GO:0006706 | steroid catabolic process(GO:0006706) sulfation(GO:0051923) |
| 0.1 | 0.3 | GO:0060694 | regulation of cholesterol transporter activity(GO:0060694) response to metformin(GO:1901558) negative regulation of pancreatic stellate cell proliferation(GO:2000230) |
| 0.1 | 0.9 | GO:0046415 | urate metabolic process(GO:0046415) |
| 0.1 | 0.2 | GO:0016260 | selenocysteine biosynthetic process(GO:0016260) |
| 0.1 | 0.5 | GO:0008218 | bioluminescence(GO:0008218) |
| 0.1 | 0.3 | GO:0038001 | autocrine signaling(GO:0035425) paracrine signaling(GO:0038001) |
| 0.1 | 0.5 | GO:0035624 | receptor transactivation(GO:0035624) |
| 0.1 | 1.0 | GO:0045721 | negative regulation of gluconeogenesis(GO:0045721) |
| 0.1 | 0.4 | GO:1904628 | response to phorbol 13-acetate 12-myristate(GO:1904627) cellular response to phorbol 13-acetate 12-myristate(GO:1904628) |
| 0.1 | 1.6 | GO:0045662 | negative regulation of myoblast differentiation(GO:0045662) |
| 0.1 | 0.5 | GO:0045959 | regulation of complement activation, classical pathway(GO:0030450) negative regulation of complement activation, classical pathway(GO:0045959) regulation of opsonization(GO:1903027) |
| 0.1 | 0.4 | GO:0032227 | negative regulation of synaptic transmission, dopaminergic(GO:0032227) |
| 0.1 | 0.2 | GO:1902261 | positive regulation of delayed rectifier potassium channel activity(GO:1902261) |
| 0.1 | 0.2 | GO:0070105 | positive regulation of interleukin-6-mediated signaling pathway(GO:0070105) |
| 0.0 | 0.4 | GO:0061302 | smooth muscle cell-matrix adhesion(GO:0061302) |
| 0.0 | 1.8 | GO:0030195 | negative regulation of blood coagulation(GO:0030195) negative regulation of hemostasis(GO:1900047) |
| 0.0 | 0.3 | GO:0043353 | enucleate erythrocyte differentiation(GO:0043353) |
| 0.0 | 0.5 | GO:0098870 | neuronal action potential propagation(GO:0019227) action potential propagation(GO:0098870) |
| 0.0 | 1.1 | GO:0006491 | N-glycan processing(GO:0006491) |
| 0.0 | 0.2 | GO:0051941 | regulation of amino acid import(GO:0010958) regulation of amino acid uptake involved in synaptic transmission(GO:0051941) regulation of glutamate uptake involved in transmission of nerve impulse(GO:0051946) regulation of L-glutamate import(GO:1900920) |
| 0.0 | 0.4 | GO:0006564 | L-serine biosynthetic process(GO:0006564) |
| 0.0 | 0.2 | GO:0035694 | mitochondrial protein catabolic process(GO:0035694) |
| 0.0 | 0.4 | GO:1990416 | cellular response to brain-derived neurotrophic factor stimulus(GO:1990416) |
| 0.0 | 0.2 | GO:0060010 | Sertoli cell fate commitment(GO:0060010) |
| 0.0 | 0.1 | GO:0060244 | negative regulation of cell proliferation involved in contact inhibition(GO:0060244) |
| 0.0 | 0.2 | GO:0006065 | UDP-glucuronate biosynthetic process(GO:0006065) |
| 0.0 | 0.3 | GO:0010606 | positive regulation of cytoplasmic mRNA processing body assembly(GO:0010606) |
| 0.0 | 0.1 | GO:0010430 | fatty acid omega-oxidation(GO:0010430) |
| 0.0 | 0.1 | GO:0044205 | 'de novo' UMP biosynthetic process(GO:0044205) |
| 0.0 | 0.1 | GO:0042270 | protection from natural killer cell mediated cytotoxicity(GO:0042270) |
| 0.0 | 0.2 | GO:0046952 | ketone body catabolic process(GO:0046952) |
| 0.0 | 0.2 | GO:0046485 | ether lipid metabolic process(GO:0046485) |
| 0.0 | 0.5 | GO:1902083 | negative regulation of peptidyl-cysteine S-nitrosylation(GO:1902083) |
| 0.0 | 0.2 | GO:0006824 | cobalt ion transport(GO:0006824) |
| 0.0 | 0.3 | GO:0001833 | inner cell mass cell proliferation(GO:0001833) |
| 0.0 | 0.1 | GO:0060133 | somatotropin secreting cell development(GO:0060133) |
| 0.0 | 0.1 | GO:0002384 | hepatic immune response(GO:0002384) |
| 0.0 | 0.1 | GO:0002874 | regulation of chronic inflammatory response to antigenic stimulus(GO:0002874) |
| 0.0 | 0.1 | GO:0050955 | thermoception(GO:0050955) |
| 0.0 | 0.1 | GO:0010868 | negative regulation of triglyceride biosynthetic process(GO:0010868) regulation of SREBP signaling pathway(GO:2000638) negative regulation of SREBP signaling pathway(GO:2000639) |
| 0.0 | 0.1 | GO:0046533 | negative regulation of photoreceptor cell differentiation(GO:0046533) |
| 0.0 | 0.2 | GO:0033353 | S-adenosylmethionine cycle(GO:0033353) |
| 0.0 | 1.0 | GO:0043252 | sodium-independent organic anion transport(GO:0043252) |
| 0.0 | 0.8 | GO:1903846 | positive regulation of transforming growth factor beta receptor signaling pathway(GO:0030511) positive regulation of cellular response to transforming growth factor beta stimulus(GO:1903846) |
| 0.0 | 0.1 | GO:1903935 | response to sodium arsenite(GO:1903935) cellular response to sodium arsenite(GO:1903936) |
| 0.0 | 0.3 | GO:0051256 | mitotic spindle midzone assembly(GO:0051256) |
| 0.0 | 0.7 | GO:0003298 | physiological muscle hypertrophy(GO:0003298) physiological cardiac muscle hypertrophy(GO:0003301) cell growth involved in cardiac muscle cell development(GO:0061049) |
| 0.0 | 0.1 | GO:0036343 | psychomotor behavior(GO:0036343) |
| 0.0 | 0.0 | GO:0060979 | vasculogenesis involved in coronary vascular morphogenesis(GO:0060979) |
| 0.0 | 0.1 | GO:0060335 | positive regulation of response to interferon-gamma(GO:0060332) positive regulation of interferon-gamma-mediated signaling pathway(GO:0060335) |
| 0.0 | 0.1 | GO:0006145 | purine nucleobase catabolic process(GO:0006145) |
| 0.0 | 0.1 | GO:2000809 | positive regulation of synaptic vesicle clustering(GO:2000809) |
| 0.0 | 0.2 | GO:0032264 | IMP salvage(GO:0032264) |
| 0.0 | 0.1 | GO:0006287 | base-excision repair, gap-filling(GO:0006287) |
| 0.0 | 0.1 | GO:0035897 | proteolysis in other organism(GO:0035897) |
| 0.0 | 0.1 | GO:0042905 | 9-cis-retinoic acid biosynthetic process(GO:0042904) 9-cis-retinoic acid metabolic process(GO:0042905) |
| 0.0 | 0.5 | GO:0030214 | hyaluronan catabolic process(GO:0030214) |
| 0.0 | 0.3 | GO:0001764 | neuron migration(GO:0001764) |
| 0.0 | 0.2 | GO:0060213 | regulation of nuclear-transcribed mRNA poly(A) tail shortening(GO:0060211) positive regulation of nuclear-transcribed mRNA poly(A) tail shortening(GO:0060213) |
| 0.0 | 0.1 | GO:0046726 | positive regulation by virus of viral protein levels in host cell(GO:0046726) |
| 0.0 | 0.0 | GO:0044210 | 'de novo' CTP biosynthetic process(GO:0044210) |
| 0.0 | 0.2 | GO:0030202 | heparin metabolic process(GO:0030202) heparin biosynthetic process(GO:0030210) |
| 0.0 | 0.2 | GO:1901407 | regulation of phosphorylation of RNA polymerase II C-terminal domain(GO:1901407) |
| 0.0 | 0.2 | GO:2001214 | positive regulation of vasculogenesis(GO:2001214) |
| 0.0 | 1.7 | GO:0070268 | cornification(GO:0070268) |
| 0.0 | 0.1 | GO:0045329 | carnitine biosynthetic process(GO:0045329) |
| 0.0 | 0.3 | GO:0035338 | long-chain fatty-acyl-CoA biosynthetic process(GO:0035338) |
| 0.0 | 0.1 | GO:0001865 | NK T cell differentiation(GO:0001865) |
| 0.0 | 0.4 | GO:0007184 | SMAD protein import into nucleus(GO:0007184) |
| 0.0 | 0.4 | GO:0043555 | regulation of translation in response to stress(GO:0043555) |
| 0.0 | 0.2 | GO:0014067 | negative regulation of phosphatidylinositol 3-kinase signaling(GO:0014067) |
| 0.0 | 0.1 | GO:0060282 | positive regulation of oocyte development(GO:0060282) |
| 0.0 | 0.1 | GO:0010735 | positive regulation of transcription via serum response element binding(GO:0010735) |
| 0.0 | 0.3 | GO:0060334 | regulation of interferon-gamma-mediated signaling pathway(GO:0060334) |
| 0.0 | 0.2 | GO:0097201 | negative regulation of transcription from RNA polymerase II promoter in response to stress(GO:0097201) |
| 0.0 | 0.0 | GO:0070301 | cellular response to hydrogen peroxide(GO:0070301) |
| 0.0 | 0.0 | GO:1903598 | positive regulation of gap junction assembly(GO:1903598) |
| 0.0 | 0.1 | GO:0002087 | regulation of respiratory gaseous exchange by neurological system process(GO:0002087) |
| 0.0 | 0.2 | GO:0060575 | intestinal epithelial cell differentiation(GO:0060575) |
| 0.0 | 0.3 | GO:0070536 | protein K63-linked deubiquitination(GO:0070536) |
| 0.0 | 0.1 | GO:0002175 | protein localization to paranode region of axon(GO:0002175) |
| 0.0 | 0.1 | GO:0045416 | positive regulation of interleukin-8 biosynthetic process(GO:0045416) |
Gene overrepresentation in C2:CP:REACTOME category:
| Log-likelihood per target | Total log-likelihood | Term | Description |
|---|---|---|---|
| 0.3 | 5.3 | REACTOME INITIAL TRIGGERING OF COMPLEMENT | Genes involved in Initial triggering of complement |
| 0.2 | 3.5 | REACTOME COMMON PATHWAY | Genes involved in Common Pathway |
| 0.2 | 3.7 | REACTOME CHYLOMICRON MEDIATED LIPID TRANSPORT | Genes involved in Chylomicron-mediated lipid transport |
| 0.1 | 2.4 | REACTOME METAL ION SLC TRANSPORTERS | Genes involved in Metal ion SLC transporters |
| 0.1 | 1.0 | REACTOME ABACAVIR TRANSPORT AND METABOLISM | Genes involved in Abacavir transport and metabolism |
| 0.1 | 2.0 | REACTOME CYTOSOLIC SULFONATION OF SMALL MOLECULES | Genes involved in Cytosolic sulfonation of small molecules |
| 0.1 | 1.5 | REACTOME GLUCURONIDATION | Genes involved in Glucuronidation |
| 0.0 | 0.7 | REACTOME TRYPTOPHAN CATABOLISM | Genes involved in Tryptophan catabolism |
| 0.0 | 0.9 | REACTOME N GLYCAN ANTENNAE ELONGATION | Genes involved in N-Glycan antennae elongation |
| 0.0 | 0.8 | REACTOME FACILITATIVE NA INDEPENDENT GLUCOSE TRANSPORTERS | Genes involved in Facilitative Na+-independent glucose transporters |
| 0.0 | 0.9 | REACTOME AMINO ACID SYNTHESIS AND INTERCONVERSION TRANSAMINATION | Genes involved in Amino acid synthesis and interconversion (transamination) |
| 0.0 | 0.6 | REACTOME SYNTHESIS OF VERY LONG CHAIN FATTY ACYL COAS | Genes involved in Synthesis of very long-chain fatty acyl-CoAs |
| 0.0 | 2.4 | REACTOME AMYLOIDS | Genes involved in Amyloids |
| 0.0 | 0.5 | REACTOME HYALURONAN UPTAKE AND DEGRADATION | Genes involved in Hyaluronan uptake and degradation |
| 0.0 | 0.4 | REACTOME UNWINDING OF DNA | Genes involved in Unwinding of DNA |
| 0.0 | 1.4 | REACTOME IL1 SIGNALING | Genes involved in Interleukin-1 signaling |
| 0.0 | 1.2 | REACTOME TRAFFICKING OF AMPA RECEPTORS | Genes involved in Trafficking of AMPA receptors |
| 0.0 | 0.9 | REACTOME CREB PHOSPHORYLATION THROUGH THE ACTIVATION OF RAS | Genes involved in CREB phosphorylation through the activation of Ras |
| 0.0 | 0.5 | REACTOME HS GAG DEGRADATION | Genes involved in HS-GAG degradation |
| 0.0 | 0.4 | REACTOME INTRINSIC PATHWAY | Genes involved in Intrinsic Pathway |
| 0.0 | 0.7 | REACTOME GLUTATHIONE CONJUGATION | Genes involved in Glutathione conjugation |
| 0.0 | 0.6 | REACTOME DCC MEDIATED ATTRACTIVE SIGNALING | Genes involved in DCC mediated attractive signaling |
| 0.0 | 1.0 | REACTOME NRAGE SIGNALS DEATH THROUGH JNK | Genes involved in NRAGE signals death through JNK |
| 0.0 | 0.5 | REACTOME CIRCADIAN REPRESSION OF EXPRESSION BY REV ERBA | Genes involved in Circadian Repression of Expression by REV-ERBA |
| 0.0 | 0.2 | REACTOME ACTIVATED TAK1 MEDIATES P38 MAPK ACTIVATION | Genes involved in activated TAK1 mediates p38 MAPK activation |
| 0.0 | 0.7 | REACTOME ION TRANSPORT BY P TYPE ATPASES | Genes involved in Ion transport by P-type ATPases |
| 0.0 | 0.1 | REACTOME JNK C JUN KINASES PHOSPHORYLATION AND ACTIVATION MEDIATED BY ACTIVATED HUMAN TAK1 | Genes involved in JNK (c-Jun kinases) phosphorylation and activation mediated by activated human TAK1 |
| 0.0 | 2.9 | REACTOME G ALPHA I SIGNALLING EVENTS | Genes involved in G alpha (i) signalling events |
| 0.0 | 0.2 | REACTOME PRE NOTCH TRANSCRIPTION AND TRANSLATION | Genes involved in Pre-NOTCH Transcription and Translation |
| 0.0 | 0.3 | REACTOME CONVERSION FROM APC C CDC20 TO APC C CDH1 IN LATE ANAPHASE | Genes involved in Conversion from APC/C:Cdc20 to APC/C:Cdh1 in late anaphase |
| 0.0 | 0.3 | REACTOME REGULATION OF IFNG SIGNALING | Genes involved in Regulation of IFNG signaling |
| 0.0 | 0.3 | REACTOME SHC1 EVENTS IN ERBB4 SIGNALING | Genes involved in SHC1 events in ERBB4 signaling |