Project
ENCODE cell lines, expression (Ernst 2011)
Navigation
Downloads
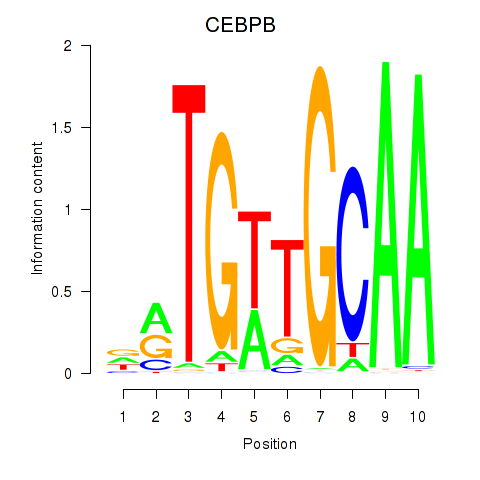
Results for CEBPB
Z-value: 1.52
Motif logo
Transcription factors associated with CEBPB
| Gene Symbol | Gene ID | Gene Info |
|---|---|---|
|
CEBPB
|
ENSG00000172216.4 | CEBPB |
Activity-expression correlation:
| Gene | Promoter | Pearson corr. coef. | P-value | Plot |
|---|---|---|---|---|
| CEBPB | hg19_v2_chr20_+_48807351_48807384 | 0.65 | 6.9e-03 | Click! |
Activity profile of CEBPB motif
Sorted Z-values of CEBPB motif
Network of associatons between targets according to the STRING database.

First level regulatory network of CEBPB
| Promoter | Score | Transcript | Gene | Gene Info |
|---|---|---|---|---|
| chr17_-_64216748 | 7.71 |
ENST00000585162.1 |
APOH |
apolipoprotein H (beta-2-glycoprotein I) |
| chr17_+_1665253 | 6.07 |
ENST00000254722.4 |
SERPINF1 |
serpin peptidase inhibitor, clade F (alpha-2 antiplasmin, pigment epithelium derived factor), member 1 |
| chr17_+_1665345 | 5.26 |
ENST00000576406.1 ENST00000571149.1 |
SERPINF1 |
serpin peptidase inhibitor, clade F (alpha-2 antiplasmin, pigment epithelium derived factor), member 1 |
| chr4_-_155533787 | 4.79 |
ENST00000407946.1 ENST00000405164.1 ENST00000336098.3 ENST00000393846.2 ENST00000404648.3 ENST00000443553.1 |
FGG |
fibrinogen gamma chain |
| chr2_-_216300784 | 4.24 |
ENST00000421182.1 ENST00000432072.2 ENST00000323926.6 ENST00000336916.4 ENST00000357867.4 ENST00000359671.1 ENST00000346544.3 ENST00000345488.5 ENST00000357009.2 ENST00000446046.1 ENST00000356005.4 ENST00000443816.1 ENST00000426059.1 ENST00000354785.4 |
FN1 |
fibronectin 1 |
| chr3_-_49722523 | 3.69 |
ENST00000448220.1 |
MST1 |
macrophage stimulating 1 (hepatocyte growth factor-like) |
| chr5_+_150400124 | 3.50 |
ENST00000388825.4 ENST00000521650.1 ENST00000517973.1 |
GPX3 |
glutathione peroxidase 3 (plasma) |
| chr5_-_172756506 | 3.35 |
ENST00000265087.4 |
STC2 |
stanniocalcin 2 |
| chr6_+_31895467 | 3.33 |
ENST00000556679.1 ENST00000456570.1 |
CFB CFB |
complement factor B Complement factor B; Uncharacterized protein; cDNA FLJ55673, highly similar to Complement factor B |
| chr6_+_31895254 | 3.31 |
ENST00000299367.5 ENST00000442278.2 |
C2 |
complement component 2 |
| chr1_+_212782012 | 3.24 |
ENST00000341491.4 ENST00000366985.1 |
ATF3 |
activating transcription factor 3 |
| chr6_+_31895480 | 3.20 |
ENST00000418949.2 ENST00000383177.3 ENST00000477310.1 |
C2 CFB |
complement component 2 Complement factor B; Uncharacterized protein; cDNA FLJ55673, highly similar to Complement factor B |
| chr12_+_57849048 | 3.10 |
ENST00000266646.2 |
INHBE |
inhibin, beta E |
| chr2_-_160654745 | 3.10 |
ENST00000259053.4 ENST00000429078.2 |
CD302 |
CD302 molecule |
| chr3_+_12392971 | 3.04 |
ENST00000287820.6 |
PPARG |
peroxisome proliferator-activated receptor gamma |
| chr22_+_35776828 | 2.75 |
ENST00000216117.8 |
HMOX1 |
heme oxygenase (decycling) 1 |
| chr20_+_56136136 | 2.75 |
ENST00000319441.4 ENST00000543666.1 |
PCK1 |
phosphoenolpyruvate carboxykinase 1 (soluble) |
| chr16_+_72088376 | 2.68 |
ENST00000570083.1 ENST00000355906.5 ENST00000398131.2 ENST00000569639.1 ENST00000564499.1 ENST00000357763.4 ENST00000562526.1 ENST00000565574.1 ENST00000568417.2 ENST00000356967.5 |
HP HPR |
haptoglobin haptoglobin-related protein |
| chr17_+_53342311 | 2.66 |
ENST00000226067.5 |
HLF |
hepatic leukemia factor |
| chr5_-_141704566 | 2.50 |
ENST00000344120.4 ENST00000434127.2 |
SPRY4 |
sprouty homolog 4 (Drosophila) |
| chrX_+_115567767 | 2.39 |
ENST00000371900.4 |
SLC6A14 |
solute carrier family 6 (amino acid transporter), member 14 |
| chr3_-_99833333 | 2.28 |
ENST00000354552.3 ENST00000331335.5 ENST00000398326.2 |
FILIP1L |
filamin A interacting protein 1-like |
| chr3_+_157154578 | 2.11 |
ENST00000295927.3 |
PTX3 |
pentraxin 3, long |
| chr2_+_211421262 | 1.86 |
ENST00000233072.5 |
CPS1 |
carbamoyl-phosphate synthase 1, mitochondrial |
| chr2_-_175711133 | 1.86 |
ENST00000409597.1 ENST00000413882.1 |
CHN1 |
chimerin 1 |
| chr14_-_92413727 | 1.81 |
ENST00000267620.10 |
FBLN5 |
fibulin 5 |
| chr11_+_7506713 | 1.77 |
ENST00000329293.3 ENST00000534244.1 |
OLFML1 |
olfactomedin-like 1 |
| chr20_+_361261 | 1.74 |
ENST00000217233.3 |
TRIB3 |
tribbles pseudokinase 3 |
| chr1_+_99127225 | 1.68 |
ENST00000370189.5 ENST00000529992.1 |
SNX7 |
sorting nexin 7 |
| chr14_-_92413353 | 1.67 |
ENST00000556154.1 |
FBLN5 |
fibulin 5 |
| chr3_-_66551397 | 1.63 |
ENST00000383703.3 |
LRIG1 |
leucine-rich repeats and immunoglobulin-like domains 1 |
| chr10_+_101542462 | 1.59 |
ENST00000370449.4 ENST00000370434.1 |
ABCC2 |
ATP-binding cassette, sub-family C (CFTR/MRP), member 2 |
| chr4_+_71063641 | 1.58 |
ENST00000514097.1 |
ODAM |
odontogenic, ameloblast asssociated |
| chr19_+_11350278 | 1.57 |
ENST00000252453.8 |
C19orf80 |
chromosome 19 open reading frame 80 |
| chr3_-_66551351 | 1.54 |
ENST00000273261.3 |
LRIG1 |
leucine-rich repeats and immunoglobulin-like domains 1 |
| chr12_-_6451186 | 1.49 |
ENST00000540022.1 ENST00000536194.1 |
TNFRSF1A |
tumor necrosis factor receptor superfamily, member 1A |
| chr21_-_44495964 | 1.46 |
ENST00000398168.1 ENST00000398165.3 |
CBS |
cystathionine-beta-synthase |
| chr19_-_51869592 | 1.36 |
ENST00000596253.1 ENST00000309244.4 |
ETFB |
electron-transfer-flavoprotein, beta polypeptide |
| chr16_-_28550348 | 1.36 |
ENST00000324873.6 |
NUPR1 |
nuclear protein, transcriptional regulator, 1 |
| chr20_+_8112824 | 1.36 |
ENST00000378641.3 |
PLCB1 |
phospholipase C, beta 1 (phosphoinositide-specific) |
| chr12_-_96390063 | 1.33 |
ENST00000541929.1 |
HAL |
histidine ammonia-lyase |
| chr21_-_44495919 | 1.33 |
ENST00000398158.1 |
CBS |
cystathionine-beta-synthase |
| chr16_-_28550320 | 1.25 |
ENST00000395641.2 |
NUPR1 |
nuclear protein, transcriptional regulator, 1 |
| chrX_-_106243451 | 1.25 |
ENST00000355610.4 ENST00000535534.1 |
MORC4 |
MORC family CW-type zinc finger 4 |
| chr12_+_10366016 | 1.22 |
ENST00000546017.1 ENST00000535576.1 ENST00000539170.1 |
GABARAPL1 |
GABA(A) receptor-associated protein like 1 |
| chr3_+_138067521 | 1.20 |
ENST00000494949.1 |
MRAS |
muscle RAS oncogene homolog |
| chr1_-_36948879 | 1.17 |
ENST00000373106.1 ENST00000373104.1 ENST00000373103.1 |
CSF3R |
colony stimulating factor 3 receptor (granulocyte) |
| chr16_-_57809015 | 1.16 |
ENST00000540079.2 ENST00000569222.1 |
KIFC3 |
kinesin family member C3 |
| chr4_+_113739244 | 1.13 |
ENST00000503271.1 ENST00000503423.1 ENST00000506722.1 |
ANK2 |
ankyrin 2, neuronal |
| chr12_-_6451235 | 1.12 |
ENST00000440083.2 ENST00000162749.2 |
TNFRSF1A |
tumor necrosis factor receptor superfamily, member 1A |
| chr1_+_150954493 | 1.09 |
ENST00000368947.4 |
ANXA9 |
annexin A9 |
| chr12_-_57914275 | 1.07 |
ENST00000547303.1 ENST00000552740.1 ENST00000547526.1 ENST00000551116.1 ENST00000346473.3 |
DDIT3 |
DNA-damage-inducible transcript 3 |
| chr12_-_96390108 | 1.01 |
ENST00000538703.1 ENST00000261208.3 |
HAL |
histidine ammonia-lyase |
| chrX_+_9431324 | 1.00 |
ENST00000407597.2 ENST00000424279.1 ENST00000536365.1 ENST00000441088.1 ENST00000380961.1 ENST00000415293.1 |
TBL1X |
transducin (beta)-like 1X-linked |
| chr19_-_33360647 | 0.96 |
ENST00000590341.1 ENST00000587772.1 ENST00000023064.4 |
SLC7A9 |
solute carrier family 7 (amino acid transporter light chain, bo,+ system), member 9 |
| chr4_-_139163491 | 0.93 |
ENST00000280612.5 |
SLC7A11 |
solute carrier family 7 (anionic amino acid transporter light chain, xc- system), member 11 |
| chr12_+_57623869 | 0.92 |
ENST00000414700.3 ENST00000557703.1 |
SHMT2 |
serine hydroxymethyltransferase 2 (mitochondrial) |
| chr17_-_76836729 | 0.89 |
ENST00000587783.1 ENST00000542802.3 ENST00000586531.1 ENST00000589424.1 ENST00000590546.2 |
USP36 |
ubiquitin specific peptidase 36 |
| chr12_+_57623477 | 0.86 |
ENST00000557487.1 ENST00000555634.1 ENST00000556689.1 |
SHMT2 |
serine hydroxymethyltransferase 2 (mitochondrial) |
| chr2_+_113885138 | 0.84 |
ENST00000409930.3 |
IL1RN |
interleukin 1 receptor antagonist |
| chr7_-_50860565 | 0.84 |
ENST00000403097.1 |
GRB10 |
growth factor receptor-bound protein 10 |
| chr19_-_44124019 | 0.83 |
ENST00000300811.3 |
ZNF428 |
zinc finger protein 428 |
| chr17_-_76836963 | 0.80 |
ENST00000312010.6 |
USP36 |
ubiquitin specific peptidase 36 |
| chr17_-_79895154 | 0.78 |
ENST00000405481.4 ENST00000585215.1 ENST00000577624.1 ENST00000403172.4 |
PYCR1 |
pyrroline-5-carboxylate reductase 1 |
| chr7_-_76829125 | 0.75 |
ENST00000248598.5 |
FGL2 |
fibrinogen-like 2 |
| chr1_-_36945097 | 0.73 |
ENST00000331941.5 ENST00000418048.2 ENST00000338937.5 ENST00000440588.2 |
CSF3R |
colony stimulating factor 3 receptor (granulocyte) |
| chr11_+_73019282 | 0.70 |
ENST00000263674.3 |
ARHGEF17 |
Rho guanine nucleotide exchange factor (GEF) 17 |
| chr12_+_56390964 | 0.68 |
ENST00000356124.4 ENST00000266971.3 ENST00000394115.2 ENST00000547586.1 ENST00000552258.1 ENST00000548274.1 ENST00000546833.1 |
SUOX |
sulfite oxidase |
| chr5_-_35230434 | 0.66 |
ENST00000504500.1 |
PRLR |
prolactin receptor |
| chr17_-_79895097 | 0.66 |
ENST00000402252.2 ENST00000583564.1 ENST00000585244.1 ENST00000337943.5 ENST00000579698.1 |
PYCR1 |
pyrroline-5-carboxylate reductase 1 |
| chr12_+_57914742 | 0.64 |
ENST00000551351.1 |
MBD6 |
methyl-CpG binding domain protein 6 |
| chr1_+_203595903 | 0.64 |
ENST00000367218.3 ENST00000367219.3 ENST00000391954.2 |
ATP2B4 |
ATPase, Ca++ transporting, plasma membrane 4 |
| chr19_-_44123734 | 0.62 |
ENST00000598676.1 |
ZNF428 |
zinc finger protein 428 |
| chr12_+_57624119 | 0.62 |
ENST00000555773.1 ENST00000554975.1 ENST00000449049.3 ENST00000393827.4 |
SHMT2 |
serine hydroxymethyltransferase 2 (mitochondrial) |
| chr9_-_13175823 | 0.60 |
ENST00000545857.1 |
MPDZ |
multiple PDZ domain protein |
| chr5_+_52083730 | 0.58 |
ENST00000282588.6 ENST00000274311.2 |
ITGA1 PELO |
integrin, alpha 1 pelota homolog (Drosophila) |
| chr11_-_3078616 | 0.56 |
ENST00000401769.3 ENST00000278224.9 ENST00000397114.3 ENST00000380525.4 |
CARS |
cysteinyl-tRNA synthetase |
| chr3_+_186435137 | 0.56 |
ENST00000447445.1 |
KNG1 |
kininogen 1 |
| chr1_+_164528866 | 0.53 |
ENST00000420696.2 |
PBX1 |
pre-B-cell leukemia homeobox 1 |
| chr17_+_56315936 | 0.52 |
ENST00000543544.1 |
LPO |
lactoperoxidase |
| chr19_-_11347173 | 0.52 |
ENST00000587656.1 |
DOCK6 |
dedicator of cytokinesis 6 |
| chr4_-_153601136 | 0.52 |
ENST00000504064.1 ENST00000304385.3 |
TMEM154 |
transmembrane protein 154 |
| chr11_+_47279504 | 0.52 |
ENST00000441012.2 ENST00000437276.1 ENST00000436029.1 ENST00000467728.1 ENST00000405853.3 |
NR1H3 |
nuclear receptor subfamily 1, group H, member 3 |
| chr15_+_96869165 | 0.51 |
ENST00000421109.2 |
NR2F2 |
nuclear receptor subfamily 2, group F, member 2 |
| chr2_+_65216462 | 0.51 |
ENST00000234256.3 |
SLC1A4 |
solute carrier family 1 (glutamate/neutral amino acid transporter), member 4 |
| chr1_+_203595689 | 0.50 |
ENST00000357681.5 |
ATP2B4 |
ATPase, Ca++ transporting, plasma membrane 4 |
| chr6_+_126102292 | 0.49 |
ENST00000368357.3 |
NCOA7 |
nuclear receptor coactivator 7 |
| chr12_-_123187890 | 0.48 |
ENST00000328880.5 |
HCAR2 |
hydroxycarboxylic acid receptor 2 |
| chr1_+_53480598 | 0.47 |
ENST00000430330.2 ENST00000408941.3 ENST00000478274.2 ENST00000484100.1 ENST00000435345.2 ENST00000488965.1 |
SCP2 |
sterol carrier protein 2 |
| chr2_+_171785012 | 0.46 |
ENST00000234160.4 |
GORASP2 |
golgi reassembly stacking protein 2, 55kDa |
| chr10_+_111765562 | 0.46 |
ENST00000360162.3 |
ADD3 |
adducin 3 (gamma) |
| chr12_+_57624085 | 0.45 |
ENST00000553474.1 |
SHMT2 |
serine hydroxymethyltransferase 2 (mitochondrial) |
| chr6_-_31939734 | 0.43 |
ENST00000375356.3 |
DXO |
decapping exoribonuclease |
| chr16_-_15736881 | 0.43 |
ENST00000540441.2 |
KIAA0430 |
KIAA0430 |
| chr15_-_61521495 | 0.41 |
ENST00000335670.6 |
RORA |
RAR-related orphan receptor A |
| chr2_+_187350973 | 0.41 |
ENST00000544130.1 |
ZC3H15 |
zinc finger CCCH-type containing 15 |
| chr12_-_56236690 | 0.40 |
ENST00000322569.4 |
MMP19 |
matrix metallopeptidase 19 |
| chr20_+_2821340 | 0.39 |
ENST00000380445.3 ENST00000380469.3 |
VPS16 |
vacuolar protein sorting 16 homolog (S. cerevisiae) |
| chr2_+_28618532 | 0.38 |
ENST00000545753.1 |
FOSL2 |
FOS-like antigen 2 |
| chr1_-_149908217 | 0.38 |
ENST00000369140.3 |
MTMR11 |
myotubularin related protein 11 |
| chr1_+_52682052 | 0.38 |
ENST00000371591.1 |
ZFYVE9 |
zinc finger, FYVE domain containing 9 |
| chr18_+_46065393 | 0.36 |
ENST00000256413.3 |
CTIF |
CBP80/20-dependent translation initiation factor |
| chr14_+_39735411 | 0.35 |
ENST00000603904.1 |
RP11-407N17.3 |
cTAGE family member 5 isoform 4 |
| chr1_-_149908710 | 0.34 |
ENST00000439741.2 ENST00000361405.6 ENST00000406732.3 |
MTMR11 |
myotubularin related protein 11 |
| chr1_+_221051699 | 0.33 |
ENST00000366903.6 |
HLX |
H2.0-like homeobox |
| chr10_-_101190202 | 0.32 |
ENST00000543866.1 ENST00000370508.5 |
GOT1 |
glutamic-oxaloacetic transaminase 1, soluble |
| chr19_+_1105110 | 0.31 |
ENST00000587648.1 |
GPX4 |
glutathione peroxidase 4 |
| chr2_-_43453734 | 0.30 |
ENST00000282388.3 |
ZFP36L2 |
ZFP36 ring finger protein-like 2 |
| chr19_-_4540486 | 0.28 |
ENST00000306390.6 |
LRG1 |
leucine-rich alpha-2-glycoprotein 1 |
| chr11_-_102668879 | 0.28 |
ENST00000315274.6 |
MMP1 |
matrix metallopeptidase 1 (interstitial collagenase) |
| chr12_+_6644443 | 0.28 |
ENST00000396858.1 |
GAPDH |
glyceraldehyde-3-phosphate dehydrogenase |
| chr3_+_138067314 | 0.27 |
ENST00000423968.2 |
MRAS |
muscle RAS oncogene homolog |
| chr22_+_39052632 | 0.26 |
ENST00000411557.1 ENST00000396811.2 ENST00000216029.3 ENST00000416285.1 |
CBY1 |
chibby homolog 1 (Drosophila) |
| chr2_+_5832799 | 0.26 |
ENST00000322002.3 |
SOX11 |
SRY (sex determining region Y)-box 11 |
| chr1_-_23857698 | 0.25 |
ENST00000361729.2 |
E2F2 |
E2F transcription factor 2 |
| chr6_+_31939608 | 0.24 |
ENST00000375331.2 ENST00000375333.2 |
STK19 |
serine/threonine kinase 19 |
| chr3_-_138763734 | 0.24 |
ENST00000413199.1 ENST00000502927.2 |
PRR23C |
proline rich 23C |
| chr10_+_57358750 | 0.23 |
ENST00000512524.2 |
MTRNR2L5 |
MT-RNR2-like 5 |
| chrX_-_43832711 | 0.23 |
ENST00000378062.5 |
NDP |
Norrie disease (pseudoglioma) |
| chr17_-_77813186 | 0.23 |
ENST00000448310.1 ENST00000269397.4 |
CBX4 |
chromobox homolog 4 |
| chr22_-_39640756 | 0.22 |
ENST00000331163.6 |
PDGFB |
platelet-derived growth factor beta polypeptide |
| chr2_+_187350883 | 0.21 |
ENST00000337859.6 |
ZC3H15 |
zinc finger CCCH-type containing 15 |
| chr11_+_63655987 | 0.21 |
ENST00000509502.2 ENST00000512060.1 |
MARK2 |
MAP/microtubule affinity-regulating kinase 2 |
| chr11_-_3078838 | 0.21 |
ENST00000397111.5 |
CARS |
cysteinyl-tRNA synthetase |
| chr6_+_36238237 | 0.21 |
ENST00000457797.1 ENST00000394571.2 |
PNPLA1 |
patatin-like phospholipase domain containing 1 |
| chr19_-_47288162 | 0.21 |
ENST00000594991.1 |
SLC1A5 |
solute carrier family 1 (neutral amino acid transporter), member 5 |
| chr1_-_216978709 | 0.20 |
ENST00000360012.3 |
ESRRG |
estrogen-related receptor gamma |
| chr12_-_123201337 | 0.19 |
ENST00000528880.2 |
HCAR3 |
hydroxycarboxylic acid receptor 3 |
| chr19_-_47287990 | 0.18 |
ENST00000593713.1 ENST00000598022.1 ENST00000434726.2 |
SLC1A5 |
solute carrier family 1 (neutral amino acid transporter), member 5 |
| chr9_+_2621798 | 0.18 |
ENST00000382100.3 |
VLDLR |
very low density lipoprotein receptor |
| chr10_+_95848824 | 0.17 |
ENST00000371385.3 ENST00000371375.1 |
PLCE1 |
phospholipase C, epsilon 1 |
| chr17_+_56315787 | 0.16 |
ENST00000262290.4 ENST00000421678.2 |
LPO |
lactoperoxidase |
| chr2_-_217559517 | 0.16 |
ENST00000449583.1 |
IGFBP5 |
insulin-like growth factor binding protein 5 |
| chr16_+_56965960 | 0.15 |
ENST00000439977.2 ENST00000344114.4 ENST00000300302.5 ENST00000379792.2 |
HERPUD1 |
homocysteine-inducible, endoplasmic reticulum stress-inducible, ubiquitin-like domain member 1 |
| chr16_+_89334512 | 0.14 |
ENST00000602042.1 |
AC137932.1 |
AC137932.1 |
| chr5_-_35230649 | 0.13 |
ENST00000382002.5 |
PRLR |
prolactin receptor |
| chr5_+_38846101 | 0.12 |
ENST00000274276.3 |
OSMR |
oncostatin M receptor |
| chr5_-_137878887 | 0.11 |
ENST00000507939.1 ENST00000572514.1 ENST00000499810.2 ENST00000360541.5 |
ETF1 |
eukaryotic translation termination factor 1 |
| chr14_-_25045446 | 0.10 |
ENST00000216336.2 |
CTSG |
cathepsin G |
| chr16_-_4323015 | 0.10 |
ENST00000204517.6 |
TFAP4 |
transcription factor AP-4 (activating enhancer binding protein 4) |
| chr5_-_158757895 | 0.09 |
ENST00000231228.2 |
IL12B |
interleukin 12B (natural killer cell stimulatory factor 2, cytotoxic lymphocyte maturation factor 2, p40) |
| chr17_+_39846114 | 0.08 |
ENST00000586699.1 |
EIF1 |
eukaryotic translation initiation factor 1 |
| chr3_+_6902794 | 0.07 |
ENST00000357716.4 ENST00000486284.1 ENST00000389336.4 ENST00000403881.1 ENST00000402647.2 |
GRM7 |
glutamate receptor, metabotropic 7 |
| chr19_-_54824344 | 0.06 |
ENST00000346508.3 ENST00000446712.3 ENST00000432233.3 ENST00000301219.3 |
LILRA5 |
leukocyte immunoglobulin-like receptor, subfamily A (with TM domain), member 5 |
| chr3_+_186435065 | 0.06 |
ENST00000287611.2 ENST00000265023.4 |
KNG1 |
kininogen 1 |
| chr4_+_77870960 | 0.04 |
ENST00000505788.1 ENST00000510515.1 ENST00000504637.1 |
SEPT11 |
septin 11 |
| chr11_+_92085707 | 0.04 |
ENST00000525166.1 |
FAT3 |
FAT atypical cadherin 3 |
| chr5_-_145562147 | 0.03 |
ENST00000545646.1 ENST00000274562.9 ENST00000510191.1 ENST00000394434.2 |
LARS |
leucyl-tRNA synthetase |
| chr9_-_117568365 | 0.03 |
ENST00000374045.4 |
TNFSF15 |
tumor necrosis factor (ligand) superfamily, member 15 |
| chr1_-_150602035 | 0.03 |
ENST00000503241.1 ENST00000369016.4 ENST00000339643.5 ENST00000271690.8 ENST00000356527.5 ENST00000362052.7 ENST00000503345.1 ENST00000369014.5 ENST00000369009.3 |
ENSA |
endosulfine alpha |
| chr17_+_44588877 | 0.02 |
ENST00000576629.1 |
LRRC37A2 |
leucine rich repeat containing 37, member A2 |
| chr19_+_44455368 | 0.01 |
ENST00000591168.1 ENST00000587682.1 ENST00000251269.5 |
ZNF221 |
zinc finger protein 221 |
Gene Ontology Analysis
Gene overrepresentation in cellular_component category:
| Log-likelihood per target | Total log-likelihood | Term | Description |
|---|---|---|---|
| 1.4 | 4.3 | GO:1990622 | CHOP-ATF3 complex(GO:1990622) |
| 0.9 | 11.3 | GO:0043203 | axon hillock(GO:0043203) |
| 0.8 | 9.8 | GO:0005577 | fibrinogen complex(GO:0005577) |
| 0.7 | 2.7 | GO:0031838 | haptoglobin-hemoglobin complex(GO:0031838) |
| 0.4 | 7.7 | GO:0031089 | platelet dense granule lumen(GO:0031089) |
| 0.4 | 3.5 | GO:0071953 | elastic fiber(GO:0071953) |
| 0.4 | 2.8 | GO:0070552 | BRISC complex(GO:0070552) |
| 0.2 | 1.6 | GO:0046581 | intercellular canaliculus(GO:0046581) |
| 0.2 | 0.6 | GO:0034665 | integrin alpha1-beta1 complex(GO:0034665) |
| 0.1 | 1.2 | GO:0005915 | zonula adherens(GO:0005915) |
| 0.0 | 3.3 | GO:0031526 | brush border membrane(GO:0031526) |
| 0.0 | 1.1 | GO:0097228 | sperm principal piece(GO:0097228) |
| 0.0 | 1.2 | GO:0032839 | dendrite cytoplasm(GO:0032839) |
| 0.0 | 1.9 | GO:0042645 | nucleoid(GO:0009295) mitochondrial nucleoid(GO:0042645) |
| 0.0 | 2.6 | GO:0005902 | microvillus(GO:0005902) |
| 0.0 | 7.1 | GO:0072562 | blood microparticle(GO:0072562) |
| 0.0 | 0.6 | GO:0043220 | Schmidt-Lanterman incisure(GO:0043220) |
| 0.0 | 0.6 | GO:0010369 | chromocenter(GO:0010369) |
| 0.0 | 0.4 | GO:0030897 | HOPS complex(GO:0030897) |
| 0.0 | 2.8 | GO:0005901 | caveola(GO:0005901) |
| 0.0 | 1.1 | GO:0031430 | M band(GO:0031430) |
| 0.0 | 0.2 | GO:0097427 | microtubule bundle(GO:0097427) |
| 0.0 | 0.1 | GO:1990037 | Lewy body core(GO:1990037) |
| 0.0 | 3.7 | GO:0090575 | RNA polymerase II transcription factor complex(GO:0090575) |
| 0.0 | 1.4 | GO:1904724 | tertiary granule lumen(GO:1904724) |
| 0.0 | 0.2 | GO:0042567 | insulin-like growth factor ternary complex(GO:0042567) |
| 0.0 | 0.1 | GO:0032279 | asymmetric synapse(GO:0032279) |
| 0.0 | 0.2 | GO:0035102 | PRC1 complex(GO:0035102) |
| 0.0 | 1.0 | GO:0005876 | spindle microtubule(GO:0005876) |
| 0.0 | 0.7 | GO:0031904 | endosome lumen(GO:0031904) |
| 0.0 | 0.9 | GO:0005791 | rough endoplasmic reticulum(GO:0005791) |
| 0.0 | 17.2 | GO:0005615 | extracellular space(GO:0005615) |
Gene overrepresentation in C2:CP:REACTOME category:
| Log-likelihood per target | Total log-likelihood | Term | Description |
|---|---|---|---|
| 0.5 | 9.8 | REACTOME INITIAL TRIGGERING OF COMPLEMENT | Genes involved in Initial triggering of complement |
| 0.3 | 8.2 | REACTOME P130CAS LINKAGE TO MAPK SIGNALING FOR INTEGRINS | Genes involved in p130Cas linkage to MAPK signaling for integrins |
| 0.2 | 3.1 | REACTOME GLYCOPROTEIN HORMONES | Genes involved in Glycoprotein hormones |
| 0.2 | 2.7 | REACTOME ABACAVIR TRANSPORT AND METABOLISM | Genes involved in Abacavir transport and metabolism |
| 0.2 | 1.7 | REACTOME NEGATIVE REGULATION OF THE PI3K AKT NETWORK | Genes involved in Negative regulation of the PI3K/AKT network |
| 0.1 | 4.4 | REACTOME ACTIVATION OF GENES BY ATF4 | Genes involved in Activation of Genes by ATF4 |
| 0.1 | 1.4 | REACTOME REGULATION OF INSULIN SECRETION BY ACETYLCHOLINE | Genes involved in Regulation of Insulin Secretion by Acetylcholine |
| 0.1 | 3.8 | REACTOME SULFUR AMINO ACID METABOLISM | Genes involved in Sulfur amino acid metabolism |
| 0.1 | 2.0 | REACTOME NA CL DEPENDENT NEUROTRANSMITTER TRANSPORTERS | Genes involved in Na+/Cl- dependent neurotransmitter transporters |
| 0.1 | 2.6 | REACTOME EXTRINSIC PATHWAY FOR APOPTOSIS | Genes involved in Extrinsic Pathway for Apoptosis |
| 0.1 | 2.2 | REACTOME METABOLISM OF PORPHYRINS | Genes involved in Metabolism of porphyrins |
| 0.0 | 1.0 | REACTOME CIRCADIAN REPRESSION OF EXPRESSION BY REV ERBA | Genes involved in Circadian Repression of Expression by REV-ERBA |
| 0.0 | 1.6 | REACTOME ABC FAMILY PROTEINS MEDIATED TRANSPORT | Genes involved in ABC-family proteins mediated transport |
| 0.0 | 0.8 | REACTOME SIGNAL ATTENUATION | Genes involved in Signal attenuation |
| 0.0 | 3.8 | REACTOME NUCLEAR RECEPTOR TRANSCRIPTION PATHWAY | Genes involved in Nuclear Receptor transcription pathway |
| 0.0 | 1.6 | REACTOME BASIGIN INTERACTIONS | Genes involved in Basigin interactions |
| 0.0 | 1.2 | REACTOME ASSOCIATION OF TRIC CCT WITH TARGET PROTEINS DURING BIOSYNTHESIS | Genes involved in Association of TriC/CCT with target proteins during biosynthesis |
| 0.0 | 0.6 | REACTOME INTRINSIC PATHWAY | Genes involved in Intrinsic Pathway |
| 0.0 | 0.6 | REACTOME OTHER SEMAPHORIN INTERACTIONS | Genes involved in Other semaphorin interactions |
| 0.0 | 0.5 | REACTOME ALPHA LINOLENIC ACID ALA METABOLISM | Genes involved in alpha-linolenic acid (ALA) metabolism |
| 0.0 | 0.6 | REACTOME PROLACTIN RECEPTOR SIGNALING | Genes involved in Prolactin receptor signaling |
| 0.0 | 0.3 | REACTOME CDC6 ASSOCIATION WITH THE ORC ORIGIN COMPLEX | Genes involved in CDC6 association with the ORC:origin complex |
| 0.0 | 3.2 | REACTOME SIGNALING BY EGFR IN CANCER | Genes involved in Signaling by EGFR in Cancer |
| 0.0 | 0.8 | REACTOME IL1 SIGNALING | Genes involved in Interleukin-1 signaling |
| 0.0 | 1.4 | REACTOME RESPIRATORY ELECTRON TRANSPORT | Genes involved in Respiratory electron transport |
| 0.0 | 0.7 | REACTOME NRAGE SIGNALS DEATH THROUGH JNK | Genes involved in NRAGE signals death through JNK |
| 0.0 | 0.3 | REACTOME REGULATION OF INSULIN LIKE GROWTH FACTOR IGF ACTIVITY BY INSULIN LIKE GROWTH FACTOR BINDING PROTEINS IGFBPS | Genes involved in Regulation of Insulin-like Growth Factor (IGF) Activity by Insulin-like Growth Factor Binding Proteins (IGFBPs) |
| 0.0 | 0.3 | REACTOME AMINO ACID SYNTHESIS AND INTERCONVERSION TRANSAMINATION | Genes involved in Amino acid synthesis and interconversion (transamination) |
| 0.0 | 2.4 | REACTOME METABOLISM OF AMINO ACIDS AND DERIVATIVES | Genes involved in Metabolism of amino acids and derivatives |
| 0.0 | 0.4 | REACTOME DOWNREGULATION OF TGF BETA RECEPTOR SIGNALING | Genes involved in Downregulation of TGF-beta receptor signaling |
Gene overrepresentation in biological_process category:
| Log-likelihood per target | Total log-likelihood | Term | Description |
|---|---|---|---|
| 2.3 | 11.3 | GO:0071279 | cellular response to cobalt ion(GO:0071279) |
| 1.4 | 4.2 | GO:0052047 | interaction with other organism via secreted substance involved in symbiotic interaction(GO:0052047) |
| 1.2 | 3.5 | GO:0006982 | response to lipid hydroperoxide(GO:0006982) |
| 1.1 | 3.2 | GO:0061394 | regulation of transcription from RNA polymerase II promoter in response to arsenic-containing substance(GO:0061394) |
| 1.1 | 3.2 | GO:0032474 | otolith morphogenesis(GO:0032474) |
| 0.9 | 2.8 | GO:0006535 | cysteine biosynthetic process from serine(GO:0006535) |
| 0.9 | 2.8 | GO:0006788 | heme oxidation(GO:0006788) smooth muscle hyperplasia(GO:0014806) |
| 0.9 | 2.7 | GO:2000296 | negative regulation of hydrogen peroxide catabolic process(GO:2000296) |
| 0.8 | 2.3 | GO:0019557 | histidine catabolic process to glutamate and formamide(GO:0019556) histidine catabolic process to glutamate and formate(GO:0019557) formamide metabolic process(GO:0043606) |
| 0.8 | 7.7 | GO:0051918 | negative regulation of fibrinolysis(GO:0051918) |
| 0.8 | 3.1 | GO:0006114 | glycerol biosynthetic process(GO:0006114) |
| 0.8 | 3.0 | GO:2000230 | negative regulation of pancreatic stellate cell proliferation(GO:2000230) |
| 0.5 | 1.6 | GO:0050787 | antibiotic metabolic process(GO:0016999) detoxification of mercury ion(GO:0050787) response to antineoplastic agent(GO:0097327) |
| 0.5 | 6.5 | GO:2000427 | positive regulation of apoptotic cell clearance(GO:2000427) |
| 0.5 | 1.4 | GO:0090427 | activation of meiosis(GO:0090427) |
| 0.4 | 2.1 | GO:0052199 | negative regulation of catalytic activity in other organism involved in symbiotic interaction(GO:0052199) |
| 0.4 | 3.3 | GO:2001256 | regulation of store-operated calcium entry(GO:2001256) |
| 0.4 | 2.8 | GO:0019264 | glycine biosynthetic process from serine(GO:0019264) |
| 0.4 | 1.6 | GO:0060054 | positive regulation of epithelial cell proliferation involved in wound healing(GO:0060054) |
| 0.4 | 1.1 | GO:2000282 | negative regulation of nitric oxide mediated signal transduction(GO:0010751) regulation of cellular amine catabolic process(GO:0033241) negative regulation of cellular amine catabolic process(GO:0033242) negative regulation of the force of heart contraction(GO:0098736) regulation of arginine catabolic process(GO:1900081) negative regulation of arginine catabolic process(GO:1900082) regulation of citrulline biosynthetic process(GO:1903248) negative regulation of citrulline biosynthetic process(GO:1903249) regulation of cellular amino acid biosynthetic process(GO:2000282) negative regulation of cellular amino acid biosynthetic process(GO:2000283) |
| 0.4 | 1.1 | GO:0036309 | protein localization to M-band(GO:0036309) protein localization to T-tubule(GO:0036371) |
| 0.4 | 1.1 | GO:0032792 | negative regulation of CREB transcription factor activity(GO:0032792) |
| 0.3 | 3.5 | GO:0048251 | elastic fiber assembly(GO:0048251) |
| 0.3 | 1.9 | GO:0034201 | response to oleic acid(GO:0034201) |
| 0.3 | 1.2 | GO:0045218 | zonula adherens maintenance(GO:0045218) |
| 0.3 | 2.6 | GO:0071550 | death-inducing signaling complex assembly(GO:0071550) |
| 0.3 | 3.7 | GO:0045721 | negative regulation of gluconeogenesis(GO:0045721) |
| 0.3 | 0.8 | GO:0006423 | cysteinyl-tRNA aminoacylation(GO:0006423) |
| 0.3 | 4.8 | GO:0090331 | negative regulation of platelet aggregation(GO:0090331) |
| 0.2 | 1.5 | GO:0015811 | L-cystine transport(GO:0015811) |
| 0.2 | 1.4 | GO:0006561 | proline biosynthetic process(GO:0006561) L-proline biosynthetic process(GO:0055129) |
| 0.2 | 0.5 | GO:0090341 | negative regulation of secretion of lysosomal enzymes(GO:0090341) |
| 0.2 | 2.6 | GO:2000194 | regulation of female gonad development(GO:2000194) |
| 0.2 | 3.3 | GO:0006957 | complement activation, alternative pathway(GO:0006957) |
| 0.1 | 0.5 | GO:0009956 | radial pattern formation(GO:0009956) |
| 0.1 | 0.8 | GO:2000660 | negative regulation of interleukin-1-mediated signaling pathway(GO:2000660) |
| 0.1 | 0.7 | GO:0019418 | sulfide oxidation(GO:0019418) sulfide oxidation, using sulfide:quinone oxidoreductase(GO:0070221) |
| 0.1 | 0.6 | GO:0038161 | prolactin signaling pathway(GO:0038161) |
| 0.1 | 0.4 | GO:0010585 | glutamine secretion(GO:0010585) L-glutamine import(GO:0036229) L-glutamine import into cell(GO:1903803) |
| 0.1 | 0.6 | GO:0070966 | nuclear-transcribed mRNA catabolic process, no-go decay(GO:0070966) |
| 0.1 | 0.5 | GO:0033031 | positive regulation of neutrophil apoptotic process(GO:0033031) |
| 0.1 | 1.9 | GO:0097186 | amelogenesis(GO:0097186) |
| 0.1 | 0.5 | GO:0032383 | regulation of intracellular lipid transport(GO:0032377) regulation of intracellular sterol transport(GO:0032380) regulation of intracellular cholesterol transport(GO:0032383) |
| 0.1 | 0.3 | GO:0035606 | induction of programmed cell death(GO:0012502) peptidyl-cysteine S-trans-nitrosylation(GO:0035606) positive regulation of apoptotic process in other organism(GO:0044533) positive regulation by symbiont of host programmed cell death(GO:0052042) positive regulation by organism of programmed cell death in other organism involved in symbiotic interaction(GO:0052330) positive regulation by organism of apoptotic process in other organism involved in symbiotic interaction(GO:0052501) |
| 0.1 | 1.4 | GO:0033539 | fatty acid beta-oxidation using acyl-CoA dehydrogenase(GO:0033539) |
| 0.1 | 0.3 | GO:0061386 | soft palate development(GO:0060023) closure of optic fissure(GO:0061386) |
| 0.1 | 0.2 | GO:1905064 | cell migration involved in kidney development(GO:0035787) cell migration involved in metanephros development(GO:0035788) metanephric mesenchymal cell migration(GO:0035789) positive regulation of metanephric mesenchymal cell migration by platelet-derived growth factor receptor-beta signaling pathway(GO:0035793) phenotypic switching(GO:0036166) negative regulation of phospholipid biosynthetic process(GO:0071072) regulation of metanephric mesenchymal cell migration by platelet-derived growth factor receptor-beta signaling pathway(GO:1900238) regulation of phenotypic switching(GO:1900239) negative regulation of vascular smooth muscle cell differentiation(GO:1905064) regulation of metanephric mesenchymal cell migration(GO:2000589) positive regulation of metanephric mesenchymal cell migration(GO:2000591) |
| 0.1 | 1.2 | GO:0043562 | cellular response to nitrogen starvation(GO:0006995) cellular response to nitrogen levels(GO:0043562) |
| 0.1 | 0.3 | GO:0045629 | negative regulation of T-helper 2 cell differentiation(GO:0045629) |
| 0.1 | 0.8 | GO:0046325 | negative regulation of glucose import(GO:0046325) |
| 0.1 | 1.2 | GO:0045717 | negative regulation of fatty acid biosynthetic process(GO:0045717) |
| 0.1 | 0.2 | GO:0035426 | extracellular matrix-cell signaling(GO:0035426) |
| 0.1 | 0.2 | GO:1904204 | regulation of skeletal muscle hypertrophy(GO:1904204) |
| 0.1 | 1.9 | GO:0008045 | motor neuron axon guidance(GO:0008045) |
| 0.1 | 0.3 | GO:1990086 | lens fiber cell apoptotic process(GO:1990086) |
| 0.0 | 0.2 | GO:1902109 | negative regulation of mitochondrial membrane permeability involved in apoptotic process(GO:1902109) |
| 0.0 | 2.9 | GO:0010862 | positive regulation of pathway-restricted SMAD protein phosphorylation(GO:0010862) |
| 0.0 | 0.4 | GO:0035542 | regulation of SNARE complex assembly(GO:0035542) |
| 0.0 | 0.3 | GO:1904628 | response to phorbol 13-acetate 12-myristate(GO:1904627) cellular response to phorbol 13-acetate 12-myristate(GO:1904628) |
| 0.0 | 2.7 | GO:0035914 | skeletal muscle cell differentiation(GO:0035914) |
| 0.0 | 0.2 | GO:0038026 | reelin-mediated signaling pathway(GO:0038026) |
| 0.0 | 0.2 | GO:0001554 | luteolysis(GO:0001554) |
| 0.0 | 0.2 | GO:0006651 | diacylglycerol biosynthetic process(GO:0006651) |
| 0.0 | 0.4 | GO:0021694 | cerebellar Purkinje cell layer formation(GO:0021694) cerebellar Purkinje cell differentiation(GO:0021702) |
| 0.0 | 0.6 | GO:0007597 | blood coagulation, intrinsic pathway(GO:0007597) |
| 0.0 | 0.1 | GO:0038165 | oncostatin-M-mediated signaling pathway(GO:0038165) |
| 0.0 | 0.4 | GO:0071027 | nuclear RNA surveillance(GO:0071027) nuclear mRNA surveillance(GO:0071028) |
| 0.0 | 0.5 | GO:1903204 | negative regulation of oxidative stress-induced neuron death(GO:1903204) |
| 0.0 | 0.7 | GO:0042744 | hydrogen peroxide catabolic process(GO:0042744) |
| 0.0 | 1.4 | GO:1903146 | regulation of mitophagy(GO:1903146) |
| 0.0 | 0.4 | GO:0007184 | SMAD protein import into nucleus(GO:0007184) |
| 0.0 | 0.5 | GO:0010971 | positive regulation of G2/M transition of mitotic cell cycle(GO:0010971) embryonic hemopoiesis(GO:0035162) |
| 0.0 | 0.1 | GO:0051140 | regulation of NK T cell proliferation(GO:0051140) positive regulation of NK T cell proliferation(GO:0051142) |
| 0.0 | 0.4 | GO:0003334 | keratinocyte development(GO:0003334) |
| 0.0 | 0.3 | GO:0019372 | lipoxygenase pathway(GO:0019372) |
| 0.0 | 0.1 | GO:0070942 | neutrophil mediated cytotoxicity(GO:0070942) neutrophil mediated killing of symbiont cell(GO:0070943) neutrophil mediated killing of bacterium(GO:0070944) |
| 0.0 | 0.1 | GO:0009048 | dosage compensation by inactivation of X chromosome(GO:0009048) |
| 0.0 | 0.9 | GO:0070527 | platelet aggregation(GO:0070527) |
| 0.0 | 1.2 | GO:0070373 | negative regulation of ERK1 and ERK2 cascade(GO:0070373) |
| 0.0 | 0.3 | GO:1903846 | positive regulation of transforming growth factor beta receptor signaling pathway(GO:0030511) positive regulation of cellular response to transforming growth factor beta stimulus(GO:1903846) |
| 0.0 | 1.5 | GO:1990823 | response to leukemia inhibitory factor(GO:1990823) cellular response to leukemia inhibitory factor(GO:1990830) |
| 0.0 | 0.0 | GO:0006425 | glutaminyl-tRNA aminoacylation(GO:0006425) valyl-tRNA aminoacylation(GO:0006438) |
| 0.0 | 1.0 | GO:0016575 | histone deacetylation(GO:0016575) |
| 0.0 | 0.1 | GO:0014050 | negative regulation of glutamate secretion(GO:0014050) |
Gene overrepresentation in molecular_function category:
| Log-likelihood per target | Total log-likelihood | Term | Description |
|---|---|---|---|
| 1.5 | 7.7 | GO:0060230 | lipoprotein lipase activator activity(GO:0060230) |
| 0.9 | 2.8 | GO:0004122 | cystathionine beta-synthase activity(GO:0004122) oxidoreductase activity, acting on other nitrogenous compounds as donors, cytochrome as acceptor(GO:0016662) nitrite reductase (NO-forming) activity(GO:0050421) carbon monoxide binding(GO:0070025) nitrite reductase activity(GO:0098809) |
| 0.9 | 2.8 | GO:0004392 | heme oxygenase (decyclizing) activity(GO:0004392) |
| 0.9 | 2.7 | GO:0004613 | phosphoenolpyruvate carboxykinase activity(GO:0004611) phosphoenolpyruvate carboxykinase (GTP) activity(GO:0004613) |
| 0.6 | 1.9 | GO:0004087 | carbamoyl-phosphate synthase (ammonia) activity(GO:0004087) carbamoyl-phosphate synthase (glutamine-hydrolyzing) activity(GO:0004088) |
| 0.6 | 2.3 | GO:0016841 | ammonia-lyase activity(GO:0016841) |
| 0.5 | 2.6 | GO:0043120 | tumor necrosis factor binding(GO:0043120) |
| 0.5 | 1.9 | GO:0051916 | granulocyte colony-stimulating factor binding(GO:0051916) |
| 0.4 | 2.7 | GO:0030492 | hemoglobin binding(GO:0030492) |
| 0.4 | 2.8 | GO:0004372 | glycine hydroxymethyltransferase activity(GO:0004372) threonine aldolase activity(GO:0004793) L-allo-threonine aldolase activity(GO:0008732) |
| 0.4 | 1.1 | GO:0036487 | nitric-oxide synthase inhibitor activity(GO:0036487) |
| 0.4 | 1.4 | GO:0004735 | pyrroline-5-carboxylate reductase activity(GO:0004735) |
| 0.3 | 2.7 | GO:0050692 | DBD domain binding(GO:0050692) |
| 0.3 | 3.5 | GO:0008430 | selenium binding(GO:0008430) |
| 0.3 | 0.8 | GO:0005150 | interleukin-1, Type I receptor binding(GO:0005150) |
| 0.3 | 2.4 | GO:0000099 | sulfur amino acid transmembrane transporter activity(GO:0000099) |
| 0.3 | 2.1 | GO:0001849 | complement component C1q binding(GO:0001849) |
| 0.3 | 0.8 | GO:0004817 | cysteine-tRNA ligase activity(GO:0004817) |
| 0.2 | 6.5 | GO:0001848 | complement binding(GO:0001848) |
| 0.2 | 0.5 | GO:0070538 | oleic acid binding(GO:0070538) |
| 0.1 | 0.4 | GO:0034353 | RNA pyrophosphohydrolase activity(GO:0034353) |
| 0.1 | 0.3 | GO:0019828 | aspartic-type endopeptidase inhibitor activity(GO:0019828) |
| 0.1 | 0.7 | GO:0030151 | molybdenum ion binding(GO:0030151) |
| 0.1 | 1.6 | GO:0043225 | anion transmembrane-transporting ATPase activity(GO:0043225) |
| 0.1 | 0.5 | GO:0032810 | sterol response element binding(GO:0032810) |
| 0.1 | 0.6 | GO:0004925 | prolactin receptor activity(GO:0004925) |
| 0.1 | 0.6 | GO:0098639 | collagen binding involved in cell-matrix adhesion(GO:0098639) |
| 0.1 | 0.3 | GO:0004609 | phosphatidylserine decarboxylase activity(GO:0004609) L-phenylalanine aminotransferase activity(GO:0070546) L-phenylalanine:2-oxoglutarate aminotransferase activity(GO:0080130) |
| 0.1 | 1.7 | GO:0055106 | ubiquitin-protein transferase regulator activity(GO:0055106) |
| 0.1 | 0.4 | GO:0015186 | L-glutamine transmembrane transporter activity(GO:0015186) |
| 0.1 | 10.3 | GO:0004867 | serine-type endopeptidase inhibitor activity(GO:0004867) |
| 0.1 | 2.0 | GO:0005328 | neurotransmitter:sodium symporter activity(GO:0005328) |
| 0.1 | 4.2 | GO:0016504 | peptidase activator activity(GO:0016504) |
| 0.1 | 0.3 | GO:0047066 | phospholipid-hydroperoxide glutathione peroxidase activity(GO:0047066) |
| 0.1 | 1.1 | GO:0008140 | cAMP response element binding protein binding(GO:0008140) |
| 0.1 | 1.2 | GO:0008569 | ATP-dependent microtubule motor activity, minus-end-directed(GO:0008569) |
| 0.1 | 0.4 | GO:0008142 | oxysterol binding(GO:0008142) |
| 0.1 | 1.2 | GO:0050811 | GABA receptor binding(GO:0050811) |
| 0.1 | 1.5 | GO:0004435 | phosphatidylinositol phospholipase C activity(GO:0004435) |
| 0.0 | 6.4 | GO:0005179 | hormone activity(GO:0005179) |
| 0.0 | 3.7 | GO:0030971 | receptor tyrosine kinase binding(GO:0030971) |
| 0.0 | 0.2 | GO:0038025 | glycoprotein transporter activity(GO:0034437) reelin receptor activity(GO:0038025) |
| 0.0 | 1.9 | GO:0046875 | ephrin receptor binding(GO:0046875) |
| 0.0 | 1.5 | GO:0030742 | GTP-dependent protein binding(GO:0030742) |
| 0.0 | 0.1 | GO:0004924 | oncostatin-M receptor activity(GO:0004924) |
| 0.0 | 1.1 | GO:0015464 | acetylcholine receptor activity(GO:0015464) |
| 0.0 | 0.1 | GO:0070905 | serine binding(GO:0070905) |
| 0.0 | 0.8 | GO:0005158 | insulin receptor binding(GO:0005158) |
| 0.0 | 0.2 | GO:0016176 | superoxide-generating NADPH oxidase activator activity(GO:0016176) |
| 0.0 | 0.2 | GO:0050682 | AF-2 domain binding(GO:0050682) |
| 0.0 | 5.8 | GO:0030674 | protein binding, bridging(GO:0030674) |
| 0.0 | 1.7 | GO:0004843 | thiol-dependent ubiquitin-specific protease activity(GO:0004843) |
| 0.0 | 3.5 | GO:0005178 | integrin binding(GO:0005178) |
| 0.0 | 0.3 | GO:0035925 | mRNA 3'-UTR AU-rich region binding(GO:0035925) |
| 0.0 | 3.2 | GO:0001078 | transcriptional repressor activity, RNA polymerase II core promoter proximal region sequence-specific binding(GO:0001078) |
| 0.0 | 0.1 | GO:0008079 | translation release factor activity(GO:0003747) translation termination factor activity(GO:0008079) |
| 0.0 | 0.2 | GO:0031995 | insulin-like growth factor II binding(GO:0031995) |
| 0.0 | 0.5 | GO:0001972 | retinoic acid binding(GO:0001972) |
| 0.0 | 3.5 | GO:0004252 | serine-type endopeptidase activity(GO:0004252) |
| 0.0 | 0.7 | GO:0004601 | peroxidase activity(GO:0004601) |
| 0.0 | 0.0 | GO:0004819 | glutamine-tRNA ligase activity(GO:0004819) valine-tRNA ligase activity(GO:0004832) |
| 0.0 | 1.3 | GO:0008013 | beta-catenin binding(GO:0008013) |
| 0.0 | 0.2 | GO:0032183 | SUMO binding(GO:0032183) |
| 0.0 | 1.4 | GO:0009055 | electron carrier activity(GO:0009055) |
| 0.0 | 3.1 | GO:0030246 | carbohydrate binding(GO:0030246) |
| 0.0 | 0.1 | GO:0005143 | interleukin-12 receptor binding(GO:0005143) |
| 0.0 | 0.2 | GO:0050321 | tau-protein kinase activity(GO:0050321) |
Gene overrepresentation in C2:CP category:
| Log-likelihood per target | Total log-likelihood | Term | Description |
|---|---|---|---|
| 0.2 | 6.3 | ST G ALPHA S PATHWAY | G alpha s Pathway |
| 0.2 | 9.3 | PID UPA UPAR PATHWAY | Urokinase-type plasminogen activator (uPA) and uPAR-mediated signaling |
| 0.1 | 2.6 | SA MMP CYTOKINE CONNECTION | Cytokines can induce activation of matrix metalloproteinases, which degrade extracellular matrix. |
| 0.1 | 3.2 | PID RXR VDR PATHWAY | RXR and RAR heterodimerization with other nuclear receptor |
| 0.1 | 2.1 | ST MYOCYTE AD PATHWAY | Myocyte Adrenergic Pathway is a specific case of the generalized Adrenergic Pathway. |
| 0.1 | 3.4 | PID FRA PATHWAY | Validated transcriptional targets of AP1 family members Fra1 and Fra2 |
| 0.1 | 3.7 | PID A6B1 A6B4 INTEGRIN PATHWAY | a6b1 and a6b4 Integrin signaling |
| 0.1 | 1.4 | ST G ALPHA I PATHWAY | G alpha i Pathway |
| 0.1 | 3.8 | PID ERBB4 PATHWAY | ErbB4 signaling events |
| 0.0 | 10.7 | NABA ECM REGULATORS | Genes encoding enzymes and their regulators involved in the remodeling of the extracellular matrix |
| 0.0 | 2.7 | PID HNF3B PATHWAY | FOXA2 and FOXA3 transcription factor networks |
| 0.0 | 3.2 | PID AP1 PATHWAY | AP-1 transcription factor network |
| 0.0 | 2.4 | PID RAC1 REG PATHWAY | Regulation of RAC1 activity |
| 0.0 | 0.6 | PID LYMPH ANGIOGENESIS PATHWAY | VEGFR3 signaling in lymphatic endothelium |
| 0.0 | 0.8 | PID IGF1 PATHWAY | IGF1 pathway |
| 0.0 | 1.2 | PID ECADHERIN STABILIZATION PATHWAY | Stabilization and expansion of the E-cadherin adherens junction |
| 0.0 | 1.5 | ST INTEGRIN SIGNALING PATHWAY | Integrin Signaling Pathway |
| 0.0 | 1.1 | PID P38 ALPHA BETA DOWNSTREAM PATHWAY | Signaling mediated by p38-alpha and p38-beta |
| 0.0 | 0.8 | PID IL1 PATHWAY | IL1-mediated signaling events |
| 0.0 | 0.3 | SA REG CASCADE OF CYCLIN EXPR | Expression of cyclins regulates progression through the cell cycle by activating cyclin-dependent kinases. |
| 0.0 | 0.2 | PID NECTIN PATHWAY | Nectin adhesion pathway |
| 0.0 | 0.7 | PID RHOA REG PATHWAY | Regulation of RhoA activity |