Project
ENCODE cell lines, expression (Ernst 2011)
Navigation
Downloads
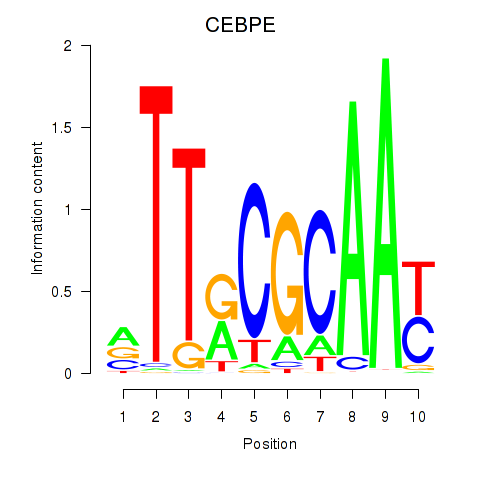
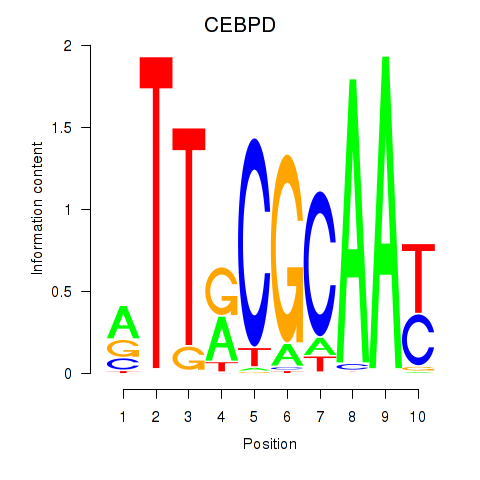
Results for CEBPE_CEBPD
Z-value: 1.95
Motif logo
Transcription factors associated with CEBPE_CEBPD
| Gene Symbol | Gene ID | Gene Info |
|---|---|---|
|
CEBPE
|
ENSG00000092067.5 | CEBPE |
|
CEBPD
|
ENSG00000221869.4 | CEBPD |
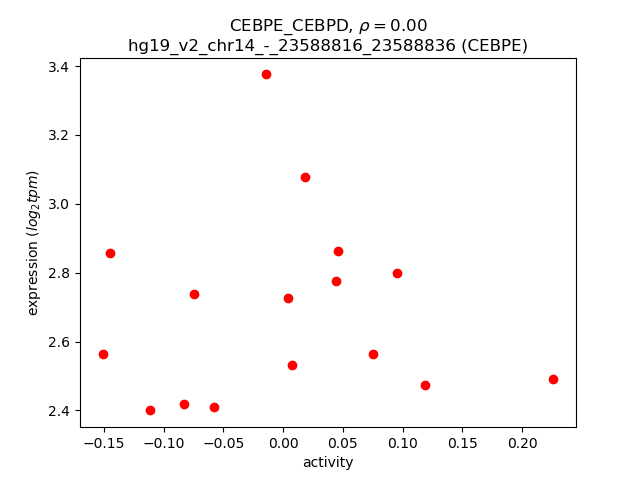
Activity-expression correlation:
| Gene | Promoter | Pearson corr. coef. | P-value | Plot |
|---|---|---|---|---|
| CEBPD | hg19_v2_chr8_-_48651648_48651648 | 0.48 | 5.9e-02 | Click! |
| CEBPE | hg19_v2_chr14_-_23588816_23588836 | 0.00 | 9.9e-01 | Click! |
Activity profile of CEBPE_CEBPD motif
Sorted Z-values of CEBPE_CEBPD motif
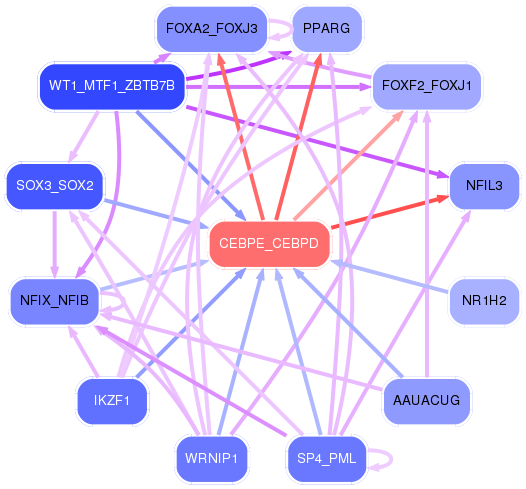
Network of associatons between targets according to the STRING database.

First level regulatory network of CEBPE_CEBPD
| Promoter | Score | Transcript | Gene | Gene Info |
|---|---|---|---|---|
| chr3_+_186330712 | 7.60 |
ENST00000411641.2 ENST00000273784.5 |
AHSG |
alpha-2-HS-glycoprotein |
| chr19_-_6720686 | 7.53 |
ENST00000245907.6 |
C3 |
complement component 3 |
| chr8_-_27468842 | 6.98 |
ENST00000523500.1 |
CLU |
clusterin |
| chr3_-_148939835 | 6.88 |
ENST00000264613.6 |
CP |
ceruloplasmin (ferroxidase) |
| chr8_-_27468945 | 5.70 |
ENST00000405140.3 |
CLU |
clusterin |
| chr8_-_134309823 | 5.61 |
ENST00000414097.2 |
NDRG1 |
N-myc downstream regulated 1 |
| chr1_+_169079823 | 5.59 |
ENST00000367813.3 |
ATP1B1 |
ATPase, Na+/K+ transporting, beta 1 polypeptide |
| chrX_-_131547625 | 5.41 |
ENST00000394311.2 |
MBNL3 |
muscleblind-like splicing regulator 3 |
| chrX_-_131547596 | 5.34 |
ENST00000538204.1 ENST00000370849.3 |
MBNL3 |
muscleblind-like splicing regulator 3 |
| chr2_+_102721023 | 5.30 |
ENST00000409589.1 ENST00000409329.1 |
IL1R1 |
interleukin 1 receptor, type I |
| chr8_-_134309335 | 5.29 |
ENST00000522890.1 ENST00000323851.7 ENST00000518176.1 ENST00000354944.5 ENST00000537882.1 ENST00000522476.1 ENST00000518066.1 ENST00000521544.1 ENST00000518480.1 ENST00000523892.1 |
NDRG1 |
N-myc downstream regulated 1 |
| chr8_-_27469196 | 5.29 |
ENST00000546343.1 ENST00000560566.1 |
CLU |
clusterin |
| chr9_-_94186131 | 4.99 |
ENST00000297689.3 |
NFIL3 |
nuclear factor, interleukin 3 regulated |
| chr3_+_12392971 | 4.31 |
ENST00000287820.6 |
PPARG |
peroxisome proliferator-activated receptor gamma |
| chr6_+_31895254 | 4.17 |
ENST00000299367.5 ENST00000442278.2 |
C2 |
complement component 2 |
| chr6_+_31895467 | 3.94 |
ENST00000556679.1 ENST00000456570.1 |
CFB CFB |
complement factor B Complement factor B; Uncharacterized protein; cDNA FLJ55673, highly similar to Complement factor B |
| chr20_-_17662878 | 3.93 |
ENST00000377813.1 ENST00000377807.2 ENST00000360807.4 ENST00000398782.2 |
RRBP1 |
ribosome binding protein 1 |
| chr20_-_22566089 | 3.86 |
ENST00000377115.4 |
FOXA2 |
forkhead box A2 |
| chr6_+_31895480 | 3.81 |
ENST00000418949.2 ENST00000383177.3 ENST00000477310.1 |
C2 CFB |
complement component 2 Complement factor B; Uncharacterized protein; cDNA FLJ55673, highly similar to Complement factor B |
| chrX_-_105282712 | 3.63 |
ENST00000372563.1 |
SERPINA7 |
serpin peptidase inhibitor, clade A (alpha-1 antiproteinase, antitrypsin), member 7 |
| chr15_+_45926919 | 3.61 |
ENST00000561735.1 ENST00000260324.7 |
SQRDL |
sulfide quinone reductase-like (yeast) |
| chr16_+_72088376 | 3.58 |
ENST00000570083.1 ENST00000355906.5 ENST00000398131.2 ENST00000569639.1 ENST00000564499.1 ENST00000357763.4 ENST00000562526.1 ENST00000565574.1 ENST00000568417.2 ENST00000356967.5 |
HP HPR |
haptoglobin haptoglobin-related protein |
| chr12_+_7167980 | 3.50 |
ENST00000360817.5 ENST00000402681.3 |
C1S |
complement component 1, s subcomponent |
| chr10_-_82049424 | 3.43 |
ENST00000372213.3 |
MAT1A |
methionine adenosyltransferase I, alpha |
| chr19_+_11350278 | 3.36 |
ENST00000252453.8 |
C19orf80 |
chromosome 19 open reading frame 80 |
| chr1_+_154377669 | 3.33 |
ENST00000368485.3 ENST00000344086.4 |
IL6R |
interleukin 6 receptor |
| chr2_+_11674213 | 3.25 |
ENST00000381486.2 |
GREB1 |
growth regulation by estrogen in breast cancer 1 |
| chr17_-_7017968 | 3.22 |
ENST00000355035.5 |
ASGR2 |
asialoglycoprotein receptor 2 |
| chr12_+_102271129 | 3.22 |
ENST00000258534.8 |
DRAM1 |
DNA-damage regulated autophagy modulator 1 |
| chr17_-_7018128 | 3.21 |
ENST00000380952.2 ENST00000254850.7 |
ASGR2 |
asialoglycoprotein receptor 2 |
| chr3_-_99594948 | 3.05 |
ENST00000471562.1 ENST00000495625.2 |
FILIP1L |
filamin A interacting protein 1-like |
| chr2_-_216300784 | 2.96 |
ENST00000421182.1 ENST00000432072.2 ENST00000323926.6 ENST00000336916.4 ENST00000357867.4 ENST00000359671.1 ENST00000346544.3 ENST00000345488.5 ENST00000357009.2 ENST00000446046.1 ENST00000356005.4 ENST00000443816.1 ENST00000426059.1 ENST00000354785.4 |
FN1 |
fibronectin 1 |
| chr13_-_46679185 | 2.93 |
ENST00000439329.3 |
CPB2 |
carboxypeptidase B2 (plasma) |
| chr3_-_99595037 | 2.90 |
ENST00000383694.2 |
FILIP1L |
filamin A interacting protein 1-like |
| chr13_-_46679144 | 2.89 |
ENST00000181383.4 |
CPB2 |
carboxypeptidase B2 (plasma) |
| chr12_-_123201337 | 2.81 |
ENST00000528880.2 |
HCAR3 |
hydroxycarboxylic acid receptor 3 |
| chr3_+_133465228 | 2.75 |
ENST00000482271.1 ENST00000264998.3 |
TF |
transferrin |
| chr12_-_96390063 | 2.65 |
ENST00000541929.1 |
HAL |
histidine ammonia-lyase |
| chr9_-_130712995 | 2.53 |
ENST00000373084.4 |
FAM102A |
family with sequence similarity 102, member A |
| chr4_+_55095264 | 2.49 |
ENST00000257290.5 |
PDGFRA |
platelet-derived growth factor receptor, alpha polypeptide |
| chr12_-_123187890 | 2.31 |
ENST00000328880.5 |
HCAR2 |
hydroxycarboxylic acid receptor 2 |
| chr20_+_56136136 | 2.03 |
ENST00000319441.4 ENST00000543666.1 |
PCK1 |
phosphoenolpyruvate carboxykinase 1 (soluble) |
| chr12_-_96390108 | 1.85 |
ENST00000538703.1 ENST00000261208.3 |
HAL |
histidine ammonia-lyase |
| chr1_+_82266053 | 1.85 |
ENST00000370715.1 ENST00000370713.1 ENST00000319517.6 ENST00000370717.2 ENST00000394879.1 ENST00000271029.4 ENST00000335786.5 |
LPHN2 |
latrophilin 2 |
| chr4_-_155511887 | 1.84 |
ENST00000302053.3 ENST00000403106.3 |
FGA |
fibrinogen alpha chain |
| chr17_+_27369918 | 1.71 |
ENST00000323372.4 |
PIPOX |
pipecolic acid oxidase |
| chrX_+_46937745 | 1.62 |
ENST00000397180.1 ENST00000457380.1 ENST00000352078.4 |
RGN |
regucalcin |
| chr9_-_99381660 | 1.61 |
ENST00000375240.3 ENST00000463569.1 |
CDC14B |
cell division cycle 14B |
| chr6_+_1389989 | 1.61 |
ENST00000259806.1 |
FOXF2 |
forkhead box F2 |
| chr17_+_72427477 | 1.58 |
ENST00000342648.5 ENST00000481232.1 |
GPRC5C |
G protein-coupled receptor, family C, group 5, member C |
| chr10_-_116444371 | 1.57 |
ENST00000533213.2 ENST00000369252.4 |
ABLIM1 |
actin binding LIM protein 1 |
| chr5_-_121413974 | 1.56 |
ENST00000231004.4 |
LOX |
lysyl oxidase |
| chr2_-_68694390 | 1.48 |
ENST00000377957.3 |
FBXO48 |
F-box protein 48 |
| chr1_+_207262170 | 1.43 |
ENST00000367078.3 |
C4BPB |
complement component 4 binding protein, beta |
| chr12_-_91573132 | 1.36 |
ENST00000550563.1 ENST00000546370.1 |
DCN |
decorin |
| chr7_-_83824169 | 1.32 |
ENST00000265362.4 |
SEMA3A |
sema domain, immunoglobulin domain (Ig), short basic domain, secreted, (semaphorin) 3A |
| chr1_-_45956822 | 1.31 |
ENST00000372086.3 ENST00000341771.6 |
TESK2 |
testis-specific kinase 2 |
| chr17_+_72426891 | 1.31 |
ENST00000392627.1 |
GPRC5C |
G protein-coupled receptor, family C, group 5, member C |
| chrX_-_73512411 | 1.23 |
ENST00000602576.1 ENST00000429124.1 |
FTX |
FTX transcript, XIST regulator (non-protein coding) |
| chr20_-_52790512 | 1.18 |
ENST00000216862.3 |
CYP24A1 |
cytochrome P450, family 24, subfamily A, polypeptide 1 |
| chr5_+_49963239 | 1.14 |
ENST00000505554.1 |
PARP8 |
poly (ADP-ribose) polymerase family, member 8 |
| chr12_-_91573249 | 1.13 |
ENST00000550099.1 ENST00000546391.1 ENST00000551354.1 |
DCN |
decorin |
| chrX_-_40506766 | 1.13 |
ENST00000378421.1 ENST00000440784.2 ENST00000327877.5 ENST00000378426.1 ENST00000378418.2 |
CXorf38 |
chromosome X open reading frame 38 |
| chr8_+_124194752 | 1.10 |
ENST00000318462.6 |
FAM83A |
family with sequence similarity 83, member A |
| chr3_-_158450231 | 1.08 |
ENST00000479756.1 |
RARRES1 |
retinoic acid receptor responder (tazarotene induced) 1 |
| chr11_-_18258342 | 1.07 |
ENST00000278222.4 |
SAA4 |
serum amyloid A4, constitutive |
| chr17_+_2699697 | 1.07 |
ENST00000254695.8 ENST00000366401.4 ENST00000542807.1 |
RAP1GAP2 |
RAP1 GTPase activating protein 2 |
| chr2_-_99279928 | 1.06 |
ENST00000414521.2 |
MGAT4A |
mannosyl (alpha-1,3-)-glycoprotein beta-1,4-N-acetylglucosaminyltransferase, isozyme A |
| chr3_-_158450475 | 1.04 |
ENST00000237696.5 |
RARRES1 |
retinoic acid receptor responder (tazarotene induced) 1 |
| chr19_-_2042065 | 1.03 |
ENST00000591588.1 ENST00000591142.1 |
MKNK2 |
MAP kinase interacting serine/threonine kinase 2 |
| chr6_+_167704798 | 1.03 |
ENST00000230256.3 |
UNC93A |
unc-93 homolog A (C. elegans) |
| chr11_-_104972158 | 1.02 |
ENST00000598974.1 ENST00000593315.1 ENST00000594519.1 ENST00000415981.2 ENST00000525374.1 ENST00000375707.1 |
CASP1 CARD16 CARD17 |
caspase 1, apoptosis-related cysteine peptidase caspase recruitment domain family, member 16 caspase recruitment domain family, member 17 |
| chr11_+_62495541 | 1.01 |
ENST00000530625.1 ENST00000513247.2 |
TTC9C |
tetratricopeptide repeat domain 9C |
| chr6_-_30043539 | 1.00 |
ENST00000376751.3 ENST00000244360.6 |
RNF39 |
ring finger protein 39 |
| chr6_+_167704838 | 1.00 |
ENST00000366829.2 |
UNC93A |
unc-93 homolog A (C. elegans) |
| chr16_-_30457048 | 0.97 |
ENST00000500504.2 ENST00000542752.1 |
SEPHS2 |
selenophosphate synthetase 2 |
| chr2_+_113885138 | 0.97 |
ENST00000409930.3 |
IL1RN |
interleukin 1 receptor antagonist |
| chr3_+_186435137 | 0.97 |
ENST00000447445.1 |
KNG1 |
kininogen 1 |
| chr2_-_209118974 | 0.93 |
ENST00000415913.1 ENST00000415282.1 ENST00000446179.1 |
IDH1 |
isocitrate dehydrogenase 1 (NADP+), soluble |
| chr2_-_167232484 | 0.93 |
ENST00000375387.4 ENST00000303354.6 ENST00000409672.1 |
SCN9A |
sodium channel, voltage-gated, type IX, alpha subunit |
| chr12_+_13197218 | 0.81 |
ENST00000197268.8 |
KIAA1467 |
KIAA1467 |
| chr5_+_95997769 | 0.80 |
ENST00000338252.3 ENST00000508830.1 |
CAST |
calpastatin |
| chr17_+_7461849 | 0.78 |
ENST00000338784.4 |
TNFSF13 |
tumor necrosis factor (ligand) superfamily, member 13 |
| chr5_+_156696362 | 0.76 |
ENST00000377576.3 |
CYFIP2 |
cytoplasmic FMR1 interacting protein 2 |
| chr17_+_7462103 | 0.75 |
ENST00000396545.4 |
TNFSF13 |
tumor necrosis factor (ligand) superfamily, member 13 |
| chr20_-_34330129 | 0.73 |
ENST00000397370.3 ENST00000528062.3 ENST00000407261.4 ENST00000374038.3 ENST00000361162.6 |
RBM39 |
RNA binding motif protein 39 |
| chr10_-_97416400 | 0.71 |
ENST00000371224.2 ENST00000371221.3 |
ALDH18A1 |
aldehyde dehydrogenase 18 family, member A1 |
| chr11_-_104905840 | 0.71 |
ENST00000526568.1 ENST00000393136.4 ENST00000531166.1 ENST00000534497.1 ENST00000527979.1 ENST00000446369.1 ENST00000353247.5 ENST00000528974.1 ENST00000533400.1 ENST00000525825.1 ENST00000436863.3 |
CASP1 |
caspase 1, apoptosis-related cysteine peptidase |
| chr10_-_17659357 | 0.69 |
ENST00000326961.6 ENST00000361271.3 |
PTPLA |
protein tyrosine phosphatase-like (proline instead of catalytic arginine), member A |
| chr10_+_90750378 | 0.64 |
ENST00000355740.2 ENST00000352159.4 |
FAS |
Fas cell surface death receptor |
| chr1_-_45956800 | 0.64 |
ENST00000538496.1 |
TESK2 |
testis-specific kinase 2 |
| chr17_-_34417479 | 0.64 |
ENST00000225245.5 |
CCL3 |
chemokine (C-C motif) ligand 3 |
| chr19_-_41945804 | 0.63 |
ENST00000221943.9 ENST00000597457.1 ENST00000589970.1 ENST00000595425.1 ENST00000438807.3 ENST00000589102.1 ENST00000592922.2 |
ATP5SL |
ATP5S-like |
| chr8_-_110660999 | 0.60 |
ENST00000424158.2 ENST00000533895.1 ENST00000446070.2 ENST00000528331.1 ENST00000526302.1 ENST00000433638.1 ENST00000408908.2 ENST00000524720.1 |
SYBU |
syntabulin (syntaxin-interacting) |
| chr17_+_7461781 | 0.57 |
ENST00000349228.4 |
TNFSF13 |
tumor necrosis factor (ligand) superfamily, member 13 |
| chr17_+_61851157 | 0.57 |
ENST00000578681.1 ENST00000583590.1 |
DDX42 |
DEAD (Asp-Glu-Ala-Asp) box helicase 42 |
| chr14_-_64971288 | 0.56 |
ENST00000394715.1 |
ZBTB25 |
zinc finger and BTB domain containing 25 |
| chr12_-_91573316 | 0.56 |
ENST00000393155.1 |
DCN |
decorin |
| chr16_-_53537105 | 0.54 |
ENST00000568596.1 ENST00000570004.1 ENST00000564497.1 ENST00000300245.4 ENST00000394657.7 |
AKTIP |
AKT interacting protein |
| chr5_+_95998070 | 0.54 |
ENST00000421689.2 ENST00000510756.1 ENST00000512620.1 |
CAST |
calpastatin |
| chrX_+_24483338 | 0.51 |
ENST00000379162.4 ENST00000441463.2 |
PDK3 |
pyruvate dehydrogenase kinase, isozyme 3 |
| chr4_-_119274121 | 0.51 |
ENST00000296498.3 |
PRSS12 |
protease, serine, 12 (neurotrypsin, motopsin) |
| chr6_-_32557610 | 0.50 |
ENST00000360004.5 |
HLA-DRB1 |
major histocompatibility complex, class II, DR beta 1 |
| chr1_-_67519782 | 0.50 |
ENST00000235345.5 |
SLC35D1 |
solute carrier family 35 (UDP-GlcA/UDP-GalNAc transporter), member D1 |
| chr17_+_61851504 | 0.49 |
ENST00000359353.5 ENST00000389924.2 |
DDX42 |
DEAD (Asp-Glu-Ala-Asp) box helicase 42 |
| chr2_-_178128250 | 0.47 |
ENST00000448782.1 ENST00000446151.2 |
NFE2L2 |
nuclear factor, erythroid 2-like 2 |
| chr9_-_88356789 | 0.46 |
ENST00000357081.3 ENST00000376081.4 ENST00000337006.4 ENST00000376109.3 |
AGTPBP1 |
ATP/GTP binding protein 1 |
| chr10_+_90750493 | 0.45 |
ENST00000357339.2 ENST00000355279.2 |
FAS |
Fas cell surface death receptor |
| chr3_+_186435065 | 0.43 |
ENST00000287611.2 ENST00000265023.4 |
KNG1 |
kininogen 1 |
| chr20_+_32150140 | 0.43 |
ENST00000344201.3 ENST00000346541.3 ENST00000397800.1 ENST00000397798.2 ENST00000492345.1 |
CBFA2T2 |
core-binding factor, runt domain, alpha subunit 2; translocated to, 2 |
| chr14_+_58765103 | 0.43 |
ENST00000355431.3 ENST00000348476.3 ENST00000395168.3 |
ARID4A |
AT rich interactive domain 4A (RBP1-like) |
| chr14_-_45722605 | 0.42 |
ENST00000310806.4 |
MIS18BP1 |
MIS18 binding protein 1 |
| chr6_+_31515337 | 0.42 |
ENST00000376148.4 ENST00000376145.4 |
NFKBIL1 |
nuclear factor of kappa light polypeptide gene enhancer in B-cells inhibitor-like 1 |
| chr12_+_66582919 | 0.41 |
ENST00000545837.1 ENST00000457197.2 |
IRAK3 |
interleukin-1 receptor-associated kinase 3 |
| chr20_-_33732952 | 0.41 |
ENST00000541621.1 |
EDEM2 |
ER degradation enhancer, mannosidase alpha-like 2 |
| chr14_+_102276192 | 0.40 |
ENST00000557714.1 |
PPP2R5C |
protein phosphatase 2, regulatory subunit B', gamma |
| chrY_+_2709527 | 0.39 |
ENST00000250784.8 |
RPS4Y1 |
ribosomal protein S4, Y-linked 1 |
| chr12_-_110939870 | 0.37 |
ENST00000447578.2 ENST00000546588.1 ENST00000360579.7 ENST00000549970.1 ENST00000549578.1 |
VPS29 |
vacuolar protein sorting 29 homolog (S. cerevisiae) |
| chr1_-_92951607 | 0.36 |
ENST00000427103.1 |
GFI1 |
growth factor independent 1 transcription repressor |
| chr19_+_55014085 | 0.35 |
ENST00000351841.2 |
LAIR2 |
leukocyte-associated immunoglobulin-like receptor 2 |
| chr19_+_55014013 | 0.35 |
ENST00000301202.2 |
LAIR2 |
leukocyte-associated immunoglobulin-like receptor 2 |
| chr10_-_17659234 | 0.34 |
ENST00000466335.1 |
PTPLA |
protein tyrosine phosphatase-like (proline instead of catalytic arginine), member A |
| chr19_+_6887571 | 0.34 |
ENST00000250572.8 ENST00000381407.5 ENST00000312053.4 ENST00000450315.3 ENST00000381404.4 |
EMR1 |
egf-like module containing, mucin-like, hormone receptor-like 1 |
| chr1_+_92414952 | 0.34 |
ENST00000449584.1 ENST00000427104.1 ENST00000355011.3 ENST00000448194.1 ENST00000426141.1 ENST00000450792.1 ENST00000548992.1 ENST00000552654.1 ENST00000457265.1 |
BRDT |
bromodomain, testis-specific |
| chr6_-_31940065 | 0.33 |
ENST00000375349.3 ENST00000337523.5 |
DXO |
decapping exoribonuclease |
| chr16_-_70323422 | 0.32 |
ENST00000261772.8 |
AARS |
alanyl-tRNA synthetase |
| chr17_-_34625719 | 0.32 |
ENST00000422211.2 ENST00000542124.1 |
CCL3L1 |
chemokine (C-C motif) ligand 3-like 1 |
| chr14_-_106573756 | 0.31 |
ENST00000390601.2 |
IGHV3-11 |
immunoglobulin heavy variable 3-11 (gene/pseudogene) |
| chr9_+_33290491 | 0.30 |
ENST00000379540.3 ENST00000379521.4 ENST00000318524.6 |
NFX1 |
nuclear transcription factor, X-box binding 1 |
| chr10_+_86004802 | 0.30 |
ENST00000359452.4 ENST00000358110.5 ENST00000372092.3 |
RGR |
retinal G protein coupled receptor |
| chr19_-_15442701 | 0.30 |
ENST00000594841.1 ENST00000601941.1 |
BRD4 |
bromodomain containing 4 |
| chr6_-_99797522 | 0.29 |
ENST00000389677.5 |
FAXC |
failed axon connections homolog (Drosophila) |
| chr16_+_3507985 | 0.28 |
ENST00000421765.3 ENST00000360862.5 ENST00000414063.2 ENST00000610180.1 ENST00000608993.1 |
NAA60 NAA60 |
N(alpha)-acetyltransferase 60, NatF catalytic subunit N-alpha-acetyltransferase 60 |
| chr14_+_102276132 | 0.28 |
ENST00000350249.3 ENST00000557621.1 ENST00000556946.1 |
PPP2R5C |
protein phosphatase 2, regulatory subunit B', gamma |
| chr1_+_209941827 | 0.27 |
ENST00000367023.1 |
TRAF3IP3 |
TRAF3 interacting protein 3 |
| chr12_-_114841703 | 0.27 |
ENST00000526441.1 |
TBX5 |
T-box 5 |
| chr17_-_61850894 | 0.26 |
ENST00000403162.3 ENST00000582252.1 ENST00000225726.5 |
CCDC47 |
coiled-coil domain containing 47 |
| chrX_-_73512177 | 0.23 |
ENST00000603672.1 ENST00000418855.1 |
FTX |
FTX transcript, XIST regulator (non-protein coding) |
| chr1_-_111743285 | 0.21 |
ENST00000357640.4 |
DENND2D |
DENN/MADD domain containing 2D |
| chr8_+_71485681 | 0.21 |
ENST00000391684.1 |
AC120194.1 |
AC120194.1 |
| chr1_+_164528866 | 0.21 |
ENST00000420696.2 |
PBX1 |
pre-B-cell leukemia homeobox 1 |
| chr17_-_77813186 | 0.19 |
ENST00000448310.1 ENST00000269397.4 |
CBX4 |
chromobox homolog 4 |
| chr13_+_41635617 | 0.18 |
ENST00000542082.1 |
WBP4 |
WW domain binding protein 4 |
| chr20_-_39946237 | 0.17 |
ENST00000441102.2 ENST00000559234.1 |
ZHX3 |
zinc fingers and homeoboxes 3 |
| chr2_+_234296792 | 0.17 |
ENST00000409813.3 |
DGKD |
diacylglycerol kinase, delta 130kDa |
| chr14_-_103523745 | 0.15 |
ENST00000361246.2 |
CDC42BPB |
CDC42 binding protein kinase beta (DMPK-like) |
| chr9_+_2158443 | 0.15 |
ENST00000302401.3 ENST00000324954.5 ENST00000423555.1 ENST00000382186.1 |
SMARCA2 |
SWI/SNF related, matrix associated, actin dependent regulator of chromatin, subfamily a, member 2 |
| chr4_+_71263599 | 0.15 |
ENST00000399575.2 |
PROL1 |
proline rich, lacrimal 1 |
| chr10_-_104597286 | 0.14 |
ENST00000369887.3 |
CYP17A1 |
cytochrome P450, family 17, subfamily A, polypeptide 1 |
| chr9_+_2158485 | 0.14 |
ENST00000417599.1 ENST00000382185.1 ENST00000382183.1 |
SMARCA2 |
SWI/SNF related, matrix associated, actin dependent regulator of chromatin, subfamily a, member 2 |
| chr5_-_140013275 | 0.13 |
ENST00000512545.1 ENST00000302014.6 ENST00000401743.2 |
CD14 |
CD14 molecule |
| chr19_-_15443318 | 0.13 |
ENST00000360016.5 |
BRD4 |
bromodomain containing 4 |
| chrX_-_135962876 | 0.12 |
ENST00000431446.3 ENST00000570135.1 ENST00000320676.7 ENST00000562646.1 |
RBMX |
RNA binding motif protein, X-linked |
| chr8_+_24151553 | 0.10 |
ENST00000265769.4 ENST00000540823.1 ENST00000397649.3 |
ADAM28 |
ADAM metallopeptidase domain 28 |
| chr9_+_111624577 | 0.10 |
ENST00000333999.3 |
ACTL7A |
actin-like 7A |
| chr6_+_72926145 | 0.10 |
ENST00000425662.2 ENST00000453976.2 |
RIMS1 |
regulating synaptic membrane exocytosis 1 |
| chr1_+_111770232 | 0.09 |
ENST00000369744.2 |
CHI3L2 |
chitinase 3-like 2 |
| chr8_-_42397037 | 0.08 |
ENST00000342228.3 |
SLC20A2 |
solute carrier family 20 (phosphate transporter), member 2 |
| chr12_+_113229737 | 0.08 |
ENST00000551052.1 ENST00000415485.3 |
RPH3A |
rabphilin 3A homolog (mouse) |
| chr16_-_21663919 | 0.08 |
ENST00000569602.1 |
IGSF6 |
immunoglobulin superfamily, member 6 |
| chr1_-_168698433 | 0.07 |
ENST00000367817.3 |
DPT |
dermatopontin |
| chr3_-_58200398 | 0.06 |
ENST00000318316.3 ENST00000460422.1 ENST00000483681.1 |
DNASE1L3 |
deoxyribonuclease I-like 3 |
| chr1_+_111770278 | 0.06 |
ENST00000369748.4 |
CHI3L2 |
chitinase 3-like 2 |
| chr20_+_44098346 | 0.06 |
ENST00000372676.3 |
WFDC2 |
WAP four-disulfide core domain 2 |
| chr10_+_43916052 | 0.05 |
ENST00000442526.2 |
RP11-517P14.2 |
RP11-517P14.2 |
| chr18_+_32621324 | 0.05 |
ENST00000300249.5 ENST00000538170.2 ENST00000588910.1 |
MAPRE2 |
microtubule-associated protein, RP/EB family, member 2 |
| chr19_-_52148798 | 0.05 |
ENST00000534261.2 |
SIGLEC5 |
sialic acid binding Ig-like lectin 5 |
| chr17_-_34524157 | 0.05 |
ENST00000378354.4 ENST00000394484.1 |
CCL3L3 |
chemokine (C-C motif) ligand 3-like 3 |
| chr17_-_60142609 | 0.04 |
ENST00000397786.2 |
MED13 |
mediator complex subunit 13 |
| chr5_+_49962772 | 0.04 |
ENST00000281631.5 ENST00000513738.1 ENST00000503665.1 ENST00000514067.2 ENST00000503046.1 |
PARP8 |
poly (ADP-ribose) polymerase family, member 8 |
| chr2_-_113594279 | 0.04 |
ENST00000416750.1 ENST00000418817.1 ENST00000263341.2 |
IL1B |
interleukin 1, beta |
| chr17_-_47755436 | 0.04 |
ENST00000505581.1 ENST00000514121.1 ENST00000393328.2 ENST00000509079.1 ENST00000393331.3 ENST00000347630.2 ENST00000504102.1 |
SPOP |
speckle-type POZ protein |
| chr17_+_7462031 | 0.03 |
ENST00000380535.4 |
TNFSF13 |
tumor necrosis factor (ligand) superfamily, member 13 |
| chr12_-_123215306 | 0.03 |
ENST00000356987.2 ENST00000436083.2 |
HCAR1 |
hydroxycarboxylic acid receptor 1 |
| chr17_-_41984835 | 0.03 |
ENST00000520406.1 ENST00000518478.1 ENST00000522172.1 ENST00000461854.1 ENST00000521178.1 ENST00000520305.1 ENST00000523501.1 ENST00000520241.1 |
MPP2 |
membrane protein, palmitoylated 2 (MAGUK p55 subfamily member 2) |
| chr8_-_103424986 | 0.02 |
ENST00000521922.1 |
UBR5 |
ubiquitin protein ligase E3 component n-recognin 5 |
| chr5_+_134368954 | 0.02 |
ENST00000432382.3 |
CTC-349C3.1 |
chromosome 5 open reading frame 66 |
| chr8_+_110552831 | 0.02 |
ENST00000530629.1 |
EBAG9 |
estrogen receptor binding site associated, antigen, 9 |
| chr4_-_103746924 | 0.02 |
ENST00000505207.1 ENST00000502404.1 ENST00000507845.1 |
UBE2D3 |
ubiquitin-conjugating enzyme E2D 3 |
| chr2_-_178128528 | 0.02 |
ENST00000397063.4 ENST00000421929.1 |
NFE2L2 |
nuclear factor, erythroid 2-like 2 |
| chr4_+_25657444 | 0.02 |
ENST00000504570.1 ENST00000382051.3 |
SLC34A2 |
solute carrier family 34 (type II sodium/phosphate contransporter), member 2 |
| chr20_+_44098385 | 0.02 |
ENST00000217425.5 ENST00000339946.3 |
WFDC2 |
WAP four-disulfide core domain 2 |
| chr7_+_22766766 | 0.01 |
ENST00000426291.1 ENST00000401651.1 ENST00000258743.5 ENST00000420258.2 ENST00000407492.1 ENST00000401630.3 ENST00000406575.1 |
IL6 |
interleukin 6 (interferon, beta 2) |
| chr10_+_18629628 | 0.01 |
ENST00000377329.4 |
CACNB2 |
calcium channel, voltage-dependent, beta 2 subunit |
| chr6_+_108977520 | 0.00 |
ENST00000540898.1 |
FOXO3 |
forkhead box O3 |
Gene Ontology Analysis
Gene overrepresentation in cellular_component category:
| Log-likelihood per target | Total log-likelihood | Term | Description |
|---|---|---|---|
| 1.3 | 21.5 | GO:0034366 | spherical high-density lipoprotein particle(GO:0034366) |
| 0.8 | 3.3 | GO:0005896 | interleukin-6 receptor complex(GO:0005896) |
| 0.5 | 2.8 | GO:0031232 | extrinsic component of external side of plasma membrane(GO:0031232) |
| 0.3 | 1.7 | GO:0097179 | protease inhibitor complex(GO:0097179) |
| 0.3 | 4.4 | GO:0005577 | fibrinogen complex(GO:0005577) |
| 0.3 | 5.6 | GO:0005890 | sodium:potassium-exchanging ATPase complex(GO:0005890) |
| 0.2 | 3.0 | GO:0098647 | collagen type VI trimer(GO:0005589) collagen beaded filament(GO:0098647) |
| 0.1 | 32.0 | GO:0072562 | blood microparticle(GO:0072562) |
| 0.1 | 10.9 | GO:0055038 | recycling endosome membrane(GO:0055038) |
| 0.1 | 0.5 | GO:0070695 | FHF complex(GO:0070695) |
| 0.1 | 0.4 | GO:0030906 | retromer, cargo-selective complex(GO:0030906) |
| 0.1 | 0.6 | GO:0097433 | dense body(GO:0097433) |
| 0.1 | 1.1 | GO:0031265 | CD95 death-inducing signaling complex(GO:0031265) |
| 0.1 | 0.9 | GO:0001518 | voltage-gated sodium channel complex(GO:0001518) |
| 0.0 | 1.7 | GO:0031907 | peroxisomal matrix(GO:0005782) microbody lumen(GO:0031907) |
| 0.0 | 0.5 | GO:0043083 | synaptic cleft(GO:0043083) |
| 0.0 | 0.4 | GO:0000778 | condensed nuclear chromosome kinetochore(GO:0000778) |
| 0.0 | 4.4 | GO:0030176 | integral component of endoplasmic reticulum membrane(GO:0030176) |
| 0.0 | 2.5 | GO:0005902 | microvillus(GO:0005902) |
| 0.0 | 0.9 | GO:1904724 | tertiary granule lumen(GO:1904724) |
| 0.0 | 0.1 | GO:0046696 | lipopolysaccharide receptor complex(GO:0046696) |
| 0.0 | 0.1 | GO:0044530 | supraspliceosomal complex(GO:0044530) |
| 0.0 | 4.1 | GO:0090575 | RNA polymerase II transcription factor complex(GO:0090575) |
| 0.0 | 1.6 | GO:0005581 | collagen trimer(GO:0005581) |
| 0.0 | 0.7 | GO:0000159 | protein phosphatase type 2A complex(GO:0000159) |
| 0.0 | 1.2 | GO:0005741 | mitochondrial outer membrane(GO:0005741) |
| 0.0 | 1.6 | GO:0072686 | mitotic spindle(GO:0072686) |
| 0.0 | 1.1 | GO:0015030 | Cajal body(GO:0015030) |
| 0.0 | 0.4 | GO:0044322 | endoplasmic reticulum quality control compartment(GO:0044322) |
| 0.0 | 1.6 | GO:0097517 | stress fiber(GO:0001725) contractile actin filament bundle(GO:0097517) |
| 0.0 | 0.2 | GO:0035102 | PRC1 complex(GO:0035102) |
| 0.0 | 0.3 | GO:0071564 | npBAF complex(GO:0071564) |
Gene overrepresentation in molecular_function category:
| Log-likelihood per target | Total log-likelihood | Term | Description |
|---|---|---|---|
| 1.3 | 5.3 | GO:0004909 | interleukin-1, Type I, activating receptor activity(GO:0004909) |
| 1.1 | 4.5 | GO:0016841 | ammonia-lyase activity(GO:0016841) |
| 1.1 | 3.3 | GO:0019981 | interleukin-6 receptor activity(GO:0004915) interleukin-6 binding(GO:0019981) |
| 0.9 | 2.8 | GO:0015091 | ferric iron transmembrane transporter activity(GO:0015091) trivalent inorganic cation transmembrane transporter activity(GO:0072510) |
| 0.9 | 18.0 | GO:0051787 | misfolded protein binding(GO:0051787) |
| 0.8 | 2.5 | GO:0005017 | platelet-derived growth factor-activated receptor activity(GO:0005017) |
| 0.8 | 6.4 | GO:0004873 | asialoglycoprotein receptor activity(GO:0004873) |
| 0.8 | 6.9 | GO:0016724 | ferroxidase activity(GO:0004322) oxidoreductase activity, oxidizing metal ions, oxygen as acceptor(GO:0016724) |
| 0.7 | 2.0 | GO:0004611 | phosphoenolpyruvate carboxykinase activity(GO:0004611) phosphoenolpyruvate carboxykinase (GTP) activity(GO:0004613) |
| 0.6 | 3.6 | GO:0030492 | hemoglobin binding(GO:0030492) |
| 0.5 | 4.3 | GO:0050692 | DBD domain binding(GO:0050692) |
| 0.4 | 10.9 | GO:0043015 | gamma-tubulin binding(GO:0043015) |
| 0.3 | 5.6 | GO:0005391 | sodium:potassium-exchanging ATPase activity(GO:0005391) |
| 0.3 | 1.0 | GO:0004756 | selenide, water dikinase activity(GO:0004756) phosphotransferase activity, paired acceptors(GO:0016781) |
| 0.3 | 1.0 | GO:0005150 | interleukin-1, Type I receptor binding(GO:0005150) |
| 0.3 | 0.9 | GO:0004450 | isocitrate dehydrogenase (NADP+) activity(GO:0004450) |
| 0.3 | 1.7 | GO:0016647 | oxidoreductase activity, acting on the CH-NH group of donors, oxygen as acceptor(GO:0016647) |
| 0.2 | 1.2 | GO:0070576 | vitamin D 24-hydroxylase activity(GO:0070576) |
| 0.2 | 1.1 | GO:0043120 | tumor necrosis factor binding(GO:0043120) |
| 0.2 | 6.1 | GO:0004181 | metallocarboxypeptidase activity(GO:0004181) |
| 0.2 | 0.7 | GO:0016774 | phosphotransferase activity, carboxyl group as acceptor(GO:0016774) |
| 0.2 | 1.1 | GO:0008454 | alpha-1,3-mannosylglycoprotein 4-beta-N-acetylglucosaminyltransferase activity(GO:0008454) |
| 0.1 | 0.3 | GO:0042056 | chemoattractant activity(GO:0042056) |
| 0.1 | 0.6 | GO:0004698 | calcium-dependent protein kinase C activity(GO:0004698) |
| 0.1 | 0.5 | GO:0004740 | pyruvate dehydrogenase (acetyl-transferring) kinase activity(GO:0004740) |
| 0.1 | 1.7 | GO:0050700 | CARD domain binding(GO:0050700) |
| 0.1 | 1.1 | GO:0036312 | phosphatidylinositol 3-kinase regulatory subunit binding(GO:0036312) |
| 0.1 | 0.3 | GO:0034353 | RNA pyrophosphohydrolase activity(GO:0034353) |
| 0.1 | 3.8 | GO:0001848 | complement binding(GO:0001848) |
| 0.1 | 0.3 | GO:0004813 | alanine-tRNA ligase activity(GO:0004813) |
| 0.1 | 1.6 | GO:0016641 | oxidoreductase activity, acting on the CH-NH2 group of donors, oxygen as acceptor(GO:0016641) |
| 0.1 | 8.0 | GO:0004869 | cysteine-type endopeptidase inhibitor activity(GO:0004869) |
| 0.1 | 1.3 | GO:0030215 | semaphorin receptor binding(GO:0030215) |
| 0.1 | 11.0 | GO:0004866 | endopeptidase inhibitor activity(GO:0004866) |
| 0.1 | 1.0 | GO:0009931 | calcium-dependent protein serine/threonine kinase activity(GO:0009931) |
| 0.1 | 0.5 | GO:0015165 | pyrimidine nucleotide-sugar transmembrane transporter activity(GO:0015165) |
| 0.1 | 5.3 | GO:0005518 | collagen binding(GO:0005518) |
| 0.1 | 0.9 | GO:0031402 | sodium ion binding(GO:0031402) |
| 0.0 | 0.1 | GO:0001847 | opsonin receptor activity(GO:0001847) peptidoglycan receptor activity(GO:0016019) |
| 0.0 | 0.4 | GO:0004571 | mannosyl-oligosaccharide 1,2-alpha-mannosidase activity(GO:0004571) |
| 0.0 | 3.4 | GO:0016765 | transferase activity, transferring alkyl or aryl (other than methyl) groups(GO:0016765) |
| 0.0 | 1.2 | GO:0003950 | NAD+ ADP-ribosyltransferase activity(GO:0003950) |
| 0.0 | 1.6 | GO:0008138 | protein tyrosine/serine/threonine phosphatase activity(GO:0008138) |
| 0.0 | 5.7 | GO:0001078 | transcriptional repressor activity, RNA polymerase II core promoter proximal region sequence-specific binding(GO:0001078) |
| 0.0 | 0.3 | GO:0008020 | G-protein coupled photoreceptor activity(GO:0008020) |
| 0.0 | 1.8 | GO:0004712 | protein serine/threonine/tyrosine kinase activity(GO:0004712) |
| 0.0 | 6.5 | GO:0004252 | serine-type endopeptidase activity(GO:0004252) |
| 0.0 | 0.3 | GO:0004596 | peptide alpha-N-acetyltransferase activity(GO:0004596) |
| 0.0 | 0.1 | GO:0015319 | sodium:inorganic phosphate symporter activity(GO:0015319) |
| 0.0 | 0.8 | GO:0070577 | lysine-acetylated histone binding(GO:0070577) |
| 0.0 | 0.6 | GO:0017075 | syntaxin-1 binding(GO:0017075) |
| 0.0 | 0.5 | GO:0023026 | MHC class II protein complex binding(GO:0023026) |
| 0.0 | 2.1 | GO:0003705 | transcription factor activity, RNA polymerase II distal enhancer sequence-specific binding(GO:0003705) |
| 0.0 | 6.9 | GO:0004930 | G-protein coupled receptor activity(GO:0004930) |
| 0.0 | 1.1 | GO:0004004 | ATP-dependent RNA helicase activity(GO:0004004) |
| 0.0 | 0.1 | GO:0008061 | chitinase activity(GO:0004568) chitin binding(GO:0008061) |
| 0.0 | 0.4 | GO:0033558 | histone deacetylase activity(GO:0004407) protein deacetylase activity(GO:0033558) |
| 0.0 | 0.2 | GO:0032183 | SUMO binding(GO:0032183) |
| 0.0 | 0.5 | GO:0005164 | tumor necrosis factor receptor binding(GO:0005164) |
| 0.0 | 4.0 | GO:0000978 | RNA polymerase II core promoter proximal region sequence-specific DNA binding(GO:0000978) |
Gene overrepresentation in C2:CP category:
| Log-likelihood per target | Total log-likelihood | Term | Description |
|---|---|---|---|
| 0.3 | 7.5 | PID ERB GENOMIC PATHWAY | Validated nuclear estrogen receptor beta network |
| 0.3 | 10.5 | ST WNT CA2 CYCLIC GMP PATHWAY | Wnt/Ca2+/cyclic GMP signaling. |
| 0.2 | 27.3 | PID MYC REPRESS PATHWAY | Validated targets of C-MYC transcriptional repression |
| 0.2 | 3.3 | ST STAT3 PATHWAY | STAT3 Pathway |
| 0.1 | 8.5 | PID IL1 PATHWAY | IL1-mediated signaling events |
| 0.1 | 7.6 | PID BMP PATHWAY | BMP receptor signaling |
| 0.1 | 4.3 | PID WNT NONCANONICAL PATHWAY | Noncanonical Wnt signaling pathway |
| 0.1 | 3.0 | PID INTEGRIN5 PATHWAY | Beta5 beta6 beta7 and beta8 integrin cell surface interactions |
| 0.1 | 5.9 | PID HNF3B PATHWAY | FOXA2 and FOXA3 transcription factor networks |
| 0.1 | 3.2 | PID INTEGRIN2 PATHWAY | Beta2 integrin cell surface interactions |
| 0.1 | 2.5 | PID PDGFRA PATHWAY | PDGFR-alpha signaling pathway |
| 0.1 | 6.6 | PID HIF1 TFPATHWAY | HIF-1-alpha transcription factor network |
| 0.1 | 1.1 | SA FAS SIGNALING | The TNF-type receptor Fas induces apoptosis on ligand binding. |
| 0.1 | 3.0 | NABA PROTEOGLYCANS | Genes encoding proteoglycans |
| 0.0 | 1.4 | PID HNF3A PATHWAY | FOXA1 transcription factor network |
| 0.0 | 2.7 | PID ERA GENOMIC PATHWAY | Validated nuclear estrogen receptor alpha network |
| 0.0 | 1.0 | ST P38 MAPK PATHWAY | p38 MAPK Pathway |
| 0.0 | 1.5 | PID PLK1 PATHWAY | PLK1 signaling events |
| 0.0 | 0.8 | PID ECADHERIN NASCENT AJ PATHWAY | E-cadherin signaling in the nascent adherens junction |
| 0.0 | 0.4 | SIG CD40PATHWAYMAP | Genes related to CD40 signaling |
Gene overrepresentation in biological_process category:
| Log-likelihood per target | Total log-likelihood | Term | Description |
|---|---|---|---|
| 3.0 | 18.0 | GO:0061518 | macrophage proliferation(GO:0061517) microglial cell proliferation(GO:0061518) regulation of neuronal signal transduction(GO:1902847) positive regulation of neurofibrillary tangle assembly(GO:1902998) |
| 2.5 | 7.5 | GO:0002894 | positive regulation of type IIa hypersensitivity(GO:0001798) positive regulation of type II hypersensitivity(GO:0002894) |
| 1.8 | 5.3 | GO:2000661 | positive regulation of interleukin-1-mediated signaling pathway(GO:2000661) |
| 1.5 | 4.5 | GO:0019556 | histidine catabolic process to glutamate and formamide(GO:0019556) histidine catabolic process to glutamate and formate(GO:0019557) formamide metabolic process(GO:0043606) |
| 1.5 | 5.8 | GO:0003331 | regulation of extracellular matrix constituent secretion(GO:0003330) positive regulation of extracellular matrix constituent secretion(GO:0003331) |
| 1.4 | 5.6 | GO:0044861 | protein transport into plasma membrane raft(GO:0044861) positive regulation of potassium ion import(GO:1903288) |
| 1.3 | 3.9 | GO:0045014 | carbon catabolite repression of transcription(GO:0045013) negative regulation of transcription by glucose(GO:0045014) |
| 1.2 | 3.6 | GO:2000296 | negative regulation of hydrogen peroxide catabolic process(GO:2000296) |
| 1.1 | 3.3 | GO:0002384 | hepatic immune response(GO:0002384) |
| 1.1 | 4.3 | GO:2000230 | negative regulation of pancreatic stellate cell proliferation(GO:2000230) |
| 1.0 | 10.9 | GO:0090232 | peripheral nervous system myelin maintenance(GO:0032287) positive regulation of spindle checkpoint(GO:0090232) |
| 1.0 | 3.0 | GO:0052047 | interaction with other organism via secreted substance involved in symbiotic interaction(GO:0052047) |
| 0.9 | 3.4 | GO:0006556 | S-adenosylmethionine biosynthetic process(GO:0006556) |
| 0.8 | 2.5 | GO:0072277 | metanephric glomerulus morphogenesis(GO:0072275) metanephric glomerulus vasculature morphogenesis(GO:0072276) metanephric glomerular capillary formation(GO:0072277) |
| 0.7 | 8.0 | GO:2000427 | positive regulation of apoptotic cell clearance(GO:2000427) |
| 0.6 | 1.7 | GO:0046440 | L-lysine catabolic process to acetyl-CoA(GO:0019474) L-lysine catabolic process(GO:0019477) L-lysine metabolic process(GO:0046440) |
| 0.5 | 1.6 | GO:0019853 | L-ascorbic acid biosynthetic process(GO:0019853) negative regulation of DNA catabolic process(GO:1903625) regulation of aminoacyl-tRNA ligase activity(GO:1903630) |
| 0.5 | 2.0 | GO:1904640 | response to methionine(GO:1904640) |
| 0.5 | 2.3 | GO:0033031 | positive regulation of neutrophil apoptotic process(GO:0033031) |
| 0.5 | 2.8 | GO:0098707 | ferrous iron import into cell(GO:0097460) ferrous iron import across plasma membrane(GO:0098707) |
| 0.4 | 1.7 | GO:0050717 | positive regulation of interleukin-1 alpha secretion(GO:0050717) |
| 0.4 | 1.2 | GO:0042369 | vitamin D catabolic process(GO:0042369) |
| 0.4 | 10.8 | GO:0045662 | negative regulation of myoblast differentiation(GO:0045662) |
| 0.4 | 8.2 | GO:0030502 | negative regulation of bone mineralization(GO:0030502) |
| 0.3 | 1.0 | GO:0016260 | selenocysteine biosynthetic process(GO:0016260) |
| 0.3 | 0.9 | GO:0006097 | glyoxylate cycle(GO:0006097) |
| 0.3 | 3.6 | GO:0070327 | thyroid hormone transport(GO:0070327) |
| 0.3 | 1.3 | GO:0048880 | sensory system development(GO:0048880) |
| 0.2 | 3.2 | GO:0001867 | complement activation, lectin pathway(GO:0001867) |
| 0.2 | 6.3 | GO:0006825 | copper ion transport(GO:0006825) |
| 0.2 | 2.1 | GO:0048298 | positive regulation of isotype switching to IgA isotypes(GO:0048298) |
| 0.2 | 1.1 | GO:0097527 | Fas signaling pathway(GO:0036337) necroptotic signaling pathway(GO:0097527) |
| 0.2 | 1.8 | GO:0043152 | induction of bacterial agglutination(GO:0043152) |
| 0.2 | 3.0 | GO:0051901 | positive regulation of mitochondrial depolarization(GO:0051901) |
| 0.2 | 1.4 | GO:1903027 | regulation of complement activation, classical pathway(GO:0030450) negative regulation of complement activation, classical pathway(GO:0045959) regulation of opsonization(GO:1903027) |
| 0.2 | 0.5 | GO:0035610 | protein side chain deglutamylation(GO:0035610) |
| 0.1 | 1.6 | GO:0048251 | elastic fiber assembly(GO:0048251) |
| 0.1 | 1.0 | GO:2000660 | negative regulation of interleukin-1-mediated signaling pathway(GO:2000660) |
| 0.1 | 0.4 | GO:0036512 | trimming of terminal mannose on B branch(GO:0036509) trimming of first mannose on A branch(GO:0036511) trimming of second mannose on A branch(GO:0036512) |
| 0.1 | 0.3 | GO:0050918 | positive chemotaxis(GO:0050918) |
| 0.1 | 2.4 | GO:0006957 | complement activation, alternative pathway(GO:0006957) |
| 0.1 | 0.5 | GO:1903786 | mycotoxin catabolic process(GO:0043387) aflatoxin catabolic process(GO:0046223) organic heteropentacyclic compound catabolic process(GO:1901377) regulation of glutathione biosynthetic process(GO:1903786) positive regulation of glutathione biosynthetic process(GO:1903788) |
| 0.1 | 0.4 | GO:0070105 | positive regulation of interleukin-6-mediated signaling pathway(GO:0070105) |
| 0.1 | 0.3 | GO:0051037 | histone displacement(GO:0001207) regulation of transcription involved in meiotic cell cycle(GO:0051037) positive regulation of transcription involved in meiotic cell cycle(GO:0051039) |
| 0.1 | 6.4 | GO:0018279 | protein N-linked glycosylation via asparagine(GO:0018279) |
| 0.1 | 0.3 | GO:0006419 | alanyl-tRNA aminoacylation(GO:0006419) |
| 0.1 | 0.4 | GO:0097368 | histone H4-K20 trimethylation(GO:0034773) establishment of Sertoli cell barrier(GO:0097368) |
| 0.1 | 1.6 | GO:0051256 | mitotic spindle midzone assembly(GO:0051256) |
| 0.1 | 0.4 | GO:0010936 | negative regulation of macrophage cytokine production(GO:0010936) |
| 0.1 | 5.0 | GO:0071353 | cellular response to interleukin-4(GO:0071353) |
| 0.1 | 0.5 | GO:0002399 | MHC class II protein complex assembly(GO:0002399) |
| 0.1 | 0.8 | GO:0051388 | positive regulation of neurotrophin TRK receptor signaling pathway(GO:0051388) |
| 0.1 | 1.6 | GO:0042249 | establishment of planar polarity of embryonic epithelium(GO:0042249) |
| 0.1 | 0.3 | GO:0035441 | bundle of His development(GO:0003166) cardiac left ventricle formation(GO:0003218) cell migration involved in vasculogenesis(GO:0035441) |
| 0.1 | 0.5 | GO:0097411 | hypoxia-inducible factor-1alpha signaling pathway(GO:0097411) |
| 0.1 | 0.5 | GO:0006065 | UDP-glucuronate biosynthetic process(GO:0006065) |
| 0.1 | 0.7 | GO:0006591 | ornithine metabolic process(GO:0006591) |
| 0.1 | 0.3 | GO:0017196 | N-terminal peptidyl-methionine acetylation(GO:0017196) |
| 0.1 | 1.1 | GO:0007597 | blood coagulation, intrinsic pathway(GO:0007597) |
| 0.0 | 1.0 | GO:0071243 | cellular response to arsenic-containing substance(GO:0071243) |
| 0.0 | 1.1 | GO:0006491 | N-glycan processing(GO:0006491) |
| 0.0 | 0.3 | GO:0045347 | negative regulation of MHC class II biosynthetic process(GO:0045347) |
| 0.0 | 0.5 | GO:2000675 | negative regulation of type B pancreatic cell apoptotic process(GO:2000675) |
| 0.0 | 0.3 | GO:0006983 | ER overload response(GO:0006983) |
| 0.0 | 0.1 | GO:0071727 | toll-like receptor TLR1:TLR2 signaling pathway(GO:0038123) response to triacyl bacterial lipopeptide(GO:0071725) cellular response to triacyl bacterial lipopeptide(GO:0071727) |
| 0.0 | 0.5 | GO:0048266 | behavioral response to pain(GO:0048266) |
| 0.0 | 0.4 | GO:0032968 | positive regulation of transcription elongation from RNA polymerase II promoter(GO:0032968) |
| 0.0 | 0.3 | GO:0071028 | nuclear RNA surveillance(GO:0071027) nuclear mRNA surveillance(GO:0071028) |
| 0.0 | 0.7 | GO:0014066 | regulation of phosphatidylinositol 3-kinase signaling(GO:0014066) |
| 0.0 | 1.1 | GO:0010501 | RNA secondary structure unwinding(GO:0010501) |
| 0.0 | 0.4 | GO:0060575 | intestinal epithelial cell differentiation(GO:0060575) |
| 0.0 | 0.0 | GO:0046136 | positive regulation of vitamin metabolic process(GO:0046136) positive regulation of vitamin D biosynthetic process(GO:0060557) positive regulation of calcidiol 1-monooxygenase activity(GO:0060559) |
| 0.0 | 0.3 | GO:0018298 | protein-chromophore linkage(GO:0018298) |
| 0.0 | 0.4 | GO:1990126 | retrograde transport, endosome to plasma membrane(GO:1990126) |
| 0.0 | 0.2 | GO:0031665 | negative regulation of lipopolysaccharide-mediated signaling pathway(GO:0031665) |
| 0.0 | 0.5 | GO:0045022 | early endosome to late endosome transport(GO:0045022) |
| 0.0 | 4.0 | GO:0001649 | osteoblast differentiation(GO:0001649) |
| 0.0 | 0.4 | GO:0031055 | chromatin remodeling at centromere(GO:0031055) CENP-A containing nucleosome assembly(GO:0034080) CENP-A containing chromatin organization(GO:0061641) |
| 0.0 | 0.1 | GO:0006032 | chitin metabolic process(GO:0006030) chitin catabolic process(GO:0006032) |
| 0.0 | 0.2 | GO:0010971 | positive regulation of G2/M transition of mitotic cell cycle(GO:0010971) |
| 0.0 | 0.1 | GO:0044341 | sodium-dependent phosphate transport(GO:0044341) |
Gene overrepresentation in C2:CP:REACTOME category:
| Log-likelihood per target | Total log-likelihood | Term | Description |
|---|---|---|---|
| 1.0 | 21.6 | REACTOME INITIAL TRIGGERING OF COMPLEMENT | Genes involved in Initial triggering of complement |
| 0.2 | 5.9 | REACTOME METAL ION SLC TRANSPORTERS | Genes involved in Metal ion SLC transporters |
| 0.2 | 4.8 | REACTOME P130CAS LINKAGE TO MAPK SIGNALING FOR INTEGRINS | Genes involved in p130Cas linkage to MAPK signaling for integrins |
| 0.2 | 7.0 | REACTOME SULFUR AMINO ACID METABOLISM | Genes involved in Sulfur amino acid metabolism |
| 0.2 | 2.0 | REACTOME ABACAVIR TRANSPORT AND METABOLISM | Genes involved in Abacavir transport and metabolism |
| 0.1 | 20.5 | REACTOME RESPONSE TO ELEVATED PLATELET CYTOSOLIC CA2 | Genes involved in Response to elevated platelet cytosolic Ca2+ |
| 0.1 | 3.9 | REACTOME REGULATION OF GENE EXPRESSION IN BETA CELLS | Genes involved in Regulation of gene expression in beta cells |
| 0.1 | 6.7 | REACTOME IL1 SIGNALING | Genes involved in Interleukin-1 signaling |
| 0.1 | 1.7 | REACTOME THE NLRP3 INFLAMMASOME | Genes involved in The NLRP3 inflammasome |
| 0.1 | 3.0 | REACTOME CS DS DEGRADATION | Genes involved in CS/DS degradation |
| 0.1 | 5.3 | REACTOME ION TRANSPORT BY P TYPE ATPASES | Genes involved in Ion transport by P-type ATPases |
| 0.1 | 1.7 | REACTOME IL 6 SIGNALING | Genes involved in Interleukin-6 signaling |
| 0.0 | 4.3 | REACTOME NUCLEAR RECEPTOR TRANSCRIPTION PATHWAY | Genes involved in Nuclear Receptor transcription pathway |
| 0.0 | 1.1 | REACTOME N GLYCAN ANTENNAE ELONGATION | Genes involved in N-Glycan antennae elongation |
| 0.0 | 0.4 | REACTOME DEPOSITION OF NEW CENPA CONTAINING NUCLEOSOMES AT THE CENTROMERE | Genes involved in Deposition of New CENPA-containing Nucleosomes at the Centromere |
| 0.0 | 1.1 | REACTOME EXTRINSIC PATHWAY FOR APOPTOSIS | Genes involved in Extrinsic Pathway for Apoptosis |
| 0.0 | 1.3 | REACTOME STEROID HORMONES | Genes involved in Steroid hormones |
| 0.0 | 2.1 | REACTOME REGULATION OF MRNA STABILITY BY PROTEINS THAT BIND AU RICH ELEMENTS | Genes involved in Regulation of mRNA Stability by Proteins that Bind AU-rich Elements |
| 0.0 | 0.5 | REACTOME REGULATION OF PYRUVATE DEHYDROGENASE PDH COMPLEX | Genes involved in Regulation of pyruvate dehydrogenase (PDH) complex |
| 0.0 | 0.6 | REACTOME REGULATION OF COMPLEMENT CASCADE | Genes involved in Regulation of Complement cascade |
| 0.0 | 0.7 | REACTOME CTNNB1 PHOSPHORYLATION CASCADE | Genes involved in Beta-catenin phosphorylation cascade |
| 0.0 | 0.3 | REACTOME OPSINS | Genes involved in Opsins |
| 0.0 | 0.9 | REACTOME PYRUVATE METABOLISM AND CITRIC ACID TCA CYCLE | Genes involved in Pyruvate metabolism and Citric Acid (TCA) cycle |
| 0.0 | 0.4 | REACTOME CALNEXIN CALRETICULIN CYCLE | Genes involved in Calnexin/calreticulin cycle |
| 0.0 | 0.5 | REACTOME TRANSLOCATION OF ZAP 70 TO IMMUNOLOGICAL SYNAPSE | Genes involved in Translocation of ZAP-70 to Immunological synapse |
| 0.0 | 0.5 | REACTOME GLUCURONIDATION | Genes involved in Glucuronidation |
| 0.0 | 0.1 | REACTOME IKK COMPLEX RECRUITMENT MEDIATED BY RIP1 | Genes involved in IKK complex recruitment mediated by RIP1 |
| 0.0 | 1.7 | REACTOME DOWNSTREAM SIGNAL TRANSDUCTION | Genes involved in Downstream signal transduction |