Project
ENCODE cell lines, expression (Ernst 2011)
Navigation
Downloads
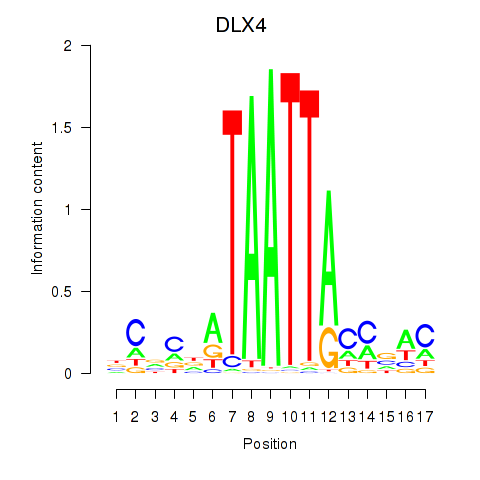
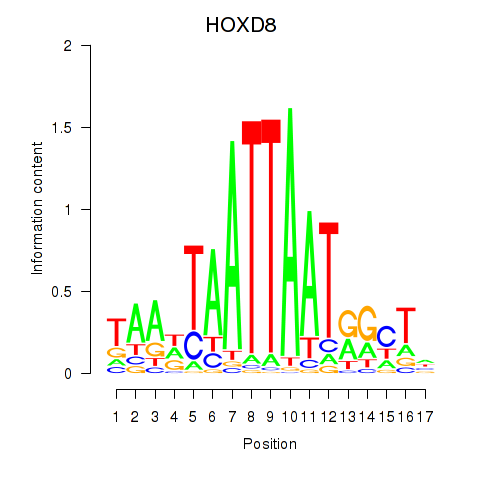
Results for DLX4_HOXD8
Z-value: 1.32
Motif logo
Transcription factors associated with DLX4_HOXD8
| Gene Symbol | Gene ID | Gene Info |
|---|---|---|
|
DLX4
|
ENSG00000108813.9 | DLX4 |
|
HOXD8
|
ENSG00000175879.7 | HOXD8 |
Activity-expression correlation:
| Gene | Promoter | Pearson corr. coef. | P-value | Plot |
|---|---|---|---|---|
| DLX4 | hg19_v2_chr17_+_48046538_48046575 | 0.88 | 6.0e-06 | Click! |
Activity profile of DLX4_HOXD8 motif
Sorted Z-values of DLX4_HOXD8 motif
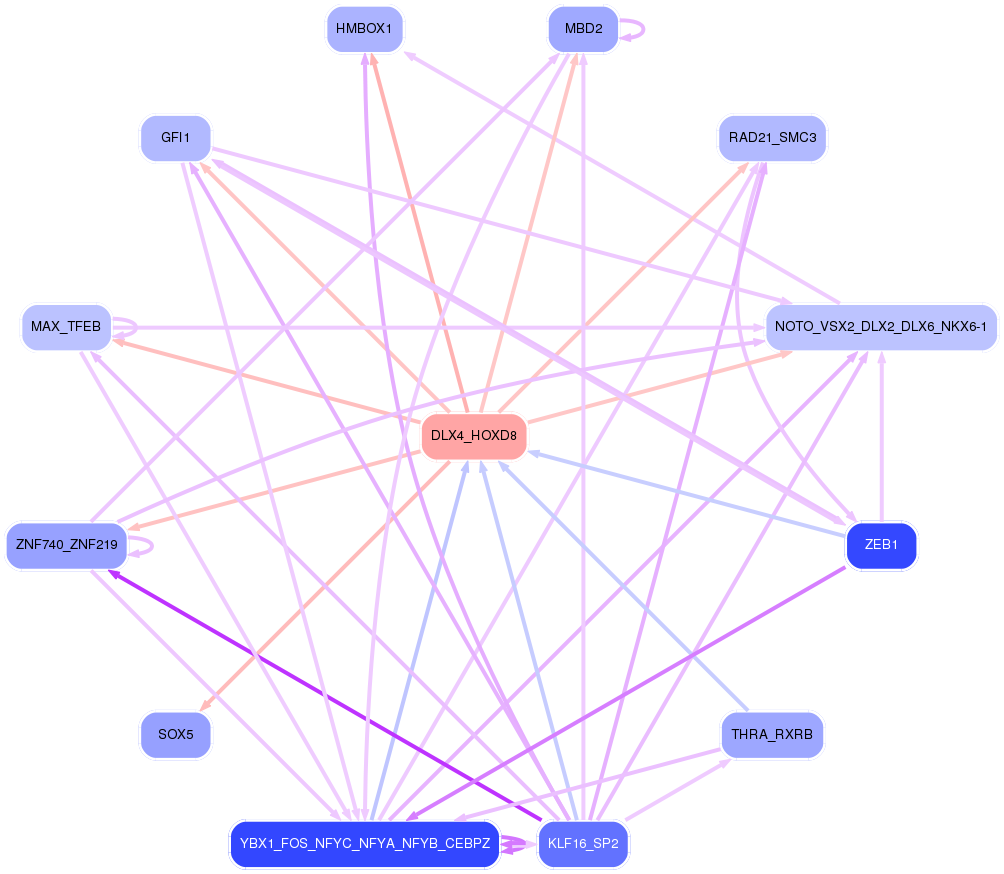
Network of associatons between targets according to the STRING database.

First level regulatory network of DLX4_HOXD8
| Promoter | Score | Transcript | Gene | Gene Info |
|---|---|---|---|---|
| chr10_+_7745303 | 8.33 |
ENST00000429820.1 ENST00000379587.4 |
ITIH2 |
inter-alpha-trypsin inhibitor heavy chain 2 |
| chr17_-_64225508 | 8.32 |
ENST00000205948.6 |
APOH |
apolipoprotein H (beta-2-glycoprotein I) |
| chr4_+_69962185 | 6.11 |
ENST00000305231.7 |
UGT2B7 |
UDP glucuronosyltransferase 2 family, polypeptide B7 |
| chr4_+_69962212 | 5.98 |
ENST00000508661.1 |
UGT2B7 |
UDP glucuronosyltransferase 2 family, polypeptide B7 |
| chr17_-_64216748 | 5.70 |
ENST00000585162.1 |
APOH |
apolipoprotein H (beta-2-glycoprotein I) |
| chr4_+_69681710 | 5.41 |
ENST00000265403.7 ENST00000458688.2 |
UGT2B10 |
UDP glucuronosyltransferase 2 family, polypeptide B10 |
| chr4_+_74275057 | 5.05 |
ENST00000511370.1 |
ALB |
albumin |
| chr10_+_7745232 | 4.81 |
ENST00000358415.4 |
ITIH2 |
inter-alpha-trypsin inhibitor heavy chain 2 |
| chr4_-_69817481 | 3.56 |
ENST00000251566.4 |
UGT2A3 |
UDP glucuronosyltransferase 2 family, polypeptide A3 |
| chr10_+_5005445 | 3.30 |
ENST00000380872.4 |
AKR1C1 |
aldo-keto reductase family 1, member C1 |
| chr2_+_11696464 | 3.08 |
ENST00000234142.5 |
GREB1 |
growth regulation by estrogen in breast cancer 1 |
| chr9_-_116837249 | 3.01 |
ENST00000466610.2 |
AMBP |
alpha-1-microglobulin/bikunin precursor |
| chr9_+_103947311 | 3.00 |
ENST00000395056.2 |
LPPR1 |
Lipid phosphate phosphatase-related protein type 1 |
| chr4_-_70080449 | 2.84 |
ENST00000446444.1 |
UGT2B11 |
UDP glucuronosyltransferase 2 family, polypeptide B11 |
| chr4_+_74301880 | 2.77 |
ENST00000395792.2 ENST00000226359.2 |
AFP |
alpha-fetoprotein |
| chr10_-_5046042 | 2.68 |
ENST00000421196.3 ENST00000455190.1 |
AKR1C2 |
aldo-keto reductase family 1, member C2 |
| chr16_-_28634874 | 2.66 |
ENST00000395609.1 ENST00000350842.4 |
SULT1A1 |
sulfotransferase family, cytosolic, 1A, phenol-preferring, member 1 |
| chr10_-_101825151 | 2.50 |
ENST00000441382.1 |
CPN1 |
carboxypeptidase N, polypeptide 1 |
| chr10_+_5005598 | 2.16 |
ENST00000442997.1 |
AKR1C1 |
aldo-keto reductase family 1, member C1 |
| chr8_-_101571933 | 2.15 |
ENST00000520311.1 |
ANKRD46 |
ankyrin repeat domain 46 |
| chr13_-_46679185 | 2.09 |
ENST00000439329.3 |
CPB2 |
carboxypeptidase B2 (plasma) |
| chr8_-_101571964 | 2.05 |
ENST00000520552.1 ENST00000521345.1 ENST00000523000.1 ENST00000335659.3 ENST00000358990.3 ENST00000519597.1 |
ANKRD46 |
ankyrin repeat domain 46 |
| chr16_+_72090053 | 2.04 |
ENST00000576168.2 ENST00000567185.3 ENST00000567612.2 |
HP |
haptoglobin |
| chr4_+_155484155 | 1.95 |
ENST00000509493.1 |
FGB |
fibrinogen beta chain |
| chr11_+_22696314 | 1.92 |
ENST00000532398.1 ENST00000433790.1 |
GAS2 |
growth arrest-specific 2 |
| chr19_+_45417921 | 1.92 |
ENST00000252491.4 ENST00000592885.1 ENST00000589781.1 |
APOC1 |
apolipoprotein C-I |
| chr4_-_155511887 | 1.89 |
ENST00000302053.3 ENST00000403106.3 |
FGA |
fibrinogen alpha chain |
| chr22_+_21128167 | 1.84 |
ENST00000215727.5 |
SERPIND1 |
serpin peptidase inhibitor, clade D (heparin cofactor), member 1 |
| chr13_-_46679144 | 1.83 |
ENST00000181383.4 |
CPB2 |
carboxypeptidase B2 (plasma) |
| chrX_+_105937068 | 1.81 |
ENST00000324342.3 |
RNF128 |
ring finger protein 128, E3 ubiquitin protein ligase |
| chr8_-_17767866 | 1.80 |
ENST00000398056.2 |
FGL1 |
fibrinogen-like 1 |
| chr14_+_95078714 | 1.73 |
ENST00000393078.3 ENST00000393080.4 ENST00000467132.1 |
SERPINA3 |
serpin peptidase inhibitor, clade A (alpha-1 antiproteinase, antitrypsin), member 3 |
| chr5_-_74162605 | 1.66 |
ENST00000389156.4 ENST00000510496.1 ENST00000380515.3 |
FAM169A |
family with sequence similarity 169, member A |
| chr2_+_211342432 | 1.65 |
ENST00000430249.2 |
CPS1 |
carbamoyl-phosphate synthase 1, mitochondrial |
| chr1_-_205091115 | 1.61 |
ENST00000264515.6 ENST00000367164.1 |
RBBP5 |
retinoblastoma binding protein 5 |
| chr11_+_22689648 | 1.60 |
ENST00000278187.3 |
GAS2 |
growth arrest-specific 2 |
| chr1_-_92371839 | 1.60 |
ENST00000370399.2 |
TGFBR3 |
transforming growth factor, beta receptor III |
| chr18_+_55816546 | 1.58 |
ENST00000435432.2 ENST00000357895.5 ENST00000586263.1 |
NEDD4L |
neural precursor cell expressed, developmentally down-regulated 4-like, E3 ubiquitin protein ligase |
| chr20_+_30697298 | 1.53 |
ENST00000398022.2 |
TM9SF4 |
transmembrane 9 superfamily protein member 4 |
| chr14_-_94789663 | 1.51 |
ENST00000557225.1 ENST00000341584.3 |
SERPINA6 |
serpin peptidase inhibitor, clade A (alpha-1 antiproteinase, antitrypsin), member 6 |
| chr16_-_28621353 | 1.51 |
ENST00000567512.1 |
SULT1A1 |
sulfotransferase family, cytosolic, 1A, phenol-preferring, member 1 |
| chr20_+_34802295 | 1.50 |
ENST00000432603.1 |
EPB41L1 |
erythrocyte membrane protein band 4.1-like 1 |
| chr19_+_45449266 | 1.49 |
ENST00000592257.1 |
APOC2 |
apolipoprotein C-II |
| chr1_-_160492994 | 1.49 |
ENST00000368055.1 ENST00000368057.3 ENST00000368059.3 |
SLAMF6 |
SLAM family member 6 |
| chr9_-_5833027 | 1.46 |
ENST00000339450.5 |
ERMP1 |
endoplasmic reticulum metallopeptidase 1 |
| chr12_-_63328817 | 1.44 |
ENST00000228705.6 |
PPM1H |
protein phosphatase, Mg2+/Mn2+ dependent, 1H |
| chr5_+_129083772 | 1.42 |
ENST00000564719.1 |
KIAA1024L |
KIAA1024-like |
| chr12_-_8088871 | 1.42 |
ENST00000075120.7 |
SLC2A3 |
solute carrier family 2 (facilitated glucose transporter), member 3 |
| chr18_+_60206744 | 1.41 |
ENST00000586834.1 |
ZCCHC2 |
zinc finger, CCHC domain containing 2 |
| chr3_+_46618727 | 1.41 |
ENST00000296145.5 |
TDGF1 |
teratocarcinoma-derived growth factor 1 |
| chr16_-_28621312 | 1.40 |
ENST00000314752.7 |
SULT1A1 |
sulfotransferase family, cytosolic, 1A, phenol-preferring, member 1 |
| chr14_-_20801427 | 1.38 |
ENST00000557665.1 ENST00000358932.4 ENST00000353689.4 |
CCNB1IP1 |
cyclin B1 interacting protein 1, E3 ubiquitin protein ligase |
| chr3_-_194072019 | 1.38 |
ENST00000429275.1 ENST00000323830.3 |
CPN2 |
carboxypeptidase N, polypeptide 2 |
| chr19_+_45449301 | 1.36 |
ENST00000591597.1 |
APOC2 |
apolipoprotein C-II |
| chr16_-_28621298 | 1.34 |
ENST00000566189.1 |
SULT1A1 |
sulfotransferase family, cytosolic, 1A, phenol-preferring, member 1 |
| chr6_-_52705641 | 1.33 |
ENST00000370989.2 |
GSTA5 |
glutathione S-transferase alpha 5 |
| chr16_+_82068830 | 1.32 |
ENST00000199936.4 |
HSD17B2 |
hydroxysteroid (17-beta) dehydrogenase 2 |
| chr10_+_57358750 | 1.31 |
ENST00000512524.2 |
MTRNR2L5 |
MT-RNR2-like 5 |
| chr17_-_39093672 | 1.28 |
ENST00000209718.3 ENST00000436344.3 ENST00000485751.1 |
KRT23 |
keratin 23 (histone deacetylase inducible) |
| chr4_-_100356291 | 1.26 |
ENST00000476959.1 ENST00000482593.1 |
ADH7 |
alcohol dehydrogenase 7 (class IV), mu or sigma polypeptide |
| chr19_+_35773242 | 1.25 |
ENST00000222304.3 |
HAMP |
hepcidin antimicrobial peptide |
| chr17_+_79953310 | 1.24 |
ENST00000582355.2 |
ASPSCR1 |
alveolar soft part sarcoma chromosome region, candidate 1 |
| chr15_+_50474385 | 1.21 |
ENST00000267842.5 |
SLC27A2 |
solute carrier family 27 (fatty acid transporter), member 2 |
| chr4_-_110723134 | 1.21 |
ENST00000510800.1 ENST00000512148.1 |
CFI |
complement factor I |
| chr12_-_51422017 | 1.19 |
ENST00000394904.3 |
SLC11A2 |
solute carrier family 11 (proton-coupled divalent metal ion transporter), member 2 |
| chr15_+_58702742 | 1.17 |
ENST00000356113.6 ENST00000414170.3 |
LIPC |
lipase, hepatic |
| chr17_+_67498538 | 1.17 |
ENST00000589647.1 |
MAP2K6 |
mitogen-activated protein kinase kinase 6 |
| chr8_+_28748765 | 1.16 |
ENST00000355231.5 |
HMBOX1 |
homeobox containing 1 |
| chr19_+_45449228 | 1.15 |
ENST00000252490.4 |
APOC2 |
apolipoprotein C-II |
| chr19_-_47291843 | 1.14 |
ENST00000542575.2 |
SLC1A5 |
solute carrier family 1 (neutral amino acid transporter), member 5 |
| chr6_+_42584847 | 1.13 |
ENST00000372883.3 |
UBR2 |
ubiquitin protein ligase E3 component n-recognin 2 |
| chr16_+_15489603 | 1.13 |
ENST00000568766.1 ENST00000287594.7 |
RP11-1021N1.1 MPV17L |
Uncharacterized protein MPV17 mitochondrial membrane protein-like |
| chr11_-_128894053 | 1.12 |
ENST00000392657.3 |
ARHGAP32 |
Rho GTPase activating protein 32 |
| chr11_-_2162468 | 1.12 |
ENST00000434045.2 |
IGF2 |
insulin-like growth factor 2 (somatomedin A) |
| chr17_+_1674982 | 1.11 |
ENST00000572048.1 ENST00000573763.1 |
SERPINF1 |
serpin peptidase inhibitor, clade F (alpha-2 antiplasmin, pigment epithelium derived factor), member 1 |
| chr16_-_30122717 | 1.11 |
ENST00000566613.1 |
GDPD3 |
glycerophosphodiester phosphodiesterase domain containing 3 |
| chr4_+_70146217 | 1.10 |
ENST00000335568.5 ENST00000511240.1 |
UGT2B28 |
UDP glucuronosyltransferase 2 family, polypeptide B28 |
| chr19_+_45409011 | 1.09 |
ENST00000252486.4 ENST00000446996.1 ENST00000434152.1 |
APOE |
apolipoprotein E |
| chr21_-_15918618 | 1.09 |
ENST00000400564.1 ENST00000400566.1 |
SAMSN1 |
SAM domain, SH3 domain and nuclear localization signals 1 |
| chr6_+_89674246 | 1.08 |
ENST00000369474.1 |
AL079342.1 |
Uncharacterized protein; cDNA FLJ27030 fis, clone SLV07741 |
| chrX_-_130423200 | 1.08 |
ENST00000361420.3 |
IGSF1 |
immunoglobulin superfamily, member 1 |
| chr8_+_97597148 | 1.07 |
ENST00000521590.1 |
SDC2 |
syndecan 2 |
| chr1_-_212965104 | 1.07 |
ENST00000422588.2 ENST00000366975.6 ENST00000366977.3 ENST00000366976.1 |
NSL1 |
NSL1, MIS12 kinetochore complex component |
| chr1_+_207262170 | 1.07 |
ENST00000367078.3 |
C4BPB |
complement component 4 binding protein, beta |
| chr12_+_51318513 | 1.06 |
ENST00000332160.4 |
METTL7A |
methyltransferase like 7A |
| chr2_-_99279928 | 1.06 |
ENST00000414521.2 |
MGAT4A |
mannosyl (alpha-1,3-)-glycoprotein beta-1,4-N-acetylglucosaminyltransferase, isozyme A |
| chr4_+_155484103 | 1.05 |
ENST00000302068.4 |
FGB |
fibrinogen beta chain |
| chr4_-_70361579 | 1.05 |
ENST00000512583.1 |
UGT2B4 |
UDP glucuronosyltransferase 2 family, polypeptide B4 |
| chr14_-_90085458 | 1.03 |
ENST00000345097.4 ENST00000555855.1 ENST00000555353.1 |
FOXN3 |
forkhead box N3 |
| chr7_+_138145076 | 1.03 |
ENST00000343526.4 |
TRIM24 |
tripartite motif containing 24 |
| chr19_+_42212501 | 1.03 |
ENST00000398599.4 |
CEACAM5 |
carcinoembryonic antigen-related cell adhesion molecule 5 |
| chr19_+_11350278 | 0.98 |
ENST00000252453.8 |
C19orf80 |
chromosome 19 open reading frame 80 |
| chr7_+_138145145 | 0.96 |
ENST00000415680.2 |
TRIM24 |
tripartite motif containing 24 |
| chrX_-_6453159 | 0.95 |
ENST00000381089.3 ENST00000398729.1 |
VCX3A |
variable charge, X-linked 3A |
| chr21_-_43735628 | 0.94 |
ENST00000291525.10 ENST00000518498.1 |
TFF3 |
trefoil factor 3 (intestinal) |
| chr16_-_28608364 | 0.93 |
ENST00000533150.1 |
SULT1A2 |
sulfotransferase family, cytosolic, 1A, phenol-preferring, member 2 |
| chr22_-_29107919 | 0.93 |
ENST00000434810.1 ENST00000456369.1 |
CHEK2 |
checkpoint kinase 2 |
| chr14_-_23426270 | 0.93 |
ENST00000557591.1 ENST00000397409.4 ENST00000490506.1 ENST00000554406.1 |
HAUS4 |
HAUS augmin-like complex, subunit 4 |
| chr9_+_35673853 | 0.92 |
ENST00000378357.4 |
CA9 |
carbonic anhydrase IX |
| chr14_-_23426322 | 0.92 |
ENST00000555367.1 |
HAUS4 |
HAUS augmin-like complex, subunit 4 |
| chr6_+_28092338 | 0.91 |
ENST00000340487.4 |
ZSCAN16 |
zinc finger and SCAN domain containing 16 |
| chr19_+_54466179 | 0.91 |
ENST00000270458.2 |
CACNG8 |
calcium channel, voltage-dependent, gamma subunit 8 |
| chr15_+_58724184 | 0.90 |
ENST00000433326.2 |
LIPC |
lipase, hepatic |
| chr6_+_64345698 | 0.90 |
ENST00000506783.1 ENST00000481385.2 ENST00000515594.1 ENST00000494284.2 ENST00000262043.3 |
PHF3 |
PHD finger protein 3 |
| chr1_-_13390765 | 0.90 |
ENST00000357367.2 |
PRAMEF8 |
PRAME family member 8 |
| chr4_+_71063641 | 0.90 |
ENST00000514097.1 |
ODAM |
odontogenic, ameloblast asssociated |
| chr9_-_21351377 | 0.89 |
ENST00000380210.1 |
IFNA6 |
interferon, alpha 6 |
| chr4_-_70361615 | 0.89 |
ENST00000305107.6 |
UGT2B4 |
UDP glucuronosyltransferase 2 family, polypeptide B4 |
| chrX_+_84258832 | 0.88 |
ENST00000373173.2 |
APOOL |
apolipoprotein O-like |
| chr15_+_65822756 | 0.87 |
ENST00000562901.1 ENST00000261875.5 ENST00000442729.2 ENST00000565299.1 ENST00000568793.1 |
PTPLAD1 |
protein tyrosine phosphatase-like A domain containing 1 |
| chr14_-_23426337 | 0.87 |
ENST00000342454.8 ENST00000555986.1 ENST00000541587.1 ENST00000554516.1 ENST00000347758.2 ENST00000206474.7 ENST00000555040.1 |
HAUS4 |
HAUS augmin-like complex, subunit 4 |
| chr16_+_24549014 | 0.86 |
ENST00000564314.1 ENST00000567686.1 |
RBBP6 |
retinoblastoma binding protein 6 |
| chr9_+_108463234 | 0.86 |
ENST00000374688.1 |
TMEM38B |
transmembrane protein 38B |
| chr1_-_158656488 | 0.82 |
ENST00000368147.4 |
SPTA1 |
spectrin, alpha, erythrocytic 1 (elliptocytosis 2) |
| chr3_+_157828152 | 0.81 |
ENST00000476899.1 |
RSRC1 |
arginine/serine-rich coiled-coil 1 |
| chr1_+_117963209 | 0.81 |
ENST00000449370.2 |
MAN1A2 |
mannosidase, alpha, class 1A, member 2 |
| chr12_-_10282742 | 0.80 |
ENST00000298523.5 ENST00000396484.2 ENST00000310002.4 |
CLEC7A |
C-type lectin domain family 7, member A |
| chr2_+_86333301 | 0.80 |
ENST00000254630.7 |
PTCD3 |
pentatricopeptide repeat domain 3 |
| chr10_+_5135981 | 0.80 |
ENST00000380554.3 |
AKR1C3 |
aldo-keto reductase family 1, member C3 |
| chrX_-_20236970 | 0.79 |
ENST00000379548.4 |
RPS6KA3 |
ribosomal protein S6 kinase, 90kDa, polypeptide 3 |
| chr12_-_23737534 | 0.77 |
ENST00000396007.2 |
SOX5 |
SRY (sex determining region Y)-box 5 |
| chr16_+_10479906 | 0.75 |
ENST00000562527.1 ENST00000396560.2 ENST00000396559.1 ENST00000562102.1 ENST00000543967.1 ENST00000569939.1 ENST00000569900.1 |
ATF7IP2 |
activating transcription factor 7 interacting protein 2 |
| chr6_-_45345597 | 0.75 |
ENST00000371460.1 ENST00000371459.1 |
SUPT3H |
suppressor of Ty 3 homolog (S. cerevisiae) |
| chr1_+_120254510 | 0.75 |
ENST00000369409.4 |
PHGDH |
phosphoglycerate dehydrogenase |
| chr14_+_74111578 | 0.75 |
ENST00000554113.1 ENST00000555631.2 ENST00000553645.2 ENST00000311089.3 ENST00000555919.3 ENST00000554339.1 ENST00000554871.1 |
DNAL1 |
dynein, axonemal, light chain 1 |
| chr6_+_153552455 | 0.75 |
ENST00000392385.2 |
AL590867.1 |
Uncharacterized protein; cDNA FLJ59044, highly similar to LINE-1 reverse transcriptase homolog |
| chr16_-_28608424 | 0.75 |
ENST00000335715.4 |
SULT1A2 |
sulfotransferase family, cytosolic, 1A, phenol-preferring, member 2 |
| chr7_-_20256965 | 0.74 |
ENST00000400331.5 ENST00000332878.4 |
MACC1 |
metastasis associated in colon cancer 1 |
| chr14_+_68086515 | 0.74 |
ENST00000261783.3 |
ARG2 |
arginase 2 |
| chr5_+_54455946 | 0.73 |
ENST00000503787.1 ENST00000296734.6 ENST00000515370.1 |
GPX8 |
glutathione peroxidase 8 (putative) |
| chr5_-_42825983 | 0.73 |
ENST00000506577.1 |
SEPP1 |
selenoprotein P, plasma, 1 |
| chr2_+_120687335 | 0.72 |
ENST00000544261.1 |
PTPN4 |
protein tyrosine phosphatase, non-receptor type 4 (megakaryocyte) |
| chr11_+_62104897 | 0.72 |
ENST00000415229.2 ENST00000535727.1 ENST00000301776.5 |
ASRGL1 |
asparaginase like 1 |
| chr6_-_25874440 | 0.72 |
ENST00000361703.6 ENST00000397060.4 |
SLC17A3 |
solute carrier family 17 (organic anion transporter), member 3 |
| chrX_-_122756660 | 0.72 |
ENST00000441692.1 |
THOC2 |
THO complex 2 |
| chr14_-_54423529 | 0.71 |
ENST00000245451.4 ENST00000559087.1 |
BMP4 |
bone morphogenetic protein 4 |
| chr16_+_22524844 | 0.71 |
ENST00000538606.1 ENST00000424340.1 ENST00000517539.1 ENST00000528249.1 |
NPIPB5 |
nuclear pore complex interacting protein family, member B5 |
| chr3_-_184971853 | 0.70 |
ENST00000231887.3 |
EHHADH |
enoyl-CoA, hydratase/3-hydroxyacyl CoA dehydrogenase |
| chr2_+_161993465 | 0.69 |
ENST00000457476.1 |
TANK |
TRAF family member-associated NFKB activator |
| chr11_+_17281900 | 0.69 |
ENST00000530527.1 |
NUCB2 |
nucleobindin 2 |
| chr7_+_150020329 | 0.69 |
ENST00000323078.7 |
LRRC61 |
leucine rich repeat containing 61 |
| chr5_-_42812143 | 0.68 |
ENST00000514985.1 |
SEPP1 |
selenoprotein P, plasma, 1 |
| chr6_-_26056695 | 0.68 |
ENST00000343677.2 |
HIST1H1C |
histone cluster 1, H1c |
| chr6_-_111136513 | 0.68 |
ENST00000368911.3 |
CDK19 |
cyclin-dependent kinase 19 |
| chr1_+_73771844 | 0.68 |
ENST00000440762.1 ENST00000444827.1 ENST00000415686.1 ENST00000411903.1 |
RP4-598G3.1 |
RP4-598G3.1 |
| chr8_+_40010989 | 0.68 |
ENST00000315792.3 |
C8orf4 |
chromosome 8 open reading frame 4 |
| chr2_+_90211643 | 0.68 |
ENST00000390277.2 |
IGKV3D-11 |
immunoglobulin kappa variable 3D-11 |
| chr2_+_234826016 | 0.68 |
ENST00000324695.4 ENST00000433712.2 |
TRPM8 |
transient receptor potential cation channel, subfamily M, member 8 |
| chr7_+_6522922 | 0.66 |
ENST00000601673.1 |
FLJ20306 |
CDNA FLJ20306 fis, clone HEP06881; Putative uncharacterized protein FLJ20306; Uncharacterized protein |
| chr2_+_201754050 | 0.66 |
ENST00000426253.1 ENST00000416651.1 ENST00000454952.1 ENST00000409020.1 ENST00000359683.4 |
NIF3L1 |
NIF3 NGG1 interacting factor 3-like 1 (S. cerevisiae) |
| chr3_-_93692781 | 0.66 |
ENST00000394236.3 |
PROS1 |
protein S (alpha) |
| chr5_-_42811986 | 0.66 |
ENST00000511224.1 ENST00000507920.1 ENST00000510965.1 |
SEPP1 |
selenoprotein P, plasma, 1 |
| chr2_+_202047596 | 0.65 |
ENST00000286186.6 ENST00000360132.3 |
CASP10 |
caspase 10, apoptosis-related cysteine peptidase |
| chr11_-_18258342 | 0.65 |
ENST00000278222.4 |
SAA4 |
serum amyloid A4, constitutive |
| chr12_-_10978957 | 0.65 |
ENST00000240619.2 |
TAS2R10 |
taste receptor, type 2, member 10 |
| chr19_+_42301079 | 0.65 |
ENST00000596544.1 |
CEACAM3 |
carcinoembryonic antigen-related cell adhesion molecule 3 |
| chr6_-_133035185 | 0.65 |
ENST00000367928.4 |
VNN1 |
vanin 1 |
| chr16_+_72088376 | 0.65 |
ENST00000570083.1 ENST00000355906.5 ENST00000398131.2 ENST00000569639.1 ENST00000564499.1 ENST00000357763.4 ENST00000562526.1 ENST00000565574.1 ENST00000568417.2 ENST00000356967.5 |
HP HPR |
haptoglobin haptoglobin-related protein |
| chr12_-_123201337 | 0.64 |
ENST00000528880.2 |
HCAR3 |
hydroxycarboxylic acid receptor 3 |
| chr19_+_5823813 | 0.64 |
ENST00000303212.2 |
NRTN |
neurturin |
| chr4_+_40198527 | 0.64 |
ENST00000381799.5 |
RHOH |
ras homolog family member H |
| chr2_-_17981462 | 0.64 |
ENST00000402989.1 ENST00000428868.1 |
SMC6 |
structural maintenance of chromosomes 6 |
| chr10_-_54531406 | 0.64 |
ENST00000373968.3 |
MBL2 |
mannose-binding lectin (protein C) 2, soluble |
| chr2_+_170440844 | 0.64 |
ENST00000260970.3 ENST00000433207.1 ENST00000409714.3 ENST00000462903.1 |
PPIG |
peptidylprolyl isomerase G (cyclophilin G) |
| chrM_+_4431 | 0.63 |
ENST00000361453.3 |
MT-ND2 |
mitochondrially encoded NADH dehydrogenase 2 |
| chr12_-_8043736 | 0.63 |
ENST00000539924.1 |
SLC2A14 |
solute carrier family 2 (facilitated glucose transporter), member 14 |
| chr9_-_94124171 | 0.63 |
ENST00000422391.2 ENST00000375731.4 ENST00000303617.5 |
AUH |
AU RNA binding protein/enoyl-CoA hydratase |
| chr2_+_163200598 | 0.62 |
ENST00000437150.2 ENST00000453113.2 |
GCA |
grancalcin, EF-hand calcium binding protein |
| chr3_-_178969403 | 0.62 |
ENST00000314235.5 ENST00000392685.2 |
KCNMB3 |
potassium large conductance calcium-activated channel, subfamily M beta member 3 |
| chr10_-_115614127 | 0.62 |
ENST00000369305.1 |
DCLRE1A |
DNA cross-link repair 1A |
| chr2_+_201754135 | 0.61 |
ENST00000409357.1 ENST00000409129.2 |
NIF3L1 |
NIF3 NGG1 interacting factor 3-like 1 (S. cerevisiae) |
| chr16_+_12059091 | 0.61 |
ENST00000562385.1 |
TNFRSF17 |
tumor necrosis factor receptor superfamily, member 17 |
| chr14_-_74485960 | 0.61 |
ENST00000556242.1 ENST00000334696.6 |
ENTPD5 |
ectonucleoside triphosphate diphosphohydrolase 5 |
| chr6_-_25930819 | 0.61 |
ENST00000360488.3 |
SLC17A2 |
solute carrier family 17, member 2 |
| chr15_+_65843130 | 0.61 |
ENST00000569894.1 |
PTPLAD1 |
protein tyrosine phosphatase-like A domain containing 1 |
| chr6_+_25652432 | 0.61 |
ENST00000377961.2 |
SCGN |
secretagogin, EF-hand calcium binding protein |
| chr5_+_175288631 | 0.61 |
ENST00000509837.1 |
CPLX2 |
complexin 2 |
| chr6_+_131894284 | 0.60 |
ENST00000368087.3 ENST00000356962.2 |
ARG1 |
arginase 1 |
| chr1_-_182360498 | 0.60 |
ENST00000417584.2 |
GLUL |
glutamate-ammonia ligase |
| chr1_-_19229248 | 0.60 |
ENST00000375341.3 |
ALDH4A1 |
aldehyde dehydrogenase 4 family, member A1 |
| chr13_-_41706864 | 0.60 |
ENST00000379485.1 ENST00000499385.2 |
KBTBD6 |
kelch repeat and BTB (POZ) domain containing 6 |
| chr6_+_17600576 | 0.59 |
ENST00000259963.3 |
FAM8A1 |
family with sequence similarity 8, member A1 |
| chr1_-_19229014 | 0.59 |
ENST00000538839.1 ENST00000290597.5 |
ALDH4A1 |
aldehyde dehydrogenase 4 family, member A1 |
| chrX_-_40036520 | 0.59 |
ENST00000406200.2 ENST00000378455.4 ENST00000342274.4 |
BCOR |
BCL6 corepressor |
| chr4_-_100356551 | 0.59 |
ENST00000209665.4 |
ADH7 |
alcohol dehydrogenase 7 (class IV), mu or sigma polypeptide |
| chr11_+_89867681 | 0.59 |
ENST00000534061.1 |
NAALAD2 |
N-acetylated alpha-linked acidic dipeptidase 2 |
| chr10_-_72648541 | 0.59 |
ENST00000299299.3 |
PCBD1 |
pterin-4 alpha-carbinolamine dehydratase/dimerization cofactor of hepatocyte nuclear factor 1 alpha |
| chr5_+_156696362 | 0.58 |
ENST00000377576.3 |
CYFIP2 |
cytoplasmic FMR1 interacting protein 2 |
| chr4_+_80584903 | 0.58 |
ENST00000506460.1 |
RP11-452C8.1 |
RP11-452C8.1 |
| chr1_-_45140074 | 0.58 |
ENST00000420706.1 ENST00000372235.3 ENST00000372242.3 ENST00000372243.3 ENST00000372244.3 |
TMEM53 |
transmembrane protein 53 |
| chr6_-_41703952 | 0.58 |
ENST00000358871.2 ENST00000403298.4 |
TFEB |
transcription factor EB |
| chr3_+_124303539 | 0.58 |
ENST00000428018.2 |
KALRN |
kalirin, RhoGEF kinase |
| chr6_+_26199737 | 0.58 |
ENST00000359985.1 |
HIST1H2BF |
histone cluster 1, H2bf |
| chr1_+_169079823 | 0.58 |
ENST00000367813.3 |
ATP1B1 |
ATPase, Na+/K+ transporting, beta 1 polypeptide |
| chr6_-_32908792 | 0.57 |
ENST00000418107.2 |
HLA-DMB |
major histocompatibility complex, class II, DM beta |
| chr6_-_25930904 | 0.57 |
ENST00000377850.3 |
SLC17A2 |
solute carrier family 17, member 2 |
| chrX_+_144908928 | 0.57 |
ENST00000408967.2 |
TMEM257 |
transmembrane protein 257 |
| chr2_+_163200848 | 0.57 |
ENST00000233612.4 |
GCA |
grancalcin, EF-hand calcium binding protein |
| chr9_-_115480303 | 0.56 |
ENST00000374234.1 ENST00000374238.1 ENST00000374236.1 ENST00000374242.4 |
INIP |
INTS3 and NABP interacting protein |
| chr19_-_36304201 | 0.56 |
ENST00000301175.3 |
PRODH2 |
proline dehydrogenase (oxidase) 2 |
Gene Ontology Analysis
Gene overrepresentation in C2:CP:REACTOME category:
| Log-likelihood per target | Total log-likelihood | Term | Description |
|---|---|---|---|
| 0.7 | 17.6 | REACTOME GLUCURONIDATION | Genes involved in Glucuronidation |
| 0.4 | 10.2 | REACTOME HDL MEDIATED LIPID TRANSPORT | Genes involved in HDL-mediated lipid transport |
| 0.3 | 4.8 | REACTOME COMMON PATHWAY | Genes involved in Common Pathway |
| 0.3 | 7.1 | REACTOME CYTOSOLIC SULFONATION OF SMALL MOLECULES | Genes involved in Cytosolic sulfonation of small molecules |
| 0.2 | 1.8 | REACTOME ETHANOL OXIDATION | Genes involved in Ethanol oxidation |
| 0.2 | 0.4 | REACTOME SIGNALING BY FGFR | Genes involved in Signaling by FGFR |
| 0.1 | 2.1 | REACTOME CHYLOMICRON MEDIATED LIPID TRANSPORT | Genes involved in Chylomicron-mediated lipid transport |
| 0.1 | 2.0 | REACTOME REVERSIBLE HYDRATION OF CARBON DIOXIDE | Genes involved in Reversible Hydration of Carbon Dioxide |
| 0.1 | 1.2 | REACTOME SYNTHESIS OF BILE ACIDS AND BILE SALTS VIA 24 HYDROXYCHOLESTEROL | Genes involved in Synthesis of bile acids and bile salts via 24-hydroxycholesterol |
| 0.1 | 0.2 | REACTOME ACYL CHAIN REMODELLING OF PG | Genes involved in Acyl chain remodelling of PG |
| 0.1 | 2.3 | REACTOME FACILITATIVE NA INDEPENDENT GLUCOSE TRANSPORTERS | Genes involved in Facilitative Na+-independent glucose transporters |
| 0.1 | 1.3 | REACTOME ROLE OF DCC IN REGULATING APOPTOSIS | Genes involved in Role of DCC in regulating apoptosis |
| 0.1 | 2.8 | REACTOME REGULATION OF IFNA SIGNALING | Genes involved in Regulation of IFNA signaling |
| 0.1 | 1.5 | REACTOME G2 M DNA DAMAGE CHECKPOINT | Genes involved in G2/M DNA damage checkpoint |
| 0.1 | 1.4 | REACTOME APOPTOSIS INDUCED DNA FRAGMENTATION | Genes involved in Apoptosis induced DNA fragmentation |
| 0.1 | 0.1 | REACTOME SYNTHESIS SECRETION AND INACTIVATION OF GLP1 | Genes involved in Synthesis, Secretion, and Inactivation of Glucagon-like Peptide-1 (GLP-1) |
| 0.1 | 1.5 | REACTOME REGULATION OF INSULIN LIKE GROWTH FACTOR IGF ACTIVITY BY INSULIN LIKE GROWTH FACTOR BINDING PROTEINS IGFBPS | Genes involved in Regulation of Insulin-like Growth Factor (IGF) Activity by Insulin-like Growth Factor Binding Proteins (IGFBPs) |
| 0.1 | 1.9 | REACTOME CASPASE MEDIATED CLEAVAGE OF CYTOSKELETAL PROTEINS | Genes involved in Caspase-mediated cleavage of cytoskeletal proteins |
| 0.1 | 2.0 | REACTOME SIGNALING BY FGFR1 FUSION MUTANTS | Genes involved in Signaling by FGFR1 fusion mutants |
| 0.1 | 1.2 | REACTOME TRAF6 MEDIATED IRF7 ACTIVATION | Genes involved in TRAF6 mediated IRF7 activation |
| 0.1 | 1.5 | REACTOME KINESINS | Genes involved in Kinesins |
| 0.1 | 3.3 | REACTOME RNA POL I PROMOTER OPENING | Genes involved in RNA Polymerase I Promoter Opening |
| 0.0 | 1.4 | REACTOME AMINO ACID SYNTHESIS AND INTERCONVERSION TRANSAMINATION | Genes involved in Amino acid synthesis and interconversion (transamination) |
| 0.0 | 1.1 | REACTOME HS GAG DEGRADATION | Genes involved in HS-GAG degradation |
| 0.0 | 0.7 | REACTOME CALNEXIN CALRETICULIN CYCLE | Genes involved in Calnexin/calreticulin cycle |
| 0.0 | 1.0 | REACTOME N GLYCAN ANTENNAE ELONGATION | Genes involved in N-Glycan antennae elongation |
| 0.0 | 0.6 | REACTOME NFKB ACTIVATION THROUGH FADD RIP1 PATHWAY MEDIATED BY CASPASE 8 AND10 | Genes involved in NF-kB activation through FADD/RIP-1 pathway mediated by caspase-8 and -10 |
| 0.0 | 2.1 | REACTOME TRAFFICKING OF AMPA RECEPTORS | Genes involved in Trafficking of AMPA receptors |
| 0.0 | 0.7 | REACTOME P2Y RECEPTORS | Genes involved in P2Y receptors |
| 0.0 | 1.6 | REACTOME AMINO ACID TRANSPORT ACROSS THE PLASMA MEMBRANE | Genes involved in Amino acid transport across the plasma membrane |
| 0.0 | 0.9 | REACTOME ACTIVATED TAK1 MEDIATES P38 MAPK ACTIVATION | Genes involved in activated TAK1 mediates p38 MAPK activation |
| 0.0 | 0.4 | REACTOME CREATION OF C4 AND C2 ACTIVATORS | Genes involved in Creation of C4 and C2 activators |
| 0.0 | 0.5 | REACTOME BILE SALT AND ORGANIC ANION SLC TRANSPORTERS | Genes involved in Bile salt and organic anion SLC transporters |
| 0.0 | 1.2 | REACTOME INTERACTION BETWEEN L1 AND ANKYRINS | Genes involved in Interaction between L1 and Ankyrins |
| 0.0 | 0.4 | REACTOME THE ACTIVATION OF ARYLSULFATASES | Genes involved in The activation of arylsulfatases |
| 0.0 | 0.5 | REACTOME KERATAN SULFATE DEGRADATION | Genes involved in Keratan sulfate degradation |
| 0.0 | 0.5 | REACTOME KERATAN SULFATE KERATIN METABOLISM | Genes involved in Keratan sulfate/keratin metabolism |
| 0.0 | 0.2 | REACTOME RAF MAP KINASE CASCADE | Genes involved in RAF/MAP kinase cascade |
| 0.0 | 0.8 | REACTOME CIRCADIAN REPRESSION OF EXPRESSION BY REV ERBA | Genes involved in Circadian Repression of Expression by REV-ERBA |
| 0.0 | 0.4 | REACTOME ANTIGEN PROCESSING CROSS PRESENTATION | Genes involved in Antigen processing-Cross presentation |
| 0.0 | 0.4 | REACTOME DEPOSITION OF NEW CENPA CONTAINING NUCLEOSOMES AT THE CENTROMERE | Genes involved in Deposition of New CENPA-containing Nucleosomes at the Centromere |
| 0.0 | 0.9 | REACTOME RNA POL III TRANSCRIPTION INITIATION FROM TYPE 2 PROMOTER | Genes involved in RNA Polymerase III Transcription Initiation From Type 2 Promoter |
| 0.0 | 0.9 | REACTOME SIGNALING BY NODAL | Genes involved in Signaling by NODAL |
| 0.0 | 0.6 | REACTOME BASIGIN INTERACTIONS | Genes involved in Basigin interactions |
| 0.0 | 1.0 | REACTOME SPHINGOLIPID DE NOVO BIOSYNTHESIS | Genes involved in Sphingolipid de novo biosynthesis |
| 0.0 | 0.7 | REACTOME SIGNALING BY HIPPO | Genes involved in Signaling by Hippo |
| 0.0 | 1.0 | REACTOME CREB PHOSPHORYLATION THROUGH THE ACTIVATION OF RAS | Genes involved in CREB phosphorylation through the activation of Ras |
| 0.0 | 0.6 | REACTOME TRANSLOCATION OF ZAP 70 TO IMMUNOLOGICAL SYNAPSE | Genes involved in Translocation of ZAP-70 to Immunological synapse |
| 0.0 | 0.2 | REACTOME BETA DEFENSINS | Genes involved in Beta defensins |
| 0.0 | 0.7 | REACTOME SYNTHESIS OF PA | Genes involved in Synthesis of PA |
| 0.0 | 0.2 | REACTOME ACTIVATION OF RAC | Genes involved in Activation of Rac |
| 0.0 | 0.3 | REACTOME HORMONE LIGAND BINDING RECEPTORS | Genes involved in Hormone ligand-binding receptors |
| 0.0 | 0.2 | REACTOME NEGATIVE REGULATION OF THE PI3K AKT NETWORK | Genes involved in Negative regulation of the PI3K/AKT network |
| 0.0 | 0.4 | REACTOME P130CAS LINKAGE TO MAPK SIGNALING FOR INTEGRINS | Genes involved in p130Cas linkage to MAPK signaling for integrins |
| 0.0 | 1.7 | REACTOME MITOTIC PROMETAPHASE | Genes involved in Mitotic Prometaphase |
| 0.0 | 0.3 | REACTOME FORMATION OF RNA POL II ELONGATION COMPLEX | Genes involved in Formation of RNA Pol II elongation complex |
| 0.0 | 0.6 | REACTOME ABC FAMILY PROTEINS MEDIATED TRANSPORT | Genes involved in ABC-family proteins mediated transport |
| 0.0 | 0.1 | REACTOME THE ROLE OF NEF IN HIV1 REPLICATION AND DISEASE PATHOGENESIS | Genes involved in The role of Nef in HIV-1 replication and disease pathogenesis |
| 0.0 | 0.2 | REACTOME ABACAVIR TRANSPORT AND METABOLISM | Genes involved in Abacavir transport and metabolism |
| 0.0 | 0.5 | REACTOME ASSOCIATION OF TRIC CCT WITH TARGET PROTEINS DURING BIOSYNTHESIS | Genes involved in Association of TriC/CCT with target proteins during biosynthesis |
| 0.0 | 0.2 | REACTOME ELEVATION OF CYTOSOLIC CA2 LEVELS | Genes involved in Elevation of cytosolic Ca2+ levels |
| 0.0 | 0.3 | REACTOME HOMOLOGOUS RECOMBINATION REPAIR OF REPLICATION INDEPENDENT DOUBLE STRAND BREAKS | Genes involved in Homologous recombination repair of replication-independent double-strand breaks |
| 0.0 | 0.3 | REACTOME CGMP EFFECTS | Genes involved in cGMP effects |
| 0.0 | 0.2 | REACTOME DOWNSTREAM TCR SIGNALING | Genes involved in Downstream TCR signaling |
| 0.0 | 0.2 | REACTOME REGULATION OF SIGNALING BY CBL | Genes involved in Regulation of signaling by CBL |
| 0.0 | 0.2 | REACTOME PURINE RIBONUCLEOSIDE MONOPHOSPHATE BIOSYNTHESIS | Genes involved in Purine ribonucleoside monophosphate biosynthesis |
| 0.0 | 0.5 | REACTOME TRANSPORT TO THE GOLGI AND SUBSEQUENT MODIFICATION | Genes involved in Transport to the Golgi and subsequent modification |
| 0.0 | 0.5 | REACTOME GLUTATHIONE CONJUGATION | Genes involved in Glutathione conjugation |
| 0.0 | 0.1 | REACTOME SHC1 EVENTS IN EGFR SIGNALING | Genes involved in SHC1 events in EGFR signaling |
| 0.0 | 0.5 | REACTOME METABOLISM OF STEROID HORMONES AND VITAMINS A AND D | Genes involved in Metabolism of steroid hormones and vitamins A and D |
| 0.0 | 0.2 | REACTOME REGULATION OF PYRUVATE DEHYDROGENASE PDH COMPLEX | Genes involved in Regulation of pyruvate dehydrogenase (PDH) complex |
| 0.0 | 0.1 | REACTOME OPSINS | Genes involved in Opsins |
| 0.0 | 0.4 | REACTOME COLLAGEN FORMATION | Genes involved in Collagen formation |
| 0.0 | 0.3 | REACTOME APC C CDC20 MEDIATED DEGRADATION OF MITOTIC PROTEINS | Genes involved in APC/C:Cdc20 mediated degradation of mitotic proteins |
| 0.0 | 0.3 | REACTOME O LINKED GLYCOSYLATION OF MUCINS | Genes involved in O-linked glycosylation of mucins |
| 0.0 | 0.1 | REACTOME PROSTANOID LIGAND RECEPTORS | Genes involved in Prostanoid ligand receptors |
Gene overrepresentation in molecular_function category:
| Log-likelihood per target | Total log-likelihood | Term | Description |
|---|---|---|---|
| 3.6 | 18.0 | GO:0060230 | lipoprotein lipase activator activity(GO:0060230) |
| 1.7 | 6.8 | GO:0047006 | 17-alpha,20-alpha-dihydroxypregn-4-en-3-one dehydrogenase activity(GO:0047006) |
| 1.2 | 8.6 | GO:0047894 | flavonol 3-sulfotransferase activity(GO:0047894) |
| 0.9 | 3.5 | GO:0047086 | phenanthrene 9,10-monooxygenase activity(GO:0018636) ketosteroid monooxygenase activity(GO:0047086) trans-1,2-dihydrobenzene-1,2-diol dehydrogenase activity(GO:0047115) |
| 0.8 | 3.0 | GO:0019862 | IgA binding(GO:0019862) |
| 0.5 | 1.6 | GO:0004088 | carbamoyl-phosphate synthase (ammonia) activity(GO:0004087) carbamoyl-phosphate synthase (glutamine-hydrolyzing) activity(GO:0004088) |
| 0.5 | 18.1 | GO:0015020 | glucuronosyltransferase activity(GO:0015020) |
| 0.5 | 1.4 | GO:0033300 | dehydroascorbic acid transporter activity(GO:0033300) |
| 0.5 | 1.8 | GO:0035276 | ethanol binding(GO:0035276) |
| 0.4 | 2.7 | GO:0030492 | hemoglobin binding(GO:0030492) |
| 0.4 | 3.0 | GO:0060228 | phosphatidylcholine-sterol O-acyltransferase activator activity(GO:0060228) |
| 0.3 | 5.1 | GO:0015643 | toxic substance binding(GO:0015643) |
| 0.3 | 0.9 | GO:0070283 | lipoate synthase activity(GO:0016992) radical SAM enzyme activity(GO:0070283) |
| 0.3 | 1.1 | GO:0015142 | citrate transmembrane transporter activity(GO:0015137) tricarboxylic acid transmembrane transporter activity(GO:0015142) |
| 0.3 | 1.3 | GO:0070728 | leucine binding(GO:0070728) |
| 0.3 | 0.8 | GO:0030627 | pre-mRNA 5'-splice site binding(GO:0030627) |
| 0.3 | 1.8 | GO:0008109 | N-acetyllactosaminide beta-1,6-N-acetylglucosaminyltransferase activity(GO:0008109) |
| 0.2 | 7.5 | GO:0004181 | metallocarboxypeptidase activity(GO:0004181) |
| 0.2 | 0.7 | GO:0004382 | guanosine-diphosphatase activity(GO:0004382) |
| 0.2 | 1.2 | GO:0015094 | cadmium ion transmembrane transporter activity(GO:0015086) cobalt ion transmembrane transporter activity(GO:0015087) lead ion transmembrane transporter activity(GO:0015094) ferrous iron uptake transmembrane transporter activity(GO:0015639) |
| 0.2 | 0.7 | GO:0033149 | FFAT motif binding(GO:0033149) |
| 0.2 | 1.2 | GO:0035800 | deubiquitinase activator activity(GO:0035800) |
| 0.2 | 1.6 | GO:0019871 | sodium channel inhibitor activity(GO:0019871) |
| 0.2 | 2.2 | GO:0034056 | estrogen response element binding(GO:0034056) |
| 0.2 | 0.7 | GO:0004165 | dodecenoyl-CoA delta-isomerase activity(GO:0004165) |
| 0.2 | 0.8 | GO:0097199 | cysteine-type endopeptidase activity involved in apoptotic signaling pathway(GO:0097199) |
| 0.2 | 1.1 | GO:0015186 | L-glutamine transmembrane transporter activity(GO:0015186) |
| 0.2 | 1.6 | GO:0005114 | type II transforming growth factor beta receptor binding(GO:0005114) |
| 0.2 | 1.9 | GO:0005436 | sodium:phosphate symporter activity(GO:0005436) |
| 0.2 | 2.2 | GO:0005132 | type I interferon receptor binding(GO:0005132) |
| 0.2 | 0.3 | GO:0001228 | transcriptional activator activity, RNA polymerase II transcription regulatory region sequence-specific binding(GO:0001228) |
| 0.2 | 0.8 | GO:0030060 | L-malate dehydrogenase activity(GO:0030060) |
| 0.2 | 0.6 | GO:0016211 | glutamate-ammonia ligase activity(GO:0004356) ammonia ligase activity(GO:0016211) acid-ammonia (or amide) ligase activity(GO:0016880) |
| 0.1 | 15.9 | GO:0004867 | serine-type endopeptidase inhibitor activity(GO:0004867) |
| 0.1 | 0.6 | GO:0004505 | phenylalanine 4-monooxygenase activity(GO:0004505) |
| 0.1 | 0.4 | GO:0003980 | UDP-glucose:glycoprotein glucosyltransferase activity(GO:0003980) |
| 0.1 | 0.4 | GO:0033823 | procollagen-lysine 5-dioxygenase activity(GO:0008475) procollagen glucosyltransferase activity(GO:0033823) |
| 0.1 | 0.4 | GO:0000386 | second spliceosomal transesterification activity(GO:0000386) |
| 0.1 | 0.1 | GO:0099609 | microtubule lateral binding(GO:0099609) |
| 0.1 | 1.1 | GO:0004064 | arylesterase activity(GO:0004064) |
| 0.1 | 1.0 | GO:0008454 | alpha-1,3-mannosylglycoprotein 4-beta-N-acetylglucosaminyltransferase activity(GO:0008454) |
| 0.1 | 1.1 | GO:0034711 | inhibin binding(GO:0034711) |
| 0.1 | 0.3 | GO:0000995 | transcription factor activity, core RNA polymerase III binding(GO:0000995) |
| 0.1 | 0.5 | GO:0004657 | proline dehydrogenase activity(GO:0004657) |
| 0.1 | 0.5 | GO:0051916 | granulocyte colony-stimulating factor binding(GO:0051916) |
| 0.1 | 0.5 | GO:0005220 | inositol 1,4,5-trisphosphate-sensitive calcium-release channel activity(GO:0005220) |
| 0.1 | 0.4 | GO:0004605 | phosphatidate cytidylyltransferase activity(GO:0004605) |
| 0.1 | 0.5 | GO:0015184 | L-cystine transmembrane transporter activity(GO:0015184) |
| 0.1 | 0.5 | GO:0004809 | tRNA (guanine-N2-)-methyltransferase activity(GO:0004809) |
| 0.1 | 1.1 | GO:0004321 | fatty-acyl-CoA synthase activity(GO:0004321) |
| 0.1 | 0.9 | GO:0035312 | 5'-3' exodeoxyribonuclease activity(GO:0035312) |
| 0.1 | 0.5 | GO:0052798 | beta-galactoside alpha-2,3-sialyltransferase activity(GO:0052798) |
| 0.1 | 1.2 | GO:0003964 | telomerase activity(GO:0003720) RNA-directed DNA polymerase activity(GO:0003964) |
| 0.1 | 0.9 | GO:0034235 | GPI anchor binding(GO:0034235) |
| 0.1 | 0.8 | GO:0004111 | creatine kinase activity(GO:0004111) |
| 0.1 | 0.5 | GO:0017159 | pantetheine hydrolase activity(GO:0017159) |
| 0.1 | 0.5 | GO:0004663 | Rab geranylgeranyltransferase activity(GO:0004663) |
| 0.1 | 0.3 | GO:0080130 | L-phenylalanine aminotransferase activity(GO:0070546) L-phenylalanine:2-oxoglutarate aminotransferase activity(GO:0080130) |
| 0.1 | 1.1 | GO:0004571 | mannosyl-oligosaccharide 1,2-alpha-mannosidase activity(GO:0004571) |
| 0.1 | 1.1 | GO:0001758 | retinal dehydrogenase activity(GO:0001758) |
| 0.1 | 1.3 | GO:0016813 | hydrolase activity, acting on carbon-nitrogen (but not peptide) bonds, in linear amidines(GO:0016813) |
| 0.1 | 1.9 | GO:0034185 | apolipoprotein binding(GO:0034185) |
| 0.1 | 0.2 | GO:0030226 | apolipoprotein receptor activity(GO:0030226) apolipoprotein A-I receptor activity(GO:0034188) phosphatidylserine-translocating ATPase activity(GO:0090556) |
| 0.1 | 1.6 | GO:0042800 | histone methyltransferase activity (H3-K4 specific)(GO:0042800) |
| 0.1 | 0.3 | GO:0017129 | triglyceride binding(GO:0017129) |
| 0.1 | 0.3 | GO:0005137 | interleukin-5 receptor binding(GO:0005137) |
| 0.1 | 0.9 | GO:0019237 | centromeric DNA binding(GO:0019237) |
| 0.1 | 0.3 | GO:0000992 | polymerase III regulatory region sequence-specific DNA binding(GO:0000992) RNA polymerase III type 1 promoter sequence-specific DNA binding(GO:0001002) RNA polymerase III type 2 promoter sequence-specific DNA binding(GO:0001003) RNA polymerase III transcription factor activity, sequence-specific DNA binding(GO:0001034) |
| 0.1 | 1.2 | GO:0031957 | very long-chain fatty acid-CoA ligase activity(GO:0031957) |
| 0.1 | 0.5 | GO:0004167 | dopachrome isomerase activity(GO:0004167) |
| 0.1 | 0.3 | GO:0016838 | carbon-oxygen lyase activity, acting on phosphates(GO:0016838) |
| 0.1 | 0.8 | GO:0015143 | urate transmembrane transporter activity(GO:0015143) salt transmembrane transporter activity(GO:1901702) |
| 0.1 | 0.4 | GO:0004301 | epoxide hydrolase activity(GO:0004301) |
| 0.1 | 0.5 | GO:0035402 | histone kinase activity (H3-T11 specific)(GO:0035402) |
| 0.1 | 0.2 | GO:0018685 | alkane 1-monooxygenase activity(GO:0018685) tocopherol omega-hydroxylase activity(GO:0052870) alpha-tocopherol omega-hydroxylase activity(GO:0052871) 20-hydroxy-leukotriene B4 omega oxidase activity(GO:0097258) 20-aldehyde-leukotriene B4 20-monooxygenase activity(GO:0097259) |
| 0.1 | 0.2 | GO:0004958 | prostaglandin F receptor activity(GO:0004958) |
| 0.1 | 0.2 | GO:0005148 | prolactin receptor binding(GO:0005148) |
| 0.1 | 0.4 | GO:0034046 | poly(G) binding(GO:0034046) |
| 0.1 | 0.5 | GO:0030369 | ICAM-3 receptor activity(GO:0030369) |
| 0.1 | 0.4 | GO:0004995 | tachykinin receptor activity(GO:0004995) |
| 0.1 | 0.3 | GO:0019770 | IgG receptor activity(GO:0019770) |
| 0.1 | 0.2 | GO:0016418 | S-acetyltransferase activity(GO:0016418) |
| 0.1 | 0.2 | GO:0032093 | SAM domain binding(GO:0032093) |
| 0.1 | 0.3 | GO:0035473 | lipase binding(GO:0035473) |
| 0.1 | 0.7 | GO:0055056 | D-glucose transmembrane transporter activity(GO:0055056) |
| 0.1 | 0.9 | GO:0004089 | carbonate dehydratase activity(GO:0004089) |
| 0.1 | 0.5 | GO:0032554 | purine deoxyribonucleotide binding(GO:0032554) |
| 0.1 | 0.7 | GO:0039706 | co-receptor binding(GO:0039706) |
| 0.1 | 0.3 | GO:0004468 | lysine N-acetyltransferase activity, acting on acetyl phosphate as donor(GO:0004468) |
| 0.1 | 0.2 | GO:0004822 | isoleucine-tRNA ligase activity(GO:0004822) |
| 0.1 | 0.3 | GO:0051998 | carboxyl-O-methyltransferase activity(GO:0010340) protein carboxyl O-methyltransferase activity(GO:0051998) |
| 0.1 | 0.6 | GO:0004300 | enoyl-CoA hydratase activity(GO:0004300) |
| 0.1 | 0.2 | GO:0031435 | mitogen-activated protein kinase kinase kinase binding(GO:0031435) |
| 0.1 | 0.2 | GO:0035663 | Toll-like receptor 2 binding(GO:0035663) |
| 0.1 | 0.3 | GO:0061649 | ubiquitinated histone binding(GO:0061649) |
| 0.1 | 1.8 | GO:0017075 | syntaxin-1 binding(GO:0017075) |
| 0.1 | 0.2 | GO:0005549 | odorant binding(GO:0005549) |
| 0.1 | 0.2 | GO:0042020 | interleukin-23 binding(GO:0042019) interleukin-23 receptor activity(GO:0042020) |
| 0.1 | 0.3 | GO:0004013 | adenosylhomocysteinase activity(GO:0004013) trialkylsulfonium hydrolase activity(GO:0016802) |
| 0.1 | 1.6 | GO:0004602 | glutathione peroxidase activity(GO:0004602) |
| 0.1 | 0.2 | GO:0016936 | galactoside binding(GO:0016936) |
| 0.1 | 0.4 | GO:0030368 | interleukin-17 receptor activity(GO:0030368) |
| 0.1 | 0.3 | GO:0052844 | endopolyphosphatase activity(GO:0000298) diphosphoinositol-polyphosphate diphosphatase activity(GO:0008486) bis(5'-adenosyl)-hexaphosphatase activity(GO:0034431) bis(5'-adenosyl)-pentaphosphatase activity(GO:0034432) inositol diphosphate tetrakisphosphate diphosphatase activity(GO:0052840) inositol bisdiphosphate tetrakisphosphate diphosphatase activity(GO:0052841) inositol diphosphate pentakisphosphate diphosphatase activity(GO:0052842) inositol-1-diphosphate-2,3,4,5,6-pentakisphosphate diphosphatase activity(GO:0052843) inositol-3-diphosphate-1,2,4,5,6-pentakisphosphate diphosphatase activity(GO:0052844) inositol-5-diphosphate-1,2,3,4,6-pentakisphosphate diphosphatase activity(GO:0052845) inositol-1,5-bisdiphosphate-2,3,4,6-tetrakisphosphate 1-diphosphatase activity(GO:0052846) inositol-1,5-bisdiphosphate-2,3,4,6-tetrakisphosphate 5-diphosphatase activity(GO:0052847) inositol-3,5-bisdiphosphate-2,3,4,6-tetrakisphosphate 5-diphosphatase activity(GO:0052848) |
| 0.1 | 0.7 | GO:0004726 | non-membrane spanning protein tyrosine phosphatase activity(GO:0004726) |
| 0.1 | 0.5 | GO:0004969 | histamine receptor activity(GO:0004969) |
| 0.1 | 0.2 | GO:0005502 | 11-cis retinal binding(GO:0005502) |
| 0.1 | 0.2 | GO:0004461 | lactose synthase activity(GO:0004461) |
| 0.1 | 0.3 | GO:0045029 | UDP-activated nucleotide receptor activity(GO:0045029) |
| 0.1 | 0.3 | GO:0050291 | sphingosine N-acyltransferase activity(GO:0050291) |
| 0.0 | 0.1 | GO:0042134 | rRNA primary transcript binding(GO:0042134) |
| 0.0 | 0.1 | GO:0004694 | eukaryotic translation initiation factor 2alpha kinase activity(GO:0004694) |
| 0.0 | 0.1 | GO:0032089 | NACHT domain binding(GO:0032089) |
| 0.0 | 0.1 | GO:0061663 | NEDD8 ligase activity(GO:0061663) |
| 0.0 | 0.6 | GO:0019957 | C-C chemokine binding(GO:0019957) |
| 0.0 | 0.9 | GO:0016805 | dipeptidase activity(GO:0016805) |
| 0.0 | 0.4 | GO:0004563 | beta-N-acetylhexosaminidase activity(GO:0004563) |
| 0.0 | 0.1 | GO:0000822 | inositol hexakisphosphate binding(GO:0000822) |
| 0.0 | 0.4 | GO:0035174 | histone serine kinase activity(GO:0035174) |
| 0.0 | 1.2 | GO:0016646 | oxidoreductase activity, acting on the CH-NH group of donors, NAD or NADP as acceptor(GO:0016646) |
| 0.0 | 0.6 | GO:0016018 | cyclosporin A binding(GO:0016018) |
| 0.0 | 0.5 | GO:0016421 | CoA carboxylase activity(GO:0016421) |
| 0.0 | 0.2 | GO:0004815 | aspartate-tRNA ligase activity(GO:0004815) |
| 0.0 | 0.5 | GO:0031013 | troponin I binding(GO:0031013) |
| 0.0 | 0.4 | GO:0015232 | heme transporter activity(GO:0015232) |
| 0.0 | 0.2 | GO:0033857 | diphosphoinositol-pentakisphosphate kinase activity(GO:0033857) |
| 0.0 | 0.2 | GO:0008046 | axon guidance receptor activity(GO:0008046) |
| 0.0 | 0.4 | GO:0001162 | RNA polymerase II intronic transcription regulatory region sequence-specific DNA binding(GO:0001162) |
| 0.0 | 0.1 | GO:0015616 | DNA translocase activity(GO:0015616) |
| 0.0 | 0.2 | GO:0051787 | misfolded protein binding(GO:0051787) |
| 0.0 | 0.9 | GO:0005095 | GTPase inhibitor activity(GO:0005095) |
| 0.0 | 0.1 | GO:0004802 | transketolase activity(GO:0004802) |
| 0.0 | 1.1 | GO:0004708 | MAP kinase kinase activity(GO:0004708) |
| 0.0 | 0.1 | GO:0031711 | angiotensin type I receptor activity(GO:0001596) bradykinin receptor binding(GO:0031711) |
| 0.0 | 1.1 | GO:0043027 | cysteine-type endopeptidase inhibitor activity involved in apoptotic process(GO:0043027) |
| 0.0 | 0.3 | GO:0097322 | 7SK snRNA binding(GO:0097322) |
| 0.0 | 0.8 | GO:0004012 | phospholipid-translocating ATPase activity(GO:0004012) |
| 0.0 | 0.2 | GO:0016300 | tRNA (uracil) methyltransferase activity(GO:0016300) |
| 0.0 | 0.2 | GO:0005157 | macrophage colony-stimulating factor receptor binding(GO:0005157) |
| 0.0 | 0.1 | GO:0004170 | dUTP diphosphatase activity(GO:0004170) |
| 0.0 | 0.1 | GO:0071987 | WD40-repeat domain binding(GO:0071987) |
| 0.0 | 0.6 | GO:0005391 | sodium:potassium-exchanging ATPase activity(GO:0005391) |
| 0.0 | 0.4 | GO:0004579 | dolichyl-diphosphooligosaccharide-protein glycotransferase activity(GO:0004579) |
| 0.0 | 0.4 | GO:0008097 | 5S rRNA binding(GO:0008097) |
| 0.0 | 0.1 | GO:0003858 | 3-hydroxybutyrate dehydrogenase activity(GO:0003858) |
| 0.0 | 0.7 | GO:0005112 | Notch binding(GO:0005112) |
| 0.0 | 1.3 | GO:0043539 | protein serine/threonine kinase activator activity(GO:0043539) |
| 0.0 | 0.5 | GO:0032395 | MHC class II receptor activity(GO:0032395) |
| 0.0 | 0.3 | GO:0005005 | transmembrane-ephrin receptor activity(GO:0005005) |
| 0.0 | 0.1 | GO:0042030 | ATPase inhibitor activity(GO:0042030) |
| 0.0 | 0.2 | GO:0070840 | dynein complex binding(GO:0070840) |
| 0.0 | 0.0 | GO:0016615 | malate dehydrogenase activity(GO:0016615) |
| 0.0 | 0.2 | GO:0050816 | phosphothreonine binding(GO:0050816) |
| 0.0 | 0.4 | GO:0031419 | cobalamin binding(GO:0031419) |
| 0.0 | 0.2 | GO:0097157 | pre-mRNA intronic binding(GO:0097157) |
| 0.0 | 0.3 | GO:0003696 | satellite DNA binding(GO:0003696) |
| 0.0 | 0.1 | GO:0015562 | efflux transmembrane transporter activity(GO:0015562) |
| 0.0 | 0.2 | GO:0015187 | glycine transmembrane transporter activity(GO:0015187) |
| 0.0 | 0.4 | GO:0008432 | JUN kinase binding(GO:0008432) |
| 0.0 | 0.2 | GO:0023024 | MHC class I protein complex binding(GO:0023024) |
| 0.0 | 0.1 | GO:0000026 | alpha-1,2-mannosyltransferase activity(GO:0000026) |
| 0.0 | 0.7 | GO:0030676 | Rac guanyl-nucleotide exchange factor activity(GO:0030676) |
| 0.0 | 0.4 | GO:0004065 | arylsulfatase activity(GO:0004065) |
| 0.0 | 0.0 | GO:0001007 | transcription factor activity, RNA polymerase III transcription factor binding(GO:0001007) |
| 0.0 | 0.3 | GO:1904264 | ubiquitin protein ligase activity involved in ERAD pathway(GO:1904264) |
| 0.0 | 0.2 | GO:0047144 | 2-acylglycerol-3-phosphate O-acyltransferase activity(GO:0047144) |
| 0.0 | 1.0 | GO:0017091 | AU-rich element binding(GO:0017091) |
| 0.0 | 0.5 | GO:0008603 | cAMP-dependent protein kinase inhibitor activity(GO:0004862) cAMP-dependent protein kinase regulator activity(GO:0008603) |
| 0.0 | 0.1 | GO:0004980 | melanocyte-stimulating hormone receptor activity(GO:0004980) |
| 0.0 | 0.5 | GO:0032454 | histone demethylase activity (H3-K9 specific)(GO:0032454) |
| 0.0 | 0.2 | GO:0030620 | U2 snRNA binding(GO:0030620) |
| 0.0 | 0.4 | GO:0036374 | glutathione hydrolase activity(GO:0036374) |
| 0.0 | 0.3 | GO:0004332 | fructose-bisphosphate aldolase activity(GO:0004332) |
| 0.0 | 0.1 | GO:0019961 | interferon binding(GO:0019961) |
| 0.0 | 0.1 | GO:0032453 | histone demethylase activity (H3-K4 specific)(GO:0032453) |
| 0.0 | 1.4 | GO:0001784 | phosphotyrosine binding(GO:0001784) |
| 0.0 | 0.3 | GO:0097371 | MDM2/MDM4 family protein binding(GO:0097371) |
| 0.0 | 0.2 | GO:0031730 | CCR5 chemokine receptor binding(GO:0031730) |
| 0.0 | 0.3 | GO:0043225 | anion transmembrane-transporting ATPase activity(GO:0043225) |
| 0.0 | 2.5 | GO:0051087 | chaperone binding(GO:0051087) |
| 0.0 | 0.2 | GO:0008142 | oxysterol binding(GO:0008142) |
| 0.0 | 0.1 | GO:0004522 | ribonuclease A activity(GO:0004522) |
| 0.0 | 0.1 | GO:0031685 | adenosine receptor binding(GO:0031685) |
| 0.0 | 0.3 | GO:0005344 | oxygen transporter activity(GO:0005344) |
| 0.0 | 0.6 | GO:0042162 | telomeric DNA binding(GO:0042162) |
| 0.0 | 0.3 | GO:0031005 | filamin binding(GO:0031005) |
| 0.0 | 0.4 | GO:0051400 | BH domain binding(GO:0051400) |
| 0.0 | 0.1 | GO:0005499 | vitamin D binding(GO:0005499) |
| 0.0 | 0.2 | GO:0005068 | transmembrane receptor protein tyrosine kinase adaptor activity(GO:0005068) |
| 0.0 | 0.2 | GO:0048273 | mitogen-activated protein kinase p38 binding(GO:0048273) |
| 0.0 | 0.0 | GO:0016297 | oleoyl-[acyl-carrier-protein] hydrolase activity(GO:0004320) myristoyl-[acyl-carrier-protein] hydrolase activity(GO:0016295) palmitoyl-[acyl-carrier-protein] hydrolase activity(GO:0016296) acyl-[acyl-carrier-protein] hydrolase activity(GO:0016297) |
| 0.0 | 0.4 | GO:0001054 | RNA polymerase I activity(GO:0001054) |
| 0.0 | 0.2 | GO:0030020 | extracellular matrix structural constituent conferring tensile strength(GO:0030020) |
| 0.0 | 0.2 | GO:0015379 | potassium:chloride symporter activity(GO:0015379) potassium ion symporter activity(GO:0022820) |
| 0.0 | 0.3 | GO:0043024 | ribosomal small subunit binding(GO:0043024) |
| 0.0 | 0.8 | GO:0070577 | lysine-acetylated histone binding(GO:0070577) |
| 0.0 | 0.1 | GO:0051033 | nucleic acid transmembrane transporter activity(GO:0051032) RNA transmembrane transporter activity(GO:0051033) |
| 0.0 | 0.1 | GO:0009378 | four-way junction helicase activity(GO:0009378) |
| 0.0 | 1.1 | GO:0004114 | 3',5'-cyclic-nucleotide phosphodiesterase activity(GO:0004114) |
| 0.0 | 0.2 | GO:0017127 | cholesterol transporter activity(GO:0017127) |
| 0.0 | 0.4 | GO:0016411 | acylglycerol O-acyltransferase activity(GO:0016411) |
| 0.0 | 0.1 | GO:0047275 | glucosaminylgalactosylglucosylceramide beta-galactosyltransferase activity(GO:0047275) |
| 0.0 | 0.1 | GO:0016019 | peptidoglycan receptor activity(GO:0016019) |
| 0.0 | 0.2 | GO:0032051 | clathrin light chain binding(GO:0032051) |
| 0.0 | 0.1 | GO:1904455 | ubiquitin-specific protease activity involved in negative regulation of ERAD pathway(GO:1904455) |
| 0.0 | 0.1 | GO:0047499 | calcium-independent phospholipase A2 activity(GO:0047499) |
| 0.0 | 1.2 | GO:0008081 | phosphoric diester hydrolase activity(GO:0008081) |
| 0.0 | 0.3 | GO:0070530 | K63-linked polyubiquitin binding(GO:0070530) |
| 0.0 | 0.3 | GO:0005243 | gap junction channel activity(GO:0005243) |
| 0.0 | 0.1 | GO:0003938 | IMP dehydrogenase activity(GO:0003938) |
| 0.0 | 0.2 | GO:0043047 | single-stranded telomeric DNA binding(GO:0043047) |
| 0.0 | 0.3 | GO:0000981 | RNA polymerase II transcription factor activity, sequence-specific DNA binding(GO:0000981) |
| 0.0 | 0.1 | GO:0032217 | riboflavin transporter activity(GO:0032217) |
| 0.0 | 0.1 | GO:0016176 | superoxide-generating NADPH oxidase activator activity(GO:0016176) |
| 0.0 | 0.2 | GO:0001085 | RNA polymerase II transcription factor binding(GO:0001085) |
| 0.0 | 0.3 | GO:0005248 | voltage-gated sodium channel activity(GO:0005248) voltage-gated ion channel activity involved in regulation of postsynaptic membrane potential(GO:1905030) |
| 0.0 | 0.1 | GO:0016635 | oxidoreductase activity, acting on the CH-CH group of donors, quinone or related compound as acceptor(GO:0016635) |
| 0.0 | 0.2 | GO:0031432 | titin binding(GO:0031432) |
| 0.0 | 0.5 | GO:0070064 | proline-rich region binding(GO:0070064) |
| 0.0 | 0.0 | GO:0048408 | epidermal growth factor binding(GO:0048408) |
| 0.0 | 0.3 | GO:0046933 | proton-transporting ATP synthase activity, rotational mechanism(GO:0046933) |
| 0.0 | 0.6 | GO:0000049 | tRNA binding(GO:0000049) |
| 0.0 | 0.4 | GO:0004033 | aldo-keto reductase (NADP) activity(GO:0004033) |
| 0.0 | 0.7 | GO:0051539 | 4 iron, 4 sulfur cluster binding(GO:0051539) |
| 0.0 | 3.0 | GO:0003823 | antigen binding(GO:0003823) |
| 0.0 | 3.2 | GO:0061630 | ubiquitin protein ligase activity(GO:0061630) |
| 0.0 | 0.3 | GO:0045504 | dynein heavy chain binding(GO:0045504) |
| 0.0 | 0.4 | GO:0004298 | threonine-type endopeptidase activity(GO:0004298) threonine-type peptidase activity(GO:0070003) |
| 0.0 | 0.4 | GO:0004003 | ATP-dependent DNA helicase activity(GO:0004003) |
| 0.0 | 0.2 | GO:0015101 | organic cation transmembrane transporter activity(GO:0015101) |
| 0.0 | 0.2 | GO:0031434 | mitogen-activated protein kinase kinase binding(GO:0031434) |
| 0.0 | 0.3 | GO:0051428 | peptide hormone receptor binding(GO:0051428) |
| 0.0 | 0.1 | GO:0035173 | histone kinase activity(GO:0035173) |
| 0.0 | 0.0 | GO:0004886 | 9-cis retinoic acid receptor activity(GO:0004886) |
| 0.0 | 0.1 | GO:0001161 | intronic transcription regulatory region sequence-specific DNA binding(GO:0001161) intronic transcription regulatory region DNA binding(GO:0044213) |
| 0.0 | 0.0 | GO:0016499 | orexin receptor activity(GO:0016499) |
| 0.0 | 0.1 | GO:0008020 | G-protein coupled photoreceptor activity(GO:0008020) |
| 0.0 | 0.1 | GO:0043533 | inositol 1,3,4,5 tetrakisphosphate binding(GO:0043533) |
| 0.0 | 0.1 | GO:0017162 | aryl hydrocarbon receptor binding(GO:0017162) |
| 0.0 | 0.2 | GO:0003906 | DNA-(apurinic or apyrimidinic site) lyase activity(GO:0003906) |
| 0.0 | 0.5 | GO:0016831 | carboxy-lyase activity(GO:0016831) |
| 0.0 | 0.1 | GO:0004977 | melanocortin receptor activity(GO:0004977) |
| 0.0 | 0.1 | GO:0001206 | transcriptional repressor activity, RNA polymerase II distal enhancer sequence-specific binding(GO:0001206) |
| 0.0 | 0.1 | GO:0005049 | nuclear export signal receptor activity(GO:0005049) |
| 0.0 | 0.1 | GO:0022851 | GABA-gated chloride ion channel activity(GO:0022851) |
| 0.0 | 0.1 | GO:0000155 | phosphorelay sensor kinase activity(GO:0000155) protein histidine kinase activity(GO:0004673) |
| 0.0 | 0.3 | GO:0045502 | dynein binding(GO:0045502) |
| 0.0 | 0.2 | GO:0008140 | cAMP response element binding protein binding(GO:0008140) |
| 0.0 | 0.9 | GO:0004722 | protein serine/threonine phosphatase activity(GO:0004722) |
| 0.0 | 0.1 | GO:0009931 | calcium-dependent protein serine/threonine kinase activity(GO:0009931) |
| 0.0 | 0.0 | GO:0070644 | vitamin D response element binding(GO:0070644) |
Gene overrepresentation in biological_process category:
| Log-likelihood per target | Total log-likelihood | Term | Description |
|---|---|---|---|
| 1.7 | 5.1 | GO:0052331 | hemolysis by symbiont of host erythrocytes(GO:0019836) hemolysis in other organism(GO:0044179) hemolysis in other organism involved in symbiotic interaction(GO:0052331) |
| 1.6 | 17.9 | GO:0051918 | negative regulation of fibrinolysis(GO:0051918) |
| 1.3 | 4.0 | GO:0010902 | positive regulation of very-low-density lipoprotein particle remodeling(GO:0010902) |
| 1.3 | 8.9 | GO:0071395 | response to jasmonic acid(GO:0009753) cellular response to jasmonic acid stimulus(GO:0071395) |
| 0.9 | 2.7 | GO:2000296 | negative regulation of hydrogen peroxide catabolic process(GO:2000296) |
| 0.6 | 1.9 | GO:0006711 | estrogen catabolic process(GO:0006711) |
| 0.6 | 1.8 | GO:0010430 | fatty acid omega-oxidation(GO:0010430) |
| 0.5 | 1.6 | GO:0007181 | transforming growth factor beta receptor complex assembly(GO:0007181) |
| 0.5 | 2.5 | GO:0030070 | insulin processing(GO:0030070) |
| 0.5 | 3.4 | GO:0008218 | bioluminescence(GO:0008218) |
| 0.5 | 1.9 | GO:0010900 | negative regulation of phosphatidylcholine catabolic process(GO:0010900) |
| 0.5 | 1.4 | GO:0070837 | dehydroascorbic acid transport(GO:0070837) |
| 0.5 | 4.7 | GO:0043152 | induction of bacterial agglutination(GO:0043152) |
| 0.4 | 1.3 | GO:1902995 | regulation of phospholipid efflux(GO:1902994) positive regulation of phospholipid efflux(GO:1902995) |
| 0.4 | 1.2 | GO:1904479 | cellular response to bile acid(GO:1903413) negative regulation of intestinal absorption(GO:1904479) response to iron ion starvation(GO:1990641) |
| 0.4 | 1.2 | GO:0072709 | cellular response to sorbitol(GO:0072709) |
| 0.4 | 8.1 | GO:0006068 | ethanol catabolic process(GO:0006068) |
| 0.4 | 8.1 | GO:0052695 | cellular glucuronidation(GO:0052695) |
| 0.3 | 3.0 | GO:0046149 | porphyrin-containing compound catabolic process(GO:0006787) tetrapyrrole catabolic process(GO:0033015) heme catabolic process(GO:0042167) pigment catabolic process(GO:0046149) |
| 0.3 | 0.9 | GO:2001190 | positive regulation of T cell activation via T cell receptor contact with antigen bound to MHC molecule on antigen presenting cell(GO:2001190) |
| 0.3 | 1.6 | GO:2001288 | positive regulation of caveolin-mediated endocytosis(GO:2001288) |
| 0.3 | 0.9 | GO:1903925 | signal transduction involved in intra-S DNA damage checkpoint(GO:0072428) response to bisphenol A(GO:1903925) cellular response to bisphenol A(GO:1903926) |
| 0.3 | 0.9 | GO:0009107 | lipoate biosynthetic process(GO:0009107) |
| 0.3 | 1.2 | GO:0097089 | methyl-branched fatty acid metabolic process(GO:0097089) |
| 0.3 | 1.1 | GO:0010585 | glutamine secretion(GO:0010585) L-glutamine import(GO:0036229) L-glutamine import into cell(GO:1903803) |
| 0.3 | 1.1 | GO:0019470 | 4-hydroxyproline catabolic process(GO:0019470) |
| 0.3 | 1.1 | GO:0010730 | negative regulation of hydrogen peroxide biosynthetic process(GO:0010730) |
| 0.3 | 1.6 | GO:0034201 | response to oleic acid(GO:0034201) |
| 0.3 | 1.1 | GO:0015746 | tricarboxylic acid transport(GO:0006842) citrate transport(GO:0015746) |
| 0.3 | 1.3 | GO:1902109 | negative regulation of mitochondrial membrane permeability involved in apoptotic process(GO:1902109) |
| 0.3 | 0.8 | GO:0006566 | threonine metabolic process(GO:0006566) |
| 0.2 | 1.2 | GO:0015692 | lead ion transport(GO:0015692) |
| 0.2 | 0.7 | GO:0003277 | apoptotic process involved in endocardial cushion morphogenesis(GO:0003277) intermediate mesoderm development(GO:0048389) intermediate mesoderm morphogenesis(GO:0048390) intermediate mesoderm formation(GO:0048391) intermediate mesodermal cell differentiation(GO:0048392) regulation of cardiac muscle fiber development(GO:0055018) positive regulation of cardiac muscle fiber development(GO:0055020) bud dilation involved in lung branching(GO:0060503) regulation of transcription from RNA polymerase II promoter involved in kidney development(GO:0060994) BMP signaling pathway involved in ureter morphogenesis(GO:0061149) renal system segmentation(GO:0061150) BMP signaling pathway involved in renal system segmentation(GO:0061151) pulmonary artery endothelial tube morphogenesis(GO:0061155) regulation of transcription from RNA polymerase II promoter involved in mesonephros development(GO:0061216) pattern specification involved in mesonephros development(GO:0061227) BMP signaling pathway involved in nephric duct formation(GO:0071893) negative regulation of branch elongation involved in ureteric bud branching(GO:0072096) negative regulation of branch elongation involved in ureteric bud branching by BMP signaling pathway(GO:0072097) anterior/posterior pattern specification involved in kidney development(GO:0072098) anterior/posterior pattern specification involved in ureteric bud development(GO:0072099) specification of ureteric bud anterior/posterior symmetry(GO:0072100) specification of ureteric bud anterior/posterior symmetry by BMP signaling pathway(GO:0072101) ureter epithelial cell differentiation(GO:0072192) negative regulation of mesenchymal cell proliferation involved in ureter development(GO:0072200) positive regulation of cell proliferation involved in outflow tract morphogenesis(GO:1901964) cardiac jelly development(GO:1905072) regulation of metanephric S-shaped body morphogenesis(GO:2000004) negative regulation of metanephric S-shaped body morphogenesis(GO:2000005) regulation of metanephric comma-shaped body morphogenesis(GO:2000006) negative regulation of metanephric comma-shaped body morphogenesis(GO:2000007) |
| 0.2 | 1.2 | GO:0071279 | cellular response to cobalt ion(GO:0071279) |
| 0.2 | 2.1 | GO:0034382 | chylomicron remnant clearance(GO:0034382) triglyceride-rich lipoprotein particle clearance(GO:0071830) |
| 0.2 | 0.9 | GO:0060054 | positive regulation of epithelial cell proliferation involved in wound healing(GO:0060054) |
| 0.2 | 0.4 | GO:0018879 | biphenyl metabolic process(GO:0018879) |
| 0.2 | 0.4 | GO:0000920 | cell separation after cytokinesis(GO:0000920) |
| 0.2 | 1.2 | GO:2000158 | positive regulation of ubiquitin-specific protease activity(GO:2000158) |
| 0.2 | 2.8 | GO:0001542 | ovulation from ovarian follicle(GO:0001542) |
| 0.2 | 1.1 | GO:0071233 | cellular response to leucine(GO:0071233) |
| 0.2 | 0.6 | GO:0010133 | proline catabolic process to glutamate(GO:0010133) |
| 0.2 | 0.5 | GO:0044878 | mitotic cytokinesis checkpoint(GO:0044878) |
| 0.2 | 1.2 | GO:0036438 | maintenance of lens transparency(GO:0036438) |
| 0.2 | 0.5 | GO:0052314 | phytoalexin metabolic process(GO:0052314) |
| 0.2 | 0.5 | GO:0007500 | mesodermal cell fate determination(GO:0007500) |
| 0.2 | 0.5 | GO:0019626 | short-chain fatty acid catabolic process(GO:0019626) |
| 0.2 | 0.5 | GO:0007290 | spermatid nucleus elongation(GO:0007290) |
| 0.2 | 0.6 | GO:0006542 | glutamine biosynthetic process(GO:0006542) |
| 0.1 | 1.3 | GO:0000050 | urea cycle(GO:0000050) |
| 0.1 | 0.6 | GO:0065001 | specification of axis polarity(GO:0065001) |
| 0.1 | 0.4 | GO:1990637 | response to prolactin(GO:1990637) |
| 0.1 | 0.4 | GO:0097359 | UDP-glucosylation(GO:0097359) |
| 0.1 | 1.2 | GO:0098532 | histone H3-K27 trimethylation(GO:0098532) |
| 0.1 | 0.6 | GO:0044861 | protein transport into plasma membrane raft(GO:0044861) positive regulation of potassium ion import(GO:1903288) |
| 0.1 | 0.4 | GO:0046946 | hydroxylysine metabolic process(GO:0046946) hydroxylysine biosynthetic process(GO:0046947) |
| 0.1 | 1.3 | GO:0051026 | chiasma assembly(GO:0051026) |
| 0.1 | 1.8 | GO:0070863 | positive regulation of protein exit from endoplasmic reticulum(GO:0070863) |
| 0.1 | 0.3 | GO:0002503 | peptide antigen assembly with MHC class II protein complex(GO:0002503) |
| 0.1 | 4.2 | GO:0008210 | estrogen metabolic process(GO:0008210) |
| 0.1 | 8.4 | GO:0030212 | hyaluronan metabolic process(GO:0030212) |
| 0.1 | 0.7 | GO:0050955 | thermoception(GO:0050955) |
| 0.1 | 0.1 | GO:0086092 | regulation of the force of heart contraction by cardiac conduction(GO:0086092) |
| 0.1 | 0.8 | GO:1904381 | Golgi apparatus mannose trimming(GO:1904381) |
| 0.1 | 1.7 | GO:0001787 | natural killer cell proliferation(GO:0001787) |
| 0.1 | 0.5 | GO:0006570 | tyrosine metabolic process(GO:0006570) |
| 0.1 | 0.8 | GO:0055059 | asymmetric neuroblast division(GO:0055059) |
| 0.1 | 0.4 | GO:0000965 | mitochondrial RNA 3'-end processing(GO:0000965) rRNA import into mitochondrion(GO:0035928) |
| 0.1 | 1.1 | GO:0038028 | insulin receptor signaling pathway via phosphatidylinositol 3-kinase(GO:0038028) |
| 0.1 | 0.1 | GO:0033227 | dsRNA transport(GO:0033227) |
| 0.1 | 0.4 | GO:0014057 | positive regulation of acetylcholine secretion, neurotransmission(GO:0014057) |
| 0.1 | 1.1 | GO:1903027 | regulation of opsonization(GO:1903027) |
| 0.1 | 1.7 | GO:0046415 | urate metabolic process(GO:0046415) |
| 0.1 | 0.3 | GO:0051083 | 'de novo' cotranslational protein folding(GO:0051083) |
| 0.1 | 0.6 | GO:0060125 | negative regulation of growth hormone secretion(GO:0060125) |
| 0.1 | 0.3 | GO:0031860 | telomeric 3' overhang formation(GO:0031860) |
| 0.1 | 0.2 | GO:0002581 | negative regulation of antigen processing and presentation of peptide or polysaccharide antigen via MHC class II(GO:0002581) |
| 0.1 | 0.3 | GO:0060474 | positive regulation of sperm motility involved in capacitation(GO:0060474) |
| 0.1 | 2.2 | GO:0033141 | positive regulation of peptidyl-serine phosphorylation of STAT protein(GO:0033141) |
| 0.1 | 0.2 | GO:0010760 | negative regulation of macrophage chemotaxis(GO:0010760) |
| 0.1 | 0.3 | GO:0090290 | positive regulation of osteoclast proliferation(GO:0090290) negative regulation of bone mineralization involved in bone maturation(GO:1900158) |
| 0.1 | 1.6 | GO:1902222 | L-phenylalanine metabolic process(GO:0006558) L-phenylalanine catabolic process(GO:0006559) erythrose 4-phosphate/phosphoenolpyruvate family amino acid metabolic process(GO:1902221) erythrose 4-phosphate/phosphoenolpyruvate family amino acid catabolic process(GO:1902222) |
| 0.1 | 0.5 | GO:0033031 | positive regulation of neutrophil apoptotic process(GO:0033031) |
| 0.1 | 0.8 | GO:0051388 | positive regulation of neurotrophin TRK receptor signaling pathway(GO:0051388) |
| 0.1 | 0.1 | GO:0005989 | lactose metabolic process(GO:0005988) lactose biosynthetic process(GO:0005989) |
| 0.1 | 0.3 | GO:1904798 | positive regulation of core promoter binding(GO:1904798) |
| 0.1 | 1.1 | GO:0042904 | 9-cis-retinoic acid biosynthetic process(GO:0042904) 9-cis-retinoic acid metabolic process(GO:0042905) |
| 0.1 | 0.3 | GO:0010956 | negative regulation of calcidiol 1-monooxygenase activity(GO:0010956) positive regulation of interleukin-6-mediated signaling pathway(GO:0070105) |
| 0.1 | 0.3 | GO:2000523 | dendritic cell dendrite assembly(GO:0097026) regulation of T cell costimulation(GO:2000523) positive regulation of T cell costimulation(GO:2000525) regulation of dendritic cell dendrite assembly(GO:2000547) |
| 0.1 | 0.8 | GO:0030183 | B cell differentiation(GO:0030183) |
| 0.1 | 1.0 | GO:0030951 | establishment or maintenance of microtubule cytoskeleton polarity(GO:0030951) |
| 0.1 | 0.5 | GO:0035093 | spermatogenesis, exchange of chromosomal proteins(GO:0035093) |
| 0.1 | 0.3 | GO:0045643 | regulation of eosinophil differentiation(GO:0045643) positive regulation of eosinophil differentiation(GO:0045645) |
| 0.1 | 0.4 | GO:0042796 | snRNA transcription from RNA polymerase III promoter(GO:0042796) |
| 0.1 | 0.3 | GO:0035359 | negative regulation of peroxisome proliferator activated receptor signaling pathway(GO:0035359) |
| 0.1 | 0.8 | GO:0000395 | mRNA 5'-splice site recognition(GO:0000395) |
| 0.1 | 0.3 | GO:2000393 | negative regulation of lamellipodium morphogenesis(GO:2000393) |
| 0.1 | 0.4 | GO:0070131 | positive regulation of mitochondrial translation(GO:0070131) |
| 0.1 | 1.0 | GO:0031848 | protection from non-homologous end joining at telomere(GO:0031848) |
| 0.1 | 0.3 | GO:0044339 | canonical Wnt signaling pathway involved in osteoblast differentiation(GO:0044339) |
| 0.1 | 0.3 | GO:0002439 | chronic inflammatory response to antigenic stimulus(GO:0002439) |
| 0.1 | 0.2 | GO:0021827 | cerebral cortex tangential migration using cell-cell interactions(GO:0021823) postnatal olfactory bulb interneuron migration(GO:0021827) chemorepulsion involved in postnatal olfactory bulb interneuron migration(GO:0021836) regulation of negative chemotaxis(GO:0050923) |
| 0.1 | 0.5 | GO:0015811 | L-cystine transport(GO:0015811) |
| 0.1 | 0.5 | GO:0035407 | histone H3-T11 phosphorylation(GO:0035407) |
| 0.1 | 0.6 | GO:0000722 | telomere maintenance via recombination(GO:0000722) |
| 0.1 | 0.2 | GO:0003095 | pressure natriuresis(GO:0003095) negative regulation of icosanoid secretion(GO:0032304) |
| 0.1 | 0.2 | GO:0045900 | negative regulation of translational elongation(GO:0045900) |
| 0.1 | 0.9 | GO:0036158 | outer dynein arm assembly(GO:0036158) |
| 0.1 | 0.5 | GO:0042797 | 5S class rRNA transcription from RNA polymerase III type 1 promoter(GO:0042791) tRNA transcription from RNA polymerase III promoter(GO:0042797) |
| 0.1 | 0.7 | GO:0006987 | activation of signaling protein activity involved in unfolded protein response(GO:0006987) |
| 0.1 | 0.8 | GO:0046784 | viral mRNA export from host cell nucleus(GO:0046784) |
| 0.1 | 0.2 | GO:0031291 | Ran protein signal transduction(GO:0031291) |
| 0.1 | 0.2 | GO:0006422 | aspartyl-tRNA aminoacylation(GO:0006422) |
| 0.1 | 0.5 | GO:0006655 | phosphatidylglycerol biosynthetic process(GO:0006655) |
| 0.1 | 0.2 | GO:0050917 | sensory perception of sweet taste(GO:0050916) sensory perception of umami taste(GO:0050917) |
| 0.1 | 0.1 | GO:0030282 | bone mineralization(GO:0030282) |
| 0.1 | 0.2 | GO:0000294 | nuclear-transcribed mRNA catabolic process, endonucleolytic cleavage-dependent decay(GO:0000294) |
| 0.1 | 0.9 | GO:0051873 | killing by host of symbiont cells(GO:0051873) |
| 0.1 | 0.2 | GO:0051300 | spindle pole body duplication(GO:0030474) spindle pole body organization(GO:0051300) spindle pole body localization(GO:0070631) establishment of spindle pole body localization(GO:0070632) spindle pole body localization to nuclear envelope(GO:0071789) establishment of spindle pole body localization to nuclear envelope(GO:0071790) |
| 0.1 | 0.6 | GO:2001256 | regulation of store-operated calcium entry(GO:2001256) |
| 0.1 | 1.3 | GO:0035435 | phosphate ion transmembrane transport(GO:0035435) |
| 0.1 | 0.2 | GO:0010212 | response to ionizing radiation(GO:0010212) |
| 0.1 | 1.4 | GO:0030277 | maintenance of gastrointestinal epithelium(GO:0030277) |
| 0.1 | 0.2 | GO:0045897 | positive regulation of transcription during mitosis(GO:0045897) |
| 0.1 | 0.1 | GO:0002752 | cell surface pattern recognition receptor signaling pathway(GO:0002752) |
| 0.1 | 0.5 | GO:0070995 | NADPH oxidation(GO:0070995) |
| 0.1 | 0.3 | GO:0060133 | somatotropin secreting cell development(GO:0060133) |
| 0.1 | 0.6 | GO:0006552 | leucine catabolic process(GO:0006552) |
| 0.1 | 0.4 | GO:0006741 | NADP biosynthetic process(GO:0006741) |
| 0.1 | 0.7 | GO:1903608 | protein localization to cytoplasmic stress granule(GO:1903608) |
| 0.1 | 0.2 | GO:0006428 | isoleucyl-tRNA aminoacylation(GO:0006428) |
| 0.1 | 0.2 | GO:0019276 | UDP-N-acetylgalactosamine metabolic process(GO:0019276) chondroitin sulfate proteoglycan biosynthetic process, polysaccharide chain biosynthetic process(GO:0050653) |
| 0.1 | 1.4 | GO:0035729 | cellular response to hepatocyte growth factor stimulus(GO:0035729) |
| 0.1 | 0.2 | GO:0036309 | protein localization to M-band(GO:0036309) protein localization to T-tubule(GO:0036371) |
| 0.1 | 0.1 | GO:1990414 | replication-born double-strand break repair via sister chromatid exchange(GO:1990414) |
| 0.1 | 0.3 | GO:1904844 | response to L-glutamine(GO:1904844) cellular response to L-glutamine(GO:1904845) |
| 0.1 | 0.7 | GO:0016024 | CDP-diacylglycerol biosynthetic process(GO:0016024) |
| 0.1 | 0.4 | GO:0051661 | maintenance of centrosome location(GO:0051661) |
| 0.1 | 0.5 | GO:0070166 | enamel mineralization(GO:0070166) |
| 0.1 | 0.2 | GO:0042495 | detection of bacterial lipoprotein(GO:0042494) detection of triacyl bacterial lipopeptide(GO:0042495) detection of bacterial lipopeptide(GO:0070340) |
| 0.1 | 0.5 | GO:0018344 | protein geranylgeranylation(GO:0018344) |
| 0.1 | 0.1 | GO:0002645 | positive regulation of tolerance induction(GO:0002645) |
| 0.1 | 1.0 | GO:0005513 | detection of calcium ion(GO:0005513) |
| 0.1 | 0.1 | GO:0071725 | toll-like receptor TLR1:TLR2 signaling pathway(GO:0038123) response to triacyl bacterial lipopeptide(GO:0071725) cellular response to triacyl bacterial lipopeptide(GO:0071727) |
| 0.1 | 0.5 | GO:0060449 | bud elongation involved in lung branching(GO:0060449) |
| 0.1 | 0.3 | GO:0070537 | histone H2A K63-linked deubiquitination(GO:0070537) |
| 0.1 | 0.4 | GO:1990416 | cellular response to brain-derived neurotrophic factor stimulus(GO:1990416) |
| 0.1 | 0.2 | GO:0001920 | negative regulation of receptor recycling(GO:0001920) |
| 0.1 | 0.6 | GO:0033089 | positive regulation of T cell differentiation in thymus(GO:0033089) positive regulation of thymocyte aggregation(GO:2000400) |
| 0.1 | 0.2 | GO:1903566 | positive regulation of protein localization to cilium(GO:1903566) |
| 0.1 | 0.3 | GO:0030035 | microspike assembly(GO:0030035) |
| 0.1 | 0.7 | GO:1904871 | regulation of protein localization to Cajal body(GO:1904869) positive regulation of protein localization to Cajal body(GO:1904871) |
| 0.1 | 0.2 | GO:1903377 | negative regulation of oxidative stress-induced neuron intrinsic apoptotic signaling pathway(GO:1903377) |
| 0.1 | 0.3 | GO:0015961 | diadenosine polyphosphate catabolic process(GO:0015961) diphosphoinositol polyphosphate metabolic process(GO:0071543) diadenosine pentaphosphate metabolic process(GO:1901906) diadenosine pentaphosphate catabolic process(GO:1901907) diadenosine hexaphosphate metabolic process(GO:1901908) diadenosine hexaphosphate catabolic process(GO:1901909) adenosine 5'-(hexahydrogen pentaphosphate) metabolic process(GO:1901910) adenosine 5'-(hexahydrogen pentaphosphate) catabolic process(GO:1901911) |
| 0.1 | 1.5 | GO:0008211 | glucocorticoid metabolic process(GO:0008211) |
| 0.1 | 0.2 | GO:0002522 | leukocyte migration involved in immune response(GO:0002522) |
| 0.1 | 0.2 | GO:0060023 | soft palate development(GO:0060023) |
| 0.1 | 0.6 | GO:0042118 | endothelial cell activation(GO:0042118) |
| 0.0 | 0.1 | GO:0006447 | regulation of translational initiation by iron(GO:0006447) |
| 0.0 | 0.2 | GO:0050432 | catecholamine secretion(GO:0050432) regulation of catecholamine secretion(GO:0050433) |
| 0.0 | 0.1 | GO:1990502 | dense core granule maturation(GO:1990502) |
| 0.0 | 0.1 | GO:0060332 | positive regulation of response to interferon-gamma(GO:0060332) positive regulation of interferon-gamma-mediated signaling pathway(GO:0060335) |
| 0.0 | 0.1 | GO:0071301 | cellular response to vitamin B1(GO:0071301) response to formaldehyde(GO:1904404) |
| 0.0 | 1.0 | GO:0009756 | carbohydrate mediated signaling(GO:0009756) |
| 0.0 | 0.4 | GO:0032534 | regulation of microvillus assembly(GO:0032534) |
| 0.0 | 0.4 | GO:0038007 | netrin-activated signaling pathway(GO:0038007) |
| 0.0 | 1.5 | GO:0072600 | establishment of protein localization to Golgi(GO:0072600) |
| 0.0 | 0.2 | GO:0042539 | hypotonic salinity response(GO:0042539) cellular hypotonic salinity response(GO:0071477) |
| 0.0 | 1.1 | GO:0007095 | mitotic G2 DNA damage checkpoint(GO:0007095) |
| 0.0 | 1.1 | GO:0032212 | positive regulation of telomere maintenance via telomerase(GO:0032212) |
| 0.0 | 0.3 | GO:0034372 | triglyceride-rich lipoprotein particle remodeling(GO:0034370) very-low-density lipoprotein particle remodeling(GO:0034372) |
| 0.0 | 0.3 | GO:0033504 | floor plate development(GO:0033504) |
| 0.0 | 0.2 | GO:1904383 | response to sodium phosphate(GO:1904383) |
| 0.0 | 0.1 | GO:0002331 | pre-B cell differentiation(GO:0002329) pre-B cell allelic exclusion(GO:0002331) |
| 0.0 | 0.8 | GO:0030033 | microvillus assembly(GO:0030033) |
| 0.0 | 0.2 | GO:1902498 | regulation of protein autoubiquitination(GO:1902498) |
| 0.0 | 0.8 | GO:0042135 | neurotransmitter catabolic process(GO:0042135) |
| 0.0 | 0.7 | GO:0018214 | peptidyl-glutamic acid carboxylation(GO:0017187) protein carboxylation(GO:0018214) |
| 0.0 | 0.6 | GO:0034656 | nucleobase-containing small molecule catabolic process(GO:0034656) |
| 0.0 | 0.3 | GO:0030321 | transepithelial chloride transport(GO:0030321) |
| 0.0 | 1.0 | GO:2000311 | regulation of alpha-amino-3-hydroxy-5-methyl-4-isoxazole propionate selective glutamate receptor activity(GO:2000311) |
| 0.0 | 0.2 | GO:2000301 | negative regulation of synaptic vesicle exocytosis(GO:2000301) |
| 0.0 | 0.2 | GO:2000676 | positive regulation of type B pancreatic cell apoptotic process(GO:2000676) |
| 0.0 | 0.3 | GO:0002414 | immunoglobulin transcytosis in epithelial cells(GO:0002414) |
| 0.0 | 0.2 | GO:2000639 | regulation of SREBP signaling pathway(GO:2000638) negative regulation of SREBP signaling pathway(GO:2000639) |
| 0.0 | 0.1 | GO:0001694 | histamine biosynthetic process(GO:0001694) |
| 0.0 | 0.1 | GO:0046061 | dATP catabolic process(GO:0046061) |
| 0.0 | 0.5 | GO:0097186 | amelogenesis(GO:0097186) |
| 0.0 | 0.9 | GO:0006359 | regulation of transcription from RNA polymerase III promoter(GO:0006359) |
| 0.0 | 0.5 | GO:0071361 | cellular response to ethanol(GO:0071361) |
| 0.0 | 0.1 | GO:0016561 | protein import into peroxisome matrix, translocation(GO:0016561) |
| 0.0 | 0.1 | GO:0086097 | phospholipase C-activating angiotensin-activated signaling pathway(GO:0086097) |
| 0.0 | 1.1 | GO:0042036 | negative regulation of cytokine biosynthetic process(GO:0042036) |
| 0.0 | 0.0 | GO:1903625 | negative regulation of DNA catabolic process(GO:1903625) |
| 0.0 | 0.1 | GO:0050860 | negative regulation of T cell receptor signaling pathway(GO:0050860) |
| 0.0 | 0.5 | GO:0051382 | kinetochore assembly(GO:0051382) |
| 0.0 | 0.1 | GO:0014807 | regulation of somitogenesis(GO:0014807) |
| 0.0 | 0.1 | GO:0046081 | dUTP metabolic process(GO:0046080) dUTP catabolic process(GO:0046081) |
| 0.0 | 0.5 | GO:2000480 | negative regulation of cAMP-dependent protein kinase activity(GO:2000480) |
| 0.0 | 0.8 | GO:0016578 | histone deubiquitination(GO:0016578) |
| 0.0 | 0.5 | GO:0030422 | production of siRNA involved in RNA interference(GO:0030422) |
| 0.0 | 0.2 | GO:2000503 | positive regulation of natural killer cell chemotaxis(GO:2000503) |
| 0.0 | 0.2 | GO:0015886 | heme transport(GO:0015886) |
| 0.0 | 4.9 | GO:0006958 | complement activation, classical pathway(GO:0006958) |
| 0.0 | 0.1 | GO:0010840 | regulation of circadian sleep/wake cycle, wakefulness(GO:0010840) circadian sleep/wake cycle, wakefulness(GO:0042746) |
| 0.0 | 0.6 | GO:0044030 | regulation of DNA methylation(GO:0044030) |
| 0.0 | 0.2 | GO:0010890 | positive regulation of sequestering of triglyceride(GO:0010890) |
| 0.0 | 1.6 | GO:1904837 | beta-catenin-TCF complex assembly(GO:1904837) |
| 0.0 | 0.1 | GO:0070940 | dephosphorylation of RNA polymerase II C-terminal domain(GO:0070940) |
| 0.0 | 1.9 | GO:0015701 | bicarbonate transport(GO:0015701) |
| 0.0 | 0.2 | GO:0030850 | prostate gland development(GO:0030850) prostate gland morphogenesis(GO:0060512) |
| 0.0 | 0.2 | GO:0006574 | valine catabolic process(GO:0006574) |
| 0.0 | 0.1 | GO:0072369 | regulation of lipid transport by positive regulation of transcription from RNA polymerase II promoter(GO:0072369) |
| 0.0 | 0.4 | GO:0000244 | spliceosomal tri-snRNP complex assembly(GO:0000244) |
| 0.0 | 0.0 | GO:0002767 | immune response-inhibiting signal transduction(GO:0002765) immune response-inhibiting cell surface receptor signaling pathway(GO:0002767) |
| 0.0 | 0.1 | GO:0044205 | 'de novo' UMP biosynthetic process(GO:0044205) |
| 0.0 | 0.1 | GO:0060979 | vasculogenesis involved in coronary vascular morphogenesis(GO:0060979) |
| 0.0 | 0.2 | GO:0061737 | leukotriene signaling pathway(GO:0061737) |
| 0.0 | 0.1 | GO:0006072 | glycerol-3-phosphate metabolic process(GO:0006072) |
| 0.0 | 0.2 | GO:0051383 | kinetochore organization(GO:0051383) |
| 0.0 | 0.2 | GO:0016139 | glycoside catabolic process(GO:0016139) |
| 0.0 | 0.4 | GO:0045059 | positive thymic T cell selection(GO:0045059) |
| 0.0 | 0.2 | GO:0060737 | prostate epithelial cord elongation(GO:0060523) prostate gland morphogenetic growth(GO:0060737) |
| 0.0 | 0.2 | GO:0001675 | acrosome assembly(GO:0001675) |
| 0.0 | 0.4 | GO:0007175 | negative regulation of epidermal growth factor-activated receptor activity(GO:0007175) |
| 0.0 | 0.3 | GO:0043923 | positive regulation by host of viral transcription(GO:0043923) |
| 0.0 | 0.2 | GO:0006537 | glutamate biosynthetic process(GO:0006537) |
| 0.0 | 0.1 | GO:0044240 | multicellular organism lipid catabolic process(GO:0044240) |
| 0.0 | 0.6 | GO:0031915 | positive regulation of synaptic plasticity(GO:0031915) |
| 0.0 | 0.1 | GO:0031340 | positive regulation of vesicle fusion(GO:0031340) |
| 0.0 | 0.1 | GO:2000255 | negative regulation of male germ cell proliferation(GO:2000255) |
| 0.0 | 0.2 | GO:0042723 | thiamine-containing compound metabolic process(GO:0042723) |
| 0.0 | 0.6 | GO:2000310 | regulation of N-methyl-D-aspartate selective glutamate receptor activity(GO:2000310) |
| 0.0 | 0.5 | GO:0002385 | mucosal immune response(GO:0002385) |
| 0.0 | 0.4 | GO:0071168 | protein localization to chromatin(GO:0071168) |
| 0.0 | 0.4 | GO:1901750 | leukotriene D4 metabolic process(GO:1901748) leukotriene D4 biosynthetic process(GO:1901750) |
| 0.0 | 0.1 | GO:0032747 | positive regulation of interleukin-23 production(GO:0032747) |
| 0.0 | 0.5 | GO:0033540 | fatty acid beta-oxidation using acyl-CoA oxidase(GO:0033540) |
| 0.0 | 0.6 | GO:1904659 | hexose transmembrane transport(GO:0035428) glucose transmembrane transport(GO:1904659) |
| 0.0 | 0.7 | GO:0002820 | negative regulation of adaptive immune response(GO:0002820) |
| 0.0 | 0.1 | GO:0032053 | ciliary basal body organization(GO:0032053) |
| 0.0 | 0.2 | GO:0035609 | C-terminal protein deglutamylation(GO:0035609) |
| 0.0 | 0.3 | GO:2000001 | regulation of DNA damage checkpoint(GO:2000001) |
| 0.0 | 0.3 | GO:0008627 | intrinsic apoptotic signaling pathway in response to osmotic stress(GO:0008627) |
| 0.0 | 0.2 | GO:0072307 | metanephric nephron tubule epithelial cell differentiation(GO:0072257) regulation of metanephric nephron tubule epithelial cell differentiation(GO:0072307) |
| 0.0 | 0.3 | GO:0055090 | acylglycerol homeostasis(GO:0055090) triglyceride homeostasis(GO:0070328) |
| 0.0 | 2.8 | GO:0051225 | spindle assembly(GO:0051225) |
| 0.0 | 0.1 | GO:0010700 | negative regulation of norepinephrine secretion(GO:0010700) |
| 0.0 | 0.1 | GO:0002678 | positive regulation of chronic inflammatory response(GO:0002678) |
| 0.0 | 0.2 | GO:0035502 | metanephric part of ureteric bud development(GO:0035502) |
| 0.0 | 0.3 | GO:0015671 | oxygen transport(GO:0015671) |
| 0.0 | 0.2 | GO:0043651 | linoleic acid metabolic process(GO:0043651) |
| 0.0 | 0.1 | GO:0006824 | cobalt ion transport(GO:0006824) |
| 0.0 | 0.1 | GO:0046984 | regulation of hemoglobin biosynthetic process(GO:0046984) |
| 0.0 | 0.1 | GO:0002467 | germinal center formation(GO:0002467) |
| 0.0 | 0.1 | GO:0010727 | negative regulation of hydrogen peroxide metabolic process(GO:0010727) |
| 0.0 | 0.1 | GO:0014062 | regulation of serotonin secretion(GO:0014062) negative regulation of serotonin secretion(GO:0014063) |
| 0.0 | 0.1 | GO:0060455 | negative regulation of gastric acid secretion(GO:0060455) |
| 0.0 | 0.2 | GO:0015816 | glycine transport(GO:0015816) |
| 0.0 | 0.1 | GO:0021564 | vagus nerve development(GO:0021564) |
| 0.0 | 0.4 | GO:0003298 | physiological muscle hypertrophy(GO:0003298) physiological cardiac muscle hypertrophy(GO:0003301) cell growth involved in cardiac muscle cell development(GO:0061049) |
| 0.0 | 0.1 | GO:0043277 | apoptotic cell clearance(GO:0043277) |
| 0.0 | 0.5 | GO:0032515 | negative regulation of phosphoprotein phosphatase activity(GO:0032515) |
| 0.0 | 0.5 | GO:0035024 | negative regulation of Rho protein signal transduction(GO:0035024) |
| 0.0 | 0.2 | GO:0061303 | cornea development in camera-type eye(GO:0061303) |
| 0.0 | 0.1 | GO:0046952 | ketone body catabolic process(GO:0046952) |
| 0.0 | 0.1 | GO:0010792 | DNA double-strand break processing involved in repair via single-strand annealing(GO:0010792) |
| 0.0 | 0.3 | GO:0030889 | negative regulation of B cell proliferation(GO:0030889) |
| 0.0 | 0.1 | GO:0006001 | fructose catabolic process(GO:0006001) fructose catabolic process to hydroxyacetone phosphate and glyceraldehyde-3-phosphate(GO:0061624) |
| 0.0 | 0.2 | GO:0006388 | tRNA splicing, via endonucleolytic cleavage and ligation(GO:0006388) |
| 0.0 | 0.1 | GO:0045723 | positive regulation of fatty acid biosynthetic process(GO:0045723) |
| 0.0 | 0.3 | GO:0033623 | regulation of integrin activation(GO:0033623) |
| 0.0 | 0.4 | GO:0045332 | lipid translocation(GO:0034204) phospholipid translocation(GO:0045332) |
| 0.0 | 0.1 | GO:0047484 | regulation of response to osmotic stress(GO:0047484) |
| 0.0 | 0.1 | GO:0044351 | macropinocytosis(GO:0044351) |
| 0.0 | 0.5 | GO:0030488 | tRNA methylation(GO:0030488) |
| 0.0 | 0.1 | GO:0051569 | regulation of histone H3-K4 methylation(GO:0051569) |
| 0.0 | 0.2 | GO:0043486 | histone exchange(GO:0043486) |
| 0.0 | 1.3 | GO:0043124 | negative regulation of I-kappaB kinase/NF-kappaB signaling(GO:0043124) |
| 0.0 | 0.1 | GO:0061743 | motor learning(GO:0061743) |
| 0.0 | 0.2 | GO:0071732 | cellular response to nitric oxide(GO:0071732) |
| 0.0 | 0.1 | GO:0007352 | zygotic specification of dorsal/ventral axis(GO:0007352) |
| 0.0 | 0.1 | GO:1990168 | protein K33-linked deubiquitination(GO:1990168) |
| 0.0 | 0.2 | GO:0042573 | retinoic acid metabolic process(GO:0042573) |
| 0.0 | 0.4 | GO:0035025 | positive regulation of Rho protein signal transduction(GO:0035025) |
| 0.0 | 0.3 | GO:0060326 | cell chemotaxis(GO:0060326) |
| 0.0 | 0.1 | GO:0000492 | box C/D snoRNP assembly(GO:0000492) |
| 0.0 | 0.3 | GO:0046069 | cGMP catabolic process(GO:0046069) |
| 0.0 | 0.7 | GO:0034724 | DNA replication-independent nucleosome assembly(GO:0006336) DNA replication-independent nucleosome organization(GO:0034724) |
| 0.0 | 0.1 | GO:0032218 | riboflavin transport(GO:0032218) |
| 0.0 | 0.1 | GO:0045722 | positive regulation of gluconeogenesis(GO:0045722) |
| 0.0 | 0.3 | GO:0006183 | GTP biosynthetic process(GO:0006183) |
| 0.0 | 0.8 | GO:0002260 | lymphocyte homeostasis(GO:0002260) |
| 0.0 | 0.2 | GO:0071803 | positive regulation of podosome assembly(GO:0071803) |
| 0.0 | 0.1 | GO:0010735 | positive regulation of transcription via serum response element binding(GO:0010735) |
| 0.0 | 0.4 | GO:2000772 | regulation of cellular senescence(GO:2000772) |
| 0.0 | 0.2 | GO:0045793 | positive regulation of cell size(GO:0045793) |
| 0.0 | 0.4 | GO:0043555 | regulation of translation in response to stress(GO:0043555) |
| 0.0 | 0.3 | GO:0016558 | protein import into peroxisome matrix(GO:0016558) |
| 0.0 | 0.4 | GO:0000038 | very long-chain fatty acid metabolic process(GO:0000038) |
| 0.0 | 0.1 | GO:0099525 | presynaptic dense core granule exocytosis(GO:0099525) |
| 0.0 | 0.1 | GO:0035728 | response to hepatocyte growth factor(GO:0035728) |
| 0.0 | 0.3 | GO:0006491 | N-glycan processing(GO:0006491) |
| 0.0 | 0.2 | GO:0006189 | 'de novo' IMP biosynthetic process(GO:0006189) |
| 0.0 | 0.2 | GO:0042753 | positive regulation of circadian rhythm(GO:0042753) |
| 0.0 | 0.1 | GO:1901525 | negative regulation of macromitophagy(GO:1901525) |
| 0.0 | 0.1 | GO:0019509 | L-methionine biosynthetic process from methylthioadenosine(GO:0019509) |
| 0.0 | 0.1 | GO:0032074 | negative regulation of nuclease activity(GO:0032074) |
| 0.0 | 0.1 | GO:0072658 | positive regulation of cell communication by electrical coupling(GO:0010650) maintenance of protein location in membrane(GO:0072658) maintenance of protein location in plasma membrane(GO:0072660) positive regulation of membrane depolarization during cardiac muscle cell action potential(GO:1900827) |
| 0.0 | 0.3 | GO:0010832 | negative regulation of myotube differentiation(GO:0010832) |
| 0.0 | 0.4 | GO:0007339 | binding of sperm to zona pellucida(GO:0007339) |
| 0.0 | 0.1 | GO:0021888 | hypothalamus gonadotrophin-releasing hormone neuron differentiation(GO:0021886) hypothalamus gonadotrophin-releasing hormone neuron development(GO:0021888) |
| 0.0 | 0.2 | GO:0050775 | positive regulation of dendrite morphogenesis(GO:0050775) |
| 0.0 | 0.1 | GO:0048749 | compound eye development(GO:0048749) |
| 0.0 | 0.2 | GO:0035082 | axoneme assembly(GO:0035082) |
| 0.0 | 0.1 | GO:0060997 | dendritic spine morphogenesis(GO:0060997) |
| 0.0 | 0.3 | GO:0032793 | positive regulation of CREB transcription factor activity(GO:0032793) |
| 0.0 | 0.0 | GO:2001183 | negative regulation of interleukin-12 secretion(GO:2001183) |
| 0.0 | 0.2 | GO:0072643 | interferon-gamma secretion(GO:0072643) |
| 0.0 | 1.2 | GO:0046324 | regulation of glucose import(GO:0046324) |
| 0.0 | 0.2 | GO:2001214 | positive regulation of vasculogenesis(GO:2001214) |
| 0.0 | 0.1 | GO:0019800 | peptide cross-linking via chondroitin 4-sulfate glycosaminoglycan(GO:0019800) |
| 0.0 | 0.2 | GO:0045732 | positive regulation of protein catabolic process(GO:0045732) |
| 0.0 | 0.5 | GO:0018146 | keratan sulfate biosynthetic process(GO:0018146) |
| 0.0 | 0.1 | GO:0010827 | regulation of glucose transport(GO:0010827) |
| 0.0 | 0.1 | GO:0034720 | histone H3-K4 demethylation(GO:0034720) |
| 0.0 | 0.1 | GO:0098789 | mRNA cleavage involved in mRNA processing(GO:0098787) pre-mRNA cleavage required for polyadenylation(GO:0098789) |
| 0.0 | 0.1 | GO:0075525 | viral translational termination-reinitiation(GO:0075525) |
| 0.0 | 0.4 | GO:0006383 | transcription from RNA polymerase III promoter(GO:0006383) |
| 0.0 | 0.2 | GO:0002517 | T cell tolerance induction(GO:0002517) |
| 0.0 | 0.3 | GO:0032094 | response to food(GO:0032094) |
| 0.0 | 0.1 | GO:0031032 | actomyosin structure organization(GO:0031032) |
| 0.0 | 0.2 | GO:0060009 | Sertoli cell development(GO:0060009) |
| 0.0 | 0.2 | GO:0006020 | inositol metabolic process(GO:0006020) |
| 0.0 | 0.0 | GO:0042727 | flavin-containing compound biosynthetic process(GO:0042727) |
| 0.0 | 0.1 | GO:0072718 | response to cisplatin(GO:0072718) |
| 0.0 | 0.2 | GO:0055026 | negative regulation of cardiac muscle tissue development(GO:0055026) |
| 0.0 | 0.1 | GO:0008612 | peptidyl-lysine modification to peptidyl-hypusine(GO:0008612) |
| 0.0 | 0.1 | GO:1903237 | negative regulation of leukocyte tethering or rolling(GO:1903237) negative regulation of leukocyte adhesion to vascular endothelial cell(GO:1904995) |
| 0.0 | 0.1 | GO:0006122 | mitochondrial electron transport, ubiquinol to cytochrome c(GO:0006122) |
| 0.0 | 0.1 | GO:0042104 | positive regulation of activated T cell proliferation(GO:0042104) |
| 0.0 | 0.0 | GO:0030534 | adult behavior(GO:0030534) |
| 0.0 | 0.3 | GO:0045948 | positive regulation of translational initiation(GO:0045948) |
| 0.0 | 0.1 | GO:0086024 | adrenergic receptor signaling pathway involved in positive regulation of heart rate(GO:0086024) |
| 0.0 | 0.2 | GO:0030388 | fructose 1,6-bisphosphate metabolic process(GO:0030388) |
| 0.0 | 0.0 | GO:0035633 | maintenance of blood-brain barrier(GO:0035633) positive regulation of metalloendopeptidase activity(GO:1904685) |
| 0.0 | 0.0 | GO:1900133 | regulation of renin secretion into blood stream(GO:1900133) |
| 0.0 | 0.5 | GO:0045739 | positive regulation of DNA repair(GO:0045739) |
| 0.0 | 0.1 | GO:0046459 | short-chain fatty acid metabolic process(GO:0046459) |
| 0.0 | 0.9 | GO:0070125 | mitochondrial translational elongation(GO:0070125) |
| 0.0 | 0.1 | GO:0018298 | protein-chromophore linkage(GO:0018298) |
| 0.0 | 0.4 | GO:0007420 | brain development(GO:0007420) |
| 0.0 | 0.3 | GO:0034142 | toll-like receptor 4 signaling pathway(GO:0034142) |
| 0.0 | 0.1 | GO:0045039 | protein import into mitochondrial inner membrane(GO:0045039) |
| 0.0 | 0.2 | GO:0006851 | mitochondrial calcium ion transport(GO:0006851) |
| 0.0 | 0.4 | GO:0030866 | cortical actin cytoskeleton organization(GO:0030866) |
| 0.0 | 0.2 | GO:0010510 | regulation of acetyl-CoA biosynthetic process from pyruvate(GO:0010510) |
| 0.0 | 0.0 | GO:0006108 | malate metabolic process(GO:0006108) |
| 0.0 | 0.1 | GO:0060339 | negative regulation of type I interferon-mediated signaling pathway(GO:0060339) |
| 0.0 | 0.0 | GO:1903800 | positive regulation of production of miRNAs involved in gene silencing by miRNA(GO:1903800) |
| 0.0 | 0.2 | GO:0042921 | glucocorticoid receptor signaling pathway(GO:0042921) |
| 0.0 | 0.4 | GO:0042407 | cristae formation(GO:0042407) |
| 0.0 | 0.1 | GO:0060285 | cilium-dependent cell motility(GO:0060285) |
| 0.0 | 0.2 | GO:0006626 | protein targeting to mitochondrion(GO:0006626) |
| 0.0 | 0.1 | GO:0016191 | synaptic vesicle uncoating(GO:0016191) |
| 0.0 | 0.1 | GO:0060800 | regulation of cell differentiation involved in embryonic placenta development(GO:0060800) |
| 0.0 | 0.5 | GO:0006305 | DNA alkylation(GO:0006305) DNA methylation(GO:0006306) |
| 0.0 | 0.4 | GO:0006400 | tRNA modification(GO:0006400) |
| 0.0 | 0.3 | GO:0007214 | gamma-aminobutyric acid signaling pathway(GO:0007214) |
| 0.0 | 0.0 | GO:0002326 | B cell lineage commitment(GO:0002326) |
| 0.0 | 0.2 | GO:0048026 | positive regulation of mRNA splicing, via spliceosome(GO:0048026) |
| 0.0 | 0.0 | GO:0015919 | peroxisomal membrane transport(GO:0015919) protein import into peroxisome membrane(GO:0045046) |
| 0.0 | 0.1 | GO:0098967 | exocytic insertion of neurotransmitter receptor to plasma membrane(GO:0098881) exocytic insertion of neurotransmitter receptor to postsynaptic membrane(GO:0098967) |
Gene overrepresentation in cellular_component category:
| Log-likelihood per target | Total log-likelihood | Term | Description |
|---|---|---|---|
| 0.9 | 21.0 | GO:0042627 | chylomicron(GO:0042627) |
| 0.7 | 2.7 | GO:0031838 | haptoglobin-hemoglobin complex(GO:0031838) |
| 0.5 | 6.5 | GO:0005577 | fibrinogen complex(GO:0005577) |
| 0.4 | 1.6 | GO:0034673 | inhibin-betaglycan-ActRII complex(GO:0034673) |
| 0.4 | 2.0 | GO:0005726 | perichromatin fibrils(GO:0005726) |
| 0.3 | 2.7 | GO:0070652 | HAUS complex(GO:0070652) |
| 0.2 | 1.2 | GO:0070826 | paraferritin complex(GO:0070826) |
| 0.2 | 1.1 | GO:0000444 | MIS12/MIND type complex(GO:0000444) |
| 0.2 | 0.6 | GO:0035061 | Smc5-Smc6 complex(GO:0030915) interchromatin granule(GO:0035061) |
| 0.2 | 1.2 | GO:0045179 | apical cortex(GO:0045179) |
| 0.1 | 1.6 | GO:0044666 | MLL3/4 complex(GO:0044666) |
| 0.1 | 0.6 | GO:0070876 | SOSS complex(GO:0070876) |
| 0.1 | 0.4 | GO:0031262 | Ndc80 complex(GO:0031262) |
| 0.1 | 1.1 | GO:0043203 | axon hillock(GO:0043203) |
| 0.1 | 0.5 | GO:0005968 | Rab-protein geranylgeranyltransferase complex(GO:0005968) |
| 0.1 | 0.1 | GO:0036020 | endolysosome membrane(GO:0036020) |
| 0.1 | 1.0 | GO:0036157 | outer dynein arm(GO:0036157) |
| 0.1 | 0.9 | GO:0061617 | MICOS complex(GO:0061617) |
| 0.1 | 0.8 | GO:0032437 | cuticular plate(GO:0032437) |
| 0.1 | 3.0 | GO:0034364 | high-density lipoprotein particle(GO:0034364) |
| 0.1 | 0.7 | GO:0097165 | nuclear stress granule(GO:0097165) |
| 0.1 | 0.5 | GO:1990031 | pinceau fiber(GO:1990031) |
| 0.1 | 22.0 | GO:0072562 | blood microparticle(GO:0072562) |
| 0.1 | 0.3 | GO:0033150 | perinuclear theca(GO:0033011) cytoskeletal calyx(GO:0033150) |
| 0.1 | 0.5 | GO:0034688 | integrin alphaM-beta2 complex(GO:0034688) |
| 0.1 | 0.7 | GO:0000347 | THO complex(GO:0000347) THO complex part of transcription export complex(GO:0000445) |
| 0.1 | 0.3 | GO:0008282 | ATP-sensitive potassium channel complex(GO:0008282) |
| 0.1 | 0.6 | GO:0070554 | synaptobrevin 2-SNAP-25-syntaxin-3-complexin complex(GO:0070554) |
| 0.1 | 0.4 | GO:0005579 | membrane attack complex(GO:0005579) |
| 0.1 | 0.3 | GO:0000798 | nuclear cohesin complex(GO:0000798) |
| 0.1 | 0.4 | GO:0044530 | supraspliceosomal complex(GO:0044530) |
| 0.1 | 0.8 | GO:0042788 | polysomal ribosome(GO:0042788) |
| 0.1 | 0.5 | GO:0000127 | transcription factor TFIIIC complex(GO:0000127) |
| 0.1 | 0.2 | GO:0070762 | nuclear pore transmembrane ring(GO:0070762) |
| 0.1 | 1.4 | GO:0042613 | MHC class II protein complex(GO:0042613) |
| 0.1 | 0.4 | GO:0032133 | chromosome passenger complex(GO:0032133) |
| 0.1 | 1.5 | GO:0035861 | site of double-strand break(GO:0035861) |
| 0.1 | 0.4 | GO:0030061 | mitochondrial crista(GO:0030061) |
| 0.1 | 0.2 | GO:0035354 | Toll-like receptor 1-Toll-like receptor 2 protein complex(GO:0035354) |
| 0.1 | 0.7 | GO:0002199 | zona pellucida receptor complex(GO:0002199) |
| 0.1 | 0.4 | GO:0072687 | meiotic spindle(GO:0072687) |
| 0.1 | 0.2 | GO:0072536 | interleukin-23 receptor complex(GO:0072536) |
| 0.1 | 0.6 | GO:0042105 | alpha-beta T cell receptor complex(GO:0042105) |
| 0.1 | 0.2 | GO:0005967 | mitochondrial pyruvate dehydrogenase complex(GO:0005967) |
| 0.1 | 0.2 | GO:0097679 | other organism cytoplasm(GO:0097679) |
| 0.0 | 0.6 | GO:0000243 | commitment complex(GO:0000243) |
| 0.0 | 1.2 | GO:0005666 | DNA-directed RNA polymerase III complex(GO:0005666) |
| 0.0 | 1.0 | GO:0031265 | CD95 death-inducing signaling complex(GO:0031265) |
| 0.0 | 1.3 | GO:0000795 | synaptonemal complex(GO:0000795) |
| 0.0 | 0.5 | GO:0097550 | transcriptional preinitiation complex(GO:0097550) |
| 0.0 | 0.3 | GO:0070531 | BRCA1-A complex(GO:0070531) |
| 0.0 | 0.3 | GO:0098554 | cytoplasmic side of endoplasmic reticulum membrane(GO:0098554) |
| 0.0 | 0.3 | GO:1990726 | Lsm1-7-Pat1 complex(GO:1990726) |
| 0.0 | 0.9 | GO:0035327 | transcriptionally active chromatin(GO:0035327) |
| 0.0 | 0.7 | GO:0005689 | U12-type spliceosomal complex(GO:0005689) |
| 0.0 | 0.6 | GO:0030914 | STAGA complex(GO:0030914) |
| 0.0 | 0.1 | GO:0044423 | virion(GO:0019012) virion part(GO:0044423) |
| 0.0 | 0.1 | GO:0030687 | preribosome, large subunit precursor(GO:0030687) |
| 0.0 | 0.2 | GO:0045272 | plasma membrane respiratory chain complex I(GO:0045272) |
| 0.0 | 0.3 | GO:0071004 | U2-type prespliceosome(GO:0071004) |
| 0.0 | 1.2 | GO:0005697 | telomerase holoenzyme complex(GO:0005697) |
| 0.0 | 0.2 | GO:0005899 | insulin receptor complex(GO:0005899) |
| 0.0 | 0.2 | GO:0098560 | cytoplasmic side of late endosome membrane(GO:0098560) |
| 0.0 | 1.8 | GO:0005771 | multivesicular body(GO:0005771) |
| 0.0 | 0.3 | GO:0033588 | Elongator holoenzyme complex(GO:0033588) |
| 0.0 | 0.8 | GO:0031233 | intrinsic component of external side of plasma membrane(GO:0031233) |
| 0.0 | 0.2 | GO:0072669 | tRNA-splicing ligase complex(GO:0072669) |
| 0.0 | 0.1 | GO:1990730 | VCP-NSFL1C complex(GO:1990730) |
| 0.0 | 0.1 | GO:0090498 | extrinsic component of Golgi membrane(GO:0090498) |
| 0.0 | 0.9 | GO:0032281 | AMPA glutamate receptor complex(GO:0032281) |
| 0.0 | 0.2 | GO:0034719 | SMN-Sm protein complex(GO:0034719) Gemini of coiled bodies(GO:0097504) |
| 0.0 | 1.6 | GO:0042645 | nucleoid(GO:0009295) mitochondrial nucleoid(GO:0042645) |
| 0.0 | 1.0 | GO:0044322 | endoplasmic reticulum quality control compartment(GO:0044322) |
| 0.0 | 0.4 | GO:0008250 | oligosaccharyltransferase complex(GO:0008250) |
| 0.0 | 3.4 | GO:0035579 | specific granule membrane(GO:0035579) |
| 0.0 | 0.2 | GO:0005686 | U2 snRNP(GO:0005686) |
| 0.0 | 0.1 | GO:0034457 | Mpp10 complex(GO:0034457) |
| 0.0 | 0.3 | GO:0008024 | cyclin/CDK positive transcription elongation factor complex(GO:0008024) |
| 0.0 | 0.1 | GO:0042382 | paraspeckles(GO:0042382) |
| 0.0 | 0.8 | GO:0031528 | microvillus membrane(GO:0031528) |
| 0.0 | 0.2 | GO:0043240 | Fanconi anaemia nuclear complex(GO:0043240) |
| 0.0 | 0.6 | GO:0005890 | sodium:potassium-exchanging ATPase complex(GO:0005890) |
| 0.0 | 0.2 | GO:1990452 | Parkin-FBXW7-Cul1 ubiquitin ligase complex(GO:1990452) |
| 0.0 | 0.9 | GO:0005839 | proteasome core complex(GO:0005839) |
| 0.0 | 0.1 | GO:0090533 | cation-transporting ATPase complex(GO:0090533) |
| 0.0 | 0.5 | GO:0031588 | nucleotide-activated protein kinase complex(GO:0031588) |
| 0.0 | 0.8 | GO:0035371 | microtubule plus-end(GO:0035371) |
| 0.0 | 0.1 | GO:0042721 | mitochondrial inner membrane protein insertion complex(GO:0042721) |
| 0.0 | 0.1 | GO:0097125 | cyclin B1-CDK1 complex(GO:0097125) |
| 0.0 | 0.2 | GO:0000940 | condensed chromosome outer kinetochore(GO:0000940) |
| 0.0 | 0.1 | GO:0017102 | methionyl glutamyl tRNA synthetase complex(GO:0017102) |
| 0.0 | 0.1 | GO:0001405 | presequence translocase-associated import motor(GO:0001405) |
| 0.0 | 2.2 | GO:0035578 | azurophil granule lumen(GO:0035578) |
| 0.0 | 0.1 | GO:0035370 | UBC13-UEV1A complex(GO:0035370) |
| 0.0 | 0.4 | GO:0031095 | platelet dense tubular network membrane(GO:0031095) |
| 0.0 | 0.1 | GO:0032010 | phagolysosome(GO:0032010) |
| 0.0 | 0.1 | GO:0070187 | telosome(GO:0070187) |
| 0.0 | 0.2 | GO:0097386 | glial cell projection(GO:0097386) |
| 0.0 | 0.4 | GO:0005849 | mRNA cleavage factor complex(GO:0005849) |
| 0.0 | 0.3 | GO:0097225 | sperm midpiece(GO:0097225) |
| 0.0 | 0.2 | GO:0000788 | nuclear nucleosome(GO:0000788) |
| 0.0 | 0.1 | GO:0031466 | Cul5-RING ubiquitin ligase complex(GO:0031466) |
| 0.0 | 0.3 | GO:0001518 | voltage-gated sodium channel complex(GO:0001518) |
| 0.0 | 0.1 | GO:0005858 | axonemal dynein complex(GO:0005858) |
| 0.0 | 0.4 | GO:0046540 | U4/U6 x U5 tri-snRNP complex(GO:0046540) |
| 0.0 | 0.1 | GO:0031417 | NatC complex(GO:0031417) |
| 0.0 | 0.1 | GO:0035253 | ciliary rootlet(GO:0035253) |
| 0.0 | 0.6 | GO:0000794 | condensed nuclear chromosome(GO:0000794) |
| 0.0 | 0.1 | GO:0044305 | calyx of Held(GO:0044305) |
| 0.0 | 0.1 | GO:0033276 | transcription factor TFTC complex(GO:0033276) |
| 0.0 | 0.1 | GO:0031232 | extrinsic component of external side of plasma membrane(GO:0031232) |
| 0.0 | 0.0 | GO:0000242 | pericentriolar material(GO:0000242) |
| 0.0 | 1.0 | GO:0005637 | nuclear inner membrane(GO:0005637) |
| 0.0 | 0.3 | GO:0033162 | melanosome membrane(GO:0033162) chitosome(GO:0045009) |
| 0.0 | 0.1 | GO:1990796 | photoreceptor cell terminal bouton(GO:1990796) |
| 0.0 | 0.3 | GO:0045277 | respiratory chain complex IV(GO:0045277) |
| 0.0 | 0.6 | GO:0000786 | nucleosome(GO:0000786) |
| 0.0 | 1.8 | GO:0016363 | nuclear matrix(GO:0016363) |
| 0.0 | 0.2 | GO:0097440 | apical dendrite(GO:0097440) |
| 0.0 | 1.9 | GO:0031225 | anchored component of membrane(GO:0031225) |
| 0.0 | 1.0 | GO:0030658 | transport vesicle membrane(GO:0030658) |
| 0.0 | 0.1 | GO:0032389 | MutLalpha complex(GO:0032389) |
| 0.0 | 0.2 | GO:0017101 | aminoacyl-tRNA synthetase multienzyme complex(GO:0017101) |
| 0.0 | 0.6 | GO:0031526 | brush border membrane(GO:0031526) |
| 0.0 | 0.1 | GO:0034709 | methylosome(GO:0034709) |
| 0.0 | 4.1 | GO:0005788 | endoplasmic reticulum lumen(GO:0005788) |
| 0.0 | 0.0 | GO:0031213 | RSF complex(GO:0031213) |
| 0.0 | 0.1 | GO:0071541 | eukaryotic translation initiation factor 3 complex, eIF3m(GO:0071541) |
| 0.0 | 0.1 | GO:0005750 | mitochondrial respiratory chain complex III(GO:0005750) respiratory chain complex III(GO:0045275) |
| 0.0 | 0.1 | GO:0000120 | RNA polymerase I transcription factor complex(GO:0000120) |
| 0.0 | 0.5 | GO:0019005 | SCF ubiquitin ligase complex(GO:0019005) |
| 0.0 | 0.2 | GO:0042101 | T cell receptor complex(GO:0042101) |
| 0.0 | 0.1 | GO:0000974 | Prp19 complex(GO:0000974) |
| 0.0 | 0.3 | GO:0070971 | endoplasmic reticulum exit site(GO:0070971) |
| 0.0 | 2.7 | GO:0009898 | cytoplasmic side of plasma membrane(GO:0009898) |
| 0.0 | 0.4 | GO:0016235 | aggresome(GO:0016235) |
Gene overrepresentation in C2:CP category:
| Log-likelihood per target | Total log-likelihood | Term | Description |
|---|---|---|---|
| 0.1 | 8.3 | PID HNF3B PATHWAY | FOXA2 and FOXA3 transcription factor networks |
| 0.1 | 5.6 | PID INTEGRIN2 PATHWAY | Beta2 integrin cell surface interactions |
| 0.1 | 19.2 | NABA ECM REGULATORS | Genes encoding enzymes and their regulators involved in the remodeling of the extracellular matrix |
| 0.1 | 1.2 | PID P38 GAMMA DELTA PATHWAY | Signaling mediated by p38-gamma and p38-delta |
| 0.1 | 1.3 | PID CIRCADIAN PATHWAY | Circadian rhythm pathway |
| 0.0 | 1.0 | PID ARF6 DOWNSTREAM PATHWAY | Arf6 downstream pathway |
| 0.0 | 2.2 | PID ATM PATHWAY | ATM pathway |
| 0.0 | 2.3 | PID HIF1 TFPATHWAY | HIF-1-alpha transcription factor network |
| 0.0 | 2.1 | PID NFAT TFPATHWAY | Calcineurin-regulated NFAT-dependent transcription in lymphocytes |
| 0.0 | 0.8 | PID EPHB FWD PATHWAY | EPHB forward signaling |
| 0.0 | 1.4 | PID HIF2PATHWAY | HIF-2-alpha transcription factor network |
| 0.0 | 2.8 | PID AR TF PATHWAY | Regulation of Androgen receptor activity |
| 0.0 | 2.8 | PID CD8 TCR DOWNSTREAM PATHWAY | Downstream signaling in naïve CD8+ T cells |
| 0.0 | 0.7 | PID EPHA2 FWD PATHWAY | EPHA2 forward signaling |
| 0.0 | 0.9 | SA CASPASE CASCADE | Apoptosis is mediated by caspases, cysteine proteases arranged in a proteolytic cascade. |
| 0.0 | 2.5 | PID TGFBR PATHWAY | TGF-beta receptor signaling |
| 0.0 | 0.2 | PID IL23 PATHWAY | IL23-mediated signaling events |
| 0.0 | 0.3 | PID TCR CALCIUM PATHWAY | Calcium signaling in the CD4+ TCR pathway |
| 0.0 | 0.8 | PID IL12 STAT4 PATHWAY | IL12 signaling mediated by STAT4 |
| 0.0 | 2.7 | PID ERA GENOMIC PATHWAY | Validated nuclear estrogen receptor alpha network |
| 0.0 | 1.0 | PID SYNDECAN 2 PATHWAY | Syndecan-2-mediated signaling events |
| 0.0 | 0.8 | SA B CELL RECEPTOR COMPLEXES | Antigen binding to B cell receptors activates protein tyrosine kinases, such as the Src family, which ultimate activate MAP kinases. |
| 0.0 | 0.6 | PID PRL SIGNALING EVENTS PATHWAY | Signaling events mediated by PRL |
| 0.0 | 0.4 | PID TCR JNK PATHWAY | JNK signaling in the CD4+ TCR pathway |
| 0.0 | 0.8 | PID MYC PATHWAY | C-MYC pathway |
| 0.0 | 0.9 | PID GLYPICAN 1PATHWAY | Glypican 1 network |
| 0.0 | 1.0 | SIG PIP3 SIGNALING IN B LYMPHOCYTES | Genes related to PIP3 signaling in B lymphocytes |
| 0.0 | 0.2 | SA G2 AND M PHASES | Cdc25 activates the cdc2/cyclin B complex to induce the G2/M transition. |
| 0.0 | 0.2 | PID KIT PATHWAY | Signaling events mediated by Stem cell factor receptor (c-Kit) |
| 0.0 | 1.0 | PID AJDISS 2PATHWAY | Posttranslational regulation of adherens junction stability and dissassembly |
| 0.0 | 0.7 | PID BMP PATHWAY | BMP receptor signaling |
| 0.0 | 0.3 | PID EPHA FWDPATHWAY | EPHA forward signaling |
| 0.0 | 0.5 | PID NETRIN PATHWAY | Netrin-mediated signaling events |
| 0.0 | 0.8 | PID AURORA A PATHWAY | Aurora A signaling |
| 0.0 | 0.2 | PID DELTA NP63 PATHWAY | Validated transcriptional targets of deltaNp63 isoforms |
| 0.0 | 0.2 | PID FOXM1 PATHWAY | FOXM1 transcription factor network |
| 0.0 | 0.9 | PID ECADHERIN NASCENT AJ PATHWAY | E-cadherin signaling in the nascent adherens junction |
| 0.0 | 0.6 | PID HDAC CLASSII PATHWAY | Signaling events mediated by HDAC Class II |
| 0.0 | 0.3 | PID AR NONGENOMIC PATHWAY | Nongenotropic Androgen signaling |
| 0.0 | 0.3 | PID SMAD2 3PATHWAY | Regulation of cytoplasmic and nuclear SMAD2/3 signaling |
| 0.0 | 0.3 | PID HDAC CLASSIII PATHWAY | Signaling events mediated by HDAC Class III |
| 0.0 | 0.3 | PID HEDGEHOG 2PATHWAY | Signaling events mediated by the Hedgehog family |
| 0.0 | 0.7 | PID TRKR PATHWAY | Neurotrophic factor-mediated Trk receptor signaling |
| 0.0 | 0.2 | PID IL1 PATHWAY | IL1-mediated signaling events |
| 0.0 | 0.1 | PID CONE PATHWAY | Visual signal transduction: Cones |
| 0.0 | 0.2 | ST WNT BETA CATENIN PATHWAY | Wnt/beta-catenin Pathway |
| 0.0 | 0.5 | PID ATF2 PATHWAY | ATF-2 transcription factor network |
| 0.0 | 0.5 | PID PLK1 PATHWAY | PLK1 signaling events |