Project
ENCODE cell lines, expression (Ernst 2011)
Navigation
Downloads
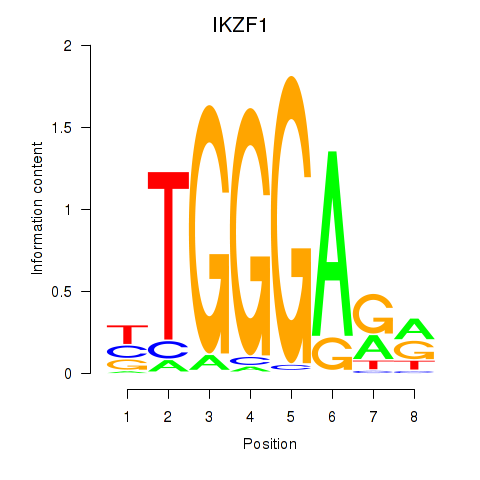
Results for IKZF1
Z-value: 2.26
Motif logo
Transcription factors associated with IKZF1
| Gene Symbol | Gene ID | Gene Info |
|---|---|---|
|
IKZF1
|
ENSG00000185811.12 | IKZF1 |
Activity-expression correlation:
| Gene | Promoter | Pearson corr. coef. | P-value | Plot |
|---|---|---|---|---|
| IKZF1 | hg19_v2_chr7_+_50344289_50344378 | -0.84 | 4.1e-05 | Click! |
Activity profile of IKZF1 motif
Sorted Z-values of IKZF1 motif
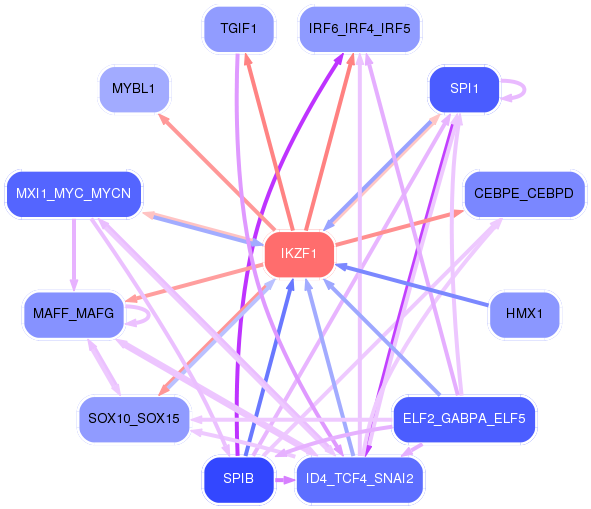
Network of associatons between targets according to the STRING database.

First level regulatory network of IKZF1
| Promoter | Score | Transcript | Gene | Gene Info |
|---|---|---|---|---|
| chr1_+_35247859 | 6.08 |
ENST00000373362.3 |
GJB3 |
gap junction protein, beta 3, 31kDa |
| chr15_+_63334831 | 5.13 |
ENST00000288398.6 ENST00000358278.3 ENST00000560445.1 ENST00000403994.3 ENST00000357980.4 ENST00000559556.1 ENST00000559397.1 ENST00000267996.7 ENST00000560970.1 |
TPM1 |
tropomyosin 1 (alpha) |
| chr1_-_153538292 | 4.98 |
ENST00000497140.1 ENST00000368708.3 |
S100A2 |
S100 calcium binding protein A2 |
| chr1_-_153538011 | 4.89 |
ENST00000368707.4 |
S100A2 |
S100 calcium binding protein A2 |
| chr16_+_56716336 | 4.81 |
ENST00000394485.4 ENST00000562939.1 |
MT1X |
metallothionein 1X |
| chr3_-_149095652 | 4.79 |
ENST00000305366.3 |
TM4SF1 |
transmembrane 4 L six family member 1 |
| chr19_-_51456321 | 4.66 |
ENST00000391809.2 |
KLK5 |
kallikrein-related peptidase 5 |
| chr19_-_51456344 | 4.62 |
ENST00000336334.3 ENST00000593428.1 |
KLK5 |
kallikrein-related peptidase 5 |
| chr1_-_153599732 | 4.44 |
ENST00000392623.1 |
S100A13 |
S100 calcium binding protein A13 |
| chr17_-_39928106 | 4.43 |
ENST00000540235.1 |
JUP |
junction plakoglobin |
| chr17_-_76975925 | 4.14 |
ENST00000591274.1 ENST00000589906.1 ENST00000591778.1 ENST00000589775.2 ENST00000585407.1 ENST00000262776.3 |
LGALS3BP |
lectin, galactoside-binding, soluble, 3 binding protein |
| chr1_-_153600656 | 4.05 |
ENST00000339556.4 ENST00000440685.2 |
S100A13 |
S100 calcium binding protein A13 |
| chr1_-_20812690 | 3.98 |
ENST00000375078.3 |
CAMK2N1 |
calcium/calmodulin-dependent protein kinase II inhibitor 1 |
| chr2_-_56150184 | 3.94 |
ENST00000394554.1 |
EFEMP1 |
EGF containing fibulin-like extracellular matrix protein 1 |
| chr5_+_135364584 | 3.86 |
ENST00000442011.2 ENST00000305126.8 |
TGFBI |
transforming growth factor, beta-induced, 68kDa |
| chr19_-_51456198 | 3.82 |
ENST00000594846.1 |
KLK5 |
kallikrein-related peptidase 5 |
| chr6_+_83073952 | 3.82 |
ENST00000543496.1 |
TPBG |
trophoblast glycoprotein |
| chr16_+_56642041 | 3.81 |
ENST00000245185.5 |
MT2A |
metallothionein 2A |
| chr22_+_31488433 | 3.75 |
ENST00000455608.1 |
SMTN |
smoothelin |
| chr12_+_53491220 | 3.64 |
ENST00000548547.1 ENST00000301464.3 |
IGFBP6 |
insulin-like growth factor binding protein 6 |
| chr4_-_187644930 | 3.56 |
ENST00000441802.2 |
FAT1 |
FAT atypical cadherin 1 |
| chr12_+_13349650 | 3.54 |
ENST00000256951.5 ENST00000431267.2 ENST00000542474.1 ENST00000544053.1 |
EMP1 |
epithelial membrane protein 1 |
| chr1_-_153599426 | 3.54 |
ENST00000392622.1 |
S100A13 |
S100 calcium binding protein A13 |
| chr5_+_52776449 | 3.52 |
ENST00000396947.3 |
FST |
follistatin |
| chr16_-_28550348 | 3.45 |
ENST00000324873.6 |
NUPR1 |
nuclear protein, transcriptional regulator, 1 |
| chr12_-_52911718 | 3.43 |
ENST00000548409.1 |
KRT5 |
keratin 5 |
| chr4_+_169552748 | 3.40 |
ENST00000504519.1 ENST00000512127.1 |
PALLD |
palladin, cytoskeletal associated protein |
| chr11_-_2950642 | 3.37 |
ENST00000314222.4 |
PHLDA2 |
pleckstrin homology-like domain, family A, member 2 |
| chr1_-_152009460 | 3.34 |
ENST00000271638.2 |
S100A11 |
S100 calcium binding protein A11 |
| chr15_+_63340647 | 3.29 |
ENST00000404484.4 |
TPM1 |
tropomyosin 1 (alpha) |
| chr12_-_8814669 | 3.27 |
ENST00000535411.1 ENST00000540087.1 |
MFAP5 |
microfibrillar associated protein 5 |
| chr10_-_95242044 | 3.26 |
ENST00000371501.4 ENST00000371502.4 ENST00000371489.1 |
MYOF |
myoferlin |
| chr19_-_51487282 | 3.20 |
ENST00000595820.1 ENST00000597707.1 ENST00000336317.4 |
KLK7 |
kallikrein-related peptidase 7 |
| chr1_+_153004800 | 3.14 |
ENST00000392661.3 |
SPRR1B |
small proline-rich protein 1B |
| chr1_-_17307173 | 3.12 |
ENST00000438542.1 ENST00000375535.3 |
MFAP2 |
microfibrillar-associated protein 2 |
| chr15_+_63340775 | 3.12 |
ENST00000559281.1 ENST00000317516.7 |
TPM1 |
tropomyosin 1 (alpha) |
| chr7_+_32996997 | 3.11 |
ENST00000242209.4 ENST00000538336.1 ENST00000538443.1 |
FKBP9 |
FK506 binding protein 9, 63 kDa |
| chr7_+_116166331 | 3.09 |
ENST00000393468.1 ENST00000393467.1 |
CAV1 |
caveolin 1, caveolae protein, 22kDa |
| chr2_-_227664474 | 3.08 |
ENST00000305123.5 |
IRS1 |
insulin receptor substrate 1 |
| chr16_-_28550320 | 3.07 |
ENST00000395641.2 |
NUPR1 |
nuclear protein, transcriptional regulator, 1 |
| chr15_+_63340858 | 3.05 |
ENST00000560615.1 |
TPM1 |
tropomyosin 1 (alpha) |
| chrX_+_102631844 | 3.03 |
ENST00000372634.1 ENST00000299872.7 |
NGFRAP1 |
nerve growth factor receptor (TNFRSF16) associated protein 1 |
| chr19_-_19051103 | 3.03 |
ENST00000542541.2 ENST00000433218.2 |
HOMER3 |
homer homolog 3 (Drosophila) |
| chr14_-_105444694 | 3.01 |
ENST00000333244.5 |
AHNAK2 |
AHNAK nucleoprotein 2 |
| chr3_-_123411191 | 2.94 |
ENST00000354792.5 ENST00000508240.1 |
MYLK |
myosin light chain kinase |
| chr16_+_56703737 | 2.93 |
ENST00000569155.1 |
MT1H |
metallothionein 1H |
| chr18_+_61420169 | 2.89 |
ENST00000425392.1 ENST00000336429.2 |
SERPINB7 |
serpin peptidase inhibitor, clade B (ovalbumin), member 7 |
| chr19_+_48281803 | 2.86 |
ENST00000601048.1 |
SEPW1 |
selenoprotein W, 1 |
| chr12_-_53012343 | 2.83 |
ENST00000305748.3 |
KRT73 |
keratin 73 |
| chr2_-_106054952 | 2.83 |
ENST00000336660.5 ENST00000393352.3 ENST00000607522.1 |
FHL2 |
four and a half LIM domains 2 |
| chr11_-_12030629 | 2.82 |
ENST00000396505.2 |
DKK3 |
dickkopf WNT signaling pathway inhibitor 3 |
| chr10_-_126849588 | 2.82 |
ENST00000411419.2 |
CTBP2 |
C-terminal binding protein 2 |
| chr10_-_95241951 | 2.81 |
ENST00000358334.5 ENST00000359263.4 ENST00000371488.3 |
MYOF |
myoferlin |
| chr1_-_209979375 | 2.81 |
ENST00000367021.3 |
IRF6 |
interferon regulatory factor 6 |
| chr11_+_69455855 | 2.76 |
ENST00000227507.2 ENST00000536559.1 |
CCND1 |
cyclin D1 |
| chr15_+_63340734 | 2.75 |
ENST00000560959.1 |
TPM1 |
tropomyosin 1 (alpha) |
| chr18_+_3451584 | 2.75 |
ENST00000551541.1 |
TGIF1 |
TGFB-induced factor homeobox 1 |
| chr1_-_153517473 | 2.74 |
ENST00000368715.1 |
S100A4 |
S100 calcium binding protein A4 |
| chr18_+_21452804 | 2.72 |
ENST00000269217.6 |
LAMA3 |
laminin, alpha 3 |
| chr12_-_52845910 | 2.69 |
ENST00000252252.3 |
KRT6B |
keratin 6B |
| chr2_-_161350305 | 2.68 |
ENST00000348849.3 |
RBMS1 |
RNA binding motif, single stranded interacting protein 1 |
| chr3_-_145878954 | 2.66 |
ENST00000282903.5 ENST00000360060.3 |
PLOD2 |
procollagen-lysine, 2-oxoglutarate 5-dioxygenase 2 |
| chr7_+_100770328 | 2.65 |
ENST00000223095.4 ENST00000445463.2 |
SERPINE1 |
serpin peptidase inhibitor, clade E (nexin, plasminogen activator inhibitor type 1), member 1 |
| chr2_-_161349909 | 2.65 |
ENST00000392753.3 |
RBMS1 |
RNA binding motif, single stranded interacting protein 1 |
| chr12_-_47473425 | 2.65 |
ENST00000550413.1 |
AMIGO2 |
adhesion molecule with Ig-like domain 2 |
| chr10_+_47746929 | 2.64 |
ENST00000340243.6 ENST00000374277.5 ENST00000449464.2 ENST00000538825.1 ENST00000335083.5 |
ANXA8L2 AL603965.1 |
annexin A8-like 2 Protein LOC100996760 |
| chr12_+_6309517 | 2.64 |
ENST00000382519.4 ENST00000009180.4 |
CD9 |
CD9 molecule |
| chr12_-_102455846 | 2.64 |
ENST00000545679.1 |
CCDC53 |
coiled-coil domain containing 53 |
| chr1_-_209824643 | 2.63 |
ENST00000391911.1 ENST00000415782.1 |
LAMB3 |
laminin, beta 3 |
| chr19_+_48281842 | 2.62 |
ENST00000509570.2 |
SEPW1 |
selenoprotein W, 1 |
| chr1_-_95007193 | 2.62 |
ENST00000370207.4 ENST00000334047.7 |
F3 |
coagulation factor III (thromboplastin, tissue factor) |
| chr19_+_35609380 | 2.60 |
ENST00000604621.1 |
FXYD3 |
FXYD domain containing ion transport regulator 3 |
| chr11_+_114166536 | 2.58 |
ENST00000299964.3 |
NNMT |
nicotinamide N-methyltransferase |
| chr16_+_56703703 | 2.58 |
ENST00000332374.4 |
MT1H |
metallothionein 1H |
| chrX_+_102631248 | 2.57 |
ENST00000361298.4 ENST00000372645.3 ENST00000372635.1 |
NGFRAP1 |
nerve growth factor receptor (TNFRSF16) associated protein 1 |
| chr19_-_45908292 | 2.55 |
ENST00000360957.5 ENST00000592134.1 |
PPP1R13L |
protein phosphatase 1, regulatory subunit 13 like |
| chr3_-_149688655 | 2.55 |
ENST00000461930.1 ENST00000423691.2 ENST00000490975.1 ENST00000461868.1 ENST00000452853.2 |
PFN2 |
profilin 2 |
| chr16_+_56598961 | 2.53 |
ENST00000219162.3 |
MT4 |
metallothionein 4 |
| chr15_+_63335899 | 2.52 |
ENST00000561266.1 |
TPM1 |
tropomyosin 1 (alpha) |
| chr2_-_235405679 | 2.49 |
ENST00000390645.2 |
ARL4C |
ADP-ribosylation factor-like 4C |
| chr12_-_77272765 | 2.49 |
ENST00000547435.1 ENST00000552330.1 ENST00000546966.1 ENST00000311083.5 |
CSRP2 |
cysteine and glycine-rich protein 2 |
| chr1_-_209825674 | 2.48 |
ENST00000367030.3 ENST00000356082.4 |
LAMB3 |
laminin, beta 3 |
| chr7_-_93519471 | 2.47 |
ENST00000451238.1 |
TFPI2 |
tissue factor pathway inhibitor 2 |
| chr22_+_43547937 | 2.46 |
ENST00000329563.4 |
TSPO |
translocator protein (18kDa) |
| chr10_-_126716459 | 2.45 |
ENST00000309035.6 |
CTBP2 |
C-terminal binding protein 2 |
| chr11_+_86511569 | 2.44 |
ENST00000441050.1 |
PRSS23 |
protease, serine, 23 |
| chr2_-_56150910 | 2.42 |
ENST00000424836.2 ENST00000438672.1 ENST00000440439.1 ENST00000429909.1 ENST00000424207.1 ENST00000452337.1 ENST00000355426.3 ENST00000439193.1 ENST00000421664.1 |
EFEMP1 |
EGF containing fibulin-like extracellular matrix protein 1 |
| chr4_-_15939963 | 2.42 |
ENST00000259988.2 |
FGFBP1 |
fibroblast growth factor binding protein 1 |
| chr14_-_69446034 | 2.41 |
ENST00000193403.6 |
ACTN1 |
actinin, alpha 1 |
| chr1_-_94050668 | 2.37 |
ENST00000539242.1 |
BCAR3 |
breast cancer anti-estrogen resistance 3 |
| chr16_+_56672571 | 2.36 |
ENST00000290705.8 |
MT1A |
metallothionein 1A |
| chr12_-_8815299 | 2.36 |
ENST00000535336.1 |
MFAP5 |
microfibrillar associated protein 5 |
| chr2_+_192110199 | 2.32 |
ENST00000304164.4 |
MYO1B |
myosin IB |
| chr19_-_19051927 | 2.32 |
ENST00000600077.1 |
HOMER3 |
homer homolog 3 (Drosophila) |
| chr8_-_48651648 | 2.32 |
ENST00000408965.3 |
CEBPD |
CCAAT/enhancer binding protein (C/EBP), delta |
| chr4_+_75310851 | 2.32 |
ENST00000395748.3 ENST00000264487.2 |
AREG |
amphiregulin |
| chr1_-_95391315 | 2.31 |
ENST00000545882.1 ENST00000415017.1 |
CNN3 |
calponin 3, acidic |
| chrX_-_51239425 | 2.31 |
ENST00000375992.3 |
NUDT11 |
nudix (nucleoside diphosphate linked moiety X)-type motif 11 |
| chr1_-_153508460 | 2.31 |
ENST00000462776.2 |
S100A6 |
S100 calcium binding protein A6 |
| chr18_+_61554932 | 2.30 |
ENST00000299502.4 ENST00000457692.1 ENST00000413956.1 |
SERPINB2 |
serpin peptidase inhibitor, clade B (ovalbumin), member 2 |
| chr12_+_79258444 | 2.29 |
ENST00000261205.4 |
SYT1 |
synaptotagmin I |
| chr7_+_79764104 | 2.29 |
ENST00000351004.3 |
GNAI1 |
guanine nucleotide binding protein (G protein), alpha inhibiting activity polypeptide 1 |
| chr3_-_111314230 | 2.28 |
ENST00000317012.4 |
ZBED2 |
zinc finger, BED-type containing 2 |
| chr8_+_95653373 | 2.27 |
ENST00000358397.5 |
ESRP1 |
epithelial splicing regulatory protein 1 |
| chr4_-_99578789 | 2.25 |
ENST00000511651.1 ENST00000505184.1 |
TSPAN5 |
tetraspanin 5 |
| chr11_+_69931519 | 2.25 |
ENST00000316296.5 ENST00000530676.1 |
ANO1 |
anoctamin 1, calcium activated chloride channel |
| chr1_+_20915409 | 2.24 |
ENST00000375071.3 |
CDA |
cytidine deaminase |
| chr11_-_35547151 | 2.24 |
ENST00000378878.3 ENST00000529303.1 ENST00000278360.3 |
PAMR1 |
peptidase domain containing associated with muscle regeneration 1 |
| chr3_-_120170052 | 2.23 |
ENST00000295633.3 |
FSTL1 |
follistatin-like 1 |
| chr4_+_169418195 | 2.22 |
ENST00000261509.6 ENST00000335742.7 |
PALLD |
palladin, cytoskeletal associated protein |
| chr16_+_56659687 | 2.21 |
ENST00000568293.1 ENST00000330439.6 |
MT1E |
metallothionein 1E |
| chr11_+_35198118 | 2.20 |
ENST00000525211.1 ENST00000526000.1 ENST00000279452.6 ENST00000527889.1 |
CD44 |
CD44 molecule (Indian blood group) |
| chr3_+_37903432 | 2.19 |
ENST00000443503.2 |
CTDSPL |
CTD (carboxy-terminal domain, RNA polymerase II, polypeptide A) small phosphatase-like |
| chr12_-_102455902 | 2.19 |
ENST00000240079.6 |
CCDC53 |
coiled-coil domain containing 53 |
| chr16_+_68679193 | 2.19 |
ENST00000581171.1 |
CDH3 |
cadherin 3, type 1, P-cadherin (placental) |
| chr8_-_145018905 | 2.19 |
ENST00000398774.2 |
PLEC |
plectin |
| chr7_+_116139424 | 2.17 |
ENST00000222693.4 |
CAV2 |
caveolin 2 |
| chr5_-_131562935 | 2.16 |
ENST00000379104.2 ENST00000379100.2 ENST00000428369.1 |
P4HA2 |
prolyl 4-hydroxylase, alpha polypeptide II |
| chr17_+_48609903 | 2.15 |
ENST00000268933.3 |
EPN3 |
epsin 3 |
| chr16_-_4987065 | 2.15 |
ENST00000590782.2 ENST00000345988.2 |
PPL |
periplakin |
| chr3_-_134093395 | 2.14 |
ENST00000249883.5 |
AMOTL2 |
angiomotin like 2 |
| chr8_+_22438009 | 2.10 |
ENST00000409417.1 |
PDLIM2 |
PDZ and LIM domain 2 (mystique) |
| chr16_+_56691911 | 2.10 |
ENST00000568475.1 |
MT1F |
metallothionein 1F |
| chr6_+_83073334 | 2.09 |
ENST00000369750.3 |
TPBG |
trophoblast glycoprotein |
| chr18_+_21452964 | 2.09 |
ENST00000587184.1 |
LAMA3 |
laminin, alpha 3 |
| chr12_+_6309963 | 2.09 |
ENST00000382515.2 |
CD9 |
CD9 molecule |
| chr22_-_43042968 | 2.08 |
ENST00000407623.3 ENST00000396303.3 ENST00000438270.1 |
CYB5R3 |
cytochrome b5 reductase 3 |
| chr10_-_47173994 | 2.07 |
ENST00000414655.2 ENST00000545298.1 ENST00000359178.4 ENST00000358140.4 ENST00000503031.1 |
ANXA8L1 LINC00842 |
annexin A8-like 1 long intergenic non-protein coding RNA 842 |
| chr19_+_48216600 | 2.07 |
ENST00000263277.3 ENST00000538399.1 |
EHD2 |
EH-domain containing 2 |
| chr11_+_114168085 | 2.07 |
ENST00000541754.1 |
NNMT |
nicotinamide N-methyltransferase |
| chr3_-_185542761 | 2.06 |
ENST00000457616.2 ENST00000346192.3 |
IGF2BP2 |
insulin-like growth factor 2 mRNA binding protein 2 |
| chr2_-_106015527 | 2.06 |
ENST00000344213.4 ENST00000358129.4 |
FHL2 |
four and a half LIM domains 2 |
| chr17_+_17082842 | 2.05 |
ENST00000579361.1 |
MPRIP |
myosin phosphatase Rho interacting protein |
| chr17_-_7493390 | 2.03 |
ENST00000538513.2 ENST00000570788.1 ENST00000250055.2 |
SOX15 |
SRY (sex determining region Y)-box 15 |
| chr3_-_185542817 | 2.03 |
ENST00000382199.2 |
IGF2BP2 |
insulin-like growth factor 2 mRNA binding protein 2 |
| chr18_+_3451646 | 2.03 |
ENST00000345133.5 ENST00000330513.5 ENST00000549546.1 |
TGIF1 |
TGFB-induced factor homeobox 1 |
| chr19_+_35606692 | 2.02 |
ENST00000406242.3 ENST00000454903.2 |
FXYD3 |
FXYD domain containing ion transport regulator 3 |
| chr8_-_67525473 | 1.97 |
ENST00000522677.3 |
MYBL1 |
v-myb avian myeloblastosis viral oncogene homolog-like 1 |
| chr4_+_74735102 | 1.97 |
ENST00000395761.3 |
CXCL1 |
chemokine (C-X-C motif) ligand 1 (melanoma growth stimulating activity, alpha) |
| chr12_-_53009116 | 1.96 |
ENST00000552855.1 |
KRT73 |
keratin 73 |
| chr5_-_131563501 | 1.94 |
ENST00000401867.1 ENST00000379086.1 ENST00000418055.1 ENST00000453286.1 ENST00000166534.4 |
P4HA2 |
prolyl 4-hydroxylase, alpha polypeptide II |
| chr11_-_119993979 | 1.93 |
ENST00000524816.3 ENST00000525327.1 |
TRIM29 |
tripartite motif containing 29 |
| chr19_+_35606777 | 1.93 |
ENST00000604404.1 ENST00000435734.2 ENST00000603181.1 |
FXYD3 |
FXYD domain containing ion transport regulator 3 |
| chr4_-_143767428 | 1.92 |
ENST00000513000.1 ENST00000509777.1 ENST00000503927.1 |
INPP4B |
inositol polyphosphate-4-phosphatase, type II, 105kDa |
| chr14_-_69445968 | 1.92 |
ENST00000438964.2 |
ACTN1 |
actinin, alpha 1 |
| chr11_+_844067 | 1.91 |
ENST00000397406.1 ENST00000409543.2 ENST00000525201.1 |
TSPAN4 |
tetraspanin 4 |
| chr10_-_126849068 | 1.91 |
ENST00000494626.2 ENST00000337195.5 |
CTBP2 |
C-terminal binding protein 2 |
| chr2_+_235860616 | 1.91 |
ENST00000392011.2 |
SH3BP4 |
SH3-domain binding protein 4 |
| chr7_-_47579188 | 1.90 |
ENST00000398879.1 ENST00000355730.3 ENST00000442536.2 ENST00000458317.2 |
TNS3 |
tensin 3 |
| chr12_+_79258547 | 1.89 |
ENST00000457153.2 |
SYT1 |
synaptotagmin I |
| chr14_-_67859422 | 1.89 |
ENST00000556532.1 |
PLEK2 |
pleckstrin 2 |
| chr16_+_56642489 | 1.88 |
ENST00000561491.1 |
MT2A |
metallothionein 2A |
| chr8_+_22446763 | 1.88 |
ENST00000450780.2 ENST00000430850.2 ENST00000447849.1 |
AC037459.4 |
Uncharacterized protein |
| chr5_+_96211643 | 1.87 |
ENST00000437043.3 ENST00000510373.1 |
ERAP2 |
endoplasmic reticulum aminopeptidase 2 |
| chrX_-_10557949 | 1.87 |
ENST00000380780.1 |
MID1 |
midline 1 (Opitz/BBB syndrome) |
| chr10_+_54074033 | 1.86 |
ENST00000373970.3 |
DKK1 |
dickkopf WNT signaling pathway inhibitor 1 |
| chr9_-_130637244 | 1.86 |
ENST00000373156.1 |
AK1 |
adenylate kinase 1 |
| chr3_+_159557637 | 1.84 |
ENST00000445224.2 |
SCHIP1 |
schwannomin interacting protein 1 |
| chr15_+_74218787 | 1.84 |
ENST00000261921.7 |
LOXL1 |
lysyl oxidase-like 1 |
| chr15_+_71184931 | 1.84 |
ENST00000560369.1 ENST00000260382.5 |
LRRC49 |
leucine rich repeat containing 49 |
| chr16_+_56691606 | 1.84 |
ENST00000334350.6 |
MT1F |
metallothionein 1F |
| chr17_-_39743139 | 1.83 |
ENST00000167586.6 |
KRT14 |
keratin 14 |
| chr19_-_51522955 | 1.83 |
ENST00000358789.3 |
KLK10 |
kallikrein-related peptidase 10 |
| chr8_+_95653302 | 1.82 |
ENST00000423620.2 ENST00000433389.2 |
ESRP1 |
epithelial splicing regulatory protein 1 |
| chr5_-_175843569 | 1.82 |
ENST00000310418.4 ENST00000345807.2 |
CLTB |
clathrin, light chain B |
| chr19_-_44160768 | 1.81 |
ENST00000593447.1 |
PLAUR |
plasminogen activator, urokinase receptor |
| chr11_+_133938820 | 1.81 |
ENST00000299106.4 ENST00000529443.2 |
JAM3 |
junctional adhesion molecule 3 |
| chr7_+_48128194 | 1.81 |
ENST00000416681.1 ENST00000331803.4 ENST00000432131.1 |
UPP1 |
uridine phosphorylase 1 |
| chr4_-_143481822 | 1.80 |
ENST00000510812.1 |
INPP4B |
inositol polyphosphate-4-phosphatase, type II, 105kDa |
| chr8_-_23261589 | 1.79 |
ENST00000524168.1 ENST00000523833.2 ENST00000519243.1 ENST00000389131.3 |
LOXL2 |
lysyl oxidase-like 2 |
| chr18_+_61143994 | 1.79 |
ENST00000382771.4 |
SERPINB5 |
serpin peptidase inhibitor, clade B (ovalbumin), member 5 |
| chr4_+_169418255 | 1.79 |
ENST00000505667.1 ENST00000511948.1 |
PALLD |
palladin, cytoskeletal associated protein |
| chr22_+_43547520 | 1.79 |
ENST00000337554.3 ENST00000396265.3 ENST00000583777.1 |
TSPO |
translocator protein (18kDa) |
| chr8_+_22436248 | 1.79 |
ENST00000308354.7 |
PDLIM2 |
PDZ and LIM domain 2 (mystique) |
| chr11_-_102668879 | 1.78 |
ENST00000315274.6 |
MMP1 |
matrix metallopeptidase 1 (interstitial collagenase) |
| chr1_+_223900034 | 1.78 |
ENST00000295006.5 |
CAPN2 |
calpain 2, (m/II) large subunit |
| chr6_-_110500905 | 1.78 |
ENST00000392587.2 |
WASF1 |
WAS protein family, member 1 |
| chr11_+_114168773 | 1.77 |
ENST00000542647.1 ENST00000545255.1 |
NNMT |
nicotinamide N-methyltransferase |
| chr9_+_132962843 | 1.77 |
ENST00000458469.1 |
NCS1 |
neuronal calcium sensor 1 |
| chr20_+_4666882 | 1.77 |
ENST00000379440.4 ENST00000430350.2 |
PRNP |
prion protein |
| chr3_+_100211412 | 1.77 |
ENST00000323523.4 ENST00000403410.1 ENST00000449609.1 |
TMEM45A |
transmembrane protein 45A |
| chr19_+_35607166 | 1.76 |
ENST00000604255.1 ENST00000346446.5 ENST00000344013.6 ENST00000603449.1 ENST00000406988.1 ENST00000605550.1 ENST00000604804.1 ENST00000605552.1 |
FXYD3 |
FXYD domain containing ion transport regulator 3 |
| chr12_-_13153139 | 1.76 |
ENST00000536942.1 ENST00000014930.4 |
HEBP1 |
heme binding protein 1 |
| chr16_+_31483451 | 1.75 |
ENST00000565360.1 ENST00000361773.3 |
TGFB1I1 |
transforming growth factor beta 1 induced transcript 1 |
| chr5_+_52776228 | 1.75 |
ENST00000256759.3 |
FST |
follistatin |
| chr16_-_10652993 | 1.74 |
ENST00000536829.1 |
EMP2 |
epithelial membrane protein 2 |
| chr3_+_154797428 | 1.74 |
ENST00000460393.1 |
MME |
membrane metallo-endopeptidase |
| chr11_+_133938955 | 1.73 |
ENST00000534549.1 ENST00000441717.3 |
JAM3 |
junctional adhesion molecule 3 |
| chr20_-_56286479 | 1.73 |
ENST00000265626.4 |
PMEPA1 |
prostate transmembrane protein, androgen induced 1 |
| chr22_+_43547877 | 1.72 |
ENST00000428336.1 |
TSPO |
translocator protein (18kDa) |
| chr22_+_38609538 | 1.72 |
ENST00000407965.1 |
MAFF |
v-maf avian musculoaponeurotic fibrosarcoma oncogene homolog F |
| chr9_-_113761720 | 1.72 |
ENST00000541779.1 ENST00000374430.2 |
LPAR1 |
lysophosphatidic acid receptor 1 |
| chr8_-_145028013 | 1.72 |
ENST00000354958.2 |
PLEC |
plectin |
| chr20_-_43883197 | 1.71 |
ENST00000338380.2 |
SLPI |
secretory leukocyte peptidase inhibitor |
| chr6_-_3752222 | 1.71 |
ENST00000380283.4 |
PXDC1 |
PX domain containing 1 |
| chr7_+_48128316 | 1.70 |
ENST00000341253.4 |
UPP1 |
uridine phosphorylase 1 |
| chr11_+_117073850 | 1.69 |
ENST00000529622.1 |
TAGLN |
transgelin |
| chr19_+_41725088 | 1.69 |
ENST00000301178.4 |
AXL |
AXL receptor tyrosine kinase |
| chr14_-_75079026 | 1.69 |
ENST00000261978.4 |
LTBP2 |
latent transforming growth factor beta binding protein 2 |
| chr16_+_56691838 | 1.69 |
ENST00000394501.2 |
MT1F |
metallothionein 1F |
Gene Ontology Analysis
Gene overrepresentation in cellular_component category:
| Log-likelihood per target | Total log-likelihood | Term | Description |
|---|---|---|---|
| 2.5 | 17.4 | GO:0097209 | epidermal lamellar body(GO:0097209) |
| 1.5 | 12.2 | GO:0005610 | laminin-5 complex(GO:0005610) |
| 1.4 | 27.0 | GO:0005862 | muscle thin filament tropomyosin(GO:0005862) |
| 1.1 | 3.2 | GO:0005607 | laminin-2 complex(GO:0005607) |
| 0.9 | 14.0 | GO:0005916 | fascia adherens(GO:0005916) |
| 0.9 | 4.4 | GO:0060201 | clathrin-sculpted acetylcholine transport vesicle(GO:0060200) clathrin-sculpted acetylcholine transport vesicle membrane(GO:0060201) |
| 0.8 | 0.8 | GO:0034666 | integrin alpha2-beta1 complex(GO:0034666) |
| 0.8 | 2.4 | GO:0034676 | integrin alpha6-beta4 complex(GO:0034676) |
| 0.7 | 4.3 | GO:0070435 | Shc-EGFR complex(GO:0070435) |
| 0.7 | 9.2 | GO:0097470 | ribbon synapse(GO:0097470) |
| 0.7 | 15.3 | GO:0001527 | microfibril(GO:0001527) fibril(GO:0043205) |
| 0.7 | 4.8 | GO:0035692 | macrophage migration inhibitory factor receptor complex(GO:0035692) |
| 0.7 | 2.0 | GO:0005588 | collagen type V trimer(GO:0005588) |
| 0.6 | 3.1 | GO:0005899 | insulin receptor complex(GO:0005899) |
| 0.6 | 9.0 | GO:0030478 | actin cap(GO:0030478) |
| 0.6 | 1.8 | GO:0043260 | laminin-11 complex(GO:0043260) |
| 0.6 | 2.3 | GO:0045160 | myosin I complex(GO:0045160) |
| 0.6 | 2.8 | GO:0032449 | CBM complex(GO:0032449) |
| 0.5 | 6.5 | GO:0033010 | paranodal junction(GO:0033010) |
| 0.5 | 9.7 | GO:0031089 | platelet dense granule lumen(GO:0031089) |
| 0.5 | 1.6 | GO:0002081 | outer acrosomal membrane(GO:0002081) |
| 0.5 | 2.7 | GO:0097123 | cyclin A1-CDK2 complex(GO:0097123) |
| 0.5 | 4.2 | GO:0005587 | collagen type IV trimer(GO:0005587) |
| 0.5 | 4.6 | GO:0097487 | multivesicular body, internal vesicle(GO:0097487) |
| 0.5 | 9.3 | GO:0030056 | hemidesmosome(GO:0030056) |
| 0.5 | 3.1 | GO:0070821 | tertiary granule membrane(GO:0070821) |
| 0.5 | 3.5 | GO:0000110 | nucleotide-excision repair factor 1 complex(GO:0000110) |
| 0.5 | 11.5 | GO:0031233 | intrinsic component of external side of plasma membrane(GO:0031233) |
| 0.5 | 1.5 | GO:0034680 | integrin alpha10-beta1 complex(GO:0034680) |
| 0.5 | 1.9 | GO:0070369 | beta-catenin-TCF7L2 complex(GO:0070369) catenin-TCF7L2 complex(GO:0071664) |
| 0.5 | 7.6 | GO:0005922 | connexon complex(GO:0005922) |
| 0.5 | 4.2 | GO:0071438 | invadopodium membrane(GO:0071438) |
| 0.4 | 4.4 | GO:0016942 | insulin-like growth factor binding protein complex(GO:0016942) growth factor complex(GO:0036454) |
| 0.4 | 1.8 | GO:0036449 | microtubule minus-end(GO:0036449) |
| 0.4 | 1.3 | GO:0036195 | muscle cell projection(GO:0036194) muscle cell projection membrane(GO:0036195) |
| 0.4 | 3.4 | GO:0016012 | sarcoglycan complex(GO:0016012) |
| 0.4 | 0.8 | GO:0048237 | rough endoplasmic reticulum lumen(GO:0048237) |
| 0.4 | 4.4 | GO:0097512 | cardiac myofibril(GO:0097512) |
| 0.4 | 2.0 | GO:0031905 | early endosome lumen(GO:0031905) |
| 0.4 | 1.1 | GO:0035579 | specific granule membrane(GO:0035579) |
| 0.4 | 8.8 | GO:0005861 | troponin complex(GO:0005861) |
| 0.4 | 2.9 | GO:0097169 | AIM2 inflammasome complex(GO:0097169) |
| 0.4 | 1.1 | GO:0016938 | kinesin I complex(GO:0016938) |
| 0.4 | 15.8 | GO:0045095 | keratin filament(GO:0045095) |
| 0.4 | 1.8 | GO:0036128 | CatSper complex(GO:0036128) |
| 0.3 | 4.8 | GO:0005589 | collagen type VI trimer(GO:0005589) collagen beaded filament(GO:0098647) |
| 0.3 | 3.4 | GO:0042612 | MHC class I protein complex(GO:0042612) |
| 0.3 | 3.8 | GO:0097443 | sorting endosome(GO:0097443) |
| 0.3 | 3.7 | GO:0035985 | senescence-associated heterochromatin focus(GO:0035985) |
| 0.3 | 2.7 | GO:0005593 | FACIT collagen trimer(GO:0005593) |
| 0.3 | 1.7 | GO:0071148 | TEAD-1-YAP complex(GO:0071148) |
| 0.3 | 2.7 | GO:0000235 | astral microtubule(GO:0000235) aster(GO:0005818) |
| 0.3 | 8.9 | GO:0031258 | lamellipodium membrane(GO:0031258) |
| 0.3 | 15.8 | GO:0001533 | cornified envelope(GO:0001533) |
| 0.3 | 0.3 | GO:0098592 | cytoplasmic side of apical plasma membrane(GO:0098592) |
| 0.3 | 1.0 | GO:0005879 | axonemal microtubule(GO:0005879) |
| 0.3 | 4.1 | GO:0030130 | clathrin coat of trans-Golgi network vesicle(GO:0030130) |
| 0.3 | 1.9 | GO:0030991 | intraciliary transport particle A(GO:0030991) |
| 0.3 | 7.3 | GO:0002080 | acrosomal membrane(GO:0002080) |
| 0.3 | 1.8 | GO:1990130 | Iml1 complex(GO:1990130) |
| 0.3 | 3.2 | GO:0005614 | interstitial matrix(GO:0005614) |
| 0.3 | 1.4 | GO:0048787 | presynaptic active zone membrane(GO:0048787) |
| 0.3 | 2.0 | GO:0005915 | zonula adherens(GO:0005915) |
| 0.3 | 7.2 | GO:0031143 | pseudopodium(GO:0031143) |
| 0.3 | 24.0 | GO:0005604 | basement membrane(GO:0005604) |
| 0.3 | 1.9 | GO:0071953 | elastic fiber(GO:0071953) |
| 0.3 | 0.8 | GO:0044352 | pinosome(GO:0044352) macropinosome(GO:0044354) |
| 0.3 | 3.8 | GO:0042583 | chromaffin granule(GO:0042583) |
| 0.3 | 5.3 | GO:0031588 | nucleotide-activated protein kinase complex(GO:0031588) |
| 0.3 | 0.8 | GO:0019012 | virion(GO:0019012) virion part(GO:0044423) |
| 0.3 | 7.8 | GO:0031092 | platelet alpha granule membrane(GO:0031092) |
| 0.3 | 1.8 | GO:0036021 | endolysosome lumen(GO:0036021) |
| 0.3 | 1.5 | GO:0000138 | Golgi trans cisterna(GO:0000138) |
| 0.2 | 1.2 | GO:0031232 | extrinsic component of external side of plasma membrane(GO:0031232) |
| 0.2 | 0.2 | GO:0022624 | proteasome accessory complex(GO:0022624) |
| 0.2 | 1.0 | GO:0042721 | mitochondrial inner membrane protein insertion complex(GO:0042721) |
| 0.2 | 2.2 | GO:1990812 | growth cone filopodium(GO:1990812) |
| 0.2 | 0.7 | GO:1902636 | kinociliary basal body(GO:1902636) |
| 0.2 | 0.2 | GO:0090498 | extrinsic component of Golgi membrane(GO:0090498) |
| 0.2 | 1.1 | GO:0045323 | interleukin-1 receptor complex(GO:0045323) |
| 0.2 | 3.4 | GO:0005869 | dynactin complex(GO:0005869) |
| 0.2 | 1.8 | GO:0035976 | AP1 complex(GO:0035976) |
| 0.2 | 1.8 | GO:0098845 | postsynaptic endosome(GO:0098845) |
| 0.2 | 0.4 | GO:0060053 | neurofilament cytoskeleton(GO:0060053) |
| 0.2 | 3.4 | GO:0090543 | Flemming body(GO:0090543) |
| 0.2 | 6.2 | GO:0005868 | cytoplasmic dynein complex(GO:0005868) |
| 0.2 | 1.1 | GO:0071986 | Ragulator complex(GO:0071986) |
| 0.2 | 0.6 | GO:0070557 | PCNA-p21 complex(GO:0070557) |
| 0.2 | 1.0 | GO:0031209 | SCAR complex(GO:0031209) |
| 0.2 | 6.2 | GO:0042629 | mast cell granule(GO:0042629) |
| 0.2 | 0.4 | GO:0000015 | phosphopyruvate hydratase complex(GO:0000015) |
| 0.2 | 0.6 | GO:0035354 | Toll-like receptor 1-Toll-like receptor 2 protein complex(GO:0035354) |
| 0.2 | 0.2 | GO:0044615 | nuclear pore nuclear basket(GO:0044615) |
| 0.2 | 1.0 | GO:0005602 | complement component C1 complex(GO:0005602) |
| 0.2 | 2.0 | GO:0097413 | Lewy body(GO:0097413) |
| 0.2 | 1.8 | GO:0005955 | calcineurin complex(GO:0005955) |
| 0.2 | 0.6 | GO:0034750 | Scrib-APC-beta-catenin complex(GO:0034750) |
| 0.2 | 1.4 | GO:0000813 | ESCRT I complex(GO:0000813) |
| 0.2 | 4.9 | GO:0099738 | cell cortex region(GO:0099738) |
| 0.2 | 2.2 | GO:0005921 | gap junction(GO:0005921) |
| 0.2 | 2.1 | GO:0033018 | sarcoplasmic reticulum lumen(GO:0033018) |
| 0.2 | 0.8 | GO:0031166 | integral component of vacuolar membrane(GO:0031166) |
| 0.2 | 0.8 | GO:0043219 | lateral loop(GO:0043219) |
| 0.2 | 3.6 | GO:0034663 | endoplasmic reticulum chaperone complex(GO:0034663) |
| 0.2 | 1.3 | GO:0032593 | insulin-responsive compartment(GO:0032593) |
| 0.2 | 0.7 | GO:0097224 | sperm connecting piece(GO:0097224) |
| 0.2 | 0.5 | GO:0034385 | very-low-density lipoprotein particle(GO:0034361) triglyceride-rich lipoprotein particle(GO:0034385) |
| 0.2 | 1.8 | GO:0005577 | fibrinogen complex(GO:0005577) |
| 0.2 | 0.9 | GO:0000836 | Hrd1p ubiquitin ligase complex(GO:0000836) |
| 0.2 | 4.1 | GO:0016327 | apicolateral plasma membrane(GO:0016327) |
| 0.2 | 0.7 | GO:0070695 | FHF complex(GO:0070695) |
| 0.2 | 0.7 | GO:0030485 | smooth muscle contractile fiber(GO:0030485) |
| 0.2 | 0.5 | GO:0005826 | actomyosin contractile ring(GO:0005826) |
| 0.2 | 14.3 | GO:0005913 | cell-cell adherens junction(GO:0005913) |
| 0.2 | 1.8 | GO:0035686 | sperm fibrous sheath(GO:0035686) |
| 0.2 | 1.9 | GO:0000815 | ESCRT III complex(GO:0000815) |
| 0.2 | 0.6 | GO:0065010 | extracellular membrane-bounded organelle(GO:0065010) |
| 0.2 | 14.9 | GO:0030175 | filopodium(GO:0030175) |
| 0.2 | 5.5 | GO:0000421 | autophagosome membrane(GO:0000421) |
| 0.2 | 6.7 | GO:0002102 | podosome(GO:0002102) |
| 0.2 | 0.2 | GO:1990075 | periciliary membrane compartment(GO:1990075) |
| 0.2 | 0.6 | GO:1990246 | uniplex complex(GO:1990246) |
| 0.2 | 4.0 | GO:0043034 | costamere(GO:0043034) |
| 0.2 | 1.5 | GO:0033643 | host cell part(GO:0033643) |
| 0.2 | 0.9 | GO:0005875 | microtubule associated complex(GO:0005875) |
| 0.1 | 0.6 | GO:0043541 | UDP-N-acetylglucosamine transferase complex(GO:0043541) |
| 0.1 | 1.5 | GO:0034364 | high-density lipoprotein particle(GO:0034364) |
| 0.1 | 1.0 | GO:0005770 | late endosome(GO:0005770) |
| 0.1 | 0.4 | GO:0044291 | cell-cell contact zone(GO:0044291) |
| 0.1 | 1.8 | GO:0036020 | endolysosome membrane(GO:0036020) |
| 0.1 | 10.8 | GO:0005901 | caveola(GO:0005901) |
| 0.1 | 0.8 | GO:1902560 | GMP reductase complex(GO:1902560) |
| 0.1 | 0.4 | GO:0033185 | dolichol-phosphate-mannose synthase complex(GO:0033185) |
| 0.1 | 0.4 | GO:0033269 | internode region of axon(GO:0033269) |
| 0.1 | 5.1 | GO:0031430 | M band(GO:0031430) |
| 0.1 | 0.8 | GO:0014802 | terminal cisterna(GO:0014802) |
| 0.1 | 6.7 | GO:0045178 | basal part of cell(GO:0045178) |
| 0.1 | 2.0 | GO:0000164 | protein phosphatase type 1 complex(GO:0000164) |
| 0.1 | 1.5 | GO:0060077 | inhibitory synapse(GO:0060077) |
| 0.1 | 1.2 | GO:0005642 | annulate lamellae(GO:0005642) |
| 0.1 | 0.5 | GO:0034993 | microtubule organizing center attachment site(GO:0034992) LINC complex(GO:0034993) |
| 0.1 | 31.0 | GO:0005578 | proteinaceous extracellular matrix(GO:0005578) |
| 0.1 | 1.5 | GO:0099634 | postsynaptic specialization membrane(GO:0099634) |
| 0.1 | 8.6 | GO:0001725 | stress fiber(GO:0001725) contractile actin filament bundle(GO:0097517) |
| 0.1 | 0.7 | GO:0005958 | DNA-dependent protein kinase-DNA ligase 4 complex(GO:0005958) |
| 0.1 | 0.1 | GO:0000306 | extrinsic component of vacuolar membrane(GO:0000306) |
| 0.1 | 0.7 | GO:0098560 | cytoplasmic side of late endosome membrane(GO:0098560) |
| 0.1 | 0.2 | GO:0097539 | ciliary transition fiber(GO:0097539) |
| 0.1 | 0.6 | GO:0044233 | ER-mitochondrion membrane contact site(GO:0044233) |
| 0.1 | 0.7 | GO:0035032 | phosphatidylinositol 3-kinase complex, class III(GO:0035032) |
| 0.1 | 1.1 | GO:0070022 | transforming growth factor beta receptor homodimeric complex(GO:0070022) |
| 0.1 | 1.4 | GO:0031045 | dense core granule(GO:0031045) |
| 0.1 | 0.6 | GO:0071797 | LUBAC complex(GO:0071797) |
| 0.1 | 0.9 | GO:0071144 | SMAD2-SMAD3 protein complex(GO:0071144) |
| 0.1 | 1.2 | GO:0042641 | actomyosin(GO:0042641) |
| 0.1 | 2.3 | GO:0071782 | endoplasmic reticulum tubular network(GO:0071782) |
| 0.1 | 2.8 | GO:0034706 | sodium channel complex(GO:0034706) |
| 0.1 | 2.6 | GO:0030867 | rough endoplasmic reticulum membrane(GO:0030867) |
| 0.1 | 7.2 | GO:1904724 | tertiary granule lumen(GO:1904724) |
| 0.1 | 1.3 | GO:1990454 | L-type voltage-gated calcium channel complex(GO:1990454) |
| 0.1 | 1.0 | GO:0005638 | lamin filament(GO:0005638) |
| 0.1 | 1.7 | GO:0099501 | synaptic vesicle membrane(GO:0030672) exocytic vesicle membrane(GO:0099501) |
| 0.1 | 8.9 | GO:0043202 | lysosomal lumen(GO:0043202) |
| 0.1 | 2.3 | GO:0031941 | filamentous actin(GO:0031941) |
| 0.1 | 22.7 | GO:0005788 | endoplasmic reticulum lumen(GO:0005788) |
| 0.1 | 18.0 | GO:0031012 | extracellular matrix(GO:0031012) |
| 0.1 | 1.8 | GO:0032420 | stereocilium(GO:0032420) |
| 0.1 | 0.2 | GO:0031501 | mannosyltransferase complex(GO:0031501) |
| 0.1 | 7.6 | GO:0034707 | chloride channel complex(GO:0034707) |
| 0.1 | 0.5 | GO:0000801 | central element(GO:0000801) |
| 0.1 | 1.0 | GO:0030126 | COPI vesicle coat(GO:0030126) |
| 0.1 | 38.7 | GO:0005925 | focal adhesion(GO:0005925) |
| 0.1 | 1.2 | GO:0030131 | clathrin adaptor complex(GO:0030131) |
| 0.1 | 0.5 | GO:0016589 | NURF complex(GO:0016589) |
| 0.1 | 2.6 | GO:0005640 | nuclear outer membrane(GO:0005640) |
| 0.1 | 0.6 | GO:0044292 | dendrite terminus(GO:0044292) |
| 0.1 | 0.5 | GO:0000221 | vacuolar proton-transporting V-type ATPase, V1 domain(GO:0000221) |
| 0.1 | 1.2 | GO:0046658 | anchored component of plasma membrane(GO:0046658) |
| 0.1 | 0.1 | GO:0030897 | HOPS complex(GO:0030897) |
| 0.1 | 0.5 | GO:0014704 | intercalated disc(GO:0014704) |
| 0.1 | 0.8 | GO:0034464 | BBSome(GO:0034464) |
| 0.1 | 1.3 | GO:0034045 | pre-autophagosomal structure membrane(GO:0034045) |
| 0.1 | 0.7 | GO:0017146 | NMDA selective glutamate receptor complex(GO:0017146) |
| 0.1 | 0.1 | GO:0005863 | striated muscle myosin thick filament(GO:0005863) |
| 0.1 | 0.3 | GO:0071546 | pi-body(GO:0071546) |
| 0.1 | 0.3 | GO:0036396 | MIS complex(GO:0036396) mRNA editing complex(GO:0045293) |
| 0.1 | 0.2 | GO:0030663 | COPI-coated vesicle membrane(GO:0030663) |
| 0.1 | 0.2 | GO:0044305 | calyx of Held(GO:0044305) |
| 0.1 | 2.2 | GO:0097546 | ciliary base(GO:0097546) |
| 0.1 | 0.6 | GO:0035580 | specific granule lumen(GO:0035580) |
| 0.1 | 2.9 | GO:0043198 | dendritic shaft(GO:0043198) |
| 0.1 | 0.7 | GO:0097433 | dense body(GO:0097433) |
| 0.1 | 0.7 | GO:0061574 | ASAP complex(GO:0061574) |
| 0.1 | 1.7 | GO:0044322 | endoplasmic reticulum quality control compartment(GO:0044322) |
| 0.1 | 0.9 | GO:0097136 | Bcl-2 family protein complex(GO:0097136) |
| 0.1 | 0.2 | GO:0042765 | GPI-anchor transamidase complex(GO:0042765) |
| 0.1 | 0.1 | GO:0030125 | clathrin vesicle coat(GO:0030125) |
| 0.1 | 0.7 | GO:0044300 | cerebellar mossy fiber(GO:0044300) |
| 0.1 | 0.7 | GO:0005964 | phosphorylase kinase complex(GO:0005964) |
| 0.1 | 1.3 | GO:0016471 | vacuolar proton-transporting V-type ATPase complex(GO:0016471) |
| 0.1 | 1.0 | GO:0043218 | compact myelin(GO:0043218) |
| 0.1 | 0.2 | GO:0035189 | Rb-E2F complex(GO:0035189) |
| 0.1 | 0.4 | GO:0098878 | ionotropic glutamate receptor complex(GO:0008328) neurotransmitter receptor complex(GO:0098878) |
| 0.1 | 0.7 | GO:0044754 | autolysosome(GO:0044754) |
| 0.1 | 0.3 | GO:0034098 | VCP-NPL4-UFD1 AAA ATPase complex(GO:0034098) |
| 0.1 | 0.1 | GO:0030665 | clathrin-coated vesicle membrane(GO:0030665) |
| 0.1 | 0.3 | GO:0032144 | 4-aminobutyrate transaminase complex(GO:0032144) |
| 0.1 | 1.0 | GO:0000145 | exocyst(GO:0000145) |
| 0.1 | 0.1 | GO:0036513 | Derlin-1 retrotranslocation complex(GO:0036513) |
| 0.1 | 0.1 | GO:0005889 | hydrogen:potassium-exchanging ATPase complex(GO:0005889) |
| 0.1 | 0.3 | GO:0036452 | ESCRT complex(GO:0036452) |
| 0.1 | 0.2 | GO:0031515 | tRNA (m1A) methyltransferase complex(GO:0031515) |
| 0.1 | 4.0 | GO:0043195 | terminal bouton(GO:0043195) |
| 0.1 | 1.6 | GO:0070971 | endoplasmic reticulum exit site(GO:0070971) |
| 0.1 | 7.9 | GO:0031901 | early endosome membrane(GO:0031901) |
| 0.1 | 0.2 | GO:0010370 | perinucleolar chromocenter(GO:0010370) |
| 0.1 | 3.7 | GO:0005905 | clathrin-coated pit(GO:0005905) |
| 0.1 | 0.1 | GO:0005865 | striated muscle thin filament(GO:0005865) |
| 0.1 | 0.2 | GO:0071595 | Nem1-Spo7 phosphatase complex(GO:0071595) |
| 0.1 | 0.2 | GO:0097149 | centralspindlin complex(GO:0097149) |
| 0.1 | 2.4 | GO:0005776 | autophagosome(GO:0005776) |
| 0.1 | 0.2 | GO:0005953 | CAAX-protein geranylgeranyltransferase complex(GO:0005953) |
| 0.1 | 0.1 | GO:0030134 | ER to Golgi transport vesicle(GO:0030134) |
| 0.1 | 0.2 | GO:0070069 | cytochrome complex(GO:0070069) |
| 0.1 | 1.1 | GO:0005859 | muscle myosin complex(GO:0005859) |
| 0.1 | 0.4 | GO:0033391 | chromatoid body(GO:0033391) |
| 0.1 | 0.4 | GO:0001740 | Barr body(GO:0001740) |
| 0.1 | 0.2 | GO:0005896 | interleukin-6 receptor complex(GO:0005896) |
| 0.1 | 0.1 | GO:0000242 | pericentriolar material(GO:0000242) |
| 0.1 | 1.9 | GO:0000159 | protein phosphatase type 2A complex(GO:0000159) |
| 0.1 | 2.9 | GO:0031674 | I band(GO:0031674) |
| 0.1 | 0.2 | GO:0030137 | COPI-coated vesicle(GO:0030137) |
| 0.1 | 0.3 | GO:0061689 | tricellular tight junction(GO:0061689) |
| 0.1 | 0.8 | GO:0030315 | T-tubule(GO:0030315) |
| 0.1 | 0.1 | GO:0070765 | gamma-secretase complex(GO:0070765) |
| 0.1 | 0.1 | GO:0005683 | U7 snRNP(GO:0005683) |
| 0.1 | 0.1 | GO:0016460 | myosin II complex(GO:0016460) |
| 0.1 | 1.0 | GO:0005912 | adherens junction(GO:0005912) |
| 0.1 | 0.3 | GO:0089701 | U2AF(GO:0089701) |
| 0.1 | 0.2 | GO:0012510 | trans-Golgi network transport vesicle membrane(GO:0012510) |
| 0.0 | 0.9 | GO:0032391 | photoreceptor connecting cilium(GO:0032391) |
| 0.0 | 0.4 | GO:0072546 | ER membrane protein complex(GO:0072546) |
| 0.0 | 1.1 | GO:0030670 | phagocytic vesicle membrane(GO:0030670) |
| 0.0 | 2.4 | GO:0033116 | endoplasmic reticulum-Golgi intermediate compartment membrane(GO:0033116) |
| 0.0 | 0.1 | GO:0005850 | eukaryotic translation initiation factor 2 complex(GO:0005850) |
| 0.0 | 0.1 | GO:0055087 | Ski complex(GO:0055087) |
| 0.0 | 2.4 | GO:0035578 | azurophil granule lumen(GO:0035578) |
| 0.0 | 0.2 | GO:0000333 | telomerase catalytic core complex(GO:0000333) |
| 0.0 | 3.5 | GO:0005923 | bicellular tight junction(GO:0005923) |
| 0.0 | 1.0 | GO:0030673 | axolemma(GO:0030673) |
| 0.0 | 0.1 | GO:0005797 | Golgi medial cisterna(GO:0005797) |
| 0.0 | 0.0 | GO:0031595 | nuclear proteasome complex(GO:0031595) |
| 0.0 | 0.3 | GO:0090665 | dystrophin-associated glycoprotein complex(GO:0016010) glycoprotein complex(GO:0090665) |
| 0.0 | 0.4 | GO:0008250 | oligosaccharyltransferase complex(GO:0008250) |
| 0.0 | 0.1 | GO:0097058 | CRLF-CLCF1 complex(GO:0097058) |
| 0.0 | 0.4 | GO:0016580 | Sin3 complex(GO:0016580) |
| 0.0 | 1.4 | GO:0030864 | cortical actin cytoskeleton(GO:0030864) |
| 0.0 | 0.3 | GO:0005579 | membrane attack complex(GO:0005579) |
| 0.0 | 0.0 | GO:0002139 | stereocilia coupling link(GO:0002139) |
| 0.0 | 0.5 | GO:0097225 | sperm midpiece(GO:0097225) |
| 0.0 | 0.1 | GO:0071012 | catalytic step 1 spliceosome(GO:0071012) |
| 0.0 | 0.1 | GO:0043296 | apical junction complex(GO:0043296) |
| 0.0 | 1.3 | GO:0097014 | axoneme(GO:0005930) ciliary plasm(GO:0097014) |
| 0.0 | 1.4 | GO:0042734 | presynaptic membrane(GO:0042734) |
| 0.0 | 0.2 | GO:0005777 | peroxisome(GO:0005777) microbody(GO:0042579) |
| 0.0 | 0.2 | GO:0097431 | mitotic spindle pole(GO:0097431) |
| 0.0 | 0.2 | GO:0005641 | nuclear envelope lumen(GO:0005641) |
| 0.0 | 0.4 | GO:0034362 | low-density lipoprotein particle(GO:0034362) |
| 0.0 | 0.1 | GO:1990851 | Wnt-Frizzled-LRP5/6 complex(GO:1990851) |
| 0.0 | 0.3 | GO:1990124 | messenger ribonucleoprotein complex(GO:1990124) |
| 0.0 | 0.1 | GO:0005674 | transcription factor TFIIF complex(GO:0005674) |
| 0.0 | 0.5 | GO:0016281 | eukaryotic translation initiation factor 4F complex(GO:0016281) |
| 0.0 | 0.1 | GO:0005832 | chaperonin-containing T-complex(GO:0005832) |
| 0.0 | 0.2 | GO:0030877 | beta-catenin destruction complex(GO:0030877) |
| 0.0 | 0.2 | GO:0031467 | Cul7-RING ubiquitin ligase complex(GO:0031467) |
| 0.0 | 0.3 | GO:0005798 | Golgi-associated vesicle(GO:0005798) |
| 0.0 | 0.1 | GO:0048269 | methionine adenosyltransferase complex(GO:0048269) |
| 0.0 | 0.9 | GO:0030173 | integral component of Golgi membrane(GO:0030173) |
| 0.0 | 0.6 | GO:0055038 | recycling endosome membrane(GO:0055038) |
| 0.0 | 0.2 | GO:0071141 | SMAD protein complex(GO:0071141) |
| 0.0 | 0.2 | GO:0097440 | apical dendrite(GO:0097440) |
| 0.0 | 13.1 | GO:0048471 | perinuclear region of cytoplasm(GO:0048471) |
| 0.0 | 0.1 | GO:0032311 | angiogenin-PRI complex(GO:0032311) |
| 0.0 | 0.1 | GO:0060170 | ciliary membrane(GO:0060170) |
| 0.0 | 0.1 | GO:0044530 | supraspliceosomal complex(GO:0044530) |
| 0.0 | 0.5 | GO:0031307 | integral component of mitochondrial outer membrane(GO:0031307) |
| 0.0 | 0.1 | GO:0070847 | core mediator complex(GO:0070847) |
| 0.0 | 0.2 | GO:0005956 | protein kinase CK2 complex(GO:0005956) |
| 0.0 | 0.1 | GO:0036057 | filtration diaphragm(GO:0036056) slit diaphragm(GO:0036057) |
| 0.0 | 0.6 | GO:0005892 | acetylcholine-gated channel complex(GO:0005892) |
| 0.0 | 0.0 | GO:0005827 | polar microtubule(GO:0005827) |
| 0.0 | 0.1 | GO:0043186 | P granule(GO:0043186) pole plasm(GO:0045495) germ plasm(GO:0060293) |
| 0.0 | 0.5 | GO:0008074 | guanylate cyclase complex, soluble(GO:0008074) |
| 0.0 | 0.2 | GO:0008024 | cyclin/CDK positive transcription elongation factor complex(GO:0008024) |
| 0.0 | 0.7 | GO:0031526 | brush border membrane(GO:0031526) |
| 0.0 | 0.1 | GO:0031251 | PAN complex(GO:0031251) |
| 0.0 | 2.7 | GO:0045211 | postsynaptic membrane(GO:0045211) |
| 0.0 | 0.4 | GO:0008540 | proteasome regulatory particle, base subcomplex(GO:0008540) |
| 0.0 | 0.2 | GO:0036038 | MKS complex(GO:0036038) |
| 0.0 | 0.2 | GO:0032839 | dendrite cytoplasm(GO:0032839) |
| 0.0 | 0.1 | GO:0097013 | phagocytic vesicle lumen(GO:0097013) |
| 0.0 | 0.1 | GO:0032421 | stereocilium bundle(GO:0032421) |
| 0.0 | 0.8 | GO:0031091 | platelet alpha granule(GO:0031091) |
| 0.0 | 0.1 | GO:0005672 | transcription factor TFIIA complex(GO:0005672) |
| 0.0 | 0.0 | GO:1990777 | plasma lipoprotein particle(GO:0034358) lipoprotein particle(GO:1990777) |
| 0.0 | 0.1 | GO:0005787 | signal peptidase complex(GO:0005787) |
| 0.0 | 0.0 | GO:0097057 | TRAF2-GSTP1 complex(GO:0097057) |
| 0.0 | 0.2 | GO:0032809 | neuronal cell body membrane(GO:0032809) cell body membrane(GO:0044298) |
| 0.0 | 0.2 | GO:0005790 | smooth endoplasmic reticulum(GO:0005790) |
| 0.0 | 0.8 | GO:0005782 | peroxisomal matrix(GO:0005782) microbody lumen(GO:0031907) |
| 0.0 | 0.5 | GO:0005685 | U1 snRNP(GO:0005685) |
| 0.0 | 0.1 | GO:0005947 | mitochondrial alpha-ketoglutarate dehydrogenase complex(GO:0005947) |
| 0.0 | 0.1 | GO:0001940 | male pronucleus(GO:0001940) |
| 0.0 | 0.2 | GO:0042622 | photoreceptor outer segment membrane(GO:0042622) |
| 0.0 | 0.0 | GO:1990682 | CSF1-CSF1R complex(GO:1990682) |
| 0.0 | 0.7 | GO:0031984 | organelle subcompartment(GO:0031984) |
| 0.0 | 0.0 | GO:0030906 | retromer, cargo-selective complex(GO:0030906) |
| 0.0 | 0.1 | GO:0070382 | exocytic vesicle(GO:0070382) |
| 0.0 | 0.1 | GO:0030285 | integral component of synaptic vesicle membrane(GO:0030285) intrinsic component of synaptic vesicle membrane(GO:0098563) |
| 0.0 | 0.0 | GO:0005944 | phosphatidylinositol 3-kinase complex, class IB(GO:0005944) |
| 0.0 | 0.3 | GO:0005834 | heterotrimeric G-protein complex(GO:0005834) |
| 0.0 | 0.3 | GO:0001917 | photoreceptor inner segment(GO:0001917) |
Gene overrepresentation in C2:CP:REACTOME category:
| Log-likelihood per target | Total log-likelihood | Term | Description |
|---|---|---|---|
| 0.7 | 42.0 | REACTOME SMOOTH MUSCLE CONTRACTION | Genes involved in Smooth Muscle Contraction |
| 0.6 | 8.4 | REACTOME PYRIMIDINE CATABOLISM | Genes involved in Pyrimidine catabolism |
| 0.4 | 7.6 | REACTOME GAP JUNCTION ASSEMBLY | Genes involved in Gap junction assembly |
| 0.4 | 13.5 | REACTOME ADHERENS JUNCTIONS INTERACTIONS | Genes involved in Adherens junctions interactions |
| 0.4 | 35.3 | REACTOME CELL JUNCTION ORGANIZATION | Genes involved in Cell junction organization |
| 0.4 | 2.3 | REACTOME CROSS PRESENTATION OF SOLUBLE EXOGENOUS ANTIGENS ENDOSOMES | Genes involved in Cross-presentation of soluble exogenous antigens (endosomes) |
| 0.3 | 9.0 | REACTOME REGULATION OF INSULIN LIKE GROWTH FACTOR IGF ACTIVITY BY INSULIN LIKE GROWTH FACTOR BINDING PROTEINS IGFBPS | Genes involved in Regulation of Insulin-like Growth Factor (IGF) Activity by Insulin-like Growth Factor Binding Proteins (IGFBPs) |
| 0.3 | 21.0 | REACTOME COLLAGEN FORMATION | Genes involved in Collagen formation |
| 0.3 | 8.5 | REACTOME GLUCURONIDATION | Genes involved in Glucuronidation |
| 0.3 | 5.8 | REACTOME NOREPINEPHRINE NEUROTRANSMITTER RELEASE CYCLE | Genes involved in Norepinephrine Neurotransmitter Release Cycle |
| 0.3 | 5.3 | REACTOME GAP JUNCTION DEGRADATION | Genes involved in Gap junction degradation |
| 0.3 | 5.9 | REACTOME HYALURONAN UPTAKE AND DEGRADATION | Genes involved in Hyaluronan uptake and degradation |
| 0.3 | 3.1 | REACTOME ENDOSOMAL VACUOLAR PATHWAY | Genes involved in Endosomal/Vacuolar pathway |
| 0.3 | 5.3 | REACTOME REGULATION OF RHEB GTPASE ACTIVITY BY AMPK | Genes involved in Regulation of Rheb GTPase activity by AMPK |
| 0.3 | 5.7 | REACTOME CS DS DEGRADATION | Genes involved in CS/DS degradation |
| 0.3 | 4.1 | REACTOME APOPTOTIC CLEAVAGE OF CELL ADHESION PROTEINS | Genes involved in Apoptotic cleavage of cell adhesion proteins |
| 0.3 | 5.0 | REACTOME SIGNALING BY HIPPO | Genes involved in Signaling by Hippo |
| 0.2 | 4.6 | REACTOME SIGNAL ATTENUATION | Genes involved in Signal attenuation |
| 0.2 | 7.3 | REACTOME DOWNREGULATION OF TGF BETA RECEPTOR SIGNALING | Genes involved in Downregulation of TGF-beta receptor signaling |
| 0.2 | 4.2 | REACTOME INTEGRIN CELL SURFACE INTERACTIONS | Genes involved in Integrin cell surface interactions |
| 0.2 | 11.7 | REACTOME SIGNALING BY ROBO RECEPTOR | Genes involved in Signaling by Robo receptor |
| 0.2 | 1.6 | REACTOME RECEPTOR LIGAND BINDING INITIATES THE SECOND PROTEOLYTIC CLEAVAGE OF NOTCH RECEPTOR | Genes involved in Receptor-ligand binding initiates the second proteolytic cleavage of Notch receptor |
| 0.2 | 4.4 | REACTOME THE NLRP3 INFLAMMASOME | Genes involved in The NLRP3 inflammasome |
| 0.2 | 3.7 | REACTOME ADENYLATE CYCLASE INHIBITORY PATHWAY | Genes involved in Adenylate cyclase inhibitory pathway |
| 0.2 | 0.6 | REACTOME TGF BETA RECEPTOR SIGNALING ACTIVATES SMADS | Genes involved in TGF-beta receptor signaling activates SMADs |
| 0.2 | 3.1 | REACTOME SYNTHESIS OF PIPS AT THE EARLY ENDOSOME MEMBRANE | Genes involved in Synthesis of PIPs at the early endosome membrane |
| 0.2 | 5.9 | REACTOME DOWNREGULATION OF ERBB2 ERBB3 SIGNALING | Genes involved in Downregulation of ERBB2:ERBB3 signaling |
| 0.2 | 2.4 | REACTOME CHONDROITIN SULFATE BIOSYNTHESIS | Genes involved in Chondroitin sulfate biosynthesis |
| 0.2 | 5.8 | REACTOME HORMONE SENSITIVE LIPASE HSL MEDIATED TRIACYLGLYCEROL HYDROLYSIS | Genes involved in Hormone-sensitive lipase (HSL)-mediated triacylglycerol hydrolysis |
| 0.2 | 4.0 | REACTOME HS GAG DEGRADATION | Genes involved in HS-GAG degradation |
| 0.2 | 4.0 | REACTOME GLYCOGEN BREAKDOWN GLYCOGENOLYSIS | Genes involved in Glycogen breakdown (glycogenolysis) |
| 0.2 | 3.5 | REACTOME VEGF LIGAND RECEPTOR INTERACTIONS | Genes involved in VEGF ligand-receptor interactions |
| 0.2 | 2.9 | REACTOME ORGANIC CATION ANION ZWITTERION TRANSPORT | Genes involved in Organic cation/anion/zwitterion transport |
| 0.2 | 7.0 | REACTOME SMAD2 SMAD3 SMAD4 HETEROTRIMER REGULATES TRANSCRIPTION | Genes involved in SMAD2/SMAD3:SMAD4 heterotrimer regulates transcription |
| 0.2 | 0.5 | REACTOME HYALURONAN METABOLISM | Genes involved in Hyaluronan metabolism |
| 0.2 | 3.3 | REACTOME SIGNALING BY NODAL | Genes involved in Signaling by NODAL |
| 0.2 | 4.1 | REACTOME CASPASE MEDIATED CLEAVAGE OF CYTOSKELETAL PROTEINS | Genes involved in Caspase-mediated cleavage of cytoskeletal proteins |
| 0.2 | 2.0 | REACTOME ABACAVIR TRANSPORT AND METABOLISM | Genes involved in Abacavir transport and metabolism |
| 0.2 | 3.4 | REACTOME ENDOSOMAL SORTING COMPLEX REQUIRED FOR TRANSPORT ESCRT | Genes involved in Endosomal Sorting Complex Required For Transport (ESCRT) |
| 0.1 | 2.7 | REACTOME PRE NOTCH TRANSCRIPTION AND TRANSLATION | Genes involved in Pre-NOTCH Transcription and Translation |
| 0.1 | 2.8 | REACTOME INITIAL TRIGGERING OF COMPLEMENT | Genes involved in Initial triggering of complement |
| 0.1 | 0.1 | REACTOME BINDING AND ENTRY OF HIV VIRION | Genes involved in Binding and entry of HIV virion |
| 0.1 | 0.3 | REACTOME PROCESSING OF CAPPED INTRON CONTAINING PRE MRNA | Genes involved in Processing of Capped Intron-Containing Pre-mRNA |
| 0.1 | 17.0 | REACTOME RESPONSE TO ELEVATED PLATELET CYTOSOLIC CA2 | Genes involved in Response to elevated platelet cytosolic Ca2+ |
| 0.1 | 2.6 | REACTOME HS GAG BIOSYNTHESIS | Genes involved in HS-GAG biosynthesis |
| 0.1 | 2.8 | REACTOME EGFR DOWNREGULATION | Genes involved in EGFR downregulation |
| 0.1 | 0.6 | REACTOME PURINE CATABOLISM | Genes involved in Purine catabolism |
| 0.1 | 0.7 | REACTOME NFKB ACTIVATION THROUGH FADD RIP1 PATHWAY MEDIATED BY CASPASE 8 AND10 | Genes involved in NF-kB activation through FADD/RIP-1 pathway mediated by caspase-8 and -10 |
| 0.1 | 1.4 | REACTOME NEF MEDIATED DOWNREGULATION OF MHC CLASS I COMPLEX CELL SURFACE EXPRESSION | Genes involved in Nef mediated downregulation of MHC class I complex cell surface expression |
| 0.1 | 2.8 | REACTOME DCC MEDIATED ATTRACTIVE SIGNALING | Genes involved in DCC mediated attractive signaling |
| 0.1 | 2.3 | REACTOME TRANSCRIPTIONAL REGULATION OF WHITE ADIPOCYTE DIFFERENTIATION | Genes involved in Transcriptional Regulation of White Adipocyte Differentiation |
| 0.1 | 2.7 | REACTOME POST CHAPERONIN TUBULIN FOLDING PATHWAY | Genes involved in Post-chaperonin tubulin folding pathway |
| 0.1 | 1.1 | REACTOME REGULATION OF AMPK ACTIVITY VIA LKB1 | Genes involved in Regulation of AMPK activity via LKB1 |
| 0.1 | 9.1 | REACTOME PHASE II CONJUGATION | Genes involved in Phase II conjugation |
| 0.1 | 1.4 | REACTOME G ALPHA Z SIGNALLING EVENTS | Genes involved in G alpha (z) signalling events |
| 0.1 | 2.7 | REACTOME INHIBITION OF INSULIN SECRETION BY ADRENALINE NORADRENALINE | Genes involved in Inhibition of Insulin Secretion by Adrenaline/Noradrenaline |
| 0.1 | 2.9 | REACTOME NETRIN1 SIGNALING | Genes involved in Netrin-1 signaling |
| 0.1 | 0.7 | REACTOME TGF BETA RECEPTOR SIGNALING IN EMT EPITHELIAL TO MESENCHYMAL TRANSITION | Genes involved in TGF-beta receptor signaling in EMT (epithelial to mesenchymal transition) |
| 0.1 | 1.6 | REACTOME CALNEXIN CALRETICULIN CYCLE | Genes involved in Calnexin/calreticulin cycle |
| 0.1 | 0.7 | REACTOME REGULATION OF ORNITHINE DECARBOXYLASE ODC | Genes involved in Regulation of ornithine decarboxylase (ODC) |
| 0.1 | 2.9 | REACTOME ASSOCIATION OF TRIC CCT WITH TARGET PROTEINS DURING BIOSYNTHESIS | Genes involved in Association of TriC/CCT with target proteins during biosynthesis |
| 0.1 | 4.4 | REACTOME G1 PHASE | Genes involved in G1 Phase |
| 0.1 | 0.2 | REACTOME FORMATION OF TRANSCRIPTION COUPLED NER TC NER REPAIR COMPLEX | Genes involved in Formation of transcription-coupled NER (TC-NER) repair complex |
| 0.1 | 4.0 | REACTOME MUSCLE CONTRACTION | Genes involved in Muscle contraction |
| 0.1 | 2.3 | REACTOME INSULIN RECEPTOR RECYCLING | Genes involved in Insulin receptor recycling |
| 0.1 | 0.7 | REACTOME CHONDROITIN SULFATE DERMATAN SULFATE METABOLISM | Genes involved in Chondroitin sulfate/dermatan sulfate metabolism |
| 0.1 | 2.1 | REACTOME FORMATION OF FIBRIN CLOT CLOTTING CASCADE | Genes involved in Formation of Fibrin Clot (Clotting Cascade) |
| 0.1 | 1.0 | REACTOME TRAF6 MEDIATED INDUCTION OF TAK1 COMPLEX | Genes involved in TRAF6 mediated induction of TAK1 complex |
| 0.1 | 5.3 | REACTOME CELL DEATH SIGNALLING VIA NRAGE NRIF AND NADE | Genes involved in Cell death signalling via NRAGE, NRIF and NADE |
| 0.1 | 2.6 | REACTOME POST TRANSLATIONAL MODIFICATION SYNTHESIS OF GPI ANCHORED PROTEINS | Genes involved in Post-translational modification: synthesis of GPI-anchored proteins |
| 0.1 | 1.5 | REACTOME OXYGEN DEPENDENT PROLINE HYDROXYLATION OF HYPOXIA INDUCIBLE FACTOR ALPHA | Genes involved in Oxygen-dependent Proline Hydroxylation of Hypoxia-inducible Factor Alpha |
| 0.1 | 2.5 | REACTOME SIGNALING BY BMP | Genes involved in Signaling by BMP |
| 0.1 | 0.1 | REACTOME AUTODEGRADATION OF THE E3 UBIQUITIN LIGASE COP1 | Genes involved in Autodegradation of the E3 ubiquitin ligase COP1 |
| 0.1 | 0.3 | REACTOME SIGNALING BY ERBB2 | Genes involved in Signaling by ERBB2 |
| 0.1 | 2.4 | REACTOME NCAM1 INTERACTIONS | Genes involved in NCAM1 interactions |
| 0.1 | 8.0 | REACTOME PPARA ACTIVATES GENE EXPRESSION | Genes involved in PPARA Activates Gene Expression |
| 0.1 | 0.7 | REACTOME OPSINS | Genes involved in Opsins |
| 0.1 | 0.3 | REACTOME PLATELET ADHESION TO EXPOSED COLLAGEN | Genes involved in Platelet Adhesion to exposed collagen |
| 0.1 | 1.0 | REACTOME REGULATION OF INSULIN SECRETION BY GLUCAGON LIKE PEPTIDE1 | Genes involved in Regulation of Insulin Secretion by Glucagon-like Peptide-1 |
| 0.1 | 0.3 | REACTOME ERKS ARE INACTIVATED | Genes involved in ERKs are inactivated |
| 0.1 | 0.6 | REACTOME THE ACTIVATION OF ARYLSULFATASES | Genes involved in The activation of arylsulfatases |
| 0.1 | 1.6 | REACTOME GLYCOSPHINGOLIPID METABOLISM | Genes involved in Glycosphingolipid metabolism |
| 0.1 | 0.5 | REACTOME TRAFFICKING AND PROCESSING OF ENDOSOMAL TLR | Genes involved in Trafficking and processing of endosomal TLR |
| 0.1 | 1.3 | REACTOME EXTRINSIC PATHWAY FOR APOPTOSIS | Genes involved in Extrinsic Pathway for Apoptosis |
| 0.1 | 3.1 | REACTOME ACTIVATION OF CHAPERONE GENES BY XBP1S | Genes involved in Activation of Chaperone Genes by XBP1(S) |
| 0.1 | 1.2 | REACTOME CHOLESTEROL BIOSYNTHESIS | Genes involved in Cholesterol biosynthesis |
| 0.1 | 0.1 | REACTOME MEMBRANE BINDING AND TARGETTING OF GAG PROTEINS | Genes involved in Membrane binding and targetting of GAG proteins |
| 0.0 | 0.6 | REACTOME GLUTAMATE NEUROTRANSMITTER RELEASE CYCLE | Genes involved in Glutamate Neurotransmitter Release Cycle |
| 0.0 | 2.0 | REACTOME METABOLISM OF STEROID HORMONES AND VITAMINS A AND D | Genes involved in Metabolism of steroid hormones and vitamins A and D |
| 0.0 | 1.3 | REACTOME DEGRADATION OF THE EXTRACELLULAR MATRIX | Genes involved in Degradation of the extracellular matrix |
| 0.0 | 3.7 | REACTOME AMYLOIDS | Genes involved in Amyloids |
| 0.0 | 1.0 | REACTOME PROTEOLYTIC CLEAVAGE OF SNARE COMPLEX PROTEINS | Genes involved in Proteolytic cleavage of SNARE complex proteins |
| 0.0 | 1.5 | REACTOME BASIGIN INTERACTIONS | Genes involved in Basigin interactions |
| 0.0 | 0.6 | REACTOME SYNTHESIS SECRETION AND DEACYLATION OF GHRELIN | Genes involved in Synthesis, Secretion, and Deacylation of Ghrelin |
| 0.0 | 0.7 | REACTOME ACYL CHAIN REMODELLING OF PS | Genes involved in Acyl chain remodelling of PS |
| 0.0 | 0.9 | REACTOME P75 NTR RECEPTOR MEDIATED SIGNALLING | Genes involved in p75 NTR receptor-mediated signalling |
| 0.0 | 0.3 | REACTOME G PROTEIN ACTIVATION | Genes involved in G-protein activation |
| 0.0 | 0.6 | REACTOME REVERSIBLE HYDRATION OF CARBON DIOXIDE | Genes involved in Reversible Hydration of Carbon Dioxide |
| 0.0 | 0.3 | REACTOME PROSTANOID LIGAND RECEPTORS | Genes involved in Prostanoid ligand receptors |
| 0.0 | 0.4 | REACTOME BETA DEFENSINS | Genes involved in Beta defensins |
| 0.0 | 0.2 | REACTOME YAP1 AND WWTR1 TAZ STIMULATED GENE EXPRESSION | Genes involved in YAP1- and WWTR1 (TAZ)-stimulated gene expression |
| 0.0 | 0.5 | REACTOME METABOLISM OF POLYAMINES | Genes involved in Metabolism of polyamines |
| 0.0 | 1.0 | REACTOME PEROXISOMAL LIPID METABOLISM | Genes involved in Peroxisomal lipid metabolism |
| 0.0 | 0.5 | REACTOME PTM GAMMA CARBOXYLATION HYPUSINE FORMATION AND ARYLSULFATASE ACTIVATION | Genes involved in PTM: gamma carboxylation, hypusine formation and arylsulfatase activation |
| 0.0 | 0.7 | REACTOME FORMATION OF INCISION COMPLEX IN GG NER | Genes involved in Formation of incision complex in GG-NER |
| 0.0 | 0.8 | REACTOME SULFUR AMINO ACID METABOLISM | Genes involved in Sulfur amino acid metabolism |
| 0.0 | 0.5 | REACTOME PRESYNAPTIC NICOTINIC ACETYLCHOLINE RECEPTORS | Genes involved in Presynaptic nicotinic acetylcholine receptors |
| 0.0 | 0.5 | REACTOME CRMPS IN SEMA3A SIGNALING | Genes involved in CRMPs in Sema3A signaling |
| 0.0 | 2.5 | REACTOME CLASS B 2 SECRETIN FAMILY RECEPTORS | Genes involved in Class B/2 (Secretin family receptors) |
| 0.0 | 0.0 | REACTOME PROSTACYCLIN SIGNALLING THROUGH PROSTACYCLIN RECEPTOR | Genes involved in Prostacyclin signalling through prostacyclin receptor |
| 0.0 | 0.2 | REACTOME COPI MEDIATED TRANSPORT | Genes involved in COPI Mediated Transport |
| 0.0 | 0.3 | REACTOME ACTIVATED NOTCH1 TRANSMITS SIGNAL TO THE NUCLEUS | Genes involved in Activated NOTCH1 Transmits Signal to the Nucleus |
| 0.0 | 0.1 | REACTOME TRANSFERRIN ENDOCYTOSIS AND RECYCLING | Genes involved in Transferrin endocytosis and recycling |
| 0.0 | 0.1 | REACTOME SEMA3A PLEXIN REPULSION SIGNALING BY INHIBITING INTEGRIN ADHESION | Genes involved in SEMA3A-Plexin repulsion signaling by inhibiting Integrin adhesion |
| 0.0 | 0.7 | REACTOME DARPP 32 EVENTS | Genes involved in DARPP-32 events |
| 0.0 | 0.2 | REACTOME REGULATION OF INSULIN SECRETION BY ACETYLCHOLINE | Genes involved in Regulation of Insulin Secretion by Acetylcholine |
| 0.0 | 0.1 | REACTOME THROMBIN SIGNALLING THROUGH PROTEINASE ACTIVATED RECEPTORS PARS | Genes involved in Thrombin signalling through proteinase activated receptors (PARs) |
| 0.0 | 0.0 | REACTOME DOPAMINE NEUROTRANSMITTER RELEASE CYCLE | Genes involved in Dopamine Neurotransmitter Release Cycle |
| 0.0 | 0.5 | REACTOME FATTY ACYL COA BIOSYNTHESIS | Genes involved in Fatty Acyl-CoA Biosynthesis |
| 0.0 | 0.3 | REACTOME PYRIMIDINE METABOLISM | Genes involved in Pyrimidine metabolism |
| 0.0 | 0.2 | REACTOME KERATAN SULFATE DEGRADATION | Genes involved in Keratan sulfate degradation |
| 0.0 | 0.1 | REACTOME TETRAHYDROBIOPTERIN BH4 SYNTHESIS RECYCLING SALVAGE AND REGULATION | Genes involved in Tetrahydrobiopterin (BH4) synthesis, recycling, salvage and regulation |
| 0.0 | 0.7 | REACTOME GOLGI ASSOCIATED VESICLE BIOGENESIS | Genes involved in Golgi Associated Vesicle Biogenesis |
| 0.0 | 0.0 | REACTOME SIGNALING BY SCF KIT | Genes involved in Signaling by SCF-KIT |
| 0.0 | 0.4 | REACTOME IL1 SIGNALING | Genes involved in Interleukin-1 signaling |
| 0.0 | 1.6 | REACTOME G ALPHA I SIGNALLING EVENTS | Genes involved in G alpha (i) signalling events |
| 0.0 | 0.1 | REACTOME ER PHAGOSOME PATHWAY | Genes involved in ER-Phagosome pathway |
| 0.0 | 0.2 | REACTOME INHIBITION OF VOLTAGE GATED CA2 CHANNELS VIA GBETA GAMMA SUBUNITS | Genes involved in Inhibition of voltage gated Ca2+ channels via Gbeta/gamma subunits |
Gene overrepresentation in molecular_function category:
| Log-likelihood per target | Total log-likelihood | Term | Description |
|---|---|---|---|
| 2.0 | 8.1 | GO:0030760 | nicotinamide N-methyltransferase activity(GO:0008112) pyridine N-methyltransferase activity(GO:0030760) |
| 1.9 | 3.9 | GO:0010858 | calcium-dependent protein kinase regulator activity(GO:0010858) |
| 1.7 | 8.5 | GO:0005006 | epidermal growth factor-activated receptor activity(GO:0005006) |
| 1.5 | 6.0 | GO:0004850 | uridine phosphorylase activity(GO:0004850) |
| 1.4 | 4.3 | GO:0070320 | inward rectifier potassium channel inhibitor activity(GO:0070320) |
| 1.4 | 7.1 | GO:0004687 | myosin light chain kinase activity(GO:0004687) |
| 1.2 | 8.6 | GO:0030267 | hydroxypyruvate reductase activity(GO:0016618) glyoxylate reductase (NADP) activity(GO:0030267) |
| 1.0 | 3.0 | GO:0008475 | procollagen-lysine 5-dioxygenase activity(GO:0008475) procollagen glucosyltransferase activity(GO:0033823) |
| 1.0 | 3.0 | GO:0030984 | kininogen binding(GO:0030984) |
| 0.9 | 2.8 | GO:0030377 | urokinase plasminogen activator receptor activity(GO:0030377) |
| 0.9 | 4.4 | GO:0004656 | procollagen-proline 4-dioxygenase activity(GO:0004656) procollagen-proline dioxygenase activity(GO:0019798) |
| 0.9 | 4.4 | GO:0038062 | protein tyrosine kinase collagen receptor activity(GO:0038062) |
| 0.9 | 7.9 | GO:0086083 | cell adhesive protein binding involved in bundle of His cell-Purkinje myocyte communication(GO:0086083) |
| 0.8 | 0.8 | GO:0038064 | collagen receptor activity(GO:0038064) |
| 0.8 | 15.8 | GO:0050786 | RAGE receptor binding(GO:0050786) |
| 0.7 | 6.0 | GO:0005497 | androgen binding(GO:0005497) |
| 0.7 | 2.9 | GO:0004598 | peptidylglycine monooxygenase activity(GO:0004504) peptidylamidoglycolate lyase activity(GO:0004598) |
| 0.7 | 3.6 | GO:0017161 | phosphatidylinositol-3,4-bisphosphate 4-phosphatase activity(GO:0016316) inositol-1,3,4-trisphosphate 4-phosphatase activity(GO:0017161) phosphatidylinositol-4,5-bisphosphate 4-phosphatase activity(GO:0034597) inositol-3,4-bisphosphate 4-phosphatase activity(GO:0052828) |
| 0.7 | 3.5 | GO:0030348 | syntaxin-3 binding(GO:0030348) |
| 0.7 | 3.5 | GO:0043120 | tumor necrosis factor binding(GO:0043120) |
| 0.7 | 2.0 | GO:0034739 | histone deacetylase activity (H4-K16 specific)(GO:0034739) |
| 0.7 | 7.2 | GO:0051371 | muscle alpha-actinin binding(GO:0051371) |
| 0.7 | 2.6 | GO:0008184 | glycogen phosphorylase activity(GO:0008184) |
| 0.7 | 9.8 | GO:0035256 | G-protein coupled glutamate receptor binding(GO:0035256) |
| 0.6 | 1.8 | GO:0070052 | collagen V binding(GO:0070052) |
| 0.6 | 3.5 | GO:1990254 | keratin filament binding(GO:1990254) |
| 0.6 | 7.8 | GO:0005243 | gap junction channel activity(GO:0005243) |
| 0.6 | 2.2 | GO:0048408 | epidermal growth factor binding(GO:0048408) |
| 0.6 | 1.7 | GO:0019834 | phospholipase A2 inhibitor activity(GO:0019834) |
| 0.6 | 3.3 | GO:0005134 | interleukin-2 receptor binding(GO:0005134) |
| 0.5 | 6.3 | GO:0032050 | clathrin heavy chain binding(GO:0032050) |
| 0.5 | 1.6 | GO:0036487 | nitric-oxide synthase inhibitor activity(GO:0036487) |
| 0.5 | 9.7 | GO:0031994 | insulin-like growth factor I binding(GO:0031994) |
| 0.5 | 2.6 | GO:0015307 | drug:proton antiporter activity(GO:0015307) |
| 0.5 | 1.5 | GO:0004781 | adenylylsulfate kinase activity(GO:0004020) sulfate adenylyltransferase activity(GO:0004779) sulfate adenylyltransferase (ATP) activity(GO:0004781) |
| 0.5 | 8.1 | GO:0017166 | vinculin binding(GO:0017166) |
| 0.5 | 2.0 | GO:0035651 | AP-3 adaptor complex binding(GO:0035651) |
| 0.5 | 1.0 | GO:0003680 | AT DNA binding(GO:0003680) |
| 0.5 | 0.5 | GO:0015183 | L-aspartate transmembrane transporter activity(GO:0015183) |
| 0.5 | 3.3 | GO:1990599 | 3' overhang single-stranded DNA endodeoxyribonuclease activity(GO:1990599) |
| 0.5 | 5.6 | GO:0045159 | myosin II binding(GO:0045159) |
| 0.5 | 1.4 | GO:0032089 | NACHT domain binding(GO:0032089) |
| 0.5 | 4.6 | GO:0008607 | phosphorylase kinase regulator activity(GO:0008607) |
| 0.5 | 1.4 | GO:0016603 | glutaminyl-peptide cyclotransferase activity(GO:0016603) |
| 0.5 | 44.7 | GO:0008307 | structural constituent of muscle(GO:0008307) |
| 0.4 | 2.2 | GO:0005152 | interleukin-1 receptor antagonist activity(GO:0005152) |
| 0.4 | 3.9 | GO:0070915 | lysophosphatidic acid receptor activity(GO:0070915) |
| 0.4 | 1.3 | GO:0008476 | protein-tyrosine sulfotransferase activity(GO:0008476) |
| 0.4 | 9.4 | GO:0030898 | actin-dependent ATPase activity(GO:0030898) |
| 0.4 | 11.5 | GO:0098641 | cadherin binding involved in cell-cell adhesion(GO:0098641) |
| 0.4 | 10.6 | GO:0005523 | tropomyosin binding(GO:0005523) |
| 0.4 | 0.8 | GO:0004515 | nicotinate-nucleotide adenylyltransferase activity(GO:0004515) |
| 0.4 | 2.1 | GO:0015111 | iodide transmembrane transporter activity(GO:0015111) |
| 0.4 | 3.2 | GO:0030023 | extracellular matrix constituent conferring elasticity(GO:0030023) |
| 0.4 | 1.2 | GO:0005169 | neurotrophin TRKB receptor binding(GO:0005169) |
| 0.4 | 0.4 | GO:0017002 | activin-activated receptor activity(GO:0017002) |
| 0.4 | 1.2 | GO:0030226 | apolipoprotein receptor activity(GO:0030226) apolipoprotein A-I receptor activity(GO:0034188) phosphatidylserine-translocating ATPase activity(GO:0090556) |
| 0.4 | 5.0 | GO:0046870 | cadmium ion binding(GO:0046870) |
| 0.4 | 3.4 | GO:0032190 | acrosin binding(GO:0032190) |
| 0.4 | 1.1 | GO:0098626 | methylselenol reductase activity(GO:0098625) methylseleninic acid reductase activity(GO:0098626) |
| 0.4 | 0.4 | GO:0005017 | platelet-derived growth factor-activated receptor activity(GO:0005017) |
| 0.4 | 3.3 | GO:0048495 | Roundabout binding(GO:0048495) |
| 0.4 | 5.5 | GO:0005540 | hyaluronic acid binding(GO:0005540) |
| 0.4 | 2.2 | GO:0047115 | phenanthrene 9,10-monooxygenase activity(GO:0018636) ketosteroid monooxygenase activity(GO:0047086) trans-1,2-dihydrobenzene-1,2-diol dehydrogenase activity(GO:0047115) |
| 0.4 | 1.1 | GO:0016838 | carbon-oxygen lyase activity, acting on phosphates(GO:0016838) |
| 0.4 | 2.9 | GO:0001968 | fibronectin binding(GO:0001968) |
| 0.4 | 6.5 | GO:0048185 | activin binding(GO:0048185) |
| 0.4 | 1.1 | GO:0046573 | lactonohydrolase activity(GO:0046573) acyl-L-homoserine-lactone lactonohydrolase activity(GO:0102007) |
| 0.4 | 0.4 | GO:0048407 | platelet-derived growth factor binding(GO:0048407) |
| 0.4 | 1.4 | GO:0098639 | collagen binding involved in cell-matrix adhesion(GO:0098639) |
| 0.4 | 36.9 | GO:0004867 | serine-type endopeptidase inhibitor activity(GO:0004867) |
| 0.3 | 1.4 | GO:0004667 | prostaglandin-D synthase activity(GO:0004667) |
| 0.3 | 1.4 | GO:0004348 | glucosylceramidase activity(GO:0004348) |
| 0.3 | 2.7 | GO:0032036 | myosin heavy chain binding(GO:0032036) |
| 0.3 | 1.0 | GO:0016262 | protein N-acetylglucosaminyltransferase activity(GO:0016262) |
| 0.3 | 0.3 | GO:0070905 | serine binding(GO:0070905) |
| 0.3 | 0.3 | GO:0043208 | glycosphingolipid binding(GO:0043208) |
| 0.3 | 2.0 | GO:0050656 | 3'-phosphoadenosine 5'-phosphosulfate binding(GO:0050656) |
| 0.3 | 1.3 | GO:0033906 | hyaluronoglucuronidase activity(GO:0033906) |
| 0.3 | 3.0 | GO:0038085 | vascular endothelial growth factor binding(GO:0038085) |
| 0.3 | 1.6 | GO:0031013 | troponin I binding(GO:0031013) |
| 0.3 | 0.3 | GO:0047238 | glucuronosyl-N-acetylgalactosaminyl-proteoglycan 4-beta-N-acetylgalactosaminyltransferase activity(GO:0047238) |
| 0.3 | 5.1 | GO:0008179 | adenylate cyclase binding(GO:0008179) |
| 0.3 | 8.9 | GO:0070410 | co-SMAD binding(GO:0070410) |
| 0.3 | 0.9 | GO:0052894 | norspermine:oxygen oxidoreductase activity(GO:0052894) N1-acetylspermine:oxygen oxidoreductase (N1-acetylspermidine-forming) activity(GO:0052895) |
| 0.3 | 0.3 | GO:0008296 | 3'-5'-exodeoxyribonuclease activity(GO:0008296) single-stranded DNA exodeoxyribonuclease activity(GO:0008297) single-stranded DNA 3'-5' exodeoxyribonuclease activity(GO:0008310) |
| 0.3 | 3.8 | GO:0004128 | cytochrome-b5 reductase activity, acting on NAD(P)H(GO:0004128) |
| 0.3 | 3.4 | GO:0001042 | RNA polymerase I core binding(GO:0001042) |
| 0.3 | 2.5 | GO:0030346 | protein phosphatase 2B binding(GO:0030346) |
| 0.3 | 1.2 | GO:0050220 | prostaglandin-E synthase activity(GO:0050220) |
| 0.3 | 1.2 | GO:0008336 | gamma-butyrobetaine dioxygenase activity(GO:0008336) |
| 0.3 | 2.4 | GO:0034235 | GPI anchor binding(GO:0034235) |
| 0.3 | 2.4 | GO:0004111 | creatine kinase activity(GO:0004111) |
| 0.3 | 0.9 | GO:0050501 | hyaluronan synthase activity(GO:0050501) |
| 0.3 | 1.8 | GO:0008467 | [heparan sulfate]-glucosamine 3-sulfotransferase 1 activity(GO:0008467) |
| 0.3 | 3.5 | GO:0031821 | G-protein coupled serotonin receptor binding(GO:0031821) |
| 0.3 | 4.4 | GO:0045499 | chemorepellent activity(GO:0045499) |
| 0.3 | 0.9 | GO:0047757 | chondroitin-glucuronate 5-epimerase activity(GO:0047757) |
| 0.3 | 26.4 | GO:0005201 | extracellular matrix structural constituent(GO:0005201) |
| 0.3 | 1.7 | GO:0010859 | calcium-dependent cysteine-type endopeptidase inhibitor activity(GO:0010859) |
| 0.3 | 1.4 | GO:0004090 | carbonyl reductase (NADPH) activity(GO:0004090) |
| 0.3 | 4.5 | GO:0016641 | oxidoreductase activity, acting on the CH-NH2 group of donors, oxygen as acceptor(GO:0016641) |
| 0.3 | 2.2 | GO:0036042 | long-chain fatty acyl-CoA binding(GO:0036042) |
| 0.3 | 10.5 | GO:0003785 | actin monomer binding(GO:0003785) |
| 0.3 | 1.1 | GO:0015319 | sodium:inorganic phosphate symporter activity(GO:0015319) |
| 0.3 | 0.8 | GO:0004817 | cysteine-tRNA ligase activity(GO:0004817) |
| 0.3 | 4.9 | GO:0004861 | cyclin-dependent protein serine/threonine kinase inhibitor activity(GO:0004861) |
| 0.3 | 0.8 | GO:0070538 | oleic acid binding(GO:0070538) |
| 0.3 | 1.1 | GO:0003827 | alpha-1,3-mannosylglycoprotein 2-beta-N-acetylglucosaminyltransferase activity(GO:0003827) |
| 0.3 | 1.0 | GO:0050473 | arachidonate 15-lipoxygenase activity(GO:0050473) |
| 0.3 | 9.9 | GO:0015020 | glucuronosyltransferase activity(GO:0015020) |
| 0.3 | 2.1 | GO:0004865 | protein serine/threonine phosphatase inhibitor activity(GO:0004865) |
| 0.3 | 0.3 | GO:0005150 | interleukin-1, Type I receptor binding(GO:0005150) |
| 0.3 | 2.8 | GO:0008253 | 5'-nucleotidase activity(GO:0008253) |
| 0.3 | 1.5 | GO:0015057 | thrombin receptor activity(GO:0015057) |
| 0.2 | 1.0 | GO:0061769 | ribosylnicotinamide kinase activity(GO:0050262) ribosylnicotinate kinase activity(GO:0061769) |
| 0.2 | 1.2 | GO:0004882 | androgen receptor activity(GO:0004882) |
| 0.2 | 3.7 | GO:0004653 | polypeptide N-acetylgalactosaminyltransferase activity(GO:0004653) |
| 0.2 | 1.2 | GO:0033192 | calmodulin-dependent protein phosphatase activity(GO:0033192) |
| 0.2 | 2.4 | GO:0045545 | syndecan binding(GO:0045545) |
| 0.2 | 1.0 | GO:0061714 | folic acid receptor activity(GO:0061714) |
| 0.2 | 0.5 | GO:0055131 | C3HC4-type RING finger domain binding(GO:0055131) |
| 0.2 | 0.7 | GO:0004157 | dihydropyrimidinase activity(GO:0004157) |
| 0.2 | 5.4 | GO:0050750 | low-density lipoprotein particle receptor binding(GO:0050750) |
| 0.2 | 0.7 | GO:0016899 | oxidoreductase activity, acting on the CH-OH group of donors, oxygen as acceptor(GO:0016899) |
| 0.2 | 0.9 | GO:0008823 | cupric reductase activity(GO:0008823) ferric-chelate reductase (NADPH) activity(GO:0052851) |
| 0.2 | 1.4 | GO:0005499 | vitamin D binding(GO:0005499) |
| 0.2 | 0.2 | GO:0032810 | sterol response element binding(GO:0032810) |
| 0.2 | 0.9 | GO:0004909 | interleukin-1, Type I, activating receptor activity(GO:0004909) |
| 0.2 | 0.2 | GO:0003923 | GPI-anchor transamidase activity(GO:0003923) |
| 0.2 | 0.2 | GO:0034186 | apolipoprotein A-I binding(GO:0034186) |
| 0.2 | 0.7 | GO:1901474 | azole transmembrane transporter activity(GO:1901474) |
| 0.2 | 0.7 | GO:0004924 | oncostatin-M receptor activity(GO:0004924) |
| 0.2 | 3.8 | GO:0030881 | beta-2-microglobulin binding(GO:0030881) |
| 0.2 | 0.7 | GO:0004032 | alditol:NADP+ 1-oxidoreductase activity(GO:0004032) |
| 0.2 | 2.8 | GO:0030280 | structural constituent of epidermis(GO:0030280) |
| 0.2 | 1.5 | GO:0004126 | cytidine deaminase activity(GO:0004126) |
| 0.2 | 0.4 | GO:0005137 | interleukin-5 receptor binding(GO:0005137) |
| 0.2 | 0.9 | GO:0005105 | type 1 fibroblast growth factor receptor binding(GO:0005105) |
| 0.2 | 0.6 | GO:0004962 | endothelin receptor activity(GO:0004962) |
| 0.2 | 0.6 | GO:0004821 | histidine-tRNA ligase activity(GO:0004821) |
| 0.2 | 0.2 | GO:0003990 | acetylcholinesterase activity(GO:0003990) |
| 0.2 | 2.5 | GO:0004017 | adenylate kinase activity(GO:0004017) |
| 0.2 | 1.0 | GO:0060961 | phospholipase D inhibitor activity(GO:0060961) |
| 0.2 | 0.8 | GO:0017089 | glycolipid transporter activity(GO:0017089) |
| 0.2 | 0.6 | GO:0018685 | alkane 1-monooxygenase activity(GO:0018685) |
| 0.2 | 10.6 | GO:0050840 | extracellular matrix binding(GO:0050840) |
| 0.2 | 0.6 | GO:0004605 | phosphatidate cytidylyltransferase activity(GO:0004605) |
| 0.2 | 0.2 | GO:1904264 | ubiquitin protein ligase activity involved in ERAD pathway(GO:1904264) |
| 0.2 | 1.0 | GO:0045134 | uridine-diphosphatase activity(GO:0045134) |
| 0.2 | 0.8 | GO:0047288 | monosialoganglioside sialyltransferase activity(GO:0047288) |
| 0.2 | 0.6 | GO:0003980 | UDP-glucose:glycoprotein glucosyltransferase activity(GO:0003980) |
| 0.2 | 0.6 | GO:0008798 | beta-aspartyl-peptidase activity(GO:0008798) |
| 0.2 | 0.6 | GO:0004797 | thymidine kinase activity(GO:0004797) |
| 0.2 | 1.0 | GO:0032795 | heterotrimeric G-protein binding(GO:0032795) |
| 0.2 | 4.9 | GO:0080025 | phosphatidylinositol-3,5-bisphosphate binding(GO:0080025) |
| 0.2 | 1.2 | GO:0016015 | morphogen activity(GO:0016015) |
| 0.2 | 2.9 | GO:0005402 | sugar:proton symporter activity(GO:0005351) cation:sugar symporter activity(GO:0005402) |
| 0.2 | 0.8 | GO:0016972 | flavin-linked sulfhydryl oxidase activity(GO:0016971) thiol oxidase activity(GO:0016972) |
| 0.2 | 0.2 | GO:0086062 | voltage-gated sodium channel activity involved in Purkinje myocyte action potential(GO:0086062) |
| 0.2 | 0.8 | GO:0001102 | RNA polymerase II activating transcription factor binding(GO:0001102) |
| 0.2 | 7.0 | GO:0070412 | R-SMAD binding(GO:0070412) |
| 0.2 | 0.9 | GO:0046912 | transferase activity, transferring acyl groups, acyl groups converted into alkyl on transfer(GO:0046912) |
| 0.2 | 0.7 | GO:0004427 | inorganic diphosphatase activity(GO:0004427) |
| 0.2 | 1.3 | GO:0035614 | snRNA stem-loop binding(GO:0035614) |
| 0.2 | 1.5 | GO:0032051 | clathrin light chain binding(GO:0032051) |
| 0.2 | 1.5 | GO:0019871 | sodium channel inhibitor activity(GO:0019871) |
| 0.2 | 0.5 | GO:0004392 | heme oxygenase (decyclizing) activity(GO:0004392) |
| 0.2 | 0.7 | GO:0016623 | aldehyde oxidase activity(GO:0004031) oxidoreductase activity, acting on the aldehyde or oxo group of donors, oxygen as acceptor(GO:0016623) |
| 0.2 | 1.1 | GO:0031014 | troponin T binding(GO:0031014) |
| 0.2 | 0.5 | GO:0017018 | myosin phosphatase activity(GO:0017018) |
| 0.2 | 0.2 | GO:0047718 | indanol dehydrogenase activity(GO:0047718) |
| 0.2 | 1.8 | GO:1990459 | transferrin receptor binding(GO:1990459) |
| 0.2 | 2.8 | GO:0045236 | CXCR chemokine receptor binding(GO:0045236) |
| 0.2 | 7.3 | GO:0017080 | sodium channel regulator activity(GO:0017080) |
| 0.2 | 0.5 | GO:0030350 | iron-responsive element binding(GO:0030350) |
| 0.2 | 0.5 | GO:0000773 | phosphatidyl-N-methylethanolamine N-methyltransferase activity(GO:0000773) phosphatidylethanolamine N-methyltransferase activity(GO:0004608) phosphatidyl-N-dimethylethanolamine N-methyltransferase activity(GO:0080101) |
| 0.2 | 0.5 | GO:0001665 | alpha-N-acetylgalactosaminide alpha-2,6-sialyltransferase activity(GO:0001665) |
| 0.2 | 2.7 | GO:0008569 | ATP-dependent microtubule motor activity, minus-end-directed(GO:0008569) |
| 0.2 | 0.5 | GO:0016309 | 1-phosphatidylinositol-5-phosphate 4-kinase activity(GO:0016309) |
| 0.2 | 1.0 | GO:0004465 | lipoprotein lipase activity(GO:0004465) |
| 0.2 | 0.3 | GO:0017075 | syntaxin-1 binding(GO:0017075) |
| 0.2 | 0.3 | GO:0070405 | ammonium ion binding(GO:0070405) |
| 0.2 | 1.5 | GO:0008517 | folic acid transporter activity(GO:0008517) |
| 0.2 | 0.5 | GO:0019992 | diacylglycerol binding(GO:0019992) |
| 0.2 | 0.3 | GO:1904929 | coreceptor activity involved in Wnt signaling pathway(GO:0071936) coreceptor activity involved in Wnt signaling pathway, planar cell polarity pathway(GO:1904929) |
| 0.2 | 0.7 | GO:0004466 | long-chain-acyl-CoA dehydrogenase activity(GO:0004466) |
| 0.2 | 0.7 | GO:0005046 | KDEL sequence binding(GO:0005046) |
| 0.2 | 1.0 | GO:0019215 | intermediate filament binding(GO:0019215) |
| 0.2 | 2.3 | GO:0004745 | retinol dehydrogenase activity(GO:0004745) |
| 0.2 | 3.2 | GO:0045504 | dynein heavy chain binding(GO:0045504) |
| 0.2 | 0.5 | GO:0004828 | serine-tRNA ligase activity(GO:0004828) |
| 0.2 | 4.2 | GO:0005527 | macrolide binding(GO:0005527) FK506 binding(GO:0005528) |
| 0.2 | 0.5 | GO:0004947 | bradykinin receptor activity(GO:0004947) |
| 0.2 | 0.5 | GO:0047223 | beta-1,3-galactosyl-O-glycosyl-glycoprotein beta-1,3-N-acetylglucosaminyltransferase activity(GO:0047223) |
| 0.2 | 0.8 | GO:0071723 | lipopeptide binding(GO:0071723) |
| 0.2 | 0.3 | GO:0050051 | leukotriene-B4 20-monooxygenase activity(GO:0050051) |
| 0.2 | 0.3 | GO:0015924 | mannosyl-oligosaccharide mannosidase activity(GO:0015924) |
| 0.2 | 0.5 | GO:0003881 | CDP-diacylglycerol-inositol 3-phosphatidyltransferase activity(GO:0003881) |
| 0.2 | 0.2 | GO:0004028 | 3-chloroallyl aldehyde dehydrogenase activity(GO:0004028) |
| 0.2 | 1.4 | GO:0035877 | death effector domain binding(GO:0035877) |
| 0.2 | 0.6 | GO:0004782 | sulfinoalanine decarboxylase activity(GO:0004782) |
| 0.2 | 3.2 | GO:0070006 | metalloaminopeptidase activity(GO:0070006) |
| 0.2 | 0.5 | GO:0055102 | lipase inhibitor activity(GO:0055102) |
| 0.1 | 0.4 | GO:0031730 | CCR5 chemokine receptor binding(GO:0031730) |
| 0.1 | 0.6 | GO:0003989 | acetyl-CoA carboxylase activity(GO:0003989) |
| 0.1 | 0.7 | GO:0070576 | vitamin D 24-hydroxylase activity(GO:0070576) |
| 0.1 | 0.1 | GO:0004735 | pyrroline-5-carboxylate reductase activity(GO:0004735) |
| 0.1 | 1.2 | GO:0017048 | Rho GTPase binding(GO:0017048) |
| 0.1 | 2.0 | GO:0030276 | clathrin binding(GO:0030276) |
| 0.1 | 0.7 | GO:0005375 | copper ion transmembrane transporter activity(GO:0005375) |
| 0.1 | 0.4 | GO:0050610 | oxidoreductase activity, acting on a sulfur group of donors, quinone or similar compound as acceptor(GO:0016672) glutathione dehydrogenase (ascorbate) activity(GO:0045174) methylarsonate reductase activity(GO:0050610) |
| 0.1 | 2.1 | GO:0048018 | receptor agonist activity(GO:0048018) |
| 0.1 | 2.0 | GO:0015280 | ligand-gated sodium channel activity(GO:0015280) |
| 0.1 | 0.4 | GO:0033867 | Fas-activated serine/threonine kinase activity(GO:0033867) |
| 0.1 | 0.3 | GO:0008252 | nucleotidase activity(GO:0008252) |
| 0.1 | 0.8 | GO:0003920 | GMP reductase activity(GO:0003920) oxidoreductase activity, acting on NAD(P)H, nitrogenous group as acceptor(GO:0016657) |
| 0.1 | 0.1 | GO:0043422 | protein kinase B binding(GO:0043422) |
| 0.1 | 0.8 | GO:0004614 | phosphoglucomutase activity(GO:0004614) |
| 0.1 | 1.9 | GO:0005149 | interleukin-1 receptor binding(GO:0005149) |
| 0.1 | 0.4 | GO:0004040 | amidase activity(GO:0004040) |
| 0.1 | 0.4 | GO:0004582 | dolichyl-phosphate beta-D-mannosyltransferase activity(GO:0004582) |
| 0.1 | 0.6 | GO:0008431 | vitamin E binding(GO:0008431) |
| 0.1 | 0.4 | GO:0030158 | protein xylosyltransferase activity(GO:0030158) |
| 0.1 | 1.5 | GO:0047372 | acylglycerol lipase activity(GO:0047372) |
| 0.1 | 0.5 | GO:0038132 | neuregulin binding(GO:0038132) |
| 0.1 | 1.3 | GO:0005432 | calcium:sodium antiporter activity(GO:0005432) |
| 0.1 | 0.5 | GO:0004743 | pyruvate kinase activity(GO:0004743) |
| 0.1 | 1.6 | GO:0005391 | sodium:potassium-exchanging ATPase activity(GO:0005391) |
| 0.1 | 0.9 | GO:0016206 | catechol O-methyltransferase activity(GO:0016206) |
| 0.1 | 1.0 | GO:0034452 | dynactin binding(GO:0034452) |
| 0.1 | 4.3 | GO:0004198 | calcium-dependent cysteine-type endopeptidase activity(GO:0004198) |
| 0.1 | 0.5 | GO:0004771 | sterol esterase activity(GO:0004771) |
| 0.1 | 0.4 | GO:0008430 | selenium binding(GO:0008430) |
| 0.1 | 1.3 | GO:0031683 | G-protein beta/gamma-subunit complex binding(GO:0031683) |
| 0.1 | 0.8 | GO:0008553 | hydrogen-exporting ATPase activity, phosphorylative mechanism(GO:0008553) |
| 0.1 | 0.4 | GO:0004022 | alcohol dehydrogenase (NAD) activity(GO:0004022) |
| 0.1 | 0.1 | GO:0009055 | electron carrier activity(GO:0009055) |
| 0.1 | 0.5 | GO:0008449 | N-acetylglucosamine-6-sulfatase activity(GO:0008449) |
| 0.1 | 0.6 | GO:0052841 | endopolyphosphatase activity(GO:0000298) diphosphoinositol-polyphosphate diphosphatase activity(GO:0008486) bis(5'-adenosyl)-hexaphosphatase activity(GO:0034431) bis(5'-adenosyl)-pentaphosphatase activity(GO:0034432) inositol diphosphate tetrakisphosphate diphosphatase activity(GO:0052840) inositol bisdiphosphate tetrakisphosphate diphosphatase activity(GO:0052841) inositol diphosphate pentakisphosphate diphosphatase activity(GO:0052842) inositol-1-diphosphate-2,3,4,5,6-pentakisphosphate diphosphatase activity(GO:0052843) inositol-3-diphosphate-1,2,4,5,6-pentakisphosphate diphosphatase activity(GO:0052844) inositol-5-diphosphate-1,2,3,4,6-pentakisphosphate diphosphatase activity(GO:0052845) inositol-1,5-bisdiphosphate-2,3,4,6-tetrakisphosphate 1-diphosphatase activity(GO:0052846) inositol-1,5-bisdiphosphate-2,3,4,6-tetrakisphosphate 5-diphosphatase activity(GO:0052847) inositol-3,5-bisdiphosphate-2,3,4,6-tetrakisphosphate 5-diphosphatase activity(GO:0052848) |
| 0.1 | 0.9 | GO:0016290 | palmitoyl-CoA hydrolase activity(GO:0016290) |
| 0.1 | 1.0 | GO:0005172 | vascular endothelial growth factor receptor binding(GO:0005172) |
| 0.1 | 0.4 | GO:0047374 | methylumbelliferyl-acetate deacetylase activity(GO:0047374) |
| 0.1 | 0.9 | GO:0004457 | lactate dehydrogenase activity(GO:0004457) L-lactate dehydrogenase activity(GO:0004459) |
| 0.1 | 5.5 | GO:0005154 | epidermal growth factor receptor binding(GO:0005154) |
| 0.1 | 1.0 | GO:0008559 | xenobiotic-transporting ATPase activity(GO:0008559) |
| 0.1 | 1.7 | GO:0043495 | protein anchor(GO:0043495) |
| 0.1 | 0.6 | GO:0070411 | I-SMAD binding(GO:0070411) |
| 0.1 | 0.5 | GO:0031716 | calcitonin receptor binding(GO:0031716) |
| 0.1 | 0.4 | GO:0003983 | UTP:glucose-1-phosphate uridylyltransferase activity(GO:0003983) UTP-monosaccharide-1-phosphate uridylyltransferase activity(GO:0051748) |
| 0.1 | 0.7 | GO:0004415 | hyalurononglucosaminidase activity(GO:0004415) |
| 0.1 | 0.7 | GO:0003998 | acylphosphatase activity(GO:0003998) |
| 0.1 | 4.6 | GO:0004385 | guanylate kinase activity(GO:0004385) |
| 0.1 | 3.8 | GO:0005518 | collagen binding(GO:0005518) |
| 0.1 | 3.9 | GO:0016709 | oxidoreductase activity, acting on paired donors, with incorporation or reduction of molecular oxygen, NAD(P)H as one donor, and incorporation of one atom of oxygen(GO:0016709) |
| 0.1 | 10.1 | GO:0051015 | actin filament binding(GO:0051015) |
| 0.1 | 12.4 | GO:0004222 | metalloendopeptidase activity(GO:0004222) |
| 0.1 | 0.5 | GO:0019201 | nucleotide kinase activity(GO:0019201) |
| 0.1 | 0.5 | GO:0046923 | ER retention sequence binding(GO:0046923) |
| 0.1 | 0.5 | GO:0005026 | transforming growth factor beta receptor activity, type II(GO:0005026) |
| 0.1 | 2.1 | GO:0070016 | armadillo repeat domain binding(GO:0070016) |
| 0.1 | 0.2 | GO:0010385 | double-stranded methylated DNA binding(GO:0010385) |
| 0.1 | 0.7 | GO:0051011 | microtubule minus-end binding(GO:0051011) |
| 0.1 | 0.6 | GO:0016300 | tRNA (uracil) methyltransferase activity(GO:0016300) |
| 0.1 | 1.9 | GO:0008484 | sulfuric ester hydrolase activity(GO:0008484) |
| 0.1 | 0.8 | GO:0060072 | large conductance calcium-activated potassium channel activity(GO:0060072) |
| 0.1 | 3.5 | GO:0017147 | Wnt-protein binding(GO:0017147) |
| 0.1 | 0.3 | GO:0050135 | NAD+ nucleosidase activity(GO:0003953) NAD(P)+ nucleosidase activity(GO:0050135) |
| 0.1 | 0.7 | GO:0045569 | TRAIL binding(GO:0045569) |
| 0.1 | 0.7 | GO:0016941 | natriuretic peptide receptor activity(GO:0016941) |
| 0.1 | 0.4 | GO:0008670 | 2,4-dienoyl-CoA reductase (NADPH) activity(GO:0008670) |
| 0.1 | 0.2 | GO:0035529 | NADH pyrophosphatase activity(GO:0035529) |
| 0.1 | 2.9 | GO:0070064 | proline-rich region binding(GO:0070064) |
| 0.1 | 2.4 | GO:0017134 | fibroblast growth factor binding(GO:0017134) |
| 0.1 | 0.3 | GO:0019855 | calcium channel inhibitor activity(GO:0019855) |
| 0.1 | 0.3 | GO:0004087 | carbamoyl-phosphate synthase (ammonia) activity(GO:0004087) carbamoyl-phosphate synthase (glutamine-hydrolyzing) activity(GO:0004088) |
| 0.1 | 1.8 | GO:0008432 | JUN kinase binding(GO:0008432) |
| 0.1 | 1.4 | GO:0004985 | opioid receptor activity(GO:0004985) |
| 0.1 | 0.4 | GO:0004679 | AMP-activated protein kinase activity(GO:0004679) |
| 0.1 | 0.3 | GO:0036080 | GDP-fucose transmembrane transporter activity(GO:0005457) purine nucleotide-sugar transmembrane transporter activity(GO:0036080) |
| 0.1 | 0.2 | GO:0047006 | 17-alpha,20-alpha-dihydroxypregn-4-en-3-one dehydrogenase activity(GO:0047006) |
| 0.1 | 0.5 | GO:0035374 | chondroitin sulfate binding(GO:0035374) |
| 0.1 | 0.3 | GO:0004450 | isocitrate dehydrogenase (NADP+) activity(GO:0004450) |
| 0.1 | 0.3 | GO:0008386 | cholesterol monooxygenase (side-chain-cleaving) activity(GO:0008386) |
| 0.1 | 7.1 | GO:0032947 | protein complex scaffold(GO:0032947) |
| 0.1 | 0.5 | GO:0050815 | phosphoserine binding(GO:0050815) |
| 0.1 | 1.2 | GO:0070273 | phosphatidylinositol-4-phosphate binding(GO:0070273) |
| 0.1 | 1.0 | GO:0043995 | histone acetyltransferase activity (H4-K5 specific)(GO:0043995) histone acetyltransferase activity (H4-K8 specific)(GO:0043996) histone acetyltransferase activity (H4-K16 specific)(GO:0046972) |
| 0.1 | 0.4 | GO:0016724 | ferroxidase activity(GO:0004322) oxidoreductase activity, oxidizing metal ions, oxygen as acceptor(GO:0016724) |
| 0.1 | 2.3 | GO:0005092 | GDP-dissociation inhibitor activity(GO:0005092) |
| 0.1 | 0.2 | GO:0003746 | translation elongation factor activity(GO:0003746) |
| 0.1 | 0.8 | GO:0035251 | UDP-glucosyltransferase activity(GO:0035251) |
| 0.1 | 2.2 | GO:0043014 | alpha-tubulin binding(GO:0043014) |
| 0.1 | 0.5 | GO:0004991 | parathyroid hormone receptor activity(GO:0004991) |
| 0.1 | 0.3 | GO:0070984 | SET domain binding(GO:0070984) |
| 0.1 | 2.3 | GO:0046875 | ephrin receptor binding(GO:0046875) |
| 0.1 | 0.2 | GO:0008392 | arachidonic acid monooxygenase activity(GO:0008391) arachidonic acid epoxygenase activity(GO:0008392) |
| 0.1 | 2.6 | GO:0043015 | gamma-tubulin binding(GO:0043015) |
| 0.1 | 1.6 | GO:0015035 | protein disulfide oxidoreductase activity(GO:0015035) |
| 0.1 | 0.3 | GO:0061752 | telomeric repeat-containing RNA binding(GO:0061752) |
| 0.1 | 0.4 | GO:0035259 | glucocorticoid receptor binding(GO:0035259) |
| 0.1 | 0.3 | GO:0019961 | interferon binding(GO:0019961) |
| 0.1 | 0.6 | GO:0043426 | MRF binding(GO:0043426) |
| 0.1 | 0.2 | GO:0034618 | arginine binding(GO:0034618) |
| 0.1 | 0.1 | GO:0047237 | glucuronylgalactosylproteoglycan 4-beta-N-acetylgalactosaminyltransferase activity(GO:0047237) |
| 0.1 | 2.2 | GO:0043548 | phosphatidylinositol 3-kinase binding(GO:0043548) |
| 0.1 | 0.5 | GO:0019966 | interleukin-1 binding(GO:0019966) |
| 0.1 | 0.3 | GO:0003845 | 11-beta-hydroxysteroid dehydrogenase [NAD(P)] activity(GO:0003845) |
| 0.1 | 0.3 | GO:0004574 | oligo-1,6-glucosidase activity(GO:0004574) |
| 0.1 | 0.1 | GO:0052650 | NADP-retinol dehydrogenase activity(GO:0052650) |
| 0.1 | 0.4 | GO:0061575 | cyclin-dependent protein serine/threonine kinase activator activity(GO:0061575) |
| 0.1 | 0.4 | GO:0022850 | serotonin-gated cation channel activity(GO:0022850) |
| 0.1 | 0.5 | GO:0002114 | interleukin-33 receptor activity(GO:0002114) |
| 0.1 | 1.1 | GO:0050700 | CARD domain binding(GO:0050700) |
| 0.1 | 1.7 | GO:0016701 | oxidoreductase activity, acting on single donors with incorporation of molecular oxygen(GO:0016701) |
| 0.1 | 0.8 | GO:0047499 | calcium-independent phospholipase A2 activity(GO:0047499) |
| 0.1 | 0.3 | GO:0042132 | fructose 1,6-bisphosphate 1-phosphatase activity(GO:0042132) |
| 0.1 | 0.3 | GO:0015254 | glycerol channel activity(GO:0015254) |
| 0.1 | 3.1 | GO:0048027 | mRNA 5'-UTR binding(GO:0048027) |
| 0.1 | 1.3 | GO:0043522 | leucine zipper domain binding(GO:0043522) |
| 0.1 | 1.3 | GO:0030546 | receptor activator activity(GO:0030546) |
| 0.1 | 1.3 | GO:0043274 | phospholipase binding(GO:0043274) |
| 0.1 | 0.2 | GO:1903135 | cupric ion binding(GO:1903135) |
| 0.1 | 0.4 | GO:0008597 | calcium-dependent protein serine/threonine phosphatase regulator activity(GO:0008597) |
| 0.1 | 0.4 | GO:0017060 | 3-galactosyl-N-acetylglucosaminide 4-alpha-L-fucosyltransferase activity(GO:0017060) |
| 0.1 | 0.4 | GO:0070891 | lipoteichoic acid binding(GO:0070891) |
| 0.1 | 0.3 | GO:0004982 | N-formyl peptide receptor activity(GO:0004982) |
| 0.1 | 0.2 | GO:0016713 | oxidoreductase activity, acting on paired donors, with incorporation or reduction of molecular oxygen, reduced iron-sulfur protein as one donor, and incorporation of one atom of oxygen(GO:0016713) |
| 0.1 | 2.3 | GO:0001671 | ATPase activator activity(GO:0001671) |
| 0.1 | 0.1 | GO:0046848 | hydroxyapatite binding(GO:0046848) |
| 0.1 | 0.2 | GO:0004139 | deoxyribose-phosphate aldolase activity(GO:0004139) |
| 0.1 | 0.1 | GO:0071208 | histone pre-mRNA DCP binding(GO:0071208) |
| 0.1 | 0.2 | GO:0004878 | complement component C5a receptor activity(GO:0004878) |
| 0.1 | 0.3 | GO:0004169 | dolichyl-phosphate-mannose-protein mannosyltransferase activity(GO:0004169) |
| 0.1 | 1.0 | GO:0036041 | long-chain fatty acid binding(GO:0036041) |
| 0.1 | 0.5 | GO:0004471 | malate dehydrogenase (decarboxylating) (NAD+) activity(GO:0004471) malate dehydrogenase (decarboxylating) (NADP+) activity(GO:0004473) oxaloacetate decarboxylase activity(GO:0008948) |
| 0.1 | 0.2 | GO:0016422 | mRNA (2'-O-methyladenosine-N6-)-methyltransferase activity(GO:0016422) |
| 0.1 | 0.5 | GO:0019776 | Atg8 ligase activity(GO:0019776) |
| 0.1 | 0.5 | GO:0017050 | sphinganine kinase activity(GO:0008481) D-erythro-sphingosine kinase activity(GO:0017050) |
| 0.1 | 0.8 | GO:0008656 | cysteine-type endopeptidase activator activity involved in apoptotic process(GO:0008656) |
| 0.1 | 0.8 | GO:0008191 | metalloendopeptidase inhibitor activity(GO:0008191) |
| 0.1 | 25.8 | GO:0045296 | cadherin binding(GO:0045296) |
| 0.1 | 0.5 | GO:0046790 | virion binding(GO:0046790) |
| 0.1 | 0.7 | GO:0051434 | BH3 domain binding(GO:0051434) |
| 0.1 | 0.7 | GO:0004689 | phosphorylase kinase activity(GO:0004689) |
| 0.1 | 0.2 | GO:0016833 | oxo-acid-lyase activity(GO:0016833) |
| 0.1 | 0.2 | GO:0016670 | oxidoreductase activity, acting on a sulfur group of donors, oxygen as acceptor(GO:0016670) |
| 0.1 | 1.8 | GO:0005212 | structural constituent of eye lens(GO:0005212) |
| 0.1 | 3.5 | GO:0005044 | scavenger receptor activity(GO:0005044) |
| 0.1 | 0.3 | GO:0015643 | toxic substance binding(GO:0015643) |
| 0.1 | 0.3 | GO:0004468 | lysine N-acetyltransferase activity, acting on acetyl phosphate as donor(GO:0004468) |
| 0.1 | 0.9 | GO:0035615 | clathrin adaptor activity(GO:0035615) endocytic adaptor activity(GO:0098748) |
| 0.1 | 0.3 | GO:0003867 | 4-aminobutyrate transaminase activity(GO:0003867) succinate-semialdehyde dehydrogenase binding(GO:0032145) (S)-3-amino-2-methylpropionate transaminase activity(GO:0047298) |
| 0.1 | 1.3 | GO:0008320 | protein transmembrane transporter activity(GO:0008320) |
| 0.1 | 0.1 | GO:0016423 | tRNA (guanine) methyltransferase activity(GO:0016423) |
| 0.1 | 0.1 | GO:0008035 | high-density lipoprotein particle binding(GO:0008035) |
| 0.1 | 0.4 | GO:0015252 | hydrogen ion channel activity(GO:0015252) |
| 0.1 | 1.2 | GO:0004143 | diacylglycerol kinase activity(GO:0004143) |
| 0.1 | 7.6 | GO:0044325 | ion channel binding(GO:0044325) |
| 0.1 | 0.3 | GO:0016230 | sphingomyelin phosphodiesterase activator activity(GO:0016230) |
| 0.1 | 0.4 | GO:0035368 | selenocysteine insertion sequence binding(GO:0035368) |
| 0.1 | 0.4 | GO:0038049 | transcription factor activity, ligand-activated RNA polymerase II transcription factor binding(GO:0038049) |
| 0.1 | 0.2 | GO:0016429 | tRNA (adenine) methyltransferase activity(GO:0016426) tRNA (adenine-N1-)-methyltransferase activity(GO:0016429) |
| 0.1 | 0.1 | GO:0070181 | small ribosomal subunit rRNA binding(GO:0070181) |
| 0.1 | 0.5 | GO:0035014 | phosphatidylinositol 3-kinase regulator activity(GO:0035014) |
| 0.1 | 0.5 | GO:0008093 | cytoskeletal adaptor activity(GO:0008093) |
| 0.1 | 0.3 | GO:0010997 | anaphase-promoting complex binding(GO:0010997) |
| 0.1 | 0.2 | GO:0017057 | 6-phosphogluconolactonase activity(GO:0017057) |
| 0.1 | 0.3 | GO:0097157 | pre-mRNA intronic binding(GO:0097157) |
| 0.1 | 0.2 | GO:0071209 | U7 snRNA binding(GO:0071209) |
| 0.1 | 0.1 | GO:0004886 | 9-cis retinoic acid receptor activity(GO:0004886) |
| 0.1 | 0.5 | GO:0004035 | alkaline phosphatase activity(GO:0004035) |
| 0.1 | 1.4 | GO:0048487 | beta-tubulin binding(GO:0048487) |
| 0.1 | 0.1 | GO:0034237 | protein kinase A regulatory subunit binding(GO:0034237) |
| 0.1 | 0.4 | GO:0003873 | 6-phosphofructo-2-kinase activity(GO:0003873) fructose-2,6-bisphosphate 2-phosphatase activity(GO:0004331) |
| 0.1 | 2.8 | GO:0015485 | cholesterol binding(GO:0015485) |
| 0.1 | 0.9 | GO:0001972 | retinoic acid binding(GO:0001972) |
| 0.1 | 0.5 | GO:0097109 | neuroligin family protein binding(GO:0097109) |
| 0.1 | 2.0 | GO:0019894 | kinesin binding(GO:0019894) |
| 0.1 | 0.1 | GO:0008556 | potassium-transporting ATPase activity(GO:0008556) |
| 0.1 | 0.2 | GO:0010340 | carboxyl-O-methyltransferase activity(GO:0010340) protein carboxyl O-methyltransferase activity(GO:0051998) |
| 0.1 | 0.4 | GO:0003960 | NADPH:quinone reductase activity(GO:0003960) |
| 0.1 | 6.7 | GO:0005200 | structural constituent of cytoskeleton(GO:0005200) |
| 0.1 | 5.5 | GO:0005178 | integrin binding(GO:0005178) |
| 0.1 | 0.4 | GO:0046703 | natural killer cell lectin-like receptor binding(GO:0046703) |
| 0.1 | 0.1 | GO:0008046 | axon guidance receptor activity(GO:0008046) |
| 0.1 | 0.1 | GO:0047184 | 1-acylglycerophosphocholine O-acyltransferase activity(GO:0047184) |
| 0.1 | 0.8 | GO:0000030 | mannosyltransferase activity(GO:0000030) |
| 0.1 | 0.7 | GO:0008020 | G-protein coupled photoreceptor activity(GO:0008020) |
| 0.1 | 0.2 | GO:0047035 | testosterone dehydrogenase (NAD+) activity(GO:0047035) |
| 0.1 | 2.5 | GO:0017137 | Rab GTPase binding(GO:0017137) |
| 0.1 | 0.4 | GO:0003810 | protein-glutamine gamma-glutamyltransferase activity(GO:0003810) |
| 0.1 | 0.7 | GO:0000146 | microfilament motor activity(GO:0000146) |
| 0.1 | 1.1 | GO:0005112 | Notch binding(GO:0005112) |
| 0.1 | 2.5 | GO:0005544 | calcium-dependent phospholipid binding(GO:0005544) |
| 0.1 | 0.3 | GO:0004161 | dimethylallyltranstransferase activity(GO:0004161) geranyltranstransferase activity(GO:0004337) |
| 0.1 | 0.6 | GO:0004030 | aldehyde dehydrogenase [NAD(P)+] activity(GO:0004030) |
| 0.1 | 0.2 | GO:0004630 | phospholipase D activity(GO:0004630) N-acylphosphatidylethanolamine-specific phospholipase D activity(GO:0070290) |
| 0.1 | 0.3 | GO:0002046 | opsin binding(GO:0002046) |
| 0.1 | 1.2 | GO:0016881 | acid-amino acid ligase activity(GO:0016881) |
| 0.1 | 0.4 | GO:0005324 | long-chain fatty acid transporter activity(GO:0005324) |
| 0.1 | 0.2 | GO:0005350 | pyrimidine nucleobase transmembrane transporter activity(GO:0005350) pyrimidine- and adenine-specific:sodium symporter activity(GO:0015389) |
| 0.1 | 2.2 | GO:0048365 | Rac GTPase binding(GO:0048365) |
| 0.1 | 0.1 | GO:0015265 | urea channel activity(GO:0015265) |
| 0.1 | 1.3 | GO:0016811 | hydrolase activity, acting on carbon-nitrogen (but not peptide) bonds, in linear amides(GO:0016811) |
| 0.1 | 0.5 | GO:0005000 | vasopressin receptor activity(GO:0005000) |
| 0.1 | 0.6 | GO:0004576 | oligosaccharyl transferase activity(GO:0004576) dolichyl-diphosphooligosaccharide-protein glycotransferase activity(GO:0004579) |
| 0.1 | 2.3 | GO:0004364 | glutathione transferase activity(GO:0004364) |
| 0.1 | 0.7 | GO:0017049 | GTP-Rho binding(GO:0017049) |
| 0.1 | 0.6 | GO:0030371 | translation repressor activity(GO:0030371) |
| 0.1 | 0.3 | GO:0003945 | N-acetyllactosamine synthase activity(GO:0003945) |
| 0.1 | 1.4 | GO:0008201 | heparin binding(GO:0008201) |
| 0.1 | 0.4 | GO:0004957 | prostaglandin E receptor activity(GO:0004957) |
| 0.1 | 0.4 | GO:1990226 | histone methyltransferase binding(GO:1990226) |
| 0.1 | 30.0 | GO:0005509 | calcium ion binding(GO:0005509) |
| 0.1 | 0.1 | GO:0016705 | oxidoreductase activity, acting on paired donors, with incorporation or reduction of molecular oxygen(GO:0016705) |
| 0.1 | 0.1 | GO:0045322 | unmethylated CpG binding(GO:0045322) |
| 0.1 | 1.2 | GO:0008327 | methyl-CpG binding(GO:0008327) |
| 0.1 | 0.6 | GO:0004300 | enoyl-CoA hydratase activity(GO:0004300) |
| 0.1 | 0.4 | GO:0030275 | LRR domain binding(GO:0030275) |
| 0.1 | 0.1 | GO:0003863 | alpha-ketoacid dehydrogenase activity(GO:0003826) 3-methyl-2-oxobutanoate dehydrogenase (2-methylpropanoyl-transferring) activity(GO:0003863) |
| 0.1 | 0.4 | GO:0005225 | volume-sensitive anion channel activity(GO:0005225) |
| 0.1 | 0.3 | GO:0030628 | pre-mRNA 3'-splice site binding(GO:0030628) |
| 0.1 | 0.3 | GO:0004673 | phosphorelay sensor kinase activity(GO:0000155) protein histidine kinase activity(GO:0004673) |
| 0.1 | 0.3 | GO:0004800 | thyroxine 5'-deiodinase activity(GO:0004800) |
| 0.1 | 0.7 | GO:0005251 | delayed rectifier potassium channel activity(GO:0005251) |
| 0.0 | 0.3 | GO:0016868 | intramolecular transferase activity, phosphotransferases(GO:0016868) |
| 0.0 | 3.8 | GO:0005089 | Rho guanyl-nucleotide exchange factor activity(GO:0005089) |
| 0.0 | 0.6 | GO:0070840 | dynein complex binding(GO:0070840) |
| 0.0 | 0.3 | GO:0030306 | ADP-ribosylation factor binding(GO:0030306) |
| 0.0 | 0.1 | GO:0003829 | beta-1,3-galactosyl-O-glycosyl-glycoprotein beta-1,6-N-acetylglucosaminyltransferase activity(GO:0003829) |
| 0.0 | 0.1 | GO:0070404 | NADH binding(GO:0070404) |
| 0.0 | 0.7 | GO:0005246 | calcium channel regulator activity(GO:0005246) |
| 0.0 | 0.8 | GO:0005546 | phosphatidylinositol-4,5-bisphosphate binding(GO:0005546) |
| 0.0 | 1.3 | GO:0051879 | Hsp90 protein binding(GO:0051879) |
| 0.0 | 0.2 | GO:0046979 | TAP2 binding(GO:0046979) |
| 0.0 | 0.1 | GO:0016653 | oxidoreductase activity, acting on NAD(P)H, heme protein as acceptor(GO:0016653) |
| 0.0 | 0.1 | GO:0004768 | stearoyl-CoA 9-desaturase activity(GO:0004768) acyl-CoA desaturase activity(GO:0016215) |
| 0.0 | 0.3 | GO:0070513 | death domain binding(GO:0070513) |
| 0.0 | 0.3 | GO:0004118 | cGMP-stimulated cyclic-nucleotide phosphodiesterase activity(GO:0004118) |
| 0.0 | 0.2 | GO:0045505 | dynein intermediate chain binding(GO:0045505) |
| 0.0 | 0.1 | GO:0004045 | aminoacyl-tRNA hydrolase activity(GO:0004045) |
| 0.0 | 0.6 | GO:0008331 | high voltage-gated calcium channel activity(GO:0008331) |
| 0.0 | 0.2 | GO:0001512 | dihydronicotinamide riboside quinone reductase activity(GO:0001512) melatonin binding(GO:1904408) |
| 0.0 | 0.2 | GO:0016402 | pristanoyl-CoA oxidase activity(GO:0016402) |
| 0.0 | 0.3 | GO:0070679 | inositol 1,4,5 trisphosphate binding(GO:0070679) |
| 0.0 | 0.0 | GO:0047498 | calcium-dependent phospholipase A2 activity(GO:0047498) |
| 0.0 | 0.3 | GO:0004741 | [pyruvate dehydrogenase (lipoamide)] phosphatase activity(GO:0004741) |
| 0.0 | 0.2 | GO:0004029 | aldehyde dehydrogenase (NAD) activity(GO:0004029) |
| 0.0 | 0.5 | GO:0001965 | G-protein alpha-subunit binding(GO:0001965) |
| 0.0 | 0.2 | GO:0016403 | dimethylargininase activity(GO:0016403) |
| 0.0 | 0.4 | GO:0015129 | lactate transmembrane transporter activity(GO:0015129) |
| 0.0 | 0.8 | GO:0005547 | phosphatidylinositol-3,4,5-trisphosphate binding(GO:0005547) |
| 0.0 | 0.1 | GO:0046965 | retinoid X receptor binding(GO:0046965) |
| 0.0 | 0.5 | GO:0000339 | RNA cap binding(GO:0000339) |
| 0.0 | 0.2 | GO:0043008 | ATP-dependent protein binding(GO:0043008) |
| 0.0 | 0.4 | GO:0005542 | folic acid binding(GO:0005542) |
| 0.0 | 0.1 | GO:0005127 | ciliary neurotrophic factor receptor binding(GO:0005127) |
| 0.0 | 1.0 | GO:0016805 | dipeptidase activity(GO:0016805) |
| 0.0 | 0.2 | GO:0008440 | inositol-1,4,5-trisphosphate 3-kinase activity(GO:0008440) |
| 0.0 | 0.1 | GO:0001132 | RNA polymerase II transcription factor activity, TBP-class protein binding, involved in preinitiation complex assembly(GO:0001129) RNA polymerase II transcription factor activity, TBP-class protein binding(GO:0001132) |
| 0.0 | 0.2 | GO:0061628 | H3K27me3 modified histone binding(GO:0061628) |
| 0.0 | 0.1 | GO:0030291 | protein serine/threonine kinase inhibitor activity(GO:0030291) |
| 0.0 | 0.2 | GO:0016802 | adenosylhomocysteinase activity(GO:0004013) trialkylsulfonium hydrolase activity(GO:0016802) |
| 0.0 | 0.2 | GO:0008889 | glycerophosphodiester phosphodiesterase activity(GO:0008889) |
| 0.0 | 0.1 | GO:0004711 | ribosomal protein S6 kinase activity(GO:0004711) |
| 0.0 | 0.2 | GO:0004563 | beta-N-acetylhexosaminidase activity(GO:0004563) |
| 0.0 | 0.0 | GO:0031681 | G-protein beta-subunit binding(GO:0031681) |
| 0.0 | 0.0 | GO:0035673 | oligopeptide transmembrane transporter activity(GO:0035673) |
| 0.0 | 0.0 | GO:0003847 | 1-alkyl-2-acetylglycerophosphocholine esterase activity(GO:0003847) |
| 0.0 | 0.1 | GO:0042799 | histone methyltransferase activity (H4-K20 specific)(GO:0042799) |
| 0.0 | 0.3 | GO:0070569 | uridylyltransferase activity(GO:0070569) |
| 0.0 | 0.3 | GO:0005229 | intracellular calcium activated chloride channel activity(GO:0005229) |
| 0.0 | 0.1 | GO:0005338 | nucleotide-sugar transmembrane transporter activity(GO:0005338) |
| 0.0 | 0.5 | GO:0004691 | cAMP-dependent protein kinase activity(GO:0004691) |
| 0.0 | 0.3 | GO:0015248 | sterol transporter activity(GO:0015248) |
| 0.0 | 0.2 | GO:0015923 | mannosidase activity(GO:0015923) |
| 0.0 | 0.1 | GO:0032422 | purine-rich negative regulatory element binding(GO:0032422) |
| 0.0 | 0.1 | GO:0008140 | cAMP response element binding protein binding(GO:0008140) |
| 0.0 | 0.1 | GO:0004379 | glycylpeptide N-tetradecanoyltransferase activity(GO:0004379) myristoyltransferase activity(GO:0019107) |
| 0.0 | 0.1 | GO:0047696 | beta-adrenergic receptor kinase activity(GO:0047696) |
| 0.0 | 0.3 | GO:0031543 | peptidyl-proline dioxygenase activity(GO:0031543) |
| 0.0 | 0.8 | GO:0042056 | chemoattractant activity(GO:0042056) |
| 0.0 | 0.1 | GO:0005222 | intracellular cAMP activated cation channel activity(GO:0005222) |
| 0.0 | 0.1 | GO:0086080 | protein binding involved in heterotypic cell-cell adhesion(GO:0086080) |
| 0.0 | 0.2 | GO:0004977 | melanocortin receptor activity(GO:0004977) |
| 0.0 | 0.5 | GO:0004185 | serine-type carboxypeptidase activity(GO:0004185) |
| 0.0 | 1.5 | GO:0017022 | myosin binding(GO:0017022) |
| 0.0 | 6.6 | GO:0004252 | serine-type endopeptidase activity(GO:0004252) |
| 0.0 | 0.2 | GO:0008073 | ornithine decarboxylase inhibitor activity(GO:0008073) |
| 0.0 | 0.1 | GO:0004703 | G-protein coupled receptor kinase activity(GO:0004703) |
| 0.0 | 0.1 | GO:0004803 | transposase activity(GO:0004803) |
| 0.0 | 0.2 | GO:0016018 | cyclosporin A binding(GO:0016018) |
| 0.0 | 0.5 | GO:0005109 | frizzled binding(GO:0005109) |
| 0.0 | 0.2 | GO:0015193 | L-proline transmembrane transporter activity(GO:0015193) |
| 0.0 | 0.1 | GO:0001609 | G-protein coupled adenosine receptor activity(GO:0001609) |
| 0.0 | 1.2 | GO:0001540 | beta-amyloid binding(GO:0001540) |
| 0.0 | 0.2 | GO:0047144 | 2-acylglycerol-3-phosphate O-acyltransferase activity(GO:0047144) |
| 0.0 | 0.1 | GO:0016846 | carbon-sulfur lyase activity(GO:0016846) |
| 0.0 | 0.1 | GO:0036033 | mediator complex binding(GO:0036033) |
| 0.0 | 0.2 | GO:0000062 | fatty-acyl-CoA binding(GO:0000062) |
| 0.0 | 0.1 | GO:0017040 | ceramidase activity(GO:0017040) |
| 0.0 | 0.2 | GO:0003995 | acyl-CoA dehydrogenase activity(GO:0003995) |
| 0.0 | 0.2 | GO:0004652 | polynucleotide adenylyltransferase activity(GO:0004652) |
| 0.0 | 0.1 | GO:0004945 | angiotensin receptor activity(GO:0001595) angiotensin type II receptor activity(GO:0004945) |
| 0.0 | 1.3 | GO:0043022 | ribosome binding(GO:0043022) |
| 0.0 | 0.4 | GO:0019789 | SUMO transferase activity(GO:0019789) |
| 0.0 | 0.1 | GO:0008097 | 5S rRNA binding(GO:0008097) |
| 0.0 | 0.2 | GO:0031418 | L-ascorbic acid binding(GO:0031418) |
| 0.0 | 0.3 | GO:0008527 | taste receptor activity(GO:0008527) |
| 0.0 | 0.3 | GO:0019784 | NEDD8-specific protease activity(GO:0019784) |
| 0.0 | 0.1 | GO:0004906 | interferon-gamma receptor activity(GO:0004906) |
| 0.0 | 0.3 | GO:0043425 | bHLH transcription factor binding(GO:0043425) |
| 0.0 | 0.1 | GO:0043891 | glyceraldehyde-3-phosphate dehydrogenase (NAD+) (phosphorylating) activity(GO:0004365) glyceraldehyde-3-phosphate dehydrogenase (NAD(P)+) (phosphorylating) activity(GO:0043891) |
| 0.0 | 0.3 | GO:1990381 | ubiquitin-specific protease binding(GO:1990381) |
| 0.0 | 0.2 | GO:0016406 | carnitine O-acyltransferase activity(GO:0016406) |
| 0.0 | 0.0 | GO:0030292 | protein tyrosine kinase inhibitor activity(GO:0030292) |
| 0.0 | 0.1 | GO:0015321 | sodium-dependent phosphate transmembrane transporter activity(GO:0015321) |
| 0.0 | 0.1 | GO:0004532 | 3'-5'-exoribonuclease activity(GO:0000175) exoribonuclease activity(GO:0004532) exoribonuclease activity, producing 5'-phosphomonoesters(GO:0016896) |
| 0.0 | 0.1 | GO:0004117 | calmodulin-dependent cyclic-nucleotide phosphodiesterase activity(GO:0004117) |
| 0.0 | 0.2 | GO:0005157 | macrophage colony-stimulating factor receptor binding(GO:0005157) |
| 0.0 | 1.7 | GO:0003730 | mRNA 3'-UTR binding(GO:0003730) |
| 0.0 | 0.1 | GO:0019763 | immunoglobulin receptor activity(GO:0019763) |
| 0.0 | 0.3 | GO:0017034 | Rap guanyl-nucleotide exchange factor activity(GO:0017034) |
| 0.0 | 0.0 | GO:0004769 | steroid delta-isomerase activity(GO:0004769) |
| 0.0 | 0.1 | GO:0001222 | transcription corepressor binding(GO:0001222) |
| 0.0 | 0.1 | GO:0032217 | riboflavin transporter activity(GO:0032217) |
| 0.0 | 0.0 | GO:0008241 | peptidyl-dipeptidase activity(GO:0008241) |
| 0.0 | 0.0 | GO:0032405 | MutLalpha complex binding(GO:0032405) |
| 0.0 | 0.0 | GO:0098770 | FBXO family protein binding(GO:0098770) |
| 0.0 | 0.1 | GO:0019238 | cyclohydrolase activity(GO:0019238) |
| 0.0 | 0.3 | GO:0097371 | MDM2/MDM4 family protein binding(GO:0097371) |
| 0.0 | 0.1 | GO:0015238 | drug transmembrane transporter activity(GO:0015238) |
| 0.0 | 0.0 | GO:0098631 | protein binding involved in cell adhesion(GO:0098631) |
| 0.0 | 0.1 | GO:0004105 | choline-phosphate cytidylyltransferase activity(GO:0004105) |
| 0.0 | 0.9 | GO:0008138 | protein tyrosine/serine/threonine phosphatase activity(GO:0008138) |
| 0.0 | 0.1 | GO:0003918 | DNA topoisomerase type II (ATP-hydrolyzing) activity(GO:0003918) DNA topoisomerase II activity(GO:0061505) |
| 0.0 | 0.1 | GO:0070402 | NADPH binding(GO:0070402) |
| 0.0 | 0.0 | GO:0035939 | microsatellite binding(GO:0035939) |
| 0.0 | 0.1 | GO:0042015 | interleukin-20 binding(GO:0042015) |
| 0.0 | 0.0 | GO:0030305 | heparanase activity(GO:0030305) |
| 0.0 | 0.1 | GO:0004925 | prolactin receptor activity(GO:0004925) |
| 0.0 | 0.1 | GO:0047273 | galactosylgalactosylglucosylceramide beta-D-acetylgalactosaminyltransferase activity(GO:0047273) |
| 0.0 | 0.1 | GO:0102338 | fatty acid elongase activity(GO:0009922) 3-oxo-arachidoyl-CoA synthase activity(GO:0102336) 3-oxo-cerotoyl-CoA synthase activity(GO:0102337) 3-oxo-lignoceronyl-CoA synthase activity(GO:0102338) |
| 0.0 | 0.2 | GO:0015299 | solute:proton antiporter activity(GO:0015299) |
| 0.0 | 0.2 | GO:0047760 | butyrate-CoA ligase activity(GO:0047760) |
| 0.0 | 0.0 | GO:0019862 | IgA binding(GO:0019862) |
| 0.0 | 0.1 | GO:0004862 | cAMP-dependent protein kinase inhibitor activity(GO:0004862) |
| 0.0 | 0.1 | GO:0008502 | melatonin receptor activity(GO:0008502) |
| 0.0 | 0.1 | GO:0004180 | carboxypeptidase activity(GO:0004180) |
| 0.0 | 0.4 | GO:0042166 | acetylcholine binding(GO:0042166) |
| 0.0 | 2.3 | GO:0044822 | mRNA binding(GO:0003729) poly(A) RNA binding(GO:0044822) |
| 0.0 | 0.1 | GO:0001591 | dopamine neurotransmitter receptor activity, coupled via Gi/Go(GO:0001591) |
| 0.0 | 0.1 | GO:0005250 | A-type (transient outward) potassium channel activity(GO:0005250) |
| 0.0 | 0.1 | GO:0016434 | rRNA (cytosine) methyltransferase activity(GO:0016434) |
| 0.0 | 0.1 | GO:0015143 | urate transmembrane transporter activity(GO:0015143) salt transmembrane transporter activity(GO:1901702) |
| 0.0 | 0.0 | GO:0015271 | outward rectifier potassium channel activity(GO:0015271) |
| 0.0 | 0.2 | GO:0032266 | phosphatidylinositol-3-phosphate binding(GO:0032266) |
| 0.0 | 0.1 | GO:0015277 | kainate selective glutamate receptor activity(GO:0015277) |
| 0.0 | 0.1 | GO:0036435 | K48-linked polyubiquitin binding(GO:0036435) |
| 0.0 | 3.8 | GO:0005096 | GTPase activator activity(GO:0005096) |
| 0.0 | 0.0 | GO:0090482 | vitamin transmembrane transporter activity(GO:0090482) |
| 0.0 | 0.0 | GO:0019960 | C-X3-C chemokine binding(GO:0019960) |
| 0.0 | 0.1 | GO:0017154 | semaphorin receptor activity(GO:0017154) |
| 0.0 | 0.0 | GO:0035033 | histone deacetylase regulator activity(GO:0035033) |
| 0.0 | 0.1 | GO:0001733 | galactosylceramide sulfotransferase activity(GO:0001733) galactose 3-O-sulfotransferase activity(GO:0050694) |
| 0.0 | 0.1 | GO:0033130 | acetylcholine receptor binding(GO:0033130) |
| 0.0 | 0.1 | GO:0032453 | histone demethylase activity (H3-K4 specific)(GO:0032453) |
| 0.0 | 0.0 | GO:0005333 | norepinephrine transmembrane transporter activity(GO:0005333) |
| 0.0 | 0.2 | GO:0036402 | proteasome-activating ATPase activity(GO:0036402) |
| 0.0 | 0.0 | GO:0030250 | cyclase activator activity(GO:0010853) guanylate cyclase activator activity(GO:0030250) |
| 0.0 | 0.4 | GO:0030553 | cGMP binding(GO:0030553) |
| 0.0 | 0.0 | GO:0003968 | RNA-directed RNA polymerase activity(GO:0003968) |
| 0.0 | 0.0 | GO:0030229 | very-low-density lipoprotein particle receptor activity(GO:0030229) |
| 0.0 | 0.1 | GO:0097322 | 7SK snRNA binding(GO:0097322) |
| 0.0 | 2.1 | GO:0060090 | binding, bridging(GO:0060090) |
| 0.0 | 0.0 | GO:0019136 | deoxynucleoside kinase activity(GO:0019136) |
| 0.0 | 0.1 | GO:0097016 | L27 domain binding(GO:0097016) |
| 0.0 | 0.1 | GO:0004310 | farnesyl-diphosphate farnesyltransferase activity(GO:0004310) squalene synthase activity(GO:0051996) |
| 0.0 | 0.1 | GO:0030107 | HLA-A specific inhibitory MHC class I receptor activity(GO:0030107) |
| 0.0 | 0.1 | GO:0019905 | syntaxin binding(GO:0019905) |
| 0.0 | 0.0 | GO:0016783 | sulfurtransferase activity(GO:0016783) |
| 0.0 | 0.0 | GO:0052795 | exo-alpha-(2->3)-sialidase activity(GO:0052794) exo-alpha-(2->6)-sialidase activity(GO:0052795) exo-alpha-(2->8)-sialidase activity(GO:0052796) |
| 0.0 | 0.1 | GO:0004969 | histamine receptor activity(GO:0004969) |
| 0.0 | 0.1 | GO:0004726 | non-membrane spanning protein tyrosine phosphatase activity(GO:0004726) |
| 0.0 | 0.0 | GO:0016209 | antioxidant activity(GO:0016209) |
| 0.0 | 0.0 | GO:0019531 | oxalate transmembrane transporter activity(GO:0019531) |
| 0.0 | 0.2 | GO:0005272 | sodium channel activity(GO:0005272) |
| 0.0 | 0.1 | GO:0004565 | beta-galactosidase activity(GO:0004565) |
| 0.0 | 0.2 | GO:0004383 | guanylate cyclase activity(GO:0004383) |
| 0.0 | 0.0 | GO:0031781 | melanocortin receptor binding(GO:0031779) type 3 melanocortin receptor binding(GO:0031781) type 4 melanocortin receptor binding(GO:0031782) |
Gene overrepresentation in C2:CP category:
| Log-likelihood per target | Total log-likelihood | Term | Description |
|---|---|---|---|
| 1.2 | 2.4 | PID GLYPICAN 1PATHWAY | Glypican 1 network |
| 0.9 | 21.7 | PID INTEGRIN4 PATHWAY | Alpha6 beta4 integrin-ligand interactions |
| 0.3 | 11.8 | PID ERBB NETWORK PATHWAY | ErbB receptor signaling network |
| 0.3 | 22.1 | PID INTEGRIN3 PATHWAY | Beta3 integrin cell surface interactions |
| 0.3 | 3.2 | PID AMB2 NEUTROPHILS PATHWAY | amb2 Integrin signaling |
| 0.3 | 7.8 | SA REG CASCADE OF CYCLIN EXPR | Expression of cyclins regulates progression through the cell cycle by activating cyclin-dependent kinases. |
| 0.3 | 12.8 | ST WNT BETA CATENIN PATHWAY | Wnt/beta-catenin Pathway |
| 0.3 | 4.2 | PID VEGF VEGFR PATHWAY | VEGF and VEGFR signaling network |
| 0.3 | 9.3 | PID HDAC CLASSIII PATHWAY | Signaling events mediated by HDAC Class III |
| 0.3 | 6.8 | PID ARF 3PATHWAY | Arf1 pathway |
| 0.3 | 9.8 | NABA COLLAGENS | Genes encoding collagen proteins |
| 0.3 | 14.7 | SIG REGULATION OF THE ACTIN CYTOSKELETON BY RHO GTPASES | Genes related to regulation of the actin cytoskeleton |
| 0.2 | 12.2 | PID NCADHERIN PATHWAY | N-cadherin signaling events |
| 0.2 | 13.6 | PID ECADHERIN STABILIZATION PATHWAY | Stabilization and expansion of the E-cadherin adherens junction |
| 0.2 | 46.2 | NABA ECM GLYCOPROTEINS | Genes encoding structural ECM glycoproteins |
| 0.2 | 10.2 | PID A6B1 A6B4 INTEGRIN PATHWAY | a6b1 and a6b4 Integrin signaling |
| 0.2 | 1.6 | PID EPHRINB REV PATHWAY | Ephrin B reverse signaling |
| 0.2 | 5.7 | PID TOLL ENDOGENOUS PATHWAY | Endogenous TLR signaling |
| 0.2 | 3.5 | PID S1P S1P4 PATHWAY | S1P4 pathway |
| 0.2 | 0.6 | ST IL 13 PATHWAY | Interleukin 13 (IL-13) Pathway |
| 0.2 | 54.9 | NABA ECM REGULATORS | Genes encoding enzymes and their regulators involved in the remodeling of the extracellular matrix |
| 0.2 | 1.6 | PID INTEGRIN1 PATHWAY | Beta1 integrin cell surface interactions |
| 0.2 | 5.4 | PID AVB3 OPN PATHWAY | Osteopontin-mediated events |
| 0.2 | 9.1 | PID INSULIN PATHWAY | Insulin Pathway |
| 0.2 | 3.3 | PID TCR CALCIUM PATHWAY | Calcium signaling in the CD4+ TCR pathway |
| 0.2 | 2.9 | PID IGF1 PATHWAY | IGF1 pathway |
| 0.2 | 2.1 | PID NECTIN PATHWAY | Nectin adhesion pathway |
| 0.2 | 8.3 | PID TAP63 PATHWAY | Validated transcriptional targets of TAp63 isoforms |
| 0.2 | 0.3 | PID NFKAPPAB ATYPICAL PATHWAY | Atypical NF-kappaB pathway |
| 0.2 | 11.5 | PID DELTA NP63 PATHWAY | Validated transcriptional targets of deltaNp63 isoforms |
| 0.2 | 6.7 | PID FRA PATHWAY | Validated transcriptional targets of AP1 family members Fra1 and Fra2 |
| 0.2 | 3.9 | PID WNT NONCANONICAL PATHWAY | Noncanonical Wnt signaling pathway |
| 0.1 | 4.6 | PID IL1 PATHWAY | IL1-mediated signaling events |
| 0.1 | 4.5 | PID SYNDECAN 2 PATHWAY | Syndecan-2-mediated signaling events |
| 0.1 | 11.6 | PID P75 NTR PATHWAY | p75(NTR)-mediated signaling |
| 0.1 | 7.5 | PID BMP PATHWAY | BMP receptor signaling |
| 0.1 | 0.4 | ST TYPE I INTERFERON PATHWAY | Type I Interferon (alpha/beta IFN) Pathway |
| 0.1 | 0.3 | PID SYNDECAN 1 PATHWAY | Syndecan-1-mediated signaling events |
| 0.1 | 0.1 | PID PI3KCI AKT PATHWAY | Class I PI3K signaling events mediated by Akt |
| 0.1 | 0.4 | SA G1 AND S PHASES | Cdk2, 4, and 6 bind cyclin D in G1, while cdk2/cyclin E promotes the G1/S transition. |
| 0.1 | 10.2 | PID AR PATHWAY | Coregulation of Androgen receptor activity |
| 0.1 | 2.3 | PID HIF1A PATHWAY | Hypoxic and oxygen homeostasis regulation of HIF-1-alpha |
| 0.1 | 2.1 | PID HEDGEHOG 2PATHWAY | Signaling events mediated by the Hedgehog family |
| 0.1 | 2.7 | PID NFKAPPAB CANONICAL PATHWAY | Canonical NF-kappaB pathway |
| 0.1 | 3.1 | PID RAC1 REG PATHWAY | Regulation of RAC1 activity |
| 0.1 | 0.8 | PID ALK2 PATHWAY | ALK2 signaling events |
| 0.1 | 7.5 | WNT SIGNALING | Genes related to Wnt-mediated signal transduction |
| 0.1 | 0.4 | PID CXCR4 PATHWAY | CXCR4-mediated signaling events |
| 0.1 | 1.7 | ST GA12 PATHWAY | G alpha 12 Pathway |
| 0.1 | 1.4 | PID NETRIN PATHWAY | Netrin-mediated signaling events |
| 0.1 | 2.8 | PID PDGFRB PATHWAY | PDGFR-beta signaling pathway |
| 0.1 | 1.1 | PID SMAD2 3PATHWAY | Regulation of cytoplasmic and nuclear SMAD2/3 signaling |
| 0.1 | 0.4 | SA G2 AND M PHASES | Cdc25 activates the cdc2/cyclin B complex to induce the G2/M transition. |
| 0.1 | 3.4 | PID CDC42 REG PATHWAY | Regulation of CDC42 activity |
| 0.1 | 3.0 | PID ARF6 TRAFFICKING PATHWAY | Arf6 trafficking events |
| 0.1 | 1.5 | PID EPHB FWD PATHWAY | EPHB forward signaling |
| 0.1 | 1.6 | PID CONE PATHWAY | Visual signal transduction: Cones |
| 0.1 | 0.9 | PID NEPHRIN NEPH1 PATHWAY | Nephrin/Neph1 signaling in the kidney podocyte |
| 0.1 | 2.7 | PID AJDISS 2PATHWAY | Posttranslational regulation of adherens junction stability and dissassembly |
| 0.1 | 2.1 | PID FAK PATHWAY | Signaling events mediated by focal adhesion kinase |
| 0.1 | 0.4 | PID RET PATHWAY | Signaling events regulated by Ret tyrosine kinase |
| 0.1 | 0.6 | PID BETA CATENIN DEG PATHWAY | Degradation of beta catenin |
| 0.1 | 0.4 | PID ARF6 DOWNSTREAM PATHWAY | Arf6 downstream pathway |
| 0.1 | 0.6 | PID MAPK TRK PATHWAY | Trk receptor signaling mediated by the MAPK pathway |
| 0.1 | 0.9 | SIG IL4RECEPTOR IN B LYPHOCYTES | Genes related to IL4 rceptor signaling in B lymphocytes |
| 0.1 | 0.9 | PID ERBB1 INTERNALIZATION PATHWAY | Internalization of ErbB1 |
| 0.1 | 2.2 | PID LYSOPHOSPHOLIPID PATHWAY | LPA receptor mediated events |
| 0.1 | 0.3 | ST MYOCYTE AD PATHWAY | Myocyte Adrenergic Pathway is a specific case of the generalized Adrenergic Pathway. |
| 0.0 | 2.6 | PID NFAT TFPATHWAY | Calcineurin-regulated NFAT-dependent transcription in lymphocytes |
| 0.0 | 0.3 | PID RANBP2 PATHWAY | Sumoylation by RanBP2 regulates transcriptional repression |
| 0.0 | 0.2 | PID IFNG PATHWAY | IFN-gamma pathway |
| 0.0 | 0.1 | ST JAK STAT PATHWAY | Jak-STAT Pathway |
| 0.0 | 0.4 | PID UPA UPAR PATHWAY | Urokinase-type plasminogen activator (uPA) and uPAR-mediated signaling |
| 0.0 | 1.8 | PID CDC42 PATHWAY | CDC42 signaling events |
| 0.0 | 10.9 | NABA SECRETED FACTORS | Genes encoding secreted soluble factors |
| 0.0 | 0.3 | PID ANTHRAX PATHWAY | Cellular roles of Anthrax toxin |
| 0.0 | 0.1 | ST WNT CA2 CYCLIC GMP PATHWAY | Wnt/Ca2+/cyclic GMP signaling. |
| 0.0 | 5.1 | NABA ECM AFFILIATED | Genes encoding proteins affiliated structurally or functionally to extracellular matrix proteins |
| 0.0 | 1.2 | PID TRKR PATHWAY | Neurotrophic factor-mediated Trk receptor signaling |
| 0.0 | 0.5 | PID P38 MKK3 6PATHWAY | p38 MAPK signaling pathway |
| 0.0 | 0.4 | PID INTEGRIN A9B1 PATHWAY | Alpha9 beta1 integrin signaling events |
| 0.0 | 0.1 | SIG CHEMOTAXIS | Genes related to chemotaxis |
| 0.0 | 0.1 | PID WNT SIGNALING PATHWAY | Wnt signaling network |
| 0.0 | 1.1 | PID HNF3A PATHWAY | FOXA1 transcription factor network |
| 0.0 | 0.3 | PID PS1 PATHWAY | Presenilin action in Notch and Wnt signaling |
| 0.0 | 0.4 | PID ER NONGENOMIC PATHWAY | Plasma membrane estrogen receptor signaling |
| 0.0 | 0.2 | SA PROGRAMMED CELL DEATH | Programmed cell death, or apoptosis, eliminates damaged or unneeded cells. |
| 0.0 | 0.5 | SIG CD40PATHWAYMAP | Genes related to CD40 signaling |
| 0.0 | 0.1 | PID MET PATHWAY | Signaling events mediated by Hepatocyte Growth Factor Receptor (c-Met) |
| 0.0 | 1.1 | PID CASPASE PATHWAY | Caspase cascade in apoptosis |
| 0.0 | 1.0 | PID RHOA REG PATHWAY | Regulation of RhoA activity |
| 0.0 | 0.0 | ST INTERFERON GAMMA PATHWAY | Interferon gamma pathway. |
| 0.0 | 0.0 | PID TCPTP PATHWAY | Signaling events mediated by TCPTP |
| 0.0 | 0.1 | PID SYNDECAN 4 PATHWAY | Syndecan-4-mediated signaling events |
| 0.0 | 0.4 | ST G ALPHA I PATHWAY | G alpha i Pathway |
| 0.0 | 0.1 | ST G ALPHA S PATHWAY | G alpha s Pathway |
| 0.0 | 0.1 | PID ALK1 PATHWAY | ALK1 signaling events |
Gene overrepresentation in biological_process category:
| Log-likelihood per target | Total log-likelihood | Term | Description |
|---|---|---|---|
| 2.9 | 17.4 | GO:0002760 | positive regulation of antimicrobial peptide production(GO:0002225) positive regulation of antimicrobial humoral response(GO:0002760) positive regulation of antibacterial peptide production(GO:0002803) |
| 2.8 | 22.5 | GO:0003065 | positive regulation of heart rate by epinephrine(GO:0003065) |
| 1.7 | 5.1 | GO:0060901 | regulation of monophenol monooxygenase activity(GO:0032771) positive regulation of monophenol monooxygenase activity(GO:0032773) negative regulation of catagen(GO:0051796) regulation of hair cycle by canonical Wnt signaling pathway(GO:0060901) positive regulation of melanosome transport(GO:1902910) |
| 1.5 | 4.5 | GO:0098746 | fast, calcium ion-dependent exocytosis of neurotransmitter(GO:0098746) |
| 1.5 | 6.0 | GO:0046108 | uridine catabolic process(GO:0006218) uridine metabolic process(GO:0046108) |
| 1.4 | 4.3 | GO:1903609 | negative regulation of peptidyl-tyrosine autophosphorylation(GO:1900085) negative regulation of inward rectifier potassium channel activity(GO:1903609) |
| 1.3 | 14.5 | GO:0050703 | interleukin-1 alpha secretion(GO:0050703) |
| 1.3 | 6.3 | GO:0055011 | atrial cardiac muscle cell differentiation(GO:0055011) atrial cardiac muscle cell development(GO:0055014) |
| 1.2 | 11.2 | GO:0048050 | post-embryonic eye morphogenesis(GO:0048050) |
| 1.2 | 32.5 | GO:0071294 | cellular response to zinc ion(GO:0071294) |
| 1.1 | 5.6 | GO:0044855 | plasma membrane raft distribution(GO:0044855) plasma membrane raft localization(GO:0044856) plasma membrane raft polarization(GO:0044858) regulation of plasma membrane raft polarization(GO:1903906) |
| 1.1 | 31.9 | GO:0031581 | hemidesmosome assembly(GO:0031581) |
| 1.1 | 3.2 | GO:0048627 | myoblast development(GO:0048627) |
| 1.1 | 20.2 | GO:0032060 | bleb assembly(GO:0032060) |
| 1.1 | 9.5 | GO:0048386 | positive regulation of retinoic acid receptor signaling pathway(GO:0048386) |
| 1.0 | 3.0 | GO:0046947 | hydroxylysine metabolic process(GO:0046946) hydroxylysine biosynthetic process(GO:0046947) |
| 1.0 | 4.0 | GO:0060672 | epithelial cell differentiation involved in embryonic placenta development(GO:0060671) epithelial cell morphogenesis involved in placental branching(GO:0060672) |
| 1.0 | 3.0 | GO:1902396 | protein localization to bicellular tight junction(GO:1902396) |
| 1.0 | 2.9 | GO:0090244 | Wnt signaling pathway involved in somitogenesis(GO:0090244) |
| 1.0 | 3.9 | GO:0090362 | positive regulation of platelet-derived growth factor production(GO:0090362) |
| 1.0 | 1.0 | GO:0048817 | negative regulation of hair follicle maturation(GO:0048817) |
| 1.0 | 4.8 | GO:0002159 | desmosome assembly(GO:0002159) |
| 0.9 | 1.9 | GO:0031346 | positive regulation of cell projection organization(GO:0031346) |
| 0.9 | 2.8 | GO:0001300 | chronological cell aging(GO:0001300) |
| 0.9 | 2.7 | GO:2000393 | negative regulation of lamellipodium morphogenesis(GO:2000393) |
| 0.9 | 3.6 | GO:1990262 | regulation of anti-Mullerian hormone signaling pathway(GO:1902612) negative regulation of anti-Mullerian hormone signaling pathway(GO:1902613) anti-Mullerian hormone signaling pathway(GO:1990262) |
| 0.9 | 3.5 | GO:0070836 | caveola assembly(GO:0070836) |
| 0.9 | 3.4 | GO:0097325 | melanocyte proliferation(GO:0097325) |
| 0.9 | 0.9 | GO:2001076 | regulation of metanephric ureteric bud development(GO:2001074) positive regulation of metanephric ureteric bud development(GO:2001076) |
| 0.9 | 2.6 | GO:0048549 | positive regulation of pinocytosis(GO:0048549) |
| 0.8 | 10.1 | GO:0001778 | plasma membrane repair(GO:0001778) |
| 0.8 | 4.2 | GO:0030047 | actin modification(GO:0030047) |
| 0.8 | 6.6 | GO:1900623 | regulation of monocyte aggregation(GO:1900623) positive regulation of monocyte aggregation(GO:1900625) |
| 0.8 | 6.6 | GO:0032926 | negative regulation of activin receptor signaling pathway(GO:0032926) |
| 0.8 | 2.4 | GO:1902938 | regulation of intracellular calcium activated chloride channel activity(GO:1902938) |
| 0.8 | 3.9 | GO:0070980 | biphenyl catabolic process(GO:0070980) |
| 0.7 | 2.9 | GO:0031179 | peptide amidation(GO:0001519) protein amidation(GO:0018032) peptide modification(GO:0031179) |
| 0.7 | 2.2 | GO:1900226 | negative regulation of NLRP3 inflammasome complex assembly(GO:1900226) |
| 0.7 | 2.1 | GO:1904328 | regulation of myofibroblast contraction(GO:1904328) myofibroblast contraction(GO:1990764) |
| 0.7 | 7.0 | GO:0070141 | response to UV-A(GO:0070141) |
| 0.7 | 7.7 | GO:0034356 | NAD biosynthesis via nicotinamide riboside salvage pathway(GO:0034356) |
| 0.7 | 6.3 | GO:1904352 | positive regulation of protein catabolic process in the vacuole(GO:1904352) |
| 0.7 | 2.8 | GO:0019747 | regulation of isoprenoid metabolic process(GO:0019747) |
| 0.7 | 2.1 | GO:0043311 | positive regulation of eosinophil degranulation(GO:0043311) positive regulation of eosinophil activation(GO:1902568) |
| 0.7 | 4.1 | GO:1902847 | macrophage proliferation(GO:0061517) microglial cell proliferation(GO:0061518) regulation of neuronal signal transduction(GO:1902847) positive regulation of neurofibrillary tangle assembly(GO:1902998) |
| 0.7 | 2.7 | GO:0032972 | regulation of muscle filament sliding speed(GO:0032972) |
| 0.7 | 2.7 | GO:0038195 | urokinase plasminogen activator signaling pathway(GO:0038195) |
| 0.7 | 0.7 | GO:1903630 | regulation of aminoacyl-tRNA ligase activity(GO:1903630) |
| 0.7 | 1.3 | GO:1903521 | apoptotic process involved in mammary gland involution(GO:0060057) positive regulation of apoptotic process involved in mammary gland involution(GO:0060058) positive regulation of apoptotic process involved in morphogenesis(GO:1902339) regulation of mammary gland involution(GO:1903519) positive regulation of mammary gland involution(GO:1903521) positive regulation of apoptotic process involved in development(GO:1904747) |
| 0.7 | 2.0 | GO:0032289 | central nervous system myelin formation(GO:0032289) |
| 0.6 | 1.9 | GO:0045210 | FasL biosynthetic process(GO:0045210) |
| 0.6 | 5.1 | GO:0030579 | ubiquitin-dependent SMAD protein catabolic process(GO:0030579) |
| 0.6 | 0.6 | GO:0045103 | intermediate filament-based process(GO:0045103) |
| 0.6 | 4.4 | GO:0035166 | post-embryonic hemopoiesis(GO:0035166) |
| 0.6 | 1.9 | GO:0046066 | dGDP metabolic process(GO:0046066) |
| 0.6 | 0.6 | GO:0021825 | substrate-dependent cerebral cortex tangential migration(GO:0021825) |
| 0.6 | 3.1 | GO:1990834 | response to odorant(GO:1990834) |
| 0.6 | 5.6 | GO:1900028 | negative regulation of ruffle assembly(GO:1900028) |
| 0.6 | 0.6 | GO:1900223 | positive regulation of beta-amyloid clearance(GO:1900223) |
| 0.6 | 2.5 | GO:0046086 | adenosine biosynthetic process(GO:0046086) |
| 0.6 | 2.4 | GO:0060434 | bronchus morphogenesis(GO:0060434) |
| 0.6 | 3.0 | GO:1905040 | vestibulocochlear nerve structural organization(GO:0021649) positive regulation of cytokine activity(GO:0060301) ganglion morphogenesis(GO:0061552) endothelial tip cell fate specification(GO:0097102) VEGF-activated neuropilin signaling pathway involved in axon guidance(GO:1902378) dorsal root ganglion morphogenesis(GO:1904835) otic placode development(GO:1905040) |
| 0.6 | 1.2 | GO:0010986 | positive regulation of lipoprotein particle clearance(GO:0010986) |
| 0.6 | 0.6 | GO:0072197 | ureter urothelium development(GO:0072190) ureter morphogenesis(GO:0072197) |
| 0.6 | 0.6 | GO:1902957 | negative regulation of mitochondrial electron transport, NADH to ubiquinone(GO:1902957) |
| 0.6 | 4.6 | GO:0052697 | flavonoid glucuronidation(GO:0052696) xenobiotic glucuronidation(GO:0052697) |
| 0.6 | 1.7 | GO:0002541 | activation of plasma proteins involved in acute inflammatory response(GO:0002541) |
| 0.6 | 3.4 | GO:0035803 | egg coat formation(GO:0035803) |
| 0.6 | 3.4 | GO:0045743 | positive regulation of fibroblast growth factor receptor signaling pathway(GO:0045743) |
| 0.6 | 7.8 | GO:0038065 | collagen-activated signaling pathway(GO:0038065) |
| 0.6 | 2.2 | GO:0021812 | neuronal-glial interaction involved in cerebral cortex radial glia guided migration(GO:0021812) |
| 0.6 | 1.7 | GO:0035606 | peptidyl-cysteine S-trans-nitrosylation(GO:0035606) |
| 0.6 | 1.7 | GO:1903224 | regulation of endodermal cell differentiation(GO:1903224) |
| 0.5 | 4.4 | GO:0006931 | substrate-dependent cell migration, cell attachment to substrate(GO:0006931) |
| 0.5 | 1.6 | GO:0060447 | bud outgrowth involved in lung branching(GO:0060447) |
| 0.5 | 1.6 | GO:0019858 | cytosine metabolic process(GO:0019858) |
| 0.5 | 3.7 | GO:0071896 | protein localization to adherens junction(GO:0071896) |
| 0.5 | 1.6 | GO:0010710 | regulation of collagen catabolic process(GO:0010710) |
| 0.5 | 1.6 | GO:0033242 | regulation of cellular amine catabolic process(GO:0033241) negative regulation of cellular amine catabolic process(GO:0033242) negative regulation of the force of heart contraction(GO:0098736) regulation of arginine catabolic process(GO:1900081) negative regulation of arginine catabolic process(GO:1900082) regulation of citrulline biosynthetic process(GO:1903248) negative regulation of citrulline biosynthetic process(GO:1903249) negative regulation of cellular amino acid biosynthetic process(GO:2000283) |
| 0.5 | 1.6 | GO:0010751 | negative regulation of nitric oxide mediated signal transduction(GO:0010751) |
| 0.5 | 2.0 | GO:2001137 | positive regulation of endocytic recycling(GO:2001137) |
| 0.5 | 1.5 | GO:1900075 | regulation of neuromuscular synaptic transmission(GO:1900073) positive regulation of neuromuscular synaptic transmission(GO:1900075) |
| 0.5 | 2.0 | GO:0001971 | negative regulation of activation of membrane attack complex(GO:0001971) |
| 0.5 | 1.9 | GO:0010908 | regulation of heparan sulfate proteoglycan biosynthetic process(GO:0010908) positive regulation of heparan sulfate proteoglycan biosynthetic process(GO:0010909) canonical Wnt signaling pathway involved in positive regulation of epithelial to mesenchymal transition(GO:0044334) positive regulation of proteoglycan biosynthetic process(GO:1902730) |
| 0.5 | 1.9 | GO:0000103 | sulfate assimilation(GO:0000103) |
| 0.5 | 1.4 | GO:2000521 | negative regulation of immunological synapse formation(GO:2000521) |
| 0.5 | 0.5 | GO:1903383 | neuron death in response to hydrogen peroxide(GO:0036476) neuron intrinsic apoptotic signaling pathway in response to hydrogen peroxide(GO:0036482) positive regulation of mitochondrial electron transport, NADH to ubiquinone(GO:1902958) regulation of hydrogen peroxide-induced neuron death(GO:1903207) negative regulation of hydrogen peroxide-induced neuron death(GO:1903208) regulation of hydrogen peroxide-induced neuron intrinsic apoptotic signaling pathway(GO:1903383) negative regulation of hydrogen peroxide-induced neuron intrinsic apoptotic signaling pathway(GO:1903384) |
| 0.5 | 7.0 | GO:0060394 | negative regulation of pathway-restricted SMAD protein phosphorylation(GO:0060394) |
| 0.5 | 1.4 | GO:0018406 | protein C-linked glycosylation(GO:0018103) peptidyl-tryptophan modification(GO:0018211) protein C-linked glycosylation via tryptophan(GO:0018317) protein C-linked glycosylation via 2'-alpha-mannosyl-L-tryptophan(GO:0018406) |
| 0.5 | 1.4 | GO:0000412 | histone peptidyl-prolyl isomerization(GO:0000412) |
| 0.5 | 1.4 | GO:0017186 | peptidyl-pyroglutamic acid biosynthetic process, using glutaminyl-peptide cyclotransferase(GO:0017186) |
| 0.5 | 2.3 | GO:0035105 | sterol regulatory element binding protein import into nucleus(GO:0035105) |
| 0.5 | 0.5 | GO:0080171 | lysosome organization(GO:0007040) lytic vacuole organization(GO:0080171) |
| 0.5 | 1.4 | GO:0036486 | trunk segmentation(GO:0035290) trunk neural crest cell migration(GO:0036484) ventral trunk neural crest cell migration(GO:0036486) |
| 0.4 | 1.3 | GO:0071877 | regulation of adrenergic receptor signaling pathway(GO:0071877) |
| 0.4 | 0.9 | GO:0070101 | positive regulation of chemokine-mediated signaling pathway(GO:0070101) |
| 0.4 | 1.8 | GO:0060995 | cell-cell signaling involved in kidney development(GO:0060995) Wnt signaling pathway involved in kidney development(GO:0061289) canonical Wnt signaling pathway involved in metanephric kidney development(GO:0061290) cell-cell signaling involved in metanephros development(GO:0072204) |
| 0.4 | 1.3 | GO:0031630 | regulation of synaptic vesicle fusion to presynaptic membrane(GO:0031630) |
| 0.4 | 1.3 | GO:2000298 | regulation of Rho-dependent protein serine/threonine kinase activity(GO:2000298) |
| 0.4 | 0.9 | GO:0007260 | tyrosine phosphorylation of STAT protein(GO:0007260) |
| 0.4 | 0.9 | GO:0030834 | regulation of actin filament depolymerization(GO:0030834) |
| 0.4 | 1.3 | GO:1903553 | positive regulation of extracellular exosome assembly(GO:1903553) |
| 0.4 | 3.5 | GO:0006526 | arginine biosynthetic process(GO:0006526) |
| 0.4 | 0.9 | GO:0048319 | axial mesoderm morphogenesis(GO:0048319) |
| 0.4 | 3.0 | GO:0015803 | branched-chain amino acid transport(GO:0015803) |
| 0.4 | 1.3 | GO:0006478 | peptidyl-tyrosine sulfation(GO:0006478) |
| 0.4 | 2.1 | GO:0046391 | 5-phosphoribose 1-diphosphate biosynthetic process(GO:0006015) 5-phosphoribose 1-diphosphate metabolic process(GO:0046391) |
| 0.4 | 5.4 | GO:2000680 | rubidium ion transport(GO:0035826) regulation of rubidium ion transport(GO:2000680) |
| 0.4 | 0.8 | GO:1903670 | regulation of sprouting angiogenesis(GO:1903670) |
| 0.4 | 6.0 | GO:2000194 | regulation of female gonad development(GO:2000194) |
| 0.4 | 1.2 | GO:0018153 | isopeptide cross-linking via N6-(L-isoglutamyl)-L-lysine(GO:0018153) isopeptide cross-linking(GO:0018262) |
| 0.4 | 0.4 | GO:2000137 | negative regulation of cell proliferation involved in heart morphogenesis(GO:2000137) |
| 0.4 | 1.6 | GO:0044861 | protein transport into plasma membrane raft(GO:0044861) |
| 0.4 | 1.6 | GO:0021564 | vagus nerve development(GO:0021564) |
| 0.4 | 3.9 | GO:0051610 | negative regulation of neurotransmitter uptake(GO:0051581) serotonin uptake(GO:0051610) regulation of serotonin uptake(GO:0051611) negative regulation of serotonin uptake(GO:0051612) |
| 0.4 | 4.7 | GO:0030050 | vesicle transport along actin filament(GO:0030050) |
| 0.4 | 1.5 | GO:0036072 | intramembranous ossification(GO:0001957) direct ossification(GO:0036072) |
| 0.4 | 2.7 | GO:0016199 | axon midline choice point recognition(GO:0016199) |
| 0.4 | 1.1 | GO:0010040 | response to iron(II) ion(GO:0010040) |
| 0.4 | 5.3 | GO:0060712 | spongiotrophoblast layer development(GO:0060712) |
| 0.4 | 4.2 | GO:0009414 | response to water deprivation(GO:0009414) |
| 0.4 | 1.1 | GO:0002894 | positive regulation of type IIa hypersensitivity(GO:0001798) positive regulation of type II hypersensitivity(GO:0002894) |
| 0.4 | 1.5 | GO:1902044 | regulation of Fas signaling pathway(GO:1902044) |
| 0.4 | 1.1 | GO:0003147 | neural crest cell migration involved in heart formation(GO:0003147) cell migration involved in heart formation(GO:0060974) anterior neural tube closure(GO:0061713) |
| 0.4 | 3.4 | GO:0060750 | epithelial cell proliferation involved in mammary gland duct elongation(GO:0060750) |
| 0.4 | 3.4 | GO:0031444 | slow-twitch skeletal muscle fiber contraction(GO:0031444) |
| 0.4 | 2.6 | GO:0033087 | negative regulation of immature T cell proliferation(GO:0033087) negative regulation of immature T cell proliferation in thymus(GO:0033088) |
| 0.4 | 0.4 | GO:2000302 | positive regulation of synaptic vesicle exocytosis(GO:2000302) |
| 0.4 | 1.8 | GO:0010643 | cell communication by chemical coupling(GO:0010643) |
| 0.4 | 1.1 | GO:0006145 | purine nucleobase catabolic process(GO:0006145) |
| 0.4 | 0.7 | GO:0010046 | response to mycotoxin(GO:0010046) |
| 0.4 | 0.4 | GO:1904933 | regulation of cell proliferation in midbrain(GO:1904933) |
| 0.4 | 2.2 | GO:0009753 | response to jasmonic acid(GO:0009753) cellular response to jasmonic acid stimulus(GO:0071395) |
| 0.4 | 1.1 | GO:0014876 | response to injury involved in regulation of muscle adaptation(GO:0014876) |
| 0.4 | 1.1 | GO:0035987 | endodermal cell differentiation(GO:0035987) |
| 0.4 | 0.4 | GO:1900425 | negative regulation of defense response to bacterium(GO:1900425) |
| 0.4 | 2.2 | GO:1900748 | positive regulation of vascular endothelial growth factor signaling pathway(GO:1900748) |
| 0.4 | 1.1 | GO:0002588 | positive regulation of antigen processing and presentation of peptide or polysaccharide antigen via MHC class II(GO:0002582) positive regulation of antigen processing and presentation of peptide antigen(GO:0002585) positive regulation of antigen processing and presentation of peptide antigen via MHC class II(GO:0002588) |
| 0.4 | 1.4 | GO:0035880 | embryonic nail plate morphogenesis(GO:0035880) |
| 0.4 | 0.4 | GO:0007089 | traversing start control point of mitotic cell cycle(GO:0007089) |
| 0.4 | 0.4 | GO:0003129 | heart induction(GO:0003129) |
| 0.4 | 1.1 | GO:1905205 | positive regulation of connective tissue replacement(GO:1905205) |
| 0.4 | 0.7 | GO:0097066 | response to thyroid hormone(GO:0097066) |
| 0.4 | 1.8 | GO:1904578 | response to thapsigargin(GO:1904578) cellular response to thapsigargin(GO:1904579) |
| 0.4 | 3.2 | GO:0002318 | myeloid progenitor cell differentiation(GO:0002318) |
| 0.4 | 1.8 | GO:0003350 | pulmonary myocardium development(GO:0003350) |
| 0.4 | 1.1 | GO:0031548 | regulation of brain-derived neurotrophic factor receptor signaling pathway(GO:0031548) |
| 0.3 | 1.4 | GO:1901805 | beta-glucoside metabolic process(GO:1901804) beta-glucoside catabolic process(GO:1901805) positive regulation of neuronal action potential(GO:1904457) |
| 0.3 | 1.7 | GO:0042374 | phylloquinone metabolic process(GO:0042374) phylloquinone catabolic process(GO:0042376) quinone catabolic process(GO:1901662) |
| 0.3 | 1.0 | GO:0044501 | modulation of signal transduction in other organism(GO:0044501) modulation by symbiont of host signal transduction pathway(GO:0052027) modulation of signal transduction in other organism involved in symbiotic interaction(GO:0052250) modulation by symbiont of host I-kappaB kinase/NF-kappaB cascade(GO:0085032) |
| 0.3 | 0.3 | GO:0010726 | positive regulation of hydrogen peroxide metabolic process(GO:0010726) |
| 0.3 | 3.4 | GO:0032000 | positive regulation of fatty acid beta-oxidation(GO:0032000) |
| 0.3 | 1.4 | GO:0009956 | radial pattern formation(GO:0009956) |
| 0.3 | 8.1 | GO:0007216 | G-protein coupled glutamate receptor signaling pathway(GO:0007216) |
| 0.3 | 13.9 | GO:0097435 | fibril organization(GO:0097435) |
| 0.3 | 1.7 | GO:0018243 | protein O-linked glycosylation via threonine(GO:0018243) |
| 0.3 | 3.7 | GO:0035986 | senescence-associated heterochromatin focus assembly(GO:0035986) |
| 0.3 | 1.0 | GO:0006982 | response to lipid hydroperoxide(GO:0006982) |
| 0.3 | 0.3 | GO:1901873 | regulation of post-translational protein modification(GO:1901873) |
| 0.3 | 1.7 | GO:0097461 | ferric iron import into cell(GO:0097461) ferric iron import across plasma membrane(GO:0098706) |
| 0.3 | 1.0 | GO:1903028 | positive regulation of opsonization(GO:1903028) |
| 0.3 | 0.6 | GO:0086053 | SA node cell to atrial cardiac muscle cell communication by electrical coupling(GO:0086021) AV node cell to bundle of His cell communication by electrical coupling(GO:0086053) |
| 0.3 | 1.0 | GO:2001245 | regulation of phosphatidylcholine biosynthetic process(GO:2001245) |
| 0.3 | 0.6 | GO:0003095 | pressure natriuresis(GO:0003095) |
| 0.3 | 7.4 | GO:0003334 | keratinocyte development(GO:0003334) |
| 0.3 | 0.9 | GO:0019417 | sulfur oxidation(GO:0019417) |
| 0.3 | 1.6 | GO:0061146 | Peyer's patch morphogenesis(GO:0061146) |
| 0.3 | 0.9 | GO:2000661 | positive regulation of interleukin-1-mediated signaling pathway(GO:2000661) |
| 0.3 | 4.7 | GO:0019511 | peptidyl-proline hydroxylation(GO:0019511) |
| 0.3 | 0.9 | GO:1903722 | regulation of centriole elongation(GO:1903722) |
| 0.3 | 0.9 | GO:0018197 | peptidyl-aspartic acid modification(GO:0018197) peptidyl-aspartic acid hydroxylation(GO:0042264) |
| 0.3 | 0.6 | GO:1904259 | regulation of basement membrane assembly involved in embryonic body morphogenesis(GO:1904259) positive regulation of basement membrane assembly involved in embryonic body morphogenesis(GO:1904261) basement membrane assembly involved in embryonic body morphogenesis(GO:2001197) |
| 0.3 | 5.9 | GO:0006853 | carnitine shuttle(GO:0006853) |
| 0.3 | 1.2 | GO:0071711 | basement membrane organization(GO:0071711) |
| 0.3 | 2.1 | GO:0021842 | directional guidance of interneurons involved in migration from the subpallium to the cortex(GO:0021840) chemorepulsion involved in interneuron migration from the subpallium to the cortex(GO:0021842) |
| 0.3 | 4.2 | GO:1904778 | regulation of protein localization to cell cortex(GO:1904776) positive regulation of protein localization to cell cortex(GO:1904778) |
| 0.3 | 0.3 | GO:1902954 | regulation of early endosome to recycling endosome transport(GO:1902954) |
| 0.3 | 0.3 | GO:1901187 | regulation of ephrin receptor signaling pathway(GO:1901187) |
| 0.3 | 31.6 | GO:0070268 | cornification(GO:0070268) |
| 0.3 | 3.3 | GO:2000304 | positive regulation of sphingolipid biosynthetic process(GO:0090154) positive regulation of ceramide biosynthetic process(GO:2000304) |
| 0.3 | 0.6 | GO:1904204 | regulation of skeletal muscle hypertrophy(GO:1904204) |
| 0.3 | 3.2 | GO:1900747 | negative regulation of vascular endothelial growth factor signaling pathway(GO:1900747) |
| 0.3 | 1.5 | GO:0010757 | negative regulation of plasminogen activation(GO:0010757) |
| 0.3 | 3.8 | GO:0090084 | negative regulation of inclusion body assembly(GO:0090084) |
| 0.3 | 1.2 | GO:0042986 | positive regulation of amyloid precursor protein biosynthetic process(GO:0042986) |
| 0.3 | 1.2 | GO:0015917 | aminophospholipid transport(GO:0015917) |
| 0.3 | 1.2 | GO:0043589 | skin morphogenesis(GO:0043589) |
| 0.3 | 4.4 | GO:0009629 | response to gravity(GO:0009629) |
| 0.3 | 2.0 | GO:0032287 | peripheral nervous system myelin maintenance(GO:0032287) |
| 0.3 | 0.9 | GO:0071494 | cellular response to UV-C(GO:0071494) |
| 0.3 | 1.2 | GO:1904046 | negative regulation of vascular endothelial growth factor production(GO:1904046) |
| 0.3 | 0.9 | GO:1901165 | positive regulation of trophoblast cell migration(GO:1901165) |
| 0.3 | 2.9 | GO:0002480 | antigen processing and presentation of exogenous peptide antigen via MHC class I, TAP-independent(GO:0002480) |
| 0.3 | 0.3 | GO:1903921 | protein processing in phagocytic vesicle(GO:1900756) regulation of protein processing in phagocytic vesicle(GO:1903921) positive regulation of protein processing in phagocytic vesicle(GO:1903923) |
| 0.3 | 0.3 | GO:0070508 | sterol import(GO:0035376) cholesterol import(GO:0070508) |
| 0.3 | 1.1 | GO:0071279 | cellular response to cobalt ion(GO:0071279) |
| 0.3 | 1.1 | GO:0034344 | type III interferon production(GO:0034343) regulation of type III interferon production(GO:0034344) |
| 0.3 | 0.3 | GO:1900242 | regulation of synaptic vesicle endocytosis(GO:1900242) positive regulation of synaptic vesicle endocytosis(GO:1900244) positive regulation of synaptic vesicle transport(GO:1902805) positive regulation of synaptic vesicle recycling(GO:1903423) |
| 0.3 | 3.9 | GO:1905049 | negative regulation of metallopeptidase activity(GO:1905049) |
| 0.3 | 2.2 | GO:0051388 | positive regulation of neurotrophin TRK receptor signaling pathway(GO:0051388) |
| 0.3 | 1.9 | GO:0032510 | endosome to lysosome transport via multivesicular body sorting pathway(GO:0032510) |
| 0.3 | 0.8 | GO:0006423 | cysteinyl-tRNA aminoacylation(GO:0006423) |
| 0.3 | 1.6 | GO:0003433 | chondrocyte development involved in endochondral bone morphogenesis(GO:0003433) |
| 0.3 | 2.2 | GO:0046618 | drug export(GO:0046618) |
| 0.3 | 0.3 | GO:0016081 | synaptic vesicle docking(GO:0016081) |
| 0.3 | 1.1 | GO:0038145 | macrophage colony-stimulating factor signaling pathway(GO:0038145) |
| 0.3 | 1.6 | GO:1902766 | skeletal muscle satellite cell migration(GO:1902766) |
| 0.3 | 1.1 | GO:0006049 | UDP-N-acetylglucosamine catabolic process(GO:0006049) |
| 0.3 | 0.3 | GO:1903336 | negative regulation of vacuolar transport(GO:1903336) |
| 0.3 | 3.4 | GO:0035372 | protein localization to microtubule(GO:0035372) |
| 0.3 | 1.1 | GO:2001288 | positive regulation of caveolin-mediated endocytosis(GO:2001288) |
| 0.3 | 0.5 | GO:1903564 | regulation of protein localization to cilium(GO:1903564) |
| 0.3 | 0.3 | GO:0034315 | regulation of Arp2/3 complex-mediated actin nucleation(GO:0034315) |
| 0.3 | 0.8 | GO:1901490 | regulation of lymphangiogenesis(GO:1901490) |
| 0.3 | 2.3 | GO:0015705 | iodide transport(GO:0015705) |
| 0.3 | 0.5 | GO:1903991 | positive regulation of iron ion transport(GO:0034758) positive regulation of iron ion transmembrane transport(GO:0034761) regulation of iron ion import(GO:1900390) regulation of ferrous iron import into cell(GO:1903989) positive regulation of ferrous iron import into cell(GO:1903991) regulation of ferrous iron binding(GO:1904432) positive regulation of ferrous iron binding(GO:1904434) regulation of transferrin receptor binding(GO:1904435) positive regulation of transferrin receptor binding(GO:1904437) regulation of ferrous iron import across plasma membrane(GO:1904438) positive regulation of ferrous iron import across plasma membrane(GO:1904440) |
| 0.3 | 4.1 | GO:0016540 | protein autoprocessing(GO:0016540) |
| 0.3 | 1.8 | GO:0010993 | regulation of ubiquitin homeostasis(GO:0010993) free ubiquitin chain polymerization(GO:0010994) |
| 0.3 | 8.4 | GO:0043616 | keratinocyte proliferation(GO:0043616) |
| 0.3 | 5.3 | GO:0042730 | fibrinolysis(GO:0042730) |
| 0.3 | 1.0 | GO:2000535 | regulation of entry of bacterium into host cell(GO:2000535) |
| 0.3 | 1.3 | GO:1902902 | negative regulation of autophagosome assembly(GO:1902902) |
| 0.3 | 2.0 | GO:1902412 | regulation of mitotic cytokinesis(GO:1902412) |
| 0.3 | 1.0 | GO:1900077 | negative regulation of cellular response to insulin stimulus(GO:1900077) |
| 0.3 | 1.3 | GO:0010635 | regulation of mitochondrial fusion(GO:0010635) |
| 0.3 | 3.0 | GO:0001915 | negative regulation of T cell mediated cytotoxicity(GO:0001915) |
| 0.2 | 2.5 | GO:0036155 | acylglycerol acyl-chain remodeling(GO:0036155) |
| 0.2 | 0.7 | GO:0046900 | tetrahydrofolylpolyglutamate metabolic process(GO:0046900) |
| 0.2 | 0.2 | GO:0015793 | glycerol transport(GO:0015793) |
| 0.2 | 0.7 | GO:0030327 | prenylated protein catabolic process(GO:0030327) |
| 0.2 | 1.0 | GO:0048698 | negative regulation of collateral sprouting in absence of injury(GO:0048698) |
| 0.2 | 1.0 | GO:0045218 | zonula adherens maintenance(GO:0045218) |
| 0.2 | 1.5 | GO:0010724 | regulation of definitive erythrocyte differentiation(GO:0010724) |
| 0.2 | 0.5 | GO:0009913 | epidermal cell differentiation(GO:0009913) |
| 0.2 | 0.5 | GO:0036337 | Fas signaling pathway(GO:0036337) |
| 0.2 | 3.9 | GO:0071803 | positive regulation of podosome assembly(GO:0071803) |
| 0.2 | 1.0 | GO:1900535 | medium-chain fatty-acyl-CoA catabolic process(GO:0036114) long-chain fatty-acyl-CoA catabolic process(GO:0036116) palmitic acid metabolic process(GO:1900533) palmitic acid biosynthetic process(GO:1900535) |
| 0.2 | 1.4 | GO:0019418 | sulfide oxidation(GO:0019418) sulfide oxidation, using sulfide:quinone oxidoreductase(GO:0070221) |
| 0.2 | 1.0 | GO:0042412 | taurine biosynthetic process(GO:0042412) |
| 0.2 | 4.1 | GO:0003215 | cardiac right ventricle morphogenesis(GO:0003215) |
| 0.2 | 0.2 | GO:1900104 | hyaluranon cable assembly(GO:0036118) regulation of hyaluranon cable assembly(GO:1900104) positive regulation of hyaluranon cable assembly(GO:1900106) |
| 0.2 | 0.5 | GO:0007439 | ectodermal digestive tract development(GO:0007439) embryonic ectodermal digestive tract development(GO:0048611) |
| 0.2 | 0.2 | GO:0051944 | positive regulation of neurotransmitter uptake(GO:0051582) positive regulation of dopamine uptake involved in synaptic transmission(GO:0051586) positive regulation of catecholamine uptake involved in synaptic transmission(GO:0051944) |
| 0.2 | 0.2 | GO:0036091 | positive regulation of transcription from RNA polymerase II promoter in response to oxidative stress(GO:0036091) |
| 0.2 | 0.7 | GO:0043328 | protein targeting to vacuole involved in ubiquitin-dependent protein catabolic process via the multivesicular body sorting pathway(GO:0043328) |
| 0.2 | 1.2 | GO:0008065 | establishment of blood-nerve barrier(GO:0008065) |
| 0.2 | 0.7 | GO:0072318 | clathrin coat disassembly(GO:0072318) clathrin-coated pit assembly(GO:1905224) |
| 0.2 | 0.2 | GO:0071649 | regulation of chemokine (C-C motif) ligand 5 production(GO:0071649) positive regulation of chemokine (C-C motif) ligand 5 production(GO:0071651) |
| 0.2 | 0.7 | GO:1901837 | negative regulation of transcription of nuclear large rRNA transcript from RNA polymerase I promoter(GO:1901837) |
| 0.2 | 2.3 | GO:0033601 | positive regulation of mammary gland epithelial cell proliferation(GO:0033601) |
| 0.2 | 1.2 | GO:0002415 | immunoglobulin transcytosis in epithelial cells mediated by polymeric immunoglobulin receptor(GO:0002415) |
| 0.2 | 0.7 | GO:0071140 | resolution of recombination intermediates(GO:0071139) resolution of mitotic recombination intermediates(GO:0071140) |
| 0.2 | 4.4 | GO:0051764 | actin crosslink formation(GO:0051764) |
| 0.2 | 4.1 | GO:0007021 | tubulin complex assembly(GO:0007021) |
| 0.2 | 0.2 | GO:0003062 | regulation of heart rate by chemical signal(GO:0003062) |
| 0.2 | 1.6 | GO:0061734 | parkin-mediated mitophagy in response to mitochondrial depolarization(GO:0061734) |
| 0.2 | 2.9 | GO:0043162 | ubiquitin-dependent protein catabolic process via the multivesicular body sorting pathway(GO:0043162) |
| 0.2 | 2.5 | GO:0035721 | intraciliary retrograde transport(GO:0035721) |
| 0.2 | 0.9 | GO:0003409 | optic cup structural organization(GO:0003409) |
| 0.2 | 1.6 | GO:1903232 | melanosome assembly(GO:1903232) |
| 0.2 | 0.4 | GO:0032526 | response to retinoic acid(GO:0032526) |
| 0.2 | 4.4 | GO:0002089 | lens morphogenesis in camera-type eye(GO:0002089) |
| 0.2 | 0.2 | GO:0034333 | adherens junction assembly(GO:0034333) |
| 0.2 | 4.9 | GO:0007250 | activation of NF-kappaB-inducing kinase activity(GO:0007250) |
| 0.2 | 0.4 | GO:0071105 | response to interleukin-11(GO:0071105) |
| 0.2 | 1.5 | GO:0045919 | positive regulation of cytolysis(GO:0045919) |
| 0.2 | 1.9 | GO:0060137 | maternal process involved in parturition(GO:0060137) |
| 0.2 | 1.7 | GO:2000675 | negative regulation of type B pancreatic cell apoptotic process(GO:2000675) |
| 0.2 | 0.4 | GO:1902723 | negative regulation of skeletal muscle cell proliferation(GO:0014859) negative regulation of skeletal muscle satellite cell proliferation(GO:1902723) |
| 0.2 | 0.6 | GO:0086100 | endothelin receptor signaling pathway(GO:0086100) |
| 0.2 | 1.3 | GO:0046208 | spermine catabolic process(GO:0046208) |
| 0.2 | 1.5 | GO:0090136 | epithelial cell-cell adhesion(GO:0090136) |
| 0.2 | 1.1 | GO:0072313 | metanephric glomerular epithelium development(GO:0072244) metanephric glomerular visceral epithelial cell differentiation(GO:0072248) metanephric glomerular visceral epithelial cell development(GO:0072249) metanephric glomerular epithelial cell differentiation(GO:0072312) metanephric glomerular epithelial cell development(GO:0072313) |
| 0.2 | 0.9 | GO:0090063 | positive regulation of microtubule nucleation(GO:0090063) |
| 0.2 | 0.2 | GO:1903625 | negative regulation of DNA catabolic process(GO:1903625) |
| 0.2 | 3.2 | GO:0019852 | L-ascorbic acid metabolic process(GO:0019852) |
| 0.2 | 1.1 | GO:0014883 | transition between fast and slow fiber(GO:0014883) |
| 0.2 | 0.6 | GO:0051088 | PMA-inducible membrane protein ectodomain proteolysis(GO:0051088) |
| 0.2 | 0.6 | GO:0006427 | histidyl-tRNA aminoacylation(GO:0006427) |
| 0.2 | 1.7 | GO:0006621 | protein retention in ER lumen(GO:0006621) |
| 0.2 | 0.6 | GO:0046586 | regulation of calcium-dependent cell-cell adhesion(GO:0046586) |
| 0.2 | 0.2 | GO:0007512 | adult heart development(GO:0007512) |
| 0.2 | 0.8 | GO:0046836 | glycolipid transport(GO:0046836) |
| 0.2 | 0.8 | GO:0032815 | negative regulation of natural killer cell activation(GO:0032815) |
| 0.2 | 0.8 | GO:0006780 | uroporphyrinogen III biosynthetic process(GO:0006780) uroporphyrinogen III metabolic process(GO:0046502) |
| 0.2 | 0.6 | GO:0090283 | regulation of protein glycosylation in Golgi(GO:0090283) |
| 0.2 | 0.4 | GO:0003150 | muscular septum morphogenesis(GO:0003150) |
| 0.2 | 5.2 | GO:0030206 | chondroitin sulfate biosynthetic process(GO:0030206) |
| 0.2 | 1.2 | GO:0060244 | negative regulation of cell proliferation involved in contact inhibition(GO:0060244) |
| 0.2 | 0.6 | GO:0097359 | UDP-glucosylation(GO:0097359) |
| 0.2 | 1.6 | GO:0098887 | neurotransmitter receptor transport, endosome to postsynaptic membrane(GO:0098887) |
| 0.2 | 3.0 | GO:0019371 | cyclooxygenase pathway(GO:0019371) |
| 0.2 | 0.6 | GO:0046104 | thymidine metabolic process(GO:0046104) pyrimidine deoxyribonucleoside metabolic process(GO:0046125) |
| 0.2 | 1.4 | GO:0097084 | vascular smooth muscle cell development(GO:0097084) |
| 0.2 | 0.6 | GO:0051102 | DNA ligation involved in DNA recombination(GO:0051102) |
| 0.2 | 1.4 | GO:0035583 | sequestering of TGFbeta in extracellular matrix(GO:0035583) |
| 0.2 | 0.6 | GO:0061357 | positive regulation of Wnt protein secretion(GO:0061357) |
| 0.2 | 1.0 | GO:0006651 | diacylglycerol biosynthetic process(GO:0006651) |
| 0.2 | 0.6 | GO:0001983 | regulation of systemic arterial blood pressure by carotid sinus baroreceptor feedback(GO:0001978) baroreceptor response to increased systemic arterial blood pressure(GO:0001983) |
| 0.2 | 0.8 | GO:0036363 | transforming growth factor beta activation(GO:0036363) regulation of mesenchymal stem cell proliferation(GO:1902460) positive regulation of mesenchymal stem cell proliferation(GO:1902462) |
| 0.2 | 1.7 | GO:0038007 | netrin-activated signaling pathway(GO:0038007) |
| 0.2 | 0.2 | GO:0033023 | mast cell homeostasis(GO:0033023) mast cell apoptotic process(GO:0033024) regulation of mast cell apoptotic process(GO:0033025) |
| 0.2 | 0.2 | GO:0050931 | pigment cell differentiation(GO:0050931) |
| 0.2 | 1.3 | GO:0001886 | endothelial cell morphogenesis(GO:0001886) |
| 0.2 | 0.6 | GO:1902463 | protein localization to cell leading edge(GO:1902463) |
| 0.2 | 1.1 | GO:0090131 | mesenchyme migration(GO:0090131) |
| 0.2 | 0.6 | GO:0045918 | negative regulation of cytolysis(GO:0045918) |
| 0.2 | 1.5 | GO:1902037 | negative regulation of hematopoietic stem cell differentiation(GO:1902037) |
| 0.2 | 0.9 | GO:0032907 | transforming growth factor beta3 production(GO:0032907) regulation of transforming growth factor beta3 production(GO:0032910) positive regulation of transforming growth factor beta3 production(GO:0032916) negative regulation of lung blood pressure(GO:0061767) |
| 0.2 | 0.7 | GO:0042483 | negative regulation of odontogenesis(GO:0042483) |
| 0.2 | 0.7 | GO:0043321 | regulation of natural killer cell degranulation(GO:0043321) positive regulation of natural killer cell degranulation(GO:0043323) |
| 0.2 | 1.3 | GO:2000467 | positive regulation of glycogen (starch) synthase activity(GO:2000467) |
| 0.2 | 1.3 | GO:0070294 | renal sodium ion absorption(GO:0070294) |
| 0.2 | 0.5 | GO:0006788 | heme oxidation(GO:0006788) |
| 0.2 | 0.5 | GO:0046521 | sphingoid catabolic process(GO:0046521) |
| 0.2 | 10.0 | GO:0030574 | collagen catabolic process(GO:0030574) |
| 0.2 | 0.7 | GO:0061000 | negative regulation of dendritic spine development(GO:0061000) |
| 0.2 | 14.0 | GO:0051965 | positive regulation of synapse assembly(GO:0051965) |
| 0.2 | 0.4 | GO:1902623 | negative regulation of granulocyte chemotaxis(GO:0071623) negative regulation of neutrophil chemotaxis(GO:0090024) negative regulation of neutrophil migration(GO:1902623) |
| 0.2 | 0.5 | GO:0048203 | vesicle targeting, trans-Golgi to endosome(GO:0048203) |
| 0.2 | 0.7 | GO:0046826 | negative regulation of protein export from nucleus(GO:0046826) |
| 0.2 | 0.7 | GO:2000389 | regulation of neutrophil extravasation(GO:2000389) |
| 0.2 | 1.3 | GO:0046469 | platelet activating factor metabolic process(GO:0046469) |
| 0.2 | 1.3 | GO:0006011 | UDP-glucose metabolic process(GO:0006011) |
| 0.2 | 0.5 | GO:0061470 | T follicular helper cell differentiation(GO:0061470) |
| 0.2 | 0.4 | GO:0097116 | gephyrin clustering involved in postsynaptic density assembly(GO:0097116) |
| 0.2 | 0.4 | GO:0090086 | negative regulation of protein deubiquitination(GO:0090086) |
| 0.2 | 0.4 | GO:1990668 | vesicle fusion with endoplasmic reticulum-Golgi intermediate compartment (ERGIC) membrane(GO:1990668) |
| 0.2 | 2.8 | GO:0006995 | cellular response to nitrogen starvation(GO:0006995) cellular response to nitrogen levels(GO:0043562) |
| 0.2 | 0.3 | GO:1903977 | positive regulation of glial cell migration(GO:1903977) |
| 0.2 | 0.2 | GO:0051683 | establishment of Golgi localization(GO:0051683) |
| 0.2 | 0.5 | GO:1901202 | negative regulation of extracellular matrix assembly(GO:1901202) |
| 0.2 | 0.5 | GO:0019474 | L-lysine catabolic process to acetyl-CoA(GO:0019474) L-lysine catabolic process(GO:0019477) L-lysine metabolic process(GO:0046440) |
| 0.2 | 1.7 | GO:0002483 | antigen processing and presentation of endogenous peptide antigen(GO:0002483) antigen processing and presentation of endogenous peptide antigen via MHC class I(GO:0019885) |
| 0.2 | 0.5 | GO:0000715 | nucleotide-excision repair, DNA damage recognition(GO:0000715) |
| 0.2 | 1.4 | GO:2000580 | positive regulation of microtubule motor activity(GO:2000576) regulation of ATP-dependent microtubule motor activity, plus-end-directed(GO:2000580) positive regulation of ATP-dependent microtubule motor activity, plus-end-directed(GO:2000582) |
| 0.2 | 1.0 | GO:0009912 | auditory receptor cell fate commitment(GO:0009912) inner ear receptor cell fate commitment(GO:0060120) |
| 0.2 | 0.5 | GO:0061760 | antifungal innate immune response(GO:0061760) |
| 0.2 | 0.2 | GO:0000768 | syncytium formation by plasma membrane fusion(GO:0000768) |
| 0.2 | 0.8 | GO:0071071 | regulation of phospholipid biosynthetic process(GO:0071071) |
| 0.2 | 1.3 | GO:0031953 | negative regulation of protein autophosphorylation(GO:0031953) |
| 0.2 | 0.7 | GO:1903949 | positive regulation of cardiac conduction(GO:1903781) positive regulation of atrial cardiac muscle cell action potential(GO:1903949) positive regulation of regulation of vascular smooth muscle cell membrane depolarization(GO:1904199) regulation of vascular smooth muscle cell membrane depolarization(GO:1990736) |
| 0.2 | 0.3 | GO:0070213 | protein auto-ADP-ribosylation(GO:0070213) |
| 0.2 | 0.7 | GO:0007525 | somatic muscle development(GO:0007525) |
| 0.2 | 0.7 | GO:0006710 | androgen catabolic process(GO:0006710) |
| 0.2 | 0.2 | GO:0045844 | positive regulation of striated muscle tissue development(GO:0045844) positive regulation of muscle organ development(GO:0048636) positive regulation of muscle tissue development(GO:1901863) |
| 0.2 | 2.9 | GO:0010842 | retina layer formation(GO:0010842) |
| 0.2 | 0.3 | GO:0061314 | Notch signaling involved in heart development(GO:0061314) |
| 0.2 | 1.1 | GO:0042908 | xenobiotic transport(GO:0042908) |
| 0.2 | 1.0 | GO:0010756 | positive regulation of plasminogen activation(GO:0010756) |
| 0.2 | 0.3 | GO:0044314 | protein K27-linked ubiquitination(GO:0044314) |
| 0.2 | 0.5 | GO:0071529 | cementum mineralization(GO:0071529) |
| 0.2 | 0.6 | GO:1903279 | regulation of calcium:sodium antiporter activity(GO:1903279) |
| 0.2 | 1.0 | GO:0051012 | microtubule sliding(GO:0051012) |
| 0.2 | 1.1 | GO:2000795 | trigeminal sensory nucleus development(GO:0021730) principal sensory nucleus of trigeminal nerve development(GO:0021740) negative regulation of epithelial cell proliferation involved in lung morphogenesis(GO:2000795) |
| 0.2 | 0.3 | GO:1901569 | leukotriene catabolic process(GO:0036100) leukotriene B4 catabolic process(GO:0036101) leukotriene B4 metabolic process(GO:0036102) icosanoid catabolic process(GO:1901523) fatty acid derivative catabolic process(GO:1901569) |
| 0.2 | 2.4 | GO:0032331 | negative regulation of chondrocyte differentiation(GO:0032331) |
| 0.2 | 0.2 | GO:0060541 | respiratory system development(GO:0060541) |
| 0.2 | 0.2 | GO:0051138 | positive regulation of NK T cell differentiation(GO:0051138) |
| 0.2 | 1.1 | GO:0042117 | monocyte activation(GO:0042117) |
| 0.2 | 0.3 | GO:0003176 | aortic valve development(GO:0003176) aortic valve morphogenesis(GO:0003180) |
| 0.2 | 0.9 | GO:0055064 | chloride ion homeostasis(GO:0055064) |
| 0.2 | 0.5 | GO:0046341 | CDP-diacylglycerol metabolic process(GO:0046341) |
| 0.2 | 0.2 | GO:0016078 | tRNA catabolic process(GO:0016078) |
| 0.2 | 0.3 | GO:0050819 | negative regulation of coagulation(GO:0050819) |
| 0.2 | 0.6 | GO:0060282 | positive regulation of oocyte development(GO:0060282) |
| 0.2 | 0.3 | GO:0071104 | response to interleukin-9(GO:0071104) |
| 0.2 | 4.4 | GO:0043567 | regulation of insulin-like growth factor receptor signaling pathway(GO:0043567) |
| 0.2 | 0.8 | GO:0030200 | proteoglycan catabolic process(GO:0030167) heparan sulfate proteoglycan catabolic process(GO:0030200) |
| 0.2 | 0.6 | GO:0002329 | pre-B cell differentiation(GO:0002329) pre-B cell allelic exclusion(GO:0002331) |
| 0.2 | 0.2 | GO:0030240 | skeletal muscle thin filament assembly(GO:0030240) skeletal muscle myosin thick filament assembly(GO:0030241) |
| 0.1 | 0.7 | GO:0006933 | negative regulation of cell adhesion involved in substrate-bound cell migration(GO:0006933) |
| 0.1 | 0.4 | GO:0048861 | leukemia inhibitory factor signaling pathway(GO:0048861) |
| 0.1 | 0.4 | GO:0038060 | nitric oxide-cGMP-mediated signaling pathway(GO:0038060) |
| 0.1 | 6.5 | GO:2000649 | regulation of sodium ion transmembrane transporter activity(GO:2000649) |
| 0.1 | 0.6 | GO:0030207 | chondroitin sulfate catabolic process(GO:0030207) |
| 0.1 | 0.3 | GO:0048133 | germ-line stem cell division(GO:0042078) male germ-line stem cell asymmetric division(GO:0048133) germline stem cell asymmetric division(GO:0098728) |
| 0.1 | 0.6 | GO:0097089 | methyl-branched fatty acid metabolic process(GO:0097089) |
| 0.1 | 0.3 | GO:0050918 | positive chemotaxis(GO:0050918) |
| 0.1 | 0.9 | GO:0048630 | skeletal muscle tissue growth(GO:0048630) |
| 0.1 | 0.4 | GO:2000301 | negative regulation of synaptic vesicle exocytosis(GO:2000301) |
| 0.1 | 0.6 | GO:0072675 | multinuclear osteoclast differentiation(GO:0072674) osteoclast fusion(GO:0072675) |
| 0.1 | 0.4 | GO:0043314 | negative regulation of neutrophil degranulation(GO:0043314) |
| 0.1 | 0.7 | GO:0034214 | protein hexamerization(GO:0034214) |
| 0.1 | 0.3 | GO:0051409 | response to nitrosative stress(GO:0051409) |
| 0.1 | 0.3 | GO:1905123 | regulation of glucosylceramidase activity(GO:1905123) |
| 0.1 | 0.4 | GO:0032594 | protein transport within lipid bilayer(GO:0032594) protein transport into membrane raft(GO:0032596) |
| 0.1 | 0.1 | GO:0097527 | necroptotic signaling pathway(GO:0097527) |
| 0.1 | 1.7 | GO:0060856 | establishment of blood-brain barrier(GO:0060856) |
| 0.1 | 0.6 | GO:0048680 | positive regulation of axon regeneration(GO:0048680) |
| 0.1 | 0.6 | GO:2000660 | negative regulation of interleukin-1-mediated signaling pathway(GO:2000660) |
| 0.1 | 1.7 | GO:0010591 | regulation of lamellipodium assembly(GO:0010591) |
| 0.1 | 0.1 | GO:0060295 | regulation of cilium movement involved in cell motility(GO:0060295) regulation of cilium beat frequency involved in ciliary motility(GO:0060296) regulation of cilium-dependent cell motility(GO:1902019) |
| 0.1 | 0.3 | GO:0072193 | ureter smooth muscle development(GO:0072191) ureter smooth muscle cell differentiation(GO:0072193) |
| 0.1 | 1.0 | GO:0046604 | positive regulation of mitotic centrosome separation(GO:0046604) |
| 0.1 | 0.1 | GO:0035092 | sperm chromatin condensation(GO:0035092) |
| 0.1 | 0.1 | GO:0097296 | activation of cysteine-type endopeptidase activity involved in apoptotic signaling pathway(GO:0097296) |
| 0.1 | 0.8 | GO:0051122 | hepoxilin metabolic process(GO:0051121) hepoxilin biosynthetic process(GO:0051122) |
| 0.1 | 0.7 | GO:0007619 | courtship behavior(GO:0007619) |
| 0.1 | 0.1 | GO:0042268 | regulation of cytolysis(GO:0042268) |
| 0.1 | 0.3 | GO:0035865 | cellular response to potassium ion(GO:0035865) |
| 0.1 | 0.5 | GO:0030822 | positive regulation of cyclic nucleotide catabolic process(GO:0030807) positive regulation of cAMP catabolic process(GO:0030822) positive regulation of purine nucleotide catabolic process(GO:0033123) |
| 0.1 | 1.5 | GO:0010992 | ubiquitin homeostasis(GO:0010992) |
| 0.1 | 0.5 | GO:0045080 | positive regulation of chemokine biosynthetic process(GO:0045080) |
| 0.1 | 1.1 | GO:0001887 | selenium compound metabolic process(GO:0001887) |
| 0.1 | 0.5 | GO:0097155 | fasciculation of sensory neuron axon(GO:0097155) |
| 0.1 | 0.3 | GO:0003011 | involuntary skeletal muscle contraction(GO:0003011) |
| 0.1 | 0.1 | GO:0097168 | mesenchymal stem cell proliferation(GO:0097168) |
| 0.1 | 0.9 | GO:2000587 | negative regulation of platelet-derived growth factor receptor-beta signaling pathway(GO:2000587) |
| 0.1 | 0.7 | GO:0006655 | phosphatidylglycerol biosynthetic process(GO:0006655) |
| 0.1 | 0.8 | GO:1900193 | regulation of oocyte maturation(GO:1900193) |
| 0.1 | 0.4 | GO:0043012 | regulation of fusion of sperm to egg plasma membrane(GO:0043012) |
| 0.1 | 3.3 | GO:0061462 | protein localization to lysosome(GO:0061462) |
| 0.1 | 0.5 | GO:0003056 | regulation of vascular smooth muscle contraction(GO:0003056) |
| 0.1 | 1.3 | GO:0048742 | regulation of skeletal muscle fiber development(GO:0048742) |
| 0.1 | 1.6 | GO:0022011 | myelination in peripheral nervous system(GO:0022011) peripheral nervous system axon ensheathment(GO:0032292) |
| 0.1 | 1.2 | GO:0048251 | elastic fiber assembly(GO:0048251) |
| 0.1 | 0.4 | GO:0000290 | deadenylation-dependent decapping of nuclear-transcribed mRNA(GO:0000290) |
| 0.1 | 0.6 | GO:0071442 | positive regulation of histone H3-K14 acetylation(GO:0071442) |
| 0.1 | 0.8 | GO:0060445 | branching involved in salivary gland morphogenesis(GO:0060445) |
| 0.1 | 0.4 | GO:1900063 | regulation of peroxisome organization(GO:1900063) |
| 0.1 | 0.3 | GO:0060454 | positive regulation of gastric acid secretion(GO:0060454) |
| 0.1 | 1.5 | GO:0060576 | intestinal epithelial cell development(GO:0060576) |
| 0.1 | 0.6 | GO:1901910 | diadenosine polyphosphate catabolic process(GO:0015961) diphosphoinositol polyphosphate metabolic process(GO:0071543) diadenosine pentaphosphate metabolic process(GO:1901906) diadenosine pentaphosphate catabolic process(GO:1901907) diadenosine hexaphosphate metabolic process(GO:1901908) diadenosine hexaphosphate catabolic process(GO:1901909) adenosine 5'-(hexahydrogen pentaphosphate) metabolic process(GO:1901910) adenosine 5'-(hexahydrogen pentaphosphate) catabolic process(GO:1901911) |
| 0.1 | 0.5 | GO:0045415 | negative regulation of interleukin-8 biosynthetic process(GO:0045415) |
| 0.1 | 1.3 | GO:0044341 | sodium-dependent phosphate transport(GO:0044341) |
| 0.1 | 1.4 | GO:0021814 | cell motility involved in cerebral cortex radial glia guided migration(GO:0021814) |
| 0.1 | 0.4 | GO:0019072 | viral genome packaging(GO:0019072) viral RNA genome packaging(GO:0019074) |
| 0.1 | 3.4 | GO:0007176 | regulation of epidermal growth factor-activated receptor activity(GO:0007176) |
| 0.1 | 0.6 | GO:1903265 | positive regulation of tumor necrosis factor-mediated signaling pathway(GO:1903265) |
| 0.1 | 0.4 | GO:0061458 | reproductive system development(GO:0061458) |
| 0.1 | 0.5 | GO:0019046 | release from viral latency(GO:0019046) |
| 0.1 | 0.4 | GO:1901899 | positive regulation of relaxation of cardiac muscle(GO:1901899) |
| 0.1 | 4.9 | GO:0003254 | regulation of membrane depolarization(GO:0003254) |
| 0.1 | 0.7 | GO:0070164 | negative regulation of adiponectin secretion(GO:0070164) |
| 0.1 | 0.2 | GO:0010940 | positive regulation of necrotic cell death(GO:0010940) |
| 0.1 | 1.1 | GO:0009642 | response to light intensity(GO:0009642) |
| 0.1 | 1.2 | GO:0048007 | antigen processing and presentation via MHC class Ib(GO:0002475) antigen processing and presentation of lipid antigen via MHC class Ib(GO:0048003) antigen processing and presentation, exogenous lipid antigen via MHC class Ib(GO:0048007) |
| 0.1 | 2.3 | GO:0071498 | cellular response to fluid shear stress(GO:0071498) |
| 0.1 | 0.4 | GO:0090175 | Wnt signaling pathway, planar cell polarity pathway(GO:0060071) regulation of establishment of planar polarity(GO:0090175) |
| 0.1 | 0.2 | GO:0060056 | mammary gland involution(GO:0060056) |
| 0.1 | 1.1 | GO:0035434 | copper ion transmembrane transport(GO:0035434) |
| 0.1 | 1.1 | GO:0015884 | folic acid transport(GO:0015884) |
| 0.1 | 1.4 | GO:0070886 | positive regulation of calcineurin-NFAT signaling cascade(GO:0070886) |
| 0.1 | 0.8 | GO:0048712 | negative regulation of astrocyte differentiation(GO:0048712) |
| 0.1 | 0.4 | GO:0061370 | testosterone biosynthetic process(GO:0061370) |
| 0.1 | 0.7 | GO:0060347 | heart trabecula formation(GO:0060347) |
| 0.1 | 0.4 | GO:0036353 | histone H2A-K119 monoubiquitination(GO:0036353) |
| 0.1 | 0.4 | GO:0000271 | polysaccharide biosynthetic process(GO:0000271) |
| 0.1 | 0.4 | GO:0031291 | Ran protein signal transduction(GO:0031291) |
| 0.1 | 0.2 | GO:0002232 | leukocyte chemotaxis involved in inflammatory response(GO:0002232) |
| 0.1 | 0.5 | GO:0071306 | cellular response to vitamin E(GO:0071306) |
| 0.1 | 1.2 | GO:1902373 | negative regulation of mRNA catabolic process(GO:1902373) |
| 0.1 | 0.3 | GO:0043353 | enucleate erythrocyte differentiation(GO:0043353) |
| 0.1 | 0.1 | GO:0009438 | methylglyoxal metabolic process(GO:0009438) |
| 0.1 | 0.5 | GO:1900245 | positive regulation of MDA-5 signaling pathway(GO:1900245) |
| 0.1 | 0.6 | GO:0072385 | minus-end-directed organelle transport along microtubule(GO:0072385) |
| 0.1 | 0.3 | GO:0060940 | epithelial to mesenchymal transition involved in cardiac fibroblast development(GO:0060940) |
| 0.1 | 0.7 | GO:0030043 | actin filament fragmentation(GO:0030043) |
| 0.1 | 0.6 | GO:0035694 | mitochondrial protein catabolic process(GO:0035694) |
| 0.1 | 5.2 | GO:0035329 | hippo signaling(GO:0035329) |
| 0.1 | 1.1 | GO:1901621 | negative regulation of smoothened signaling pathway involved in dorsal/ventral neural tube patterning(GO:1901621) |
| 0.1 | 0.7 | GO:0048642 | negative regulation of skeletal muscle tissue development(GO:0048642) |
| 0.1 | 0.9 | GO:0046415 | urate metabolic process(GO:0046415) |
| 0.1 | 0.2 | GO:0038165 | oncostatin-M-mediated signaling pathway(GO:0038165) |
| 0.1 | 0.1 | GO:0060729 | intestinal epithelial structure maintenance(GO:0060729) |
| 0.1 | 2.6 | GO:0051894 | positive regulation of focal adhesion assembly(GO:0051894) |
| 0.1 | 0.1 | GO:0035812 | renal sodium excretion(GO:0035812) regulation of renal sodium excretion(GO:0035813) regulation of excretion(GO:0044062) |
| 0.1 | 0.8 | GO:0015014 | heparan sulfate proteoglycan biosynthetic process, polysaccharide chain biosynthetic process(GO:0015014) |
| 0.1 | 0.4 | GO:0021520 | spinal cord motor neuron cell fate specification(GO:0021520) |
| 0.1 | 1.6 | GO:0032802 | low-density lipoprotein particle receptor catabolic process(GO:0032802) |
| 0.1 | 0.9 | GO:0060020 | Bergmann glial cell differentiation(GO:0060020) |
| 0.1 | 0.4 | GO:0002296 | T-helper 1 cell lineage commitment(GO:0002296) |
| 0.1 | 2.3 | GO:0007141 | male meiosis I(GO:0007141) |
| 0.1 | 0.4 | GO:0043587 | tongue morphogenesis(GO:0043587) |
| 0.1 | 0.3 | GO:0009597 | detection of virus(GO:0009597) |
| 0.1 | 0.3 | GO:0043403 | skeletal muscle tissue regeneration(GO:0043403) |
| 0.1 | 0.7 | GO:0043152 | induction of bacterial agglutination(GO:0043152) |
| 0.1 | 0.3 | GO:0036079 | GDP-fucose transport(GO:0015783) purine nucleotide-sugar transport(GO:0036079) |
| 0.1 | 0.5 | GO:0007386 | compartment pattern specification(GO:0007386) |
| 0.1 | 0.1 | GO:1901727 | positive regulation of histone deacetylase activity(GO:1901727) |
| 0.1 | 1.4 | GO:0032515 | negative regulation of phosphoprotein phosphatase activity(GO:0032515) |
| 0.1 | 0.1 | GO:0021539 | subthalamus development(GO:0021539) |
| 0.1 | 0.2 | GO:1901896 | positive regulation of calcium-transporting ATPase activity(GO:1901896) |
| 0.1 | 0.3 | GO:0090394 | negative regulation of excitatory postsynaptic potential(GO:0090394) |
| 0.1 | 0.2 | GO:0048477 | oogenesis(GO:0048477) |
| 0.1 | 0.4 | GO:0042271 | susceptibility to natural killer cell mediated cytotoxicity(GO:0042271) |
| 0.1 | 0.1 | GO:0060830 | ciliary receptor clustering involved in smoothened signaling pathway(GO:0060830) |
| 0.1 | 0.2 | GO:0015688 | iron chelate transport(GO:0015688) siderophore transport(GO:0015891) |
| 0.1 | 2.6 | GO:0050435 | beta-amyloid metabolic process(GO:0050435) |
| 0.1 | 1.2 | GO:0030199 | collagen fibril organization(GO:0030199) |
| 0.1 | 0.2 | GO:0002028 | regulation of sodium ion transport(GO:0002028) |
| 0.1 | 0.2 | GO:0048842 | positive regulation of axon extension involved in axon guidance(GO:0048842) |
| 0.1 | 0.2 | GO:0036215 | response to stem cell factor(GO:0036215) cellular response to stem cell factor stimulus(GO:0036216) Kit signaling pathway(GO:0038109) |
| 0.1 | 0.2 | GO:1902236 | negative regulation of endoplasmic reticulum stress-induced intrinsic apoptotic signaling pathway(GO:1902236) |
| 0.1 | 0.1 | GO:0032672 | regulation of interleukin-3 production(GO:0032672) positive regulation of interleukin-3 production(GO:0032752) interleukin-3 biosynthetic process(GO:0042223) regulation of interleukin-3 biosynthetic process(GO:0045399) positive regulation of interleukin-3 biosynthetic process(GO:0045401) |
| 0.1 | 0.2 | GO:0060681 | branch elongation involved in ureteric bud branching(GO:0060681) |
| 0.1 | 0.4 | GO:0035879 | plasma membrane lactate transport(GO:0035879) |
| 0.1 | 0.6 | GO:1900029 | positive regulation of ruffle assembly(GO:1900029) |
| 0.1 | 0.3 | GO:0046113 | nucleobase catabolic process(GO:0046113) |
| 0.1 | 1.3 | GO:0030502 | negative regulation of bone mineralization(GO:0030502) |
| 0.1 | 0.6 | GO:0035860 | glial cell-derived neurotrophic factor receptor signaling pathway(GO:0035860) |
| 0.1 | 0.3 | GO:0032808 | lacrimal gland development(GO:0032808) |
| 0.1 | 0.6 | GO:0071763 | nuclear membrane organization(GO:0071763) |
| 0.1 | 0.9 | GO:0090315 | negative regulation of protein targeting to membrane(GO:0090315) |
| 0.1 | 0.3 | GO:0006617 | SRP-dependent cotranslational protein targeting to membrane, signal sequence recognition(GO:0006617) |
| 0.1 | 0.3 | GO:0008215 | spermine metabolic process(GO:0008215) |
| 0.1 | 0.1 | GO:0060352 | cell adhesion molecule production(GO:0060352) |
| 0.1 | 1.3 | GO:0010603 | regulation of cytoplasmic mRNA processing body assembly(GO:0010603) |
| 0.1 | 0.3 | GO:0036509 | trimming of terminal mannose on B branch(GO:0036509) trimming of first mannose on A branch(GO:0036511) trimming of second mannose on A branch(GO:0036512) |
| 0.1 | 0.5 | GO:0033489 | cholesterol biosynthetic process via desmosterol(GO:0033489) cholesterol biosynthetic process via lathosterol(GO:0033490) |
| 0.1 | 0.2 | GO:0042369 | vitamin D catabolic process(GO:0042369) |
| 0.1 | 0.4 | GO:0042796 | snRNA transcription from RNA polymerase III promoter(GO:0042796) |
| 0.1 | 0.3 | GO:0010845 | positive regulation of reciprocal meiotic recombination(GO:0010845) |
| 0.1 | 1.3 | GO:0007567 | parturition(GO:0007567) |
| 0.1 | 0.9 | GO:2000811 | negative regulation of anoikis(GO:2000811) |
| 0.1 | 0.3 | GO:0044351 | macropinocytosis(GO:0044351) |
| 0.1 | 0.4 | GO:0060040 | retinal bipolar neuron differentiation(GO:0060040) |
| 0.1 | 0.1 | GO:0001992 | regulation of systemic arterial blood pressure by vasopressin(GO:0001992) |
| 0.1 | 0.9 | GO:0002098 | tRNA wobble uridine modification(GO:0002098) |
| 0.1 | 0.4 | GO:0006308 | DNA catabolic process(GO:0006308) |
| 0.1 | 0.5 | GO:0060754 | positive regulation of mast cell chemotaxis(GO:0060754) |
| 0.1 | 0.3 | GO:0072015 | glomerular visceral epithelial cell development(GO:0072015) |
| 0.1 | 0.5 | GO:0018231 | peptidyl-L-cysteine S-palmitoylation(GO:0018230) peptidyl-S-diacylglycerol-L-cysteine biosynthetic process from peptidyl-cysteine(GO:0018231) |
| 0.1 | 0.8 | GO:0007172 | signal complex assembly(GO:0007172) |
| 0.1 | 0.2 | GO:0001842 | neural fold formation(GO:0001842) |
| 0.1 | 0.9 | GO:0045039 | protein import into mitochondrial inner membrane(GO:0045039) |
| 0.1 | 3.7 | GO:0000413 | protein peptidyl-prolyl isomerization(GO:0000413) |
| 0.1 | 0.4 | GO:0036159 | inner dynein arm assembly(GO:0036159) |
| 0.1 | 0.3 | GO:0050758 | thymidylate synthase biosynthetic process(GO:0050757) regulation of thymidylate synthase biosynthetic process(GO:0050758) |
| 0.1 | 0.8 | GO:0060083 | smooth muscle contraction involved in micturition(GO:0060083) |
| 0.1 | 0.2 | GO:0086029 | Purkinje myocyte to ventricular cardiac muscle cell signaling(GO:0086029) Purkinje myocyte to ventricular cardiac muscle cell communication(GO:0086068) |
| 0.1 | 0.1 | GO:0071724 | toll-like receptor TLR6:TLR2 signaling pathway(GO:0038124) response to diacyl bacterial lipopeptide(GO:0071724) cellular response to diacyl bacterial lipopeptide(GO:0071726) |
| 0.1 | 0.2 | GO:0003241 | growth involved in heart morphogenesis(GO:0003241) |
| 0.1 | 0.3 | GO:0048312 | intracellular distribution of mitochondria(GO:0048312) |
| 0.1 | 0.3 | GO:0051533 | positive regulation of NFAT protein import into nucleus(GO:0051533) |
| 0.1 | 1.1 | GO:0038003 | opioid receptor signaling pathway(GO:0038003) |
| 0.1 | 0.7 | GO:0060004 | reflex(GO:0060004) |
| 0.1 | 0.3 | GO:0002084 | protein depalmitoylation(GO:0002084) |
| 0.1 | 1.2 | GO:0034497 | protein localization to pre-autophagosomal structure(GO:0034497) |
| 0.1 | 0.3 | GO:0048294 | negative regulation of isotype switching to IgE isotypes(GO:0048294) |
| 0.1 | 0.6 | GO:0008218 | bioluminescence(GO:0008218) |
| 0.1 | 0.3 | GO:0016255 | attachment of GPI anchor to protein(GO:0016255) |
| 0.1 | 0.4 | GO:0035900 | response to isolation stress(GO:0035900) |
| 0.1 | 0.1 | GO:0019276 | UDP-N-acetylgalactosamine metabolic process(GO:0019276) |
| 0.1 | 0.4 | GO:0015910 | peroxisomal long-chain fatty acid import(GO:0015910) very long-chain fatty acid catabolic process(GO:0042760) |
| 0.1 | 0.1 | GO:2000645 | negative regulation of receptor catabolic process(GO:2000645) |
| 0.1 | 1.3 | GO:0044458 | motile cilium assembly(GO:0044458) |
| 0.1 | 0.5 | GO:0021523 | somatic motor neuron differentiation(GO:0021523) |
| 0.1 | 0.1 | GO:0043163 | cell envelope organization(GO:0043163) external encapsulating structure organization(GO:0045229) |
| 0.1 | 0.5 | GO:0050747 | positive regulation of lipoprotein metabolic process(GO:0050747) |
| 0.1 | 0.1 | GO:0032070 | regulation of deoxyribonuclease activity(GO:0032070) regulation of endodeoxyribonuclease activity(GO:0032071) |
| 0.1 | 1.0 | GO:0097320 | membrane tubulation(GO:0097320) |
| 0.1 | 0.2 | GO:1901894 | regulation of calcium ion binding(GO:1901876) negative regulation of calcium ion binding(GO:1901877) regulation of calcium-transporting ATPase activity(GO:1901894) |
| 0.1 | 0.3 | GO:1903936 | response to sodium arsenite(GO:1903935) cellular response to sodium arsenite(GO:1903936) |
| 0.1 | 0.2 | GO:0015888 | thiamine transport(GO:0015888) thiamine transmembrane transport(GO:0071934) |
| 0.1 | 0.1 | GO:1900227 | positive regulation of NLRP3 inflammasome complex assembly(GO:1900227) |
| 0.1 | 0.7 | GO:0060122 | inner ear receptor stereocilium organization(GO:0060122) |
| 0.1 | 0.7 | GO:0045905 | translational frameshifting(GO:0006452) positive regulation of translational termination(GO:0045905) |
| 0.1 | 0.2 | GO:0060979 | cardiac left ventricle formation(GO:0003218) vasculogenesis involved in coronary vascular morphogenesis(GO:0060979) |
| 0.1 | 0.3 | GO:0005985 | sucrose metabolic process(GO:0005985) sucrose biosynthetic process(GO:0005986) |
| 0.1 | 0.9 | GO:0098903 | regulation of membrane repolarization during action potential(GO:0098903) |
| 0.1 | 0.6 | GO:0051561 | positive regulation of mitochondrial calcium ion concentration(GO:0051561) |
| 0.1 | 0.9 | GO:0035269 | protein O-linked mannosylation(GO:0035269) |
| 0.1 | 0.3 | GO:0048213 | Golgi vesicle prefusion complex stabilization(GO:0048213) |
| 0.1 | 0.6 | GO:0097577 | intracellular sequestering of iron ion(GO:0006880) sequestering of iron ion(GO:0097577) |
| 0.1 | 0.1 | GO:0034427 | nuclear-transcribed mRNA catabolic process, exonucleolytic, 3'-5'(GO:0034427) |
| 0.1 | 0.3 | GO:0007220 | Notch receptor processing(GO:0007220) |
| 0.1 | 0.2 | GO:0019254 | carnitine metabolic process, CoA-linked(GO:0019254) |
| 0.1 | 1.9 | GO:0000185 | activation of MAPKKK activity(GO:0000185) |
| 0.1 | 0.2 | GO:0090306 | spindle assembly involved in female meiosis(GO:0007056) spindle assembly involved in meiosis(GO:0090306) |
| 0.1 | 0.9 | GO:0006578 | amino-acid betaine biosynthetic process(GO:0006578) |
| 0.1 | 0.3 | GO:0060670 | branching involved in labyrinthine layer morphogenesis(GO:0060670) |
| 0.1 | 0.2 | GO:0060528 | secretory columnal luminar epithelial cell differentiation involved in prostate glandular acinus development(GO:0060528) |
| 0.1 | 3.5 | GO:0007190 | activation of adenylate cyclase activity(GO:0007190) |
| 0.1 | 1.1 | GO:0003148 | outflow tract septum morphogenesis(GO:0003148) |
| 0.1 | 0.2 | GO:0030886 | negative regulation of myeloid dendritic cell activation(GO:0030886) |
| 0.1 | 0.9 | GO:0010739 | positive regulation of protein kinase A signaling(GO:0010739) |
| 0.1 | 0.6 | GO:1902416 | positive regulation of mRNA binding(GO:1902416) |
| 0.1 | 0.2 | GO:0007113 | endomitotic cell cycle(GO:0007113) |
| 0.1 | 0.2 | GO:0006420 | arginyl-tRNA aminoacylation(GO:0006420) |
| 0.1 | 0.2 | GO:0010765 | positive regulation of sodium ion transport(GO:0010765) |
| 0.1 | 0.2 | GO:0032097 | positive regulation of response to food(GO:0032097) positive regulation of appetite(GO:0032100) |
| 0.1 | 0.2 | GO:0090204 | protein localization to nuclear pore(GO:0090204) |
| 0.1 | 1.2 | GO:0032780 | negative regulation of ATPase activity(GO:0032780) |
| 0.1 | 0.4 | GO:0045914 | cellular response to phosphate starvation(GO:0016036) positive regulation of sulfur amino acid metabolic process(GO:0031337) negative regulation of catecholamine metabolic process(GO:0045914) negative regulation of dopamine metabolic process(GO:0045963) positive regulation of homocysteine metabolic process(GO:0050668) |
| 0.1 | 0.3 | GO:0060073 | micturition(GO:0060073) |
| 0.1 | 0.3 | GO:0044375 | regulation of peroxisome size(GO:0044375) |
| 0.1 | 0.2 | GO:0042350 | GDP-L-fucose biosynthetic process(GO:0042350) 'de novo' GDP-L-fucose biosynthetic process(GO:0042351) |
| 0.1 | 0.6 | GO:0071569 | protein ufmylation(GO:0071569) |
| 0.1 | 0.5 | GO:0006600 | creatine metabolic process(GO:0006600) |
| 0.1 | 1.3 | GO:0035904 | aorta development(GO:0035904) |
| 0.1 | 0.5 | GO:0002933 | lipid hydroxylation(GO:0002933) |
| 0.1 | 0.2 | GO:0046121 | deoxyribonucleoside catabolic process(GO:0046121) |
| 0.1 | 0.6 | GO:0060042 | retina morphogenesis in camera-type eye(GO:0060042) |
| 0.1 | 0.2 | GO:0019605 | benzoate metabolic process(GO:0018874) butyrate metabolic process(GO:0019605) |
| 0.1 | 0.5 | GO:0051639 | actin filament network formation(GO:0051639) |
| 0.1 | 0.5 | GO:0019060 | intracellular transport of viral protein in host cell(GO:0019060) symbiont intracellular protein transport in host(GO:0030581) intracellular protein transport in other organism involved in symbiotic interaction(GO:0051708) |
| 0.1 | 0.6 | GO:0071386 | cellular response to corticosterone stimulus(GO:0071386) |
| 0.1 | 0.1 | GO:0009822 | alkaloid catabolic process(GO:0009822) |
| 0.1 | 0.1 | GO:1903541 | regulation of exosomal secretion(GO:1903541) |
| 0.1 | 0.5 | GO:0001561 | fatty acid alpha-oxidation(GO:0001561) |
| 0.1 | 5.4 | GO:0048013 | ephrin receptor signaling pathway(GO:0048013) |
| 0.1 | 0.9 | GO:0060117 | auditory receptor cell development(GO:0060117) |
| 0.1 | 0.2 | GO:0007566 | embryo implantation(GO:0007566) |
| 0.1 | 0.2 | GO:0031017 | exocrine pancreas development(GO:0031017) |
| 0.1 | 0.5 | GO:0051791 | medium-chain fatty acid metabolic process(GO:0051791) |
| 0.1 | 0.2 | GO:0016095 | polyprenol catabolic process(GO:0016095) |
| 0.1 | 0.2 | GO:0035634 | response to stilbenoid(GO:0035634) |
| 0.1 | 0.2 | GO:0032079 | positive regulation of endodeoxyribonuclease activity(GO:0032079) |
| 0.1 | 0.1 | GO:0006041 | glucosamine metabolic process(GO:0006041) |
| 0.1 | 0.2 | GO:2000346 | negative regulation of hepatocyte proliferation(GO:2000346) |
| 0.1 | 0.1 | GO:0034694 | response to prostaglandin(GO:0034694) |
| 0.1 | 0.1 | GO:1902908 | regulation of melanosome transport(GO:1902908) |
| 0.1 | 9.8 | GO:0007156 | homophilic cell adhesion via plasma membrane adhesion molecules(GO:0007156) |
| 0.1 | 0.2 | GO:1904781 | positive regulation of protein localization to centrosome(GO:1904781) |
| 0.1 | 0.3 | GO:0022417 | protein maturation by protein folding(GO:0022417) |
| 0.1 | 0.2 | GO:1900112 | regulation of histone H3-K9 trimethylation(GO:1900112) |
| 0.1 | 0.2 | GO:0019287 | isopentenyl diphosphate biosynthetic process, mevalonate pathway(GO:0019287) |
| 0.1 | 0.3 | GO:0043586 | tongue development(GO:0043586) |
| 0.1 | 0.1 | GO:0045880 | positive regulation of smoothened signaling pathway(GO:0045880) |
| 0.1 | 0.3 | GO:0031914 | negative regulation of synaptic plasticity(GO:0031914) |
| 0.1 | 0.1 | GO:0045792 | negative regulation of cell size(GO:0045792) |
| 0.1 | 0.4 | GO:2000074 | regulation of type B pancreatic cell development(GO:2000074) |
| 0.1 | 4.0 | GO:0007044 | cell-substrate junction assembly(GO:0007044) |
| 0.1 | 0.3 | GO:0022030 | cerebral cortex radial glia guided migration(GO:0021801) telencephalon glial cell migration(GO:0022030) |
| 0.1 | 0.2 | GO:0034201 | response to oleic acid(GO:0034201) |
| 0.1 | 0.1 | GO:1901029 | negative regulation of mitochondrial outer membrane permeabilization involved in apoptotic signaling pathway(GO:1901029) |
| 0.1 | 0.6 | GO:0060325 | face morphogenesis(GO:0060325) |
| 0.1 | 0.3 | GO:0006382 | adenosine to inosine editing(GO:0006382) |
| 0.1 | 0.1 | GO:0033159 | negative regulation of protein import into nucleus, translocation(GO:0033159) |
| 0.1 | 0.1 | GO:0042226 | interleukin-6 biosynthetic process(GO:0042226) |
| 0.1 | 0.3 | GO:1904448 | negative regulation of gamma-aminobutyric acid secretion(GO:0014053) aspartate secretion(GO:0061528) regulation of aspartate secretion(GO:1904448) positive regulation of aspartate secretion(GO:1904450) |
| 0.1 | 0.3 | GO:0030916 | otic vesicle formation(GO:0030916) otic vesicle morphogenesis(GO:0071600) |
| 0.1 | 0.8 | GO:0031290 | retinal ganglion cell axon guidance(GO:0031290) |
| 0.1 | 0.1 | GO:0002858 | natural killer cell mediated cytotoxicity directed against tumor cell target(GO:0002420) natural killer cell mediated immune response to tumor cell(GO:0002423) positive regulation of response to tumor cell(GO:0002836) positive regulation of immune response to tumor cell(GO:0002839) regulation of natural killer cell mediated immune response to tumor cell(GO:0002855) positive regulation of natural killer cell mediated immune response to tumor cell(GO:0002857) regulation of natural killer cell mediated cytotoxicity directed against tumor cell target(GO:0002858) positive regulation of natural killer cell mediated cytotoxicity directed against tumor cell target(GO:0002860) |
| 0.1 | 0.4 | GO:0036010 | protein localization to endosome(GO:0036010) |
| 0.1 | 0.7 | GO:1901386 | negative regulation of voltage-gated calcium channel activity(GO:1901386) |
| 0.1 | 0.1 | GO:0045002 | DNA double-strand break processing involved in repair via single-strand annealing(GO:0010792) double-strand break repair via single-strand annealing(GO:0045002) |
| 0.1 | 0.1 | GO:0055075 | potassium ion homeostasis(GO:0055075) |
| 0.1 | 0.4 | GO:2000786 | positive regulation of autophagosome assembly(GO:2000786) |
| 0.1 | 0.5 | GO:1903071 | positive regulation of ER-associated ubiquitin-dependent protein catabolic process(GO:1903071) |
| 0.1 | 0.3 | GO:0071550 | death-inducing signaling complex assembly(GO:0071550) |
| 0.1 | 0.1 | GO:2000049 | positive regulation of cell-cell adhesion mediated by cadherin(GO:2000049) |
| 0.1 | 0.1 | GO:0032455 | nerve growth factor processing(GO:0032455) |
| 0.1 | 0.3 | GO:1904262 | negative regulation of TORC1 signaling(GO:1904262) |
| 0.1 | 1.0 | GO:1904380 | endoplasmic reticulum mannose trimming(GO:1904380) |
| 0.1 | 0.1 | GO:2000253 | positive regulation of feeding behavior(GO:2000253) |
| 0.1 | 0.4 | GO:0007252 | I-kappaB phosphorylation(GO:0007252) |
| 0.1 | 1.3 | GO:0051457 | maintenance of protein location in nucleus(GO:0051457) |
| 0.1 | 1.2 | GO:0032456 | endocytic recycling(GO:0032456) |
| 0.1 | 0.5 | GO:0007266 | Rho protein signal transduction(GO:0007266) |
| 0.1 | 1.4 | GO:0015800 | acidic amino acid transport(GO:0015800) |
| 0.1 | 5.5 | GO:0006892 | post-Golgi vesicle-mediated transport(GO:0006892) |
| 0.1 | 0.1 | GO:0032689 | negative regulation of interferon-gamma production(GO:0032689) |
| 0.1 | 0.4 | GO:2000664 | positive regulation of interleukin-5 secretion(GO:2000664) |
| 0.1 | 0.1 | GO:1901673 | regulation of mitotic spindle assembly(GO:1901673) |
| 0.1 | 0.5 | GO:0055003 | cardiac myofibril assembly(GO:0055003) |
| 0.1 | 0.4 | GO:0006003 | fructose 2,6-bisphosphate metabolic process(GO:0006003) |
| 0.1 | 0.3 | GO:0098502 | DNA dephosphorylation(GO:0098502) |
| 0.1 | 0.1 | GO:0048266 | behavioral response to pain(GO:0048266) |
| 0.1 | 0.5 | GO:0090168 | Golgi reassembly(GO:0090168) |
| 0.1 | 0.1 | GO:0060501 | positive regulation of epithelial cell proliferation involved in lung morphogenesis(GO:0060501) |
| 0.1 | 0.8 | GO:2000052 | positive regulation of non-canonical Wnt signaling pathway(GO:2000052) |
| 0.1 | 0.5 | GO:2001015 | negative regulation of skeletal muscle cell differentiation(GO:2001015) |
| 0.1 | 0.2 | GO:0003190 | atrioventricular valve formation(GO:0003190) |
| 0.1 | 0.4 | GO:0034384 | high-density lipoprotein particle clearance(GO:0034384) |
| 0.1 | 0.4 | GO:0018095 | protein polyglutamylation(GO:0018095) |
| 0.1 | 0.2 | GO:0019934 | cGMP-mediated signaling(GO:0019934) |
| 0.1 | 0.1 | GO:0051182 | coenzyme transport(GO:0051182) |
| 0.1 | 0.2 | GO:0032466 | negative regulation of cytokinesis(GO:0032466) |
| 0.1 | 0.5 | GO:0060039 | pericardium development(GO:0060039) |
| 0.1 | 0.2 | GO:0002457 | T cell antigen processing and presentation(GO:0002457) |
| 0.1 | 0.1 | GO:2000348 | regulation of CD40 signaling pathway(GO:2000348) |
| 0.1 | 0.2 | GO:0031573 | intra-S DNA damage checkpoint(GO:0031573) |
| 0.1 | 0.2 | GO:0090208 | positive regulation of triglyceride metabolic process(GO:0090208) |
| 0.1 | 1.0 | GO:0003351 | epithelial cilium movement(GO:0003351) |
| 0.1 | 0.2 | GO:0090045 | positive regulation of deacetylase activity(GO:0090045) |
| 0.1 | 0.2 | GO:0098935 | dendritic transport(GO:0098935) anterograde dendritic transport(GO:0098937) |
| 0.1 | 0.3 | GO:0006693 | prostanoid metabolic process(GO:0006692) prostaglandin metabolic process(GO:0006693) |
| 0.1 | 0.3 | GO:1901552 | positive regulation of endothelial cell development(GO:1901552) positive regulation of establishment of endothelial barrier(GO:1903142) |
| 0.1 | 0.7 | GO:0001867 | complement activation, lectin pathway(GO:0001867) |
| 0.1 | 0.1 | GO:0045671 | negative regulation of osteoclast differentiation(GO:0045671) |
| 0.1 | 0.3 | GO:0033383 | geranyl diphosphate metabolic process(GO:0033383) geranyl diphosphate biosynthetic process(GO:0033384) farnesyl diphosphate biosynthetic process(GO:0045337) |
| 0.1 | 0.7 | GO:0034332 | adherens junction organization(GO:0034332) |
| 0.1 | 0.7 | GO:0048011 | neurotrophin TRK receptor signaling pathway(GO:0048011) |
| 0.1 | 0.1 | GO:0060297 | regulation of sarcomere organization(GO:0060297) |
| 0.1 | 0.1 | GO:0060168 | positive regulation of adenosine receptor signaling pathway(GO:0060168) |
| 0.1 | 0.2 | GO:0042249 | establishment of planar polarity of embryonic epithelium(GO:0042249) |
| 0.1 | 1.9 | GO:0003009 | skeletal muscle contraction(GO:0003009) |
| 0.1 | 0.1 | GO:0060157 | urinary bladder development(GO:0060157) |
| 0.1 | 0.2 | GO:1904823 | pyrimidine nucleobase transport(GO:0015855) purine nucleobase transmembrane transport(GO:1904823) |
| 0.1 | 0.5 | GO:0042761 | fatty acid elongation(GO:0030497) very long-chain fatty acid biosynthetic process(GO:0042761) |
| 0.1 | 0.1 | GO:0090344 | negative regulation of cell aging(GO:0090344) |
| 0.1 | 0.5 | GO:0034975 | protein folding in endoplasmic reticulum(GO:0034975) |
| 0.1 | 0.4 | GO:0050482 | arachidonic acid secretion(GO:0050482) arachidonate transport(GO:1903963) |
| 0.1 | 0.3 | GO:0051412 | response to corticosterone(GO:0051412) |
| 0.1 | 0.3 | GO:0046548 | retinal rod cell development(GO:0046548) |
| 0.1 | 0.4 | GO:0097428 | protein maturation by iron-sulfur cluster transfer(GO:0097428) |
| 0.1 | 2.4 | GO:0072583 | clathrin-mediated endocytosis(GO:0072583) |
| 0.1 | 0.5 | GO:0046597 | negative regulation of viral entry into host cell(GO:0046597) |
| 0.1 | 0.1 | GO:0060054 | positive regulation of epithelial cell proliferation involved in wound healing(GO:0060054) |
| 0.1 | 0.2 | GO:0035791 | platelet-derived growth factor receptor-beta signaling pathway(GO:0035791) |
| 0.1 | 0.3 | GO:0018022 | peptidyl-lysine methylation(GO:0018022) |
| 0.1 | 0.2 | GO:0044241 | lipid digestion(GO:0044241) |
| 0.1 | 0.1 | GO:2000402 | negative regulation of lymphocyte migration(GO:2000402) |
| 0.1 | 0.3 | GO:0019323 | pentose catabolic process(GO:0019323) |
| 0.1 | 0.1 | GO:0014816 | skeletal muscle satellite cell differentiation(GO:0014816) |
| 0.1 | 1.3 | GO:0048286 | lung alveolus development(GO:0048286) |
| 0.1 | 0.1 | GO:0051604 | protein maturation(GO:0051604) |
| 0.1 | 0.2 | GO:1900025 | negative regulation of substrate adhesion-dependent cell spreading(GO:1900025) |
| 0.1 | 0.3 | GO:0019050 | suppression by virus of host apoptotic process(GO:0019050) modulation by virus of host apoptotic process(GO:0039526) |
| 0.1 | 1.1 | GO:0045747 | positive regulation of Notch signaling pathway(GO:0045747) |
| 0.1 | 0.4 | GO:0035457 | cellular response to interferon-alpha(GO:0035457) |
| 0.1 | 0.2 | GO:0030177 | positive regulation of Wnt signaling pathway(GO:0030177) |
| 0.1 | 0.1 | GO:0071109 | superior temporal gyrus development(GO:0071109) |
| 0.1 | 0.3 | GO:0006689 | ganglioside catabolic process(GO:0006689) |
| 0.1 | 0.2 | GO:2000418 | positive regulation of eosinophil migration(GO:2000418) |
| 0.1 | 0.4 | GO:0009313 | oligosaccharide catabolic process(GO:0009313) |
| 0.1 | 0.1 | GO:0014052 | regulation of gamma-aminobutyric acid secretion(GO:0014052) |
| 0.1 | 0.1 | GO:0060689 | cell differentiation involved in salivary gland development(GO:0060689) |
| 0.1 | 0.1 | GO:0061484 | hematopoietic stem cell homeostasis(GO:0061484) |
| 0.1 | 0.1 | GO:0002467 | germinal center formation(GO:0002467) |
| 0.1 | 0.1 | GO:0035089 | establishment of apical/basal cell polarity(GO:0035089) |
| 0.1 | 0.2 | GO:0009820 | alkaloid metabolic process(GO:0009820) |
| 0.1 | 0.1 | GO:0038162 | erythropoietin-mediated signaling pathway(GO:0038162) |
| 0.1 | 0.3 | GO:0046755 | viral budding(GO:0046755) multi-organism organelle organization(GO:1902590) multi-organism membrane budding(GO:1902592) |
| 0.1 | 0.3 | GO:0051775 | response to redox state(GO:0051775) |
| 0.1 | 0.2 | GO:0042727 | flavin-containing compound biosynthetic process(GO:0042727) |
| 0.1 | 0.2 | GO:0070370 | heat acclimation(GO:0010286) cellular heat acclimation(GO:0070370) |
| 0.1 | 1.2 | GO:0051131 | chaperone-mediated protein complex assembly(GO:0051131) |
| 0.1 | 1.9 | GO:0007041 | lysosomal transport(GO:0007041) |
| 0.1 | 0.1 | GO:0010936 | negative regulation of macrophage cytokine production(GO:0010936) |
| 0.1 | 0.2 | GO:0035915 | pore formation in membrane of other organism(GO:0035915) |
| 0.1 | 0.5 | GO:0006729 | tetrahydrobiopterin biosynthetic process(GO:0006729) tetrahydrobiopterin metabolic process(GO:0046146) |
| 0.1 | 0.2 | GO:0006346 | methylation-dependent chromatin silencing(GO:0006346) |
| 0.1 | 0.2 | GO:0034587 | piRNA metabolic process(GO:0034587) |
| 0.1 | 0.1 | GO:0008544 | epidermis development(GO:0008544) |
| 0.1 | 0.1 | GO:0007500 | mesodermal cell fate determination(GO:0007500) |
| 0.1 | 0.1 | GO:1904885 | beta-catenin destruction complex assembly(GO:1904885) |
| 0.1 | 0.3 | GO:0002692 | negative regulation of cellular extravasation(GO:0002692) |
| 0.1 | 0.4 | GO:2000427 | positive regulation of apoptotic cell clearance(GO:2000427) |
| 0.1 | 0.2 | GO:2001044 | regulation of integrin-mediated signaling pathway(GO:2001044) |
| 0.1 | 0.1 | GO:0010713 | negative regulation of collagen metabolic process(GO:0010713) negative regulation of multicellular organismal metabolic process(GO:0044252) |
| 0.1 | 0.1 | GO:0001732 | formation of cytoplasmic translation initiation complex(GO:0001732) |
| 0.1 | 0.4 | GO:0033561 | regulation of water loss via skin(GO:0033561) establishment of skin barrier(GO:0061436) |
| 0.1 | 0.4 | GO:0006659 | phosphatidylserine biosynthetic process(GO:0006659) |
| 0.1 | 0.2 | GO:0060575 | intestinal epithelial cell differentiation(GO:0060575) |
| 0.1 | 0.9 | GO:0006658 | phosphatidylserine metabolic process(GO:0006658) |
| 0.1 | 0.1 | GO:1904636 | response to ionomycin(GO:1904636) cellular response to ionomycin(GO:1904637) |
| 0.1 | 1.4 | GO:0030049 | muscle filament sliding(GO:0030049) actin-myosin filament sliding(GO:0033275) |
| 0.1 | 0.4 | GO:0016339 | calcium-dependent cell-cell adhesion via plasma membrane cell adhesion molecules(GO:0016339) |
| 0.1 | 0.2 | GO:0090107 | regulation of high-density lipoprotein particle assembly(GO:0090107) |
| 0.1 | 1.6 | GO:0090383 | phagosome acidification(GO:0090383) |
| 0.1 | 0.4 | GO:0007193 | adenylate cyclase-inhibiting G-protein coupled receptor signaling pathway(GO:0007193) |
| 0.0 | 0.3 | GO:0002191 | cap-dependent translational initiation(GO:0002191) |
| 0.0 | 0.0 | GO:0021761 | limbic system development(GO:0021761) |
| 0.0 | 0.3 | GO:0040016 | embryonic cleavage(GO:0040016) |
| 0.0 | 0.5 | GO:0031268 | pseudopodium organization(GO:0031268) |
| 0.0 | 0.3 | GO:0071415 | cellular response to purine-containing compound(GO:0071415) |
| 0.0 | 0.6 | GO:0043981 | histone H4-K5 acetylation(GO:0043981) histone H4-K8 acetylation(GO:0043982) |
| 0.0 | 1.2 | GO:0006654 | phosphatidic acid biosynthetic process(GO:0006654) |
| 0.0 | 0.0 | GO:0097352 | autophagosome maturation(GO:0097352) |
| 0.0 | 0.1 | GO:0000294 | nuclear-transcribed mRNA catabolic process, endonucleolytic cleavage-dependent decay(GO:0000294) |
| 0.0 | 0.4 | GO:0090190 | regulation of branching involved in ureteric bud morphogenesis(GO:0090189) positive regulation of branching involved in ureteric bud morphogenesis(GO:0090190) |
| 0.0 | 0.0 | GO:0046688 | response to copper ion(GO:0046688) |
| 0.0 | 0.1 | GO:0061364 | apoptotic process involved in luteolysis(GO:0061364) |
| 0.0 | 1.6 | GO:0032467 | positive regulation of cytokinesis(GO:0032467) |
| 0.0 | 0.4 | GO:0070527 | platelet aggregation(GO:0070527) |
| 0.0 | 0.4 | GO:0070475 | rRNA base methylation(GO:0070475) |
| 0.0 | 0.1 | GO:0050955 | thermoception(GO:0050955) |
| 0.0 | 0.0 | GO:0048733 | sebaceous gland development(GO:0048733) |
| 0.0 | 0.2 | GO:0060158 | phospholipase C-activating dopamine receptor signaling pathway(GO:0060158) |
| 0.0 | 0.2 | GO:0060272 | embryonic skeletal joint morphogenesis(GO:0060272) embryonic skeletal joint development(GO:0072498) |
| 0.0 | 0.1 | GO:0048749 | compound eye development(GO:0048749) |
| 0.0 | 0.4 | GO:0097039 | protein linear polyubiquitination(GO:0097039) |
| 0.0 | 0.1 | GO:0006044 | N-acetylglucosamine metabolic process(GO:0006044) |
| 0.0 | 0.2 | GO:1902626 | assembly of large subunit precursor of preribosome(GO:1902626) |
| 0.0 | 0.1 | GO:0060265 | positive regulation of respiratory burst involved in inflammatory response(GO:0060265) |
| 0.0 | 1.3 | GO:0048278 | vesicle docking(GO:0048278) |
| 0.0 | 0.5 | GO:0039532 | negative regulation of viral-induced cytoplasmic pattern recognition receptor signaling pathway(GO:0039532) |
| 0.0 | 1.3 | GO:0046323 | glucose import(GO:0046323) |
| 0.0 | 0.1 | GO:0030205 | dermatan sulfate metabolic process(GO:0030205) |
| 0.0 | 0.2 | GO:0006620 | posttranslational protein targeting to membrane(GO:0006620) |
| 0.0 | 0.1 | GO:0070940 | dephosphorylation of RNA polymerase II C-terminal domain(GO:0070940) |
| 0.0 | 0.6 | GO:0033539 | fatty acid beta-oxidation using acyl-CoA dehydrogenase(GO:0033539) |
| 0.0 | 0.1 | GO:0090331 | negative regulation of platelet aggregation(GO:0090331) |
| 0.0 | 0.7 | GO:2000179 | positive regulation of neural precursor cell proliferation(GO:2000179) |
| 0.0 | 0.3 | GO:0017121 | phospholipid scrambling(GO:0017121) |
| 0.0 | 0.6 | GO:0006703 | estrogen biosynthetic process(GO:0006703) |
| 0.0 | 0.1 | GO:0000393 | spliceosomal conformational changes to generate catalytic conformation(GO:0000393) |
| 0.0 | 0.2 | GO:0060065 | uterus development(GO:0060065) |
| 0.0 | 0.0 | GO:1904431 | positive regulation of t-circle formation(GO:1904431) |
| 0.0 | 0.0 | GO:1905098 | negative regulation of guanyl-nucleotide exchange factor activity(GO:1905098) |
| 0.0 | 0.3 | GO:0035024 | negative regulation of Rho protein signal transduction(GO:0035024) |
| 0.0 | 0.1 | GO:0035507 | regulation of myosin-light-chain-phosphatase activity(GO:0035507) |
| 0.0 | 0.3 | GO:0045161 | neuronal ion channel clustering(GO:0045161) |
| 0.0 | 2.1 | GO:0050909 | sensory perception of taste(GO:0050909) |
| 0.0 | 0.2 | GO:2001034 | positive regulation of double-strand break repair via nonhomologous end joining(GO:2001034) |
| 0.0 | 0.5 | GO:0007342 | fusion of sperm to egg plasma membrane(GO:0007342) |
| 0.0 | 0.6 | GO:0008038 | neuron recognition(GO:0008038) |
| 0.0 | 0.2 | GO:0060136 | embryonic process involved in female pregnancy(GO:0060136) |
| 0.0 | 0.0 | GO:1903898 | negative regulation of PERK-mediated unfolded protein response(GO:1903898) |
| 0.0 | 0.3 | GO:0002181 | cytoplasmic translation(GO:0002181) |
| 0.0 | 0.1 | GO:0046958 | nonassociative learning(GO:0046958) |
| 0.0 | 0.4 | GO:0090162 | establishment of epithelial cell polarity(GO:0090162) |
| 0.0 | 0.1 | GO:0045955 | negative regulation of calcium ion-dependent exocytosis(GO:0045955) |
| 0.0 | 0.1 | GO:0043974 | histone H3-K27 acetylation(GO:0043974) regulation of histone H3-K27 acetylation(GO:1901674) |
| 0.0 | 0.1 | GO:0019255 | glucose 1-phosphate metabolic process(GO:0019255) |
| 0.0 | 0.2 | GO:0007369 | gastrulation(GO:0007369) |
| 0.0 | 0.2 | GO:0001705 | ectoderm formation(GO:0001705) ectodermal cell fate commitment(GO:0001712) |
| 0.0 | 0.2 | GO:0033353 | S-adenosylmethionine cycle(GO:0033353) |
| 0.0 | 0.6 | GO:0007263 | nitric oxide mediated signal transduction(GO:0007263) |
| 0.0 | 0.1 | GO:0070212 | protein poly-ADP-ribosylation(GO:0070212) |
| 0.0 | 0.0 | GO:0031063 | regulation of histone deacetylation(GO:0031063) regulation of protein deacetylation(GO:0090311) |
| 0.0 | 0.3 | GO:0030866 | cortical cytoskeleton organization(GO:0030865) cortical actin cytoskeleton organization(GO:0030866) |
| 0.0 | 0.3 | GO:0019509 | L-methionine biosynthetic process from methylthioadenosine(GO:0019509) |
| 0.0 | 0.1 | GO:0060332 | positive regulation of response to interferon-gamma(GO:0060332) positive regulation of interferon-gamma-mediated signaling pathway(GO:0060335) |
| 0.0 | 0.2 | GO:0001692 | histamine metabolic process(GO:0001692) |
| 0.0 | 0.1 | GO:0006432 | phenylalanyl-tRNA aminoacylation(GO:0006432) |
| 0.0 | 0.3 | GO:0002011 | morphogenesis of an epithelial sheet(GO:0002011) |
| 0.0 | 0.1 | GO:0031998 | regulation of fatty acid beta-oxidation(GO:0031998) |
| 0.0 | 0.9 | GO:0009235 | cobalamin metabolic process(GO:0009235) |
| 0.0 | 0.3 | GO:0006451 | selenocysteine incorporation(GO:0001514) translational readthrough(GO:0006451) |
| 0.0 | 0.1 | GO:1900027 | regulation of ruffle assembly(GO:1900027) |
| 0.0 | 0.4 | GO:0022617 | extracellular matrix disassembly(GO:0022617) |
| 0.0 | 0.1 | GO:0090312 | positive regulation of protein deacetylation(GO:0090312) |
| 0.0 | 0.9 | GO:0030032 | lamellipodium assembly(GO:0030032) |
| 0.0 | 0.2 | GO:2000291 | myoblast proliferation(GO:0051450) regulation of myoblast proliferation(GO:2000291) |
| 0.0 | 0.4 | GO:0006704 | glucocorticoid biosynthetic process(GO:0006704) |
| 0.0 | 0.8 | GO:0097120 | receptor localization to synapse(GO:0097120) |
| 0.0 | 0.1 | GO:0010193 | response to ozone(GO:0010193) |
| 0.0 | 0.3 | GO:0052695 | cellular glucuronidation(GO:0052695) |
| 0.0 | 1.9 | GO:0006939 | smooth muscle contraction(GO:0006939) |
| 0.0 | 0.2 | GO:0032119 | sequestering of zinc ion(GO:0032119) |
| 0.0 | 0.1 | GO:0090073 | positive regulation of protein homodimerization activity(GO:0090073) |
| 0.0 | 0.1 | GO:0002778 | antimicrobial peptide production(GO:0002775) antibacterial peptide production(GO:0002778) |
| 0.0 | 0.1 | GO:0060907 | positive regulation of macrophage cytokine production(GO:0060907) |
| 0.0 | 1.3 | GO:0000188 | inactivation of MAPK activity(GO:0000188) |
| 0.0 | 0.2 | GO:0015840 | urea transport(GO:0015840) |
| 0.0 | 0.2 | GO:0070682 | proteasome regulatory particle assembly(GO:0070682) |
| 0.0 | 0.1 | GO:2000398 | regulation of T cell differentiation in thymus(GO:0033081) regulation of thymocyte aggregation(GO:2000398) |
| 0.0 | 0.3 | GO:0045023 | G0 to G1 transition(GO:0045023) |
| 0.0 | 0.0 | GO:1900225 | regulation of NLRP3 inflammasome complex assembly(GO:1900225) |
| 0.0 | 0.0 | GO:2000364 | regulation of STAT protein import into nucleus(GO:2000364) positive regulation of STAT protein import into nucleus(GO:2000366) |
| 0.0 | 0.1 | GO:0019249 | lactate biosynthetic process(GO:0019249) |
| 0.0 | 0.1 | GO:1902630 | regulation of membrane hyperpolarization(GO:1902630) |
| 0.0 | 0.1 | GO:0035672 | oligopeptide transport(GO:0006857) oligopeptide transmembrane transport(GO:0035672) |
| 0.0 | 0.1 | GO:0018008 | N-terminal peptidyl-glycine N-myristoylation(GO:0018008) peptidyl-glycine modification(GO:0018201) |
| 0.0 | 0.1 | GO:1903011 | negative regulation of bone development(GO:1903011) |
| 0.0 | 0.1 | GO:0007549 | dosage compensation(GO:0007549) dosage compensation by inactivation of X chromosome(GO:0009048) |
| 0.0 | 0.2 | GO:0072733 | response to staurosporine(GO:0072733) cellular response to staurosporine(GO:0072734) |
| 0.0 | 0.1 | GO:0030511 | positive regulation of transforming growth factor beta receptor signaling pathway(GO:0030511) positive regulation of cellular response to transforming growth factor beta stimulus(GO:1903846) |
| 0.0 | 0.1 | GO:0043988 | histone H3-S28 phosphorylation(GO:0043988) |
| 0.0 | 0.2 | GO:0008589 | regulation of smoothened signaling pathway(GO:0008589) |
| 0.0 | 0.1 | GO:0048850 | hypophysis morphogenesis(GO:0048850) diencephalon morphogenesis(GO:0048852) |
| 0.0 | 0.0 | GO:0050720 | interleukin-1 beta biosynthetic process(GO:0050720) |
| 0.0 | 0.0 | GO:0006002 | fructose 6-phosphate metabolic process(GO:0006002) |
| 0.0 | 0.9 | GO:0001837 | epithelial to mesenchymal transition(GO:0001837) |
| 0.0 | 0.1 | GO:0070374 | positive regulation of ERK1 and ERK2 cascade(GO:0070374) |
| 0.0 | 0.2 | GO:0016242 | negative regulation of macroautophagy(GO:0016242) |
| 0.0 | 0.1 | GO:0001951 | intestinal D-glucose absorption(GO:0001951) |
| 0.0 | 0.1 | GO:0046968 | peptide antigen transport(GO:0046968) |
| 0.0 | 0.2 | GO:0033234 | negative regulation of protein sumoylation(GO:0033234) |
| 0.0 | 0.3 | GO:0035036 | binding of sperm to zona pellucida(GO:0007339) sperm-egg recognition(GO:0035036) |
| 0.0 | 0.5 | GO:0060795 | cell fate commitment involved in formation of primary germ layer(GO:0060795) |
| 0.0 | 0.2 | GO:0017183 | peptidyl-diphthamide metabolic process(GO:0017182) peptidyl-diphthamide biosynthetic process from peptidyl-histidine(GO:0017183) |
| 0.0 | 0.3 | GO:0097201 | negative regulation of transcription from RNA polymerase II promoter in response to stress(GO:0097201) |
| 0.0 | 0.1 | GO:0030186 | melatonin metabolic process(GO:0030186) melatonin biosynthetic process(GO:0030187) |
| 0.0 | 0.4 | GO:0045214 | sarcomere organization(GO:0045214) |
| 0.0 | 0.1 | GO:1901655 | cellular response to ketone(GO:1901655) |
| 0.0 | 0.6 | GO:0071624 | positive regulation of granulocyte chemotaxis(GO:0071624) |
| 0.0 | 0.2 | GO:1902268 | negative regulation of polyamine transmembrane transport(GO:1902268) |
| 0.0 | 0.2 | GO:0032026 | response to magnesium ion(GO:0032026) |
| 0.0 | 0.2 | GO:0010499 | proteasomal ubiquitin-independent protein catabolic process(GO:0010499) |
| 0.0 | 0.6 | GO:0030166 | proteoglycan biosynthetic process(GO:0030166) |
| 0.0 | 0.1 | GO:0097167 | circadian regulation of translation(GO:0097167) |
| 0.0 | 0.1 | GO:0008628 | hormone-mediated apoptotic signaling pathway(GO:0008628) |
| 0.0 | 0.3 | GO:0007171 | activation of transmembrane receptor protein tyrosine kinase activity(GO:0007171) |
| 0.0 | 0.1 | GO:0006953 | acute-phase response(GO:0006953) |
| 0.0 | 0.1 | GO:0048485 | sympathetic nervous system development(GO:0048485) |
| 0.0 | 0.2 | GO:0014067 | negative regulation of phosphatidylinositol 3-kinase signaling(GO:0014067) |
| 0.0 | 0.4 | GO:0030728 | ovulation(GO:0030728) |
| 0.0 | 0.3 | GO:0033628 | regulation of cell adhesion mediated by integrin(GO:0033628) |
| 0.0 | 0.4 | GO:0006828 | manganese ion transport(GO:0006828) |
| 0.0 | 0.3 | GO:0002230 | positive regulation of defense response to virus by host(GO:0002230) |
| 0.0 | 0.2 | GO:0045662 | negative regulation of myoblast differentiation(GO:0045662) |
| 0.0 | 0.1 | GO:0045897 | positive regulation of transcription during mitosis(GO:0045897) |
| 0.0 | 0.1 | GO:2000352 | negative regulation of endothelial cell apoptotic process(GO:2000352) |
| 0.0 | 0.3 | GO:0045793 | positive regulation of cell size(GO:0045793) |
| 0.0 | 0.1 | GO:0060022 | hard palate development(GO:0060022) |
| 0.0 | 0.0 | GO:0060392 | negative regulation of SMAD protein import into nucleus(GO:0060392) |
| 0.0 | 0.6 | GO:0060113 | inner ear receptor cell differentiation(GO:0060113) |
| 0.0 | 0.1 | GO:0045657 | positive regulation of monocyte differentiation(GO:0045657) |
| 0.0 | 0.0 | GO:0097091 | synaptic vesicle clustering(GO:0097091) |
| 0.0 | 0.1 | GO:0021631 | optic nerve morphogenesis(GO:0021631) optic nerve structural organization(GO:0021633) |
| 0.0 | 0.0 | GO:0045945 | positive regulation of transcription from RNA polymerase III promoter(GO:0045945) |
| 0.0 | 0.2 | GO:0015693 | magnesium ion transport(GO:0015693) |
| 0.0 | 0.2 | GO:0036066 | protein O-linked fucosylation(GO:0036066) |
| 0.0 | 0.1 | GO:0010960 | magnesium ion homeostasis(GO:0010960) |
| 0.0 | 0.1 | GO:0019401 | glycerol biosynthetic process(GO:0006114) alditol biosynthetic process(GO:0019401) |
| 0.0 | 0.2 | GO:0035358 | regulation of peroxisome proliferator activated receptor signaling pathway(GO:0035358) |
| 0.0 | 0.0 | GO:0007548 | sex differentiation(GO:0007548) |
| 0.0 | 0.1 | GO:0007185 | transmembrane receptor protein tyrosine phosphatase signaling pathway(GO:0007185) |
| 0.0 | 0.1 | GO:0023021 | termination of signal transduction(GO:0023021) |
| 0.0 | 0.1 | GO:0033140 | negative regulation of peptidyl-serine phosphorylation of STAT protein(GO:0033140) |
| 0.0 | 0.2 | GO:0090527 | actin filament reorganization(GO:0090527) |
| 0.0 | 0.1 | GO:0000965 | mitochondrial RNA 3'-end processing(GO:0000965) |
| 0.0 | 0.2 | GO:0030539 | male genitalia development(GO:0030539) |
| 0.0 | 0.1 | GO:0016486 | peptide hormone processing(GO:0016486) |
| 0.0 | 0.0 | GO:0060266 | respiratory burst involved in inflammatory response(GO:0002536) regulation of respiratory burst involved in inflammatory response(GO:0060264) negative regulation of respiratory burst involved in inflammatory response(GO:0060266) negative regulation of respiratory burst(GO:0060268) |
| 0.0 | 0.1 | GO:0070966 | nuclear-transcribed mRNA catabolic process, no-go decay(GO:0070966) |
| 0.0 | 0.2 | GO:0010452 | histone H3-K36 methylation(GO:0010452) |
| 0.0 | 0.0 | GO:0010663 | positive regulation of striated muscle cell apoptotic process(GO:0010663) positive regulation of cardiac muscle cell apoptotic process(GO:0010666) |
| 0.0 | 0.1 | GO:0090042 | tubulin deacetylation(GO:0090042) |
| 0.0 | 0.2 | GO:0060011 | Sertoli cell proliferation(GO:0060011) |
| 0.0 | 1.9 | GO:0048207 | vesicle targeting, rough ER to cis-Golgi(GO:0048207) COPII vesicle coating(GO:0048208) |
| 0.0 | 0.3 | GO:0033687 | osteoblast proliferation(GO:0033687) |
| 0.0 | 0.1 | GO:0070102 | interleukin-6-mediated signaling pathway(GO:0070102) |
| 0.0 | 0.3 | GO:0032463 | negative regulation of protein homooligomerization(GO:0032463) |
| 0.0 | 0.2 | GO:1902031 | regulation of NADP metabolic process(GO:1902031) |
| 0.0 | 0.1 | GO:1901186 | positive regulation of ERBB signaling pathway(GO:1901186) |
| 0.0 | 0.2 | GO:0006531 | aspartate metabolic process(GO:0006531) |
| 0.0 | 0.9 | GO:0002062 | chondrocyte differentiation(GO:0002062) |
| 0.0 | 0.1 | GO:0018126 | protein hydroxylation(GO:0018126) |
| 0.0 | 0.3 | GO:0051642 | centrosome localization(GO:0051642) |
| 0.0 | 0.1 | GO:0070634 | transepithelial ammonium transport(GO:0070634) |
| 0.0 | 0.1 | GO:0009712 | catecholamine metabolic process(GO:0006584) catechol-containing compound metabolic process(GO:0009712) |
| 0.0 | 0.1 | GO:0045903 | positive regulation of translational fidelity(GO:0045903) |
| 0.0 | 0.1 | GO:0021563 | glossopharyngeal nerve development(GO:0021563) |
| 0.0 | 0.3 | GO:0031163 | iron-sulfur cluster assembly(GO:0016226) metallo-sulfur cluster assembly(GO:0031163) |
| 0.0 | 0.1 | GO:0051503 | ADP transport(GO:0015866) ATP transport(GO:0015867) adenine nucleotide transport(GO:0051503) |
| 0.0 | 0.0 | GO:0010642 | negative regulation of platelet-derived growth factor receptor signaling pathway(GO:0010642) |
| 0.0 | 0.0 | GO:0070365 | hepatocyte differentiation(GO:0070365) |
| 0.0 | 0.0 | GO:0051045 | negative regulation of membrane protein ectodomain proteolysis(GO:0051045) |
| 0.0 | 0.1 | GO:0060700 | regulation of ribonuclease activity(GO:0060700) |
| 0.0 | 0.0 | GO:0071873 | response to norepinephrine(GO:0071873) cellular response to norepinephrine stimulus(GO:0071874) |
| 0.0 | 0.0 | GO:1902573 | positive regulation of serine-type endopeptidase activity(GO:1900005) positive regulation of serine-type peptidase activity(GO:1902573) |
| 0.0 | 0.1 | GO:0032218 | riboflavin transport(GO:0032218) |
| 0.0 | 0.1 | GO:0034058 | endosomal vesicle fusion(GO:0034058) |
| 0.0 | 0.0 | GO:0015827 | tryptophan transport(GO:0015827) |
| 0.0 | 0.0 | GO:1903054 | negative regulation of extracellular matrix organization(GO:1903054) |
| 0.0 | 0.0 | GO:1904882 | telomerase catalytic core complex assembly(GO:1904868) regulation of telomerase catalytic core complex assembly(GO:1904882) positive regulation of telomerase catalytic core complex assembly(GO:1904884) |
| 0.0 | 0.0 | GO:0045932 | negative regulation of muscle contraction(GO:0045932) |
| 0.0 | 0.0 | GO:1902527 | positive regulation of protein monoubiquitination(GO:1902527) |
| 0.0 | 0.0 | GO:0072672 | neutrophil extravasation(GO:0072672) |
| 0.0 | 0.1 | GO:1990504 | dense core granule exocytosis(GO:1990504) |
| 0.0 | 0.0 | GO:0010760 | negative regulation of macrophage chemotaxis(GO:0010760) |
| 0.0 | 0.0 | GO:1904752 | vascular associated smooth muscle cell migration(GO:1904738) regulation of vascular associated smooth muscle cell migration(GO:1904752) |
| 0.0 | 0.1 | GO:0035646 | endosome to melanosome transport(GO:0035646) pigment accumulation(GO:0043476) cellular pigment accumulation(GO:0043482) endosome to pigment granule transport(GO:0043485) pigment granule maturation(GO:0048757) |
| 0.0 | 0.1 | GO:0008090 | retrograde axonal transport(GO:0008090) |
| 0.0 | 0.0 | GO:2000504 | positive regulation of blood vessel remodeling(GO:2000504) |
| 0.0 | 1.0 | GO:0036092 | phosphatidylinositol-3-phosphate biosynthetic process(GO:0036092) |
| 0.0 | 0.7 | GO:0005978 | glycogen biosynthetic process(GO:0005978) glucan biosynthetic process(GO:0009250) |
| 0.0 | 0.1 | GO:0060155 | platelet dense granule organization(GO:0060155) |
| 0.0 | 0.0 | GO:0016103 | diterpenoid catabolic process(GO:0016103) retinoic acid catabolic process(GO:0034653) |
| 0.0 | 0.1 | GO:0045590 | negative regulation of regulatory T cell differentiation(GO:0045590) |
| 0.0 | 0.1 | GO:1901314 | negative regulation of histone ubiquitination(GO:0033183) negative regulation of protein K63-linked ubiquitination(GO:1900045) regulation of histone H2A K63-linked ubiquitination(GO:1901314) negative regulation of histone H2A K63-linked ubiquitination(GO:1901315) negative regulation of protein polyubiquitination(GO:1902915) |
| 0.0 | 0.5 | GO:0030835 | negative regulation of actin filament depolymerization(GO:0030835) |
| 0.0 | 0.2 | GO:0097503 | sialylation(GO:0097503) |
| 0.0 | 0.0 | GO:0036369 | transcription factor catabolic process(GO:0036369) |
| 0.0 | 0.1 | GO:0042921 | glucocorticoid receptor signaling pathway(GO:0042921) |
| 0.0 | 0.1 | GO:0046710 | GDP metabolic process(GO:0046710) |
| 0.0 | 0.0 | GO:0061141 | lung ciliated cell differentiation(GO:0061141) pancreatic stellate cell proliferation(GO:0072343) regulation of pancreatic stellate cell proliferation(GO:2000229) |
| 0.0 | 0.0 | GO:0033341 | regulation of collagen binding(GO:0033341) |
| 0.0 | 0.1 | GO:0048069 | eye pigmentation(GO:0048069) |
| 0.0 | 1.1 | GO:0000381 | regulation of alternative mRNA splicing, via spliceosome(GO:0000381) |
| 0.0 | 0.0 | GO:0036093 | male germ cell proliferation(GO:0002176) germ cell proliferation(GO:0036093) |
| 0.0 | 0.0 | GO:0045448 | regulation of mitotic cell cycle, embryonic(GO:0009794) mitotic cell cycle, embryonic(GO:0045448) |
| 0.0 | 0.0 | GO:1990637 | response to prolactin(GO:1990637) |
| 0.0 | 0.2 | GO:0009584 | detection of visible light(GO:0009584) |
| 0.0 | 0.5 | GO:0071470 | cellular response to osmotic stress(GO:0071470) |
| 0.0 | 0.1 | GO:0006509 | membrane protein ectodomain proteolysis(GO:0006509) |
| 0.0 | 0.1 | GO:0007168 | receptor guanylyl cyclase signaling pathway(GO:0007168) |
| 0.0 | 0.1 | GO:0002818 | intracellular defense response(GO:0002818) |
| 0.0 | 0.0 | GO:2000048 | negative regulation of cell-cell adhesion mediated by cadherin(GO:2000048) |
| 0.0 | 0.1 | GO:0051725 | protein de-ADP-ribosylation(GO:0051725) |
| 0.0 | 0.1 | GO:0001946 | lymphangiogenesis(GO:0001946) |
| 0.0 | 0.3 | GO:0006957 | complement activation, alternative pathway(GO:0006957) |
| 0.0 | 0.3 | GO:0002076 | osteoblast development(GO:0002076) |
| 0.0 | 0.1 | GO:0072334 | UDP-galactose transport(GO:0015785) UDP-galactose transmembrane transport(GO:0072334) |
| 0.0 | 0.1 | GO:2000672 | negative regulation of motor neuron apoptotic process(GO:2000672) |
| 0.0 | 0.1 | GO:0090141 | positive regulation of mitochondrial fission(GO:0090141) |
| 0.0 | 0.1 | GO:0007202 | activation of phospholipase C activity(GO:0007202) |
| 0.0 | 0.1 | GO:0048293 | isotype switching to IgE isotypes(GO:0048289) regulation of isotype switching to IgE isotypes(GO:0048293) |
| 0.0 | 0.0 | GO:0033484 | nitric oxide homeostasis(GO:0033484) |
| 0.0 | 0.0 | GO:0048711 | positive regulation of astrocyte differentiation(GO:0048711) |
| 0.0 | 0.1 | GO:0031643 | positive regulation of myelination(GO:0031643) |
| 0.0 | 0.2 | GO:0072164 | ureteric bud development(GO:0001657) mesonephros development(GO:0001823) mesonephric epithelium development(GO:0072163) mesonephric tubule development(GO:0072164) |
| 0.0 | 0.1 | GO:1903361 | protein localization to basolateral plasma membrane(GO:1903361) |
| 0.0 | 0.0 | GO:0046294 | formaldehyde catabolic process(GO:0046294) |
| 0.0 | 0.1 | GO:0006685 | sphingomyelin catabolic process(GO:0006685) |
| 0.0 | 0.0 | GO:0050428 | purine ribonucleoside bisphosphate biosynthetic process(GO:0034036) 3'-phosphoadenosine 5'-phosphosulfate biosynthetic process(GO:0050428) |
| 0.0 | 0.1 | GO:0045821 | positive regulation of nucleotide catabolic process(GO:0030813) positive regulation of glycolytic process(GO:0045821) positive regulation of cofactor metabolic process(GO:0051194) positive regulation of coenzyme metabolic process(GO:0051197) |
| 0.0 | 0.0 | GO:0097210 | response to gonadotropin-releasing hormone(GO:0097210) cellular response to gonadotropin-releasing hormone(GO:0097211) |
| 0.0 | 0.1 | GO:0090004 | positive regulation of establishment of protein localization to plasma membrane(GO:0090004) |
| 0.0 | 0.0 | GO:0043653 | mitochondrial fragmentation involved in apoptotic process(GO:0043653) |
| 0.0 | 0.1 | GO:0038018 | Wnt receptor catabolic process(GO:0038018) |
| 0.0 | 0.0 | GO:0035414 | negative regulation of catenin import into nucleus(GO:0035414) |
| 0.0 | 0.1 | GO:0042771 | intrinsic apoptotic signaling pathway in response to DNA damage by p53 class mediator(GO:0042771) |
| 0.0 | 0.0 | GO:0045836 | positive regulation of meiotic nuclear division(GO:0045836) |
| 0.0 | 0.1 | GO:0090129 | positive regulation of synapse maturation(GO:0090129) |
| 0.0 | 0.0 | GO:0061635 | regulation of protein complex stability(GO:0061635) |
| 0.0 | 0.2 | GO:0035418 | protein localization to synapse(GO:0035418) |
| 0.0 | 0.1 | GO:0021691 | cerebellar Purkinje cell layer maturation(GO:0021691) |
| 0.0 | 0.1 | GO:0032489 | regulation of Cdc42 protein signal transduction(GO:0032489) |
| 0.0 | 0.1 | GO:0051216 | cartilage development(GO:0051216) |
| 0.0 | 0.1 | GO:0007598 | blood coagulation, extrinsic pathway(GO:0007598) |
| 0.0 | 0.0 | GO:0090074 | negative regulation of protein homodimerization activity(GO:0090074) |
| 0.0 | 0.0 | GO:0071280 | cellular response to copper ion(GO:0071280) response to heparin(GO:0071503) cellular response to heparin(GO:0071504) |
| 0.0 | 0.2 | GO:0045899 | positive regulation of RNA polymerase II transcriptional preinitiation complex assembly(GO:0045899) |
| 0.0 | 0.1 | GO:0009256 | 10-formyltetrahydrofolate metabolic process(GO:0009256) |
| 0.0 | 0.0 | GO:0046122 | purine deoxyribonucleoside metabolic process(GO:0046122) |
| 0.0 | 0.0 | GO:0060351 | cartilage development involved in endochondral bone morphogenesis(GO:0060351) |
| 0.0 | 0.0 | GO:0015838 | amino-acid betaine transport(GO:0015838) |
| 0.0 | 0.1 | GO:0046185 | aldehyde catabolic process(GO:0046185) |
| 0.0 | 0.0 | GO:0007223 | Wnt signaling pathway, calcium modulating pathway(GO:0007223) |
| 0.0 | 0.1 | GO:0050680 | negative regulation of epithelial cell proliferation(GO:0050680) |
| 0.0 | 0.1 | GO:0045338 | farnesyl diphosphate metabolic process(GO:0045338) |
| 0.0 | 0.0 | GO:1903800 | positive regulation of production of miRNAs involved in gene silencing by miRNA(GO:1903800) |
| 0.0 | 0.2 | GO:0061045 | negative regulation of wound healing(GO:0061045) |
| 0.0 | 0.5 | GO:0006493 | protein O-linked glycosylation(GO:0006493) |
| 0.0 | 0.0 | GO:0090155 | negative regulation of sphingolipid biosynthetic process(GO:0090155) negative regulation of ceramide biosynthetic process(GO:1900060) |
| 0.0 | 0.0 | GO:0033684 | regulation of luteinizing hormone secretion(GO:0033684) |
| 0.0 | 0.1 | GO:0070286 | axonemal dynein complex assembly(GO:0070286) |
| 0.0 | 0.1 | GO:0032007 | negative regulation of TOR signaling(GO:0032007) |
| 0.0 | 0.0 | GO:0071838 | cell proliferation in bone marrow(GO:0071838) |
| 0.0 | 0.0 | GO:0045654 | positive regulation of megakaryocyte differentiation(GO:0045654) positive regulation of hematopoietic progenitor cell differentiation(GO:1901534) |
| 0.0 | 0.1 | GO:0061049 | physiological muscle hypertrophy(GO:0003298) physiological cardiac muscle hypertrophy(GO:0003301) cell growth involved in cardiac muscle cell development(GO:0061049) |
| 0.0 | 0.0 | GO:0045212 | negative regulation of synaptic transmission, cholinergic(GO:0032223) neurotransmitter receptor biosynthetic process(GO:0045212) |
| 0.0 | 1.3 | GO:0006936 | muscle contraction(GO:0006936) |
| 0.0 | 0.0 | GO:0045629 | negative regulation of T-helper 2 cell differentiation(GO:0045629) |
| 0.0 | 0.1 | GO:0046697 | decidualization(GO:0046697) |
| 0.0 | 0.2 | GO:0030282 | bone mineralization(GO:0030282) |
| 0.0 | 0.1 | GO:0000338 | protein deneddylation(GO:0000338) |
| 0.0 | 0.1 | GO:0045599 | negative regulation of fat cell differentiation(GO:0045599) |
| 0.0 | 0.1 | GO:0044245 | polysaccharide digestion(GO:0044245) |
| 0.0 | 0.3 | GO:0046847 | filopodium assembly(GO:0046847) |
| 0.0 | 0.0 | GO:0061744 | psychomotor behavior(GO:0036343) motor behavior(GO:0061744) |
| 0.0 | 0.1 | GO:0018214 | peptidyl-glutamic acid carboxylation(GO:0017187) protein carboxylation(GO:0018214) |
| 0.0 | 0.0 | GO:1903350 | response to dopamine(GO:1903350) cellular response to dopamine(GO:1903351) |
| 0.0 | 0.0 | GO:0001172 | transcription, RNA-templated(GO:0001172) |
| 0.0 | 0.0 | GO:0006624 | vacuolar protein processing(GO:0006624) |