Project
ENCODE cell lines, expression (Ernst 2011)
Navigation
Downloads
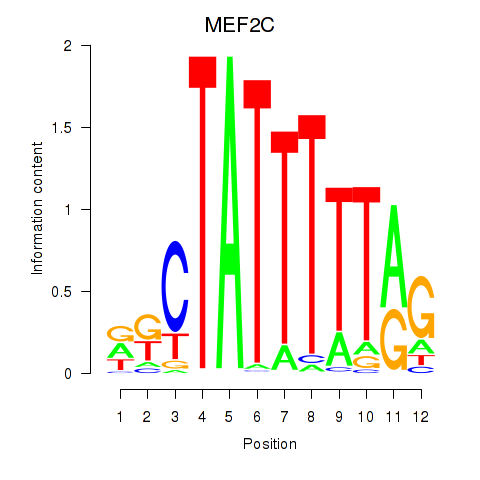
Results for MEF2C
Z-value: 1.96
Motif logo
Transcription factors associated with MEF2C
| Gene Symbol | Gene ID | Gene Info |
|---|---|---|
|
MEF2C
|
ENSG00000081189.9 | MEF2C |
Activity-expression correlation:
| Gene | Promoter | Pearson corr. coef. | P-value | Plot |
|---|---|---|---|---|
| MEF2C | hg19_v2_chr5_-_88119580_88119605 | 0.15 | 5.7e-01 | Click! |
Activity profile of MEF2C motif
Sorted Z-values of MEF2C motif
Network of associatons between targets according to the STRING database.

First level regulatory network of MEF2C
| Promoter | Score | Transcript | Gene | Gene Info |
|---|---|---|---|---|
| chr4_-_143226979 | 15.36 |
ENST00000514525.1 |
INPP4B |
inositol polyphosphate-4-phosphatase, type II, 105kDa |
| chr4_-_143227088 | 11.00 |
ENST00000511838.1 |
INPP4B |
inositol polyphosphate-4-phosphatase, type II, 105kDa |
| chr4_+_169418195 | 9.44 |
ENST00000261509.6 ENST00000335742.7 |
PALLD |
palladin, cytoskeletal associated protein |
| chr1_-_201391149 | 9.14 |
ENST00000555948.1 ENST00000556362.1 |
TNNI1 |
troponin I type 1 (skeletal, slow) |
| chr4_+_169418255 | 6.97 |
ENST00000505667.1 ENST00000511948.1 |
PALLD |
palladin, cytoskeletal associated protein |
| chr2_-_151344172 | 6.95 |
ENST00000375734.2 ENST00000263895.4 ENST00000454202.1 |
RND3 |
Rho family GTPase 3 |
| chr8_-_49834299 | 6.52 |
ENST00000396822.1 |
SNAI2 |
snail family zinc finger 2 |
| chr3_+_8543393 | 6.32 |
ENST00000157600.3 ENST00000415597.1 ENST00000535732.1 |
LMCD1 |
LIM and cysteine-rich domains 1 |
| chr8_-_49833978 | 6.13 |
ENST00000020945.1 |
SNAI2 |
snail family zinc finger 2 |
| chr10_-_75410771 | 6.11 |
ENST00000372873.4 |
SYNPO2L |
synaptopodin 2-like |
| chr3_+_8543561 | 6.08 |
ENST00000397386.3 |
LMCD1 |
LIM and cysteine-rich domains 1 |
| chr4_-_143767428 | 5.98 |
ENST00000513000.1 ENST00000509777.1 ENST00000503927.1 |
INPP4B |
inositol polyphosphate-4-phosphatase, type II, 105kDa |
| chr10_-_75415825 | 5.65 |
ENST00000394810.2 |
SYNPO2L |
synaptopodin 2-like |
| chr3_+_138067521 | 5.63 |
ENST00000494949.1 |
MRAS |
muscle RAS oncogene homolog |
| chr2_-_211168332 | 5.32 |
ENST00000341685.4 |
MYL1 |
myosin, light chain 1, alkali; skeletal, fast |
| chr3_+_135741576 | 5.11 |
ENST00000334546.2 |
PPP2R3A |
protein phosphatase 2, regulatory subunit B'', alpha |
| chr2_+_170366203 | 5.06 |
ENST00000284669.1 |
KLHL41 |
kelch-like family member 41 |
| chr3_+_8543533 | 4.94 |
ENST00000454244.1 |
LMCD1 |
LIM and cysteine-rich domains 1 |
| chr3_-_52486841 | 4.83 |
ENST00000496590.1 |
TNNC1 |
troponin C type 1 (slow) |
| chrX_+_135278908 | 4.67 |
ENST00000539015.1 ENST00000370683.1 |
FHL1 |
four and a half LIM domains 1 |
| chr5_+_53751445 | 4.48 |
ENST00000302005.1 |
HSPB3 |
heat shock 27kDa protein 3 |
| chr1_-_201390846 | 4.45 |
ENST00000367312.1 ENST00000555340.2 ENST00000361379.4 |
TNNI1 |
troponin I type 1 (skeletal, slow) |
| chr1_-_116311402 | 4.42 |
ENST00000261448.5 |
CASQ2 |
calsequestrin 2 (cardiac muscle) |
| chrX_+_135279179 | 4.34 |
ENST00000370676.3 |
FHL1 |
four and a half LIM domains 1 |
| chr5_-_111091948 | 3.90 |
ENST00000447165.2 |
NREP |
neuronal regeneration related protein |
| chr3_+_159570722 | 3.83 |
ENST00000482804.1 |
SCHIP1 |
schwannomin interacting protein 1 |
| chr3_+_138067314 | 3.67 |
ENST00000423968.2 |
MRAS |
muscle RAS oncogene homolog |
| chr13_+_76334567 | 3.60 |
ENST00000321797.8 |
LMO7 |
LIM domain 7 |
| chr3_+_138067666 | 3.60 |
ENST00000475711.1 ENST00000464896.1 |
MRAS |
muscle RAS oncogene homolog |
| chr2_-_190044480 | 3.50 |
ENST00000374866.3 |
COL5A2 |
collagen, type V, alpha 2 |
| chr6_-_169654139 | 3.28 |
ENST00000366787.3 |
THBS2 |
thrombospondin 2 |
| chr11_+_12766583 | 3.18 |
ENST00000361985.2 |
TEAD1 |
TEA domain family member 1 (SV40 transcriptional enhancer factor) |
| chr4_-_186697044 | 3.11 |
ENST00000437304.2 |
SORBS2 |
sorbin and SH3 domain containing 2 |
| chr3_+_154797877 | 3.10 |
ENST00000462745.1 ENST00000493237.1 |
MME |
membrane metallo-endopeptidase |
| chr1_-_31845914 | 3.05 |
ENST00000373713.2 |
FABP3 |
fatty acid binding protein 3, muscle and heart (mammary-derived growth inhibitor) |
| chr13_+_76334795 | 3.01 |
ENST00000526202.1 ENST00000465261.2 |
LMO7 |
LIM domain 7 |
| chr1_-_201346761 | 2.96 |
ENST00000455702.1 ENST00000422165.1 ENST00000367318.5 ENST00000367320.2 ENST00000438742.1 ENST00000412633.1 ENST00000458432.2 ENST00000421663.2 ENST00000367322.1 ENST00000509001.1 |
TNNT2 |
troponin T type 2 (cardiac) |
| chr1_-_173174681 | 2.94 |
ENST00000367718.1 |
TNFSF4 |
tumor necrosis factor (ligand) superfamily, member 4 |
| chr17_+_4855053 | 2.89 |
ENST00000518175.1 |
ENO3 |
enolase 3 (beta, muscle) |
| chr9_-_21995249 | 2.85 |
ENST00000494262.1 |
CDKN2A |
cyclin-dependent kinase inhibitor 2A |
| chr2_-_235405679 | 2.78 |
ENST00000390645.2 |
ARL4C |
ADP-ribosylation factor-like 4C |
| chr11_+_1942580 | 2.54 |
ENST00000381558.1 |
TNNT3 |
troponin T type 3 (skeletal, fast) |
| chr11_+_1860200 | 2.50 |
ENST00000381911.1 |
TNNI2 |
troponin I type 2 (skeletal, fast) |
| chr12_-_111358372 | 2.49 |
ENST00000548438.1 ENST00000228841.8 |
MYL2 |
myosin, light chain 2, regulatory, cardiac, slow |
| chr7_-_150946015 | 2.42 |
ENST00000262188.8 |
SMARCD3 |
SWI/SNF related, matrix associated, actin dependent regulator of chromatin, subfamily d, member 3 |
| chr17_+_80186908 | 2.37 |
ENST00000582743.1 ENST00000578684.1 ENST00000577650.1 ENST00000582715.1 |
SLC16A3 |
solute carrier family 16 (monocarboxylate transporter), member 3 |
| chr4_+_41362796 | 2.28 |
ENST00000508501.1 ENST00000512946.1 ENST00000313860.7 ENST00000512632.1 ENST00000512820.1 |
LIMCH1 |
LIM and calponin homology domains 1 |
| chr10_+_63661053 | 2.10 |
ENST00000279873.7 |
ARID5B |
AT rich interactive domain 5B (MRF1-like) |
| chr13_-_67802549 | 1.89 |
ENST00000328454.5 ENST00000377865.2 |
PCDH9 |
protocadherin 9 |
| chr16_+_6069072 | 1.85 |
ENST00000547605.1 ENST00000550418.1 ENST00000553186.1 |
RBFOX1 |
RNA binding protein, fox-1 homolog (C. elegans) 1 |
| chr11_+_19799327 | 1.83 |
ENST00000540292.1 |
NAV2 |
neuron navigator 2 |
| chr11_+_1860832 | 1.78 |
ENST00000252898.7 |
TNNI2 |
troponin I type 2 (skeletal, fast) |
| chrX_+_153046456 | 1.68 |
ENST00000393786.3 ENST00000370104.1 ENST00000370108.3 ENST00000370101.3 ENST00000430541.1 ENST00000370100.1 |
SRPK3 |
SRSF protein kinase 3 |
| chr9_+_116327326 | 1.64 |
ENST00000342620.5 |
RGS3 |
regulator of G-protein signaling 3 |
| chr21_+_27011584 | 1.64 |
ENST00000400532.1 ENST00000480456.1 ENST00000312957.5 |
JAM2 |
junctional adhesion molecule 2 |
| chr16_+_84328252 | 1.62 |
ENST00000219454.5 |
WFDC1 |
WAP four-disulfide core domain 1 |
| chr21_+_39628852 | 1.58 |
ENST00000398938.2 |
KCNJ15 |
potassium inwardly-rectifying channel, subfamily J, member 15 |
| chr1_-_59249732 | 1.57 |
ENST00000371222.2 |
JUN |
jun proto-oncogene |
| chr16_+_7382745 | 1.56 |
ENST00000436368.2 ENST00000311745.5 ENST00000355637.4 ENST00000340209.4 |
RBFOX1 |
RNA binding protein, fox-1 homolog (C. elegans) 1 |
| chr11_+_1940925 | 1.53 |
ENST00000453458.1 ENST00000381557.2 ENST00000381589.3 ENST00000381579.3 ENST00000381563.4 ENST00000344578.4 |
TNNT3 |
troponin T type 3 (skeletal, fast) |
| chr1_+_145524891 | 1.48 |
ENST00000369304.3 |
ITGA10 |
integrin, alpha 10 |
| chr8_-_62602327 | 1.48 |
ENST00000445642.3 ENST00000517847.2 ENST00000389204.4 ENST00000517661.1 ENST00000517903.1 ENST00000522603.1 ENST00000522349.1 ENST00000522835.1 ENST00000541428.1 ENST00000518306.1 |
ASPH |
aspartate beta-hydroxylase |
| chr10_+_124134201 | 1.48 |
ENST00000368990.3 ENST00000368988.1 ENST00000368989.2 ENST00000463663.2 |
PLEKHA1 |
pleckstrin homology domain containing, family A (phosphoinositide binding specific) member 1 |
| chr16_+_84328429 | 1.46 |
ENST00000568638.1 |
WFDC1 |
WAP four-disulfide core domain 1 |
| chr1_+_156095951 | 1.45 |
ENST00000448611.2 ENST00000368297.1 |
LMNA |
lamin A/C |
| chr11_+_1940786 | 1.45 |
ENST00000278317.6 ENST00000381561.4 ENST00000381548.3 ENST00000360603.3 ENST00000381549.3 |
TNNT3 |
troponin T type 3 (skeletal, fast) |
| chr2_+_233497931 | 1.44 |
ENST00000264059.3 |
EFHD1 |
EF-hand domain family, member D1 |
| chr11_+_1860682 | 1.43 |
ENST00000381906.1 |
TNNI2 |
troponin I type 2 (skeletal, fast) |
| chr17_-_1389419 | 1.42 |
ENST00000575158.1 |
MYO1C |
myosin IC |
| chr4_+_55095264 | 1.42 |
ENST00000257290.5 |
PDGFRA |
platelet-derived growth factor receptor, alpha polypeptide |
| chr5_+_140749803 | 1.42 |
ENST00000576222.1 |
PCDHGB3 |
protocadherin gamma subfamily B, 3 |
| chr3_+_99357319 | 1.40 |
ENST00000452013.1 ENST00000261037.3 ENST00000273342.4 |
COL8A1 |
collagen, type VIII, alpha 1 |
| chr4_+_41614909 | 1.36 |
ENST00000509454.1 ENST00000396595.3 ENST00000381753.4 |
LIMCH1 |
LIM and calponin homology domains 1 |
| chr2_-_208030647 | 1.34 |
ENST00000309446.6 |
KLF7 |
Kruppel-like factor 7 (ubiquitous) |
| chr17_-_1389228 | 1.31 |
ENST00000438665.2 |
MYO1C |
myosin IC |
| chr21_+_39628655 | 1.28 |
ENST00000398925.1 ENST00000398928.1 ENST00000328656.4 ENST00000443341.1 |
KCNJ15 |
potassium inwardly-rectifying channel, subfamily J, member 15 |
| chr4_-_186696425 | 1.28 |
ENST00000430503.1 ENST00000319454.6 ENST00000450341.1 |
SORBS2 |
sorbin and SH3 domain containing 2 |
| chr10_+_88428206 | 1.21 |
ENST00000429277.2 ENST00000458213.2 ENST00000352360.5 |
LDB3 |
LIM domain binding 3 |
| chr10_-_62704005 | 1.17 |
ENST00000337910.5 |
RHOBTB1 |
Rho-related BTB domain containing 1 |
| chr1_-_230513367 | 1.15 |
ENST00000321327.2 ENST00000525115.1 |
PGBD5 |
piggyBac transposable element derived 5 |
| chr4_+_120056939 | 1.10 |
ENST00000307128.5 |
MYOZ2 |
myozenin 2 |
| chr8_+_132952112 | 1.10 |
ENST00000520362.1 ENST00000519656.1 |
EFR3A |
EFR3 homolog A (S. cerevisiae) |
| chr7_+_18535346 | 1.09 |
ENST00000405010.3 ENST00000406451.4 ENST00000428307.2 |
HDAC9 |
histone deacetylase 9 |
| chr5_-_142065223 | 1.09 |
ENST00000378046.1 |
FGF1 |
fibroblast growth factor 1 (acidic) |
| chr10_-_3827417 | 1.08 |
ENST00000497571.1 ENST00000542957.1 |
KLF6 |
Kruppel-like factor 6 |
| chr9_-_110251836 | 1.08 |
ENST00000374672.4 |
KLF4 |
Kruppel-like factor 4 (gut) |
| chr5_-_150521192 | 1.03 |
ENST00000523714.1 ENST00000521749.1 |
ANXA6 |
annexin A6 |
| chr15_+_100106126 | 1.03 |
ENST00000558812.1 ENST00000338042.6 |
MEF2A |
myocyte enhancer factor 2A |
| chr17_+_65040678 | 0.96 |
ENST00000226021.3 |
CACNG1 |
calcium channel, voltage-dependent, gamma subunit 1 |
| chr3_+_36421826 | 0.86 |
ENST00000273183.3 |
STAC |
SH3 and cysteine rich domain |
| chr15_+_100106244 | 0.85 |
ENST00000557942.1 |
MEF2A |
myocyte enhancer factor 2A |
| chr7_-_151217166 | 0.82 |
ENST00000496004.1 |
RHEB |
Ras homolog enriched in brain |
| chr1_+_68150744 | 0.75 |
ENST00000370986.4 ENST00000370985.3 |
GADD45A |
growth arrest and DNA-damage-inducible, alpha |
| chr1_-_154164534 | 0.74 |
ENST00000271850.7 ENST00000368530.2 |
TPM3 |
tropomyosin 3 |
| chr16_-_31439735 | 0.74 |
ENST00000287490.4 |
COX6A2 |
cytochrome c oxidase subunit VIa polypeptide 2 |
| chr14_+_78870030 | 0.74 |
ENST00000553631.1 ENST00000554719.1 |
NRXN3 |
neurexin 3 |
| chr20_+_48807351 | 0.73 |
ENST00000303004.3 |
CEBPB |
CCAAT/enhancer binding protein (C/EBP), beta |
| chr8_+_1993173 | 0.71 |
ENST00000523438.1 |
MYOM2 |
myomesin 2 |
| chr11_+_69924639 | 0.71 |
ENST00000538023.1 ENST00000398543.2 |
ANO1 |
anoctamin 1, calcium activated chloride channel |
| chr3_+_54157480 | 0.70 |
ENST00000490478.1 |
CACNA2D3 |
calcium channel, voltage-dependent, alpha 2/delta subunit 3 |
| chr14_-_61748550 | 0.69 |
ENST00000555868.1 |
TMEM30B |
transmembrane protein 30B |
| chr8_+_1993152 | 0.68 |
ENST00000262113.4 |
MYOM2 |
myomesin 2 |
| chr2_+_220143989 | 0.68 |
ENST00000336576.5 |
DNAJB2 |
DnaJ (Hsp40) homolog, subfamily B, member 2 |
| chr14_+_74003818 | 0.68 |
ENST00000311148.4 |
ACOT1 |
acyl-CoA thioesterase 1 |
| chr7_+_80267973 | 0.67 |
ENST00000394788.3 ENST00000447544.2 |
CD36 |
CD36 molecule (thrombospondin receptor) |
| chr15_+_100106155 | 0.63 |
ENST00000557785.1 ENST00000558049.1 ENST00000449277.2 |
MEF2A |
myocyte enhancer factor 2A |
| chr7_-_151217001 | 0.60 |
ENST00000262187.5 |
RHEB |
Ras homolog enriched in brain |
| chr15_+_67418047 | 0.55 |
ENST00000540846.2 |
SMAD3 |
SMAD family member 3 |
| chr6_+_132129151 | 0.54 |
ENST00000360971.2 |
ENPP1 |
ectonucleotide pyrophosphatase/phosphodiesterase 1 |
| chr3_+_46924829 | 0.53 |
ENST00000313049.5 |
PTH1R |
parathyroid hormone 1 receptor |
| chr18_+_9708162 | 0.48 |
ENST00000578921.1 |
RAB31 |
RAB31, member RAS oncogene family |
| chr3_+_179370517 | 0.47 |
ENST00000263966.3 |
USP13 |
ubiquitin specific peptidase 13 (isopeptidase T-3) |
| chr2_+_220144052 | 0.43 |
ENST00000425450.1 ENST00000392086.4 ENST00000421532.1 |
DNAJB2 |
DnaJ (Hsp40) homolog, subfamily B, member 2 |
| chr1_-_204329013 | 0.43 |
ENST00000272203.3 ENST00000414478.1 |
PLEKHA6 |
pleckstrin homology domain containing, family A member 6 |
| chr1_+_156096336 | 0.40 |
ENST00000504687.1 ENST00000473598.2 |
LMNA |
lamin A/C |
| chr18_+_3252206 | 0.38 |
ENST00000578562.2 |
MYL12A |
myosin, light chain 12A, regulatory, non-sarcomeric |
| chr2_+_109204909 | 0.38 |
ENST00000393310.1 |
LIMS1 |
LIM and senescent cell antigen-like domains 1 |
| chr10_+_88428370 | 0.38 |
ENST00000372066.3 ENST00000263066.6 ENST00000372056.4 ENST00000310944.6 ENST00000361373.4 ENST00000542786.1 |
LDB3 |
LIM domain binding 3 |
| chr1_+_170633047 | 0.37 |
ENST00000239461.6 ENST00000497230.2 |
PRRX1 |
paired related homeobox 1 |
| chr10_+_52751010 | 0.36 |
ENST00000373985.1 |
PRKG1 |
protein kinase, cGMP-dependent, type I |
| chr9_+_130565147 | 0.36 |
ENST00000373247.2 ENST00000373245.1 ENST00000393706.2 ENST00000373228.1 |
FPGS |
folylpolyglutamate synthase |
| chr2_+_109204743 | 0.35 |
ENST00000332345.6 |
LIMS1 |
LIM and senescent cell antigen-like domains 1 |
| chr9_-_74980113 | 0.32 |
ENST00000376962.5 ENST00000376960.4 ENST00000237937.3 |
ZFAND5 |
zinc finger, AN1-type domain 5 |
| chr7_-_56160625 | 0.29 |
ENST00000446428.1 ENST00000432123.1 ENST00000452681.2 ENST00000537360.1 |
PHKG1 |
phosphorylase kinase, gamma 1 (muscle) |
| chr22_+_41487711 | 0.28 |
ENST00000263253.7 |
EP300 |
E1A binding protein p300 |
| chr7_+_142457315 | 0.26 |
ENST00000486171.1 ENST00000311737.7 |
PRSS1 |
protease, serine, 1 (trypsin 1) |
| chr7_+_75931861 | 0.26 |
ENST00000248553.6 |
HSPB1 |
heat shock 27kDa protein 1 |
| chr15_+_80364901 | 0.22 |
ENST00000560228.1 ENST00000559835.1 ENST00000559775.1 ENST00000558688.1 ENST00000560392.1 ENST00000560976.1 ENST00000558272.1 ENST00000558390.1 |
ZFAND6 |
zinc finger, AN1-type domain 6 |
| chr18_+_29027696 | 0.18 |
ENST00000257189.4 |
DSG3 |
desmoglein 3 |
| chr3_-_3151664 | 0.16 |
ENST00000256452.3 ENST00000311981.8 ENST00000430514.2 ENST00000456302.1 |
IL5RA |
interleukin 5 receptor, alpha |
| chr7_-_56160666 | 0.15 |
ENST00000297373.2 |
PHKG1 |
phosphorylase kinase, gamma 1 (muscle) |
| chr11_-_85780853 | 0.15 |
ENST00000531930.1 ENST00000528398.1 |
PICALM |
phosphatidylinositol binding clathrin assembly protein |
| chr17_-_79604075 | 0.14 |
ENST00000374747.5 ENST00000539314.1 ENST00000331134.6 |
NPLOC4 |
nuclear protein localization 4 homolog (S. cerevisiae) |
| chr20_+_44519948 | 0.14 |
ENST00000354880.5 ENST00000191018.5 |
CTSA |
cathepsin A |
| chr1_+_201979645 | 0.13 |
ENST00000367284.5 ENST00000367283.3 |
ELF3 |
E74-like factor 3 (ets domain transcription factor, epithelial-specific ) |
| chrX_-_109683446 | 0.11 |
ENST00000372057.1 |
AMMECR1 |
Alport syndrome, mental retardation, midface hypoplasia and elliptocytosis chromosomal region gene 1 |
| chr17_-_10276319 | 0.11 |
ENST00000252172.4 ENST00000418404.3 |
MYH13 |
myosin, heavy chain 13, skeletal muscle |
| chr4_+_41614720 | 0.10 |
ENST00000509277.1 |
LIMCH1 |
LIM and calponin homology domains 1 |
| chr11_+_75110530 | 0.08 |
ENST00000531188.1 ENST00000530164.1 ENST00000422465.2 ENST00000278572.6 ENST00000534440.1 ENST00000527446.1 ENST00000526608.1 ENST00000527273.1 ENST00000524851.1 |
RPS3 |
ribosomal protein S3 |
| chr9_-_215744 | 0.08 |
ENST00000382387.2 |
C9orf66 |
chromosome 9 open reading frame 66 |
| chr18_+_3252265 | 0.06 |
ENST00000580887.1 ENST00000536605.1 |
MYL12A |
myosin, light chain 12A, regulatory, non-sarcomeric |
| chr10_+_95517660 | 0.05 |
ENST00000371413.3 |
LGI1 |
leucine-rich, glioma inactivated 1 |
| chr15_+_68582544 | 0.05 |
ENST00000566008.1 |
FEM1B |
fem-1 homolog b (C. elegans) |
| chr8_-_7309887 | 0.05 |
ENST00000458665.1 ENST00000528168.1 |
SPAG11B |
sperm associated antigen 11B |
| chr5_-_66492562 | 0.05 |
ENST00000256447.4 |
CD180 |
CD180 molecule |
| chr1_-_713985 | 0.04 |
ENST00000428504.1 |
RP11-206L10.2 |
RP11-206L10.2 |
| chr6_-_161085291 | 0.03 |
ENST00000316300.5 |
LPA |
lipoprotein, Lp(a) |
| chr20_+_44520009 | 0.03 |
ENST00000607482.1 ENST00000372459.2 |
CTSA |
cathepsin A |
| chr4_-_88450612 | 0.03 |
ENST00000418378.1 ENST00000282470.6 |
SPARCL1 |
SPARC-like 1 (hevin) |
| chr10_+_121652204 | 0.03 |
ENST00000369075.3 ENST00000543134.1 |
SEC23IP |
SEC23 interacting protein |
| chr1_+_24018269 | 0.03 |
ENST00000374550.3 |
RPL11 |
ribosomal protein L11 |
| chr4_-_57547870 | 0.01 |
ENST00000381260.3 ENST00000420433.1 ENST00000554144.1 ENST00000557328.1 |
HOPX |
HOP homeobox |
| chr4_-_57547454 | 0.01 |
ENST00000556376.2 |
HOPX |
HOP homeobox |
| chr1_+_92632542 | 0.00 |
ENST00000409154.4 ENST00000370378.4 |
KIAA1107 |
KIAA1107 |
Gene Ontology Analysis
Gene overrepresentation in C2:CP category:
| Log-likelihood per target | Total log-likelihood | Term | Description |
|---|---|---|---|
| 0.1 | 2.5 | PID THROMBIN PAR4 PATHWAY | PAR4-mediated thrombin signaling events |
| 0.1 | 3.0 | PID PDGFRA PATHWAY | PDGFR-alpha signaling pathway |
| 0.1 | 2.9 | PID INTEGRIN A9B1 PATHWAY | Alpha9 beta1 integrin signaling events |
| 0.1 | 2.9 | SA REG CASCADE OF CYCLIN EXPR | Expression of cyclins regulates progression through the cell cycle by activating cyclin-dependent kinases. |
| 0.1 | 13.4 | ST INTEGRIN SIGNALING PATHWAY | Integrin Signaling Pathway |
| 0.1 | 9.7 | PID KIT PATHWAY | Signaling events mediated by Stem cell factor receptor (c-Kit) |
| 0.1 | 8.4 | PID INTEGRIN1 PATHWAY | Beta1 integrin cell surface interactions |
| 0.0 | 1.6 | PID EPHRINB REV PATHWAY | Ephrin B reverse signaling |
| 0.0 | 1.0 | PID IFNG PATHWAY | IFN-gamma pathway |
| 0.0 | 1.4 | PID MTOR 4PATHWAY | mTOR signaling pathway |
| 0.0 | 1.5 | PID PI3KCI PATHWAY | Class I PI3K signaling events |
| 0.0 | 0.4 | PID P38 ALPHA BETA PATHWAY | Regulation of p38-alpha and p38-beta |
| 0.0 | 0.7 | PID P38 MKK3 6PATHWAY | p38 MAPK signaling pathway |
| 0.0 | 0.8 | ST ERK1 ERK2 MAPK PATHWAY | ERK1/ERK2 MAPK Pathway |
| 0.0 | 1.9 | PID CASPASE PATHWAY | Caspase cascade in apoptosis |
| 0.0 | 0.5 | PID SMAD2 3PATHWAY | Regulation of cytoplasmic and nuclear SMAD2/3 signaling |
| 0.0 | 0.2 | PID IL5 PATHWAY | IL5-mediated signaling events |
| 0.0 | 0.3 | ST P38 MAPK PATHWAY | p38 MAPK Pathway |
| 0.0 | 0.8 | PID FGF PATHWAY | FGF signaling pathway |
| 0.0 | 0.7 | PID ILK PATHWAY | Integrin-linked kinase signaling |
Gene overrepresentation in cellular_component category:
| Log-likelihood per target | Total log-likelihood | Term | Description |
|---|---|---|---|
| 1.4 | 32.6 | GO:0005861 | troponin complex(GO:0005861) |
| 1.2 | 3.5 | GO:0005588 | collagen type V trimer(GO:0005588) |
| 1.1 | 4.4 | GO:0030314 | junctional membrane complex(GO:0030314) |
| 0.7 | 2.7 | GO:0045160 | myosin I complex(GO:0045160) |
| 0.6 | 3.2 | GO:0071148 | TEAD-1-YAP complex(GO:0071148) |
| 0.5 | 1.5 | GO:0034680 | integrin alpha10-beta1 complex(GO:0034680) |
| 0.5 | 2.9 | GO:0000015 | phosphopyruvate hydratase complex(GO:0000015) |
| 0.3 | 16.2 | GO:0002102 | podosome(GO:0002102) |
| 0.2 | 1.5 | GO:0032541 | cortical endoplasmic reticulum(GO:0032541) |
| 0.2 | 6.7 | GO:0031143 | pseudopodium(GO:0031143) |
| 0.2 | 1.9 | GO:0005638 | lamin filament(GO:0005638) |
| 0.2 | 2.4 | GO:0097512 | cardiac myofibril(GO:0097512) |
| 0.2 | 1.6 | GO:0035976 | AP1 complex(GO:0035976) |
| 0.2 | 1.8 | GO:0005614 | interstitial matrix(GO:0005614) |
| 0.2 | 1.8 | GO:0035985 | senescence-associated heterochromatin focus(GO:0035985) |
| 0.2 | 1.4 | GO:0098645 | network-forming collagen trimer(GO:0098642) collagen network(GO:0098645) |
| 0.1 | 4.6 | GO:0000159 | protein phosphatase type 2A complex(GO:0000159) |
| 0.1 | 2.4 | GO:0071564 | npBAF complex(GO:0071564) |
| 0.1 | 0.2 | GO:0098575 | lumenal side of lysosomal membrane(GO:0098575) |
| 0.1 | 1.2 | GO:0044291 | cell-cell contact zone(GO:0044291) |
| 0.1 | 12.4 | GO:0030018 | Z disc(GO:0030018) |
| 0.1 | 2.7 | GO:0005859 | muscle myosin complex(GO:0005859) |
| 0.1 | 0.5 | GO:0071144 | SMAD2-SMAD3 protein complex(GO:0071144) |
| 0.1 | 0.7 | GO:0005751 | mitochondrial respiratory chain complex IV(GO:0005751) |
| 0.0 | 0.7 | GO:0005862 | muscle thin filament tropomyosin(GO:0005862) |
| 0.0 | 0.4 | GO:0005964 | phosphorylase kinase complex(GO:0005964) |
| 0.0 | 21.7 | GO:0031012 | extracellular matrix(GO:0031012) |
| 0.0 | 24.3 | GO:0005925 | focal adhesion(GO:0005925) |
| 0.0 | 13.0 | GO:0000790 | nuclear chromatin(GO:0000790) |
| 0.0 | 2.8 | GO:0030175 | filopodium(GO:0030175) |
| 0.0 | 1.4 | GO:0005902 | microvillus(GO:0005902) |
| 0.0 | 0.1 | GO:0070381 | endosome to plasma membrane transport vesicle(GO:0070381) |
| 0.0 | 0.6 | GO:0031092 | platelet alpha granule membrane(GO:0031092) |
| 0.0 | 0.8 | GO:0005891 | voltage-gated calcium channel complex(GO:0005891) |
| 0.0 | 1.1 | GO:0035097 | histone methyltransferase complex(GO:0035097) |
| 0.0 | 3.9 | GO:0005802 | trans-Golgi network(GO:0005802) |
| 0.0 | 3.6 | GO:0016607 | nuclear speck(GO:0016607) |
| 0.0 | 0.1 | GO:0034098 | VCP-NPL4-UFD1 AAA ATPase complex(GO:0034098) |
| 0.0 | 1.6 | GO:0005923 | bicellular tight junction(GO:0005923) |
| 0.0 | 0.4 | GO:0031526 | brush border membrane(GO:0031526) |
Gene overrepresentation in biological_process category:
| Log-likelihood per target | Total log-likelihood | Term | Description |
|---|---|---|---|
| 4.2 | 12.7 | GO:0070563 | negative regulation of vitamin D receptor signaling pathway(GO:0070563) |
| 1.9 | 7.8 | GO:0032972 | regulation of muscle filament sliding speed(GO:0032972) |
| 1.0 | 3.1 | GO:2001245 | regulation of phosphatidylcholine biosynthetic process(GO:2001245) |
| 1.0 | 2.9 | GO:2000523 | regulation of T cell costimulation(GO:2000523) positive regulation of T cell costimulation(GO:2000525) |
| 0.9 | 13.6 | GO:0014883 | transition between fast and slow fiber(GO:0014883) |
| 0.9 | 3.5 | GO:1903224 | regulation of endodermal cell differentiation(GO:1903224) |
| 0.8 | 3.1 | GO:0071492 | cellular response to UV-A(GO:0071492) |
| 0.7 | 16.4 | GO:0003334 | keratinocyte development(GO:0003334) |
| 0.6 | 16.5 | GO:0070886 | positive regulation of calcineurin-NFAT signaling cascade(GO:0070886) |
| 0.6 | 2.4 | GO:0035879 | plasma membrane lactate transport(GO:0035879) |
| 0.5 | 1.5 | GO:0042264 | peptidyl-aspartic acid hydroxylation(GO:0042264) |
| 0.5 | 2.9 | GO:0071313 | cellular response to caffeine(GO:0071313) |
| 0.5 | 2.4 | GO:0003219 | cardiac right ventricle formation(GO:0003219) |
| 0.5 | 1.4 | GO:0072276 | metanephric glomerulus morphogenesis(GO:0072275) metanephric glomerulus vasculature morphogenesis(GO:0072276) metanephric glomerular capillary formation(GO:0072277) |
| 0.5 | 5.1 | GO:0031272 | regulation of pseudopodium assembly(GO:0031272) |
| 0.5 | 1.8 | GO:0021564 | vagus nerve development(GO:0021564) |
| 0.5 | 2.7 | GO:1900748 | positive regulation of vascular endothelial growth factor signaling pathway(GO:1900748) |
| 0.4 | 32.6 | GO:0036092 | phosphatidylinositol-3-phosphate biosynthetic process(GO:0036092) |
| 0.4 | 2.5 | GO:0055005 | ventricular cardiac myofibril assembly(GO:0055005) |
| 0.4 | 2.5 | GO:0098735 | positive regulation of the force of heart contraction(GO:0098735) |
| 0.4 | 1.6 | GO:0035026 | leading edge cell differentiation(GO:0035026) |
| 0.4 | 1.9 | GO:0035105 | sterol regulatory element binding protein import into nucleus(GO:0035105) |
| 0.4 | 1.1 | GO:0071409 | negative regulation of muscle hyperplasia(GO:0014740) cellular response to cycloheximide(GO:0071409) |
| 0.3 | 1.1 | GO:1903644 | regulation of chaperone-mediated protein folding(GO:1903644) |
| 0.2 | 2.9 | GO:2000111 | positive regulation of macrophage apoptotic process(GO:2000111) |
| 0.2 | 9.6 | GO:0003009 | skeletal muscle contraction(GO:0003009) |
| 0.2 | 1.4 | GO:2000074 | regulation of type B pancreatic cell development(GO:2000074) |
| 0.1 | 8.2 | GO:0043268 | positive regulation of potassium ion transport(GO:0043268) |
| 0.1 | 1.3 | GO:0033327 | Leydig cell differentiation(GO:0033327) |
| 0.1 | 11.3 | GO:0032233 | positive regulation of actin filament bundle assembly(GO:0032233) |
| 0.1 | 3.2 | GO:0003301 | physiological muscle hypertrophy(GO:0003298) physiological cardiac muscle hypertrophy(GO:0003301) cell growth involved in cardiac muscle cell development(GO:0061049) |
| 0.1 | 1.1 | GO:0090050 | peptidyl-lysine deacetylation(GO:0034983) positive regulation of cell migration involved in sprouting angiogenesis(GO:0090050) |
| 0.1 | 0.4 | GO:0046900 | tetrahydrofolylpolyglutamate metabolic process(GO:0046900) |
| 0.1 | 0.5 | GO:0035523 | protein K29-linked deubiquitination(GO:0035523) maintenance of unfolded protein(GO:0036506) maintenance of unfolded protein involved in ERAD pathway(GO:1904378) |
| 0.1 | 12.9 | GO:1990823 | response to leukemia inhibitory factor(GO:1990823) cellular response to leukemia inhibitory factor(GO:1990830) |
| 0.1 | 0.3 | GO:0006990 | positive regulation of transcription from RNA polymerase II promoter involved in unfolded protein response(GO:0006990) |
| 0.1 | 0.5 | GO:0030643 | cellular phosphate ion homeostasis(GO:0030643) cellular trivalent inorganic anion homeostasis(GO:0072502) |
| 0.1 | 0.7 | GO:0015705 | iodide transport(GO:0015705) |
| 0.1 | 0.6 | GO:2000334 | lipoprotein particle mediated signaling(GO:0055095) low-density lipoprotein particle mediated signaling(GO:0055096) blood microparticle formation(GO:0072564) regulation of blood microparticle formation(GO:2000332) positive regulation of blood microparticle formation(GO:2000334) |
| 0.1 | 0.7 | GO:0070863 | positive regulation of protein exit from endoplasmic reticulum(GO:0070863) |
| 0.1 | 2.5 | GO:0010107 | potassium ion import(GO:0010107) |
| 0.1 | 3.2 | GO:0035329 | hippo signaling(GO:0035329) |
| 0.1 | 2.1 | GO:0016577 | histone demethylation(GO:0016577) |
| 0.1 | 5.1 | GO:0061053 | somite development(GO:0061053) |
| 0.1 | 0.3 | GO:0099640 | axo-dendritic protein transport(GO:0099640) |
| 0.1 | 2.8 | GO:0032456 | endocytic recycling(GO:0032456) |
| 0.1 | 0.7 | GO:1990440 | positive regulation of transcription from RNA polymerase II promoter in response to endoplasmic reticulum stress(GO:1990440) |
| 0.1 | 2.7 | GO:0043403 | skeletal muscle tissue regeneration(GO:0043403) |
| 0.1 | 0.2 | GO:0038043 | interleukin-5-mediated signaling pathway(GO:0038043) |
| 0.1 | 3.2 | GO:0000381 | regulation of alternative mRNA splicing, via spliceosome(GO:0000381) |
| 0.1 | 4.0 | GO:0051965 | positive regulation of synapse assembly(GO:0051965) |
| 0.0 | 1.0 | GO:0051560 | mitochondrial calcium ion homeostasis(GO:0051560) |
| 0.0 | 0.7 | GO:0071850 | mitotic cell cycle arrest(GO:0071850) |
| 0.0 | 1.6 | GO:0000188 | inactivation of MAPK activity(GO:0000188) |
| 0.0 | 3.4 | GO:0061045 | negative regulation of wound healing(GO:0061045) |
| 0.0 | 0.1 | GO:1902962 | regulation of metalloendopeptidase activity involved in amyloid precursor protein catabolic process(GO:1902962) negative regulation of metalloendopeptidase activity involved in amyloid precursor protein catabolic process(GO:1902963) |
| 0.0 | 0.7 | GO:0006123 | mitochondrial electron transport, cytochrome c to oxygen(GO:0006123) |
| 0.0 | 0.7 | GO:0051894 | positive regulation of focal adhesion assembly(GO:0051894) |
| 0.0 | 1.0 | GO:0070296 | sarcoplasmic reticulum calcium ion transport(GO:0070296) |
| 0.0 | 1.4 | GO:0035987 | endodermal cell differentiation(GO:0035987) |
| 0.0 | 1.7 | GO:0000245 | spliceosomal complex assembly(GO:0000245) |
| 0.0 | 0.1 | GO:1902544 | positive regulation of endodeoxyribonuclease activity(GO:0032079) regulation of DNA N-glycosylase activity(GO:1902544) |
| 0.0 | 3.0 | GO:0007156 | homophilic cell adhesion via plasma membrane adhesion molecules(GO:0007156) |
| 0.0 | 0.4 | GO:0045880 | positive regulation of smoothened signaling pathway(GO:0045880) |
| 0.0 | 0.7 | GO:1901385 | regulation of voltage-gated calcium channel activity(GO:1901385) |
| 0.0 | 0.5 | GO:0002076 | osteoblast development(GO:0002076) |
| 0.0 | 0.2 | GO:1904715 | negative regulation of chaperone-mediated autophagy(GO:1904715) |
| 0.0 | 3.6 | GO:0006986 | response to unfolded protein(GO:0006986) |
| 0.0 | 0.1 | GO:0060743 | epithelial cell maturation involved in prostate gland development(GO:0060743) |
| 0.0 | 0.3 | GO:0003016 | respiratory system process(GO:0003016) |
| 0.0 | 5.7 | GO:0000209 | protein polyubiquitination(GO:0000209) |
| 0.0 | 0.1 | GO:0030970 | retrograde protein transport, ER to cytosol(GO:0030970) |
| 0.0 | 0.1 | GO:0060056 | mammary gland involution(GO:0060056) |
| 0.0 | 0.5 | GO:0090382 | phagosome maturation(GO:0090382) |
| 0.0 | 1.5 | GO:0007229 | integrin-mediated signaling pathway(GO:0007229) |
| 0.0 | 0.4 | GO:0005980 | glycogen catabolic process(GO:0005980) |
| 0.0 | 0.3 | GO:0009235 | cobalamin metabolic process(GO:0009235) |
Gene overrepresentation in molecular_function category:
| Log-likelihood per target | Total log-likelihood | Term | Description |
|---|---|---|---|
| 6.5 | 32.3 | GO:0016316 | phosphatidylinositol-3,4-bisphosphate 4-phosphatase activity(GO:0016316) inositol-1,3,4-trisphosphate 4-phosphatase activity(GO:0017161) phosphatidylinositol-4,5-bisphosphate 4-phosphatase activity(GO:0034597) inositol-3,4-bisphosphate 4-phosphatase activity(GO:0052828) |
| 1.4 | 5.5 | GO:0030899 | calcium-dependent ATPase activity(GO:0030899) |
| 1.0 | 3.1 | GO:0070538 | oleic acid binding(GO:0070538) |
| 0.9 | 6.5 | GO:0031013 | troponin I binding(GO:0031013) |
| 0.8 | 17.5 | GO:0051371 | muscle alpha-actinin binding(GO:0051371) |
| 0.5 | 2.9 | GO:0004634 | phosphopyruvate hydratase activity(GO:0004634) |
| 0.5 | 5.7 | GO:0031014 | troponin T binding(GO:0031014) |
| 0.5 | 1.4 | GO:0005017 | platelet-derived growth factor-activated receptor activity(GO:0005017) |
| 0.3 | 1.5 | GO:0098639 | collagen binding involved in cell-matrix adhesion(GO:0098639) |
| 0.3 | 2.4 | GO:0015129 | lactate transmembrane transporter activity(GO:0015129) |
| 0.2 | 8.7 | GO:0030742 | GTP-dependent protein binding(GO:0030742) |
| 0.2 | 1.1 | GO:0001010 | transcription factor activity, sequence-specific DNA binding transcription factor recruiting(GO:0001010) |
| 0.2 | 3.2 | GO:0001134 | transcription factor activity, transcription factor recruiting(GO:0001134) |
| 0.2 | 0.5 | GO:0035529 | NADH pyrophosphatase activity(GO:0035529) |
| 0.2 | 4.4 | GO:0008093 | cytoskeletal adaptor activity(GO:0008093) |
| 0.2 | 2.7 | GO:0017160 | Ral GTPase binding(GO:0017160) |
| 0.2 | 2.9 | GO:0004861 | cyclin-dependent protein serine/threonine kinase inhibitor activity(GO:0004861) |
| 0.2 | 0.5 | GO:1904288 | BAT3 complex binding(GO:1904288) |
| 0.1 | 0.7 | GO:0015111 | iodide transmembrane transporter activity(GO:0015111) |
| 0.1 | 2.5 | GO:0015467 | G-protein activated inward rectifier potassium channel activity(GO:0015467) |
| 0.1 | 0.5 | GO:0031962 | mineralocorticoid receptor binding(GO:0031962) |
| 0.1 | 0.5 | GO:0004991 | parathyroid hormone receptor activity(GO:0004991) |
| 0.1 | 14.8 | GO:0003705 | transcription factor activity, RNA polymerase II distal enhancer sequence-specific binding(GO:0003705) |
| 0.1 | 0.6 | GO:0070892 | lipoteichoic acid receptor activity(GO:0070892) |
| 0.1 | 1.1 | GO:0030346 | protein phosphatase 2B binding(GO:0030346) |
| 0.1 | 0.3 | GO:0008426 | protein kinase C inhibitor activity(GO:0008426) |
| 0.1 | 1.2 | GO:0032036 | myosin heavy chain binding(GO:0032036) |
| 0.1 | 1.1 | GO:0044548 | S100 protein binding(GO:0044548) |
| 0.1 | 0.4 | GO:0004692 | cGMP-dependent protein kinase activity(GO:0004692) |
| 0.1 | 0.3 | GO:0004468 | lysine N-acetyltransferase activity, acting on acetyl phosphate as donor(GO:0004468) |
| 0.1 | 5.5 | GO:0048306 | calcium-dependent protein binding(GO:0048306) |
| 0.1 | 2.1 | GO:0032452 | histone demethylase activity(GO:0032452) |
| 0.1 | 0.7 | GO:0016290 | palmitoyl-CoA hydrolase activity(GO:0016290) |
| 0.1 | 4.8 | GO:0008307 | structural constituent of muscle(GO:0008307) |
| 0.1 | 1.5 | GO:0043325 | phosphatidylinositol-3,4-bisphosphate binding(GO:0043325) |
| 0.1 | 17.2 | GO:0003714 | transcription corepressor activity(GO:0003714) |
| 0.1 | 0.2 | GO:0004914 | interleukin-5 receptor activity(GO:0004914) |
| 0.1 | 2.5 | GO:0005164 | tumor necrosis factor receptor binding(GO:0005164) |
| 0.0 | 0.4 | GO:0004689 | phosphorylase kinase activity(GO:0004689) |
| 0.0 | 0.7 | GO:0097109 | neuroligin family protein binding(GO:0097109) |
| 0.0 | 4.6 | GO:0019888 | protein phosphatase regulator activity(GO:0019888) |
| 0.0 | 1.1 | GO:0001671 | ATPase activator activity(GO:0001671) |
| 0.0 | 12.8 | GO:0003924 | GTPase activity(GO:0003924) |
| 0.0 | 3.5 | GO:0046332 | SMAD binding(GO:0046332) |
| 0.0 | 17.1 | GO:0003779 | actin binding(GO:0003779) |
| 0.0 | 5.1 | GO:0044325 | ion channel binding(GO:0044325) |
| 0.0 | 3.1 | GO:0004222 | metalloendopeptidase activity(GO:0004222) |
| 0.0 | 0.4 | GO:0071837 | HMG box domain binding(GO:0071837) |
| 0.0 | 0.7 | GO:0004129 | cytochrome-c oxidase activity(GO:0004129) heme-copper terminal oxidase activity(GO:0015002) oxidoreductase activity, acting on a heme group of donors, oxygen as acceptor(GO:0016676) |
| 0.0 | 2.3 | GO:0004867 | serine-type endopeptidase inhibitor activity(GO:0004867) |
| 0.0 | 0.8 | GO:0005245 | voltage-gated calcium channel activity(GO:0005245) |
| 0.0 | 0.2 | GO:0016997 | exo-alpha-sialidase activity(GO:0004308) alpha-sialidase activity(GO:0016997) |
| 0.0 | 8.5 | GO:0004842 | ubiquitin-protein transferase activity(GO:0004842) |
| 0.0 | 0.4 | GO:0016881 | acid-amino acid ligase activity(GO:0016881) |
| 0.0 | 2.7 | GO:0008201 | heparin binding(GO:0008201) |
| 0.0 | 0.7 | GO:0005262 | calcium channel activity(GO:0005262) |
| 0.0 | 3.5 | GO:0044822 | mRNA binding(GO:0003729) poly(A) RNA binding(GO:0044822) |
| 0.0 | 0.1 | GO:0035615 | clathrin heavy chain binding(GO:0032050) clathrin adaptor activity(GO:0035615) endocytic adaptor activity(GO:0098748) |
Gene overrepresentation in C2:CP:REACTOME category:
| Log-likelihood per target | Total log-likelihood | Term | Description |
|---|---|---|---|
| 2.2 | 32.3 | REACTOME SYNTHESIS OF PIPS AT THE EARLY ENDOSOME MEMBRANE | Genes involved in Synthesis of PIPs at the early endosome membrane |
| 0.4 | 28.6 | REACTOME STRIATED MUSCLE CONTRACTION | Genes involved in Striated Muscle Contraction |
| 0.2 | 2.4 | REACTOME BILE SALT AND ORGANIC ANION SLC TRANSPORTERS | Genes involved in Bile salt and organic anion SLC transporters |
| 0.1 | 4.9 | REACTOME YAP1 AND WWTR1 TAZ STIMULATED GENE EXPRESSION | Genes involved in YAP1- and WWTR1 (TAZ)-stimulated gene expression |
| 0.1 | 1.8 | REACTOME PRE NOTCH TRANSCRIPTION AND TRANSLATION | Genes involved in Pre-NOTCH Transcription and Translation |
| 0.1 | 1.1 | REACTOME SIGNALING BY FGFR3 MUTANTS | Genes involved in Signaling by FGFR3 mutants |
| 0.1 | 1.4 | REACTOME REGULATION OF RHEB GTPASE ACTIVITY BY AMPK | Genes involved in Regulation of Rheb GTPase activity by AMPK |
| 0.1 | 2.5 | REACTOME INHIBITION OF VOLTAGE GATED CA2 CHANNELS VIA GBETA GAMMA SUBUNITS | Genes involved in Inhibition of voltage gated Ca2+ channels via Gbeta/gamma subunits |
| 0.1 | 2.5 | REACTOME ERK MAPK TARGETS | Genes involved in ERK/MAPK targets |
| 0.1 | 1.1 | REACTOME SYNTHESIS SECRETION AND DEACYLATION OF GHRELIN | Genes involved in Synthesis, Secretion, and Deacylation of Ghrelin |
| 0.1 | 0.7 | REACTOME TRANSCRIPTIONAL REGULATION OF WHITE ADIPOCYTE DIFFERENTIATION | Genes involved in Transcriptional Regulation of White Adipocyte Differentiation |
| 0.1 | 3.5 | REACTOME NCAM1 INTERACTIONS | Genes involved in NCAM1 interactions |
| 0.1 | 2.9 | REACTOME G1 PHASE | Genes involved in G1 Phase |
| 0.0 | 1.6 | REACTOME GLYCOLYSIS | Genes involved in Glycolysis |
| 0.0 | 0.7 | REACTOME CELL EXTRACELLULAR MATRIX INTERACTIONS | Genes involved in Cell-extracellular matrix interactions |
| 0.0 | 2.0 | REACTOME APOPTOTIC CLEAVAGE OF CELLULAR PROTEINS | Genes involved in Apoptotic cleavage of cellular proteins |
| 0.0 | 2.7 | REACTOME INTEGRIN CELL SURFACE INTERACTIONS | Genes involved in Integrin cell surface interactions |
| 0.0 | 0.4 | REACTOME RAP1 SIGNALLING | Genes involved in Rap1 signalling |
| 0.0 | 0.5 | REACTOME SIGNALING BY NODAL | Genes involved in Signaling by NODAL |
| 0.0 | 0.4 | REACTOME GLYCOGEN BREAKDOWN GLYCOGENOLYSIS | Genes involved in Glycogen breakdown (glycogenolysis) |
| 0.0 | 1.7 | REACTOME SIGNALING BY PDGF | Genes involved in Signaling by PDGF |
| 0.0 | 0.9 | REACTOME METABOLISM OF VITAMINS AND COFACTORS | Genes involved in Metabolism of vitamins and cofactors |
| 0.0 | 0.3 | REACTOME DESTABILIZATION OF MRNA BY AUF1 HNRNP D0 | Genes involved in Destabilization of mRNA by AUF1 (hnRNP D0) |