Project
ENCODE cell lines, expression (Ernst 2011)
Navigation
Downloads
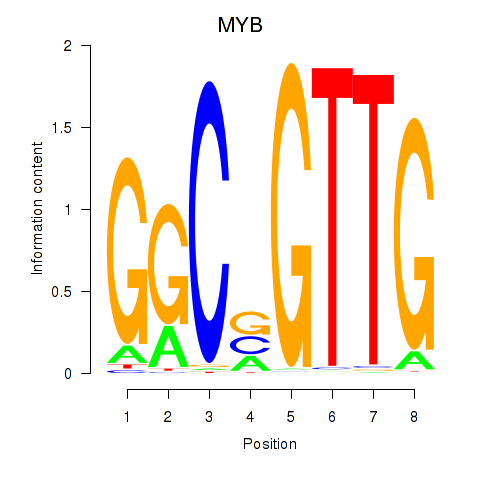
Results for MYB
Z-value: 2.03
Motif logo
Transcription factors associated with MYB
| Gene Symbol | Gene ID | Gene Info |
|---|---|---|
|
MYB
|
ENSG00000118513.14 | MYB |
Activity-expression correlation:
| Gene | Promoter | Pearson corr. coef. | P-value | Plot |
|---|---|---|---|---|
| MYB | hg19_v2_chr6_+_135502501_135502652 | 0.95 | 2.4e-08 | Click! |
Activity profile of MYB motif
Sorted Z-values of MYB motif
Network of associatons between targets according to the STRING database.

First level regulatory network of MYB
| Promoter | Score | Transcript | Gene | Gene Info |
|---|---|---|---|---|
| chr1_-_85155939 | 3.50 |
ENST00000603677.1 |
SSX2IP |
synovial sarcoma, X breakpoint 2 interacting protein |
| chr11_-_67888671 | 3.36 |
ENST00000265689.4 |
CHKA |
choline kinase alpha |
| chrX_+_37545012 | 3.25 |
ENST00000378616.3 |
XK |
X-linked Kx blood group (McLeod syndrome) |
| chr1_-_85156216 | 2.86 |
ENST00000342203.3 ENST00000370612.4 |
SSX2IP |
synovial sarcoma, X breakpoint 2 interacting protein |
| chr14_+_29236269 | 2.77 |
ENST00000313071.4 |
FOXG1 |
forkhead box G1 |
| chrX_-_151903101 | 2.69 |
ENST00000393900.3 |
MAGEA12 |
melanoma antigen family A, 12 |
| chr1_-_114355083 | 2.63 |
ENST00000261441.5 |
RSBN1 |
round spermatid basic protein 1 |
| chr17_+_45286387 | 2.59 |
ENST00000572316.1 ENST00000354968.1 ENST00000576874.1 ENST00000536623.2 |
MYL4 |
myosin, light chain 4, alkali; atrial, embryonic |
| chr2_-_111435610 | 2.53 |
ENST00000447014.1 ENST00000420328.1 ENST00000535254.1 ENST00000409311.1 ENST00000302759.6 |
BUB1 |
BUB1 mitotic checkpoint serine/threonine kinase |
| chr17_+_45286706 | 2.37 |
ENST00000393450.1 ENST00000572303.1 |
MYL4 |
myosin, light chain 4, alkali; atrial, embryonic |
| chr6_+_167412835 | 2.35 |
ENST00000349556.4 |
FGFR1OP |
FGFR1 oncogene partner |
| chrX_-_151903184 | 2.34 |
ENST00000357916.4 ENST00000393869.3 |
MAGEA12 |
melanoma antigen family A, 12 |
| chr19_-_14530143 | 2.25 |
ENST00000242776.4 |
DDX39A |
DEAD (Asp-Glu-Ala-Asp) box polypeptide 39A |
| chr1_-_85156090 | 2.25 |
ENST00000605755.1 ENST00000437941.2 |
SSX2IP |
synovial sarcoma, X breakpoint 2 interacting protein |
| chr11_-_67888881 | 2.22 |
ENST00000356135.5 |
CHKA |
choline kinase alpha |
| chr8_-_28747424 | 2.19 |
ENST00000523436.1 ENST00000397363.4 ENST00000521777.1 ENST00000520184.1 ENST00000521022.1 |
INTS9 |
integrator complex subunit 9 |
| chr17_+_7155819 | 2.17 |
ENST00000570322.1 ENST00000576496.1 ENST00000574841.2 |
ELP5 |
elongator acetyltransferase complex subunit 5 |
| chr17_+_7155556 | 2.15 |
ENST00000570500.1 ENST00000574993.1 ENST00000396628.2 ENST00000573657.1 |
ELP5 |
elongator acetyltransferase complex subunit 5 |
| chrX_+_151903253 | 2.11 |
ENST00000452779.2 ENST00000370291.2 |
CSAG1 |
chondrosarcoma associated gene 1 |
| chrX_+_151903207 | 2.05 |
ENST00000370287.3 |
CSAG1 |
chondrosarcoma associated gene 1 |
| chr1_-_211848899 | 2.03 |
ENST00000366998.3 ENST00000540251.1 ENST00000366999.4 |
NEK2 |
NIMA-related kinase 2 |
| chrX_+_151883090 | 2.01 |
ENST00000370293.2 ENST00000423993.1 ENST00000447530.1 ENST00000458057.1 ENST00000331220.2 ENST00000422085.1 ENST00000453150.1 ENST00000409560.1 |
MAGEA2B |
melanoma antigen family A, 2B |
| chr15_-_55581954 | 1.96 |
ENST00000336787.1 |
RAB27A |
RAB27A, member RAS oncogene family |
| chr8_-_28747717 | 1.91 |
ENST00000416984.2 |
INTS9 |
integrator complex subunit 9 |
| chrX_-_129299847 | 1.89 |
ENST00000319908.3 ENST00000287295.3 |
AIFM1 |
apoptosis-inducing factor, mitochondrion-associated, 1 |
| chr6_-_41040195 | 1.87 |
ENST00000463088.1 ENST00000469104.1 ENST00000486443.1 |
OARD1 |
O-acyl-ADP-ribose deacylase 1 |
| chr19_-_59023348 | 1.84 |
ENST00000601355.1 ENST00000263093.2 |
SLC27A5 |
solute carrier family 27 (fatty acid transporter), member 5 |
| chrX_-_151922340 | 1.83 |
ENST00000370284.1 ENST00000543232.1 ENST00000393876.1 ENST00000393872.3 |
MAGEA2 |
melanoma antigen family A, 2 |
| chr17_+_7155343 | 1.81 |
ENST00000573513.1 ENST00000354429.2 ENST00000574255.1 ENST00000396627.2 ENST00000356683.2 |
ELP5 |
elongator acetyltransferase complex subunit 5 |
| chr16_+_68119247 | 1.79 |
ENST00000575270.1 |
NFATC3 |
nuclear factor of activated T-cells, cytoplasmic, calcineurin-dependent 3 |
| chr17_+_7210898 | 1.77 |
ENST00000572815.1 |
EIF5A |
eukaryotic translation initiation factor 5A |
| chr6_-_41040268 | 1.76 |
ENST00000373154.2 ENST00000244558.9 ENST00000464633.1 ENST00000424266.2 ENST00000479950.1 ENST00000482515.1 |
OARD1 |
O-acyl-ADP-ribose deacylase 1 |
| chr12_+_93771659 | 1.75 |
ENST00000337179.5 ENST00000415493.2 |
NUDT4 |
nudix (nucleoside diphosphate linked moiety X)-type motif 4 |
| chr14_-_23451467 | 1.71 |
ENST00000555074.1 ENST00000361265.4 |
RP11-298I3.5 AJUBA |
RP11-298I3.5 ajuba LIM protein |
| chr15_-_58357866 | 1.70 |
ENST00000537372.1 |
ALDH1A2 |
aldehyde dehydrogenase 1 family, member A2 |
| chr7_+_150065879 | 1.68 |
ENST00000397281.2 ENST00000444957.1 ENST00000466559.1 ENST00000489432.2 ENST00000475514.1 ENST00000482680.1 ENST00000488943.1 ENST00000518514.1 ENST00000478789.1 |
REPIN1 ZNF775 |
replication initiator 1 zinc finger protein 775 |
| chr10_-_43904235 | 1.68 |
ENST00000356053.3 |
HNRNPF |
heterogeneous nuclear ribonucleoprotein F |
| chr19_+_49497121 | 1.68 |
ENST00000413176.2 |
RUVBL2 |
RuvB-like AAA ATPase 2 |
| chr11_-_32452357 | 1.67 |
ENST00000379079.2 ENST00000530998.1 |
WT1 |
Wilms tumor 1 |
| chr10_-_43904608 | 1.63 |
ENST00000337970.3 |
HNRNPF |
heterogeneous nuclear ribonucleoprotein F |
| chr1_+_52195480 | 1.62 |
ENST00000531828.1 ENST00000361556.5 ENST00000481937.1 |
OSBPL9 |
oxysterol binding protein-like 9 |
| chrX_-_129299638 | 1.58 |
ENST00000535724.1 ENST00000346424.2 |
AIFM1 |
apoptosis-inducing factor, mitochondrion-associated, 1 |
| chr6_+_167412665 | 1.58 |
ENST00000366847.4 |
FGFR1OP |
FGFR1 oncogene partner |
| chr19_+_59055814 | 1.57 |
ENST00000594806.1 ENST00000253024.5 ENST00000341753.6 |
TRIM28 |
tripartite motif containing 28 |
| chr7_-_128694927 | 1.56 |
ENST00000471166.1 ENST00000265388.5 |
TNPO3 |
transportin 3 |
| chr4_-_140098339 | 1.53 |
ENST00000394235.2 |
ELF2 |
E74-like factor 2 (ets domain transcription factor) |
| chr9_+_132597722 | 1.49 |
ENST00000372429.3 ENST00000315480.4 ENST00000358355.1 |
USP20 |
ubiquitin specific peptidase 20 |
| chr16_-_30006922 | 1.49 |
ENST00000564026.1 |
HIRIP3 |
HIRA interacting protein 3 |
| chr11_+_34073872 | 1.48 |
ENST00000530820.1 |
CAPRIN1 |
cell cycle associated protein 1 |
| chr3_-_121379739 | 1.48 |
ENST00000428394.2 ENST00000314583.3 |
HCLS1 |
hematopoietic cell-specific Lyn substrate 1 |
| chr17_-_79895097 | 1.46 |
ENST00000402252.2 ENST00000583564.1 ENST00000585244.1 ENST00000337943.5 ENST00000579698.1 |
PYCR1 |
pyrroline-5-carboxylate reductase 1 |
| chr11_+_62104897 | 1.45 |
ENST00000415229.2 ENST00000535727.1 ENST00000301776.5 |
ASRGL1 |
asparaginase like 1 |
| chr8_+_27348649 | 1.45 |
ENST00000521780.1 ENST00000380476.3 ENST00000518379.1 ENST00000521684.1 |
EPHX2 |
epoxide hydrolase 2, cytoplasmic |
| chr6_-_13711773 | 1.45 |
ENST00000011619.3 |
RANBP9 |
RAN binding protein 9 |
| chr8_-_61193947 | 1.44 |
ENST00000317995.4 |
CA8 |
carbonic anhydrase VIII |
| chr11_+_59824060 | 1.44 |
ENST00000395032.2 ENST00000358152.2 |
MS4A3 |
membrane-spanning 4-domains, subfamily A, member 3 (hematopoietic cell-specific) |
| chr17_-_79895154 | 1.42 |
ENST00000405481.4 ENST00000585215.1 ENST00000577624.1 ENST00000403172.4 |
PYCR1 |
pyrroline-5-carboxylate reductase 1 |
| chr7_-_148581360 | 1.42 |
ENST00000320356.2 ENST00000541220.1 ENST00000483967.1 ENST00000536783.1 |
EZH2 |
enhancer of zeste homolog 2 (Drosophila) |
| chr6_+_34725263 | 1.41 |
ENST00000374018.1 ENST00000374017.3 |
SNRPC |
small nuclear ribonucleoprotein polypeptide C |
| chr9_+_131219179 | 1.40 |
ENST00000372791.3 |
ODF2 |
outer dense fiber of sperm tails 2 |
| chr8_+_96145974 | 1.40 |
ENST00000315367.3 |
PLEKHF2 |
pleckstrin homology domain containing, family F (with FYVE domain) member 2 |
| chr11_+_59824127 | 1.40 |
ENST00000278865.3 |
MS4A3 |
membrane-spanning 4-domains, subfamily A, member 3 (hematopoietic cell-specific) |
| chr1_+_93544791 | 1.37 |
ENST00000545708.1 ENST00000540243.1 ENST00000370298.4 |
MTF2 |
metal response element binding transcription factor 2 |
| chr1_-_115053781 | 1.36 |
ENST00000358465.2 ENST00000369543.2 |
TRIM33 |
tripartite motif containing 33 |
| chr1_+_93544821 | 1.36 |
ENST00000370303.4 |
MTF2 |
metal response element binding transcription factor 2 |
| chr19_+_1104415 | 1.35 |
ENST00000585362.2 |
GPX4 |
glutathione peroxidase 4 |
| chr1_+_174969262 | 1.35 |
ENST00000406752.1 ENST00000405362.1 |
CACYBP |
calcyclin binding protein |
| chr22_-_21356375 | 1.35 |
ENST00000215742.4 ENST00000399133.2 |
THAP7 |
THAP domain containing 7 |
| chr4_+_128703295 | 1.35 |
ENST00000296464.4 ENST00000508549.1 |
HSPA4L |
heat shock 70kDa protein 4-like |
| chr16_+_85646891 | 1.35 |
ENST00000393243.1 |
GSE1 |
Gse1 coiled-coil protein |
| chr2_+_47596287 | 1.33 |
ENST00000263735.4 |
EPCAM |
epithelial cell adhesion molecule |
| chr12_-_58027138 | 1.33 |
ENST00000341156.4 |
B4GALNT1 |
beta-1,4-N-acetyl-galactosaminyl transferase 1 |
| chr22_+_23229960 | 1.33 |
ENST00000526893.1 ENST00000532223.2 ENST00000531372.1 |
IGLL5 |
immunoglobulin lambda-like polypeptide 5 |
| chr18_-_268019 | 1.33 |
ENST00000261600.6 |
THOC1 |
THO complex 1 |
| chr4_+_142142035 | 1.26 |
ENST00000262990.4 ENST00000512809.1 ENST00000503649.1 ENST00000512738.1 ENST00000421169.2 |
ZNF330 |
zinc finger protein 330 |
| chr1_+_52195542 | 1.26 |
ENST00000462759.1 ENST00000486942.1 |
OSBPL9 |
oxysterol binding protein-like 9 |
| chr10_+_21823243 | 1.25 |
ENST00000307729.7 ENST00000377091.2 |
MLLT10 |
myeloid/lymphoid or mixed-lineage leukemia (trithorax homolog, Drosophila); translocated to, 10 |
| chr3_-_141747439 | 1.25 |
ENST00000467667.1 |
TFDP2 |
transcription factor Dp-2 (E2F dimerization partner 2) |
| chrX_-_122756660 | 1.24 |
ENST00000441692.1 |
THOC2 |
THO complex 2 |
| chr1_-_155658518 | 1.22 |
ENST00000404643.1 ENST00000359205.5 ENST00000407221.1 |
YY1AP1 |
YY1 associated protein 1 |
| chr13_-_103426081 | 1.20 |
ENST00000376022.1 ENST00000376021.4 |
TEX30 |
testis expressed 30 |
| chr5_+_126112794 | 1.20 |
ENST00000261366.5 ENST00000395354.1 |
LMNB1 |
lamin B1 |
| chr1_+_155658849 | 1.20 |
ENST00000368336.5 ENST00000343043.3 ENST00000421487.2 ENST00000535183.1 ENST00000465375.1 ENST00000470830.1 |
DAP3 |
death associated protein 3 |
| chr9_+_100745615 | 1.18 |
ENST00000339399.4 |
ANP32B |
acidic (leucine-rich) nuclear phosphoprotein 32 family, member B |
| chr12_-_6961050 | 1.18 |
ENST00000538862.2 |
CDCA3 |
cell division cycle associated 3 |
| chr1_-_155658260 | 1.17 |
ENST00000368339.5 ENST00000405763.3 ENST00000368340.5 ENST00000454523.1 ENST00000443231.1 ENST00000347088.5 ENST00000361831.5 ENST00000355499.4 |
YY1AP1 |
YY1 associated protein 1 |
| chr9_+_108456800 | 1.17 |
ENST00000434214.1 ENST00000374692.3 |
TMEM38B |
transmembrane protein 38B |
| chr13_-_103426112 | 1.17 |
ENST00000376032.4 ENST00000376029.3 |
TEX30 |
testis expressed 30 |
| chr1_-_25291475 | 1.16 |
ENST00000338888.3 ENST00000399916.1 |
RUNX3 |
runt-related transcription factor 3 |
| chr15_+_84116106 | 1.16 |
ENST00000535412.1 ENST00000324537.5 |
SH3GL3 |
SH3-domain GRB2-like 3 |
| chr2_+_168725458 | 1.16 |
ENST00000392690.3 |
B3GALT1 |
UDP-Gal:betaGlcNAc beta 1,3-galactosyltransferase, polypeptide 1 |
| chr1_-_38061522 | 1.15 |
ENST00000373062.3 |
GNL2 |
guanine nucleotide binding protein-like 2 (nucleolar) |
| chr16_+_68119324 | 1.13 |
ENST00000349223.5 |
NFATC3 |
nuclear factor of activated T-cells, cytoplasmic, calcineurin-dependent 3 |
| chr16_+_68119440 | 1.13 |
ENST00000346183.3 ENST00000329524.4 |
NFATC3 |
nuclear factor of activated T-cells, cytoplasmic, calcineurin-dependent 3 |
| chr4_+_128702969 | 1.13 |
ENST00000508776.1 ENST00000439123.2 |
HSPA4L |
heat shock 70kDa protein 4-like |
| chr1_-_155658766 | 1.12 |
ENST00000295566.4 ENST00000368330.2 |
YY1AP1 |
YY1 associated protein 1 |
| chr8_+_17780483 | 1.11 |
ENST00000517730.1 ENST00000518537.1 ENST00000523055.1 ENST00000519253.1 |
PCM1 |
pericentriolar material 1 |
| chr15_+_75335604 | 1.10 |
ENST00000563393.1 |
PPCDC |
phosphopantothenoylcysteine decarboxylase |
| chr15_+_81475047 | 1.10 |
ENST00000559388.1 |
IL16 |
interleukin 16 |
| chr19_+_49496705 | 1.10 |
ENST00000595090.1 |
RUVBL2 |
RuvB-like AAA ATPase 2 |
| chr1_+_212208919 | 1.10 |
ENST00000366991.4 ENST00000542077.1 |
DTL |
denticleless E3 ubiquitin protein ligase homolog (Drosophila) |
| chr2_-_203776864 | 1.09 |
ENST00000261015.4 |
WDR12 |
WD repeat domain 12 |
| chr7_-_128695147 | 1.09 |
ENST00000482320.1 ENST00000393245.1 ENST00000471234.1 |
TNPO3 |
transportin 3 |
| chr3_-_182698381 | 1.07 |
ENST00000292782.4 |
DCUN1D1 |
DCN1, defective in cullin neddylation 1, domain containing 1 |
| chr16_+_31539197 | 1.07 |
ENST00000564707.1 |
AHSP |
alpha hemoglobin stabilizing protein |
| chr16_+_29817841 | 1.07 |
ENST00000322945.6 ENST00000562337.1 ENST00000566906.2 ENST00000563402.1 ENST00000219782.6 |
MAZ |
MYC-associated zinc finger protein (purine-binding transcription factor) |
| chr1_+_165796753 | 1.07 |
ENST00000367879.4 |
UCK2 |
uridine-cytidine kinase 2 |
| chr19_+_17413663 | 1.06 |
ENST00000594999.1 |
MRPL34 |
mitochondrial ribosomal protein L34 |
| chr1_-_153643442 | 1.05 |
ENST00000368681.1 ENST00000361891.4 |
ILF2 |
interleukin enhancer binding factor 2 |
| chr19_+_50529212 | 1.05 |
ENST00000270617.3 ENST00000445728.3 ENST00000601364.1 |
ZNF473 |
zinc finger protein 473 |
| chr19_-_39826639 | 1.05 |
ENST00000602185.1 ENST00000598034.1 ENST00000601387.1 ENST00000595636.1 ENST00000253054.8 ENST00000594700.1 ENST00000597595.1 |
GMFG |
glia maturation factor, gamma |
| chr16_+_29802036 | 1.04 |
ENST00000561482.1 ENST00000160827.4 ENST00000569636.2 ENST00000400750.2 |
KIF22 |
kinesin family member 22 |
| chr1_+_38158090 | 1.04 |
ENST00000373055.1 ENST00000327331.2 |
CDCA8 |
cell division cycle associated 8 |
| chr3_+_157823609 | 1.04 |
ENST00000480820.1 |
RSRC1 |
arginine/serine-rich coiled-coil 1 |
| chr1_+_43824669 | 1.03 |
ENST00000372462.1 |
CDC20 |
cell division cycle 20 |
| chr1_-_114301503 | 1.02 |
ENST00000447664.2 |
PHTF1 |
putative homeodomain transcription factor 1 |
| chr1_-_33502441 | 1.01 |
ENST00000548033.1 ENST00000487289.1 ENST00000373449.2 ENST00000480134.1 ENST00000467905.1 |
AK2 |
adenylate kinase 2 |
| chr21_-_46237883 | 1.00 |
ENST00000397893.3 |
SUMO3 |
small ubiquitin-like modifier 3 |
| chr6_-_166796461 | 0.99 |
ENST00000360961.6 ENST00000341756.6 |
MPC1 |
mitochondrial pyruvate carrier 1 |
| chr3_-_141747459 | 0.99 |
ENST00000477292.1 ENST00000478006.1 ENST00000495310.1 ENST00000486111.1 |
TFDP2 |
transcription factor Dp-2 (E2F dimerization partner 2) |
| chr3_+_4535025 | 0.99 |
ENST00000302640.8 ENST00000354582.6 ENST00000423119.2 ENST00000357086.4 ENST00000456211.2 |
ITPR1 |
inositol 1,4,5-trisphosphate receptor, type 1 |
| chr11_+_34073195 | 0.98 |
ENST00000341394.4 |
CAPRIN1 |
cell cycle associated protein 1 |
| chr1_-_245027833 | 0.98 |
ENST00000444376.2 |
HNRNPU |
heterogeneous nuclear ribonucleoprotein U (scaffold attachment factor A) |
| chr1_+_100598691 | 0.97 |
ENST00000370143.1 ENST00000370141.2 |
TRMT13 |
tRNA methyltransferase 13 homolog (S. cerevisiae) |
| chr1_+_43824577 | 0.97 |
ENST00000310955.6 |
CDC20 |
cell division cycle 20 |
| chr18_-_12702769 | 0.97 |
ENST00000262127.2 |
CEP76 |
centrosomal protein 76kDa |
| chr22_+_50247449 | 0.97 |
ENST00000216268.5 |
ZBED4 |
zinc finger, BED-type containing 4 |
| chr3_-_197476560 | 0.96 |
ENST00000273582.5 |
KIAA0226 |
KIAA0226 |
| chr2_-_128615681 | 0.96 |
ENST00000409955.1 ENST00000272645.4 |
POLR2D |
polymerase (RNA) II (DNA directed) polypeptide D |
| chr12_+_123011776 | 0.96 |
ENST00000450485.2 ENST00000333479.7 |
KNTC1 |
kinetochore associated 1 |
| chr11_-_78285804 | 0.96 |
ENST00000281038.5 ENST00000529571.1 |
NARS2 |
asparaginyl-tRNA synthetase 2, mitochondrial (putative) |
| chr10_-_21463116 | 0.96 |
ENST00000417816.2 |
NEBL |
nebulette |
| chr5_+_43121698 | 0.95 |
ENST00000505606.2 ENST00000509634.1 ENST00000509341.1 |
ZNF131 |
zinc finger protein 131 |
| chrX_-_71458802 | 0.94 |
ENST00000373657.1 ENST00000334463.3 |
ERCC6L |
excision repair cross-complementing rodent repair deficiency, complementation group 6-like |
| chrX_-_153714994 | 0.94 |
ENST00000369660.4 |
UBL4A |
ubiquitin-like 4A |
| chr22_+_25960786 | 0.94 |
ENST00000324198.6 |
ADRBK2 |
adrenergic, beta, receptor kinase 2 |
| chr1_+_12538594 | 0.93 |
ENST00000543710.1 |
VPS13D |
vacuolar protein sorting 13 homolog D (S. cerevisiae) |
| chr8_+_67976593 | 0.93 |
ENST00000262210.5 ENST00000412460.1 |
CSPP1 |
centrosome and spindle pole associated protein 1 |
| chr2_+_48010221 | 0.92 |
ENST00000234420.5 |
MSH6 |
mutS homolog 6 |
| chr1_+_45965725 | 0.92 |
ENST00000401061.4 |
MMACHC |
methylmalonic aciduria (cobalamin deficiency) cblC type, with homocystinuria |
| chr9_+_2015335 | 0.92 |
ENST00000349721.2 ENST00000357248.2 ENST00000450198.1 |
SMARCA2 |
SWI/SNF related, matrix associated, actin dependent regulator of chromatin, subfamily a, member 2 |
| chr5_+_61602055 | 0.92 |
ENST00000381103.2 |
KIF2A |
kinesin heavy chain member 2A |
| chr19_+_50528971 | 0.92 |
ENST00000598809.1 ENST00000595661.1 ENST00000391821.2 |
ZNF473 |
zinc finger protein 473 |
| chr11_+_22688150 | 0.91 |
ENST00000454584.2 |
GAS2 |
growth arrest-specific 2 |
| chr8_+_17780346 | 0.91 |
ENST00000325083.8 |
PCM1 |
pericentriolar material 1 |
| chr6_+_42584847 | 0.91 |
ENST00000372883.3 |
UBR2 |
ubiquitin protein ligase E3 component n-recognin 2 |
| chr16_+_29817399 | 0.90 |
ENST00000545521.1 |
MAZ |
MYC-associated zinc finger protein (purine-binding transcription factor) |
| chr7_-_65447192 | 0.90 |
ENST00000421103.1 ENST00000345660.6 ENST00000304895.4 |
GUSB |
glucuronidase, beta |
| chr11_+_34073269 | 0.90 |
ENST00000389645.3 |
CAPRIN1 |
cell cycle associated protein 1 |
| chr3_-_186857267 | 0.89 |
ENST00000455270.1 ENST00000296277.4 |
RPL39L |
ribosomal protein L39-like |
| chr21_+_44394742 | 0.89 |
ENST00000432907.2 |
PKNOX1 |
PBX/knotted 1 homeobox 1 |
| chr16_+_66586461 | 0.89 |
ENST00000264001.4 ENST00000351137.4 ENST00000345436.4 ENST00000362093.4 ENST00000417030.2 ENST00000527729.1 ENST00000532838.1 |
CKLF CKLF-CMTM1 |
chemokine-like factor CKLF-CMTM1 readthrough |
| chr2_+_97481974 | 0.88 |
ENST00000377060.3 ENST00000305510.3 |
CNNM3 |
cyclin M3 |
| chr16_+_85646763 | 0.87 |
ENST00000411612.1 ENST00000253458.7 |
GSE1 |
Gse1 coiled-coil protein |
| chr19_+_49496782 | 0.86 |
ENST00000601968.1 ENST00000596837.1 |
RUVBL2 |
RuvB-like AAA ATPase 2 |
| chr5_+_43121607 | 0.85 |
ENST00000509156.1 ENST00000508259.1 ENST00000306938.4 ENST00000399534.1 |
ZNF131 |
zinc finger protein 131 |
| chr6_+_34204642 | 0.85 |
ENST00000347617.6 ENST00000401473.3 ENST00000311487.5 ENST00000447654.1 ENST00000395004.3 |
HMGA1 |
high mobility group AT-hook 1 |
| chr2_-_208634287 | 0.85 |
ENST00000295417.3 |
FZD5 |
frizzled family receptor 5 |
| chr6_+_126112001 | 0.84 |
ENST00000392477.2 |
NCOA7 |
nuclear receptor coactivator 7 |
| chr8_-_67976509 | 0.84 |
ENST00000518747.1 |
COPS5 |
COP9 signalosome subunit 5 |
| chr19_-_50529193 | 0.84 |
ENST00000596445.1 ENST00000599538.1 |
VRK3 |
vaccinia related kinase 3 |
| chr5_-_137667459 | 0.84 |
ENST00000415130.2 ENST00000356505.3 ENST00000357274.3 ENST00000348983.3 ENST00000323760.6 |
CDC25C |
cell division cycle 25C |
| chr6_-_89827720 | 0.84 |
ENST00000452027.2 |
SRSF12 |
serine/arginine-rich splicing factor 12 |
| chr16_-_56485257 | 0.84 |
ENST00000300291.5 |
NUDT21 |
nudix (nucleoside diphosphate linked moiety X)-type motif 21 |
| chr9_+_139780942 | 0.83 |
ENST00000247668.2 ENST00000359662.3 |
TRAF2 |
TNF receptor-associated factor 2 |
| chr5_-_137667526 | 0.83 |
ENST00000503022.1 |
CDC25C |
cell division cycle 25C |
| chr11_+_34073757 | 0.83 |
ENST00000532820.1 |
CAPRIN1 |
cell cycle associated protein 1 |
| chr17_-_79869004 | 0.82 |
ENST00000573927.1 ENST00000331285.3 ENST00000572157.1 |
PCYT2 |
phosphate cytidylyltransferase 2, ethanolamine |
| chr9_-_132597529 | 0.82 |
ENST00000372447.3 |
C9orf78 |
chromosome 9 open reading frame 78 |
| chr6_-_35888824 | 0.82 |
ENST00000361690.3 ENST00000512445.1 |
SRPK1 |
SRSF protein kinase 1 |
| chr11_-_10829851 | 0.82 |
ENST00000532082.1 |
EIF4G2 |
eukaryotic translation initiation factor 4 gamma, 2 |
| chr11_+_34460447 | 0.81 |
ENST00000241052.4 |
CAT |
catalase |
| chr17_-_79869077 | 0.81 |
ENST00000570391.1 |
PCYT2 |
phosphate cytidylyltransferase 2, ethanolamine |
| chr1_+_174769006 | 0.80 |
ENST00000489615.1 |
RABGAP1L |
RAB GTPase activating protein 1-like |
| chr12_-_31479045 | 0.80 |
ENST00000539409.1 ENST00000395766.1 |
FAM60A |
family with sequence similarity 60, member A |
| chr7_+_155090271 | 0.79 |
ENST00000476756.1 |
INSIG1 |
insulin induced gene 1 |
| chr6_+_34725181 | 0.79 |
ENST00000244520.5 |
SNRPC |
small nuclear ribonucleoprotein polypeptide C |
| chr11_-_62474803 | 0.78 |
ENST00000533982.1 ENST00000360796.5 |
BSCL2 |
Berardinelli-Seip congenital lipodystrophy 2 (seipin) |
| chr3_-_138553779 | 0.78 |
ENST00000461451.1 |
PIK3CB |
phosphatidylinositol-4,5-bisphosphate 3-kinase, catalytic subunit beta |
| chr12_-_25055949 | 0.78 |
ENST00000539282.1 |
BCAT1 |
branched chain amino-acid transaminase 1, cytosolic |
| chr3_+_38495333 | 0.78 |
ENST00000352511.4 |
ACVR2B |
activin A receptor, type IIB |
| chr19_+_46850320 | 0.78 |
ENST00000391919.1 |
PPP5C |
protein phosphatase 5, catalytic subunit |
| chr5_+_68665608 | 0.78 |
ENST00000509734.1 ENST00000354868.5 ENST00000521422.1 ENST00000354312.3 ENST00000345306.6 |
RAD17 |
RAD17 homolog (S. pombe) |
| chr19_+_50432400 | 0.78 |
ENST00000423777.2 ENST00000600336.1 ENST00000597227.1 |
ATF5 |
activating transcription factor 5 |
| chr21_-_35284635 | 0.78 |
ENST00000429238.1 |
AP000304.12 |
AP000304.12 |
| chr2_+_97001491 | 0.76 |
ENST00000240423.4 ENST00000427946.1 ENST00000435975.1 ENST00000456906.1 ENST00000455200.1 |
NCAPH |
non-SMC condensin I complex, subunit H |
| chr18_+_268148 | 0.76 |
ENST00000581677.1 |
RP11-705O1.8 |
RP11-705O1.8 |
| chr10_+_35415719 | 0.76 |
ENST00000474362.1 ENST00000374721.3 |
CREM |
cAMP responsive element modulator |
| chr5_+_139781393 | 0.76 |
ENST00000360839.2 ENST00000297183.6 ENST00000421134.1 ENST00000394723.3 ENST00000511151.1 |
ANKHD1 |
ankyrin repeat and KH domain containing 1 |
| chr8_+_124084899 | 0.76 |
ENST00000287380.1 ENST00000309336.3 ENST00000519418.1 ENST00000327098.5 ENST00000522420.1 ENST00000521676.1 ENST00000378080.2 |
TBC1D31 |
TBC1 domain family, member 31 |
| chr1_-_762885 | 0.76 |
ENST00000536430.1 ENST00000473798.1 |
LINC00115 |
long intergenic non-protein coding RNA 115 |
| chr2_+_48010312 | 0.76 |
ENST00000540021.1 |
MSH6 |
mutS homolog 6 |
| chr17_+_58677539 | 0.76 |
ENST00000305921.3 |
PPM1D |
protein phosphatase, Mg2+/Mn2+ dependent, 1D |
| chr1_+_206808918 | 0.75 |
ENST00000367108.3 |
DYRK3 |
dual-specificity tyrosine-(Y)-phosphorylation regulated kinase 3 |
| chr16_-_31076332 | 0.75 |
ENST00000539836.3 ENST00000535577.1 ENST00000442862.2 |
ZNF668 |
zinc finger protein 668 |
| chr12_+_6603253 | 0.75 |
ENST00000382457.4 ENST00000545962.1 |
NCAPD2 |
non-SMC condensin I complex, subunit D2 |
| chr4_+_160188889 | 0.75 |
ENST00000264431.4 |
RAPGEF2 |
Rap guanine nucleotide exchange factor (GEF) 2 |
| chr11_+_7597639 | 0.74 |
ENST00000533792.1 |
PPFIBP2 |
PTPRF interacting protein, binding protein 2 (liprin beta 2) |
| chr19_-_50432654 | 0.74 |
ENST00000596680.1 ENST00000594673.1 ENST00000597029.1 |
NUP62 |
nucleoporin 62kDa |
| chr1_-_212208842 | 0.74 |
ENST00000366992.3 ENST00000366993.3 ENST00000440600.2 ENST00000366994.3 |
INTS7 |
integrator complex subunit 7 |
Gene Ontology Analysis
Gene overrepresentation in cellular_component category:
| Log-likelihood per target | Total log-likelihood | Term | Description |
|---|---|---|---|
| 0.7 | 2.7 | GO:0032301 | MutSalpha complex(GO:0032301) |
| 0.2 | 2.0 | GO:0033588 | Elongator holoenzyme complex(GO:0033588) |
| 0.2 | 0.6 | GO:0009330 | DNA topoisomerase complex (ATP-hydrolyzing)(GO:0009330) |
| 0.2 | 1.4 | GO:0032133 | chromosome passenger complex(GO:0032133) |
| 0.2 | 0.6 | GO:1990246 | uniplex complex(GO:1990246) |
| 0.2 | 0.6 | GO:1990423 | RZZ complex(GO:1990423) |
| 0.1 | 0.4 | GO:0071020 | post-spliceosomal complex(GO:0071020) |
| 0.1 | 1.9 | GO:0035631 | CD40 receptor complex(GO:0035631) |
| 0.1 | 1.6 | GO:0031464 | Cul4A-RING E3 ubiquitin ligase complex(GO:0031464) |
| 0.1 | 0.4 | GO:0098536 | deuterosome(GO:0098536) |
| 0.1 | 0.4 | GO:0097197 | tetraspanin-enriched microdomain(GO:0097197) |
| 0.1 | 0.7 | GO:1990023 | mitotic spindle midzone(GO:1990023) |
| 0.1 | 0.7 | GO:0097165 | nuclear stress granule(GO:0097165) |
| 0.1 | 1.1 | GO:0097431 | mitotic spindle pole(GO:0097431) |
| 0.1 | 0.5 | GO:0002169 | 3-methylcrotonyl-CoA carboxylase complex, mitochondrial(GO:0002169) methylcrotonoyl-CoA carboxylase complex(GO:1905202) |
| 0.1 | 1.2 | GO:0005847 | mRNA cleavage and polyadenylation specificity factor complex(GO:0005847) |
| 0.1 | 3.2 | GO:0035371 | microtubule plus-end(GO:0035371) |
| 0.1 | 0.4 | GO:0005726 | perichromatin fibrils(GO:0005726) |
| 0.1 | 0.9 | GO:0070938 | contractile ring(GO:0070938) |
| 0.1 | 1.1 | GO:0033093 | Weibel-Palade body(GO:0033093) |
| 0.1 | 0.3 | GO:0031213 | RSF complex(GO:0031213) |
| 0.1 | 0.7 | GO:0000125 | PCAF complex(GO:0000125) |
| 0.1 | 0.4 | GO:0045323 | interleukin-1 receptor complex(GO:0045323) |
| 0.1 | 2.3 | GO:0016581 | NuRD complex(GO:0016581) CHD-type complex(GO:0090545) |
| 0.1 | 0.7 | GO:0000796 | condensin complex(GO:0000796) |
| 0.1 | 0.4 | GO:0031429 | box H/ACA snoRNP complex(GO:0031429) box H/ACA RNP complex(GO:0072588) box H/ACA scaRNP complex(GO:0072589) box H/ACA telomerase RNP complex(GO:0090661) |
| 0.1 | 1.2 | GO:0044613 | nuclear pore central transport channel(GO:0044613) |
| 0.1 | 0.3 | GO:0001940 | male pronucleus(GO:0001940) |
| 0.1 | 0.3 | GO:0005968 | Rab-protein geranylgeranyltransferase complex(GO:0005968) |
| 0.1 | 0.6 | GO:0097255 | R2TP complex(GO:0097255) |
| 0.1 | 0.5 | GO:0045120 | pronucleus(GO:0045120) |
| 0.1 | 0.5 | GO:0032039 | integrator complex(GO:0032039) |
| 0.1 | 0.4 | GO:0070852 | cell body fiber(GO:0070852) |
| 0.1 | 0.5 | GO:0031616 | spindle pole centrosome(GO:0031616) |
| 0.1 | 1.5 | GO:0005680 | anaphase-promoting complex(GO:0005680) |
| 0.1 | 0.4 | GO:0072487 | MSL complex(GO:0072487) |
| 0.1 | 0.8 | GO:0017146 | NMDA selective glutamate receptor complex(GO:0017146) |
| 0.0 | 0.5 | GO:0044666 | MLL3/4 complex(GO:0044666) |
| 0.0 | 0.1 | GO:0048269 | methionine adenosyltransferase complex(GO:0048269) |
| 0.0 | 2.8 | GO:0045171 | intercellular bridge(GO:0045171) |
| 0.0 | 0.2 | GO:0044352 | pinosome(GO:0044352) macropinosome(GO:0044354) |
| 0.0 | 0.5 | GO:1990909 | catenin complex(GO:0016342) Wnt signalosome(GO:1990909) |
| 0.0 | 0.5 | GO:0000243 | commitment complex(GO:0000243) |
| 0.0 | 2.4 | GO:0005801 | cis-Golgi network(GO:0005801) |
| 0.0 | 0.4 | GO:0016602 | CCAAT-binding factor complex(GO:0016602) |
| 0.0 | 2.6 | GO:0031672 | A band(GO:0031672) |
| 0.0 | 0.3 | GO:0032389 | MutLalpha complex(GO:0032389) |
| 0.0 | 0.6 | GO:0005641 | nuclear envelope lumen(GO:0005641) |
| 0.0 | 0.3 | GO:0098645 | network-forming collagen trimer(GO:0098642) collagen network(GO:0098645) |
| 0.0 | 0.2 | GO:0030121 | AP-1 adaptor complex(GO:0030121) |
| 0.0 | 0.3 | GO:0005849 | mRNA cleavage factor complex(GO:0005849) |
| 0.0 | 0.2 | GO:0000836 | Hrd1p ubiquitin ligase complex(GO:0000836) |
| 0.0 | 0.4 | GO:0019773 | proteasome core complex, alpha-subunit complex(GO:0019773) |
| 0.0 | 0.2 | GO:0031232 | extrinsic component of external side of plasma membrane(GO:0031232) |
| 0.0 | 0.3 | GO:0031618 | nuclear pericentric heterochromatin(GO:0031618) |
| 0.0 | 0.5 | GO:0042622 | photoreceptor outer segment membrane(GO:0042622) |
| 0.0 | 0.2 | GO:0070545 | PeBoW complex(GO:0070545) |
| 0.0 | 3.3 | GO:0005913 | cell-cell adherens junction(GO:0005913) |
| 0.0 | 0.5 | GO:0031254 | uropod(GO:0001931) cell trailing edge(GO:0031254) |
| 0.0 | 0.5 | GO:0005885 | Arp2/3 protein complex(GO:0005885) |
| 0.0 | 0.2 | GO:0098554 | cytoplasmic side of endoplasmic reticulum membrane(GO:0098554) |
| 0.0 | 1.4 | GO:0044815 | DNA packaging complex(GO:0044815) |
| 0.0 | 0.9 | GO:1904115 | axon cytoplasm(GO:1904115) |
| 0.0 | 0.3 | GO:0070822 | Sin3-type complex(GO:0070822) |
| 0.0 | 0.2 | GO:0045254 | pyruvate dehydrogenase complex(GO:0045254) |
| 0.0 | 2.6 | GO:0000776 | kinetochore(GO:0000776) |
| 0.0 | 0.6 | GO:0005852 | eukaryotic translation initiation factor 3 complex(GO:0005852) |
| 0.0 | 1.0 | GO:0005876 | spindle microtubule(GO:0005876) |
| 0.0 | 0.4 | GO:0005736 | DNA-directed RNA polymerase I complex(GO:0005736) |
| 0.0 | 1.3 | GO:0031463 | Cul3-RING ubiquitin ligase complex(GO:0031463) |
| 0.0 | 0.5 | GO:0030140 | trans-Golgi network transport vesicle(GO:0030140) |
| 0.0 | 1.6 | GO:1904724 | tertiary granule lumen(GO:1904724) |
| 0.0 | 0.1 | GO:0071001 | U4/U6 snRNP(GO:0071001) |
| 0.0 | 0.2 | GO:0036038 | MKS complex(GO:0036038) |
| 0.0 | 1.1 | GO:0010494 | cytoplasmic stress granule(GO:0010494) |
| 0.0 | 0.1 | GO:0071986 | Ragulator complex(GO:0071986) |
| 0.0 | 0.3 | GO:0045277 | respiratory chain complex IV(GO:0045277) |
| 0.0 | 4.1 | GO:0005681 | spliceosomal complex(GO:0005681) |
| 0.0 | 0.4 | GO:0000930 | gamma-tubulin complex(GO:0000930) |
| 0.0 | 0.2 | GO:0043083 | synaptic cleft(GO:0043083) |
| 0.0 | 0.6 | GO:0000315 | organellar large ribosomal subunit(GO:0000315) mitochondrial large ribosomal subunit(GO:0005762) |
| 0.0 | 0.0 | GO:0031466 | Cul5-RING ubiquitin ligase complex(GO:0031466) |
| 0.0 | 0.1 | GO:0042105 | alpha-beta T cell receptor complex(GO:0042105) |
| 0.0 | 0.1 | GO:0036513 | Derlin-1 retrotranslocation complex(GO:0036513) |
| 0.0 | 1.3 | GO:0031093 | platelet alpha granule lumen(GO:0031093) |
| 0.0 | 0.5 | GO:1902555 | endoribonuclease complex(GO:1902555) |
| 0.0 | 0.1 | GO:1990037 | Lewy body core(GO:1990037) |
| 0.0 | 1.1 | GO:0005814 | centriole(GO:0005814) |
| 0.0 | 0.3 | GO:0071437 | invadopodium(GO:0071437) |
| 0.0 | 0.2 | GO:0005720 | nuclear heterochromatin(GO:0005720) |
| 0.0 | 0.1 | GO:0060077 | inhibitory synapse(GO:0060077) |
Gene overrepresentation in C2:CP category:
| Log-likelihood per target | Total log-likelihood | Term | Description |
|---|---|---|---|
| 0.1 | 9.9 | PID PLK1 PATHWAY | PLK1 signaling events |
| 0.1 | 4.0 | PID MYC PATHWAY | C-MYC pathway |
| 0.1 | 0.8 | PID FOXO PATHWAY | FoxO family signaling |
| 0.1 | 6.9 | PID FOXM1 PATHWAY | FOXM1 transcription factor network |
| 0.1 | 1.5 | PID ANGIOPOIETIN RECEPTOR PATHWAY | Angiopoietin receptor Tie2-mediated signaling |
| 0.1 | 4.2 | PID AURORA B PATHWAY | Aurora B signaling |
| 0.1 | 3.2 | PID ATM PATHWAY | ATM pathway |
| 0.1 | 0.7 | SA PROGRAMMED CELL DEATH | Programmed cell death, or apoptosis, eliminates damaged or unneeded cells. |
| 0.1 | 2.1 | ST WNT CA2 CYCLIC GMP PATHWAY | Wnt/Ca2+/cyclic GMP signaling. |
| 0.1 | 3.5 | PID CERAMIDE PATHWAY | Ceramide signaling pathway |
| 0.1 | 3.0 | PID TRAIL PATHWAY | TRAIL signaling pathway |
| 0.1 | 0.6 | SA FAS SIGNALING | The TNF-type receptor Fas induces apoptosis on ligand binding. |
| 0.1 | 1.3 | PID WNT CANONICAL PATHWAY | Canonical Wnt signaling pathway |
| 0.1 | 4.7 | PID E2F PATHWAY | E2F transcription factor network |
| 0.0 | 1.6 | PID RAS PATHWAY | Regulation of Ras family activation |
| 0.0 | 2.1 | PID TELOMERASE PATHWAY | Regulation of Telomerase |
| 0.0 | 2.1 | PID CASPASE PATHWAY | Caspase cascade in apoptosis |
| 0.0 | 0.9 | PID NECTIN PATHWAY | Nectin adhesion pathway |
| 0.0 | 0.8 | SIG CD40PATHWAYMAP | Genes related to CD40 signaling |
| 0.0 | 0.2 | PID EPO PATHWAY | EPO signaling pathway |
| 0.0 | 3.3 | PID SMAD2 3NUCLEAR PATHWAY | Regulation of nuclear SMAD2/3 signaling |
| 0.0 | 0.7 | PID PRL SIGNALING EVENTS PATHWAY | Signaling events mediated by PRL |
| 0.0 | 0.9 | PID FANCONI PATHWAY | Fanconi anemia pathway |
| 0.0 | 0.6 | PID FCER1 PATHWAY | Fc-epsilon receptor I signaling in mast cells |
| 0.0 | 1.0 | PID AR TF PATHWAY | Regulation of Androgen receptor activity |
| 0.0 | 0.8 | PID HIF1A PATHWAY | Hypoxic and oxygen homeostasis regulation of HIF-1-alpha |
| 0.0 | 0.4 | ST TUMOR NECROSIS FACTOR PATHWAY | Tumor Necrosis Factor Pathway. |
| 0.0 | 0.5 | PID CIRCADIAN PATHWAY | Circadian rhythm pathway |
| 0.0 | 0.3 | PID S1P S1P4 PATHWAY | S1P4 pathway |
| 0.0 | 1.3 | PID NFAT TFPATHWAY | Calcineurin-regulated NFAT-dependent transcription in lymphocytes |
| 0.0 | 0.9 | PID THROMBIN PAR1 PATHWAY | PAR1-mediated thrombin signaling events |
| 0.0 | 1.7 | PID AR PATHWAY | Coregulation of Androgen receptor activity |
| 0.0 | 0.7 | PID P38 ALPHA BETA DOWNSTREAM PATHWAY | Signaling mediated by p38-alpha and p38-beta |
| 0.0 | 1.7 | PID MYC ACTIV PATHWAY | Validated targets of C-MYC transcriptional activation |
| 0.0 | 1.4 | PID BETA CATENIN NUC PATHWAY | Regulation of nuclear beta catenin signaling and target gene transcription |
| 0.0 | 0.5 | SA MMP CYTOKINE CONNECTION | Cytokines can induce activation of matrix metalloproteinases, which degrade extracellular matrix. |
| 0.0 | 0.4 | PID TOLL ENDOGENOUS PATHWAY | Endogenous TLR signaling |
| 0.0 | 0.5 | SIG CHEMOTAXIS | Genes related to chemotaxis |
| 0.0 | 1.8 | PID ERBB1 DOWNSTREAM PATHWAY | ErbB1 downstream signaling |
| 0.0 | 0.3 | PID MAPK TRK PATHWAY | Trk receptor signaling mediated by the MAPK pathway |
| 0.0 | 0.3 | PID INSULIN GLUCOSE PATHWAY | Insulin-mediated glucose transport |
| 0.0 | 0.3 | PID RHOA PATHWAY | RhoA signaling pathway |
| 0.0 | 0.4 | PID SYNDECAN 2 PATHWAY | Syndecan-2-mediated signaling events |
| 0.0 | 0.2 | PID IL27 PATHWAY | IL27-mediated signaling events |
| 0.0 | 0.3 | PID DELTA NP63 PATHWAY | Validated transcriptional targets of deltaNp63 isoforms |
| 0.0 | 3.9 | NABA SECRETED FACTORS | Genes encoding secreted soluble factors |
| 0.0 | 0.5 | PID LKB1 PATHWAY | LKB1 signaling events |
Gene overrepresentation in molecular_function category:
| Log-likelihood per target | Total log-likelihood | Term | Description |
|---|---|---|---|
| 0.7 | 2.7 | GO:0032143 | single thymine insertion binding(GO:0032143) |
| 0.7 | 2.6 | GO:0032038 | myosin II heavy chain binding(GO:0032038) |
| 0.6 | 1.8 | GO:0008798 | beta-aspartyl-peptidase activity(GO:0008798) |
| 0.6 | 3.4 | GO:0008269 | JAK pathway signal transduction adaptor activity(GO:0008269) |
| 0.3 | 2.4 | GO:0019237 | centromeric DNA binding(GO:0019237) |
| 0.3 | 0.9 | GO:0015235 | cobalamin transporter activity(GO:0015235) |
| 0.2 | 0.9 | GO:0031694 | alpha-2A adrenergic receptor binding(GO:0031694) |
| 0.2 | 2.1 | GO:0016724 | ferroxidase activity(GO:0004322) oxidoreductase activity, oxidizing metal ions, oxygen as acceptor(GO:0016724) |
| 0.2 | 1.1 | GO:0052843 | endopolyphosphatase activity(GO:0000298) diphosphoinositol-polyphosphate diphosphatase activity(GO:0008486) bis(5'-adenosyl)-hexaphosphatase activity(GO:0034431) bis(5'-adenosyl)-pentaphosphatase activity(GO:0034432) inositol diphosphate tetrakisphosphate diphosphatase activity(GO:0052840) inositol bisdiphosphate tetrakisphosphate diphosphatase activity(GO:0052841) inositol diphosphate pentakisphosphate diphosphatase activity(GO:0052842) inositol-1-diphosphate-2,3,4,5,6-pentakisphosphate diphosphatase activity(GO:0052843) inositol-3-diphosphate-1,2,4,5,6-pentakisphosphate diphosphatase activity(GO:0052844) inositol-5-diphosphate-1,2,3,4,6-pentakisphosphate diphosphatase activity(GO:0052845) inositol-1,5-bisdiphosphate-2,3,4,6-tetrakisphosphate 1-diphosphatase activity(GO:0052846) inositol-1,5-bisdiphosphate-2,3,4,6-tetrakisphosphate 5-diphosphatase activity(GO:0052847) inositol-3,5-bisdiphosphate-2,3,4,6-tetrakisphosphate 5-diphosphatase activity(GO:0052848) |
| 0.2 | 0.6 | GO:0061505 | DNA topoisomerase type II (ATP-hydrolyzing) activity(GO:0003918) DNA topoisomerase II activity(GO:0061505) |
| 0.2 | 1.7 | GO:0001849 | complement component C1q binding(GO:0001849) |
| 0.2 | 0.6 | GO:0004719 | protein-L-isoaspartate (D-aspartate) O-methyltransferase activity(GO:0004719) |
| 0.2 | 0.8 | GO:0033265 | choline binding(GO:0033265) |
| 0.2 | 0.5 | GO:0004616 | phosphogluconate dehydrogenase (decarboxylating) activity(GO:0004616) |
| 0.2 | 0.5 | GO:0030627 | pre-mRNA 5'-splice site binding(GO:0030627) |
| 0.2 | 0.5 | GO:0000386 | second spliceosomal transesterification activity(GO:0000386) |
| 0.2 | 1.8 | GO:0030274 | LIM domain binding(GO:0030274) |
| 0.2 | 0.5 | GO:0004345 | glucose-6-phosphate dehydrogenase activity(GO:0004345) |
| 0.1 | 1.2 | GO:0008379 | thioredoxin peroxidase activity(GO:0008379) |
| 0.1 | 0.6 | GO:0044729 | hemi-methylated DNA-binding(GO:0044729) |
| 0.1 | 0.3 | GO:0001034 | RNA polymerase III transcription factor activity, sequence-specific DNA binding(GO:0001034) |
| 0.1 | 0.9 | GO:0071933 | Arp2/3 complex binding(GO:0071933) |
| 0.1 | 0.5 | GO:0010465 | nerve growth factor receptor activity(GO:0010465) |
| 0.1 | 0.6 | GO:0043141 | ATP-dependent 5'-3' DNA helicase activity(GO:0043141) |
| 0.1 | 1.7 | GO:0031996 | thioesterase binding(GO:0031996) |
| 0.1 | 0.5 | GO:0004485 | methylcrotonoyl-CoA carboxylase activity(GO:0004485) |
| 0.1 | 0.6 | GO:0003998 | acylphosphatase activity(GO:0003998) |
| 0.1 | 1.7 | GO:0003680 | AT DNA binding(GO:0003680) |
| 0.1 | 0.3 | GO:0047275 | glucosaminylgalactosylglucosylceramide beta-galactosyltransferase activity(GO:0047275) |
| 0.1 | 0.5 | GO:0043023 | ribosomal large subunit binding(GO:0043023) |
| 0.1 | 0.3 | GO:0032138 | single base insertion or deletion binding(GO:0032138) |
| 0.1 | 0.5 | GO:0032296 | ribonuclease III activity(GO:0004525) double-stranded RNA-specific ribonuclease activity(GO:0032296) |
| 0.1 | 1.0 | GO:0031386 | protein tag(GO:0031386) |
| 0.1 | 0.3 | GO:0030337 | DNA polymerase processivity factor activity(GO:0030337) |
| 0.1 | 1.2 | GO:0008140 | cAMP response element binding protein binding(GO:0008140) |
| 0.1 | 0.4 | GO:0004306 | ethanolamine-phosphate cytidylyltransferase activity(GO:0004306) |
| 0.1 | 0.3 | GO:0004743 | pyruvate kinase activity(GO:0004743) |
| 0.1 | 0.4 | GO:0034513 | box H/ACA snoRNA binding(GO:0034513) |
| 0.1 | 1.4 | GO:0070001 | aspartic-type endopeptidase activity(GO:0004190) aspartic-type peptidase activity(GO:0070001) |
| 0.1 | 0.3 | GO:0047708 | biotinidase activity(GO:0047708) |
| 0.1 | 0.2 | GO:0004514 | nicotinate-nucleotide diphosphorylase (carboxylating) activity(GO:0004514) |
| 0.1 | 0.3 | GO:0038062 | protein tyrosine kinase collagen receptor activity(GO:0038062) |
| 0.1 | 0.2 | GO:0004739 | pyruvate dehydrogenase (acetyl-transferring) activity(GO:0004739) |
| 0.1 | 0.2 | GO:0004819 | glutamine-tRNA ligase activity(GO:0004819) |
| 0.1 | 0.6 | GO:0019784 | NEDD8-specific protease activity(GO:0019784) |
| 0.1 | 0.2 | GO:0047391 | alkylglycerophosphoethanolamine phosphodiesterase activity(GO:0047391) |
| 0.1 | 0.3 | GO:0003960 | NADPH:quinone reductase activity(GO:0003960) |
| 0.1 | 0.5 | GO:0046976 | histone methyltransferase activity (H3-K27 specific)(GO:0046976) |
| 0.1 | 1.7 | GO:0008574 | ATP-dependent microtubule motor activity, plus-end-directed(GO:0008574) |
| 0.1 | 0.7 | GO:0042043 | neurexin family protein binding(GO:0042043) |
| 0.0 | 0.2 | GO:0047237 | glucuronylgalactosylproteoglycan 4-beta-N-acetylgalactosaminyltransferase activity(GO:0047237) |
| 0.0 | 0.3 | GO:0010997 | anaphase-promoting complex binding(GO:0010997) |
| 0.0 | 0.7 | GO:0030280 | structural constituent of epidermis(GO:0030280) |
| 0.0 | 0.3 | GO:0008559 | xenobiotic-transporting ATPase activity(GO:0008559) |
| 0.0 | 0.3 | GO:0004849 | uridine kinase activity(GO:0004849) |
| 0.0 | 0.7 | GO:0005095 | GTPase inhibitor activity(GO:0005095) |
| 0.0 | 0.3 | GO:0004169 | dolichyl-phosphate-mannose-protein mannosyltransferase activity(GO:0004169) |
| 0.0 | 0.2 | GO:0015254 | glycerol channel activity(GO:0015254) |
| 0.0 | 0.6 | GO:0008139 | nuclear localization sequence binding(GO:0008139) |
| 0.0 | 1.1 | GO:0031489 | myosin V binding(GO:0031489) |
| 0.0 | 1.2 | GO:0017056 | structural constituent of nuclear pore(GO:0017056) |
| 0.0 | 1.7 | GO:0050699 | WW domain binding(GO:0050699) |
| 0.0 | 1.9 | GO:0008536 | Ran GTPase binding(GO:0008536) |
| 0.0 | 0.1 | GO:0032184 | SUMO polymer binding(GO:0032184) |
| 0.0 | 0.6 | GO:0055056 | D-glucose transmembrane transporter activity(GO:0055056) |
| 0.0 | 0.4 | GO:1990825 | sequence-specific mRNA binding(GO:1990825) |
| 0.0 | 0.3 | GO:0004046 | aminoacylase activity(GO:0004046) |
| 0.0 | 0.2 | GO:0008240 | tripeptidyl-peptidase activity(GO:0008240) peptidyl-dipeptidase activity(GO:0008241) |
| 0.0 | 0.6 | GO:0008494 | translation activator activity(GO:0008494) |
| 0.0 | 0.4 | GO:0034056 | estrogen response element binding(GO:0034056) |
| 0.0 | 0.4 | GO:0036122 | BMP binding(GO:0036122) |
| 0.0 | 0.4 | GO:0008266 | poly(U) RNA binding(GO:0008266) |
| 0.0 | 0.4 | GO:0016861 | intramolecular oxidoreductase activity, interconverting aldoses and ketoses(GO:0016861) |
| 0.0 | 0.4 | GO:0004017 | adenylate kinase activity(GO:0004017) |
| 0.0 | 1.0 | GO:0070717 | poly-purine tract binding(GO:0070717) |
| 0.0 | 0.2 | GO:0070181 | small ribosomal subunit rRNA binding(GO:0070181) |
| 0.0 | 0.3 | GO:0031419 | cobalamin binding(GO:0031419) |
| 0.0 | 0.2 | GO:0015165 | pyrimidine nucleotide-sugar transmembrane transporter activity(GO:0015165) |
| 0.0 | 0.2 | GO:0003689 | DNA clamp loader activity(GO:0003689) protein-DNA loading ATPase activity(GO:0033170) |
| 0.0 | 0.8 | GO:0019198 | transmembrane receptor protein tyrosine phosphatase activity(GO:0005001) transmembrane receptor protein phosphatase activity(GO:0019198) |
| 0.0 | 0.5 | GO:0045295 | gamma-catenin binding(GO:0045295) |
| 0.0 | 0.1 | GO:0001641 | group II metabotropic glutamate receptor activity(GO:0001641) |
| 0.0 | 1.6 | GO:0070888 | E-box binding(GO:0070888) |
| 0.0 | 0.1 | GO:1904288 | BAT3 complex binding(GO:1904288) |
| 0.0 | 0.1 | GO:0016933 | extracellular-glycine-gated ion channel activity(GO:0016933) extracellular-glycine-gated chloride channel activity(GO:0016934) |
| 0.0 | 0.2 | GO:0070087 | chromo shadow domain binding(GO:0070087) |
| 0.0 | 0.4 | GO:0001054 | RNA polymerase I activity(GO:0001054) |
| 0.0 | 0.5 | GO:0042609 | CD4 receptor binding(GO:0042609) |
| 0.0 | 0.4 | GO:0043422 | protein kinase B binding(GO:0043422) |
| 0.0 | 0.4 | GO:0070628 | proteasome binding(GO:0070628) |
| 0.0 | 0.1 | GO:0015218 | pyrimidine nucleotide transmembrane transporter activity(GO:0015218) |
| 0.0 | 0.5 | GO:0003841 | 1-acylglycerol-3-phosphate O-acyltransferase activity(GO:0003841) |
| 0.0 | 0.0 | GO:0004530 | deoxyribonuclease I activity(GO:0004530) |
| 0.0 | 0.2 | GO:0035174 | histone serine kinase activity(GO:0035174) |
| 0.0 | 0.1 | GO:0000268 | peroxisome targeting sequence binding(GO:0000268) |
| 0.0 | 0.1 | GO:0030621 | U4 snRNA binding(GO:0030621) |
| 0.0 | 0.2 | GO:0004784 | superoxide dismutase activity(GO:0004784) oxidoreductase activity, acting on superoxide radicals as acceptor(GO:0016721) |
| 0.0 | 0.1 | GO:0004376 | glycolipid mannosyltransferase activity(GO:0004376) |
| 0.0 | 0.2 | GO:0043996 | histone acetyltransferase activity (H4-K5 specific)(GO:0043995) histone acetyltransferase activity (H4-K8 specific)(GO:0043996) histone acetyltransferase activity (H4-K16 specific)(GO:0046972) |
| 0.0 | 0.9 | GO:0008138 | protein tyrosine/serine/threonine phosphatase activity(GO:0008138) |
| 0.0 | 0.4 | GO:0005072 | transforming growth factor beta receptor, cytoplasmic mediator activity(GO:0005072) |
| 0.0 | 0.2 | GO:0030620 | U2 snRNA binding(GO:0030620) |
| 0.0 | 0.1 | GO:0070361 | mitochondrial light strand promoter anti-sense binding(GO:0070361) mitochondrial heavy strand promoter anti-sense binding(GO:0070362) mitochondrial heavy strand promoter sense binding(GO:0070364) |
| 0.0 | 0.3 | GO:0019992 | diacylglycerol binding(GO:0019992) |
| 0.0 | 0.3 | GO:0070513 | death domain binding(GO:0070513) |
| 0.0 | 0.4 | GO:0051537 | 2 iron, 2 sulfur cluster binding(GO:0051537) |
| 0.0 | 0.2 | GO:1990381 | ubiquitin-specific protease binding(GO:1990381) |
| 0.0 | 0.1 | GO:0052650 | NADP-retinol dehydrogenase activity(GO:0052650) |
| 0.0 | 0.2 | GO:0035925 | mRNA 3'-UTR AU-rich region binding(GO:0035925) |
| 0.0 | 0.1 | GO:0031727 | CCR2 chemokine receptor binding(GO:0031727) |
| 0.0 | 0.1 | GO:0016520 | growth hormone-releasing hormone receptor activity(GO:0016520) |
| 0.0 | 1.2 | GO:0004004 | ATP-dependent RNA helicase activity(GO:0004004) |
| 0.0 | 0.8 | GO:0008009 | chemokine activity(GO:0008009) |
| 0.0 | 0.1 | GO:0042608 | T cell receptor binding(GO:0042608) |
| 0.0 | 0.1 | GO:0070735 | protein-glycine ligase activity(GO:0070735) |
| 0.0 | 0.2 | GO:0004550 | nucleoside diphosphate kinase activity(GO:0004550) |
| 0.0 | 0.2 | GO:0015095 | magnesium ion transmembrane transporter activity(GO:0015095) |
| 0.0 | 0.5 | GO:0043015 | gamma-tubulin binding(GO:0043015) |
| 0.0 | 0.7 | GO:0019894 | kinesin binding(GO:0019894) |
| 0.0 | 0.1 | GO:0005007 | fibroblast growth factor-activated receptor activity(GO:0005007) |
| 0.0 | 0.4 | GO:0004298 | threonine-type endopeptidase activity(GO:0004298) threonine-type peptidase activity(GO:0070003) |
| 0.0 | 0.1 | GO:0060698 | endoribonuclease inhibitor activity(GO:0060698) |
| 0.0 | 0.3 | GO:0005092 | GDP-dissociation inhibitor activity(GO:0005092) |
| 0.0 | 0.2 | GO:0005149 | interleukin-1 receptor binding(GO:0005149) |
| 0.0 | 0.5 | GO:0005164 | tumor necrosis factor receptor binding(GO:0005164) |
| 0.0 | 0.6 | GO:0005544 | calcium-dependent phospholipid binding(GO:0005544) |
| 0.0 | 0.1 | GO:0071532 | ankyrin repeat binding(GO:0071532) |
| 0.0 | 0.1 | GO:0043024 | ribosomal small subunit binding(GO:0043024) |
| 0.0 | 0.4 | GO:0004003 | ATP-dependent DNA helicase activity(GO:0004003) |
| 0.0 | 0.3 | GO:0031418 | L-ascorbic acid binding(GO:0031418) |
| 0.0 | 0.1 | GO:0042731 | PH domain binding(GO:0042731) |
| 0.0 | 0.1 | GO:0034594 | inositol-polyphosphate 5-phosphatase activity(GO:0004445) phosphatidylinositol-3,4,5-trisphosphate 5-phosphatase activity(GO:0034485) phosphatidylinositol trisphosphate phosphatase activity(GO:0034594) |
Gene overrepresentation in C2:CP:REACTOME category:
| Log-likelihood per target | Total log-likelihood | Term | Description |
|---|---|---|---|
| 0.1 | 2.8 | REACTOME CS DS DEGRADATION | Genes involved in CS/DS degradation |
| 0.1 | 1.2 | REACTOME SIGNALING BY FGFR3 MUTANTS | Genes involved in Signaling by FGFR3 mutants |
| 0.1 | 2.7 | REACTOME ERK MAPK TARGETS | Genes involved in ERK/MAPK targets |
| 0.1 | 1.3 | REACTOME TRANSLOCATION OF ZAP 70 TO IMMUNOLOGICAL SYNAPSE | Genes involved in Translocation of ZAP-70 to Immunological synapse |
| 0.0 | 1.1 | REACTOME BRANCHED CHAIN AMINO ACID CATABOLISM | Genes involved in Branched-chain amino acid catabolism |
| 0.0 | 0.7 | REACTOME CRMPS IN SEMA3A SIGNALING | Genes involved in CRMPs in Sema3A signaling |
| 0.0 | 0.3 | REACTOME MEMBRANE BINDING AND TARGETTING OF GAG PROTEINS | Genes involved in Membrane binding and targetting of GAG proteins |
| 0.0 | 0.4 | REACTOME ORGANIC CATION ANION ZWITTERION TRANSPORT | Genes involved in Organic cation/anion/zwitterion transport |
| 0.0 | 0.8 | REACTOME EFFECTS OF PIP2 HYDROLYSIS | Genes involved in Effects of PIP2 hydrolysis |
| 0.0 | 1.1 | REACTOME COLLAGEN FORMATION | Genes involved in Collagen formation |
| 0.0 | 0.2 | REACTOME ACYL CHAIN REMODELLING OF PG | Genes involved in Acyl chain remodelling of PG |
| 0.0 | 0.3 | REACTOME INFLAMMASOMES | Genes involved in Inflammasomes |
| 0.0 | 0.1 | REACTOME TRYPTOPHAN CATABOLISM | Genes involved in Tryptophan catabolism |
| 0.0 | 0.4 | REACTOME NUCLEOTIDE BINDING DOMAIN LEUCINE RICH REPEAT CONTAINING RECEPTOR NLR SIGNALING PATHWAYS | Genes involved in Nucleotide-binding domain, leucine rich repeat containing receptor (NLR) signaling pathways |
| 0.0 | 0.4 | REACTOME SULFUR AMINO ACID METABOLISM | Genes involved in Sulfur amino acid metabolism |
Gene overrepresentation in C2:CP category:
| Log-likelihood per target | Total log-likelihood | Term | Description |
|---|---|---|---|
| 0.1 | 4.5 | ST MYOCYTE AD PATHWAY | Myocyte Adrenergic Pathway is a specific case of the generalized Adrenergic Pathway. |
| 0.1 | 2.8 | NABA PROTEOGLYCANS | Genes encoding proteoglycans |
| 0.0 | 2.7 | PID HDAC CLASSII PATHWAY | Signaling events mediated by HDAC Class II |
| 0.0 | 2.5 | SIG CD40PATHWAYMAP | Genes related to CD40 signaling |
| 0.0 | 0.8 | PID CONE PATHWAY | Visual signal transduction: Cones |
| 0.0 | 0.6 | PID TAP63 PATHWAY | Validated transcriptional targets of TAp63 isoforms |
| 0.0 | 1.1 | NABA COLLAGENS | Genes encoding collagen proteins |
| 0.0 | 1.2 | PID GLYPICAN 1PATHWAY | Glypican 1 network |
| 0.0 | 1.6 | PID ILK PATHWAY | Integrin-linked kinase signaling |
| 0.0 | 1.0 | PID AJDISS 2PATHWAY | Posttranslational regulation of adherens junction stability and dissassembly |
| 0.0 | 0.8 | PID TXA2PATHWAY | Thromboxane A2 receptor signaling |
| 0.0 | 0.3 | PID ARF 3PATHWAY | Arf1 pathway |
| 0.0 | 0.5 | PID RAS PATHWAY | Regulation of Ras family activation |
| 0.0 | 0.1 | PID RANBP2 PATHWAY | Sumoylation by RanBP2 regulates transcriptional repression |
| 0.0 | 0.6 | SIG BCR SIGNALING PATHWAY | Members of the BCR signaling pathway |
Gene overrepresentation in biological_process category:
| Log-likelihood per target | Total log-likelihood | Term | Description |
|---|---|---|---|
| 1.1 | 3.3 | GO:0031133 | regulation of axon diameter(GO:0031133) |
| 0.9 | 3.6 | GO:0090579 | transcriptional activation by promoter-enhancer looping(GO:0071733) gene looping(GO:0090202) dsDNA loop formation(GO:0090579) |
| 0.6 | 2.5 | GO:0051754 | meiotic sister chromatid cohesion, centromeric(GO:0051754) |
| 0.6 | 1.2 | GO:2001160 | regulation of histone H3-K79 methylation(GO:2001160) positive regulation of histone H3-K79 methylation(GO:2001162) |
| 0.6 | 1.7 | GO:0006172 | ADP biosynthetic process(GO:0006172) |
| 0.6 | 2.8 | GO:0006398 | mRNA 3'-end processing by stem-loop binding and cleavage(GO:0006398) |
| 0.6 | 5.6 | GO:0019695 | choline metabolic process(GO:0019695) |
| 0.5 | 1.6 | GO:1901536 | regulation of DNA demethylation(GO:1901535) negative regulation of DNA demethylation(GO:1901536) regulation of genetic imprinting(GO:2000653) |
| 0.5 | 2.0 | GO:0022027 | interkinetic nuclear migration(GO:0022027) |
| 0.5 | 3.5 | GO:1904044 | response to oxygen-glucose deprivation(GO:0090649) cellular response to oxygen-glucose deprivation(GO:0090650) response to aldosterone(GO:1904044) |
| 0.5 | 2.0 | GO:0032954 | regulation of cytokinetic process(GO:0032954) regulation of mitotic cytokinetic process(GO:1903436) positive regulation of mitotic cytokinetic process(GO:1903438) positive regulation of mitotic cytokinesis(GO:1903490) |
| 0.5 | 2.9 | GO:0006561 | proline biosynthetic process(GO:0006561) L-proline biosynthetic process(GO:0055129) |
| 0.5 | 8.6 | GO:0035020 | regulation of Rac protein signal transduction(GO:0035020) |
| 0.5 | 1.4 | GO:0036333 | hepatocyte homeostasis(GO:0036333) response to tetrachloromethane(GO:1904772) |
| 0.5 | 2.7 | GO:0061086 | negative regulation of histone H3-K27 methylation(GO:0061086) positive regulation of histone H3-K27 methylation(GO:0061087) |
| 0.4 | 1.3 | GO:2000048 | negative regulation of cell-cell adhesion mediated by cadherin(GO:2000048) |
| 0.4 | 1.7 | GO:0072166 | posterior mesonephric tubule development(GO:0072166) negative regulation of metanephric glomerulus development(GO:0072299) negative regulation of metanephric glomerular mesangial cell proliferation(GO:0072302) |
| 0.4 | 2.1 | GO:0035617 | stress granule disassembly(GO:0035617) |
| 0.4 | 1.5 | GO:1902361 | mitochondrial pyruvate transport(GO:0006850) mitochondrial pyruvate transmembrane transport(GO:1902361) |
| 0.4 | 1.4 | GO:0046271 | phenylpropanoid catabolic process(GO:0046271) |
| 0.4 | 2.5 | GO:0006642 | triglyceride mobilization(GO:0006642) |
| 0.4 | 1.8 | GO:1901911 | diadenosine polyphosphate catabolic process(GO:0015961) diphosphoinositol polyphosphate metabolic process(GO:0071543) diadenosine pentaphosphate metabolic process(GO:1901906) diadenosine pentaphosphate catabolic process(GO:1901907) diadenosine hexaphosphate metabolic process(GO:1901908) diadenosine hexaphosphate catabolic process(GO:1901909) adenosine 5'-(hexahydrogen pentaphosphate) metabolic process(GO:1901910) adenosine 5'-(hexahydrogen pentaphosphate) catabolic process(GO:1901911) |
| 0.3 | 1.3 | GO:0030259 | lipid glycosylation(GO:0030259) |
| 0.3 | 1.3 | GO:0045829 | negative regulation of isotype switching(GO:0045829) |
| 0.3 | 1.6 | GO:0050882 | voluntary musculoskeletal movement(GO:0050882) |
| 0.3 | 3.0 | GO:0000395 | mRNA 5'-splice site recognition(GO:0000395) |
| 0.3 | 2.0 | GO:1903435 | positive regulation of constitutive secretory pathway(GO:1903435) |
| 0.3 | 0.7 | GO:0010826 | negative regulation of centrosome duplication(GO:0010826) |
| 0.3 | 1.0 | GO:0006421 | asparaginyl-tRNA aminoacylation(GO:0006421) |
| 0.3 | 0.6 | GO:0070601 | centromeric sister chromatid cohesion(GO:0070601) |
| 0.3 | 0.6 | GO:0036166 | phenotypic switching(GO:0036166) regulation of phenotypic switching(GO:1900239) |
| 0.3 | 1.5 | GO:0033591 | response to L-ascorbic acid(GO:0033591) |
| 0.3 | 0.8 | GO:0060061 | Spemann organizer formation(GO:0060061) |
| 0.3 | 2.2 | GO:0010032 | meiotic chromosome condensation(GO:0010032) |
| 0.3 | 1.4 | GO:0030997 | regulation of centriole-centriole cohesion(GO:0030997) |
| 0.3 | 1.1 | GO:0046035 | CMP salvage(GO:0006238) CMP biosynthetic process(GO:0009224) CMP metabolic process(GO:0046035) |
| 0.3 | 0.8 | GO:1901301 | regulation of cargo loading into COPII-coated vesicle(GO:1901301) |
| 0.3 | 5.2 | GO:0016180 | snRNA processing(GO:0016180) |
| 0.3 | 2.6 | GO:0051096 | positive regulation of helicase activity(GO:0051096) |
| 0.3 | 1.5 | GO:2000324 | positive regulation of glucocorticoid receptor signaling pathway(GO:2000324) |
| 0.3 | 0.8 | GO:0016260 | selenocysteine biosynthetic process(GO:0016260) |
| 0.2 | 0.7 | GO:1900377 | negative regulation of melanin biosynthetic process(GO:0048022) negative regulation of secondary metabolite biosynthetic process(GO:1900377) |
| 0.2 | 1.7 | GO:0035331 | negative regulation of hippo signaling(GO:0035331) |
| 0.2 | 0.7 | GO:0010793 | regulation of mRNA export from nucleus(GO:0010793) |
| 0.2 | 1.7 | GO:0035799 | ureter maturation(GO:0035799) |
| 0.2 | 0.7 | GO:0044376 | RNA polymerase II complex import to nucleus(GO:0044376) RNA polymerase III complex localization to nucleus(GO:1990022) |
| 0.2 | 0.5 | GO:0046601 | positive regulation of centriole replication(GO:0046601) |
| 0.2 | 0.4 | GO:1901976 | regulation of cell cycle checkpoint(GO:1901976) regulation of DNA damage checkpoint(GO:2000001) |
| 0.2 | 0.7 | GO:1901859 | negative regulation of mitochondrial DNA replication(GO:0090298) negative regulation of mitochondrial DNA metabolic process(GO:1901859) |
| 0.2 | 0.6 | GO:0006404 | RNA import into nucleus(GO:0006404) |
| 0.2 | 0.8 | GO:1903719 | regulation of I-kappaB phosphorylation(GO:1903719) positive regulation of I-kappaB phosphorylation(GO:1903721) |
| 0.2 | 1.4 | GO:0070934 | CRD-mediated mRNA stabilization(GO:0070934) |
| 0.2 | 4.0 | GO:1902894 | negative regulation of pri-miRNA transcription from RNA polymerase II promoter(GO:1902894) |
| 0.2 | 0.6 | GO:1903566 | positive regulation of protein localization to cilium(GO:1903566) |
| 0.2 | 1.1 | GO:0051013 | microtubule severing(GO:0051013) |
| 0.2 | 1.5 | GO:0006528 | asparagine metabolic process(GO:0006528) |
| 0.2 | 0.9 | GO:0071233 | cellular response to leucine(GO:0071233) |
| 0.2 | 0.7 | GO:1901895 | negative regulation of calcium-transporting ATPase activity(GO:1901895) |
| 0.2 | 0.5 | GO:0045900 | negative regulation of translational elongation(GO:0045900) |
| 0.2 | 0.7 | GO:1900533 | medium-chain fatty-acyl-CoA catabolic process(GO:0036114) long-chain fatty-acyl-CoA catabolic process(GO:0036116) palmitic acid metabolic process(GO:1900533) palmitic acid biosynthetic process(GO:1900535) |
| 0.2 | 0.7 | GO:0033634 | positive regulation of cell-cell adhesion mediated by integrin(GO:0033634) |
| 0.2 | 0.5 | GO:0003257 | positive regulation of transcription from RNA polymerase II promoter involved in myocardial precursor cell differentiation(GO:0003257) mesoderm migration involved in gastrulation(GO:0007509) positive regulation of transcription from RNA polymerase II promoter involved in heart development(GO:1901228) |
| 0.2 | 4.4 | GO:0034453 | microtubule anchoring(GO:0034453) |
| 0.2 | 0.7 | GO:0031339 | negative regulation of vesicle fusion(GO:0031339) |
| 0.2 | 1.3 | GO:0042364 | water-soluble vitamin biosynthetic process(GO:0042364) |
| 0.2 | 0.9 | GO:0071816 | tail-anchored membrane protein insertion into ER membrane(GO:0071816) |
| 0.2 | 0.8 | GO:0033031 | positive regulation of neutrophil apoptotic process(GO:0033031) |
| 0.2 | 0.6 | GO:0002884 | type IV hypersensitivity(GO:0001806) regulation of type IV hypersensitivity(GO:0001807) negative regulation of hypersensitivity(GO:0002884) |
| 0.2 | 0.8 | GO:0033314 | mitotic DNA replication checkpoint(GO:0033314) |
| 0.2 | 0.2 | GO:0046668 | regulation of retinal cell programmed cell death(GO:0046668) |
| 0.2 | 0.6 | GO:0032053 | ciliary basal body organization(GO:0032053) |
| 0.2 | 0.6 | GO:0035519 | protein K29-linked ubiquitination(GO:0035519) |
| 0.1 | 0.4 | GO:0048936 | peripheral nervous system neuron axonogenesis(GO:0048936) |
| 0.1 | 0.4 | GO:0097112 | gamma-aminobutyric acid receptor clustering(GO:0097112) |
| 0.1 | 0.4 | GO:0070407 | oxidation-dependent protein catabolic process(GO:0070407) |
| 0.1 | 0.3 | GO:0014029 | neural crest formation(GO:0014029) |
| 0.1 | 2.3 | GO:0007064 | mitotic sister chromatid cohesion(GO:0007064) |
| 0.1 | 0.4 | GO:2000118 | regulation of sodium-dependent phosphate transport(GO:2000118) |
| 0.1 | 1.1 | GO:0045905 | translational frameshifting(GO:0006452) positive regulation of translational termination(GO:0045905) |
| 0.1 | 4.1 | GO:0061003 | positive regulation of dendritic spine morphogenesis(GO:0061003) |
| 0.1 | 1.4 | GO:0006268 | DNA unwinding involved in DNA replication(GO:0006268) |
| 0.1 | 0.4 | GO:0036090 | cleavage furrow ingression(GO:0036090) |
| 0.1 | 0.7 | GO:0033564 | anterior/posterior axon guidance(GO:0033564) |
| 0.1 | 0.4 | GO:0014022 | neural plate elongation(GO:0014022) convergent extension involved in neural plate elongation(GO:0022007) |
| 0.1 | 1.2 | GO:0046784 | viral mRNA export from host cell nucleus(GO:0046784) |
| 0.1 | 1.4 | GO:0071763 | nuclear membrane organization(GO:0071763) |
| 0.1 | 0.4 | GO:0006106 | fumarate metabolic process(GO:0006106) aspartate catabolic process(GO:0006533) L-kynurenine metabolic process(GO:0097052) |
| 0.1 | 0.4 | GO:0061110 | histone H3-T6 phosphorylation(GO:0035408) dense core granule biogenesis(GO:0061110) regulation of dense core granule biogenesis(GO:2000705) |
| 0.1 | 0.8 | GO:0009082 | branched-chain amino acid biosynthetic process(GO:0009082) leucine biosynthetic process(GO:0009098) valine biosynthetic process(GO:0009099) |
| 0.1 | 3.6 | GO:0050855 | regulation of B cell receptor signaling pathway(GO:0050855) |
| 0.1 | 0.4 | GO:0000294 | nuclear-transcribed mRNA catabolic process, endonucleolytic cleavage-dependent decay(GO:0000294) |
| 0.1 | 2.1 | GO:0035970 | peptidyl-threonine dephosphorylation(GO:0035970) |
| 0.1 | 0.4 | GO:2000015 | regulation of determination of dorsal identity(GO:2000015) |
| 0.1 | 0.8 | GO:1901029 | negative regulation of mitochondrial outer membrane permeabilization involved in apoptotic signaling pathway(GO:1901029) |
| 0.1 | 0.6 | GO:0014886 | transition between slow and fast fiber(GO:0014886) |
| 0.1 | 1.9 | GO:0030854 | positive regulation of granulocyte differentiation(GO:0030854) |
| 0.1 | 0.5 | GO:0019918 | peptidyl-arginine methylation, to symmetrical-dimethyl arginine(GO:0019918) |
| 0.1 | 0.5 | GO:0051958 | methotrexate transport(GO:0051958) reduced folate transmembrane transport(GO:0098838) |
| 0.1 | 1.6 | GO:0006646 | phosphatidylethanolamine biosynthetic process(GO:0006646) |
| 0.1 | 2.3 | GO:0019372 | lipoxygenase pathway(GO:0019372) |
| 0.1 | 0.4 | GO:0045921 | positive regulation of exocytosis(GO:0045921) |
| 0.1 | 0.6 | GO:0060136 | embryonic process involved in female pregnancy(GO:0060136) |
| 0.1 | 0.7 | GO:0060480 | lung goblet cell differentiation(GO:0060480) |
| 0.1 | 0.7 | GO:0060154 | cellular process regulating host cell cycle in response to virus(GO:0060154) |
| 0.1 | 0.7 | GO:0048255 | RNA stabilization(GO:0043489) mRNA stabilization(GO:0048255) |
| 0.1 | 0.6 | GO:0019262 | N-acetylneuraminate catabolic process(GO:0019262) |
| 0.1 | 0.3 | GO:0031446 | regulation of fast-twitch skeletal muscle fiber contraction(GO:0031446) positive regulation of fast-twitch skeletal muscle fiber contraction(GO:0031448) |
| 0.1 | 0.3 | GO:0021718 | superior olivary nucleus development(GO:0021718) superior olivary nucleus maturation(GO:0021722) |
| 0.1 | 0.7 | GO:0098789 | pre-mRNA cleavage required for polyadenylation(GO:0098789) |
| 0.1 | 0.7 | GO:0002326 | B cell lineage commitment(GO:0002326) |
| 0.1 | 0.3 | GO:0034124 | regulation of MyD88-dependent toll-like receptor signaling pathway(GO:0034124) |
| 0.1 | 1.1 | GO:0000463 | maturation of LSU-rRNA from tricistronic rRNA transcript (SSU-rRNA, 5.8S rRNA, LSU-rRNA)(GO:0000463) |
| 0.1 | 0.4 | GO:1901490 | regulation of lymphangiogenesis(GO:1901490) |
| 0.1 | 0.3 | GO:0001831 | trophectodermal cellular morphogenesis(GO:0001831) |
| 0.1 | 1.5 | GO:0033234 | negative regulation of protein sumoylation(GO:0033234) |
| 0.1 | 5.1 | GO:0006369 | termination of RNA polymerase II transcription(GO:0006369) |
| 0.1 | 0.4 | GO:0060800 | regulation of cell differentiation involved in embryonic placenta development(GO:0060800) |
| 0.1 | 0.3 | GO:0046833 | positive regulation of RNA export from nucleus(GO:0046833) |
| 0.1 | 1.4 | GO:0007084 | mitotic nuclear envelope reassembly(GO:0007084) |
| 0.1 | 0.2 | GO:0044211 | CTP salvage(GO:0044211) |
| 0.1 | 0.1 | GO:0034729 | histone H3-K79 methylation(GO:0034729) |
| 0.1 | 0.5 | GO:0006264 | mitochondrial DNA replication(GO:0006264) |
| 0.1 | 0.8 | GO:0021891 | olfactory bulb interneuron development(GO:0021891) |
| 0.1 | 1.0 | GO:0010172 | embryonic body morphogenesis(GO:0010172) |
| 0.1 | 0.5 | GO:1903758 | regulation of transcription from RNA polymerase II promoter by histone modification(GO:1903756) negative regulation of transcription from RNA polymerase II promoter by histone modification(GO:1903758) |
| 0.1 | 0.5 | GO:0055059 | asymmetric neuroblast division(GO:0055059) |
| 0.1 | 0.4 | GO:1902525 | regulation of protein monoubiquitination(GO:1902525) |
| 0.1 | 0.7 | GO:1902455 | negative regulation of stem cell population maintenance(GO:1902455) |
| 0.1 | 0.2 | GO:2000271 | positive regulation of fibroblast apoptotic process(GO:2000271) |
| 0.1 | 0.6 | GO:0051533 | positive regulation of NFAT protein import into nucleus(GO:0051533) |
| 0.1 | 1.0 | GO:0033182 | regulation of histone ubiquitination(GO:0033182) |
| 0.1 | 0.3 | GO:1905098 | negative regulation of guanyl-nucleotide exchange factor activity(GO:1905098) |
| 0.1 | 2.9 | GO:0006699 | bile acid biosynthetic process(GO:0006699) |
| 0.1 | 0.3 | GO:0060623 | regulation of chromosome condensation(GO:0060623) |
| 0.1 | 1.0 | GO:0055003 | cardiac myofibril assembly(GO:0055003) |
| 0.1 | 1.4 | GO:0046599 | regulation of centriole replication(GO:0046599) |
| 0.1 | 0.4 | GO:1904526 | regulation of microtubule binding(GO:1904526) |
| 0.1 | 0.7 | GO:0015889 | cobalamin transport(GO:0015889) |
| 0.1 | 0.7 | GO:0035092 | sperm chromatin condensation(GO:0035092) |
| 0.1 | 0.8 | GO:0060836 | lymphatic endothelial cell differentiation(GO:0060836) |
| 0.1 | 0.9 | GO:1904776 | regulation of protein localization to cell cortex(GO:1904776) positive regulation of protein localization to cell cortex(GO:1904778) |
| 0.1 | 1.2 | GO:0048935 | peripheral nervous system neuron differentiation(GO:0048934) peripheral nervous system neuron development(GO:0048935) |
| 0.1 | 0.2 | GO:1903431 | spindle assembly involved in female meiosis I(GO:0007057) positive regulation of oocyte maturation(GO:1900195) positive regulation of cell maturation(GO:1903431) |
| 0.1 | 0.6 | GO:0031936 | negative regulation of chromatin silencing(GO:0031936) |
| 0.1 | 1.9 | GO:0050995 | negative regulation of lipid catabolic process(GO:0050995) |
| 0.1 | 0.4 | GO:0034316 | negative regulation of Arp2/3 complex-mediated actin nucleation(GO:0034316) negative regulation of actin nucleation(GO:0051126) |
| 0.1 | 0.3 | GO:0032364 | oxygen homeostasis(GO:0032364) |
| 0.1 | 0.8 | GO:0032516 | positive regulation of phosphoprotein phosphatase activity(GO:0032516) |
| 0.1 | 0.2 | GO:0043456 | regulation of pentose-phosphate shunt(GO:0043456) |
| 0.1 | 0.4 | GO:0070172 | positive regulation of tooth mineralization(GO:0070172) |
| 0.1 | 0.5 | GO:0016075 | rRNA catabolic process(GO:0016075) |
| 0.1 | 5.0 | GO:0030049 | muscle filament sliding(GO:0030049) actin-myosin filament sliding(GO:0033275) |
| 0.1 | 1.1 | GO:0020027 | hemoglobin metabolic process(GO:0020027) |
| 0.1 | 0.8 | GO:1903204 | negative regulation of oxidative stress-induced neuron death(GO:1903204) |
| 0.1 | 2.1 | GO:0007080 | mitotic metaphase plate congression(GO:0007080) |
| 0.1 | 0.7 | GO:2001241 | positive regulation of extrinsic apoptotic signaling pathway in absence of ligand(GO:2001241) |
| 0.1 | 0.8 | GO:0000338 | protein deneddylation(GO:0000338) regulation of IRE1-mediated unfolded protein response(GO:1903894) |
| 0.1 | 0.3 | GO:0007519 | skeletal muscle tissue development(GO:0007519) skeletal muscle organ development(GO:0060538) |
| 0.1 | 1.7 | GO:1902751 | positive regulation of cell cycle G2/M phase transition(GO:1902751) |
| 0.1 | 0.2 | GO:1901993 | meiotic cell cycle phase transition(GO:0044771) regulation of meiotic cell cycle phase transition(GO:1901993) negative regulation of meiotic cell cycle phase transition(GO:1901994) |
| 0.1 | 0.2 | GO:0015917 | aminophospholipid transport(GO:0015917) |
| 0.1 | 2.2 | GO:0000083 | regulation of transcription involved in G1/S transition of mitotic cell cycle(GO:0000083) |
| 0.1 | 0.4 | GO:0000160 | phosphorelay signal transduction system(GO:0000160) |
| 0.1 | 1.2 | GO:0021591 | ventricular system development(GO:0021591) |
| 0.1 | 1.0 | GO:0007096 | regulation of exit from mitosis(GO:0007096) |
| 0.1 | 0.7 | GO:0048227 | plasma membrane to endosome transport(GO:0048227) |
| 0.1 | 0.2 | GO:0030242 | pexophagy(GO:0030242) |
| 0.1 | 0.4 | GO:0002051 | osteoblast fate commitment(GO:0002051) |
| 0.1 | 0.5 | GO:2001224 | positive regulation of neuron migration(GO:2001224) |
| 0.1 | 0.5 | GO:0010764 | negative regulation of fibroblast migration(GO:0010764) |
| 0.1 | 0.4 | GO:1903748 | negative regulation of establishment of protein localization to mitochondrion(GO:1903748) |
| 0.1 | 1.7 | GO:0000387 | spliceosomal snRNP assembly(GO:0000387) |
| 0.1 | 1.0 | GO:0002021 | response to dietary excess(GO:0002021) |
| 0.0 | 0.4 | GO:0051256 | mitotic spindle midzone assembly(GO:0051256) |
| 0.0 | 0.6 | GO:2000696 | regulation of epithelial cell differentiation involved in kidney development(GO:2000696) |
| 0.0 | 0.5 | GO:0000492 | box C/D snoRNP assembly(GO:0000492) |
| 0.0 | 0.4 | GO:0075525 | viral translational termination-reinitiation(GO:0075525) |
| 0.0 | 0.3 | GO:0033211 | adiponectin-activated signaling pathway(GO:0033211) |
| 0.0 | 0.2 | GO:0006449 | regulation of translational termination(GO:0006449) |
| 0.0 | 0.9 | GO:0006811 | ion transport(GO:0006811) |
| 0.0 | 0.2 | GO:2000973 | regulation of pro-B cell differentiation(GO:2000973) |
| 0.0 | 1.0 | GO:0050930 | induction of positive chemotaxis(GO:0050930) |
| 0.0 | 0.5 | GO:0038166 | angiotensin-activated signaling pathway(GO:0038166) |
| 0.0 | 0.2 | GO:0007198 | adenylate cyclase-inhibiting serotonin receptor signaling pathway(GO:0007198) |
| 0.0 | 4.0 | GO:0035722 | interleukin-12-mediated signaling pathway(GO:0035722) cellular response to interleukin-12(GO:0071349) |
| 0.0 | 0.2 | GO:0090074 | negative regulation of protein homodimerization activity(GO:0090074) |
| 0.0 | 0.2 | GO:0070829 | response to vitamin B2(GO:0033274) heterochromatin maintenance(GO:0070829) |
| 0.0 | 0.2 | GO:1901731 | positive regulation of platelet aggregation(GO:1901731) |
| 0.0 | 1.1 | GO:0030214 | hyaluronan catabolic process(GO:0030214) |
| 0.0 | 0.6 | GO:0097150 | neuronal stem cell population maintenance(GO:0097150) |
| 0.0 | 0.6 | GO:0043248 | proteasome assembly(GO:0043248) |
| 0.0 | 0.6 | GO:0045116 | protein neddylation(GO:0045116) |
| 0.0 | 0.3 | GO:0070166 | enamel mineralization(GO:0070166) |
| 0.0 | 1.0 | GO:0070536 | protein K63-linked deubiquitination(GO:0070536) |
| 0.0 | 0.5 | GO:0097034 | mitochondrial respiratory chain complex IV assembly(GO:0033617) mitochondrial respiratory chain complex IV biogenesis(GO:0097034) |
| 0.0 | 0.3 | GO:0048664 | neuron fate determination(GO:0048664) |
| 0.0 | 0.6 | GO:0008608 | attachment of spindle microtubules to kinetochore(GO:0008608) |
| 0.0 | 0.1 | GO:0071393 | cellular response to progesterone stimulus(GO:0071393) |
| 0.0 | 0.5 | GO:0035635 | entry of bacterium into host cell(GO:0035635) |
| 0.0 | 0.4 | GO:0007289 | spermatid nucleus differentiation(GO:0007289) |
| 0.0 | 2.6 | GO:0070126 | mitochondrial translational elongation(GO:0070125) mitochondrial translational termination(GO:0070126) |
| 0.0 | 0.4 | GO:0030100 | regulation of endocytosis(GO:0030100) |
| 0.0 | 0.9 | GO:0030488 | tRNA methylation(GO:0030488) |
| 0.0 | 0.9 | GO:0032467 | positive regulation of cytokinesis(GO:0032467) |
| 0.0 | 1.0 | GO:0045948 | positive regulation of translational initiation(GO:0045948) |
| 0.0 | 0.1 | GO:0016185 | synaptic vesicle budding from presynaptic endocytic zone membrane(GO:0016185) |
| 0.0 | 0.3 | GO:0051705 | social behavior(GO:0035176) intraspecies interaction between organisms(GO:0051703) multi-organism behavior(GO:0051705) |
| 0.0 | 0.4 | GO:0034134 | toll-like receptor 2 signaling pathway(GO:0034134) |
| 0.0 | 0.3 | GO:1900364 | negative regulation of mRNA polyadenylation(GO:1900364) |
| 0.0 | 0.6 | GO:0006337 | nucleosome disassembly(GO:0006337) |
| 0.0 | 0.2 | GO:0060842 | arterial endothelial cell differentiation(GO:0060842) |
| 0.0 | 0.7 | GO:0045737 | positive regulation of cyclin-dependent protein serine/threonine kinase activity(GO:0045737) |
| 0.0 | 0.4 | GO:0003376 | sphingosine-1-phosphate signaling pathway(GO:0003376) sphingolipid mediated signaling pathway(GO:0090520) |
| 0.0 | 0.1 | GO:0046642 | negative regulation of alpha-beta T cell proliferation(GO:0046642) |
| 0.0 | 0.2 | GO:0061084 | regulation of protein refolding(GO:0061083) negative regulation of protein refolding(GO:0061084) |
| 0.0 | 0.8 | GO:0030514 | negative regulation of BMP signaling pathway(GO:0030514) |
| 0.0 | 0.3 | GO:0045008 | depyrimidination(GO:0045008) |
| 0.0 | 0.1 | GO:2000546 | positive regulation of cell chemotaxis to fibroblast growth factor(GO:1904849) positive regulation of endothelial cell chemotaxis to fibroblast growth factor(GO:2000546) |
| 0.0 | 0.5 | GO:0030388 | fructose 1,6-bisphosphate metabolic process(GO:0030388) |
| 0.0 | 0.3 | GO:0048569 | post-embryonic organ development(GO:0048569) |
| 0.0 | 0.4 | GO:0006296 | nucleotide-excision repair, DNA incision, 5'-to lesion(GO:0006296) |
| 0.0 | 0.2 | GO:0002291 | T cell activation via T cell receptor contact with antigen bound to MHC molecule on antigen presenting cell(GO:0002291) |
| 0.0 | 0.1 | GO:1903288 | positive regulation of potassium ion import(GO:1903288) |
| 0.0 | 1.0 | GO:0070911 | global genome nucleotide-excision repair(GO:0070911) |
| 0.0 | 0.2 | GO:0034379 | very-low-density lipoprotein particle assembly(GO:0034379) |
| 0.0 | 1.1 | GO:0006363 | transcription elongation from RNA polymerase I promoter(GO:0006362) termination of RNA polymerase I transcription(GO:0006363) |
| 0.0 | 0.4 | GO:0032688 | negative regulation of interferon-beta production(GO:0032688) |
| 0.0 | 1.2 | GO:0046677 | response to antibiotic(GO:0046677) |
| 0.0 | 0.4 | GO:0002643 | regulation of tolerance induction(GO:0002643) |
| 0.0 | 0.1 | GO:0036438 | maintenance of lens transparency(GO:0036438) |
| 0.0 | 1.1 | GO:0045824 | negative regulation of innate immune response(GO:0045824) |
| 0.0 | 0.3 | GO:0043982 | histone H4-K5 acetylation(GO:0043981) histone H4-K8 acetylation(GO:0043982) |
| 0.0 | 0.8 | GO:0006730 | one-carbon metabolic process(GO:0006730) |
| 0.0 | 0.9 | GO:0048246 | macrophage chemotaxis(GO:0048246) |
| 0.0 | 0.0 | GO:0060715 | syncytiotrophoblast cell differentiation involved in labyrinthine layer development(GO:0060715) |
| 0.0 | 0.2 | GO:0072584 | caveolin-mediated endocytosis(GO:0072584) |
| 0.0 | 0.2 | GO:0071692 | sequestering of TGFbeta in extracellular matrix(GO:0035583) protein localization to extracellular region(GO:0071692) maintenance of protein location in extracellular region(GO:0071694) |
| 0.0 | 0.3 | GO:0032292 | myelination in peripheral nervous system(GO:0022011) peripheral nervous system axon ensheathment(GO:0032292) |
| 0.0 | 0.3 | GO:0050774 | negative regulation of dendrite morphogenesis(GO:0050774) |
| 0.0 | 0.5 | GO:0000291 | nuclear-transcribed mRNA catabolic process, exonucleolytic(GO:0000291) exonucleolytic nuclear-transcribed mRNA catabolic process involved in deadenylation-dependent decay(GO:0043928) |
| 0.0 | 0.3 | GO:0015937 | coenzyme A biosynthetic process(GO:0015937) |
| 0.0 | 1.0 | GO:0060416 | response to growth hormone(GO:0060416) |
| 0.0 | 1.6 | GO:0050853 | B cell receptor signaling pathway(GO:0050853) |
| 0.0 | 1.3 | GO:0070373 | negative regulation of ERK1 and ERK2 cascade(GO:0070373) |
| 0.0 | 0.1 | GO:0035469 | determination of pancreatic left/right asymmetry(GO:0035469) determination of liver left/right asymmetry(GO:0071910) |
| 0.0 | 0.2 | GO:0060716 | labyrinthine layer blood vessel development(GO:0060716) |
| 0.0 | 0.1 | GO:0045759 | negative regulation of action potential(GO:0045759) |
| 0.0 | 1.3 | GO:1902749 | regulation of cell cycle G2/M phase transition(GO:1902749) |
| 0.0 | 0.1 | GO:2001206 | positive regulation of osteoclast development(GO:2001206) |
| 0.0 | 0.1 | GO:0035426 | extracellular matrix-cell signaling(GO:0035426) progesterone secretion(GO:0042701) retinal blood vessel morphogenesis(GO:0061304) |
| 0.0 | 0.4 | GO:2000114 | regulation of establishment of cell polarity(GO:2000114) |
| 0.0 | 0.6 | GO:2000249 | regulation of actin cytoskeleton reorganization(GO:2000249) |
| 0.0 | 0.0 | GO:0060830 | ciliary receptor clustering involved in smoothened signaling pathway(GO:0060830) |
| 0.0 | 0.2 | GO:1903944 | regulation of hepatocyte apoptotic process(GO:1903943) negative regulation of hepatocyte apoptotic process(GO:1903944) |
| 0.0 | 0.2 | GO:0050982 | detection of mechanical stimulus(GO:0050982) |
| 0.0 | 1.1 | GO:0006513 | protein monoubiquitination(GO:0006513) |
| 0.0 | 0.7 | GO:0000079 | regulation of cyclin-dependent protein serine/threonine kinase activity(GO:0000079) |
| 0.0 | 0.3 | GO:0045662 | negative regulation of myoblast differentiation(GO:0045662) |
| 0.0 | 0.3 | GO:0099517 | anterograde synaptic vesicle transport(GO:0048490) synaptic vesicle cytoskeletal transport(GO:0099514) synaptic vesicle transport along microtubule(GO:0099517) |
| 0.0 | 0.3 | GO:0016601 | Rac protein signal transduction(GO:0016601) |
| 0.0 | 0.3 | GO:0035855 | megakaryocyte development(GO:0035855) |
| 0.0 | 0.3 | GO:0071420 | cellular response to histamine(GO:0071420) |
| 0.0 | 0.4 | GO:0032288 | myelin assembly(GO:0032288) |
| 0.0 | 0.2 | GO:1990090 | response to nerve growth factor(GO:1990089) cellular response to nerve growth factor stimulus(GO:1990090) |
| 0.0 | 0.5 | GO:1904837 | beta-catenin-TCF complex assembly(GO:1904837) |
| 0.0 | 0.2 | GO:0090161 | Golgi ribbon formation(GO:0090161) |
| 0.0 | 0.5 | GO:0043406 | positive regulation of MAP kinase activity(GO:0043406) |
| 0.0 | 0.8 | GO:0090502 | RNA phosphodiester bond hydrolysis, endonucleolytic(GO:0090502) |
| 0.0 | 0.1 | GO:0006378 | mRNA polyadenylation(GO:0006378) RNA polyadenylation(GO:0043631) |
| 0.0 | 0.2 | GO:0035162 | embryonic hemopoiesis(GO:0035162) |
| 0.0 | 0.2 | GO:0006853 | carnitine shuttle(GO:0006853) |
| 0.0 | 0.1 | GO:0061351 | neural precursor cell proliferation(GO:0061351) |
| 0.0 | 0.8 | GO:0009060 | aerobic respiration(GO:0009060) |
| 0.0 | 1.1 | GO:0006958 | complement activation, classical pathway(GO:0006958) |
| 0.0 | 0.2 | GO:0043666 | regulation of phosphoprotein phosphatase activity(GO:0043666) |
| 0.0 | 0.1 | GO:0042355 | fucose catabolic process(GO:0019317) L-fucose metabolic process(GO:0042354) L-fucose catabolic process(GO:0042355) |
| 0.0 | 0.4 | GO:0051865 | protein autoubiquitination(GO:0051865) |
| 0.0 | 0.4 | GO:0048265 | response to pain(GO:0048265) |
| 0.0 | 0.0 | GO:0060370 | susceptibility to T cell mediated cytotoxicity(GO:0060370) |
| 0.0 | 0.0 | GO:0006880 | intracellular sequestering of iron ion(GO:0006880) sequestering of iron ion(GO:0097577) |
| 0.0 | 0.5 | GO:0046464 | neutral lipid catabolic process(GO:0046461) acylglycerol catabolic process(GO:0046464) |
| 0.0 | 0.3 | GO:0034314 | Arp2/3 complex-mediated actin nucleation(GO:0034314) |
Gene overrepresentation in molecular_function category:
| Log-likelihood per target | Total log-likelihood | Term | Description |
|---|---|---|---|
| 0.6 | 4.5 | GO:0001849 | complement component C1q binding(GO:0001849) |
| 0.3 | 1.0 | GO:0005169 | neurotrophin TRKB receptor binding(GO:0005169) |
| 0.2 | 1.2 | GO:0052656 | branched-chain-amino-acid transaminase activity(GO:0004084) L-leucine transaminase activity(GO:0052654) L-valine transaminase activity(GO:0052655) L-isoleucine transaminase activity(GO:0052656) |
| 0.2 | 0.8 | GO:0004699 | calcium-independent protein kinase C activity(GO:0004699) |
| 0.2 | 2.6 | GO:0003680 | AT DNA binding(GO:0003680) |
| 0.2 | 2.4 | GO:0031996 | thioesterase binding(GO:0031996) |
| 0.1 | 0.3 | GO:0016309 | 1-phosphatidylinositol-5-phosphate 4-kinase activity(GO:0016309) |
| 0.1 | 0.7 | GO:0035374 | chondroitin sulfate binding(GO:0035374) |
| 0.1 | 2.7 | GO:0015002 | cytochrome-c oxidase activity(GO:0004129) heme-copper terminal oxidase activity(GO:0015002) oxidoreductase activity, acting on a heme group of donors, oxygen as acceptor(GO:0016676) |
| 0.1 | 0.5 | GO:0030548 | acetylcholine receptor regulator activity(GO:0030548) neurotransmitter receptor regulator activity(GO:0099602) |
| 0.1 | 0.5 | GO:0070892 | lipoteichoic acid receptor activity(GO:0070892) |
| 0.1 | 0.4 | GO:0003956 | NAD(P)+-protein-arginine ADP-ribosyltransferase activity(GO:0003956) |
| 0.1 | 0.9 | GO:0030957 | Tat protein binding(GO:0030957) |
| 0.1 | 0.7 | GO:1990459 | transferrin receptor binding(GO:1990459) |
| 0.1 | 1.0 | GO:0050786 | RAGE receptor binding(GO:0050786) |
| 0.0 | 0.1 | GO:0004833 | tryptophan 2,3-dioxygenase activity(GO:0004833) |
| 0.0 | 0.4 | GO:0004784 | superoxide dismutase activity(GO:0004784) oxidoreductase activity, acting on superoxide radicals as acceptor(GO:0016721) |
| 0.0 | 1.2 | GO:0005104 | fibroblast growth factor receptor binding(GO:0005104) |
| 0.0 | 0.2 | GO:0042577 | lipid phosphatase activity(GO:0042577) |
| 0.0 | 0.4 | GO:0015143 | urate transmembrane transporter activity(GO:0015143) salt transmembrane transporter activity(GO:1901702) |
| 0.0 | 0.2 | GO:0070740 | tubulin-glutamic acid ligase activity(GO:0070740) |
| 0.0 | 0.2 | GO:1990829 | C-rich single-stranded DNA binding(GO:1990829) |
| 0.0 | 0.6 | GO:0008494 | translation activator activity(GO:0008494) |
| 0.0 | 0.6 | GO:0017049 | GTP-Rho binding(GO:0017049) |
| 0.0 | 0.5 | GO:0042043 | neurexin family protein binding(GO:0042043) |
| 0.0 | 0.4 | GO:0050700 | CARD domain binding(GO:0050700) |
| 0.0 | 1.8 | GO:0070888 | E-box binding(GO:0070888) |
| 0.0 | 0.1 | GO:0045134 | uridine-diphosphatase activity(GO:0045134) |
| 0.0 | 0.5 | GO:0019992 | diacylglycerol binding(GO:0019992) |
| 0.0 | 2.1 | GO:0050840 | extracellular matrix binding(GO:0050840) |
| 0.0 | 0.2 | GO:0047498 | calcium-dependent phospholipase A2 activity(GO:0047498) |
| 0.0 | 0.1 | GO:0019237 | centromeric DNA binding(GO:0019237) |
| 0.0 | 0.7 | GO:0030742 | GTP-dependent protein binding(GO:0030742) |
| 0.0 | 1.0 | GO:0031369 | translation initiation factor binding(GO:0031369) |
| 0.0 | 0.2 | GO:0015165 | pyrimidine nucleotide-sugar transmembrane transporter activity(GO:0015165) |
| 0.0 | 0.8 | GO:0042605 | peptide antigen binding(GO:0042605) |
| 0.0 | 0.2 | GO:0016681 | ubiquinol-cytochrome-c reductase activity(GO:0008121) oxidoreductase activity, acting on diphenols and related substances as donors, cytochrome as acceptor(GO:0016681) |
| 0.0 | 0.4 | GO:0001222 | transcription corepressor binding(GO:0001222) |
| 0.0 | 0.6 | GO:0051010 | microtubule plus-end binding(GO:0051010) |
| 0.0 | 0.0 | GO:0004459 | lactate dehydrogenase activity(GO:0004457) L-lactate dehydrogenase activity(GO:0004459) |
| 0.0 | 0.2 | GO:0019869 | chloride channel inhibitor activity(GO:0019869) |
| 0.0 | 0.5 | GO:0008327 | methyl-CpG binding(GO:0008327) |
| 0.0 | 0.2 | GO:0051864 | histone demethylase activity (H3-K36 specific)(GO:0051864) |
| 0.0 | 0.3 | GO:0004536 | deoxyribonuclease activity(GO:0004536) |
| 0.0 | 0.0 | GO:0004170 | dUTP diphosphatase activity(GO:0004170) |
| 0.0 | 0.1 | GO:0050815 | phosphoserine binding(GO:0050815) |
| 0.0 | 0.4 | GO:0008157 | protein phosphatase 1 binding(GO:0008157) |
| 0.0 | 0.0 | GO:0015235 | cobalamin transporter activity(GO:0015235) |
| 0.0 | 0.3 | GO:0044548 | S100 protein binding(GO:0044548) |
| 0.0 | 0.1 | GO:0046976 | histone methyltransferase activity (H3-K27 specific)(GO:0046976) |
| 0.0 | 0.1 | GO:0061665 | SUMO ligase activity(GO:0061665) |
| 0.0 | 0.1 | GO:0030614 | oxidoreductase activity, acting on phosphorus or arsenic in donors(GO:0030613) oxidoreductase activity, acting on phosphorus or arsenic in donors, disulfide as acceptor(GO:0030614) |
| 0.0 | 0.1 | GO:0061628 | H3K27me3 modified histone binding(GO:0061628) |
| 0.0 | 0.1 | GO:1901612 | cardiolipin binding(GO:1901612) |
| 0.0 | 0.4 | GO:0030296 | protein tyrosine kinase activator activity(GO:0030296) |
| 0.0 | 0.6 | GO:0036002 | pre-mRNA binding(GO:0036002) |
| 0.0 | 0.2 | GO:0000339 | RNA cap binding(GO:0000339) |
| 0.0 | 0.4 | GO:0061631 | ubiquitin conjugating enzyme activity(GO:0061631) |
Gene overrepresentation in cellular_component category:
| Log-likelihood per target | Total log-likelihood | Term | Description |
|---|---|---|---|
| 0.7 | 6.1 | GO:0033588 | Elongator holoenzyme complex(GO:0033588) |
| 0.6 | 5.2 | GO:0032039 | integrator complex(GO:0032039) |
| 0.4 | 2.5 | GO:0000942 | condensed nuclear chromosome outer kinetochore(GO:0000942) |
| 0.4 | 1.7 | GO:0032301 | MutSalpha complex(GO:0032301) |
| 0.4 | 8.2 | GO:0033202 | Ino80 complex(GO:0031011) DNA helicase complex(GO:0033202) |
| 0.4 | 1.5 | GO:0000799 | nuclear condensin complex(GO:0000799) |
| 0.4 | 2.6 | GO:0000445 | THO complex(GO:0000347) THO complex part of transcription export complex(GO:0000445) |
| 0.4 | 10.2 | GO:0034451 | centriolar satellite(GO:0034451) |
| 0.3 | 1.2 | GO:0055087 | Ski complex(GO:0055087) |
| 0.3 | 0.8 | GO:0031372 | UBC13-MMS2 complex(GO:0031372) |
| 0.3 | 0.8 | GO:0097057 | TRAF2-GSTP1 complex(GO:0097057) |
| 0.3 | 1.3 | GO:0035061 | interchromatin granule(GO:0035061) |
| 0.3 | 0.8 | GO:0001740 | Barr body(GO:0001740) |
| 0.2 | 1.7 | GO:0098554 | cytoplasmic side of endoplasmic reticulum membrane(GO:0098554) |
| 0.2 | 1.0 | GO:1990423 | RZZ complex(GO:1990423) |
| 0.2 | 2.9 | GO:0005642 | annulate lamellae(GO:0005642) |
| 0.2 | 0.9 | GO:0072379 | BAT3 complex(GO:0071818) ER membrane insertion complex(GO:0072379) |
| 0.2 | 1.6 | GO:1990635 | proximal dendrite(GO:1990635) |
| 0.2 | 1.7 | GO:0032133 | chromosome passenger complex(GO:0032133) |
| 0.2 | 1.4 | GO:0001520 | outer dense fiber(GO:0001520) |
| 0.2 | 0.8 | GO:0032937 | SREBP-SCAP-Insig complex(GO:0032937) |
| 0.2 | 4.8 | GO:0035098 | ESC/E(Z) complex(GO:0035098) |
| 0.2 | 1.6 | GO:0005955 | calcineurin complex(GO:0005955) |
| 0.2 | 1.1 | GO:0070545 | PeBoW complex(GO:0070545) |
| 0.2 | 2.4 | GO:0000243 | commitment complex(GO:0000243) |
| 0.2 | 0.7 | GO:0071001 | U4/U6 snRNP(GO:0071001) |
| 0.2 | 0.7 | GO:0005846 | nuclear cap binding complex(GO:0005846) |
| 0.2 | 0.9 | GO:0000793 | condensed chromosome(GO:0000793) |
| 0.2 | 0.5 | GO:0098536 | deuterosome(GO:0098536) |
| 0.2 | 2.9 | GO:0031902 | late endosome membrane(GO:0031902) |
| 0.1 | 0.6 | GO:0031510 | SUMO activating enzyme complex(GO:0031510) |
| 0.1 | 0.8 | GO:0071817 | MMXD complex(GO:0071817) |
| 0.1 | 1.1 | GO:0031465 | Cul4B-RING E3 ubiquitin ligase complex(GO:0031465) |
| 0.1 | 1.2 | GO:0005638 | lamin filament(GO:0005638) |
| 0.1 | 1.7 | GO:0005664 | origin recognition complex(GO:0000808) nuclear origin of replication recognition complex(GO:0005664) |
| 0.1 | 0.4 | GO:1990622 | CHOP-ATF3 complex(GO:1990622) |
| 0.1 | 1.0 | GO:0097504 | Gemini of coiled bodies(GO:0097504) |
| 0.1 | 0.7 | GO:0000796 | condensin complex(GO:0000796) |
| 0.1 | 0.9 | GO:0000346 | transcription export complex(GO:0000346) |
| 0.1 | 2.0 | GO:0045009 | melanosome membrane(GO:0033162) chitosome(GO:0045009) |
| 0.1 | 0.8 | GO:0042382 | paraspeckles(GO:0042382) |
| 0.1 | 0.3 | GO:0097361 | CIA complex(GO:0097361) |
| 0.1 | 0.4 | GO:0043625 | delta DNA polymerase complex(GO:0043625) |
| 0.1 | 2.9 | GO:0005680 | anaphase-promoting complex(GO:0005680) |
| 0.1 | 0.3 | GO:0005956 | protein kinase CK2 complex(GO:0005956) |
| 0.1 | 1.4 | GO:0005641 | nuclear envelope lumen(GO:0005641) |
| 0.1 | 0.6 | GO:0031415 | NatA complex(GO:0031415) |
| 0.1 | 0.5 | GO:0070937 | CRD-mediated mRNA stability complex(GO:0070937) |
| 0.1 | 0.7 | GO:0036057 | filtration diaphragm(GO:0036056) slit diaphragm(GO:0036057) |
| 0.1 | 0.5 | GO:0030426 | growth cone(GO:0030426) |
| 0.1 | 1.9 | GO:0070822 | Sin3-type complex(GO:0070822) |
| 0.1 | 0.5 | GO:0070436 | Grb2-EGFR complex(GO:0070436) |
| 0.1 | 0.4 | GO:0044530 | supraspliceosomal complex(GO:0044530) |
| 0.1 | 1.1 | GO:0005858 | axonemal dynein complex(GO:0005858) |
| 0.1 | 1.1 | GO:0005833 | hemoglobin complex(GO:0005833) |
| 0.1 | 0.8 | GO:0035631 | CD40 receptor complex(GO:0035631) |
| 0.1 | 1.1 | GO:0014731 | spectrin-associated cytoskeleton(GO:0014731) |
| 0.1 | 0.7 | GO:0070938 | contractile ring(GO:0070938) |
| 0.1 | 0.3 | GO:0016533 | cyclin-dependent protein kinase 5 holoenzyme complex(GO:0016533) |
| 0.1 | 5.4 | GO:0031672 | A band(GO:0031672) |
| 0.1 | 6.8 | GO:0031970 | mitochondrial intermembrane space(GO:0005758) organelle envelope lumen(GO:0031970) |
| 0.1 | 0.6 | GO:0071204 | histone pre-mRNA 3'end processing complex(GO:0071204) |
| 0.1 | 1.6 | GO:0071564 | npBAF complex(GO:0071564) |
| 0.1 | 1.6 | GO:0005852 | eukaryotic translation initiation factor 3 complex(GO:0005852) |
| 0.1 | 0.2 | GO:0071748 | IgA immunoglobulin complex(GO:0071745) IgA immunoglobulin complex, circulating(GO:0071746) monomeric IgA immunoglobulin complex(GO:0071748) polymeric IgA immunoglobulin complex(GO:0071749) secretory IgA immunoglobulin complex(GO:0071751) |
| 0.1 | 0.5 | GO:0070761 | PCAF complex(GO:0000125) pre-snoRNP complex(GO:0070761) |
| 0.1 | 1.1 | GO:0005736 | DNA-directed RNA polymerase I complex(GO:0005736) |
| 0.1 | 0.7 | GO:0030008 | TRAPP complex(GO:0030008) |
| 0.1 | 2.0 | GO:0009925 | basal plasma membrane(GO:0009925) |
| 0.1 | 0.7 | GO:0097136 | Bcl-2 family protein complex(GO:0097136) |
| 0.1 | 0.5 | GO:0005827 | polar microtubule(GO:0005827) |
| 0.1 | 0.2 | GO:0097058 | CRLF-CLCF1 complex(GO:0097058) |
| 0.1 | 0.5 | GO:0016602 | CCAAT-binding factor complex(GO:0016602) |
| 0.0 | 1.3 | GO:0031304 | intrinsic component of mitochondrial inner membrane(GO:0031304) integral component of mitochondrial inner membrane(GO:0031305) |
| 0.0 | 0.4 | GO:0031464 | Cul4A-RING E3 ubiquitin ligase complex(GO:0031464) |
| 0.0 | 1.2 | GO:0000314 | organellar small ribosomal subunit(GO:0000314) mitochondrial small ribosomal subunit(GO:0005763) |
| 0.0 | 0.5 | GO:0000242 | pericentriolar material(GO:0000242) |
| 0.0 | 0.4 | GO:1990907 | beta-catenin-TCF complex(GO:1990907) |
| 0.0 | 2.2 | GO:0030176 | integral component of endoplasmic reticulum membrane(GO:0030176) |
| 0.0 | 0.4 | GO:0036513 | Derlin-1 retrotranslocation complex(GO:0036513) |
| 0.0 | 1.4 | GO:0005720 | nuclear heterochromatin(GO:0005720) |
| 0.0 | 1.4 | GO:0005762 | organellar large ribosomal subunit(GO:0000315) mitochondrial large ribosomal subunit(GO:0005762) |
| 0.0 | 0.2 | GO:0072536 | interleukin-23 receptor complex(GO:0072536) |
| 0.0 | 0.6 | GO:0005662 | DNA replication factor A complex(GO:0005662) |
| 0.0 | 0.4 | GO:0008541 | proteasome regulatory particle, lid subcomplex(GO:0008541) |
| 0.0 | 0.2 | GO:1990316 | ATG1/ULK1 kinase complex(GO:1990316) |
| 0.0 | 1.6 | GO:0042571 | immunoglobulin complex, circulating(GO:0042571) |
| 0.0 | 0.6 | GO:0001931 | uropod(GO:0001931) cell trailing edge(GO:0031254) |
| 0.0 | 0.3 | GO:0072357 | PTW/PP1 phosphatase complex(GO:0072357) |
| 0.0 | 0.8 | GO:0005942 | phosphatidylinositol 3-kinase complex(GO:0005942) |
| 0.0 | 0.5 | GO:0034709 | methylosome(GO:0034709) |
| 0.0 | 0.4 | GO:0097524 | sperm plasma membrane(GO:0097524) |
| 0.0 | 0.2 | GO:0033503 | HULC complex(GO:0033503) |
| 0.0 | 0.5 | GO:0000177 | cytoplasmic exosome (RNase complex)(GO:0000177) |
| 0.0 | 0.4 | GO:0071011 | precatalytic spliceosome(GO:0071011) |
| 0.0 | 0.2 | GO:0035145 | exon-exon junction complex(GO:0035145) |
| 0.0 | 3.8 | GO:0000922 | spindle pole(GO:0000922) |
| 0.0 | 0.7 | GO:0035371 | microtubule plus-end(GO:0035371) |
| 0.0 | 1.5 | GO:0015030 | Cajal body(GO:0015030) |
| 0.0 | 0.3 | GO:0071004 | U2-type prespliceosome(GO:0071004) |
| 0.0 | 1.8 | GO:0016328 | lateral plasma membrane(GO:0016328) |
| 0.0 | 2.9 | GO:0016605 | PML body(GO:0016605) |
| 0.0 | 0.5 | GO:0097440 | apical dendrite(GO:0097440) |
| 0.0 | 0.4 | GO:0005682 | U5 snRNP(GO:0005682) |
| 0.0 | 0.2 | GO:0005787 | signal peptidase complex(GO:0005787) |
| 0.0 | 0.2 | GO:0032389 | MutLalpha complex(GO:0032389) |
| 0.0 | 0.5 | GO:0005885 | Arp2/3 protein complex(GO:0005885) |
| 0.0 | 1.2 | GO:0019005 | SCF ubiquitin ligase complex(GO:0019005) |
| 0.0 | 0.3 | GO:0005697 | telomerase holoenzyme complex(GO:0005697) |
| 0.0 | 2.7 | GO:0000932 | cytoplasmic mRNA processing body(GO:0000932) |
| 0.0 | 1.7 | GO:0071013 | catalytic step 2 spliceosome(GO:0071013) |
| 0.0 | 0.8 | GO:0030173 | integral component of Golgi membrane(GO:0030173) |
| 0.0 | 0.2 | GO:0072487 | MSL complex(GO:0072487) |
| 0.0 | 7.2 | GO:0016607 | nuclear speck(GO:0016607) |
| 0.0 | 2.1 | GO:0005913 | cell-cell adherens junction(GO:0005913) |
| 0.0 | 0.3 | GO:0080008 | Cul4-RING E3 ubiquitin ligase complex(GO:0080008) |
| 0.0 | 1.2 | GO:0005637 | nuclear inner membrane(GO:0005637) |
| 0.0 | 0.9 | GO:0042645 | nucleoid(GO:0009295) mitochondrial nucleoid(GO:0042645) |
| 0.0 | 0.1 | GO:0098843 | postsynaptic endocytic zone(GO:0098843) |
| 0.0 | 0.1 | GO:0097453 | mesaxon(GO:0097453) ensheathing process(GO:1990015) |
| 0.0 | 0.1 | GO:0016514 | SWI/SNF complex(GO:0016514) |
| 0.0 | 1.2 | GO:0005814 | centriole(GO:0005814) |
| 0.0 | 0.3 | GO:0030131 | clathrin adaptor complex(GO:0030131) |
| 0.0 | 0.5 | GO:0010494 | cytoplasmic stress granule(GO:0010494) |
| 0.0 | 0.4 | GO:0071437 | invadopodium(GO:0071437) |
| 0.0 | 0.1 | GO:0035838 | growing cell tip(GO:0035838) |
| 0.0 | 0.2 | GO:0097225 | sperm midpiece(GO:0097225) |
| 0.0 | 0.2 | GO:0005750 | mitochondrial respiratory chain complex III(GO:0005750) respiratory chain complex III(GO:0045275) |
| 0.0 | 0.0 | GO:0005879 | axonemal microtubule(GO:0005879) |
| 0.0 | 0.2 | GO:0030681 | multimeric ribonuclease P complex(GO:0030681) |
| 0.0 | 2.3 | GO:0101002 | ficolin-1-rich granule(GO:0101002) ficolin-1-rich granule lumen(GO:1904813) |
| 0.0 | 0.2 | GO:0044232 | organelle membrane contact site(GO:0044232) |
| 0.0 | 0.6 | GO:0045171 | intercellular bridge(GO:0045171) |
| 0.0 | 1.6 | GO:0035579 | specific granule membrane(GO:0035579) |
| 0.0 | 0.8 | GO:0030669 | clathrin-coated endocytic vesicle membrane(GO:0030669) |
| 0.0 | 0.7 | GO:0033017 | sarcoplasmic reticulum membrane(GO:0033017) |
| 0.0 | 1.9 | GO:0000151 | ubiquitin ligase complex(GO:0000151) |
| 0.0 | 0.1 | GO:0036038 | MKS complex(GO:0036038) |
| 0.0 | 0.1 | GO:0035577 | azurophil granule membrane(GO:0035577) |
| 0.0 | 0.5 | GO:0043198 | dendritic shaft(GO:0043198) |
Gene overrepresentation in C2:CP category:
| Log-likelihood per target | Total log-likelihood | Term | Description |
|---|---|---|---|
| 0.1 | 5.2 | PID AURORA B PATHWAY | Aurora B signaling |
| 0.1 | 3.3 | PID PLK1 PATHWAY | PLK1 signaling events |
| 0.0 | 2.2 | ST MYOCYTE AD PATHWAY | Myocyte Adrenergic Pathway is a specific case of the generalized Adrenergic Pathway. |
| 0.0 | 0.6 | PID DELTA NP63 PATHWAY | Validated transcriptional targets of deltaNp63 isoforms |
| 0.0 | 1.7 | PID HDAC CLASSII PATHWAY | Signaling events mediated by HDAC Class II |
| 0.0 | 1.4 | SIG CD40PATHWAYMAP | Genes related to CD40 signaling |
| 0.0 | 0.5 | PID TAP63 PATHWAY | Validated transcriptional targets of TAp63 isoforms |
| 0.0 | 1.2 | PID PI3KCI AKT PATHWAY | Class I PI3K signaling events mediated by Akt |
| 0.0 | 1.7 | PID IL2 1PATHWAY | IL2-mediated signaling events |
| 0.0 | 1.5 | PID NFAT TFPATHWAY | Calcineurin-regulated NFAT-dependent transcription in lymphocytes |
| 0.0 | 0.8 | PID ALPHA SYNUCLEIN PATHWAY | Alpha-synuclein signaling |
| 0.0 | 0.5 | SA MMP CYTOKINE CONNECTION | Cytokines can induce activation of matrix metalloproteinases, which degrade extracellular matrix. |
| 0.0 | 3.1 | PID P53 DOWNSTREAM PATHWAY | Direct p53 effectors |
| 0.0 | 1.0 | PID ILK PATHWAY | Integrin-linked kinase signaling |
| 0.0 | 1.0 | PID TELOMERASE PATHWAY | Regulation of Telomerase |
| 0.0 | 0.2 | PID P38 ALPHA BETA PATHWAY | Regulation of p38-alpha and p38-beta |
Gene overrepresentation in biological_process category:
| Log-likelihood per target | Total log-likelihood | Term | Description |
|---|---|---|---|
| 0.4 | 1.7 | GO:0003172 | primary heart field specification(GO:0003138) sinoatrial valve development(GO:0003172) sinoatrial valve morphogenesis(GO:0003185) |
| 0.4 | 3.0 | GO:0000727 | double-strand break repair via break-induced replication(GO:0000727) |
| 0.3 | 1.7 | GO:0052199 | negative regulation of catalytic activity in other organism involved in symbiotic interaction(GO:0052199) |
| 0.3 | 1.6 | GO:0006311 | meiotic gene conversion(GO:0006311) regulation of reciprocal meiotic recombination(GO:0010520) |
| 0.3 | 0.9 | GO:0007412 | axon target recognition(GO:0007412) |
| 0.3 | 1.2 | GO:0036228 | protein targeting to nuclear inner membrane(GO:0036228) |
| 0.3 | 0.9 | GO:1990022 | RNA polymerase II complex import to nucleus(GO:0044376) RNA polymerase III complex localization to nucleus(GO:1990022) |
| 0.2 | 2.4 | GO:0030951 | establishment or maintenance of microtubule cytoskeleton polarity(GO:0030951) |
| 0.2 | 0.7 | GO:0098923 | retrograde trans-synaptic signaling by soluble gas(GO:0098923) trans-synaptic signaling by soluble gas(GO:0099543) trans-synaptic signaling by trans-synaptic complex(GO:0099545) |
| 0.2 | 0.9 | GO:0035519 | protein K29-linked ubiquitination(GO:0035519) |
| 0.2 | 1.8 | GO:0006528 | asparagine metabolic process(GO:0006528) |
| 0.2 | 1.1 | GO:0071543 | diadenosine polyphosphate catabolic process(GO:0015961) diphosphoinositol polyphosphate metabolic process(GO:0071543) diadenosine pentaphosphate metabolic process(GO:1901906) diadenosine pentaphosphate catabolic process(GO:1901907) diadenosine hexaphosphate metabolic process(GO:1901908) diadenosine hexaphosphate catabolic process(GO:1901909) adenosine 5'-(hexahydrogen pentaphosphate) metabolic process(GO:1901910) adenosine 5'-(hexahydrogen pentaphosphate) catabolic process(GO:1901911) |
| 0.2 | 3.4 | GO:0040015 | negative regulation of multicellular organism growth(GO:0040015) |
| 0.2 | 1.1 | GO:1903435 | positive regulation of constitutive secretory pathway(GO:1903435) |
| 0.2 | 1.6 | GO:0045602 | negative regulation of endothelial cell differentiation(GO:0045602) |
| 0.2 | 0.5 | GO:0036333 | hepatocyte homeostasis(GO:0036333) response to tetrachloromethane(GO:1904772) |
| 0.2 | 0.6 | GO:0090202 | transcriptional activation by promoter-enhancer looping(GO:0071733) gene looping(GO:0090202) dsDNA loop formation(GO:0090579) |
| 0.2 | 0.6 | GO:0072299 | posterior mesonephric tubule development(GO:0072166) negative regulation of metanephric glomerulus development(GO:0072299) negative regulation of metanephric glomerular mesangial cell proliferation(GO:0072302) |
| 0.2 | 0.2 | GO:0046833 | positive regulation of RNA export from nucleus(GO:0046833) |
| 0.2 | 0.5 | GO:0009051 | pentose-phosphate shunt, oxidative branch(GO:0009051) |
| 0.1 | 0.6 | GO:0032053 | ciliary basal body organization(GO:0032053) |
| 0.1 | 1.0 | GO:0043570 | maintenance of DNA repeat elements(GO:0043570) |
| 0.1 | 0.4 | GO:0051684 | maintenance of Golgi location(GO:0051684) |
| 0.1 | 0.4 | GO:1903566 | positive regulation of protein localization to cilium(GO:1903566) |
| 0.1 | 0.4 | GO:0071048 | nuclear mRNA surveillance of spliceosomal pre-mRNA splicing(GO:0071030) nuclear retention of unspliced pre-mRNA at the site of transcription(GO:0071048) |
| 0.1 | 0.4 | GO:1904751 | positive regulation of protein localization to nucleolus(GO:1904751) |
| 0.1 | 0.4 | GO:0014016 | neuroblast differentiation(GO:0014016) |
| 0.1 | 0.9 | GO:0034316 | negative regulation of Arp2/3 complex-mediated actin nucleation(GO:0034316) |
| 0.1 | 0.5 | GO:0031339 | negative regulation of vesicle fusion(GO:0031339) |
| 0.1 | 0.1 | GO:1903438 | regulation of cytokinetic process(GO:0032954) regulation of mitotic cytokinetic process(GO:1903436) positive regulation of mitotic cytokinetic process(GO:1903438) positive regulation of mitotic cytokinesis(GO:1903490) |
| 0.1 | 0.5 | GO:0002884 | regulation of type IV hypersensitivity(GO:0001807) negative regulation of hypersensitivity(GO:0002884) |
| 0.1 | 0.4 | GO:0060648 | mammary gland bud morphogenesis(GO:0060648) |
| 0.1 | 1.2 | GO:0098789 | pre-mRNA cleavage required for polyadenylation(GO:0098789) |
| 0.1 | 0.3 | GO:2000523 | regulation of T cell costimulation(GO:2000523) positive regulation of T cell costimulation(GO:2000525) |
| 0.1 | 0.6 | GO:1905098 | negative regulation of guanyl-nucleotide exchange factor activity(GO:1905098) |
| 0.1 | 0.6 | GO:0036444 | calcium ion transmembrane import into mitochondrion(GO:0036444) |
| 0.1 | 0.4 | GO:0021796 | cerebral cortex regionalization(GO:0021796) |
| 0.1 | 1.1 | GO:0015889 | cobalamin transport(GO:0015889) |
| 0.1 | 0.4 | GO:0051661 | maintenance of centrosome location(GO:0051661) |
| 0.1 | 0.4 | GO:0009298 | GDP-mannose biosynthetic process(GO:0009298) |
| 0.1 | 0.6 | GO:0000712 | resolution of meiotic recombination intermediates(GO:0000712) |
| 0.1 | 0.3 | GO:1904579 | response to thapsigargin(GO:1904578) cellular response to thapsigargin(GO:1904579) |
| 0.1 | 0.7 | GO:2000825 | positive regulation of androgen receptor activity(GO:2000825) |
| 0.1 | 0.5 | GO:0090073 | positive regulation of protein homodimerization activity(GO:0090073) |
| 0.1 | 2.1 | GO:0006825 | copper ion transport(GO:0006825) |
| 0.1 | 0.2 | GO:0007566 | embryo implantation(GO:0007566) |
| 0.1 | 0.4 | GO:0008588 | release of cytoplasmic sequestered NF-kappaB(GO:0008588) |
| 0.1 | 0.3 | GO:0009224 | CMP salvage(GO:0006238) CMP biosynthetic process(GO:0009224) CMP metabolic process(GO:0046035) |
| 0.1 | 0.6 | GO:0000972 | transcription-dependent tethering of RNA polymerase II gene DNA at nuclear periphery(GO:0000972) |
| 0.1 | 0.4 | GO:0046601 | positive regulation of centriole replication(GO:0046601) |
| 0.1 | 0.7 | GO:0006335 | DNA replication-dependent nucleosome assembly(GO:0006335) DNA replication-dependent nucleosome organization(GO:0034723) |
| 0.1 | 0.5 | GO:1904885 | beta-catenin destruction complex assembly(GO:1904885) |
| 0.1 | 1.0 | GO:0072520 | seminiferous tubule development(GO:0072520) |
| 0.1 | 1.2 | GO:1990001 | inhibition of cysteine-type endopeptidase activity involved in apoptotic process(GO:1990001) |
| 0.1 | 0.2 | GO:1901535 | regulation of DNA demethylation(GO:1901535) negative regulation of DNA demethylation(GO:1901536) regulation of genetic imprinting(GO:2000653) |
| 0.1 | 1.8 | GO:0010669 | epithelial structure maintenance(GO:0010669) |
| 0.1 | 0.3 | GO:0006398 | mRNA 3'-end processing by stem-loop binding and cleavage(GO:0006398) |
| 0.1 | 0.2 | GO:1900195 | spindle assembly involved in female meiosis I(GO:0007057) positive regulation of oocyte maturation(GO:1900195) |
| 0.1 | 0.4 | GO:0031118 | rRNA pseudouridine synthesis(GO:0031118) |
| 0.1 | 0.2 | GO:0019276 | UDP-N-acetylgalactosamine metabolic process(GO:0019276) |
| 0.1 | 0.7 | GO:1903608 | protein localization to cytoplasmic stress granule(GO:1903608) |
| 0.1 | 0.4 | GO:1902746 | regulation of lens fiber cell differentiation(GO:1902746) |
| 0.1 | 0.4 | GO:0031087 | deadenylation-independent decapping of nuclear-transcribed mRNA(GO:0031087) |
| 0.1 | 0.2 | GO:0006425 | glutaminyl-tRNA aminoacylation(GO:0006425) |
| 0.1 | 0.5 | GO:0006552 | leucine catabolic process(GO:0006552) |
| 0.1 | 3.2 | GO:0007157 | heterophilic cell-cell adhesion via plasma membrane cell adhesion molecules(GO:0007157) |
| 0.1 | 1.0 | GO:0035020 | regulation of Rac protein signal transduction(GO:0035020) |
| 0.1 | 1.7 | GO:0061003 | positive regulation of dendritic spine morphogenesis(GO:0061003) |
| 0.1 | 0.3 | GO:1904098 | regulation of protein O-linked glycosylation(GO:1904098) positive regulation of protein O-linked glycosylation(GO:1904100) |
| 0.1 | 0.2 | GO:1903597 | negative regulation of gap junction assembly(GO:1903597) |
| 0.1 | 0.5 | GO:0051005 | negative regulation of lipoprotein lipase activity(GO:0051005) |
| 0.1 | 2.0 | GO:0002026 | regulation of the force of heart contraction(GO:0002026) |
| 0.1 | 0.3 | GO:0033591 | response to L-ascorbic acid(GO:0033591) |
| 0.1 | 0.3 | GO:0042866 | pyruvate biosynthetic process(GO:0042866) |
| 0.0 | 0.4 | GO:0000395 | mRNA 5'-splice site recognition(GO:0000395) |
| 0.0 | 0.7 | GO:0007076 | mitotic chromosome condensation(GO:0007076) |
| 0.0 | 0.4 | GO:0019695 | choline metabolic process(GO:0019695) |
| 0.0 | 0.6 | GO:0007096 | regulation of exit from mitosis(GO:0007096) |
| 0.0 | 0.3 | GO:0070562 | regulation of vitamin D receptor signaling pathway(GO:0070562) |
| 0.0 | 0.8 | GO:0000338 | protein deneddylation(GO:0000338) |
| 0.0 | 0.9 | GO:0000022 | mitotic spindle elongation(GO:0000022) |
| 0.0 | 0.5 | GO:0048387 | negative regulation of retinoic acid receptor signaling pathway(GO:0048387) |
| 0.0 | 1.3 | GO:0061641 | CENP-A containing nucleosome assembly(GO:0034080) CENP-A containing chromatin organization(GO:0061641) |
| 0.0 | 0.6 | GO:0045919 | positive regulation of cytolysis(GO:0045919) |
| 0.0 | 0.4 | GO:0006390 | transcription from mitochondrial promoter(GO:0006390) |
| 0.0 | 0.1 | GO:0035607 | vacuolar phosphate transport(GO:0007037) fibroblast growth factor receptor signaling pathway involved in orbitofrontal cortex development(GO:0035607) positive regulation of mitotic cell cycle DNA replication(GO:1903465) positive regulation of parathyroid hormone secretion(GO:2000830) |
| 0.0 | 0.2 | GO:0006627 | protein processing involved in protein targeting to mitochondrion(GO:0006627) |
| 0.0 | 0.3 | GO:0051414 | response to cortisol(GO:0051414) |
| 0.0 | 0.8 | GO:0046602 | regulation of mitotic centrosome separation(GO:0046602) |
| 0.0 | 0.2 | GO:0033314 | mitotic DNA replication checkpoint(GO:0033314) |
| 0.0 | 0.1 | GO:0045900 | negative regulation of translational elongation(GO:0045900) |
| 0.0 | 0.4 | GO:0015781 | pyrimidine nucleotide-sugar transport(GO:0015781) |
| 0.0 | 0.1 | GO:0006556 | S-adenosylmethionine biosynthetic process(GO:0006556) |
| 0.0 | 0.1 | GO:0072183 | negative regulation by virus of viral protein levels in host cell(GO:0046725) negative regulation of nephron tubule epithelial cell differentiation(GO:0072183) negative regulation of metanephric nephron tubule epithelial cell differentiation(GO:0072308) negative regulation of epithelial cell differentiation involved in kidney development(GO:2000697) |
| 0.0 | 1.4 | GO:0019430 | removal of superoxide radicals(GO:0019430) |
| 0.0 | 0.4 | GO:1901078 | negative regulation of relaxation of muscle(GO:1901078) negative regulation of relaxation of cardiac muscle(GO:1901898) |
| 0.0 | 0.2 | GO:0001507 | acetylcholine catabolic process in synaptic cleft(GO:0001507) acetylcholine catabolic process(GO:0006581) |
| 0.0 | 0.2 | GO:0055059 | asymmetric neuroblast division(GO:0055059) |
| 0.0 | 0.3 | GO:0070236 | regulation of activation-induced cell death of T cells(GO:0070235) negative regulation of activation-induced cell death of T cells(GO:0070236) |
| 0.0 | 0.3 | GO:0042908 | xenobiotic transport(GO:0042908) |
| 0.0 | 0.6 | GO:0000188 | inactivation of MAPK activity(GO:0000188) |
| 0.0 | 0.3 | GO:0006682 | galactosylceramide biosynthetic process(GO:0006682) galactolipid biosynthetic process(GO:0019375) |
| 0.0 | 0.3 | GO:0030091 | protein repair(GO:0030091) |
| 0.0 | 0.3 | GO:0010624 | regulation of Schwann cell proliferation(GO:0010624) negative regulation of Schwann cell proliferation(GO:0010626) |
| 0.0 | 0.1 | GO:0090206 | negative regulation of cholesterol biosynthetic process(GO:0045541) negative regulation of cholesterol metabolic process(GO:0090206) |
| 0.0 | 0.1 | GO:0030952 | establishment or maintenance of cytoskeleton polarity(GO:0030952) |
| 0.0 | 2.3 | GO:0006369 | termination of RNA polymerase II transcription(GO:0006369) |
| 0.0 | 0.1 | GO:0090649 | response to oxygen-glucose deprivation(GO:0090649) cellular response to oxygen-glucose deprivation(GO:0090650) |
| 0.0 | 0.5 | GO:0016024 | CDP-diacylglycerol biosynthetic process(GO:0016024) |
| 0.0 | 0.5 | GO:0035855 | megakaryocyte development(GO:0035855) |
| 0.0 | 0.3 | GO:0046007 | negative regulation of activated T cell proliferation(GO:0046007) |
| 0.0 | 0.3 | GO:0018344 | protein geranylgeranylation(GO:0018344) |
| 0.0 | 0.5 | GO:0090161 | Golgi ribbon formation(GO:0090161) |
| 0.0 | 0.2 | GO:0089700 | protein kinase D signaling(GO:0089700) |
| 0.0 | 0.2 | GO:0048549 | positive regulation of pinocytosis(GO:0048549) |
| 0.0 | 0.4 | GO:0046600 | negative regulation of centriole replication(GO:0046600) |
| 0.0 | 0.1 | GO:0031627 | telomeric loop formation(GO:0031627) negative regulation of protein localization to chromosome, telomeric region(GO:1904815) |
| 0.0 | 0.5 | GO:0016180 | snRNA processing(GO:0016180) |
| 0.0 | 0.1 | GO:1902626 | assembly of large subunit precursor of preribosome(GO:1902626) |
| 0.0 | 0.3 | GO:0007084 | mitotic nuclear envelope reassembly(GO:0007084) |
| 0.0 | 0.2 | GO:0007296 | vitellogenesis(GO:0007296) |
| 0.0 | 0.7 | GO:0043968 | histone H2A acetylation(GO:0043968) |
| 0.0 | 0.2 | GO:0060136 | embryonic process involved in female pregnancy(GO:0060136) |
| 0.0 | 0.2 | GO:0015793 | glycerol transport(GO:0015793) |
| 0.0 | 0.2 | GO:0061732 | mitochondrial acetyl-CoA biosynthetic process from pyruvate(GO:0061732) |
| 0.0 | 0.2 | GO:0015693 | magnesium ion transport(GO:0015693) |
| 0.0 | 3.2 | GO:0035335 | peptidyl-tyrosine dephosphorylation(GO:0035335) |
| 0.0 | 0.3 | GO:0090091 | positive regulation of extracellular matrix disassembly(GO:0090091) |
| 0.0 | 0.1 | GO:0002436 | immune complex clearance(GO:0002434) immune complex clearance by monocytes and macrophages(GO:0002436) regulation of immune complex clearance by monocytes and macrophages(GO:0090264) |
| 0.0 | 0.3 | GO:0031584 | activation of phospholipase D activity(GO:0031584) |
| 0.0 | 0.0 | GO:0000819 | sister chromatid segregation(GO:0000819) |
| 0.0 | 0.3 | GO:0016446 | somatic hypermutation of immunoglobulin genes(GO:0016446) |
| 0.0 | 0.2 | GO:0038092 | nodal signaling pathway(GO:0038092) |
| 0.0 | 0.3 | GO:0031053 | primary miRNA processing(GO:0031053) |
| 0.0 | 0.4 | GO:0050930 | induction of positive chemotaxis(GO:0050930) |
| 0.0 | 0.3 | GO:0090129 | positive regulation of synapse maturation(GO:0090129) |
| 0.0 | 0.2 | GO:0045292 | mRNA cis splicing, via spliceosome(GO:0045292) |
| 0.0 | 1.1 | GO:0048255 | mRNA stabilization(GO:0048255) |
| 0.0 | 0.1 | GO:0046010 | positive regulation of circadian sleep/wake cycle, non-REM sleep(GO:0046010) |
| 0.0 | 0.1 | GO:0019287 | isopentenyl diphosphate biosynthetic process, mevalonate pathway(GO:0019287) |
| 0.0 | 0.6 | GO:0060236 | regulation of mitotic spindle organization(GO:0060236) |
| 0.0 | 0.1 | GO:0048511 | rhythmic process(GO:0048511) |
| 0.0 | 0.2 | GO:0002051 | osteoblast fate commitment(GO:0002051) |
| 0.0 | 0.2 | GO:0034638 | phosphatidylcholine catabolic process(GO:0034638) |
| 0.0 | 0.0 | GO:0003094 | glomerular filtration(GO:0003094) renal filtration(GO:0097205) |
| 0.0 | 0.1 | GO:0051970 | negative regulation of transmission of nerve impulse(GO:0051970) positive regulation of acrosome reaction(GO:2000344) |
| 0.0 | 0.1 | GO:0070942 | neutrophil mediated cytotoxicity(GO:0070942) neutrophil mediated killing of symbiont cell(GO:0070943) neutrophil mediated killing of bacterium(GO:0070944) |
| 0.0 | 0.4 | GO:0006744 | ubiquinone biosynthetic process(GO:0006744) quinone biosynthetic process(GO:1901663) |
| 0.0 | 0.3 | GO:0006768 | biotin metabolic process(GO:0006768) |
| 0.0 | 0.4 | GO:0006646 | phosphatidylethanolamine biosynthetic process(GO:0006646) phosphatidylethanolamine metabolic process(GO:0046337) |
| 0.0 | 0.2 | GO:2000074 | regulation of type B pancreatic cell development(GO:2000074) |
| 0.0 | 0.1 | GO:0016559 | peroxisome fission(GO:0016559) |
| 0.0 | 0.1 | GO:0070407 | oxidation-dependent protein catabolic process(GO:0070407) |
| 0.0 | 0.7 | GO:0048246 | macrophage chemotaxis(GO:0048246) |
| 0.0 | 0.4 | GO:0031163 | iron-sulfur cluster assembly(GO:0016226) metallo-sulfur cluster assembly(GO:0031163) |
| 0.0 | 0.1 | GO:0042364 | water-soluble vitamin biosynthetic process(GO:0042364) |
| 0.0 | 0.1 | GO:0043449 | olfactory learning(GO:0008355) cellular alkene metabolic process(GO:0043449) |
| 0.0 | 0.5 | GO:1904659 | hexose transmembrane transport(GO:0035428) glucose transmembrane transport(GO:1904659) |
| 0.0 | 0.8 | GO:0006363 | termination of RNA polymerase I transcription(GO:0006363) |
| 0.0 | 0.2 | GO:0045732 | positive regulation of protein catabolic process(GO:0045732) |
| 0.0 | 0.1 | GO:0018094 | protein polyglycylation(GO:0018094) |
| 0.0 | 0.2 | GO:0000244 | spliceosomal tri-snRNP complex assembly(GO:0000244) |
| 0.0 | 0.7 | GO:0034260 | negative regulation of GTPase activity(GO:0034260) |
| 0.0 | 0.1 | GO:0030579 | ubiquitin-dependent SMAD protein catabolic process(GO:0030579) |
| 0.0 | 0.2 | GO:0000463 | maturation of LSU-rRNA from tricistronic rRNA transcript (SSU-rRNA, 5.8S rRNA, LSU-rRNA)(GO:0000463) |
| 0.0 | 0.0 | GO:0060437 | lung growth(GO:0060437) |
| 0.0 | 0.2 | GO:0051292 | nuclear pore complex assembly(GO:0051292) |
| 0.0 | 0.0 | GO:0060332 | positive regulation of response to interferon-gamma(GO:0060332) positive regulation of interferon-gamma-mediated signaling pathway(GO:0060335) |
| 0.0 | 0.2 | GO:0046785 | microtubule polymerization(GO:0046785) |
| 0.0 | 0.0 | GO:1900226 | negative regulation of NLRP3 inflammasome complex assembly(GO:1900226) |
| 0.0 | 0.2 | GO:0048227 | plasma membrane to endosome transport(GO:0048227) |
| 0.0 | 0.1 | GO:0000492 | box C/D snoRNP assembly(GO:0000492) |
| 0.0 | 0.2 | GO:0046051 | UTP biosynthetic process(GO:0006228) UTP metabolic process(GO:0046051) |
| 0.0 | 0.8 | GO:0045652 | regulation of megakaryocyte differentiation(GO:0045652) |
| 0.0 | 0.3 | GO:0001502 | cartilage condensation(GO:0001502) |
| 0.0 | 1.2 | GO:0006687 | glycosphingolipid metabolic process(GO:0006687) |
| 0.0 | 0.1 | GO:0032790 | ribosome disassembly(GO:0032790) |
| 0.0 | 0.1 | GO:1901096 | regulation of autophagosome maturation(GO:1901096) positive regulation of autophagosome maturation(GO:1901098) |
| 0.0 | 0.1 | GO:0060702 | regulation of mRNA cleavage(GO:0031437) negative regulation of mRNA cleavage(GO:0031438) negative regulation of immunoglobulin secretion(GO:0051025) regulation of endoribonuclease activity(GO:0060699) negative regulation of ribonuclease activity(GO:0060701) negative regulation of endoribonuclease activity(GO:0060702) regulation of mRNA endonucleolytic cleavage involved in unfolded protein response(GO:1904720) negative regulation of mRNA endonucleolytic cleavage involved in unfolded protein response(GO:1904721) |
| 0.0 | 0.3 | GO:2000114 | regulation of establishment of cell polarity(GO:2000114) |
| 0.0 | 0.4 | GO:0034314 | Arp2/3 complex-mediated actin nucleation(GO:0034314) |
| 0.0 | 0.1 | GO:0019050 | suppression by virus of host apoptotic process(GO:0019050) modulation by virus of host apoptotic process(GO:0039526) |
| 0.0 | 0.7 | GO:0043392 | negative regulation of DNA binding(GO:0043392) |
| 0.0 | 0.4 | GO:0042787 | protein ubiquitination involved in ubiquitin-dependent protein catabolic process(GO:0042787) |
| 0.0 | 0.1 | GO:1900864 | mitochondrial tRNA modification(GO:0070900) mitochondrial RNA modification(GO:1900864) |
| 0.0 | 0.2 | GO:0008635 | activation of cysteine-type endopeptidase activity involved in apoptotic process by cytochrome c(GO:0008635) |
| 0.0 | 0.1 | GO:0043982 | histone H4-K5 acetylation(GO:0043981) histone H4-K8 acetylation(GO:0043982) |
| 0.0 | 0.1 | GO:1904776 | regulation of protein localization to cell cortex(GO:1904776) positive regulation of protein localization to cell cortex(GO:1904778) |
| 0.0 | 0.8 | GO:0070125 | mitochondrial translational elongation(GO:0070125) mitochondrial translational termination(GO:0070126) |
| 0.0 | 0.4 | GO:0031572 | G2 DNA damage checkpoint(GO:0031572) |
| 0.0 | 0.8 | GO:0009060 | aerobic respiration(GO:0009060) |
| 0.0 | 2.1 | GO:0021915 | neural tube development(GO:0021915) |
| 0.0 | 1.0 | GO:0006334 | nucleosome assembly(GO:0006334) |
| 0.0 | 0.2 | GO:0070886 | positive regulation of calcineurin-NFAT signaling cascade(GO:0070886) |
| 0.0 | 0.7 | GO:0070373 | negative regulation of ERK1 and ERK2 cascade(GO:0070373) |
| 0.0 | 0.1 | GO:1904879 | positive regulation of calcium ion transmembrane transport via high voltage-gated calcium channel(GO:1904879) |
| 0.0 | 0.2 | GO:0007080 | mitotic metaphase plate congression(GO:0007080) |
Gene overrepresentation in C2:CP:REACTOME category:
| Log-likelihood per target | Total log-likelihood | Term | Description |
|---|---|---|---|
| 0.4 | 7.2 | REACTOME SYNTHESIS OF PE | Genes involved in Synthesis of PE |
| 0.2 | 3.5 | REACTOME SLBP DEPENDENT PROCESSING OF REPLICATION DEPENDENT HISTONE PRE MRNAS | Genes involved in SLBP Dependent Processing of Replication-Dependent Histone Pre-mRNAs |
| 0.2 | 1.8 | REACTOME SYNTHESIS OF BILE ACIDS AND BILE SALTS VIA 24 HYDROXYCHOLESTEROL | Genes involved in Synthesis of bile acids and bile salts via 24-hydroxycholesterol |
| 0.1 | 3.6 | REACTOME AMINO ACID SYNTHESIS AND INTERCONVERSION TRANSAMINATION | Genes involved in Amino acid synthesis and interconversion (transamination) |
| 0.1 | 4.3 | REACTOME APC CDC20 MEDIATED DEGRADATION OF NEK2A | Genes involved in APC-Cdc20 mediated degradation of Nek2A |
| 0.1 | 4.4 | REACTOME SIGNALING BY FGFR1 FUSION MUTANTS | Genes involved in Signaling by FGFR1 fusion mutants |
| 0.1 | 1.3 | REACTOME IRAK1 RECRUITS IKK COMPLEX | Genes involved in IRAK1 recruits IKK complex |
| 0.1 | 4.0 | REACTOME EXTENSION OF TELOMERES | Genes involved in Extension of Telomeres |
| 0.1 | 1.2 | REACTOME INTERACTIONS OF VPR WITH HOST CELLULAR PROTEINS | Genes involved in Interactions of Vpr with host cellular proteins |
| 0.1 | 1.1 | REACTOME RNA POL III CHAIN ELONGATION | Genes involved in RNA Polymerase III Chain Elongation |
| 0.1 | 1.6 | REACTOME G2 M DNA DAMAGE CHECKPOINT | Genes involved in G2/M DNA damage checkpoint |
| 0.1 | 2.0 | REACTOME KINESINS | Genes involved in Kinesins |
| 0.1 | 2.0 | REACTOME INSULIN SYNTHESIS AND PROCESSING | Genes involved in Insulin Synthesis and Processing |
| 0.1 | 0.8 | REACTOME PURINE CATABOLISM | Genes involved in Purine catabolism |
| 0.1 | 5.0 | REACTOME STRIATED MUSCLE CONTRACTION | Genes involved in Striated Muscle Contraction |
| 0.1 | 3.9 | REACTOME METABOLISM OF NON CODING RNA | Genes involved in Metabolism of non-coding RNA |
| 0.1 | 0.2 | REACTOME APC C CDH1 MEDIATED DEGRADATION OF CDC20 AND OTHER APC C CDH1 TARGETED PROTEINS IN LATE MITOSIS EARLY G1 | Genes involved in APC/C:Cdh1 mediated degradation of Cdc20 and other APC/C:Cdh1 targeted proteins in late mitosis/early G1 |
| 0.1 | 0.8 | REACTOME ACTIVATION OF CHAPERONE GENES BY ATF6 ALPHA | Genes involved in Activation of Chaperone Genes by ATF6-alpha |
| 0.1 | 0.7 | REACTOME INHIBITION OF REPLICATION INITIATION OF DAMAGED DNA BY RB1 E2F1 | Genes involved in Inhibition of replication initiation of damaged DNA by RB1/E2F1 |
| 0.1 | 0.8 | REACTOME SYNTHESIS SECRETION AND DEACYLATION OF GHRELIN | Genes involved in Synthesis, Secretion, and Deacylation of Ghrelin |
| 0.1 | 0.7 | REACTOME ROLE OF SECOND MESSENGERS IN NETRIN1 SIGNALING | Genes involved in Role of second messengers in netrin-1 signaling |
| 0.1 | 1.7 | REACTOME SYNTHESIS AND INTERCONVERSION OF NUCLEOTIDE DI AND TRIPHOSPHATES | Genes involved in Synthesis and interconversion of nucleotide di- and triphosphates |
| 0.1 | 7.3 | REACTOME MRNA SPLICING | Genes involved in mRNA Splicing |
| 0.1 | 1.0 | REACTOME RESOLUTION OF AP SITES VIA THE SINGLE NUCLEOTIDE REPLACEMENT PATHWAY | Genes involved in Resolution of AP sites via the single-nucleotide replacement pathway |
| 0.0 | 0.9 | REACTOME HYALURONAN UPTAKE AND DEGRADATION | Genes involved in Hyaluronan uptake and degradation |
| 0.0 | 3.0 | REACTOME MITOTIC PROMETAPHASE | Genes involved in Mitotic Prometaphase |
| 0.0 | 0.4 | REACTOME SYNTHESIS OF PIPS AT THE LATE ENDOSOME MEMBRANE | Genes involved in Synthesis of PIPs at the late endosome membrane |
| 0.0 | 0.5 | REACTOME MRNA DECAY BY 5 TO 3 EXORIBONUCLEASE | Genes involved in mRNA Decay by 5' to 3' Exoribonuclease |
| 0.0 | 1.1 | REACTOME PYRIMIDINE METABOLISM | Genes involved in Pyrimidine metabolism |
| 0.0 | 0.4 | REACTOME REGULATION OF INSULIN SECRETION BY ACETYLCHOLINE | Genes involved in Regulation of Insulin Secretion by Acetylcholine |
| 0.0 | 1.0 | REACTOME EXTRINSIC PATHWAY FOR APOPTOSIS | Genes involved in Extrinsic Pathway for Apoptosis |
| 0.0 | 0.9 | REACTOME CASPASE MEDIATED CLEAVAGE OF CYTOSKELETAL PROTEINS | Genes involved in Caspase-mediated cleavage of cytoskeletal proteins |
| 0.0 | 1.9 | REACTOME RNA POL I PROMOTER OPENING | Genes involved in RNA Polymerase I Promoter Opening |
| 0.0 | 2.1 | REACTOME METABOLISM OF VITAMINS AND COFACTORS | Genes involved in Metabolism of vitamins and cofactors |
| 0.0 | 2.4 | REACTOME LOSS OF NLP FROM MITOTIC CENTROSOMES | Genes involved in Loss of Nlp from mitotic centrosomes |
| 0.0 | 1.0 | REACTOME PTM GAMMA CARBOXYLATION HYPUSINE FORMATION AND ARYLSULFATASE ACTIVATION | Genes involved in PTM: gamma carboxylation, hypusine formation and arylsulfatase activation |
| 0.0 | 0.7 | REACTOME INFLAMMASOMES | Genes involved in Inflammasomes |
| 0.0 | 0.8 | REACTOME ACTIVATION OF ATR IN RESPONSE TO REPLICATION STRESS | Genes involved in Activation of ATR in response to replication stress |
| 0.0 | 0.5 | REACTOME UNBLOCKING OF NMDA RECEPTOR GLUTAMATE BINDING AND ACTIVATION | Genes involved in Unblocking of NMDA receptor, glutamate binding and activation |
| 0.0 | 0.4 | REACTOME TGF BETA RECEPTOR SIGNALING IN EMT EPITHELIAL TO MESENCHYMAL TRANSITION | Genes involved in TGF-beta receptor signaling in EMT (epithelial to mesenchymal transition) |
| 0.0 | 0.4 | REACTOME POST CHAPERONIN TUBULIN FOLDING PATHWAY | Genes involved in Post-chaperonin tubulin folding pathway |
| 0.0 | 0.4 | REACTOME SIGNALING BY HIPPO | Genes involved in Signaling by Hippo |
| 0.0 | 0.5 | REACTOME BMAL1 CLOCK NPAS2 ACTIVATES CIRCADIAN EXPRESSION | Genes involved in BMAL1:CLOCK/NPAS2 Activates Circadian Expression |
| 0.0 | 0.8 | REACTOME SYNTHESIS OF PIPS AT THE PLASMA MEMBRANE | Genes involved in Synthesis of PIPs at the plasma membrane |
| 0.0 | 1.0 | REACTOME MITOCHONDRIAL PROTEIN IMPORT | Genes involved in Mitochondrial Protein Import |
| 0.0 | 0.4 | REACTOME OTHER SEMAPHORIN INTERACTIONS | Genes involved in Other semaphorin interactions |
| 0.0 | 0.8 | REACTOME G1 PHASE | Genes involved in G1 Phase |
| 0.0 | 0.4 | REACTOME GRB2 SOS PROVIDES LINKAGE TO MAPK SIGNALING FOR INTERGRINS | Genes involved in GRB2:SOS provides linkage to MAPK signaling for Intergrins |
| 0.0 | 1.0 | REACTOME CHEMOKINE RECEPTORS BIND CHEMOKINES | Genes involved in Chemokine receptors bind chemokines |
| 0.0 | 0.7 | REACTOME GLYCOLYSIS | Genes involved in Glycolysis |
| 0.0 | 0.2 | REACTOME KERATAN SULFATE DEGRADATION | Genes involved in Keratan sulfate degradation |
| 0.0 | 0.5 | REACTOME EFFECTS OF PIP2 HYDROLYSIS | Genes involved in Effects of PIP2 hydrolysis |
| 0.0 | 0.2 | REACTOME SEROTONIN RECEPTORS | Genes involved in Serotonin receptors |
| 0.0 | 1.7 | REACTOME L1CAM INTERACTIONS | Genes involved in L1CAM interactions |
| 0.0 | 0.3 | REACTOME PYRUVATE METABOLISM | Genes involved in Pyruvate metabolism |
| 0.0 | 0.5 | REACTOME NOTCH1 INTRACELLULAR DOMAIN REGULATES TRANSCRIPTION | Genes involved in NOTCH1 Intracellular Domain Regulates Transcription |
| 0.0 | 0.8 | REACTOME FORMATION OF THE TERNARY COMPLEX AND SUBSEQUENTLY THE 43S COMPLEX | Genes involved in Formation of the ternary complex, and subsequently, the 43S complex |
Gene overrepresentation in C2:CP:REACTOME category:
| Log-likelihood per target | Total log-likelihood | Term | Description |
|---|---|---|---|
| 0.2 | 4.5 | REACTOME KINESINS | Genes involved in Kinesins |
| 0.1 | 4.6 | REACTOME ACTIVATION OF ATR IN RESPONSE TO REPLICATION STRESS | Genes involved in Activation of ATR in response to replication stress |
| 0.1 | 2.1 | REACTOME METAL ION SLC TRANSPORTERS | Genes involved in Metal ion SLC transporters |
| 0.1 | 0.5 | REACTOME CTNNB1 PHOSPHORYLATION CASCADE | Genes involved in Beta-catenin phosphorylation cascade |
| 0.0 | 1.9 | REACTOME GROWTH HORMONE RECEPTOR SIGNALING | Genes involved in Growth hormone receptor signaling |
| 0.0 | 1.8 | REACTOME NEP NS2 INTERACTS WITH THE CELLULAR EXPORT MACHINERY | Genes involved in NEP/NS2 Interacts with the Cellular Export Machinery |
| 0.0 | 1.1 | REACTOME INSULIN SYNTHESIS AND PROCESSING | Genes involved in Insulin Synthesis and Processing |
| 0.0 | 1.7 | REACTOME ERK MAPK TARGETS | Genes involved in ERK/MAPK targets |
| 0.0 | 0.8 | REACTOME SYNTHESIS OF PE | Genes involved in Synthesis of PE |
| 0.0 | 3.1 | REACTOME MITOTIC PROMETAPHASE | Genes involved in Mitotic Prometaphase |
| 0.0 | 0.5 | REACTOME SYNTHESIS SECRETION AND DEACYLATION OF GHRELIN | Genes involved in Synthesis, Secretion, and Deacylation of Ghrelin |
| 0.0 | 0.3 | REACTOME APOBEC3G MEDIATED RESISTANCE TO HIV1 INFECTION | Genes involved in APOBEC3G mediated resistance to HIV-1 infection |
| 0.0 | 2.2 | REACTOME STRIATED MUSCLE CONTRACTION | Genes involved in Striated Muscle Contraction |
| 0.0 | 0.9 | REACTOME MICRORNA MIRNA BIOGENESIS | Genes involved in MicroRNA (miRNA) Biogenesis |
| 0.0 | 0.4 | REACTOME ACTIVATION OF CHAPERONE GENES BY ATF6 ALPHA | Genes involved in Activation of Chaperone Genes by ATF6-alpha |
| 0.0 | 0.6 | REACTOME EXTENSION OF TELOMERES | Genes involved in Extension of Telomeres |
| 0.0 | 1.2 | REACTOME DEPOSITION OF NEW CENPA CONTAINING NUCLEOSOMES AT THE CENTROMERE | Genes involved in Deposition of New CENPA-containing Nucleosomes at the Centromere |
| 0.0 | 0.3 | REACTOME PURINE CATABOLISM | Genes involved in Purine catabolism |
| 0.0 | 0.4 | REACTOME SYNTHESIS OF SUBSTRATES IN N GLYCAN BIOSYTHESIS | Genes involved in Synthesis of substrates in N-glycan biosythesis |
| 0.0 | 0.3 | REACTOME SLBP DEPENDENT PROCESSING OF REPLICATION DEPENDENT HISTONE PRE MRNAS | Genes involved in SLBP Dependent Processing of Replication-Dependent Histone Pre-mRNAs |
| 0.0 | 0.5 | REACTOME BRANCHED CHAIN AMINO ACID CATABOLISM | Genes involved in Branched-chain amino acid catabolism |
| 0.0 | 0.6 | REACTOME DEADENYLATION OF MRNA | Genes involved in Deadenylation of mRNA |
| 0.0 | 0.3 | REACTOME AKT PHOSPHORYLATES TARGETS IN THE CYTOSOL | Genes involved in AKT phosphorylates targets in the cytosol |
| 0.0 | 0.3 | REACTOME RNA POL III TRANSCRIPTION INITIATION FROM TYPE 2 PROMOTER | Genes involved in RNA Polymerase III Transcription Initiation From Type 2 Promoter |
| 0.0 | 0.1 | REACTOME INTERACTIONS OF VPR WITH HOST CELLULAR PROTEINS | Genes involved in Interactions of Vpr with host cellular proteins |
| 0.0 | 0.3 | REACTOME INHIBITION OF THE PROTEOLYTIC ACTIVITY OF APC C REQUIRED FOR THE ONSET OF ANAPHASE BY MITOTIC SPINDLE CHECKPOINT COMPONENTS | Genes involved in Inhibition of the proteolytic activity of APC/C required for the onset of anaphase by mitotic spindle checkpoint components |
| 0.0 | 0.5 | REACTOME SYNTHESIS OF PA | Genes involved in Synthesis of PA |
| 0.0 | 0.2 | REACTOME MTORC1 MEDIATED SIGNALLING | Genes involved in mTORC1-mediated signalling |
| 0.0 | 0.2 | REACTOME REGULATION OF PYRUVATE DEHYDROGENASE PDH COMPLEX | Genes involved in Regulation of pyruvate dehydrogenase (PDH) complex |
| 0.0 | 0.4 | REACTOME TRANSPORT OF MATURE TRANSCRIPT TO CYTOPLASM | Genes involved in Transport of Mature Transcript to Cytoplasm |
| 0.0 | 0.4 | REACTOME SIGNALING BY FGFR1 FUSION MUTANTS | Genes involved in Signaling by FGFR1 fusion mutants |
| 0.0 | 0.2 | REACTOME PASSIVE TRANSPORT BY AQUAPORINS | Genes involved in Passive Transport by Aquaporins |
| 0.0 | 0.5 | REACTOME ABC FAMILY PROTEINS MEDIATED TRANSPORT | Genes involved in ABC-family proteins mediated transport |
| 0.0 | 0.3 | REACTOME REGULATION OF GENE EXPRESSION IN BETA CELLS | Genes involved in Regulation of gene expression in beta cells |
| 0.0 | 0.5 | REACTOME BASIGIN INTERACTIONS | Genes involved in Basigin interactions |
Gene overrepresentation in cellular_component category:
| Log-likelihood per target | Total log-likelihood | Term | Description |
|---|---|---|---|
| 0.4 | 1.1 | GO:0005588 | collagen type V trimer(GO:0005588) |
| 0.3 | 1.3 | GO:0048787 | presynaptic active zone membrane(GO:0048787) |
| 0.2 | 2.8 | GO:0005589 | collagen type VI trimer(GO:0005589) collagen beaded filament(GO:0098647) |
| 0.2 | 2.5 | GO:0035631 | CD40 receptor complex(GO:0035631) |
| 0.1 | 0.6 | GO:0031673 | H zone(GO:0031673) |
| 0.1 | 0.4 | GO:0048269 | methionine adenosyltransferase complex(GO:0048269) |
| 0.1 | 0.8 | GO:0097169 | AIM2 inflammasome complex(GO:0097169) |
| 0.1 | 0.4 | GO:0036128 | CatSper complex(GO:0036128) |
| 0.1 | 0.3 | GO:0033263 | CORVET complex(GO:0033263) |
| 0.1 | 1.3 | GO:0042613 | MHC class II protein complex(GO:0042613) |
| 0.1 | 0.4 | GO:0000813 | ESCRT I complex(GO:0000813) |
| 0.1 | 4.8 | GO:0035580 | specific granule lumen(GO:0035580) |
| 0.0 | 0.2 | GO:0005712 | chiasma(GO:0005712) |
| 0.0 | 0.2 | GO:0005600 | collagen type XIII trimer(GO:0005600) transmembrane collagen trimer(GO:0030936) |
| 0.0 | 0.5 | GO:0032045 | guanyl-nucleotide exchange factor complex(GO:0032045) |
| 0.0 | 0.1 | GO:0019008 | molybdopterin synthase complex(GO:0019008) |
| 0.0 | 0.3 | GO:0016012 | sarcoglycan complex(GO:0016012) |
| 0.0 | 0.1 | GO:0031166 | integral component of vacuolar membrane(GO:0031166) |
| 0.0 | 0.2 | GO:0000408 | EKC/KEOPS complex(GO:0000408) |
| 0.0 | 0.1 | GO:0030891 | VCB complex(GO:0030891) |
| 0.0 | 0.9 | GO:0032839 | dendrite cytoplasm(GO:0032839) |
| 0.0 | 0.4 | GO:0017146 | NMDA selective glutamate receptor complex(GO:0017146) |
| 0.0 | 0.2 | GO:0031464 | Cul4A-RING E3 ubiquitin ligase complex(GO:0031464) |
| 0.0 | 0.4 | GO:0071782 | endoplasmic reticulum tubular network(GO:0071782) |
| 0.0 | 0.3 | GO:0000124 | SAGA complex(GO:0000124) |
| 0.0 | 0.5 | GO:0031092 | platelet alpha granule membrane(GO:0031092) |
| 0.0 | 0.2 | GO:0008385 | IkappaB kinase complex(GO:0008385) |
| 0.0 | 1.8 | GO:0070469 | respiratory chain(GO:0070469) |
| 0.0 | 0.4 | GO:0000145 | exocyst(GO:0000145) |
| 0.0 | 0.6 | GO:0016592 | mediator complex(GO:0016592) |
| 0.0 | 0.8 | GO:0019005 | SCF ubiquitin ligase complex(GO:0019005) |
| 0.0 | 0.2 | GO:0031209 | SCAR complex(GO:0031209) |
| 0.0 | 0.1 | GO:0061574 | ASAP complex(GO:0061574) |
| 0.0 | 0.7 | GO:0031941 | filamentous actin(GO:0031941) |
| 0.0 | 0.1 | GO:0000796 | condensin complex(GO:0000796) |
| 0.0 | 0.4 | GO:0005680 | anaphase-promoting complex(GO:0005680) |
| 0.0 | 0.7 | GO:0001772 | immunological synapse(GO:0001772) |
| 0.0 | 0.1 | GO:0034464 | BBSome(GO:0034464) |
| 0.0 | 0.1 | GO:1990130 | Iml1 complex(GO:1990130) |
| 0.0 | 0.4 | GO:0044322 | endoplasmic reticulum quality control compartment(GO:0044322) |
Gene overrepresentation in biological_process category:
| Log-likelihood per target | Total log-likelihood | Term | Description |
|---|---|---|---|
| 0.9 | 4.5 | GO:0052199 | negative regulation of catalytic activity in other organism involved in symbiotic interaction(GO:0052199) |
| 0.6 | 2.6 | GO:0003185 | primary heart field specification(GO:0003138) sinoatrial valve development(GO:0003172) sinoatrial valve morphogenesis(GO:0003185) |
| 0.4 | 1.3 | GO:1905154 | negative regulation of membrane invagination(GO:1905154) |
| 0.3 | 1.0 | GO:0031548 | regulation of brain-derived neurotrophic factor receptor signaling pathway(GO:0031548) |
| 0.3 | 1.1 | GO:1903224 | regulation of endodermal cell differentiation(GO:1903224) |
| 0.2 | 2.8 | GO:1900747 | negative regulation of vascular endothelial growth factor signaling pathway(GO:1900747) |
| 0.2 | 1.8 | GO:0045602 | negative regulation of endothelial cell differentiation(GO:0045602) |
| 0.2 | 1.2 | GO:0009098 | branched-chain amino acid biosynthetic process(GO:0009082) leucine biosynthetic process(GO:0009098) valine biosynthetic process(GO:0009099) |
| 0.2 | 0.8 | GO:2000504 | positive regulation of blood vessel remodeling(GO:2000504) |
| 0.2 | 0.6 | GO:0072137 | condensed mesenchymal cell proliferation(GO:0072137) |
| 0.2 | 1.2 | GO:2000546 | positive regulation of cell chemotaxis to fibroblast growth factor(GO:1904849) positive regulation of endothelial cell chemotaxis to fibroblast growth factor(GO:2000546) |
| 0.2 | 0.7 | GO:0043128 | regulation of 1-phosphatidylinositol 4-kinase activity(GO:0043126) positive regulation of 1-phosphatidylinositol 4-kinase activity(GO:0043128) |
| 0.2 | 0.5 | GO:0098923 | retrograde trans-synaptic signaling by soluble gas(GO:0098923) trans-synaptic signaling by soluble gas(GO:0099543) trans-synaptic signaling by trans-synaptic complex(GO:0099545) |
| 0.1 | 0.4 | GO:0070086 | protein targeting to vacuole involved in ubiquitin-dependent protein catabolic process via the multivesicular body sorting pathway(GO:0043328) ubiquitin-dependent endocytosis(GO:0070086) regulation of ubiquitin-dependent endocytosis(GO:2000395) positive regulation of ubiquitin-dependent endocytosis(GO:2000397) |
| 0.1 | 1.0 | GO:0034351 | regulation of glial cell apoptotic process(GO:0034350) negative regulation of glial cell apoptotic process(GO:0034351) |
| 0.1 | 0.5 | GO:0097498 | endothelial tube lumen extension(GO:0097498) |
| 0.1 | 0.4 | GO:0006556 | S-adenosylmethionine biosynthetic process(GO:0006556) |
| 0.1 | 0.6 | GO:0060613 | fat pad development(GO:0060613) |
| 0.1 | 0.3 | GO:0044314 | protein K27-linked ubiquitination(GO:0044314) |
| 0.1 | 0.3 | GO:0070541 | response to platinum ion(GO:0070541) cellular response to lead ion(GO:0071284) |
| 0.1 | 0.4 | GO:0060392 | negative regulation of SMAD protein import into nucleus(GO:0060392) |
| 0.1 | 0.8 | GO:0035542 | regulation of SNARE complex assembly(GO:0035542) |
| 0.1 | 0.4 | GO:0002399 | MHC class II protein complex assembly(GO:0002399) |
| 0.1 | 0.2 | GO:0045897 | positive regulation of transcription during mitosis(GO:0045897) |
| 0.1 | 0.1 | GO:1901668 | regulation of superoxide dismutase activity(GO:1901668) |
| 0.1 | 0.5 | GO:2000332 | lipoprotein particle mediated signaling(GO:0055095) low-density lipoprotein particle mediated signaling(GO:0055096) blood microparticle formation(GO:0072564) regulation of blood microparticle formation(GO:2000332) positive regulation of blood microparticle formation(GO:2000334) |
| 0.1 | 0.6 | GO:0008090 | retrograde axonal transport(GO:0008090) |
| 0.1 | 0.2 | GO:0044240 | multicellular organism lipid catabolic process(GO:0044240) |
| 0.1 | 0.2 | GO:2001151 | regulation of renal water transport(GO:2001151) positive regulation of renal water transport(GO:2001153) |
| 0.1 | 0.2 | GO:0007089 | traversing start control point of mitotic cell cycle(GO:0007089) |
| 0.1 | 0.2 | GO:0002949 | tRNA threonylcarbamoyladenosine modification(GO:0002949) |
| 0.1 | 0.4 | GO:1903265 | positive regulation of tumor necrosis factor-mediated signaling pathway(GO:1903265) |
| 0.1 | 0.9 | GO:0043562 | cellular response to nitrogen starvation(GO:0006995) cellular response to nitrogen levels(GO:0043562) |
| 0.1 | 0.3 | GO:0010724 | regulation of definitive erythrocyte differentiation(GO:0010724) |
| 0.0 | 0.1 | GO:0019442 | tryptophan catabolic process to acetyl-CoA(GO:0019442) |
| 0.0 | 0.3 | GO:0070269 | pyroptosis(GO:0070269) |
| 0.0 | 0.3 | GO:0048280 | vesicle fusion with Golgi apparatus(GO:0048280) |
| 0.0 | 0.5 | GO:0000463 | maturation of LSU-rRNA from tricistronic rRNA transcript (SSU-rRNA, 5.8S rRNA, LSU-rRNA)(GO:0000463) |
| 0.0 | 0.3 | GO:0098535 | de novo centriole assembly(GO:0098535) |
| 0.0 | 0.4 | GO:0015747 | urate transport(GO:0015747) |
| 0.0 | 0.9 | GO:0051764 | actin crosslink formation(GO:0051764) |
| 0.0 | 0.1 | GO:1904772 | hepatocyte homeostasis(GO:0036333) response to tetrachloromethane(GO:1904772) |
| 0.0 | 0.1 | GO:1902309 | regulation of heart rate by hormone(GO:0003064) negative regulation of peptidyl-serine dephosphorylation(GO:1902309) |
| 0.0 | 0.2 | GO:1903566 | positive regulation of protein localization to cilium(GO:1903566) |
| 0.0 | 0.2 | GO:0090073 | positive regulation of protein homodimerization activity(GO:0090073) |
| 0.0 | 0.3 | GO:0014894 | response to muscle inactivity involved in regulation of muscle adaptation(GO:0014877) response to denervation involved in regulation of muscle adaptation(GO:0014894) |
| 0.0 | 0.2 | GO:0018095 | protein polyglutamylation(GO:0018095) |
| 0.0 | 0.5 | GO:0019852 | L-ascorbic acid metabolic process(GO:0019852) |
| 0.0 | 0.1 | GO:0002101 | tRNA wobble cytosine modification(GO:0002101) |
| 0.0 | 0.2 | GO:0010032 | meiotic chromosome condensation(GO:0010032) |
| 0.0 | 0.3 | GO:2000786 | positive regulation of autophagosome assembly(GO:2000786) |
| 0.0 | 0.1 | GO:0036369 | transcription factor catabolic process(GO:0036369) |
| 0.0 | 0.3 | GO:0042989 | sequestering of actin monomers(GO:0042989) |
| 0.0 | 0.1 | GO:0009191 | ribonucleoside diphosphate catabolic process(GO:0009191) |
| 0.0 | 0.6 | GO:0006883 | cellular sodium ion homeostasis(GO:0006883) |
| 0.0 | 0.1 | GO:0007468 | regulation of rhodopsin gene expression(GO:0007468) |
| 0.0 | 0.6 | GO:0000028 | ribosomal small subunit assembly(GO:0000028) |
| 0.0 | 0.1 | GO:0051694 | pointed-end actin filament capping(GO:0051694) |
| 0.0 | 0.2 | GO:0070862 | negative regulation of protein exit from endoplasmic reticulum(GO:0070862) negative regulation of retrograde protein transport, ER to cytosol(GO:1904153) |
| 0.0 | 0.2 | GO:0090043 | regulation of tubulin deacetylation(GO:0090043) |
| 0.0 | 0.1 | GO:0007144 | female meiosis I(GO:0007144) |
| 0.0 | 2.4 | GO:1902600 | hydrogen ion transmembrane transport(GO:1902600) |
| 0.0 | 0.2 | GO:1900113 | histone H3-K36 demethylation(GO:0070544) negative regulation of histone H3-K9 trimethylation(GO:1900113) |
| 0.0 | 0.5 | GO:0095500 | acetylcholine receptor signaling pathway(GO:0095500) postsynaptic signal transduction(GO:0098926) signal transduction involved in cellular response to ammonium ion(GO:1903831) response to acetylcholine(GO:1905144) cellular response to acetylcholine(GO:1905145) |
| 0.0 | 0.2 | GO:0015781 | pyrimidine nucleotide-sugar transport(GO:0015781) |
| 0.0 | 0.2 | GO:2000601 | positive regulation of Arp2/3 complex-mediated actin nucleation(GO:2000601) |
| 0.0 | 0.0 | GO:0046080 | dUTP metabolic process(GO:0046080) dUTP catabolic process(GO:0046081) |
| 0.0 | 0.1 | GO:0006574 | valine catabolic process(GO:0006574) |
| 0.0 | 0.0 | GO:0051311 | meiotic metaphase I plate congression(GO:0043060) meiotic spindle midzone assembly(GO:0051257) meiotic metaphase plate congression(GO:0051311) |
| 0.0 | 0.1 | GO:2001184 | positive regulation of interleukin-12 secretion(GO:2001184) |
| 0.0 | 0.4 | GO:0006525 | arginine metabolic process(GO:0006525) |
| 0.0 | 0.1 | GO:0046813 | receptor-mediated virion attachment to host cell(GO:0046813) |
| 0.0 | 0.4 | GO:0071450 | cellular response to oxygen radical(GO:0071450) cellular response to superoxide(GO:0071451) |
| 0.0 | 0.6 | GO:0006376 | mRNA splice site selection(GO:0006376) |
| 0.0 | 0.9 | GO:0032729 | positive regulation of interferon-gamma production(GO:0032729) |
| 0.0 | 3.3 | GO:0043123 | positive regulation of I-kappaB kinase/NF-kappaB signaling(GO:0043123) |
| 0.0 | 0.2 | GO:0006488 | dolichol-linked oligosaccharide biosynthetic process(GO:0006488) |
| 0.0 | 0.2 | GO:0071786 | endoplasmic reticulum tubular network organization(GO:0071786) |
| 0.0 | 0.1 | GO:0090235 | regulation of metaphase plate congression(GO:0090235) |
| 0.0 | 0.6 | GO:0009409 | response to cold(GO:0009409) |
Gene overrepresentation in molecular_function category:
| Log-likelihood per target | Total log-likelihood | Term | Description |
|---|---|---|---|
| 1.9 | 5.6 | GO:0004103 | choline kinase activity(GO:0004103) |
| 1.2 | 5.0 | GO:0032038 | myosin II heavy chain binding(GO:0032038) |
| 1.0 | 3.9 | GO:0030292 | protein tyrosine kinase inhibitor activity(GO:0030292) |
| 0.7 | 2.2 | GO:0030627 | pre-mRNA 5'-splice site binding(GO:0030627) |
| 0.7 | 2.9 | GO:0004735 | pyrroline-5-carboxylate reductase activity(GO:0004735) |
| 0.6 | 3.6 | GO:0043141 | ATP-dependent 5'-3' DNA helicase activity(GO:0043141) |
| 0.6 | 2.3 | GO:0047066 | phospholipid-hydroperoxide glutathione peroxidase activity(GO:0047066) |
| 0.5 | 1.5 | GO:0008798 | beta-aspartyl-peptidase activity(GO:0008798) |
| 0.5 | 1.4 | GO:0070410 | co-SMAD binding(GO:0070410) |
| 0.4 | 1.7 | GO:0032143 | single thymine insertion binding(GO:0032143) |
| 0.4 | 1.6 | GO:0005220 | inositol 1,4,5-trisphosphate-sensitive calcium-release channel activity(GO:0005220) |
| 0.4 | 1.8 | GO:0052840 | endopolyphosphatase activity(GO:0000298) diphosphoinositol-polyphosphate diphosphatase activity(GO:0008486) bis(5'-adenosyl)-hexaphosphatase activity(GO:0034431) bis(5'-adenosyl)-pentaphosphatase activity(GO:0034432) inositol diphosphate tetrakisphosphate diphosphatase activity(GO:0052840) inositol bisdiphosphate tetrakisphosphate diphosphatase activity(GO:0052841) inositol diphosphate pentakisphosphate diphosphatase activity(GO:0052842) inositol-1-diphosphate-2,3,4,5,6-pentakisphosphate diphosphatase activity(GO:0052843) inositol-3-diphosphate-1,2,4,5,6-pentakisphosphate diphosphatase activity(GO:0052844) inositol-5-diphosphate-1,2,3,4,6-pentakisphosphate diphosphatase activity(GO:0052845) inositol-1,5-bisdiphosphate-2,3,4,6-tetrakisphosphate 1-diphosphatase activity(GO:0052846) inositol-1,5-bisdiphosphate-2,3,4,6-tetrakisphosphate 5-diphosphatase activity(GO:0052847) inositol-3,5-bisdiphosphate-2,3,4,6-tetrakisphosphate 5-diphosphatase activity(GO:0052848) |
| 0.3 | 1.7 | GO:0044729 | hemi-methylated DNA-binding(GO:0044729) |
| 0.3 | 2.0 | GO:0010997 | anaphase-promoting complex binding(GO:0010997) |
| 0.3 | 1.6 | GO:0004306 | ethanolamine-phosphate cytidylyltransferase activity(GO:0004306) |
| 0.3 | 0.8 | GO:0005174 | CD40 receptor binding(GO:0005174) |
| 0.3 | 0.8 | GO:0004756 | selenide, water dikinase activity(GO:0004756) phosphotransferase activity, paired acceptors(GO:0016781) |
| 0.2 | 1.4 | GO:0042577 | lipid phosphatase activity(GO:0042577) |
| 0.2 | 3.5 | GO:0016174 | NAD(P)H oxidase activity(GO:0016174) |
| 0.2 | 0.9 | GO:0004566 | beta-glucuronidase activity(GO:0004566) |
| 0.2 | 0.7 | GO:0015235 | cobalamin transporter activity(GO:0015235) |
| 0.2 | 0.6 | GO:0004616 | phosphogluconate dehydrogenase (decarboxylating) activity(GO:0004616) |
| 0.2 | 0.6 | GO:0004514 | nicotinate-nucleotide diphosphorylase (carboxylating) activity(GO:0004514) |
| 0.2 | 0.4 | GO:0003887 | DNA-directed DNA polymerase activity(GO:0003887) |
| 0.2 | 1.6 | GO:0070087 | chromo shadow domain binding(GO:0070087) |
| 0.2 | 0.6 | GO:0032422 | purine-rich negative regulatory element binding(GO:0032422) |
| 0.2 | 1.5 | GO:0050833 | pyruvate transmembrane transporter activity(GO:0050833) |
| 0.2 | 1.1 | GO:0008568 | microtubule-severing ATPase activity(GO:0008568) |
| 0.2 | 0.9 | GO:0070728 | leucine binding(GO:0070728) |
| 0.2 | 1.1 | GO:0030492 | hemoglobin binding(GO:0030492) |
| 0.2 | 1.2 | GO:0004849 | uridine kinase activity(GO:0004849) |
| 0.2 | 1.7 | GO:0051425 | PTB domain binding(GO:0051425) |
| 0.2 | 0.8 | GO:0071208 | histone pre-mRNA DCP binding(GO:0071208) |
| 0.2 | 1.4 | GO:0046976 | histone methyltransferase activity (H3-K27 specific)(GO:0046976) |
| 0.2 | 0.6 | GO:0043398 | HLH domain binding(GO:0043398) |
| 0.2 | 0.8 | GO:0044547 | DNA topoisomerase binding(GO:0044547) |
| 0.1 | 0.7 | GO:0031697 | beta-1 adrenergic receptor binding(GO:0031697) |
| 0.1 | 0.7 | GO:0070644 | vitamin D response element binding(GO:0070644) |
| 0.1 | 0.4 | GO:0070361 | mitochondrial light strand promoter anti-sense binding(GO:0070361) mitochondrial heavy strand promoter anti-sense binding(GO:0070362) mitochondrial heavy strand promoter sense binding(GO:0070364) |
| 0.1 | 0.6 | GO:0042500 | aspartic endopeptidase activity, intramembrane cleaving(GO:0042500) |
| 0.1 | 0.6 | GO:0044388 | small protein activating enzyme binding(GO:0044388) |
| 0.1 | 1.7 | GO:0004017 | adenylate kinase activity(GO:0004017) |
| 0.1 | 0.4 | GO:1904288 | BAT3 complex binding(GO:1904288) |
| 0.1 | 1.7 | GO:0001758 | retinal dehydrogenase activity(GO:0001758) |
| 0.1 | 1.0 | GO:0050733 | RS domain binding(GO:0050733) |
| 0.1 | 1.6 | GO:0031386 | protein tag(GO:0031386) |
| 0.1 | 1.7 | GO:0045294 | alpha-catenin binding(GO:0045294) |
| 0.1 | 0.4 | GO:0097158 | pre-mRNA intronic pyrimidine-rich binding(GO:0097158) |
| 0.1 | 0.4 | GO:0070546 | L-phenylalanine aminotransferase activity(GO:0070546) L-phenylalanine:2-oxoglutarate aminotransferase activity(GO:0080130) |
| 0.1 | 1.8 | GO:0031957 | very long-chain fatty acid-CoA ligase activity(GO:0031957) |
| 0.1 | 0.4 | GO:0035403 | histone kinase activity (H3-T6 specific)(GO:0035403) |
| 0.1 | 0.8 | GO:0052655 | branched-chain-amino-acid transaminase activity(GO:0004084) L-leucine transaminase activity(GO:0052654) L-valine transaminase activity(GO:0052655) L-isoleucine transaminase activity(GO:0052656) |
| 0.1 | 0.4 | GO:0000386 | second spliceosomal transesterification activity(GO:0000386) |
| 0.1 | 0.8 | GO:0061575 | cyclin-dependent protein serine/threonine kinase activator activity(GO:0061575) |
| 0.1 | 0.5 | GO:0030337 | DNA polymerase processivity factor activity(GO:0030337) |
| 0.1 | 0.8 | GO:0004046 | aminoacylase activity(GO:0004046) |
| 0.1 | 0.5 | GO:0015207 | ATP:ADP antiporter activity(GO:0005471) adenine transmembrane transporter activity(GO:0015207) |
| 0.1 | 0.5 | GO:0035243 | protein-arginine omega-N symmetric methyltransferase activity(GO:0035243) |
| 0.1 | 0.5 | GO:0015350 | reduced folate carrier activity(GO:0008518) methotrexate transporter activity(GO:0015350) |
| 0.1 | 0.8 | GO:0035005 | 1-phosphatidylinositol-4-phosphate 3-kinase activity(GO:0035005) |
| 0.1 | 0.8 | GO:0003689 | DNA clamp loader activity(GO:0003689) protein-DNA loading ATPase activity(GO:0033170) |
| 0.1 | 0.4 | GO:0008940 | nitrate reductase activity(GO:0008940) |
| 0.1 | 1.9 | GO:0017070 | U6 snRNA binding(GO:0017070) |
| 0.1 | 0.9 | GO:0031419 | cobalamin binding(GO:0031419) |
| 0.1 | 0.7 | GO:0031726 | CCR1 chemokine receptor binding(GO:0031726) |
| 0.1 | 0.3 | GO:0016534 | cyclin-dependent protein kinase 5 activator activity(GO:0016534) |
| 0.1 | 0.7 | GO:0046975 | histone methyltransferase activity (H3-K36 specific)(GO:0046975) |
| 0.1 | 0.2 | GO:0019788 | NEDD8 transferase activity(GO:0019788) |
| 0.1 | 0.7 | GO:0036042 | long-chain fatty acyl-CoA binding(GO:0036042) |
| 0.1 | 0.5 | GO:0003747 | translation release factor activity(GO:0003747) translation termination factor activity(GO:0008079) |
| 0.1 | 0.3 | GO:0031208 | POZ domain binding(GO:0031208) |
| 0.1 | 1.4 | GO:0004089 | carbonate dehydratase activity(GO:0004089) |
| 0.1 | 0.8 | GO:0019784 | NEDD8-specific protease activity(GO:0019784) |
| 0.1 | 0.1 | GO:0035613 | RNA stem-loop binding(GO:0035613) |
| 0.1 | 0.7 | GO:0000340 | RNA 7-methylguanosine cap binding(GO:0000340) |
| 0.1 | 2.8 | GO:0015248 | sterol transporter activity(GO:0015248) |
| 0.1 | 0.2 | GO:0033906 | hyaluronoglucuronidase activity(GO:0033906) |
| 0.1 | 0.6 | GO:0035174 | histone serine kinase activity(GO:0035174) |
| 0.1 | 0.3 | GO:0052827 | inositol pentakisphosphate phosphatase activity(GO:0052827) |
| 0.1 | 0.3 | GO:0008263 | pyrimidine-specific mismatch base pair DNA N-glycosylase activity(GO:0008263) |
| 0.1 | 1.8 | GO:0031489 | myosin V binding(GO:0031489) |
| 0.1 | 0.7 | GO:0051434 | BH3 domain binding(GO:0051434) |
| 0.1 | 0.4 | GO:0004704 | NF-kappaB-inducing kinase activity(GO:0004704) |
| 0.1 | 0.4 | GO:0000285 | 1-phosphatidylinositol-3-phosphate 5-kinase activity(GO:0000285) phosphatidylinositol-3,5-bisphosphate 5-phosphatase activity(GO:0043813) |
| 0.1 | 1.7 | GO:0070034 | telomerase RNA binding(GO:0070034) |
| 0.1 | 2.4 | GO:0008139 | nuclear localization sequence binding(GO:0008139) |
| 0.1 | 0.9 | GO:0042975 | peroxisome proliferator activated receptor binding(GO:0042975) |
| 0.1 | 1.1 | GO:0001054 | RNA polymerase I activity(GO:0001054) |
| 0.1 | 0.2 | GO:0046538 | bisphosphoglycerate mutase activity(GO:0004082) phosphoglycerate mutase activity(GO:0004619) 2,3-bisphosphoglycerate-dependent phosphoglycerate mutase activity(GO:0046538) |
| 0.1 | 1.1 | GO:0097602 | cullin family protein binding(GO:0097602) |
| 0.1 | 1.0 | GO:0031005 | filamin binding(GO:0031005) |
| 0.1 | 0.4 | GO:0071933 | Arp2/3 complex binding(GO:0071933) |
| 0.1 | 2.2 | GO:0017025 | TBP-class protein binding(GO:0017025) |
| 0.1 | 0.6 | GO:0004596 | peptide alpha-N-acetyltransferase activity(GO:0004596) |
| 0.1 | 1.3 | GO:0098641 | cadherin binding involved in cell-cell adhesion(GO:0098641) |
| 0.1 | 0.8 | GO:0031996 | thioesterase binding(GO:0031996) |
| 0.0 | 0.7 | GO:0008140 | cAMP response element binding protein binding(GO:0008140) |
| 0.0 | 0.3 | GO:0003720 | telomerase activity(GO:0003720) RNA-directed DNA polymerase activity(GO:0003964) |
| 0.0 | 1.4 | GO:0001965 | G-protein alpha-subunit binding(GO:0001965) |
| 0.0 | 0.7 | GO:0035925 | mRNA 3'-UTR AU-rich region binding(GO:0035925) |
| 0.0 | 2.9 | GO:0035064 | methylated histone binding(GO:0035064) |
| 0.0 | 0.5 | GO:0001075 | transcription factor activity, RNA polymerase II core promoter sequence-specific binding involved in preinitiation complex assembly(GO:0001075) |
| 0.0 | 0.2 | GO:0004489 | methylenetetrahydrofolate reductase (NAD(P)H) activity(GO:0004489) |
| 0.0 | 0.5 | GO:0004312 | fatty acid synthase activity(GO:0004312) |
| 0.0 | 1.2 | GO:0015269 | calcium-activated potassium channel activity(GO:0015269) |
| 0.0 | 1.5 | GO:0008536 | Ran GTPase binding(GO:0008536) |
| 0.0 | 0.2 | GO:0004095 | carnitine O-palmitoyltransferase activity(GO:0004095) |
| 0.0 | 0.5 | GO:0004332 | fructose-bisphosphate aldolase activity(GO:0004332) |
| 0.0 | 0.1 | GO:0004652 | polynucleotide adenylyltransferase activity(GO:0004652) |
| 0.0 | 0.9 | GO:0005545 | 1-phosphatidylinositol binding(GO:0005545) |
| 0.0 | 0.4 | GO:0042277 | peptide binding(GO:0042277) |
| 0.0 | 0.4 | GO:0030284 | estrogen receptor activity(GO:0030284) |
| 0.0 | 0.2 | GO:0042020 | interleukin-23 binding(GO:0042019) interleukin-23 receptor activity(GO:0042020) |
| 0.0 | 1.0 | GO:0005521 | lamin binding(GO:0005521) |
| 0.0 | 0.6 | GO:0030247 | pattern binding(GO:0001871) polysaccharide binding(GO:0030247) |
| 0.0 | 2.2 | GO:0019213 | deacetylase activity(GO:0019213) |
| 0.0 | 0.5 | GO:0043274 | phospholipase binding(GO:0043274) |
| 0.0 | 0.4 | GO:0055131 | C3HC4-type RING finger domain binding(GO:0055131) |
| 0.0 | 2.8 | GO:0070491 | repressing transcription factor binding(GO:0070491) |
| 0.0 | 0.9 | GO:0008175 | tRNA methyltransferase activity(GO:0008175) |
| 0.0 | 0.3 | GO:0003988 | acetyl-CoA C-acyltransferase activity(GO:0003988) |
| 0.0 | 0.6 | GO:0003688 | DNA replication origin binding(GO:0003688) |
| 0.0 | 0.5 | GO:0010857 | calcium-dependent protein serine/threonine kinase activity(GO:0009931) calcium-dependent protein kinase activity(GO:0010857) |
| 0.0 | 1.4 | GO:0050699 | WW domain binding(GO:0050699) |
| 0.0 | 0.4 | GO:0038036 | sphingosine-1-phosphate receptor activity(GO:0038036) |
| 0.0 | 0.6 | GO:0008569 | ATP-dependent microtubule motor activity, minus-end-directed(GO:0008569) |
| 0.0 | 0.6 | GO:0000400 | four-way junction DNA binding(GO:0000400) |
| 0.0 | 0.6 | GO:0043422 | protein kinase B binding(GO:0043422) |
| 0.0 | 0.8 | GO:0001085 | RNA polymerase II transcription factor binding(GO:0001085) |
| 0.0 | 0.2 | GO:0005127 | ciliary neurotrophic factor receptor binding(GO:0005127) |
| 0.0 | 0.5 | GO:0019992 | diacylglycerol binding(GO:0019992) |
| 0.0 | 1.6 | GO:0034987 | immunoglobulin receptor binding(GO:0034987) |
| 0.0 | 0.5 | GO:0043560 | insulin receptor substrate binding(GO:0043560) |
| 0.0 | 1.2 | GO:0008009 | chemokine activity(GO:0008009) |
| 0.0 | 0.6 | GO:0008327 | methyl-CpG binding(GO:0008327) |
| 0.0 | 0.3 | GO:0070064 | proline-rich region binding(GO:0070064) |
| 0.0 | 3.4 | GO:0042393 | histone binding(GO:0042393) |
| 0.0 | 0.2 | GO:0003998 | acylphosphatase activity(GO:0003998) |
| 0.0 | 0.4 | GO:0009881 | photoreceptor activity(GO:0009881) |
| 0.0 | 0.2 | GO:0032564 | adenyl deoxyribonucleotide binding(GO:0032558) dATP binding(GO:0032564) |
| 0.0 | 0.3 | GO:0008483 | transaminase activity(GO:0008483) |
| 0.0 | 0.2 | GO:1990446 | U1 snRNP binding(GO:1990446) |
| 0.0 | 0.4 | GO:0004190 | aspartic-type endopeptidase activity(GO:0004190) aspartic-type peptidase activity(GO:0070001) |
| 0.0 | 2.0 | GO:0000979 | RNA polymerase II core promoter sequence-specific DNA binding(GO:0000979) |
| 0.0 | 1.3 | GO:0030374 | ligand-dependent nuclear receptor transcription coactivator activity(GO:0030374) |
| 0.0 | 0.5 | GO:0017091 | AU-rich element binding(GO:0017091) |
| 0.0 | 0.9 | GO:0051019 | mitogen-activated protein kinase binding(GO:0051019) |
| 0.0 | 0.2 | GO:0008121 | ubiquinol-cytochrome-c reductase activity(GO:0008121) oxidoreductase activity, acting on diphenols and related substances as donors, cytochrome as acceptor(GO:0016681) |
| 0.0 | 0.1 | GO:0030350 | iron-responsive element binding(GO:0030350) |
| 0.0 | 0.2 | GO:0004000 | adenosine deaminase activity(GO:0004000) |
| 0.0 | 0.1 | GO:0008109 | N-acetyllactosaminide beta-1,6-N-acetylglucosaminyltransferase activity(GO:0008109) |
| 0.0 | 0.3 | GO:0015095 | magnesium ion transmembrane transporter activity(GO:0015095) |
| 0.0 | 1.1 | GO:0016831 | carboxy-lyase activity(GO:0016831) |
| 0.0 | 0.8 | GO:0008138 | protein tyrosine/serine/threonine phosphatase activity(GO:0008138) |
| 0.0 | 0.2 | GO:0030023 | extracellular matrix constituent conferring elasticity(GO:0030023) |
| 0.0 | 0.3 | GO:0004691 | cAMP-dependent protein kinase activity(GO:0004691) |
| 0.0 | 0.1 | GO:0004949 | cannabinoid receptor activity(GO:0004949) |
| 0.0 | 0.1 | GO:0004102 | choline O-acetyltransferase activity(GO:0004102) |
| 0.0 | 0.9 | GO:0004812 | aminoacyl-tRNA ligase activity(GO:0004812) ligase activity, forming carbon-oxygen bonds(GO:0016875) ligase activity, forming aminoacyl-tRNA and related compounds(GO:0016876) |
| 0.0 | 0.6 | GO:0036002 | pre-mRNA binding(GO:0036002) |
| 0.0 | 0.2 | GO:0043176 | amine binding(GO:0043176) serotonin binding(GO:0051378) |
| 0.0 | 0.7 | GO:0031369 | translation initiation factor binding(GO:0031369) |
| 0.0 | 0.5 | GO:0043015 | gamma-tubulin binding(GO:0043015) |
| 0.0 | 1.6 | GO:0003725 | double-stranded RNA binding(GO:0003725) |
| 0.0 | 0.2 | GO:0000339 | RNA cap binding(GO:0000339) |
| 0.0 | 0.9 | GO:0017112 | Rab guanyl-nucleotide exchange factor activity(GO:0017112) |
| 0.0 | 1.9 | GO:0047485 | protein N-terminus binding(GO:0047485) |
| 0.0 | 0.4 | GO:0005109 | frizzled binding(GO:0005109) |
| 0.0 | 3.6 | GO:0003735 | structural constituent of ribosome(GO:0003735) |
| 0.0 | 0.2 | GO:0047372 | acylglycerol lipase activity(GO:0047372) |
| 0.0 | 0.2 | GO:0034483 | heparan sulfate sulfotransferase activity(GO:0034483) |
| 0.0 | 0.1 | GO:0032451 | demethylase activity(GO:0032451) |
| 0.0 | 1.0 | GO:0048365 | Rac GTPase binding(GO:0048365) |
| 0.0 | 0.4 | GO:0030159 | receptor signaling complex scaffold activity(GO:0030159) |
| 0.0 | 0.4 | GO:0042162 | telomeric DNA binding(GO:0042162) |
| 0.0 | 19.0 | GO:0003700 | nucleic acid binding transcription factor activity(GO:0001071) transcription factor activity, sequence-specific DNA binding(GO:0003700) |
| 0.0 | 0.1 | GO:0004925 | prolactin receptor activity(GO:0004925) |
| 0.0 | 0.2 | GO:0005522 | profilin binding(GO:0005522) |
| 0.0 | 0.9 | GO:0001540 | beta-amyloid binding(GO:0001540) |
| 0.0 | 1.5 | GO:0019903 | protein phosphatase binding(GO:0019903) |
| 0.0 | 0.1 | GO:0003755 | peptidyl-prolyl cis-trans isomerase activity(GO:0003755) cis-trans isomerase activity(GO:0016859) |
| 0.0 | 0.0 | GO:0030197 | extracellular matrix constituent, lubricant activity(GO:0030197) |
| 0.0 | 0.2 | GO:0004526 | ribonuclease P activity(GO:0004526) |
| 0.0 | 0.1 | GO:0031702 | type 1 angiotensin receptor binding(GO:0031702) |
| 0.0 | 0.5 | GO:0019902 | phosphatase binding(GO:0019902) |
| 0.0 | 0.1 | GO:0016864 | protein disulfide isomerase activity(GO:0003756) intramolecular oxidoreductase activity, transposing S-S bonds(GO:0016864) |
| 0.0 | 0.5 | GO:0004712 | protein serine/threonine/tyrosine kinase activity(GO:0004712) |