Project
ENCODE cell lines, expression (Ernst 2011)
Navigation
Downloads
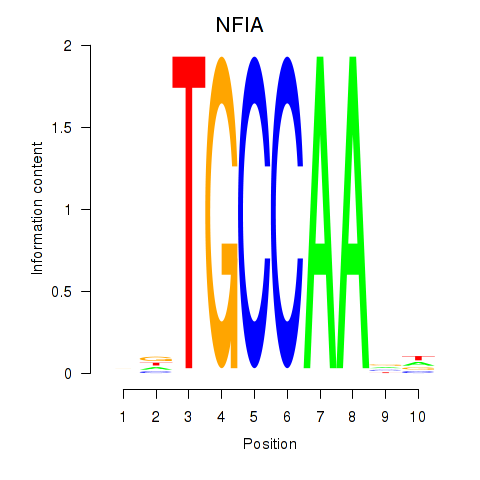
Results for NFIA
Z-value: 0.96
Motif logo
Transcription factors associated with NFIA
| Gene Symbol | Gene ID | Gene Info |
|---|---|---|
|
NFIA
|
ENSG00000162599.11 | NFIA |
Activity profile of NFIA motif
Sorted Z-values of NFIA motif
Network of associatons between targets according to the STRING database.

First level regulatory network of NFIA
| Promoter | Score | Transcript | Gene | Gene Info |
|---|---|---|---|---|
| chr7_+_129932974 | 2.16 |
ENST00000445470.2 ENST00000222482.4 ENST00000492072.1 ENST00000473956.1 ENST00000493259.1 ENST00000486598.1 |
CPA4 |
carboxypeptidase A4 |
| chr18_+_61143994 | 1.93 |
ENST00000382771.4 |
SERPINB5 |
serpin peptidase inhibitor, clade B (ovalbumin), member 5 |
| chr12_-_52911718 | 1.83 |
ENST00000548409.1 |
KRT5 |
keratin 5 |
| chr11_-_122931881 | 1.81 |
ENST00000526110.1 ENST00000227378.3 |
HSPA8 |
heat shock 70kDa protein 8 |
| chr19_+_41725088 | 1.79 |
ENST00000301178.4 |
AXL |
AXL receptor tyrosine kinase |
| chr4_+_169552748 | 1.65 |
ENST00000504519.1 ENST00000512127.1 |
PALLD |
palladin, cytoskeletal associated protein |
| chr17_-_10325261 | 1.63 |
ENST00000403437.2 |
MYH8 |
myosin, heavy chain 8, skeletal muscle, perinatal |
| chr14_+_73704201 | 1.63 |
ENST00000340738.5 ENST00000427855.1 ENST00000381166.3 |
PAPLN |
papilin, proteoglycan-like sulfated glycoprotein |
| chr7_-_41742697 | 1.61 |
ENST00000242208.4 |
INHBA |
inhibin, beta A |
| chr4_-_111558135 | 1.51 |
ENST00000394598.2 ENST00000394595.3 |
PITX2 |
paired-like homeodomain 2 |
| chr20_-_14318248 | 1.38 |
ENST00000378053.3 ENST00000341420.4 |
FLRT3 |
fibronectin leucine rich transmembrane protein 3 |
| chr2_+_189839046 | 1.38 |
ENST00000304636.3 ENST00000317840.5 |
COL3A1 |
collagen, type III, alpha 1 |
| chrX_+_135251783 | 1.36 |
ENST00000394153.2 |
FHL1 |
four and a half LIM domains 1 |
| chr15_-_35088340 | 1.34 |
ENST00000290378.4 |
ACTC1 |
actin, alpha, cardiac muscle 1 |
| chr5_+_135394840 | 1.30 |
ENST00000503087.1 |
TGFBI |
transforming growth factor, beta-induced, 68kDa |
| chr2_-_163099885 | 1.29 |
ENST00000443424.1 |
FAP |
fibroblast activation protein, alpha |
| chr2_-_163100045 | 1.22 |
ENST00000188790.4 |
FAP |
fibroblast activation protein, alpha |
| chr5_+_53751445 | 1.11 |
ENST00000302005.1 |
HSPB3 |
heat shock 27kDa protein 3 |
| chrX_+_135252050 | 1.11 |
ENST00000449474.1 ENST00000345434.3 |
FHL1 |
four and a half LIM domains 1 |
| chrX_+_135251835 | 1.08 |
ENST00000456445.1 |
FHL1 |
four and a half LIM domains 1 |
| chr3_-_52488048 | 1.03 |
ENST00000232975.3 |
TNNC1 |
troponin C type 1 (slow) |
| chr11_-_35547151 | 1.00 |
ENST00000378878.3 ENST00000529303.1 ENST00000278360.3 |
PAMR1 |
peptidase domain containing associated with muscle regeneration 1 |
| chr7_+_79764104 | 0.99 |
ENST00000351004.3 |
GNAI1 |
guanine nucleotide binding protein (G protein), alpha inhibiting activity polypeptide 1 |
| chr17_-_10421853 | 0.95 |
ENST00000226207.5 |
MYH1 |
myosin, heavy chain 1, skeletal muscle, adult |
| chr13_-_40177261 | 0.95 |
ENST00000379589.3 |
LHFP |
lipoma HMGIC fusion partner |
| chr3_+_69812701 | 0.92 |
ENST00000472437.1 |
MITF |
microphthalmia-associated transcription factor |
| chr7_-_27135591 | 0.92 |
ENST00000343060.4 ENST00000355633.5 |
HOXA1 |
homeobox A1 |
| chr11_-_58343319 | 0.91 |
ENST00000395074.2 |
LPXN |
leupaxin |
| chr9_+_130911723 | 0.90 |
ENST00000277480.2 ENST00000373013.2 ENST00000540948.1 |
LCN2 |
lipocalin 2 |
| chr8_+_32579341 | 0.89 |
ENST00000519240.1 ENST00000539990.1 |
NRG1 |
neuregulin 1 |
| chr2_-_31637560 | 0.88 |
ENST00000379416.3 |
XDH |
xanthine dehydrogenase |
| chr2_-_113542063 | 0.88 |
ENST00000263339.3 |
IL1A |
interleukin 1, alpha |
| chr16_-_79634595 | 0.86 |
ENST00000326043.4 ENST00000393350.1 |
MAF |
v-maf avian musculoaponeurotic fibrosarcoma oncogene homolog |
| chr2_+_234590556 | 0.86 |
ENST00000373426.3 |
UGT1A7 |
UDP glucuronosyltransferase 1 family, polypeptide A7 |
| chr12_-_28125638 | 0.86 |
ENST00000545234.1 |
PTHLH |
parathyroid hormone-like hormone |
| chr5_+_36608422 | 0.85 |
ENST00000381918.3 |
SLC1A3 |
solute carrier family 1 (glial high affinity glutamate transporter), member 3 |
| chr19_+_41725140 | 0.85 |
ENST00000359092.3 |
AXL |
AXL receptor tyrosine kinase |
| chr19_-_43969796 | 0.84 |
ENST00000244333.3 |
LYPD3 |
LY6/PLAUR domain containing 3 |
| chrX_-_13835147 | 0.83 |
ENST00000493677.1 ENST00000355135.2 |
GPM6B |
glycoprotein M6B |
| chr1_-_203144941 | 0.83 |
ENST00000255416.4 |
MYBPH |
myosin binding protein H |
| chr9_+_130911770 | 0.83 |
ENST00000372998.1 |
LCN2 |
lipocalin 2 |
| chr6_-_41909191 | 0.82 |
ENST00000512426.1 ENST00000372987.4 |
CCND3 |
cyclin D3 |
| chr17_-_10452929 | 0.82 |
ENST00000532183.2 ENST00000397183.2 ENST00000420805.1 |
MYH2 |
myosin, heavy chain 2, skeletal muscle, adult |
| chr8_-_108510224 | 0.80 |
ENST00000517746.1 ENST00000297450.3 |
ANGPT1 |
angiopoietin 1 |
| chr14_-_75079026 | 0.80 |
ENST00000261978.4 |
LTBP2 |
latent transforming growth factor beta binding protein 2 |
| chr4_+_30721968 | 0.78 |
ENST00000361762.2 |
PCDH7 |
protocadherin 7 |
| chr2_-_190044480 | 0.78 |
ENST00000374866.3 |
COL5A2 |
collagen, type V, alpha 2 |
| chr17_-_15168624 | 0.72 |
ENST00000312280.3 ENST00000494511.1 ENST00000580584.1 |
PMP22 |
peripheral myelin protein 22 |
| chr3_+_69812877 | 0.71 |
ENST00000457080.1 ENST00000328528.6 |
MITF |
microphthalmia-associated transcription factor |
| chr6_-_41909466 | 0.70 |
ENST00000414200.2 |
CCND3 |
cyclin D3 |
| chr2_-_190927447 | 0.70 |
ENST00000260950.4 |
MSTN |
myostatin |
| chr16_+_30383613 | 0.65 |
ENST00000568749.1 |
MYLPF |
myosin light chain, phosphorylatable, fast skeletal muscle |
| chr11_-_122930121 | 0.65 |
ENST00000524552.1 |
HSPA8 |
heat shock 70kDa protein 8 |
| chr13_+_78109884 | 0.64 |
ENST00000377246.3 ENST00000349847.3 |
SCEL |
sciellin |
| chr9_-_5437818 | 0.64 |
ENST00000223864.2 |
PLGRKT |
plasminogen receptor, C-terminal lysine transmembrane protein |
| chr13_+_78109804 | 0.63 |
ENST00000535157.1 |
SCEL |
sciellin |
| chr10_+_11206925 | 0.60 |
ENST00000354440.2 ENST00000315874.4 ENST00000427450.1 |
CELF2 |
CUGBP, Elav-like family member 2 |
| chr17_-_39769005 | 0.59 |
ENST00000301653.4 ENST00000593067.1 |
KRT16 |
keratin 16 |
| chr16_-_67493110 | 0.59 |
ENST00000602876.1 |
ATP6V0D1 |
ATPase, H+ transporting, lysosomal 38kDa, V0 subunit d1 |
| chr12_+_93965609 | 0.59 |
ENST00000549887.1 ENST00000551556.1 |
SOCS2 |
suppressor of cytokine signaling 2 |
| chr13_-_36705425 | 0.58 |
ENST00000255448.4 ENST00000360631.3 ENST00000379892.4 |
DCLK1 |
doublecortin-like kinase 1 |
| chr11_-_5271122 | 0.58 |
ENST00000330597.3 |
HBG1 |
hemoglobin, gamma A |
| chr21_-_44846999 | 0.57 |
ENST00000270162.6 |
SIK1 |
salt-inducible kinase 1 |
| chrX_-_133792480 | 0.56 |
ENST00000359237.4 |
PLAC1 |
placenta-specific 1 |
| chr18_+_61254534 | 0.55 |
ENST00000269489.5 |
SERPINB13 |
serpin peptidase inhibitor, clade B (ovalbumin), member 13 |
| chr6_-_2971494 | 0.54 |
ENST00000380539.1 |
SERPINB6 |
serpin peptidase inhibitor, clade B (ovalbumin), member 6 |
| chr2_+_234545092 | 0.52 |
ENST00000344644.5 |
UGT1A10 |
UDP glucuronosyltransferase 1 family, polypeptide A10 |
| chr1_+_44399466 | 0.50 |
ENST00000498139.2 ENST00000491846.1 |
ARTN |
artemin |
| chr2_-_145277569 | 0.48 |
ENST00000303660.4 |
ZEB2 |
zinc finger E-box binding homeobox 2 |
| chr4_-_114900831 | 0.48 |
ENST00000315366.7 |
ARSJ |
arylsulfatase family, member J |
| chr17_-_39538550 | 0.48 |
ENST00000394001.1 |
KRT34 |
keratin 34 |
| chr10_+_74033672 | 0.47 |
ENST00000307365.3 |
DDIT4 |
DNA-damage-inducible transcript 4 |
| chr12_+_56324756 | 0.45 |
ENST00000331886.5 ENST00000555090.1 |
DGKA |
diacylglycerol kinase, alpha 80kDa |
| chr3_+_159570722 | 0.45 |
ENST00000482804.1 |
SCHIP1 |
schwannomin interacting protein 1 |
| chr12_+_56114151 | 0.45 |
ENST00000547072.1 ENST00000552930.1 ENST00000257895.5 |
RDH5 |
retinol dehydrogenase 5 (11-cis/9-cis) |
| chr4_+_41362796 | 0.44 |
ENST00000508501.1 ENST00000512946.1 ENST00000313860.7 ENST00000512632.1 ENST00000512820.1 |
LIMCH1 |
LIM and calponin homology domains 1 |
| chr13_+_102104952 | 0.44 |
ENST00000376180.3 |
ITGBL1 |
integrin, beta-like 1 (with EGF-like repeat domains) |
| chr18_+_61254570 | 0.44 |
ENST00000344731.5 |
SERPINB13 |
serpin peptidase inhibitor, clade B (ovalbumin), member 13 |
| chr2_+_192141611 | 0.43 |
ENST00000392316.1 |
MYO1B |
myosin IB |
| chr5_+_140868717 | 0.42 |
ENST00000252087.1 |
PCDHGC5 |
protocadherin gamma subfamily C, 5 |
| chr10_-_75226166 | 0.42 |
ENST00000544628.1 |
PPP3CB |
protein phosphatase 3, catalytic subunit, beta isozyme |
| chr12_+_56114189 | 0.42 |
ENST00000548082.1 |
RDH5 |
retinol dehydrogenase 5 (11-cis/9-cis) |
| chr6_+_99282570 | 0.42 |
ENST00000328345.5 |
POU3F2 |
POU class 3 homeobox 2 |
| chr4_-_57547454 | 0.42 |
ENST00000556376.2 |
HOPX |
HOP homeobox |
| chr6_+_108977520 | 0.42 |
ENST00000540898.1 |
FOXO3 |
forkhead box O3 |
| chr12_+_56435637 | 0.41 |
ENST00000356464.5 ENST00000552361.1 |
RPS26 |
ribosomal protein S26 |
| chr15_+_67458357 | 0.39 |
ENST00000537194.2 |
SMAD3 |
SMAD family member 3 |
| chr13_+_102104980 | 0.39 |
ENST00000545560.2 |
ITGBL1 |
integrin, beta-like 1 (with EGF-like repeat domains) |
| chr10_+_22605374 | 0.39 |
ENST00000448361.1 |
COMMD3 |
COMM domain containing 3 |
| chr17_-_62308087 | 0.39 |
ENST00000583097.1 |
TEX2 |
testis expressed 2 |
| chr2_+_234526272 | 0.38 |
ENST00000373450.4 |
UGT1A1 |
UDP glucuronosyltransferase 1 family, polypeptide A8 |
| chr4_-_57547870 | 0.38 |
ENST00000381260.3 ENST00000420433.1 ENST00000554144.1 ENST00000557328.1 |
HOPX |
HOP homeobox |
| chrX_-_10544942 | 0.38 |
ENST00000380779.1 |
MID1 |
midline 1 (Opitz/BBB syndrome) |
| chr7_+_120629653 | 0.38 |
ENST00000450913.2 ENST00000340646.5 |
CPED1 |
cadherin-like and PC-esterase domain containing 1 |
| chr1_+_86934526 | 0.37 |
ENST00000394711.1 |
CLCA1 |
chloride channel accessory 1 |
| chr7_-_37956409 | 0.36 |
ENST00000436072.2 |
SFRP4 |
secreted frizzled-related protein 4 |
| chr11_-_5276008 | 0.36 |
ENST00000336906.4 |
HBG2 |
hemoglobin, gamma G |
| chr3_+_69928256 | 0.34 |
ENST00000394355.2 |
MITF |
microphthalmia-associated transcription factor |
| chr5_+_152870106 | 0.34 |
ENST00000285900.5 |
GRIA1 |
glutamate receptor, ionotropic, AMPA 1 |
| chrX_-_13835461 | 0.34 |
ENST00000316715.4 ENST00000356942.5 |
GPM6B |
glycoprotein M6B |
| chr1_+_68150744 | 0.33 |
ENST00000370986.4 ENST00000370985.3 |
GADD45A |
growth arrest and DNA-damage-inducible, alpha |
| chr16_+_81272287 | 0.33 |
ENST00000425577.2 ENST00000564552.1 |
BCMO1 |
beta-carotene 15,15'-monooxygenase 1 |
| chr16_+_6533729 | 0.33 |
ENST00000551752.1 |
RBFOX1 |
RNA binding protein, fox-1 homolog (C. elegans) 1 |
| chr2_-_33824336 | 0.32 |
ENST00000431950.1 ENST00000403368.1 ENST00000441530.2 |
FAM98A |
family with sequence similarity 98, member A |
| chr13_-_36429763 | 0.32 |
ENST00000379893.1 |
DCLK1 |
doublecortin-like kinase 1 |
| chr20_+_43343886 | 0.32 |
ENST00000190983.4 |
WISP2 |
WNT1 inducible signaling pathway protein 2 |
| chr10_+_22605304 | 0.32 |
ENST00000475460.2 ENST00000602390.1 ENST00000489125.2 ENST00000456711.1 ENST00000444869.1 |
COMMD3-BMI1 COMMD3 |
COMMD3-BMI1 readthrough COMM domain containing 3 |
| chr11_-_65626753 | 0.31 |
ENST00000526975.1 ENST00000531413.1 |
CFL1 |
cofilin 1 (non-muscle) |
| chr3_+_69788576 | 0.31 |
ENST00000352241.4 ENST00000448226.2 |
MITF |
microphthalmia-associated transcription factor |
| chr19_-_12997995 | 0.31 |
ENST00000264834.4 |
KLF1 |
Kruppel-like factor 1 (erythroid) |
| chr14_-_61124977 | 0.31 |
ENST00000554986.1 |
SIX1 |
SIX homeobox 1 |
| chr15_+_67418047 | 0.30 |
ENST00000540846.2 |
SMAD3 |
SMAD family member 3 |
| chr3_-_37216055 | 0.30 |
ENST00000336686.4 |
LRRFIP2 |
leucine rich repeat (in FLII) interacting protein 2 |
| chrX_-_135849484 | 0.30 |
ENST00000370620.1 ENST00000535227.1 |
ARHGEF6 |
Rac/Cdc42 guanine nucleotide exchange factor (GEF) 6 |
| chr3_-_123411191 | 0.30 |
ENST00000354792.5 ENST00000508240.1 |
MYLK |
myosin light chain kinase |
| chr5_+_50678921 | 0.30 |
ENST00000230658.7 |
ISL1 |
ISL LIM homeobox 1 |
| chr22_+_25615489 | 0.29 |
ENST00000398215.2 |
CRYBB2 |
crystallin, beta B2 |
| chr11_-_64013288 | 0.29 |
ENST00000542235.1 |
PPP1R14B |
protein phosphatase 1, regulatory (inhibitor) subunit 14B |
| chrX_+_49832231 | 0.29 |
ENST00000376108.3 |
CLCN5 |
chloride channel, voltage-sensitive 5 |
| chr20_+_43343517 | 0.29 |
ENST00000372865.4 |
WISP2 |
WNT1 inducible signaling pathway protein 2 |
| chr1_-_237167718 | 0.29 |
ENST00000464121.2 |
MT1HL1 |
metallothionein 1H-like 1 |
| chr2_-_191878681 | 0.28 |
ENST00000409465.1 |
STAT1 |
signal transducer and activator of transcription 1, 91kDa |
| chr22_-_38699003 | 0.28 |
ENST00000451964.1 |
CSNK1E |
casein kinase 1, epsilon |
| chr3_+_45067659 | 0.28 |
ENST00000296130.4 |
CLEC3B |
C-type lectin domain family 3, member B |
| chr12_+_56324933 | 0.28 |
ENST00000549629.1 ENST00000555218.1 |
DGKA |
diacylglycerol kinase, alpha 80kDa |
| chr12_-_49449107 | 0.28 |
ENST00000301067.7 |
KMT2D |
lysine (K)-specific methyltransferase 2D |
| chr2_+_234545148 | 0.27 |
ENST00000373445.1 |
UGT1A10 |
UDP glucuronosyltransferase 1 family, polypeptide A10 |
| chr3_-_52002403 | 0.27 |
ENST00000490063.1 ENST00000468324.1 ENST00000497653.1 ENST00000484633.1 |
PCBP4 |
poly(rC) binding protein 4 |
| chr3_-_194188956 | 0.25 |
ENST00000256031.4 ENST00000446356.1 |
ATP13A3 |
ATPase type 13A3 |
| chr12_+_56521840 | 0.25 |
ENST00000394048.5 |
ESYT1 |
extended synaptotagmin-like protein 1 |
| chr2_+_241938255 | 0.25 |
ENST00000401884.1 ENST00000405547.3 ENST00000310397.8 ENST00000342631.6 |
SNED1 |
sushi, nidogen and EGF-like domains 1 |
| chr14_-_64194745 | 0.25 |
ENST00000247225.6 |
SGPP1 |
sphingosine-1-phosphate phosphatase 1 |
| chr20_+_43343476 | 0.25 |
ENST00000372868.2 |
WISP2 |
WNT1 inducible signaling pathway protein 2 |
| chr2_-_191878162 | 0.25 |
ENST00000540176.1 |
STAT1 |
signal transducer and activator of transcription 1, 91kDa |
| chr19_+_39214797 | 0.23 |
ENST00000440400.1 |
ACTN4 |
actinin, alpha 4 |
| chr5_+_42423872 | 0.23 |
ENST00000230882.4 ENST00000357703.3 |
GHR |
growth hormone receptor |
| chr7_+_134528635 | 0.23 |
ENST00000445569.2 |
CALD1 |
caldesmon 1 |
| chr17_-_38657849 | 0.23 |
ENST00000254051.6 |
TNS4 |
tensin 4 |
| chr7_-_83824169 | 0.23 |
ENST00000265362.4 |
SEMA3A |
sema domain, immunoglobulin domain (Ig), short basic domain, secreted, (semaphorin) 3A |
| chr4_-_103266626 | 0.23 |
ENST00000356736.4 |
SLC39A8 |
solute carrier family 39 (zinc transporter), member 8 |
| chrX_+_105855160 | 0.23 |
ENST00000372544.2 ENST00000372548.4 |
CXorf57 |
chromosome X open reading frame 57 |
| chr12_-_111358372 | 0.22 |
ENST00000548438.1 ENST00000228841.8 |
MYL2 |
myosin, light chain 2, regulatory, cardiac, slow |
| chr6_-_136847099 | 0.22 |
ENST00000438100.2 |
MAP7 |
microtubule-associated protein 7 |
| chr4_-_103266219 | 0.21 |
ENST00000394833.2 |
SLC39A8 |
solute carrier family 39 (zinc transporter), member 8 |
| chr11_-_113644491 | 0.20 |
ENST00000200135.3 |
ZW10 |
zw10 kinetochore protein |
| chr3_+_184033135 | 0.20 |
ENST00000424196.1 |
EIF4G1 |
eukaryotic translation initiation factor 4 gamma, 1 |
| chr10_-_27149792 | 0.20 |
ENST00000376140.3 ENST00000376170.4 |
ABI1 |
abl-interactor 1 |
| chr5_+_112073544 | 0.20 |
ENST00000257430.4 ENST00000508376.2 |
APC |
adenomatous polyposis coli |
| chr10_-_27149851 | 0.19 |
ENST00000376142.2 ENST00000359188.4 ENST00000376139.2 ENST00000376160.1 |
ABI1 |
abl-interactor 1 |
| chr13_-_36050819 | 0.19 |
ENST00000379919.4 |
MAB21L1 |
mab-21-like 1 (C. elegans) |
| chrX_+_78003204 | 0.19 |
ENST00000435339.3 ENST00000514744.1 |
LPAR4 |
lysophosphatidic acid receptor 4 |
| chr1_-_154164534 | 0.19 |
ENST00000271850.7 ENST00000368530.2 |
TPM3 |
tropomyosin 3 |
| chr6_+_107077435 | 0.19 |
ENST00000369046.4 |
QRSL1 |
glutaminyl-tRNA synthase (glutamine-hydrolyzing)-like 1 |
| chr14_-_76447494 | 0.19 |
ENST00000238682.3 |
TGFB3 |
transforming growth factor, beta 3 |
| chr15_+_84322827 | 0.18 |
ENST00000286744.5 ENST00000567476.1 |
ADAMTSL3 |
ADAMTS-like 3 |
| chr17_-_73150599 | 0.18 |
ENST00000392566.2 ENST00000581874.1 |
HN1 |
hematological and neurological expressed 1 |
| chr10_+_95848824 | 0.18 |
ENST00000371385.3 ENST00000371375.1 |
PLCE1 |
phospholipase C, epsilon 1 |
| chr18_+_13825543 | 0.18 |
ENST00000324750.3 |
MC5R |
melanocortin 5 receptor |
| chr21_+_44394620 | 0.17 |
ENST00000291547.5 |
PKNOX1 |
PBX/knotted 1 homeobox 1 |
| chr12_+_57828521 | 0.17 |
ENST00000309668.2 |
INHBC |
inhibin, beta C |
| chr21_+_44394742 | 0.17 |
ENST00000432907.2 |
PKNOX1 |
PBX/knotted 1 homeobox 1 |
| chr10_-_27149904 | 0.17 |
ENST00000376166.1 ENST00000376138.3 ENST00000355394.4 ENST00000346832.5 ENST00000376134.3 ENST00000376137.4 ENST00000536334.1 ENST00000490841.2 |
ABI1 |
abl-interactor 1 |
| chr1_+_173684047 | 0.17 |
ENST00000546011.1 ENST00000209884.4 |
KLHL20 |
kelch-like family member 20 |
| chr4_+_113739244 | 0.17 |
ENST00000503271.1 ENST00000503423.1 ENST00000506722.1 |
ANK2 |
ankyrin 2, neuronal |
| chr17_-_73150629 | 0.17 |
ENST00000356033.4 ENST00000405458.3 ENST00000409753.3 |
HN1 |
hematological and neurological expressed 1 |
| chrX_-_135338503 | 0.17 |
ENST00000370663.5 |
MAP7D3 |
MAP7 domain containing 3 |
| chr5_+_152870287 | 0.17 |
ENST00000340592.5 |
GRIA1 |
glutamate receptor, ionotropic, AMPA 1 |
| chr7_-_7782204 | 0.17 |
ENST00000418534.2 |
AC007161.5 |
AC007161.5 |
| chr15_+_58430567 | 0.16 |
ENST00000536493.1 |
AQP9 |
aquaporin 9 |
| chr5_-_43313574 | 0.16 |
ENST00000325110.6 ENST00000433297.2 |
HMGCS1 |
3-hydroxy-3-methylglutaryl-CoA synthase 1 (soluble) |
| chr11_-_59383617 | 0.16 |
ENST00000263847.1 |
OSBP |
oxysterol binding protein |
| chr8_+_9953214 | 0.16 |
ENST00000382490.5 |
MSRA |
methionine sulfoxide reductase A |
| chr9_+_137967366 | 0.16 |
ENST00000252854.4 |
OLFM1 |
olfactomedin 1 |
| chr11_-_117166276 | 0.16 |
ENST00000510630.1 ENST00000392937.6 |
BACE1 |
beta-site APP-cleaving enzyme 1 |
| chr1_-_203320617 | 0.16 |
ENST00000354955.4 |
FMOD |
fibromodulin |
| chr12_-_13248562 | 0.16 |
ENST00000457134.2 ENST00000537302.1 |
GSG1 |
germ cell associated 1 |
| chr3_+_184032919 | 0.15 |
ENST00000427845.1 ENST00000342981.4 ENST00000319274.6 |
EIF4G1 |
eukaryotic translation initiation factor 4 gamma, 1 |
| chr12_+_58138664 | 0.15 |
ENST00000257910.3 |
TSPAN31 |
tetraspanin 31 |
| chr9_+_36169380 | 0.15 |
ENST00000335119.2 |
CCIN |
calicin |
| chr3_+_101498269 | 0.15 |
ENST00000491511.2 |
NXPE3 |
neurexophilin and PC-esterase domain family, member 3 |
| chr5_-_148929848 | 0.15 |
ENST00000504676.1 ENST00000515435.1 |
CSNK1A1 |
casein kinase 1, alpha 1 |
| chr4_-_103266355 | 0.15 |
ENST00000424970.2 |
SLC39A8 |
solute carrier family 39 (zinc transporter), member 8 |
| chr19_-_15560730 | 0.15 |
ENST00000389282.4 ENST00000263381.7 |
WIZ |
widely interspaced zinc finger motifs |
| chr4_-_76928641 | 0.15 |
ENST00000264888.5 |
CXCL9 |
chemokine (C-X-C motif) ligand 9 |
| chr7_-_97619508 | 0.15 |
ENST00000257627.4 |
OCM2 |
oncomodulin 2 |
| chr13_+_23755054 | 0.15 |
ENST00000218867.3 |
SGCG |
sarcoglycan, gamma (35kDa dystrophin-associated glycoprotein) |
| chr3_-_47950745 | 0.14 |
ENST00000429422.1 |
MAP4 |
microtubule-associated protein 4 |
| chr19_+_33463210 | 0.14 |
ENST00000590281.1 |
C19orf40 |
chromosome 19 open reading frame 40 |
| chr14_-_24732403 | 0.14 |
ENST00000206765.6 |
TGM1 |
transglutaminase 1 |
| chr2_-_182545603 | 0.14 |
ENST00000295108.3 |
NEUROD1 |
neuronal differentiation 1 |
| chr9_-_99064386 | 0.14 |
ENST00000375262.2 |
HSD17B3 |
hydroxysteroid (17-beta) dehydrogenase 3 |
| chr9_+_17135016 | 0.14 |
ENST00000425824.1 ENST00000262360.5 ENST00000380641.4 |
CNTLN |
centlein, centrosomal protein |
| chr5_-_55412774 | 0.14 |
ENST00000434982.2 |
ANKRD55 |
ankyrin repeat domain 55 |
| chr16_+_58283814 | 0.14 |
ENST00000443128.2 ENST00000219299.4 |
CCDC113 |
coiled-coil domain containing 113 |
| chr7_-_56160625 | 0.13 |
ENST00000446428.1 ENST00000432123.1 ENST00000452681.2 ENST00000537360.1 |
PHKG1 |
phosphorylase kinase, gamma 1 (muscle) |
| chr1_+_149553003 | 0.13 |
ENST00000369222.3 |
PPIAL4C |
peptidylprolyl isomerase A (cyclophilin A)-like 4C |
| chr12_+_58138800 | 0.13 |
ENST00000547992.1 ENST00000552816.1 ENST00000547472.1 |
TSPAN31 |
tetraspanin 31 |
| chr12_+_49621658 | 0.13 |
ENST00000541364.1 |
TUBA1C |
tubulin, alpha 1c |
| chr9_-_32635667 | 0.13 |
ENST00000242310.4 |
TAF1L |
TAF1 RNA polymerase II, TATA box binding protein (TBP)-associated factor, 210kDa-like |
| chr6_+_26158343 | 0.13 |
ENST00000377777.4 ENST00000289316.2 |
HIST1H2BD |
histone cluster 1, H2bd |
Gene Ontology Analysis
Gene overrepresentation in C2:CP category:
| Log-likelihood per target | Total log-likelihood | Term | Description |
|---|---|---|---|
| 0.1 | 6.2 | PID DELTA NP63 PATHWAY | Validated transcriptional targets of deltaNp63 isoforms |
| 0.1 | 2.4 | ST MYOCYTE AD PATHWAY | Myocyte Adrenergic Pathway is a specific case of the generalized Adrenergic Pathway. |
| 0.0 | 0.5 | PID IL2 1PATHWAY | IL2-mediated signaling events |
| 0.0 | 1.6 | NABA BASEMENT MEMBRANES | Genes encoding structural components of basement membranes |
| 0.0 | 1.9 | NABA COLLAGENS | Genes encoding collagen proteins |
| 0.0 | 0.9 | PID CONE PATHWAY | Visual signal transduction: Cones |
| 0.0 | 0.5 | ST INTERFERON GAMMA PATHWAY | Interferon gamma pathway. |
| 0.0 | 1.6 | PID ALK1 PATHWAY | ALK1 signaling events |
| 0.0 | 2.4 | PID P38 ALPHA BETA DOWNSTREAM PATHWAY | Signaling mediated by p38-alpha and p38-beta |
| 0.0 | 1.3 | PID IL2 STAT5 PATHWAY | IL2 signaling events mediated by STAT5 |
| 0.0 | 0.8 | PID HEDGEHOG 2PATHWAY | Signaling events mediated by the Hedgehog family |
| 0.0 | 1.9 | PID TAP63 PATHWAY | Validated transcriptional targets of TAp63 isoforms |
| 0.0 | 3.4 | PID CMYB PATHWAY | C-MYB transcription factor network |
| 0.0 | 0.7 | PID SMAD2 3PATHWAY | Regulation of cytoplasmic and nuclear SMAD2/3 signaling |
| 0.0 | 1.3 | PID INTEGRIN3 PATHWAY | Beta3 integrin cell surface interactions |
| 0.0 | 0.4 | SA G1 AND S PHASES | Cdk2, 4, and 6 bind cyclin D in G1, while cdk2/cyclin E promotes the G1/S transition. |
| 0.0 | 1.4 | PID INTEGRIN A4B1 PATHWAY | Alpha4 beta1 integrin signaling events |
| 0.0 | 0.7 | PID A6B1 A6B4 INTEGRIN PATHWAY | a6b1 and a6b4 Integrin signaling |
| 0.0 | 0.6 | PID EPHB FWD PATHWAY | EPHB forward signaling |
| 0.0 | 0.4 | PID IL2 PI3K PATHWAY | IL2 signaling events mediated by PI3K |
| 0.0 | 0.4 | PID BETA CATENIN DEG PATHWAY | Degradation of beta catenin |
| 0.0 | 0.2 | PID THROMBIN PAR4 PATHWAY | PAR4-mediated thrombin signaling events |
| 0.0 | 0.7 | PID ANGIOPOIETIN RECEPTOR PATHWAY | Angiopoietin receptor Tie2-mediated signaling |
| 0.0 | 0.2 | PID S1P META PATHWAY | Sphingosine 1-phosphate (S1P) pathway |
| 0.0 | 0.2 | PID LPA4 PATHWAY | LPA4-mediated signaling events |
| 0.0 | 0.5 | SIG INSULIN RECEPTOR PATHWAY IN CARDIAC MYOCYTES | Genes related to the insulin receptor pathway |
Gene overrepresentation in biological_process category:
| Log-likelihood per target | Total log-likelihood | Term | Description |
|---|---|---|---|
| 0.6 | 2.5 | GO:0097325 | melanocyte proliferation(GO:0097325) |
| 0.5 | 1.6 | GO:0060279 | regulation of ovulation(GO:0060278) positive regulation of ovulation(GO:0060279) |
| 0.5 | 1.5 | GO:0060460 | subthalamic nucleus development(GO:0021763) prolactin secreting cell differentiation(GO:0060127) left lung morphogenesis(GO:0060460) pulmonary vein morphogenesis(GO:0060577) superior vena cava morphogenesis(GO:0060578) |
| 0.5 | 2.5 | GO:1904764 | negative regulation of fibril organization(GO:1902904) chaperone-mediated autophagy translocation complex disassembly(GO:1904764) |
| 0.5 | 2.9 | GO:0048549 | positive regulation of pinocytosis(GO:0048549) |
| 0.3 | 1.7 | GO:0015688 | iron chelate transport(GO:0015688) siderophore transport(GO:0015891) |
| 0.3 | 0.9 | GO:0006145 | purine nucleobase catabolic process(GO:0006145) |
| 0.3 | 1.0 | GO:0032972 | diaphragm contraction(GO:0002086) regulation of muscle filament sliding speed(GO:0032972) |
| 0.2 | 1.3 | GO:0090131 | mesenchyme migration(GO:0090131) |
| 0.2 | 1.7 | GO:0060414 | aorta smooth muscle tissue morphogenesis(GO:0060414) |
| 0.2 | 2.0 | GO:0051552 | flavone metabolic process(GO:0051552) |
| 0.2 | 0.8 | GO:1903224 | regulation of endodermal cell differentiation(GO:1903224) |
| 0.2 | 0.7 | GO:0014816 | skeletal muscle satellite cell differentiation(GO:0014816) negative regulation of skeletal muscle cell proliferation(GO:0014859) regulation of skeletal muscle tissue growth(GO:0048631) negative regulation of skeletal muscle satellite cell proliferation(GO:1902723) |
| 0.2 | 1.4 | GO:0003344 | pericardium morphogenesis(GO:0003344) |
| 0.1 | 0.9 | GO:2000391 | positive regulation of neutrophil extravasation(GO:2000391) |
| 0.1 | 0.6 | GO:0032792 | negative regulation of CREB transcription factor activity(GO:0032792) |
| 0.1 | 0.7 | GO:0061767 | negative regulation of lung blood pressure(GO:0061767) |
| 0.1 | 0.4 | GO:0001544 | initiation of primordial ovarian follicle growth(GO:0001544) |
| 0.1 | 0.5 | GO:0072308 | negative regulation by virus of viral protein levels in host cell(GO:0046725) negative regulation of nephron tubule epithelial cell differentiation(GO:0072183) negative regulation of metanephric nephron tubule epithelial cell differentiation(GO:0072308) negative regulation of epithelial cell differentiation involved in kidney development(GO:2000697) |
| 0.1 | 0.9 | GO:0010756 | positive regulation of plasminogen activation(GO:0010756) |
| 0.1 | 0.9 | GO:0021842 | directional guidance of interneurons involved in migration from the subpallium to the cortex(GO:0021840) chemorepulsion involved in interneuron migration from the subpallium to the cortex(GO:0021842) |
| 0.1 | 1.4 | GO:0097283 | keratinocyte apoptotic process(GO:0097283) regulation of keratinocyte apoptotic process(GO:1902172) |
| 0.1 | 0.9 | GO:0006537 | glutamate biosynthetic process(GO:0006537) gamma-aminobutyric acid biosynthetic process(GO:0009449) |
| 0.1 | 0.5 | GO:1902748 | positive regulation of lens fiber cell differentiation(GO:1902748) |
| 0.1 | 1.2 | GO:0051581 | negative regulation of neurotransmitter uptake(GO:0051581) serotonin uptake(GO:0051610) regulation of serotonin uptake(GO:0051611) negative regulation of serotonin uptake(GO:0051612) |
| 0.1 | 0.9 | GO:0050859 | negative regulation of B cell receptor signaling pathway(GO:0050859) |
| 0.1 | 1.1 | GO:0048702 | embryonic neurocranium morphogenesis(GO:0048702) |
| 0.1 | 0.5 | GO:0048880 | sensory system development(GO:0048880) |
| 0.1 | 0.3 | GO:0071699 | olfactory placode formation(GO:0030910) myotome development(GO:0061055) olfactory placode development(GO:0071698) olfactory placode morphogenesis(GO:0071699) positive regulation of mesenchymal cell proliferation involved in ureter development(GO:2000729) |
| 0.1 | 0.5 | GO:0061146 | Peyer's patch morphogenesis(GO:0061146) lymphocyte migration into lymphoid organs(GO:0097021) |
| 0.1 | 0.7 | GO:0048014 | Tie signaling pathway(GO:0048014) |
| 0.1 | 0.1 | GO:0048073 | regulation of eye pigmentation(GO:0048073) |
| 0.1 | 0.4 | GO:0071964 | regulation of unidimensional cell growth(GO:0051510) negative regulation of unidimensional cell growth(GO:0051511) establishment of cell polarity regulating cell shape(GO:0071964) regulation of establishment or maintenance of cell polarity regulating cell shape(GO:2000769) positive regulation of establishment or maintenance of cell polarity regulating cell shape(GO:2000771) regulation of establishment of cell polarity regulating cell shape(GO:2000782) positive regulation of establishment of cell polarity regulating cell shape(GO:2000784) regulation of barbed-end actin filament capping(GO:2000812) positive regulation of barbed-end actin filament capping(GO:2000814) |
| 0.1 | 1.0 | GO:1904322 | response to forskolin(GO:1904321) cellular response to forskolin(GO:1904322) |
| 0.1 | 1.7 | GO:0003334 | keratinocyte development(GO:0003334) |
| 0.1 | 0.6 | GO:0099566 | regulation of postsynaptic cytosolic calcium ion concentration(GO:0099566) |
| 0.1 | 0.2 | GO:0043163 | cell envelope organization(GO:0043163) external encapsulating structure organization(GO:0045229) |
| 0.1 | 0.8 | GO:0001778 | plasma membrane repair(GO:0001778) |
| 0.1 | 3.7 | GO:0043268 | positive regulation of potassium ion transport(GO:0043268) |
| 0.1 | 1.8 | GO:0031581 | hemidesmosome assembly(GO:0031581) |
| 0.1 | 0.2 | GO:0006668 | sphinganine-1-phosphate metabolic process(GO:0006668) |
| 0.1 | 0.9 | GO:0015671 | oxygen transport(GO:0015671) |
| 0.1 | 0.2 | GO:0000255 | allantoin metabolic process(GO:0000255) |
| 0.1 | 0.8 | GO:0071688 | striated muscle myosin thick filament assembly(GO:0071688) |
| 0.1 | 0.6 | GO:0071578 | zinc II ion transmembrane import(GO:0071578) |
| 0.1 | 0.3 | GO:0015722 | canalicular bile acid transport(GO:0015722) pyrimidine nucleobase transport(GO:0015855) urea transmembrane transport(GO:0071918) purine nucleobase transmembrane transport(GO:1904823) |
| 0.1 | 0.3 | GO:0001555 | oocyte growth(GO:0001555) |
| 0.1 | 0.3 | GO:1904885 | beta-catenin destruction complex assembly(GO:1904885) |
| 0.1 | 0.7 | GO:0060712 | spongiotrophoblast layer development(GO:0060712) |
| 0.1 | 0.2 | GO:0007181 | transforming growth factor beta receptor complex assembly(GO:0007181) |
| 0.1 | 0.1 | GO:0002541 | activation of plasma proteins involved in acute inflammatory response(GO:0002541) |
| 0.1 | 2.3 | GO:0030318 | melanocyte differentiation(GO:0030318) |
| 0.0 | 0.4 | GO:2000507 | positive regulation of energy homeostasis(GO:2000507) |
| 0.0 | 0.7 | GO:0032060 | bleb assembly(GO:0032060) |
| 0.0 | 1.7 | GO:0060512 | prostate gland morphogenesis(GO:0060512) |
| 0.0 | 0.6 | GO:0051546 | keratinocyte migration(GO:0051546) |
| 0.0 | 0.3 | GO:0098735 | positive regulation of the force of heart contraction(GO:0098735) |
| 0.0 | 0.4 | GO:0021979 | hypothalamus cell differentiation(GO:0021979) |
| 0.0 | 0.9 | GO:0021952 | central nervous system projection neuron axonogenesis(GO:0021952) |
| 0.0 | 1.5 | GO:0045737 | positive regulation of cyclin-dependent protein serine/threonine kinase activity(GO:0045737) |
| 0.0 | 0.1 | GO:0060729 | intestinal epithelial structure maintenance(GO:0060729) |
| 0.0 | 0.1 | GO:0001545 | primary ovarian follicle growth(GO:0001545) |
| 0.0 | 0.2 | GO:0006651 | diacylglycerol biosynthetic process(GO:0006651) |
| 0.0 | 0.8 | GO:0001829 | trophectodermal cell differentiation(GO:0001829) |
| 0.0 | 0.1 | GO:0019442 | tryptophan catabolic process to acetyl-CoA(GO:0019442) |
| 0.0 | 0.6 | GO:0035855 | megakaryocyte development(GO:0035855) |
| 0.0 | 0.6 | GO:0040015 | negative regulation of multicellular organism growth(GO:0040015) |
| 0.0 | 0.2 | GO:0043010 | camera-type eye development(GO:0043010) |
| 0.0 | 0.3 | GO:0030091 | protein repair(GO:0030091) |
| 0.0 | 0.1 | GO:0021759 | globus pallidus development(GO:0021759) |
| 0.0 | 0.1 | GO:0021913 | regulation of transcription from RNA polymerase II promoter involved in ventral spinal cord interneuron specification(GO:0021913) |
| 0.0 | 0.4 | GO:0031987 | locomotion involved in locomotory behavior(GO:0031987) |
| 0.0 | 0.4 | GO:0035372 | protein localization to microtubule(GO:0035372) |
| 0.0 | 0.2 | GO:0061370 | testosterone biosynthetic process(GO:0061370) |
| 0.0 | 1.6 | GO:0003009 | skeletal muscle contraction(GO:0003009) |
| 0.0 | 0.1 | GO:0072021 | ascending thin limb development(GO:0072021) thick ascending limb development(GO:0072023) metanephric ascending thin limb development(GO:0072218) metanephric thick ascending limb development(GO:0072233) |
| 0.0 | 0.6 | GO:0036295 | cellular response to increased oxygen levels(GO:0036295) |
| 0.0 | 0.8 | GO:0002076 | osteoblast development(GO:0002076) |
| 0.0 | 0.5 | GO:0010801 | negative regulation of peptidyl-threonine phosphorylation(GO:0010801) |
| 0.0 | 0.2 | GO:0071372 | cellular response to follicle-stimulating hormone stimulus(GO:0071372) |
| 0.0 | 0.1 | GO:0006740 | NADPH regeneration(GO:0006740) |
| 0.0 | 0.2 | GO:0003190 | atrioventricular valve formation(GO:0003190) |
| 0.0 | 0.1 | GO:0048733 | sebaceous gland development(GO:0048733) |
| 0.0 | 0.4 | GO:0046339 | diacylglycerol metabolic process(GO:0046339) |
| 0.0 | 0.3 | GO:0071850 | mitotic cell cycle arrest(GO:0071850) |
| 0.0 | 0.2 | GO:0016098 | monoterpenoid metabolic process(GO:0016098) |
| 0.0 | 0.1 | GO:0032417 | positive regulation of sodium:proton antiporter activity(GO:0032417) |
| 0.0 | 0.7 | GO:0070306 | lens fiber cell differentiation(GO:0070306) |
| 0.0 | 0.1 | GO:0051012 | microtubule sliding(GO:0051012) |
| 0.0 | 0.1 | GO:0002581 | negative regulation of antigen processing and presentation of peptide or polysaccharide antigen via MHC class II(GO:0002581) |
| 0.0 | 0.1 | GO:0061534 | gamma-aminobutyric acid secretion, neurotransmission(GO:0061534) |
| 0.0 | 0.1 | GO:0060613 | fat pad development(GO:0060613) |
| 0.0 | 0.1 | GO:0043950 | positive regulation of cAMP-mediated signaling(GO:0043950) |
| 0.0 | 0.1 | GO:1990418 | response to insulin-like growth factor stimulus(GO:1990418) |
| 0.0 | 0.1 | GO:0060837 | blood vessel endothelial cell differentiation(GO:0060837) arterial endothelial cell differentiation(GO:0060842) |
| 0.0 | 0.2 | GO:0007096 | regulation of exit from mitosis(GO:0007096) |
| 0.0 | 0.1 | GO:0071895 | odontoblast differentiation(GO:0071895) |
| 0.0 | 0.7 | GO:0097435 | fibril organization(GO:0097435) |
| 0.0 | 0.1 | GO:0010571 | positive regulation of nuclear cell cycle DNA replication(GO:0010571) |
| 0.0 | 0.2 | GO:0031109 | microtubule polymerization or depolymerization(GO:0031109) |
| 0.0 | 0.0 | GO:0071034 | CUT catabolic process(GO:0071034) CUT metabolic process(GO:0071043) polyadenylation-dependent snoRNA 3'-end processing(GO:0071051) |
| 0.0 | 0.1 | GO:0009624 | response to nematode(GO:0009624) |
| 0.0 | 0.3 | GO:0010457 | centriole-centriole cohesion(GO:0010457) |
| 0.0 | 0.5 | GO:0006376 | mRNA splice site selection(GO:0006376) |
| 0.0 | 0.0 | GO:0008050 | female courtship behavior(GO:0008050) |
| 0.0 | 0.0 | GO:0072553 | terminal button organization(GO:0072553) |
| 0.0 | 0.1 | GO:0014051 | gamma-aminobutyric acid secretion(GO:0014051) |
| 0.0 | 0.0 | GO:0086097 | phospholipase C-activating angiotensin-activated signaling pathway(GO:0086097) |
| 0.0 | 0.4 | GO:0097120 | receptor localization to synapse(GO:0097120) |
| 0.0 | 0.1 | GO:0070120 | ciliary neurotrophic factor-mediated signaling pathway(GO:0070120) |
| 0.0 | 2.3 | GO:0016573 | histone acetylation(GO:0016573) |
| 0.0 | 0.5 | GO:0071470 | cellular response to osmotic stress(GO:0071470) |
| 0.0 | 0.4 | GO:0033119 | negative regulation of RNA splicing(GO:0033119) |
| 0.0 | 2.5 | GO:0007601 | visual perception(GO:0007601) |
| 0.0 | 0.1 | GO:0044245 | polysaccharide digestion(GO:0044245) |
| 0.0 | 0.2 | GO:0044126 | regulation of growth of symbiont in host(GO:0044126) |
Gene overrepresentation in cellular_component category:
| Log-likelihood per target | Total log-likelihood | Term | Description |
|---|---|---|---|
| 0.5 | 1.6 | GO:0043512 | inhibin complex(GO:0043511) inhibin A complex(GO:0043512) |
| 0.4 | 2.5 | GO:0098575 | lumenal side of lysosomal membrane(GO:0098575) |
| 0.3 | 0.8 | GO:0005826 | actomyosin contractile ring(GO:0005826) |
| 0.3 | 1.3 | GO:0042643 | actomyosin, actin portion(GO:0042643) |
| 0.3 | 0.8 | GO:0005588 | collagen type V trimer(GO:0005588) |
| 0.2 | 2.5 | GO:0071438 | invadopodium membrane(GO:0071438) |
| 0.2 | 2.6 | GO:0033643 | host cell part(GO:0033643) |
| 0.2 | 1.0 | GO:1990584 | cardiac Troponin complex(GO:1990584) |
| 0.2 | 1.4 | GO:0098643 | fibrillar collagen trimer(GO:0005583) banded collagen fibril(GO:0098643) |
| 0.1 | 3.4 | GO:0032982 | myosin filament(GO:0032982) |
| 0.1 | 0.6 | GO:0044308 | axonal spine(GO:0044308) |
| 0.1 | 0.7 | GO:0071144 | SMAD2-SMAD3 protein complex(GO:0071144) |
| 0.1 | 0.2 | GO:0070195 | growth hormone receptor complex(GO:0070195) |
| 0.1 | 1.6 | GO:0044295 | axonal growth cone(GO:0044295) |
| 0.1 | 0.2 | GO:0070939 | Dsl1p complex(GO:0070939) |
| 0.1 | 0.9 | GO:0005833 | hemoglobin complex(GO:0005833) |
| 0.1 | 0.3 | GO:0001652 | granular component(GO:0001652) |
| 0.1 | 0.2 | GO:0033011 | perinuclear theca(GO:0033011) cytoskeletal calyx(GO:0033150) |
| 0.0 | 0.3 | GO:0072669 | tRNA-splicing ligase complex(GO:0072669) |
| 0.0 | 2.4 | GO:0002102 | podosome(GO:0002102) |
| 0.0 | 0.6 | GO:0031209 | SCAR complex(GO:0031209) |
| 0.0 | 2.0 | GO:0045095 | keratin filament(GO:0045095) |
| 0.0 | 0.6 | GO:0033179 | proton-transporting V-type ATPase, V0 domain(GO:0033179) |
| 0.0 | 0.7 | GO:0005859 | muscle myosin complex(GO:0005859) |
| 0.0 | 0.1 | GO:0097059 | CNTFR-CLCF1 complex(GO:0097059) |
| 0.0 | 1.5 | GO:0001533 | cornified envelope(GO:0001533) |
| 0.0 | 1.6 | GO:0000307 | cyclin-dependent protein kinase holoenzyme complex(GO:0000307) |
| 0.0 | 0.3 | GO:0044666 | MLL3/4 complex(GO:0044666) |
| 0.0 | 0.8 | GO:0031092 | platelet alpha granule membrane(GO:0031092) |
| 0.0 | 0.2 | GO:0005964 | phosphorylase kinase complex(GO:0005964) |
| 0.0 | 0.2 | GO:0016012 | sarcoglycan complex(GO:0016012) |
| 0.0 | 0.8 | GO:0030673 | axolemma(GO:0030673) |
| 0.0 | 0.7 | GO:0043218 | compact myelin(GO:0043218) |
| 0.0 | 0.2 | GO:0030478 | actin cap(GO:0030478) |
| 0.0 | 0.1 | GO:0001405 | presequence translocase-associated import motor(GO:0001405) |
| 0.0 | 0.1 | GO:0005968 | Rab-protein geranylgeranyltransferase complex(GO:0005968) |
| 0.0 | 0.4 | GO:0034663 | endoplasmic reticulum chaperone complex(GO:0034663) |
| 0.0 | 0.2 | GO:0097512 | cardiac myofibril(GO:0097512) |
| 0.0 | 0.9 | GO:0099738 | cell cortex region(GO:0099738) |
| 0.0 | 0.2 | GO:0016342 | catenin complex(GO:0016342) |
| 0.0 | 0.3 | GO:0042589 | zymogen granule membrane(GO:0042589) |
| 0.0 | 0.4 | GO:0016281 | eukaryotic translation initiation factor 4F complex(GO:0016281) |
| 0.0 | 0.1 | GO:0005955 | calcineurin complex(GO:0005955) |
| 0.0 | 0.3 | GO:0044232 | organelle membrane contact site(GO:0044232) |
| 0.0 | 0.1 | GO:0005602 | complement component C1 complex(GO:0005602) |
| 0.0 | 0.4 | GO:0031258 | lamellipodium membrane(GO:0031258) |
| 0.0 | 0.2 | GO:0005862 | muscle thin filament tropomyosin(GO:0005862) |
| 0.0 | 0.1 | GO:0044614 | nuclear pore cytoplasmic filaments(GO:0044614) |
| 0.0 | 0.0 | GO:0044354 | pinosome(GO:0044352) macropinosome(GO:0044354) |
| 0.0 | 0.8 | GO:0016529 | sarcoplasmic reticulum(GO:0016529) |
| 0.0 | 0.2 | GO:0044224 | juxtaparanode region of axon(GO:0044224) |
| 0.0 | 0.4 | GO:0016459 | myosin complex(GO:0016459) |
Gene overrepresentation in molecular_function category:
| Log-likelihood per target | Total log-likelihood | Term | Description |
|---|---|---|---|
| 0.5 | 1.6 | GO:0070699 | type II activin receptor binding(GO:0070699) |
| 0.3 | 1.6 | GO:0017018 | myosin phosphatase activity(GO:0017018) |
| 0.2 | 2.5 | GO:0055131 | C3HC4-type RING finger domain binding(GO:0055131) |
| 0.2 | 2.9 | GO:0032036 | myosin heavy chain binding(GO:0032036) |
| 0.2 | 2.5 | GO:0045499 | chemorepellent activity(GO:0045499) |
| 0.1 | 0.7 | GO:0031962 | mineralocorticoid receptor binding(GO:0031962) |
| 0.1 | 0.9 | GO:0043546 | molybdopterin cofactor binding(GO:0043546) |
| 0.1 | 1.4 | GO:0048407 | platelet-derived growth factor binding(GO:0048407) |
| 0.1 | 0.9 | GO:0015501 | glutamate:sodium symporter activity(GO:0015501) |
| 0.1 | 2.5 | GO:0008239 | dipeptidyl-peptidase activity(GO:0008239) |
| 0.1 | 2.5 | GO:0051371 | muscle alpha-actinin binding(GO:0051371) |
| 0.1 | 0.6 | GO:0008553 | hydrogen-exporting ATPase activity, phosphorylative mechanism(GO:0008553) |
| 0.1 | 0.6 | GO:0008269 | JAK pathway signal transduction adaptor activity(GO:0008269) |
| 0.1 | 1.0 | GO:0031013 | troponin I binding(GO:0031013) |
| 0.1 | 1.0 | GO:0031821 | G-protein coupled serotonin receptor binding(GO:0031821) |
| 0.1 | 0.6 | GO:0099583 | neurotransmitter receptor activity involved in regulation of postsynaptic membrane potential(GO:0099529) neurotransmitter receptor activity involved in regulation of postsynaptic cytosolic calcium ion concentration(GO:0099583) transmitter-gated ion channel activity involved in regulation of postsynaptic membrane potential(GO:1904315) |
| 0.1 | 0.9 | GO:0005344 | oxygen transporter activity(GO:0005344) |
| 0.1 | 0.3 | GO:0015254 | glycerol channel activity(GO:0015254) urea channel activity(GO:0015265) |
| 0.1 | 0.2 | GO:0004040 | amidase activity(GO:0004040) |
| 0.1 | 0.2 | GO:0034714 | type III transforming growth factor beta receptor binding(GO:0034714) |
| 0.1 | 0.3 | GO:0004687 | myosin light chain kinase activity(GO:0004687) |
| 0.1 | 0.2 | GO:0019961 | interferon binding(GO:0019961) |
| 0.1 | 0.3 | GO:0008113 | peptide-methionine (S)-S-oxide reductase activity(GO:0008113) |
| 0.1 | 0.2 | GO:0008798 | beta-aspartyl-peptidase activity(GO:0008798) |
| 0.1 | 1.6 | GO:0004181 | metallocarboxypeptidase activity(GO:0004181) |
| 0.1 | 2.0 | GO:0015020 | glucuronosyltransferase activity(GO:0015020) |
| 0.0 | 0.1 | GO:0070984 | SET domain binding(GO:0070984) |
| 0.0 | 0.9 | GO:0004745 | retinol dehydrogenase activity(GO:0004745) |
| 0.0 | 0.9 | GO:0005149 | interleukin-1 receptor binding(GO:0005149) |
| 0.0 | 0.4 | GO:0033192 | calmodulin-dependent protein phosphatase activity(GO:0033192) |
| 0.0 | 4.3 | GO:0004867 | serine-type endopeptidase inhibitor activity(GO:0004867) |
| 0.0 | 0.6 | GO:0008140 | cAMP response element binding protein binding(GO:0008140) |
| 0.0 | 2.3 | GO:0070888 | E-box binding(GO:0070888) |
| 0.0 | 1.2 | GO:0000146 | microfilament motor activity(GO:0000146) |
| 0.0 | 0.1 | GO:0004963 | follicle-stimulating hormone receptor activity(GO:0004963) |
| 0.0 | 0.2 | GO:0046912 | transferase activity, transferring acyl groups, acyl groups converted into alkyl on transfer(GO:0046912) |
| 0.0 | 0.2 | GO:0047045 | testosterone 17-beta-dehydrogenase (NADP+) activity(GO:0047045) |
| 0.0 | 0.5 | GO:0004065 | arylsulfatase activity(GO:0004065) |
| 0.0 | 0.1 | GO:0004833 | tryptophan 2,3-dioxygenase activity(GO:0004833) |
| 0.0 | 1.8 | GO:0001105 | RNA polymerase II transcription coactivator activity(GO:0001105) |
| 0.0 | 0.6 | GO:0005385 | zinc ion transmembrane transporter activity(GO:0005385) |
| 0.0 | 0.1 | GO:0061628 | H3K27me3 modified histone binding(GO:0061628) |
| 0.0 | 0.1 | GO:0048248 | CXCR3 chemokine receptor binding(GO:0048248) |
| 0.0 | 2.1 | GO:0050840 | extracellular matrix binding(GO:0050840) |
| 0.0 | 0.6 | GO:0030296 | protein tyrosine kinase activator activity(GO:0030296) |
| 0.0 | 0.8 | GO:0005520 | insulin-like growth factor binding(GO:0005520) |
| 0.0 | 0.7 | GO:0051428 | peptide hormone receptor binding(GO:0051428) |
| 0.0 | 0.2 | GO:0003810 | protein-glutamine gamma-glutamyltransferase activity(GO:0003810) |
| 0.0 | 0.1 | GO:0001083 | transcription factor activity, RNA polymerase II basal transcription factor binding(GO:0001083) RNA polymerase II transcription factor activity, TBP-class protein binding, involved in preinitiation complex assembly(GO:0001129) RNA polymerase II transcription factor activity, TBP-class protein binding(GO:0001132) |
| 0.0 | 0.4 | GO:0004143 | diacylglycerol kinase activity(GO:0004143) |
| 0.0 | 1.5 | GO:0004693 | cyclin-dependent protein serine/threonine kinase activity(GO:0004693) |
| 0.0 | 0.4 | GO:0005229 | intracellular calcium activated chloride channel activity(GO:0005229) |
| 0.0 | 0.2 | GO:0004689 | phosphorylase kinase activity(GO:0004689) |
| 0.0 | 0.4 | GO:0008190 | eukaryotic initiation factor 4E binding(GO:0008190) |
| 0.0 | 0.2 | GO:0008142 | oxysterol binding(GO:0008142) |
| 0.0 | 0.1 | GO:0004947 | bradykinin receptor activity(GO:0004947) |
| 0.0 | 0.2 | GO:0070915 | lysophosphatidic acid receptor activity(GO:0070915) |
| 0.0 | 0.2 | GO:0015349 | thyroid hormone transmembrane transporter activity(GO:0015349) |
| 0.0 | 1.6 | GO:0017022 | myosin binding(GO:0017022) |
| 0.0 | 1.8 | GO:0097110 | scaffold protein binding(GO:0097110) |
| 0.0 | 0.2 | GO:0019237 | centromeric DNA binding(GO:0019237) |
| 0.0 | 0.1 | GO:0008422 | beta-glucosidase activity(GO:0008422) |
| 0.0 | 0.1 | GO:0004958 | prostaglandin F receptor activity(GO:0004958) |
| 0.0 | 0.1 | GO:0004616 | phosphogluconate dehydrogenase (decarboxylating) activity(GO:0004616) |
| 0.0 | 0.1 | GO:0005113 | patched binding(GO:0005113) |
| 0.0 | 0.1 | GO:0004663 | Rab geranylgeranyltransferase activity(GO:0004663) |
| 0.0 | 0.2 | GO:0004977 | melanocortin receptor activity(GO:0004977) |
| 0.0 | 0.1 | GO:0001093 | TFIIB-class transcription factor binding(GO:0001093) |
| 0.0 | 0.4 | GO:0042813 | Wnt-activated receptor activity(GO:0042813) |
| 0.0 | 0.5 | GO:0000983 | transcription factor activity, RNA polymerase II core promoter sequence-specific(GO:0000983) |
| 0.0 | 0.1 | GO:0099580 | ion antiporter activity involved in regulation of postsynaptic membrane potential(GO:0099580) |
| 0.0 | 0.5 | GO:0071889 | 14-3-3 protein binding(GO:0071889) |
| 0.0 | 0.3 | GO:0042800 | histone methyltransferase activity (H3-K4 specific)(GO:0042800) |
| 0.0 | 0.0 | GO:0070643 | vitamin D3 25-hydroxylase activity(GO:0030343) vitamin D 25-hydroxylase activity(GO:0070643) |
| 0.0 | 0.9 | GO:0005160 | transforming growth factor beta receptor binding(GO:0005160) |
| 0.0 | 0.0 | GO:0015361 | low-affinity sodium:dicarboxylate symporter activity(GO:0015361) |
| 0.0 | 0.3 | GO:0005247 | voltage-gated chloride channel activity(GO:0005247) |
| 0.0 | 0.1 | GO:0044213 | intronic transcription regulatory region sequence-specific DNA binding(GO:0001161) intronic transcription regulatory region DNA binding(GO:0044213) |
| 0.0 | 0.1 | GO:0004897 | ciliary neurotrophic factor receptor activity(GO:0004897) |
| 0.0 | 0.3 | GO:0030275 | LRR domain binding(GO:0030275) |
| 0.0 | 2.3 | GO:0044325 | ion channel binding(GO:0044325) |
| 0.0 | 0.1 | GO:0008889 | glycerophosphodiester phosphodiesterase activity(GO:0008889) |
| 0.0 | 0.5 | GO:0001205 | transcriptional activator activity, RNA polymerase II distal enhancer sequence-specific binding(GO:0001205) |
| 0.0 | 0.0 | GO:0003845 | 11-beta-hydroxysteroid dehydrogenase [NAD(P)] activity(GO:0003845) |
| 0.0 | 1.7 | GO:0002020 | protease binding(GO:0002020) |
| 0.0 | 0.0 | GO:0001596 | angiotensin type I receptor activity(GO:0001596) |
| 0.0 | 0.6 | GO:0036002 | pre-mRNA binding(GO:0036002) |
| 0.0 | 0.2 | GO:0008191 | metalloendopeptidase inhibitor activity(GO:0008191) |
| 0.0 | 0.1 | GO:0038051 | glucocorticoid receptor activity(GO:0004883) glucocorticoid-activated RNA polymerase II transcription factor binding transcription factor activity(GO:0038051) |
| 0.0 | 0.4 | GO:0004385 | guanylate kinase activity(GO:0004385) |
| 0.0 | 0.0 | GO:0008336 | gamma-butyrobetaine dioxygenase activity(GO:0008336) |
Gene overrepresentation in C2:CP:REACTOME category:
| Log-likelihood per target | Total log-likelihood | Term | Description |
|---|---|---|---|
| 0.1 | 1.8 | REACTOME GLYCOPROTEIN HORMONES | Genes involved in Glycoprotein hormones |
| 0.1 | 0.6 | REACTOME GROWTH HORMONE RECEPTOR SIGNALING | Genes involved in Growth hormone receptor signaling |
| 0.1 | 0.9 | REACTOME PURINE CATABOLISM | Genes involved in Purine catabolism |
| 0.1 | 2.4 | REACTOME GABA SYNTHESIS RELEASE REUPTAKE AND DEGRADATION | Genes involved in GABA synthesis, release, reuptake and degradation |
| 0.1 | 1.0 | REACTOME ADENYLATE CYCLASE INHIBITORY PATHWAY | Genes involved in Adenylate cyclase inhibitory pathway |
| 0.0 | 1.2 | REACTOME GLUCURONIDATION | Genes involved in Glucuronidation |
| 0.0 | 3.1 | REACTOME STRIATED MUSCLE CONTRACTION | Genes involved in Striated Muscle Contraction |
| 0.0 | 0.5 | REACTOME THE ACTIVATION OF ARYLSULFATASES | Genes involved in The activation of arylsulfatases |
| 0.0 | 2.4 | REACTOME NCAM1 INTERACTIONS | Genes involved in NCAM1 interactions |
| 0.0 | 1.1 | REACTOME SIGNALING BY NODAL | Genes involved in Signaling by NODAL |
| 0.0 | 0.6 | REACTOME ZINC TRANSPORTERS | Genes involved in Zinc transporters |
| 0.0 | 0.9 | REACTOME DOWNREGULATION OF ERBB2 ERBB3 SIGNALING | Genes involved in Downregulation of ERBB2:ERBB3 signaling |
| 0.0 | 0.6 | REACTOME UNBLOCKING OF NMDA RECEPTOR GLUTAMATE BINDING AND ACTIVATION | Genes involved in Unblocking of NMDA receptor, glutamate binding and activation |
| 0.0 | 1.5 | REACTOME G1 PHASE | Genes involved in G1 Phase |
| 0.0 | 0.6 | REACTOME SEMA3A PAK DEPENDENT AXON REPULSION | Genes involved in Sema3A PAK dependent Axon repulsion |
| 0.0 | 0.6 | REACTOME INSULIN RECEPTOR RECYCLING | Genes involved in Insulin receptor recycling |
| 0.0 | 0.3 | REACTOME PASSIVE TRANSPORT BY AQUAPORINS | Genes involved in Passive Transport by Aquaporins |
| 0.0 | 0.4 | REACTOME MTORC1 MEDIATED SIGNALLING | Genes involved in mTORC1-mediated signalling |
| 0.0 | 0.3 | REACTOME SYNTHESIS SECRETION AND INACTIVATION OF GIP | Genes involved in Synthesis, Secretion, and Inactivation of Glucose-dependent Insulinotropic Polypeptide (GIP) |
| 0.0 | 0.5 | REACTOME REGULATION OF IFNA SIGNALING | Genes involved in Regulation of IFNA signaling |
| 0.0 | 0.5 | REACTOME TIE2 SIGNALING | Genes involved in Tie2 Signaling |
| 0.0 | 0.1 | REACTOME HORMONE LIGAND BINDING RECEPTORS | Genes involved in Hormone ligand-binding receptors |
| 0.0 | 0.2 | REACTOME NEPHRIN INTERACTIONS | Genes involved in Nephrin interactions |
| 0.0 | 0.5 | REACTOME METABOLISM OF STEROID HORMONES AND VITAMINS A AND D | Genes involved in Metabolism of steroid hormones and vitamins A and D |
| 0.0 | 0.3 | REACTOME CELL EXTRACELLULAR MATRIX INTERACTIONS | Genes involved in Cell-extracellular matrix interactions |
| 0.0 | 0.5 | REACTOME SMOOTH MUSCLE CONTRACTION | Genes involved in Smooth Muscle Contraction |
| 0.0 | 0.2 | REACTOME PROLACTIN RECEPTOR SIGNALING | Genes involved in Prolactin receptor signaling |
| 0.0 | 0.7 | REACTOME AMINO ACID AND OLIGOPEPTIDE SLC TRANSPORTERS | Genes involved in Amino acid and oligopeptide SLC transporters |
| 0.0 | 0.2 | REACTOME GLYCOGEN BREAKDOWN GLYCOGENOLYSIS | Genes involved in Glycogen breakdown (glycogenolysis) |
| 0.0 | 0.4 | REACTOME EFFECTS OF PIP2 HYDROLYSIS | Genes involved in Effects of PIP2 hydrolysis |