Project
ENCODE cell lines, expression (Ernst 2011)
Navigation
Downloads
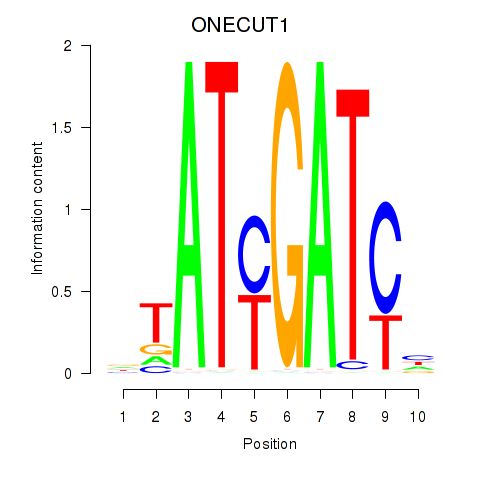
Results for ONECUT1
Z-value: 1.19
Motif logo
Transcription factors associated with ONECUT1
| Gene Symbol | Gene ID | Gene Info |
|---|---|---|
|
ONECUT1
|
ENSG00000169856.7 | ONECUT1 |
Activity-expression correlation:
| Gene | Promoter | Pearson corr. coef. | P-value | Plot |
|---|---|---|---|---|
| ONECUT1 | hg19_v2_chr15_-_53082178_53082209 | 0.84 | 4.6e-05 | Click! |
Activity profile of ONECUT1 motif
Sorted Z-values of ONECUT1 motif
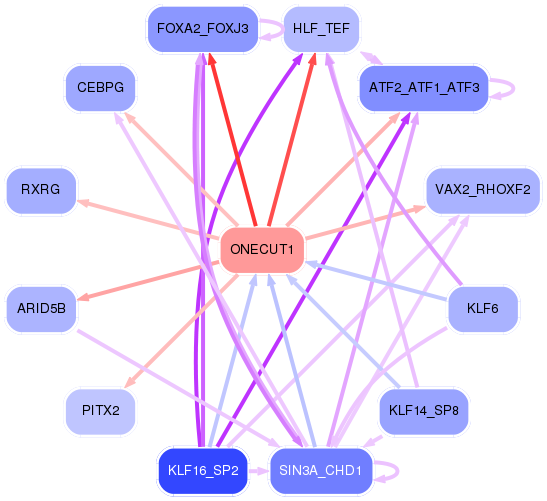
Network of associatons between targets according to the STRING database.

First level regulatory network of ONECUT1
| Promoter | Score | Transcript | Gene | Gene Info |
|---|---|---|---|---|
| chr13_-_46679144 | 6.10 |
ENST00000181383.4 |
CPB2 |
carboxypeptidase B2 (plasma) |
| chr13_-_46679185 | 5.85 |
ENST00000439329.3 |
CPB2 |
carboxypeptidase B2 (plasma) |
| chr9_-_116840728 | 5.77 |
ENST00000265132.3 |
AMBP |
alpha-1-microglobulin/bikunin precursor |
| chr12_+_69742121 | 4.85 |
ENST00000261267.2 ENST00000549690.1 ENST00000548839.1 |
LYZ |
lysozyme |
| chrX_-_131623982 | 3.75 |
ENST00000370844.1 |
MBNL3 |
muscleblind-like splicing regulator 3 |
| chr17_-_64225508 | 3.67 |
ENST00000205948.6 |
APOH |
apolipoprotein H (beta-2-glycoprotein I) |
| chr19_+_45449228 | 3.62 |
ENST00000252490.4 |
APOC2 |
apolipoprotein C-II |
| chr1_+_207262881 | 3.55 |
ENST00000451804.2 |
C4BPB |
complement component 4 binding protein, beta |
| chr19_+_45449301 | 3.54 |
ENST00000591597.1 |
APOC2 |
apolipoprotein C-II |
| chr19_+_45449266 | 3.20 |
ENST00000592257.1 |
APOC2 |
apolipoprotein C-II |
| chr1_+_207262540 | 3.18 |
ENST00000452902.2 |
C4BPB |
complement component 4 binding protein, beta |
| chr20_-_22566089 | 3.11 |
ENST00000377115.4 |
FOXA2 |
forkhead box A2 |
| chr2_-_161350305 | 3.02 |
ENST00000348849.3 |
RBMS1 |
RNA binding motif, single stranded interacting protein 1 |
| chr1_+_207262578 | 2.94 |
ENST00000243611.5 ENST00000367076.3 |
C4BPB |
complement component 4 binding protein, beta |
| chr2_-_161349909 | 2.81 |
ENST00000392753.3 |
RBMS1 |
RNA binding motif, single stranded interacting protein 1 |
| chr1_+_207262627 | 2.72 |
ENST00000391923.1 |
C4BPB |
complement component 4 binding protein, beta |
| chr3_-_99569821 | 2.64 |
ENST00000487087.1 |
FILIP1L |
filamin A interacting protein 1-like |
| chr17_+_53342311 | 2.61 |
ENST00000226067.5 |
HLF |
hepatic leukemia factor |
| chr10_+_28966271 | 2.42 |
ENST00000375533.3 |
BAMBI |
BMP and activin membrane-bound inhibitor |
| chr8_-_27468842 | 2.39 |
ENST00000523500.1 |
CLU |
clusterin |
| chr1_+_10292308 | 2.20 |
ENST00000377081.1 |
KIF1B |
kinesin family member 1B |
| chr17_-_26697304 | 2.16 |
ENST00000536498.1 |
VTN |
vitronectin |
| chr17_+_41052808 | 2.03 |
ENST00000592383.1 ENST00000253801.2 ENST00000585489.1 |
G6PC |
glucose-6-phosphatase, catalytic subunit |
| chr3_-_79816965 | 1.95 |
ENST00000464233.1 |
ROBO1 |
roundabout, axon guidance receptor, homolog 1 (Drosophila) |
| chr11_+_19799327 | 1.88 |
ENST00000540292.1 |
NAV2 |
neuron navigator 2 |
| chr3_-_170744498 | 1.83 |
ENST00000382808.4 ENST00000314251.3 |
SLC2A2 |
solute carrier family 2 (facilitated glucose transporter), member 2 |
| chr16_-_18573396 | 1.72 |
ENST00000543392.1 ENST00000381474.3 ENST00000330537.6 |
NOMO2 |
NODAL modulator 2 |
| chrX_+_70435044 | 1.65 |
ENST00000374029.1 ENST00000374022.3 ENST00000447581.1 |
GJB1 |
gap junction protein, beta 1, 32kDa |
| chr16_-_75467318 | 1.61 |
ENST00000283882.3 |
CFDP1 |
craniofacial development protein 1 |
| chr4_-_141348999 | 1.40 |
ENST00000325617.5 |
CLGN |
calmegin |
| chr16_+_16326352 | 1.33 |
ENST00000399336.4 ENST00000263012.6 ENST00000538468.1 |
NOMO3 |
NODAL modulator 3 |
| chr10_+_114133773 | 1.27 |
ENST00000354655.4 |
ACSL5 |
acyl-CoA synthetase long-chain family member 5 |
| chr10_-_35104185 | 1.23 |
ENST00000374789.3 ENST00000374788.3 ENST00000346874.4 ENST00000374794.3 ENST00000350537.4 ENST00000374790.3 ENST00000374776.1 ENST00000374773.1 ENST00000545693.1 ENST00000545260.1 ENST00000340077.5 |
PARD3 |
par-3 family cell polarity regulator |
| chr2_-_85788652 | 1.22 |
ENST00000430215.3 |
GGCX |
gamma-glutamyl carboxylase |
| chr1_+_57320437 | 1.11 |
ENST00000361249.3 |
C8A |
complement component 8, alpha polypeptide |
| chr3_+_142315225 | 0.98 |
ENST00000457734.2 ENST00000483373.1 ENST00000475296.1 ENST00000495744.1 ENST00000476044.1 ENST00000461644.1 |
PLS1 |
plastin 1 |
| chr15_-_99789736 | 0.98 |
ENST00000560235.1 ENST00000394132.2 ENST00000560860.1 ENST00000558078.1 ENST00000394136.1 ENST00000262074.4 ENST00000558613.1 ENST00000394130.1 ENST00000560772.1 |
TTC23 |
tetratricopeptide repeat domain 23 |
| chr4_-_157892498 | 0.91 |
ENST00000502773.1 |
PDGFC |
platelet derived growth factor C |
| chr22_-_36220420 | 0.89 |
ENST00000473487.2 |
RBFOX2 |
RNA binding protein, fox-1 homolog (C. elegans) 2 |
| chr3_+_52811596 | 0.87 |
ENST00000542827.1 ENST00000273283.2 |
ITIH1 |
inter-alpha-trypsin inhibitor heavy chain 1 |
| chr16_-_29499154 | 0.85 |
ENST00000354563.5 |
RP11-231C14.4 |
Uncharacterized protein |
| chr7_-_71912046 | 0.84 |
ENST00000395276.2 ENST00000431984.1 |
CALN1 |
calneuron 1 |
| chr7_-_5998714 | 0.84 |
ENST00000539903.1 |
RSPH10B |
radial spoke head 10 homolog B (Chlamydomonas) |
| chr10_+_63661053 | 0.82 |
ENST00000279873.7 |
ARID5B |
AT rich interactive domain 5B (MRF1-like) |
| chr2_-_86850949 | 0.79 |
ENST00000237455.4 |
RNF103 |
ring finger protein 103 |
| chr14_-_35873856 | 0.78 |
ENST00000553342.1 ENST00000216797.5 ENST00000557140.1 |
NFKBIA |
nuclear factor of kappa light polypeptide gene enhancer in B-cells inhibitor, alpha |
| chr21_-_43735628 | 0.77 |
ENST00000291525.10 ENST00000518498.1 |
TFF3 |
trefoil factor 3 (intestinal) |
| chr7_-_121784285 | 0.72 |
ENST00000417368.2 |
AASS |
aminoadipate-semialdehyde synthase |
| chr1_+_52870227 | 0.65 |
ENST00000257181.9 |
PRPF38A |
pre-mRNA processing factor 38A |
| chr11_+_62623544 | 0.62 |
ENST00000377890.2 ENST00000377891.2 ENST00000377889.2 |
SLC3A2 |
solute carrier family 3 (amino acid transporter heavy chain), member 2 |
| chr11_-_118305921 | 0.58 |
ENST00000532619.1 |
RP11-770J1.4 |
RP11-770J1.4 |
| chr11_+_62623621 | 0.56 |
ENST00000535296.1 |
SLC3A2 |
solute carrier family 3 (amino acid transporter heavy chain), member 2 |
| chr5_+_59726565 | 0.55 |
ENST00000412930.2 |
FKSG52 |
FKSG52 |
| chr5_-_115910630 | 0.53 |
ENST00000343348.6 |
SEMA6A |
sema domain, transmembrane domain (TM), and cytoplasmic domain, (semaphorin) 6A |
| chr1_+_212738676 | 0.51 |
ENST00000366981.4 ENST00000366987.2 |
ATF3 |
activating transcription factor 3 |
| chrX_-_33229636 | 0.49 |
ENST00000357033.4 |
DMD |
dystrophin |
| chr15_-_47426320 | 0.49 |
ENST00000557832.1 |
FKSG62 |
FKSG62 |
| chr2_+_71127699 | 0.47 |
ENST00000234392.2 |
VAX2 |
ventral anterior homeobox 2 |
| chr10_+_51576285 | 0.47 |
ENST00000443446.1 |
NCOA4 |
nuclear receptor coactivator 4 |
| chr4_+_187187098 | 0.44 |
ENST00000403665.2 ENST00000264692.4 |
F11 |
coagulation factor XI |
| chr3_+_148415571 | 0.42 |
ENST00000497524.1 ENST00000349243.3 ENST00000542281.1 ENST00000418473.2 ENST00000404754.2 |
AGTR1 |
angiotensin II receptor, type 1 |
| chr7_-_152373216 | 0.41 |
ENST00000359321.1 |
XRCC2 |
X-ray repair complementing defective repair in Chinese hamster cells 2 |
| chr15_-_86338100 | 0.41 |
ENST00000536947.1 |
KLHL25 |
kelch-like family member 25 |
| chr18_-_49557 | 0.40 |
ENST00000308911.6 |
RP11-683L23.1 |
Tubulin beta-8 chain-like protein LOC260334 |
| chr4_-_130692631 | 0.39 |
ENST00000500092.2 ENST00000509105.1 |
RP11-519M16.1 |
RP11-519M16.1 |
| chr11_+_131240373 | 0.39 |
ENST00000374791.3 ENST00000436745.1 |
NTM |
neurotrimin |
| chr19_+_5681011 | 0.38 |
ENST00000581893.1 ENST00000411793.2 ENST00000301382.4 ENST00000581773.1 ENST00000423665.2 ENST00000583928.1 ENST00000342970.2 ENST00000422535.2 ENST00000581521.1 ENST00000339423.2 |
HSD11B1L |
hydroxysteroid (11-beta) dehydrogenase 1-like |
| chr2_-_55646412 | 0.37 |
ENST00000413716.2 |
CCDC88A |
coiled-coil domain containing 88A |
| chr20_+_58515417 | 0.35 |
ENST00000360816.3 |
FAM217B |
family with sequence similarity 217, member B |
| chr9_+_80850952 | 0.34 |
ENST00000424347.2 ENST00000415759.2 ENST00000376597.4 ENST00000277082.5 ENST00000376598.2 |
CEP78 |
centrosomal protein 78kDa |
| chr4_-_111563076 | 0.33 |
ENST00000354925.2 ENST00000511990.1 |
PITX2 |
paired-like homeodomain 2 |
| chr6_-_27799305 | 0.33 |
ENST00000357549.2 |
HIST1H4K |
histone cluster 1, H4k |
| chr15_-_86338134 | 0.33 |
ENST00000337975.5 |
KLHL25 |
kelch-like family member 25 |
| chr19_-_47287990 | 0.31 |
ENST00000593713.1 ENST00000598022.1 ENST00000434726.2 |
SLC1A5 |
solute carrier family 1 (neutral amino acid transporter), member 5 |
| chr2_-_39348137 | 0.31 |
ENST00000426016.1 |
SOS1 |
son of sevenless homolog 1 (Drosophila) |
| chr1_+_110546700 | 0.30 |
ENST00000359172.3 ENST00000393614.4 |
AHCYL1 |
adenosylhomocysteinase-like 1 |
| chr4_-_83483395 | 0.30 |
ENST00000515780.2 |
TMEM150C |
transmembrane protein 150C |
| chr8_+_120885949 | 0.29 |
ENST00000523492.1 ENST00000286234.5 |
DEPTOR |
DEP domain containing MTOR-interacting protein |
| chr17_-_17485731 | 0.29 |
ENST00000395783.1 |
PEMT |
phosphatidylethanolamine N-methyltransferase |
| chr11_-_47788847 | 0.28 |
ENST00000263773.5 |
FNBP4 |
formin binding protein 4 |
| chr2_+_27255806 | 0.28 |
ENST00000238788.9 ENST00000404032.3 |
TMEM214 |
transmembrane protein 214 |
| chr11_+_118938485 | 0.28 |
ENST00000300793.6 |
VPS11 |
vacuolar protein sorting 11 homolog (S. cerevisiae) |
| chr1_-_165414414 | 0.28 |
ENST00000359842.5 |
RXRG |
retinoid X receptor, gamma |
| chr4_+_123073464 | 0.27 |
ENST00000264501.4 |
KIAA1109 |
KIAA1109 |
| chr7_+_97736197 | 0.26 |
ENST00000297293.5 |
LMTK2 |
lemur tyrosine kinase 2 |
| chr19_+_33865218 | 0.25 |
ENST00000585933.2 |
CEBPG |
CCAAT/enhancer binding protein (C/EBP), gamma |
| chr1_-_94586651 | 0.24 |
ENST00000535735.1 ENST00000370225.3 |
ABCA4 |
ATP-binding cassette, sub-family A (ABC1), member 4 |
| chr4_+_110834033 | 0.23 |
ENST00000509793.1 ENST00000265171.5 |
EGF |
epidermal growth factor |
| chr22_+_24198890 | 0.23 |
ENST00000345044.6 |
SLC2A11 |
solute carrier family 2 (facilitated glucose transporter), member 11 |
| chr1_+_145293371 | 0.22 |
ENST00000342960.5 |
NBPF10 |
neuroblastoma breakpoint family, member 10 |
| chr20_+_36373032 | 0.21 |
ENST00000373473.1 |
CTNNBL1 |
catenin, beta like 1 |
| chr7_+_129007964 | 0.21 |
ENST00000460109.1 ENST00000474594.1 ENST00000446212.1 |
AHCYL2 |
adenosylhomocysteinase-like 2 |
| chr12_+_8995832 | 0.20 |
ENST00000541459.1 |
A2ML1 |
alpha-2-macroglobulin-like 1 |
| chrX_-_110654147 | 0.18 |
ENST00000358070.4 |
DCX |
doublecortin |
| chr12_-_56359802 | 0.17 |
ENST00000548803.1 ENST00000449260.2 ENST00000550447.1 ENST00000547137.1 ENST00000546543.1 ENST00000550464.1 |
PMEL |
premelanosome protein |
| chr11_-_95657231 | 0.16 |
ENST00000409459.1 ENST00000352297.7 ENST00000393223.3 ENST00000346299.5 |
MTMR2 |
myotubularin related protein 2 |
| chr22_+_51176624 | 0.15 |
ENST00000216139.5 ENST00000529621.1 |
ACR |
acrosin |
| chr12_-_11422739 | 0.15 |
ENST00000279573.7 |
PRB3 |
proline-rich protein BstNI subfamily 3 |
| chr1_-_1655713 | 0.14 |
ENST00000401096.2 ENST00000404249.3 ENST00000357760.2 ENST00000358779.5 ENST00000378633.1 ENST00000378635.3 |
CDK11A |
cyclin-dependent kinase 11A |
| chr14_+_24422795 | 0.14 |
ENST00000313250.5 ENST00000558263.1 ENST00000543741.2 ENST00000421831.1 ENST00000397073.2 ENST00000308178.8 ENST00000382761.3 ENST00000397075.3 ENST00000397074.3 ENST00000559632.1 ENST00000558581.1 |
DHRS4 |
dehydrogenase/reductase (SDR family) member 4 |
| chr18_-_31802056 | 0.13 |
ENST00000538587.1 |
NOL4 |
nucleolar protein 4 |
| chr12_-_10978957 | 0.13 |
ENST00000240619.2 |
TAS2R10 |
taste receptor, type 2, member 10 |
| chr19_+_2785458 | 0.12 |
ENST00000307741.6 ENST00000585338.1 |
THOP1 |
thimet oligopeptidase 1 |
| chr16_-_20702578 | 0.11 |
ENST00000307493.4 ENST00000219151.4 |
ACSM1 |
acyl-CoA synthetase medium-chain family member 1 |
| chr5_+_140800638 | 0.11 |
ENST00000398587.2 ENST00000518882.1 |
PCDHGA11 |
protocadherin gamma subfamily A, 11 |
| chr10_+_70980051 | 0.10 |
ENST00000354624.5 ENST00000395086.2 |
HKDC1 |
hexokinase domain containing 1 |
| chr1_-_202679535 | 0.10 |
ENST00000367268.4 |
SYT2 |
synaptotagmin II |
| chr13_+_52586517 | 0.10 |
ENST00000523764.1 ENST00000521508.1 |
ALG11 |
ALG11, alpha-1,2-mannosyltransferase |
| chr17_-_8263538 | 0.10 |
ENST00000535173.1 |
AC135178.1 |
HCG1985372; Uncharacterized protein; cDNA FLJ37541 fis, clone BRCAN2026340 |
| chr4_+_159131630 | 0.10 |
ENST00000504569.1 ENST00000509278.1 ENST00000514558.1 ENST00000503200.1 |
TMEM144 |
transmembrane protein 144 |
| chr12_-_90024360 | 0.09 |
ENST00000393164.2 |
ATP2B1 |
ATPase, Ca++ transporting, plasma membrane 1 |
| chr11_-_72385437 | 0.09 |
ENST00000418754.2 ENST00000542969.2 ENST00000334456.5 |
PDE2A |
phosphodiesterase 2A, cGMP-stimulated |
| chr12_-_11422630 | 0.09 |
ENST00000381842.3 ENST00000538488.1 |
PRB3 |
proline-rich protein BstNI subfamily 3 |
| chr12_+_74931551 | 0.08 |
ENST00000519948.2 |
ATXN7L3B |
ataxin 7-like 3B |
| chr12_-_11062161 | 0.08 |
ENST00000390677.2 |
TAS2R13 |
taste receptor, type 2, member 13 |
| chr1_+_78245303 | 0.08 |
ENST00000370791.3 ENST00000443751.2 |
FAM73A |
family with sequence similarity 73, member A |
| chr15_-_89089860 | 0.08 |
ENST00000558413.1 ENST00000564406.1 ENST00000268148.8 |
DET1 |
de-etiolated homolog 1 (Arabidopsis) |
| chrX_-_151143140 | 0.07 |
ENST00000393914.3 ENST00000370328.3 ENST00000370325.1 |
GABRE |
gamma-aminobutyric acid (GABA) A receptor, epsilon |
| chr11_+_57365150 | 0.07 |
ENST00000457869.1 ENST00000340687.6 ENST00000378323.4 ENST00000378324.2 ENST00000403558.1 |
SERPING1 |
serpin peptidase inhibitor, clade G (C1 inhibitor), member 1 |
| chr21_-_43816052 | 0.07 |
ENST00000398405.1 |
TMPRSS3 |
transmembrane protease, serine 3 |
| chrX_+_14547632 | 0.07 |
ENST00000218075.4 |
GLRA2 |
glycine receptor, alpha 2 |
| chr1_+_25598989 | 0.07 |
ENST00000454452.2 |
RHD |
Rh blood group, D antigen |
| chr7_-_36764142 | 0.06 |
ENST00000258749.5 ENST00000535891.1 |
AOAH |
acyloxyacyl hydrolase (neutrophil) |
| chr11_+_4788500 | 0.06 |
ENST00000380390.1 |
MMP26 |
matrix metallopeptidase 26 |
| chr5_+_128300810 | 0.06 |
ENST00000262462.4 |
SLC27A6 |
solute carrier family 27 (fatty acid transporter), member 6 |
| chr7_-_6523688 | 0.05 |
ENST00000490996.1 |
KDELR2 |
KDEL (Lys-Asp-Glu-Leu) endoplasmic reticulum protein retention receptor 2 |
| chr1_-_151804222 | 0.05 |
ENST00000392697.3 |
RORC |
RAR-related orphan receptor C |
| chr10_-_94003003 | 0.04 |
ENST00000412050.4 |
CPEB3 |
cytoplasmic polyadenylation element binding protein 3 |
| chr12_+_70760056 | 0.04 |
ENST00000258111.4 |
KCNMB4 |
potassium large conductance calcium-activated channel, subfamily M, beta member 4 |
| chr19_+_11200038 | 0.03 |
ENST00000558518.1 ENST00000557933.1 ENST00000455727.2 ENST00000535915.1 ENST00000545707.1 ENST00000558013.1 |
LDLR |
low density lipoprotein receptor |
| chr4_-_168155169 | 0.03 |
ENST00000534949.1 ENST00000535728.1 |
SPOCK3 |
sparc/osteonectin, cwcv and kazal-like domains proteoglycan (testican) 3 |
| chr19_+_49588690 | 0.02 |
ENST00000221448.5 |
SNRNP70 |
small nuclear ribonucleoprotein 70kDa (U1) |
| chr12_-_110434183 | 0.02 |
ENST00000360185.4 ENST00000354574.4 ENST00000338373.5 ENST00000343646.5 ENST00000356259.4 ENST00000553118.1 |
GIT2 |
G protein-coupled receptor kinase interacting ArfGAP 2 |
| chr18_-_3880051 | 0.02 |
ENST00000584874.1 |
DLGAP1 |
discs, large (Drosophila) homolog-associated protein 1 |
| chr13_+_52598827 | 0.01 |
ENST00000521776.2 |
UTP14C |
UTP14, U3 small nucleolar ribonucleoprotein, homolog C (yeast) |
| chr4_-_103747011 | 0.01 |
ENST00000350435.7 |
UBE2D3 |
ubiquitin-conjugating enzyme E2D 3 |
| chr1_+_26496362 | 0.01 |
ENST00000374266.5 ENST00000270812.5 |
ZNF593 |
zinc finger protein 593 |
| chr11_-_67407031 | 0.01 |
ENST00000335385.3 |
TBX10 |
T-box 10 |
| chr11_-_5531215 | 0.01 |
ENST00000311659.4 |
UBQLN3 |
ubiquilin 3 |
Gene Ontology Analysis
Gene overrepresentation in C2:CP category:
| Log-likelihood per target | Total log-likelihood | Term | Description |
|---|---|---|---|
| 0.2 | 15.3 | PID HNF3A PATHWAY | FOXA1 transcription factor network |
| 0.1 | 3.6 | PID HNF3B PATHWAY | FOXA2 and FOXA3 transcription factor networks |
| 0.0 | 2.4 | PID BMP PATHWAY | BMP receptor signaling |
| 0.0 | 2.2 | PID AJDISS 2PATHWAY | Posttranslational regulation of adherens junction stability and dissassembly |
| 0.0 | 1.1 | ST GAQ PATHWAY | G alpha q Pathway |
| 0.0 | 1.5 | SIG INSULIN RECEPTOR PATHWAY IN CARDIAC MYOCYTES | Genes related to the insulin receptor pathway |
| 0.0 | 3.4 | NABA ECM REGULATORS | Genes encoding enzymes and their regulators involved in the remodeling of the extracellular matrix |
| 0.0 | 1.5 | PID MYC REPRESS PATHWAY | Validated targets of C-MYC transcriptional repression |
Gene overrepresentation in C2:CP:REACTOME category:
| Log-likelihood per target | Total log-likelihood | Term | Description |
|---|---|---|---|
| 0.5 | 10.4 | REACTOME CHYLOMICRON MEDIATED LIPID TRANSPORT | Genes involved in Chylomicron-mediated lipid transport |
| 0.4 | 12.4 | REACTOME REGULATION OF COMPLEMENT CASCADE | Genes involved in Regulation of Complement cascade |
| 0.1 | 4.7 | REACTOME REGULATION OF GENE EXPRESSION IN BETA CELLS | Genes involved in Regulation of gene expression in beta cells |
| 0.1 | 1.6 | REACTOME GAP JUNCTION ASSEMBLY | Genes involved in Gap junction assembly |
| 0.1 | 1.2 | REACTOME GAMMA CARBOXYLATION TRANSPORT AND AMINO TERMINAL CLEAVAGE OF PROTEINS | Genes involved in Gamma-carboxylation, transport, and amino-terminal cleavage of proteins |
| 0.1 | 2.0 | REACTOME ACTIVATION OF RAC | Genes involved in Activation of Rac |
| 0.1 | 1.2 | REACTOME TGF BETA RECEPTOR SIGNALING IN EMT EPITHELIAL TO MESENCHYMAL TRANSITION | Genes involved in TGF-beta receptor signaling in EMT (epithelial to mesenchymal transition) |
| 0.1 | 1.3 | REACTOME SYNTHESIS OF VERY LONG CHAIN FATTY ACYL COAS | Genes involved in Synthesis of very long-chain fatty acyl-CoAs |
| 0.1 | 4.8 | REACTOME AMYLOIDS | Genes involved in Amyloids |
| 0.1 | 0.8 | REACTOME NFKB IS ACTIVATED AND SIGNALS SURVIVAL | Genes involved in NF-kB is activated and signals survival |
| 0.0 | 0.9 | REACTOME VEGF LIGAND RECEPTOR INTERACTIONS | Genes involved in VEGF ligand-receptor interactions |
| 0.0 | 2.0 | REACTOME GLUCOSE TRANSPORT | Genes involved in Glucose transport |
| 0.0 | 1.5 | REACTOME AMINO ACID TRANSPORT ACROSS THE PLASMA MEMBRANE | Genes involved in Amino acid transport across the plasma membrane |
| 0.0 | 0.5 | REACTOME COMPLEMENT CASCADE | Genes involved in Complement cascade |
| 0.0 | 0.5 | REACTOME OTHER SEMAPHORIN INTERACTIONS | Genes involved in Other semaphorin interactions |
| 0.0 | 0.5 | REACTOME ACTIVATION OF GENES BY ATF4 | Genes involved in Activation of Genes by ATF4 |
| 0.0 | 0.2 | REACTOME SYNTHESIS OF PIPS AT THE LATE ENDOSOME MEMBRANE | Genes involved in Synthesis of PIPs at the late endosome membrane |
| 0.0 | 0.2 | REACTOME FACILITATIVE NA INDEPENDENT GLUCOSE TRANSPORTERS | Genes involved in Facilitative Na+-independent glucose transporters |
| 0.0 | 1.7 | REACTOME RESPONSE TO ELEVATED PLATELET CYTOSOLIC CA2 | Genes involved in Response to elevated platelet cytosolic Ca2+ |
| 0.0 | 0.3 | REACTOME SYNTHESIS OF PC | Genes involved in Synthesis of PC |
Gene overrepresentation in cellular_component category:
| Log-likelihood per target | Total log-likelihood | Term | Description |
|---|---|---|---|
| 1.3 | 10.4 | GO:0034363 | intermediate-density lipoprotein particle(GO:0034363) |
| 0.5 | 2.2 | GO:0071062 | rough endoplasmic reticulum lumen(GO:0048237) alphav-beta3 integrin-vitronectin complex(GO:0071062) |
| 0.2 | 2.4 | GO:0034366 | spherical high-density lipoprotein particle(GO:0034366) |
| 0.2 | 3.7 | GO:0042627 | chylomicron(GO:0042627) |
| 0.2 | 1.2 | GO:0033269 | internode region of axon(GO:0033269) |
| 0.2 | 0.5 | GO:1990622 | CHOP-ATF3 complex(GO:1990622) |
| 0.2 | 1.9 | GO:0005614 | interstitial matrix(GO:0005614) |
| 0.2 | 1.0 | GO:1990357 | terminal web(GO:1990357) |
| 0.1 | 1.1 | GO:0005579 | membrane attack complex(GO:0005579) |
| 0.1 | 12.4 | GO:0044217 | other organism(GO:0044215) other organism cell(GO:0044216) other organism part(GO:0044217) |
| 0.1 | 1.6 | GO:0005922 | connexon complex(GO:0005922) |
| 0.1 | 0.4 | GO:0033061 | DNA recombinase mediator complex(GO:0033061) Rad51B-Rad51C-Rad51D-XRCC2 complex(GO:0033063) |
| 0.1 | 0.8 | GO:0033256 | I-kappaB/NF-kappaB complex(GO:0033256) |
| 0.1 | 4.9 | GO:1904724 | tertiary granule lumen(GO:1904724) |
| 0.1 | 0.5 | GO:0016013 | syntrophin complex(GO:0016013) |
| 0.1 | 0.2 | GO:0043159 | acrosomal matrix(GO:0043159) |
| 0.0 | 2.2 | GO:1904115 | axon cytoplasm(GO:1904115) |
| 0.0 | 0.5 | GO:0044754 | autolysosome(GO:0044754) |
| 0.0 | 0.8 | GO:0044322 | endoplasmic reticulum quality control compartment(GO:0044322) |
| 0.0 | 0.6 | GO:0071011 | precatalytic spliceosome(GO:0071011) |
| 0.0 | 0.3 | GO:0030897 | HOPS complex(GO:0030897) |
| 0.0 | 1.6 | GO:0000777 | condensed chromosome kinetochore(GO:0000777) |
| 0.0 | 0.2 | GO:0000974 | Prp19 complex(GO:0000974) |
| 0.0 | 2.0 | GO:0030176 | integral component of endoplasmic reticulum membrane(GO:0030176) |
| 0.0 | 1.9 | GO:0005903 | brush border(GO:0005903) |
| 0.0 | 0.7 | GO:0031463 | Cul3-RING ubiquitin ligase complex(GO:0031463) |
| 0.0 | 0.8 | GO:0032588 | trans-Golgi network membrane(GO:0032588) |
| 0.0 | 0.1 | GO:0042584 | chromaffin granule membrane(GO:0042584) |
Gene overrepresentation in molecular_function category:
| Log-likelihood per target | Total log-likelihood | Term | Description |
|---|---|---|---|
| 2.8 | 14.0 | GO:0060230 | lipoprotein lipase activator activity(GO:0060230) |
| 1.4 | 5.8 | GO:0019862 | IgA binding(GO:0019862) |
| 0.8 | 4.9 | GO:0003796 | lysozyme activity(GO:0003796) |
| 0.6 | 1.8 | GO:0033300 | dehydroascorbic acid transporter activity(GO:0033300) |
| 0.5 | 2.0 | GO:0004346 | glucose-6-phosphatase activity(GO:0004346) sugar-terminal-phosphatase activity(GO:0050309) |
| 0.4 | 11.9 | GO:0004181 | metallocarboxypeptidase activity(GO:0004181) |
| 0.3 | 1.9 | GO:0008046 | axon guidance receptor activity(GO:0008046) |
| 0.2 | 2.4 | GO:0005114 | type II transforming growth factor beta receptor binding(GO:0005114) |
| 0.1 | 0.4 | GO:0001596 | angiotensin type I receptor activity(GO:0001596) |
| 0.1 | 2.2 | GO:0030247 | pattern binding(GO:0001871) polysaccharide binding(GO:0030247) |
| 0.1 | 1.6 | GO:0005243 | gap junction channel activity(GO:0005243) |
| 0.1 | 1.2 | GO:0005432 | calcium:sodium antiporter activity(GO:0005432) |
| 0.1 | 0.3 | GO:0080101 | phosphatidyl-N-methylethanolamine N-methyltransferase activity(GO:0000773) phosphatidylethanolamine N-methyltransferase activity(GO:0004608) phosphatidyl-N-dimethylethanolamine N-methyltransferase activity(GO:0080101) |
| 0.1 | 0.5 | GO:0004013 | adenosylhomocysteinase activity(GO:0004013) trialkylsulfonium hydrolase activity(GO:0016802) |
| 0.1 | 1.3 | GO:0102391 | decanoate--CoA ligase activity(GO:0102391) |
| 0.1 | 0.3 | GO:0004886 | 9-cis retinoic acid receptor activity(GO:0004886) |
| 0.1 | 0.8 | GO:1904264 | ubiquitin protein ligase activity involved in ERAD pathway(GO:1904264) |
| 0.1 | 1.4 | GO:0051787 | misfolded protein binding(GO:0051787) |
| 0.1 | 0.5 | GO:0001162 | RNA polymerase II intronic transcription regulatory region sequence-specific DNA binding(GO:0001162) |
| 0.1 | 0.2 | GO:0004040 | amidase activity(GO:0004040) fucose binding(GO:0042806) |
| 0.0 | 0.1 | GO:0000253 | 3-keto sterol reductase activity(GO:0000253) |
| 0.0 | 0.9 | GO:0005161 | platelet-derived growth factor receptor binding(GO:0005161) |
| 0.0 | 0.3 | GO:0015186 | L-glutamine transmembrane transporter activity(GO:0015186) |
| 0.0 | 1.2 | GO:0032266 | phosphatidylinositol-3-phosphate binding(GO:0032266) |
| 0.0 | 5.8 | GO:0003697 | single-stranded DNA binding(GO:0003697) |
| 0.0 | 2.2 | GO:0019894 | kinesin binding(GO:0019894) |
| 0.0 | 0.1 | GO:0000026 | alpha-1,2-mannosyltransferase activity(GO:0000026) |
| 0.0 | 0.4 | GO:0070008 | serine-type exopeptidase activity(GO:0070008) |
| 0.0 | 0.7 | GO:0016646 | oxidoreductase activity, acting on the CH-NH group of donors, NAD or NADP as acceptor(GO:0016646) |
| 0.0 | 0.5 | GO:0050998 | nitric-oxide synthase binding(GO:0050998) |
| 0.0 | 0.9 | GO:0044183 | protein binding involved in protein folding(GO:0044183) |
| 0.0 | 0.7 | GO:0032452 | histone demethylase activity(GO:0032452) |
| 0.0 | 1.2 | GO:0016831 | carboxy-lyase activity(GO:0016831) |
| 0.0 | 0.8 | GO:0008139 | nuclear localization sequence binding(GO:0008139) |
| 0.0 | 0.1 | GO:0050528 | acyloxyacyl hydrolase activity(GO:0050528) |
| 0.0 | 0.5 | GO:0001848 | complement binding(GO:0001848) |
| 0.0 | 0.2 | GO:0030297 | transmembrane receptor protein tyrosine kinase activator activity(GO:0030297) |
| 0.0 | 0.4 | GO:0043422 | protein kinase B binding(GO:0043422) |
| 0.0 | 0.1 | GO:0043533 | inositol 1,3,4,5 tetrakisphosphate binding(GO:0043533) |
| 0.0 | 0.1 | GO:0004118 | cGMP-stimulated cyclic-nucleotide phosphodiesterase activity(GO:0004118) |
| 0.0 | 0.1 | GO:0016933 | extracellular-glycine-gated ion channel activity(GO:0016933) extracellular-glycine-gated chloride channel activity(GO:0016934) |
| 0.0 | 0.1 | GO:0005046 | KDEL sequence binding(GO:0005046) |
| 0.0 | 0.1 | GO:0008865 | glucokinase activity(GO:0004340) hexokinase activity(GO:0004396) fructokinase activity(GO:0008865) mannokinase activity(GO:0019158) |
| 0.0 | 0.1 | GO:0004321 | fatty-acyl-CoA synthase activity(GO:0004321) |
| 0.0 | 0.2 | GO:0052629 | phosphatidylinositol-3,5-bisphosphate 3-phosphatase activity(GO:0052629) |
| 0.0 | 1.7 | GO:0004386 | helicase activity(GO:0004386) |
Gene overrepresentation in biological_process category:
| Log-likelihood per target | Total log-likelihood | Term | Description |
|---|---|---|---|
| 3.5 | 10.4 | GO:0010902 | positive regulation of very-low-density lipoprotein particle remodeling(GO:0010902) |
| 3.0 | 11.9 | GO:0003330 | regulation of extracellular matrix constituent secretion(GO:0003330) positive regulation of extracellular matrix constituent secretion(GO:0003331) |
| 1.4 | 12.4 | GO:0030450 | regulation of complement activation, classical pathway(GO:0030450) negative regulation of complement activation, classical pathway(GO:0045959) regulation of opsonization(GO:1903027) |
| 1.0 | 3.1 | GO:0045013 | carbon catabolite repression of transcription(GO:0045013) negative regulation of transcription by glucose(GO:0045014) |
| 1.0 | 4.9 | GO:0016998 | cell wall macromolecule catabolic process(GO:0016998) |
| 0.7 | 2.2 | GO:1904647 | response to rotenone(GO:1904647) |
| 0.6 | 1.9 | GO:0021823 | cerebral cortex tangential migration using cell-cell interactions(GO:0021823) postnatal olfactory bulb interneuron migration(GO:0021827) chemorepulsion involved in postnatal olfactory bulb interneuron migration(GO:0021836) regulation of negative chemotaxis(GO:0050923) |
| 0.6 | 1.8 | GO:0070837 | dehydroascorbic acid transport(GO:0070837) |
| 0.5 | 1.9 | GO:0021564 | vagus nerve development(GO:0021564) |
| 0.4 | 2.4 | GO:1902847 | macrophage proliferation(GO:0061517) microglial cell proliferation(GO:0061518) regulation of neuronal signal transduction(GO:1902847) positive regulation of neurofibrillary tangle assembly(GO:1902998) |
| 0.4 | 5.8 | GO:0006787 | porphyrin-containing compound catabolic process(GO:0006787) tetrapyrrole catabolic process(GO:0033015) heme catabolic process(GO:0042167) pigment catabolic process(GO:0046149) |
| 0.3 | 3.0 | GO:0051918 | negative regulation of fibrinolysis(GO:0051918) |
| 0.3 | 2.0 | GO:0015760 | hexose phosphate transport(GO:0015712) glucose-6-phosphate transport(GO:0015760) |
| 0.3 | 2.2 | GO:0061302 | smooth muscle cell-matrix adhesion(GO:0061302) |
| 0.2 | 0.7 | GO:0046440 | L-lysine catabolic process to acetyl-CoA(GO:0019474) L-lysine catabolic process(GO:0019477) L-lysine metabolic process(GO:0046440) |
| 0.2 | 1.2 | GO:0060356 | leucine import(GO:0060356) |
| 0.2 | 1.0 | GO:1902896 | terminal web assembly(GO:1902896) |
| 0.2 | 1.6 | GO:2000270 | negative regulation of fibroblast apoptotic process(GO:2000270) |
| 0.2 | 0.5 | GO:0061394 | regulation of transcription from RNA polymerase II promoter in response to arsenic-containing substance(GO:0061394) |
| 0.1 | 1.6 | GO:0015865 | purine nucleotide transport(GO:0015865) purine ribonucleotide transport(GO:0015868) |
| 0.1 | 0.9 | GO:0010724 | regulation of definitive erythrocyte differentiation(GO:0010724) |
| 0.1 | 2.6 | GO:0035413 | positive regulation of catenin import into nucleus(GO:0035413) |
| 0.1 | 3.8 | GO:0045662 | negative regulation of myoblast differentiation(GO:0045662) |
| 0.1 | 0.8 | GO:0070417 | cellular response to cold(GO:0070417) nucleotide-binding oligomerization domain containing 1 signaling pathway(GO:0070427) |
| 0.1 | 0.3 | GO:0035993 | subthalamic nucleus development(GO:0021763) deltoid tuberosity development(GO:0035993) prolactin secreting cell differentiation(GO:0060127) left lung morphogenesis(GO:0060460) pulmonary vein morphogenesis(GO:0060577) superior vena cava morphogenesis(GO:0060578) |
| 0.1 | 0.4 | GO:0086097 | phospholipase C-activating angiotensin-activated signaling pathway(GO:0086097) |
| 0.1 | 0.4 | GO:1903566 | positive regulation of protein localization to cilium(GO:1903566) |
| 0.1 | 1.2 | GO:0017187 | peptidyl-glutamic acid carboxylation(GO:0017187) protein carboxylation(GO:0018214) |
| 0.1 | 0.3 | GO:0010585 | glutamine secretion(GO:0010585) L-glutamine import(GO:0036229) L-glutamine import into cell(GO:1903803) |
| 0.1 | 0.5 | GO:0033353 | S-adenosylmethionine cycle(GO:0033353) |
| 0.1 | 0.3 | GO:0046498 | S-adenosylhomocysteine metabolic process(GO:0046498) |
| 0.1 | 0.4 | GO:0000707 | meiotic DNA recombinase assembly(GO:0000707) |
| 0.1 | 1.2 | GO:0008356 | asymmetric cell division(GO:0008356) |
| 0.1 | 0.3 | GO:2000973 | midbrain morphogenesis(GO:1904693) regulation of pro-B cell differentiation(GO:2000973) |
| 0.1 | 0.4 | GO:2000643 | positive regulation of early endosome to late endosome transport(GO:2000643) |
| 0.1 | 1.3 | GO:0035338 | long-chain fatty-acyl-CoA biosynthetic process(GO:0035338) |
| 0.1 | 1.1 | GO:0006957 | complement activation, alternative pathway(GO:0006957) |
| 0.0 | 0.5 | GO:0014809 | regulation of skeletal muscle contraction by regulation of release of sequestered calcium ion(GO:0014809) |
| 0.0 | 0.5 | GO:2001224 | positive regulation of neuron migration(GO:2001224) |
| 0.0 | 0.1 | GO:0033159 | negative regulation of protein import into nucleus, translocation(GO:0033159) |
| 0.0 | 0.1 | GO:0019605 | benzoate metabolic process(GO:0018874) butyrate metabolic process(GO:0019605) |
| 0.0 | 0.2 | GO:0043353 | enucleate erythrocyte differentiation(GO:0043353) |
| 0.0 | 2.3 | GO:0035914 | skeletal muscle cell differentiation(GO:0035914) |
| 0.0 | 1.7 | GO:0031648 | protein destabilization(GO:0031648) |
| 0.0 | 0.9 | GO:0031954 | positive regulation of protein autophosphorylation(GO:0031954) |
| 0.0 | 0.8 | GO:1904380 | endoplasmic reticulum mannose trimming(GO:1904380) |
| 0.0 | 0.5 | GO:0009950 | dorsal/ventral axis specification(GO:0009950) |
| 0.0 | 1.0 | GO:0007339 | binding of sperm to zona pellucida(GO:0007339) |
| 0.0 | 0.7 | GO:0016577 | histone demethylation(GO:0016577) |
| 0.0 | 0.3 | GO:0045792 | negative regulation of cell size(GO:0045792) |
| 0.0 | 0.1 | GO:1990034 | calcium ion export from cell(GO:1990034) |
| 0.0 | 0.9 | GO:0030212 | hyaluronan metabolic process(GO:0030212) |
| 0.0 | 0.0 | GO:0045900 | negative regulation of translational elongation(GO:0045900) |
| 0.0 | 0.0 | GO:0090118 | receptor-mediated endocytosis of low-density lipoprotein particle involved in cholesterol transport(GO:0090118) positive regulation of lysosomal protein catabolic process(GO:1905167) |