Project
ENCODE cell lines, expression (Ernst 2011)
Navigation
Downloads
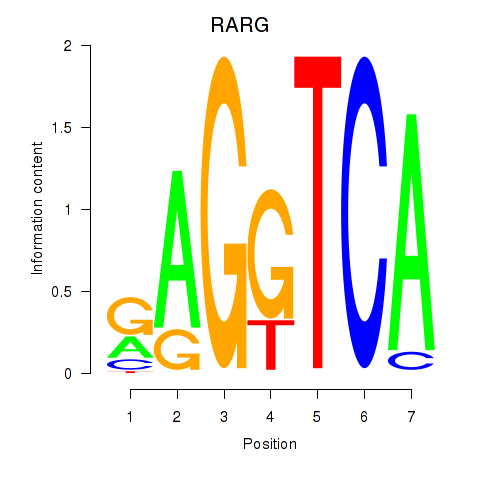
Results for RARG
Z-value: 1.79
Motif logo
Transcription factors associated with RARG
| Gene Symbol | Gene ID | Gene Info |
|---|---|---|
|
RARG
|
ENSG00000172819.12 | RARG |
Activity-expression correlation:
| Gene | Promoter | Pearson corr. coef. | P-value | Plot |
|---|---|---|---|---|
| RARG | hg19_v2_chr12_-_53625958_53626036 | 0.21 | 4.3e-01 | Click! |
Activity profile of RARG motif
Sorted Z-values of RARG motif
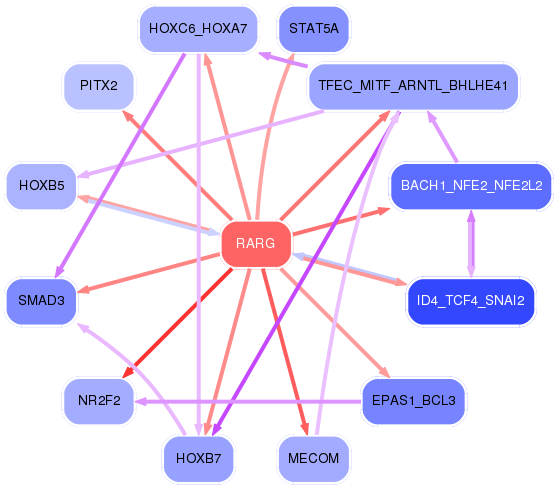
Network of associatons between targets according to the STRING database.

First level regulatory network of RARG
| Promoter | Score | Transcript | Gene | Gene Info |
|---|---|---|---|---|
| chr1_-_156647189 | 4.28 |
ENST00000368223.3 |
NES |
nestin |
| chr15_+_33010175 | 4.21 |
ENST00000300177.4 ENST00000560677.1 ENST00000560830.1 |
GREM1 |
gremlin 1, DAN family BMP antagonist |
| chr7_-_107642348 | 3.72 |
ENST00000393561.1 |
LAMB1 |
laminin, beta 1 |
| chr11_+_117073850 | 3.62 |
ENST00000529622.1 |
TAGLN |
transgelin |
| chr8_-_108510224 | 3.42 |
ENST00000517746.1 ENST00000297450.3 |
ANGPT1 |
angiopoietin 1 |
| chr9_-_130637244 | 3.33 |
ENST00000373156.1 |
AK1 |
adenylate kinase 1 |
| chr12_-_91576429 | 3.26 |
ENST00000552145.1 ENST00000546745.1 |
DCN |
decorin |
| chr11_-_111784005 | 2.71 |
ENST00000527899.1 |
CRYAB |
crystallin, alpha B |
| chr1_+_196621002 | 2.66 |
ENST00000367429.4 ENST00000439155.2 |
CFH |
complement factor H |
| chr8_+_70404996 | 2.66 |
ENST00000402687.4 ENST00000419716.3 |
SULF1 |
sulfatase 1 |
| chr2_-_190044480 | 2.45 |
ENST00000374866.3 |
COL5A2 |
collagen, type V, alpha 2 |
| chr8_-_18666360 | 2.39 |
ENST00000286485.8 |
PSD3 |
pleckstrin and Sec7 domain containing 3 |
| chr7_-_16685422 | 2.30 |
ENST00000306999.2 |
ANKMY2 |
ankyrin repeat and MYND domain containing 2 |
| chr11_+_66624527 | 2.30 |
ENST00000393952.3 |
LRFN4 |
leucine rich repeat and fibronectin type III domain containing 4 |
| chr1_+_196621156 | 2.28 |
ENST00000359637.2 |
CFH |
complement factor H |
| chr13_+_102142296 | 2.27 |
ENST00000376162.3 |
ITGBL1 |
integrin, beta-like 1 (with EGF-like repeat domains) |
| chr2_+_69240415 | 2.23 |
ENST00000409829.3 |
ANTXR1 |
anthrax toxin receptor 1 |
| chr11_-_111783595 | 2.22 |
ENST00000528628.1 |
CRYAB |
crystallin, alpha B |
| chr11_+_114166536 | 2.19 |
ENST00000299964.3 |
NNMT |
nicotinamide N-methyltransferase |
| chrX_+_135230712 | 2.18 |
ENST00000535737.1 |
FHL1 |
four and a half LIM domains 1 |
| chr11_+_46402297 | 2.17 |
ENST00000405308.2 |
MDK |
midkine (neurite growth-promoting factor 2) |
| chr9_-_35691017 | 2.17 |
ENST00000378292.3 |
TPM2 |
tropomyosin 2 (beta) |
| chr6_+_143999072 | 2.13 |
ENST00000440869.2 ENST00000367582.3 ENST00000451827.2 |
PHACTR2 |
phosphatase and actin regulator 2 |
| chr11_-_5271122 | 2.07 |
ENST00000330597.3 |
HBG1 |
hemoglobin, gamma A |
| chr15_+_96876340 | 2.05 |
ENST00000453270.2 |
NR2F2 |
nuclear receptor subfamily 2, group F, member 2 |
| chr19_-_46974741 | 2.03 |
ENST00000313683.10 ENST00000602246.1 |
PNMAL1 |
paraneoplastic Ma antigen family-like 1 |
| chr19_-_46974664 | 2.02 |
ENST00000438932.2 |
PNMAL1 |
paraneoplastic Ma antigen family-like 1 |
| chr13_-_110959478 | 2.00 |
ENST00000543140.1 ENST00000375820.4 |
COL4A1 |
collagen, type IV, alpha 1 |
| chr12_+_13349650 | 1.98 |
ENST00000256951.5 ENST00000431267.2 ENST00000542474.1 ENST00000544053.1 |
EMP1 |
epithelial membrane protein 1 |
| chr12_+_93963590 | 1.98 |
ENST00000340600.2 |
SOCS2 |
suppressor of cytokine signaling 2 |
| chr1_-_103574024 | 1.98 |
ENST00000512756.1 ENST00000370096.3 ENST00000358392.2 ENST00000353414.4 |
COL11A1 |
collagen, type XI, alpha 1 |
| chr2_+_69240302 | 1.97 |
ENST00000303714.4 |
ANTXR1 |
anthrax toxin receptor 1 |
| chr19_-_11308190 | 1.95 |
ENST00000586659.1 ENST00000592903.1 ENST00000589359.1 ENST00000588724.1 ENST00000432929.2 |
KANK2 |
KN motif and ankyrin repeat domains 2 |
| chr15_+_96875657 | 1.95 |
ENST00000559679.1 ENST00000394171.2 |
NR2F2 |
nuclear receptor subfamily 2, group F, member 2 |
| chr15_+_39873268 | 1.91 |
ENST00000397591.2 ENST00000260356.5 |
THBS1 |
thrombospondin 1 |
| chr9_+_139873264 | 1.89 |
ENST00000446677.1 |
PTGDS |
prostaglandin D2 synthase 21kDa (brain) |
| chr1_-_203144941 | 1.88 |
ENST00000255416.4 |
MYBPH |
myosin binding protein H |
| chr12_-_21810726 | 1.86 |
ENST00000396076.1 |
LDHB |
lactate dehydrogenase B |
| chr11_-_35547572 | 1.82 |
ENST00000378880.2 |
PAMR1 |
peptidase domain containing associated with muscle regeneration 1 |
| chr10_+_17271266 | 1.81 |
ENST00000224237.5 |
VIM |
vimentin |
| chr10_-_62761188 | 1.80 |
ENST00000357917.4 |
RHOBTB1 |
Rho-related BTB domain containing 1 |
| chr10_+_17272608 | 1.79 |
ENST00000421459.2 |
VIM |
vimentin |
| chrX_-_151938171 | 1.78 |
ENST00000393902.3 ENST00000417212.1 ENST00000370278.3 |
MAGEA3 |
melanoma antigen family A, 3 |
| chr1_-_144994909 | 1.77 |
ENST00000369347.4 ENST00000369354.3 |
PDE4DIP |
phosphodiesterase 4D interacting protein |
| chr3_+_45067659 | 1.76 |
ENST00000296130.4 |
CLEC3B |
C-type lectin domain family 3, member B |
| chr11_+_46402744 | 1.76 |
ENST00000533952.1 |
MDK |
midkine (neurite growth-promoting factor 2) |
| chr11_-_111783919 | 1.75 |
ENST00000531198.1 ENST00000533879.1 |
CRYAB |
crystallin, alpha B |
| chr7_+_116165754 | 1.75 |
ENST00000405348.1 |
CAV1 |
caveolin 1, caveolae protein, 22kDa |
| chr8_-_93115445 | 1.72 |
ENST00000523629.1 |
RUNX1T1 |
runt-related transcription factor 1; translocated to, 1 (cyclin D-related) |
| chr10_-_33625154 | 1.72 |
ENST00000265371.4 |
NRP1 |
neuropilin 1 |
| chr2_+_69240511 | 1.71 |
ENST00000409349.3 |
ANTXR1 |
anthrax toxin receptor 1 |
| chr9_+_36036430 | 1.71 |
ENST00000377966.3 |
RECK |
reversion-inducing-cysteine-rich protein with kazal motifs |
| chr8_-_23261589 | 1.71 |
ENST00000524168.1 ENST00000523833.2 ENST00000519243.1 ENST00000389131.3 |
LOXL2 |
lysyl oxidase-like 2 |
| chr1_+_165600436 | 1.67 |
ENST00000367888.4 ENST00000367885.1 ENST00000367884.2 |
MGST3 |
microsomal glutathione S-transferase 3 |
| chr7_+_128399002 | 1.66 |
ENST00000493278.1 |
CALU |
calumenin |
| chr12_-_91576561 | 1.66 |
ENST00000547568.2 ENST00000552962.1 |
DCN |
decorin |
| chr11_+_46402583 | 1.62 |
ENST00000359803.3 |
MDK |
midkine (neurite growth-promoting factor 2) |
| chr6_-_2971429 | 1.62 |
ENST00000380529.1 |
SERPINB6 |
serpin peptidase inhibitor, clade B (ovalbumin), member 6 |
| chr7_-_131241361 | 1.62 |
ENST00000378555.3 ENST00000322985.9 ENST00000541194.1 ENST00000537928.1 |
PODXL |
podocalyxin-like |
| chr22_-_36236623 | 1.61 |
ENST00000405409.2 |
RBFOX2 |
RNA binding protein, fox-1 homolog (C. elegans) 2 |
| chr2_-_238322800 | 1.59 |
ENST00000392004.3 ENST00000433762.1 ENST00000347401.3 ENST00000353578.4 ENST00000346358.4 ENST00000392003.2 |
COL6A3 |
collagen, type VI, alpha 3 |
| chr2_-_238322770 | 1.57 |
ENST00000472056.1 |
COL6A3 |
collagen, type VI, alpha 3 |
| chr2_-_158732340 | 1.57 |
ENST00000539637.1 ENST00000413751.1 ENST00000434821.1 ENST00000424669.1 |
ACVR1 |
activin A receptor, type I |
| chr5_+_34656331 | 1.55 |
ENST00000265109.3 |
RAI14 |
retinoic acid induced 14 |
| chr12_+_119616447 | 1.55 |
ENST00000281938.2 |
HSPB8 |
heat shock 22kDa protein 8 |
| chr1_-_17380630 | 1.55 |
ENST00000375499.3 |
SDHB |
succinate dehydrogenase complex, subunit B, iron sulfur (Ip) |
| chr11_-_64013663 | 1.55 |
ENST00000392210.2 |
PPP1R14B |
protein phosphatase 1, regulatory (inhibitor) subunit 14B |
| chr7_+_79764104 | 1.53 |
ENST00000351004.3 |
GNAI1 |
guanine nucleotide binding protein (G protein), alpha inhibiting activity polypeptide 1 |
| chr14_-_105420241 | 1.52 |
ENST00000557457.1 |
AHNAK2 |
AHNAK nucleoprotein 2 |
| chr3_+_159557637 | 1.50 |
ENST00000445224.2 |
SCHIP1 |
schwannomin interacting protein 1 |
| chr14_-_21492251 | 1.50 |
ENST00000554398.1 |
NDRG2 |
NDRG family member 2 |
| chr10_-_44070016 | 1.50 |
ENST00000374446.2 ENST00000426961.1 ENST00000535642.1 |
ZNF239 |
zinc finger protein 239 |
| chr19_-_43702231 | 1.50 |
ENST00000597374.1 ENST00000599371.1 |
PSG4 |
pregnancy specific beta-1-glycoprotein 4 |
| chr3_-_168865522 | 1.49 |
ENST00000464456.1 |
MECOM |
MDS1 and EVI1 complex locus |
| chr1_-_79472365 | 1.48 |
ENST00000370742.3 |
ELTD1 |
EGF, latrophilin and seven transmembrane domain containing 1 |
| chr12_-_91573132 | 1.47 |
ENST00000550563.1 ENST00000546370.1 |
DCN |
decorin |
| chr12_-_91576750 | 1.47 |
ENST00000228329.5 ENST00000303320.3 ENST00000052754.5 |
DCN |
decorin |
| chr1_+_150480576 | 1.44 |
ENST00000346569.6 |
ECM1 |
extracellular matrix protein 1 |
| chr12_-_56106060 | 1.43 |
ENST00000452168.2 |
ITGA7 |
integrin, alpha 7 |
| chr14_-_21492113 | 1.39 |
ENST00000554094.1 |
NDRG2 |
NDRG family member 2 |
| chr12_-_91573249 | 1.38 |
ENST00000550099.1 ENST00000546391.1 ENST00000551354.1 |
DCN |
decorin |
| chr11_+_46402482 | 1.37 |
ENST00000441869.1 |
MDK |
midkine (neurite growth-promoting factor 2) |
| chr8_+_98900132 | 1.37 |
ENST00000520016.1 |
MATN2 |
matrilin 2 |
| chr2_-_86790593 | 1.36 |
ENST00000263856.4 ENST00000409225.2 |
CHMP3 |
charged multivesicular body protein 3 |
| chrX_+_99899180 | 1.35 |
ENST00000373004.3 |
SRPX2 |
sushi-repeat containing protein, X-linked 2 |
| chr3_-_46000064 | 1.33 |
ENST00000433878.1 |
FYCO1 |
FYVE and coiled-coil domain containing 1 |
| chr14_+_61447927 | 1.32 |
ENST00000451406.1 |
SLC38A6 |
solute carrier family 38, member 6 |
| chr11_-_35547151 | 1.31 |
ENST00000378878.3 ENST00000529303.1 ENST00000278360.3 |
PAMR1 |
peptidase domain containing associated with muscle regeneration 1 |
| chr22_+_29702996 | 1.31 |
ENST00000406549.3 ENST00000360113.2 ENST00000341313.6 ENST00000403764.1 ENST00000471961.1 ENST00000407854.1 |
GAS2L1 |
growth arrest-specific 2 like 1 |
| chr2_-_192711968 | 1.31 |
ENST00000304141.4 |
SDPR |
serum deprivation response |
| chr9_-_35685452 | 1.30 |
ENST00000607559.1 |
TPM2 |
tropomyosin 2 (beta) |
| chr19_+_45394477 | 1.26 |
ENST00000252487.5 ENST00000405636.2 ENST00000592434.1 ENST00000426677.2 ENST00000589649.1 |
TOMM40 |
translocase of outer mitochondrial membrane 40 homolog (yeast) |
| chr1_-_17304771 | 1.26 |
ENST00000375534.3 |
MFAP2 |
microfibrillar-associated protein 2 |
| chr1_+_163039143 | 1.25 |
ENST00000531057.1 ENST00000527809.1 ENST00000367908.4 |
RGS4 |
regulator of G-protein signaling 4 |
| chr12_-_54689532 | 1.24 |
ENST00000540264.2 ENST00000312156.4 |
NFE2 |
nuclear factor, erythroid 2 |
| chr1_-_154946825 | 1.23 |
ENST00000368453.4 ENST00000368450.1 ENST00000366442.2 |
SHC1 |
SHC (Src homology 2 domain containing) transforming protein 1 |
| chr9_+_139874683 | 1.23 |
ENST00000444903.1 |
PTGDS |
prostaglandin D2 synthase 21kDa (brain) |
| chrX_+_64887512 | 1.23 |
ENST00000360270.5 |
MSN |
moesin |
| chr10_+_54074033 | 1.22 |
ENST00000373970.3 |
DKK1 |
dickkopf WNT signaling pathway inhibitor 1 |
| chr1_+_223889285 | 1.21 |
ENST00000433674.2 |
CAPN2 |
calpain 2, (m/II) large subunit |
| chr19_-_43690674 | 1.20 |
ENST00000342951.6 ENST00000366175.3 |
PSG5 |
pregnancy specific beta-1-glycoprotein 5 |
| chr18_-_21891460 | 1.20 |
ENST00000357041.4 |
OSBPL1A |
oxysterol binding protein-like 1A |
| chr3_+_69985734 | 1.19 |
ENST00000314557.6 ENST00000394351.3 |
MITF |
microphthalmia-associated transcription factor |
| chr14_+_61447832 | 1.16 |
ENST00000354886.2 ENST00000267488.4 |
SLC38A6 |
solute carrier family 38, member 6 |
| chr1_-_85156216 | 1.16 |
ENST00000342203.3 ENST00000370612.4 |
SSX2IP |
synovial sarcoma, X breakpoint 2 interacting protein |
| chr4_-_111119804 | 1.16 |
ENST00000394607.3 ENST00000302274.3 |
ELOVL6 |
ELOVL fatty acid elongase 6 |
| chr22_-_36220420 | 1.16 |
ENST00000473487.2 |
RBFOX2 |
RNA binding protein, fox-1 homolog (C. elegans) 2 |
| chr1_-_144994840 | 1.16 |
ENST00000369351.3 ENST00000369349.3 |
PDE4DIP |
phosphodiesterase 4D interacting protein |
| chrX_+_117861535 | 1.15 |
ENST00000371666.3 ENST00000371642.1 |
IL13RA1 |
interleukin 13 receptor, alpha 1 |
| chr1_+_160097462 | 1.15 |
ENST00000447527.1 |
ATP1A2 |
ATPase, Na+/K+ transporting, alpha 2 polypeptide |
| chr1_-_159894319 | 1.14 |
ENST00000320307.4 |
TAGLN2 |
transgelin 2 |
| chr2_-_161350305 | 1.13 |
ENST00000348849.3 |
RBMS1 |
RNA binding motif, single stranded interacting protein 1 |
| chr20_+_53092123 | 1.13 |
ENST00000262593.5 |
DOK5 |
docking protein 5 |
| chr17_+_1665253 | 1.12 |
ENST00000254722.4 |
SERPINF1 |
serpin peptidase inhibitor, clade F (alpha-2 antiplasmin, pigment epithelium derived factor), member 1 |
| chr4_-_16900217 | 1.11 |
ENST00000441778.2 |
LDB2 |
LIM domain binding 2 |
| chr16_+_222846 | 1.08 |
ENST00000251595.6 ENST00000397806.1 |
HBA2 |
hemoglobin, alpha 2 |
| chr19_-_43690642 | 1.08 |
ENST00000407356.1 ENST00000407568.1 ENST00000404580.1 ENST00000599812.1 |
PSG5 |
pregnancy specific beta-1-glycoprotein 5 |
| chr4_+_169842707 | 1.08 |
ENST00000503290.1 |
PALLD |
palladin, cytoskeletal associated protein |
| chrX_+_52780318 | 1.07 |
ENST00000375515.3 ENST00000276049.6 |
SSX2B |
synovial sarcoma, X breakpoint 2B |
| chr4_-_16900410 | 1.07 |
ENST00000304523.5 |
LDB2 |
LIM domain binding 2 |
| chr4_-_16900184 | 1.07 |
ENST00000515064.1 |
LDB2 |
LIM domain binding 2 |
| chr4_-_111563076 | 1.07 |
ENST00000354925.2 ENST00000511990.1 |
PITX2 |
paired-like homeodomain 2 |
| chr4_-_16900242 | 1.07 |
ENST00000502640.1 ENST00000506732.1 |
LDB2 |
LIM domain binding 2 |
| chr10_+_75757863 | 1.06 |
ENST00000372755.3 ENST00000211998.4 ENST00000417648.2 |
VCL |
vinculin |
| chr2_-_211179883 | 1.06 |
ENST00000352451.3 |
MYL1 |
myosin, light chain 1, alkali; skeletal, fast |
| chr17_+_60704762 | 1.06 |
ENST00000303375.5 |
MRC2 |
mannose receptor, C type 2 |
| chr12_-_6665200 | 1.06 |
ENST00000336604.4 ENST00000396840.2 ENST00000356896.4 |
IFFO1 |
intermediate filament family orphan 1 |
| chr2_+_10560147 | 1.06 |
ENST00000422133.1 |
HPCAL1 |
hippocalcin-like 1 |
| chr21_+_42539701 | 1.06 |
ENST00000330333.6 ENST00000328735.6 ENST00000347667.5 |
BACE2 |
beta-site APP-cleaving enzyme 2 |
| chr12_+_6494285 | 1.06 |
ENST00000541102.1 |
LTBR |
lymphotoxin beta receptor (TNFR superfamily, member 3) |
| chrX_-_21776281 | 1.05 |
ENST00000379494.3 |
SMPX |
small muscle protein, X-linked |
| chr9_+_120466650 | 1.05 |
ENST00000355622.6 |
TLR4 |
toll-like receptor 4 |
| chr3_+_183894566 | 1.04 |
ENST00000439647.1 |
AP2M1 |
adaptor-related protein complex 2, mu 1 subunit |
| chr5_+_170288856 | 1.04 |
ENST00000523189.1 |
RANBP17 |
RAN binding protein 17 |
| chr11_-_407103 | 1.04 |
ENST00000526395.1 |
SIGIRR |
single immunoglobulin and toll-interleukin 1 receptor (TIR) domain |
| chrX_-_48931648 | 1.03 |
ENST00000376386.3 ENST00000376390.4 |
PRAF2 |
PRA1 domain family, member 2 |
| chr4_+_20255123 | 1.02 |
ENST00000504154.1 ENST00000273739.5 |
SLIT2 |
slit homolog 2 (Drosophila) |
| chrX_+_48114752 | 1.01 |
ENST00000376919.3 |
SSX1 |
synovial sarcoma, X breakpoint 1 |
| chr6_-_112575912 | 1.01 |
ENST00000522006.1 ENST00000230538.7 ENST00000519932.1 |
LAMA4 |
laminin, alpha 4 |
| chr4_-_7941596 | 1.01 |
ENST00000420658.1 ENST00000358461.2 |
AFAP1 |
actin filament associated protein 1 |
| chr17_-_53809473 | 1.00 |
ENST00000575734.1 |
TMEM100 |
transmembrane protein 100 |
| chr2_+_109237717 | 1.00 |
ENST00000409441.1 |
LIMS1 |
LIM and senescent cell antigen-like domains 1 |
| chr11_-_86666427 | 0.99 |
ENST00000531380.1 |
FZD4 |
frizzled family receptor 4 |
| chr2_+_223916862 | 0.98 |
ENST00000604125.1 |
KCNE4 |
potassium voltage-gated channel, Isk-related family, member 4 |
| chr3_-_38691119 | 0.98 |
ENST00000333535.4 ENST00000413689.1 ENST00000443581.1 ENST00000425664.1 ENST00000451551.2 |
SCN5A |
sodium channel, voltage-gated, type V, alpha subunit |
| chr17_+_1665345 | 0.98 |
ENST00000576406.1 ENST00000571149.1 |
SERPINF1 |
serpin peptidase inhibitor, clade F (alpha-2 antiplasmin, pigment epithelium derived factor), member 1 |
| chr11_-_75017734 | 0.97 |
ENST00000532525.1 |
ARRB1 |
arrestin, beta 1 |
| chr9_+_120466610 | 0.97 |
ENST00000394487.4 |
TLR4 |
toll-like receptor 4 |
| chr15_+_67430339 | 0.96 |
ENST00000439724.3 |
SMAD3 |
SMAD family member 3 |
| chr13_+_42031679 | 0.96 |
ENST00000379359.3 |
RGCC |
regulator of cell cycle |
| chrX_-_135849484 | 0.96 |
ENST00000370620.1 ENST00000535227.1 |
ARHGEF6 |
Rac/Cdc42 guanine nucleotide exchange factor (GEF) 6 |
| chrX_+_70521584 | 0.95 |
ENST00000373829.3 ENST00000538820.1 |
ITGB1BP2 |
integrin beta 1 binding protein (melusin) 2 |
| chr12_-_21810765 | 0.95 |
ENST00000450584.1 ENST00000350669.1 |
LDHB |
lactate dehydrogenase B |
| chr19_-_3971050 | 0.94 |
ENST00000545797.2 ENST00000596311.1 |
DAPK3 |
death-associated protein kinase 3 |
| chr9_+_127539481 | 0.94 |
ENST00000373580.3 |
OLFML2A |
olfactomedin-like 2A |
| chr15_+_43809797 | 0.93 |
ENST00000399453.1 ENST00000300231.5 |
MAP1A |
microtubule-associated protein 1A |
| chr4_-_159094194 | 0.93 |
ENST00000592057.1 ENST00000585682.1 ENST00000393807.5 |
FAM198B |
family with sequence similarity 198, member B |
| chr11_+_111783450 | 0.93 |
ENST00000537382.1 |
HSPB2 |
Homo sapiens heat shock 27kDa protein 2 (HSPB2), mRNA. |
| chr7_+_79765071 | 0.91 |
ENST00000457358.2 |
GNAI1 |
guanine nucleotide binding protein (G protein), alpha inhibiting activity polypeptide 1 |
| chr4_+_126237554 | 0.91 |
ENST00000394329.3 |
FAT4 |
FAT atypical cadherin 4 |
| chr9_-_130966497 | 0.90 |
ENST00000393608.1 ENST00000372948.3 |
CIZ1 |
CDKN1A interacting zinc finger protein 1 |
| chr20_+_43343886 | 0.90 |
ENST00000190983.4 |
WISP2 |
WNT1 inducible signaling pathway protein 2 |
| chr14_-_103987679 | 0.90 |
ENST00000553610.1 |
CKB |
creatine kinase, brain |
| chrX_-_48216101 | 0.90 |
ENST00000298396.2 ENST00000376893.3 |
SSX3 |
synovial sarcoma, X breakpoint 3 |
| chr1_-_201476274 | 0.90 |
ENST00000340006.2 |
CSRP1 |
cysteine and glycine-rich protein 1 |
| chr8_-_13372395 | 0.89 |
ENST00000276297.4 ENST00000511869.1 |
DLC1 |
deleted in liver cancer 1 |
| chr3_+_46448648 | 0.89 |
ENST00000399036.3 |
CCRL2 |
chemokine (C-C motif) receptor-like 2 |
| chr7_-_151433342 | 0.89 |
ENST00000433631.2 |
PRKAG2 |
protein kinase, AMP-activated, gamma 2 non-catalytic subunit |
| chr5_-_146781153 | 0.88 |
ENST00000520473.1 |
DPYSL3 |
dihydropyrimidinase-like 3 |
| chr17_-_46688334 | 0.88 |
ENST00000239165.7 |
HOXB7 |
homeobox B7 |
| chr4_-_7873981 | 0.88 |
ENST00000360265.4 |
AFAP1 |
actin filament associated protein 1 |
| chr6_-_42016385 | 0.87 |
ENST00000502771.1 ENST00000508143.1 ENST00000514588.1 ENST00000510503.1 ENST00000415497.2 ENST00000372988.4 |
CCND3 |
cyclin D3 |
| chr7_-_151433393 | 0.87 |
ENST00000492843.1 |
PRKAG2 |
protein kinase, AMP-activated, gamma 2 non-catalytic subunit |
| chr12_-_54694758 | 0.87 |
ENST00000553070.1 |
NFE2 |
nuclear factor, erythroid 2 |
| chr12_+_102091400 | 0.87 |
ENST00000229266.3 ENST00000549872.1 |
CHPT1 |
choline phosphotransferase 1 |
| chr12_-_6451186 | 0.86 |
ENST00000540022.1 ENST00000536194.1 |
TNFRSF1A |
tumor necrosis factor receptor superfamily, member 1A |
| chr1_-_43855479 | 0.86 |
ENST00000290663.6 ENST00000372457.4 |
MED8 |
mediator complex subunit 8 |
| chr16_-_69760409 | 0.86 |
ENST00000561500.1 ENST00000439109.2 ENST00000564043.1 ENST00000379046.2 ENST00000379047.3 |
NQO1 |
NAD(P)H dehydrogenase, quinone 1 |
| chr11_-_321050 | 0.85 |
ENST00000399808.4 |
IFITM3 |
interferon induced transmembrane protein 3 |
| chr5_+_149569520 | 0.85 |
ENST00000230671.2 ENST00000524041.1 |
SLC6A7 |
solute carrier family 6 (neurotransmitter transporter), member 7 |
| chr1_-_95392635 | 0.85 |
ENST00000538964.1 ENST00000394202.4 ENST00000370206.4 |
CNN3 |
calponin 3, acidic |
| chr11_-_33744487 | 0.84 |
ENST00000426650.2 |
CD59 |
CD59 molecule, complement regulatory protein |
| chr3_-_138312971 | 0.84 |
ENST00000485115.1 ENST00000484888.1 ENST00000468900.1 ENST00000542237.1 ENST00000481834.1 |
CEP70 |
centrosomal protein 70kDa |
| chrX_+_152760397 | 0.83 |
ENST00000331595.4 ENST00000431891.1 |
BGN |
biglycan |
| chr11_-_64014379 | 0.83 |
ENST00000309318.3 |
PPP1R14B |
protein phosphatase 1, regulatory (inhibitor) subunit 14B |
| chr1_+_19923454 | 0.83 |
ENST00000602662.1 ENST00000602293.1 ENST00000322753.6 |
MINOS1-NBL1 MINOS1 |
MINOS1-NBL1 readthrough mitochondrial inner membrane organizing system 1 |
| chr1_-_43855444 | 0.82 |
ENST00000372455.4 |
MED8 |
mediator complex subunit 8 |
| chr6_-_112575687 | 0.82 |
ENST00000521398.1 ENST00000424408.2 ENST00000243219.3 |
LAMA4 |
laminin, alpha 4 |
| chr4_-_186696425 | 0.82 |
ENST00000430503.1 ENST00000319454.6 ENST00000450341.1 |
SORBS2 |
sorbin and SH3 domain containing 2 |
| chr12_-_54694807 | 0.82 |
ENST00000435572.2 |
NFE2 |
nuclear factor, erythroid 2 |
| chr3_-_52486841 | 0.82 |
ENST00000496590.1 |
TNNC1 |
troponin C type 1 (slow) |
| chr11_+_20044600 | 0.81 |
ENST00000311043.8 |
NAV2 |
neuron navigator 2 |
| chr2_+_170366203 | 0.81 |
ENST00000284669.1 |
KLHL41 |
kelch-like family member 41 |
| chr6_+_129204337 | 0.81 |
ENST00000421865.2 |
LAMA2 |
laminin, alpha 2 |
| chr1_-_203151933 | 0.80 |
ENST00000404436.2 |
CHI3L1 |
chitinase 3-like 1 (cartilage glycoprotein-39) |
| chr22_+_31518938 | 0.80 |
ENST00000412985.1 ENST00000331075.5 ENST00000412277.2 ENST00000420017.1 ENST00000400294.2 ENST00000405300.1 ENST00000404390.3 |
INPP5J |
inositol polyphosphate-5-phosphatase J |
| chr7_+_112063192 | 0.79 |
ENST00000005558.4 |
IFRD1 |
interferon-related developmental regulator 1 |
| chr6_+_39760129 | 0.79 |
ENST00000274867.4 |
DAAM2 |
dishevelled associated activator of morphogenesis 2 |
| chr13_+_48807288 | 0.78 |
ENST00000378565.5 |
ITM2B |
integral membrane protein 2B |
| chr2_+_192141611 | 0.78 |
ENST00000392316.1 |
MYO1B |
myosin IB |
Gene Ontology Analysis
Gene overrepresentation in biological_process category:
| Log-likelihood per target | Total log-likelihood | Term | Description |
|---|---|---|---|
| 2.0 | 5.9 | GO:1901202 | negative regulation of extracellular matrix assembly(GO:1901202) |
| 1.4 | 4.2 | GO:1900158 | negative regulation of osteoclast proliferation(GO:0090291) negative regulation of bone mineralization involved in bone maturation(GO:1900158) |
| 1.2 | 6.9 | GO:0030421 | defecation(GO:0030421) |
| 1.0 | 2.0 | GO:0070428 | regulation of nucleotide-binding oligomerization domain containing 1 signaling pathway(GO:0070428) |
| 1.0 | 4.0 | GO:0009956 | radial pattern formation(GO:0009956) |
| 0.9 | 3.7 | GO:0021812 | neuronal-glial interaction involved in cerebral cortex radial glia guided migration(GO:0021812) |
| 0.9 | 3.7 | GO:1903224 | regulation of endodermal cell differentiation(GO:1903224) |
| 0.7 | 3.0 | GO:0061304 | retinal blood vessel morphogenesis(GO:0061304) |
| 0.7 | 8.8 | GO:1900747 | negative regulation of vascular endothelial growth factor signaling pathway(GO:1900747) |
| 0.7 | 2.0 | GO:0070563 | negative regulation of vitamin D receptor signaling pathway(GO:0070563) |
| 0.6 | 1.9 | GO:0002605 | negative regulation of dendritic cell antigen processing and presentation(GO:0002605) negative regulation of endothelial cell chemotaxis(GO:2001027) |
| 0.6 | 1.7 | GO:1903609 | negative regulation of peptidyl-tyrosine autophosphorylation(GO:1900085) negative regulation of inward rectifier potassium channel activity(GO:1903609) |
| 0.6 | 1.7 | GO:0039689 | negative stranded viral RNA replication(GO:0039689) multi-organism biosynthetic process(GO:0044034) |
| 0.5 | 1.6 | GO:0033634 | positive regulation of cell-cell adhesion mediated by integrin(GO:0033634) |
| 0.5 | 3.7 | GO:0048014 | Tie signaling pathway(GO:0048014) |
| 0.5 | 1.6 | GO:2000017 | positive regulation of determination of dorsal identity(GO:2000017) |
| 0.5 | 0.5 | GO:0030213 | hyaluronan biosynthetic process(GO:0030213) |
| 0.5 | 1.4 | GO:0007518 | myoblast fate determination(GO:0007518) |
| 0.5 | 1.4 | GO:0016185 | synaptic vesicle budding from presynaptic endocytic zone membrane(GO:0016185) |
| 0.5 | 2.8 | GO:0010724 | regulation of definitive erythrocyte differentiation(GO:0010724) |
| 0.4 | 2.7 | GO:0060686 | negative regulation of prostatic bud formation(GO:0060686) |
| 0.4 | 1.3 | GO:1902623 | negative regulation of granulocyte chemotaxis(GO:0071623) negative regulation of neutrophil chemotaxis(GO:0090024) negative regulation of neutrophil migration(GO:1902623) |
| 0.4 | 2.1 | GO:0071279 | cellular response to cobalt ion(GO:0071279) |
| 0.4 | 2.0 | GO:0035989 | tendon development(GO:0035989) |
| 0.4 | 6.6 | GO:0007021 | tubulin complex assembly(GO:0007021) |
| 0.4 | 4.0 | GO:0060020 | Bergmann glial cell differentiation(GO:0060020) |
| 0.4 | 1.1 | GO:0035993 | subthalamic nucleus development(GO:0021763) deltoid tuberosity development(GO:0035993) prolactin secreting cell differentiation(GO:0060127) left lung development(GO:0060459) left lung morphogenesis(GO:0060460) pulmonary vein morphogenesis(GO:0060577) superior vena cava morphogenesis(GO:0060578) |
| 0.3 | 1.7 | GO:1902378 | vestibulocochlear nerve structural organization(GO:0021649) positive regulation of cytokine activity(GO:0060301) ganglion morphogenesis(GO:0061552) endothelial tip cell fate specification(GO:0097102) VEGF-activated neuropilin signaling pathway involved in axon guidance(GO:1902378) dorsal root ganglion morphogenesis(GO:1904835) otic placode development(GO:1905040) |
| 0.3 | 0.7 | GO:0070426 | positive regulation of nucleotide-binding oligomerization domain containing signaling pathway(GO:0070426) positive regulation of nucleotide-binding oligomerization domain containing 2 signaling pathway(GO:0070434) |
| 0.3 | 1.0 | GO:2000048 | negative regulation of cell-cell adhesion mediated by cadherin(GO:2000048) |
| 0.3 | 0.9 | GO:0072137 | condensed mesenchymal cell proliferation(GO:0072137) |
| 0.3 | 0.3 | GO:0003408 | optic cup formation involved in camera-type eye development(GO:0003408) |
| 0.3 | 1.5 | GO:0006041 | glucosamine metabolic process(GO:0006041) |
| 0.3 | 1.5 | GO:0006436 | tryptophanyl-tRNA aminoacylation(GO:0006436) |
| 0.3 | 1.2 | GO:0006663 | platelet activating factor biosynthetic process(GO:0006663) |
| 0.3 | 1.6 | GO:1902766 | skeletal muscle satellite cell migration(GO:1902766) |
| 0.3 | 1.3 | GO:1900920 | regulation of amino acid uptake involved in synaptic transmission(GO:0051941) regulation of glutamate uptake involved in transmission of nerve impulse(GO:0051946) regulation of L-glutamate import(GO:1900920) |
| 0.3 | 0.8 | GO:0097498 | endothelial tube lumen extension(GO:0097498) |
| 0.3 | 1.0 | GO:0048388 | endosomal lumen acidification(GO:0048388) |
| 0.3 | 0.5 | GO:0035377 | transepithelial water transport(GO:0035377) |
| 0.3 | 0.8 | GO:0042264 | peptidyl-aspartic acid hydroxylation(GO:0042264) |
| 0.2 | 3.0 | GO:0006089 | lactate metabolic process(GO:0006089) |
| 0.2 | 1.5 | GO:0051013 | microtubule severing(GO:0051013) |
| 0.2 | 0.5 | GO:1901491 | negative regulation of lymphangiogenesis(GO:1901491) |
| 0.2 | 2.0 | GO:0060665 | regulation of branching involved in salivary gland morphogenesis by mesenchymal-epithelial signaling(GO:0060665) |
| 0.2 | 1.7 | GO:0010756 | positive regulation of plasminogen activation(GO:0010756) |
| 0.2 | 3.6 | GO:0030150 | protein import into mitochondrial matrix(GO:0030150) |
| 0.2 | 1.7 | GO:0070294 | renal sodium ion absorption(GO:0070294) |
| 0.2 | 0.7 | GO:1902463 | protein localization to cell leading edge(GO:1902463) |
| 0.2 | 0.7 | GO:0007227 | signal transduction downstream of smoothened(GO:0007227) |
| 0.2 | 1.1 | GO:0015692 | lead ion transport(GO:0015692) |
| 0.2 | 0.9 | GO:0030644 | cellular chloride ion homeostasis(GO:0030644) |
| 0.2 | 1.3 | GO:0006021 | inositol biosynthetic process(GO:0006021) |
| 0.2 | 2.6 | GO:1904321 | response to forskolin(GO:1904321) cellular response to forskolin(GO:1904322) |
| 0.2 | 0.8 | GO:0001971 | negative regulation of activation of membrane attack complex(GO:0001971) |
| 0.2 | 1.0 | GO:0044856 | plasma membrane raft distribution(GO:0044855) plasma membrane raft localization(GO:0044856) plasma membrane raft polarization(GO:0044858) regulation of plasma membrane raft polarization(GO:1903906) |
| 0.2 | 1.2 | GO:0022614 | membrane to membrane docking(GO:0022614) |
| 0.2 | 0.8 | GO:0032972 | regulation of muscle filament sliding speed(GO:0032972) |
| 0.2 | 0.8 | GO:0021564 | vagus nerve development(GO:0021564) |
| 0.2 | 1.0 | GO:0001315 | age-dependent response to oxidative stress(GO:0001306) age-dependent response to reactive oxygen species(GO:0001315) regulation of systemic arterial blood pressure by acetylcholine(GO:0003068) vasodilation by acetylcholine involved in regulation of systemic arterial blood pressure(GO:0003069) regulation of systemic arterial blood pressure by neurotransmitter(GO:0003070) age-dependent general metabolic decline(GO:0007571) |
| 0.2 | 1.0 | GO:1990034 | calcium ion export from cell(GO:1990034) |
| 0.2 | 1.2 | GO:0034626 | fatty acid elongation, saturated fatty acid(GO:0019367) fatty acid elongation, unsaturated fatty acid(GO:0019368) fatty acid elongation, monounsaturated fatty acid(GO:0034625) fatty acid elongation, polyunsaturated fatty acid(GO:0034626) |
| 0.2 | 1.0 | GO:0061767 | negative regulation of lung blood pressure(GO:0061767) |
| 0.2 | 0.8 | GO:0019276 | UDP-N-acetylgalactosamine metabolic process(GO:0019276) |
| 0.2 | 0.6 | GO:1900075 | regulation of neuromuscular synaptic transmission(GO:1900073) positive regulation of neuromuscular synaptic transmission(GO:1900075) |
| 0.2 | 1.3 | GO:0046604 | positive regulation of mitotic centrosome separation(GO:0046604) |
| 0.2 | 1.3 | GO:0086046 | membrane depolarization during SA node cell action potential(GO:0086046) |
| 0.2 | 0.4 | GO:0030242 | pexophagy(GO:0030242) |
| 0.2 | 1.5 | GO:0042985 | negative regulation of amyloid precursor protein biosynthetic process(GO:0042985) |
| 0.2 | 0.2 | GO:0021539 | subthalamus development(GO:0021539) |
| 0.2 | 2.9 | GO:0090361 | platelet-derived growth factor production(GO:0090360) regulation of platelet-derived growth factor production(GO:0090361) |
| 0.2 | 0.9 | GO:0019323 | pentose catabolic process(GO:0019323) |
| 0.2 | 0.5 | GO:0060535 | trachea cartilage morphogenesis(GO:0060535) |
| 0.2 | 1.4 | GO:0032510 | endosome to lysosome transport via multivesicular body sorting pathway(GO:0032510) |
| 0.2 | 0.5 | GO:0032242 | regulation of nucleoside transport(GO:0032242) negative regulation of neurotrophin production(GO:0032900) |
| 0.2 | 1.0 | GO:1901098 | regulation of autophagosome maturation(GO:1901096) positive regulation of autophagosome maturation(GO:1901098) |
| 0.2 | 0.8 | GO:0035524 | proline transmembrane transport(GO:0035524) |
| 0.2 | 2.9 | GO:0031033 | myosin filament organization(GO:0031033) |
| 0.2 | 1.3 | GO:0090050 | positive regulation of cell migration involved in sprouting angiogenesis(GO:0090050) |
| 0.2 | 0.5 | GO:0003275 | endocardial cushion fusion(GO:0003274) apoptotic process involved in outflow tract morphogenesis(GO:0003275) negative regulation of alkaline phosphatase activity(GO:0010693) positive regulation of catagen(GO:0051795) regulation of apoptotic process involved in outflow tract morphogenesis(GO:1902256) |
| 0.2 | 4.4 | GO:0010669 | epithelial structure maintenance(GO:0010669) |
| 0.2 | 3.6 | GO:1901881 | positive regulation of protein depolymerization(GO:1901881) |
| 0.2 | 2.7 | GO:0019371 | cyclooxygenase pathway(GO:0019371) |
| 0.2 | 1.6 | GO:0001955 | blood vessel maturation(GO:0001955) |
| 0.2 | 3.8 | GO:0006957 | complement activation, alternative pathway(GO:0006957) |
| 0.2 | 1.5 | GO:0034356 | NAD biosynthesis via nicotinamide riboside salvage pathway(GO:0034356) |
| 0.2 | 0.6 | GO:0019046 | release from viral latency(GO:0019046) |
| 0.1 | 0.6 | GO:0071802 | negative regulation of podosome assembly(GO:0071802) |
| 0.1 | 1.0 | GO:0045079 | negative regulation of chemokine biosynthetic process(GO:0045079) |
| 0.1 | 1.0 | GO:0014722 | regulation of skeletal muscle contraction by calcium ion signaling(GO:0014722) |
| 0.1 | 1.3 | GO:0072592 | oxygen metabolic process(GO:0072592) |
| 0.1 | 0.6 | GO:0000255 | allantoin metabolic process(GO:0000255) |
| 0.1 | 0.4 | GO:2000395 | protein targeting to vacuole involved in ubiquitin-dependent protein catabolic process via the multivesicular body sorting pathway(GO:0043328) ubiquitin-dependent endocytosis(GO:0070086) regulation of ubiquitin-dependent endocytosis(GO:2000395) positive regulation of ubiquitin-dependent endocytosis(GO:2000397) |
| 0.1 | 2.1 | GO:0015671 | oxygen transport(GO:0015671) |
| 0.1 | 0.4 | GO:0033159 | negative regulation of protein import into nucleus, translocation(GO:0033159) |
| 0.1 | 0.8 | GO:0003301 | physiological muscle hypertrophy(GO:0003298) physiological cardiac muscle hypertrophy(GO:0003301) cell growth involved in cardiac muscle cell development(GO:0061049) |
| 0.1 | 0.5 | GO:0031291 | Ran protein signal transduction(GO:0031291) |
| 0.1 | 0.5 | GO:1902612 | regulation of anti-Mullerian hormone signaling pathway(GO:1902612) negative regulation of anti-Mullerian hormone signaling pathway(GO:1902613) anti-Mullerian hormone signaling pathway(GO:1990262) |
| 0.1 | 0.3 | GO:0030513 | positive regulation of BMP signaling pathway(GO:0030513) |
| 0.1 | 0.7 | GO:0043129 | surfactant homeostasis(GO:0043129) |
| 0.1 | 0.9 | GO:0046485 | ether lipid metabolic process(GO:0046485) |
| 0.1 | 1.3 | GO:0071550 | death-inducing signaling complex assembly(GO:0071550) positive regulation of sphingolipid biosynthetic process(GO:0090154) positive regulation of ceramide biosynthetic process(GO:2000304) |
| 0.1 | 0.4 | GO:0030327 | prenylated protein catabolic process(GO:0030327) |
| 0.1 | 1.5 | GO:0001778 | plasma membrane repair(GO:0001778) |
| 0.1 | 0.4 | GO:0002317 | plasma cell differentiation(GO:0002317) |
| 0.1 | 0.2 | GO:0097212 | lysosomal membrane organization(GO:0097212) |
| 0.1 | 0.5 | GO:0075071 | autophagy of host cells involved in interaction with symbiont(GO:0075044) autophagy involved in symbiotic interaction(GO:0075071) |
| 0.1 | 0.6 | GO:0030240 | skeletal muscle thin filament assembly(GO:0030240) |
| 0.1 | 1.3 | GO:0006105 | succinate metabolic process(GO:0006105) |
| 0.1 | 0.4 | GO:0046010 | positive regulation of circadian sleep/wake cycle, non-REM sleep(GO:0046010) |
| 0.1 | 2.0 | GO:0040015 | negative regulation of multicellular organism growth(GO:0040015) |
| 0.1 | 0.9 | GO:0032417 | positive regulation of sodium:proton antiporter activity(GO:0032417) |
| 0.1 | 0.3 | GO:0003218 | cardiac left ventricle formation(GO:0003218) |
| 0.1 | 0.5 | GO:2000254 | regulation of male germ cell proliferation(GO:2000254) negative regulation of male germ cell proliferation(GO:2000255) |
| 0.1 | 0.6 | GO:0080009 | mRNA methylation(GO:0080009) |
| 0.1 | 1.2 | GO:2000580 | positive regulation of microtubule motor activity(GO:2000576) regulation of ATP-dependent microtubule motor activity, plus-end-directed(GO:2000580) positive regulation of ATP-dependent microtubule motor activity, plus-end-directed(GO:2000582) |
| 0.1 | 2.9 | GO:0006337 | nucleosome disassembly(GO:0006337) |
| 0.1 | 0.3 | GO:1903070 | negative regulation of ER-associated ubiquitin-dependent protein catabolic process(GO:1903070) |
| 0.1 | 0.3 | GO:0033693 | neurofilament bundle assembly(GO:0033693) |
| 0.1 | 0.7 | GO:0070862 | negative regulation of protein exit from endoplasmic reticulum(GO:0070862) negative regulation of retrograde protein transport, ER to cytosol(GO:1904153) |
| 0.1 | 0.5 | GO:0061187 | regulation of chromatin silencing at rDNA(GO:0061187) |
| 0.1 | 1.6 | GO:0034497 | protein localization to pre-autophagosomal structure(GO:0034497) |
| 0.1 | 0.4 | GO:0010039 | response to iron ion(GO:0010039) |
| 0.1 | 1.2 | GO:0001514 | selenocysteine incorporation(GO:0001514) translational readthrough(GO:0006451) |
| 0.1 | 2.0 | GO:0032060 | bleb assembly(GO:0032060) |
| 0.1 | 2.3 | GO:0046597 | negative regulation of viral entry into host cell(GO:0046597) |
| 0.1 | 0.4 | GO:0035752 | lysosomal lumen pH elevation(GO:0035752) |
| 0.1 | 0.5 | GO:0015793 | glycerol transport(GO:0015793) |
| 0.1 | 0.4 | GO:0030222 | eosinophil differentiation(GO:0030222) |
| 0.1 | 0.4 | GO:0045917 | positive regulation of complement activation(GO:0045917) positive regulation of protein activation cascade(GO:2000259) |
| 0.1 | 0.9 | GO:0071638 | negative regulation of monocyte chemotactic protein-1 production(GO:0071638) |
| 0.1 | 1.9 | GO:0006853 | carnitine shuttle(GO:0006853) |
| 0.1 | 0.6 | GO:0015677 | copper ion import(GO:0015677) |
| 0.1 | 0.5 | GO:1905098 | negative regulation of guanyl-nucleotide exchange factor activity(GO:1905098) |
| 0.1 | 0.8 | GO:0090043 | regulation of tubulin deacetylation(GO:0090043) |
| 0.1 | 1.5 | GO:0035970 | peptidyl-threonine dephosphorylation(GO:0035970) |
| 0.1 | 0.7 | GO:0032434 | regulation of proteasomal ubiquitin-dependent protein catabolic process(GO:0032434) |
| 0.1 | 0.2 | GO:0042246 | tissue regeneration(GO:0042246) |
| 0.1 | 0.4 | GO:0046116 | queuosine biosynthetic process(GO:0008616) queuosine metabolic process(GO:0046116) |
| 0.1 | 0.5 | GO:0018230 | peptidyl-L-cysteine S-palmitoylation(GO:0018230) peptidyl-S-diacylglycerol-L-cysteine biosynthetic process from peptidyl-cysteine(GO:0018231) |
| 0.1 | 1.2 | GO:0043562 | cellular response to nitrogen starvation(GO:0006995) cellular response to nitrogen levels(GO:0043562) |
| 0.1 | 0.4 | GO:0032780 | negative regulation of ATPase activity(GO:0032780) |
| 0.1 | 0.2 | GO:1902177 | positive regulation of oxidative stress-induced intrinsic apoptotic signaling pathway(GO:1902177) |
| 0.1 | 0.8 | GO:0038203 | TORC2 signaling(GO:0038203) |
| 0.1 | 0.2 | GO:0002752 | cell surface pattern recognition receptor signaling pathway(GO:0002752) |
| 0.1 | 0.6 | GO:0007341 | penetration of zona pellucida(GO:0007341) |
| 0.1 | 6.0 | GO:0030049 | muscle filament sliding(GO:0030049) actin-myosin filament sliding(GO:0033275) |
| 0.1 | 0.3 | GO:0061083 | regulation of protein refolding(GO:0061083) negative regulation of protein refolding(GO:0061084) |
| 0.1 | 1.0 | GO:0090240 | positive regulation of histone H4 acetylation(GO:0090240) |
| 0.1 | 0.4 | GO:0017055 | negative regulation of RNA polymerase II transcriptional preinitiation complex assembly(GO:0017055) |
| 0.1 | 0.4 | GO:0035803 | egg coat formation(GO:0035803) |
| 0.1 | 0.4 | GO:0060528 | secretory columnal luminar epithelial cell differentiation involved in prostate glandular acinus development(GO:0060528) |
| 0.1 | 0.3 | GO:0003402 | planar cell polarity pathway involved in axis elongation(GO:0003402) |
| 0.1 | 0.3 | GO:0098923 | retrograde trans-synaptic signaling by soluble gas(GO:0098923) trans-synaptic signaling by soluble gas(GO:0099543) trans-synaptic signaling by trans-synaptic complex(GO:0099545) |
| 0.1 | 0.8 | GO:0045716 | positive regulation of low-density lipoprotein particle receptor biosynthetic process(GO:0045716) |
| 0.1 | 0.8 | GO:0032224 | positive regulation of synaptic transmission, cholinergic(GO:0032224) |
| 0.1 | 0.3 | GO:0097029 | mature conventional dendritic cell differentiation(GO:0097029) |
| 0.1 | 0.3 | GO:0031507 | heterochromatin assembly(GO:0031507) |
| 0.1 | 0.4 | GO:0003322 | pancreatic A cell development(GO:0003322) |
| 0.1 | 0.3 | GO:0038030 | non-canonical Wnt signaling pathway via MAPK cascade(GO:0038030) non-canonical Wnt signaling pathway via JNK cascade(GO:0038031) |
| 0.1 | 0.8 | GO:0031272 | regulation of pseudopodium assembly(GO:0031272) |
| 0.1 | 0.2 | GO:1902774 | late endosome to lysosome transport(GO:1902774) |
| 0.1 | 1.9 | GO:0051894 | positive regulation of focal adhesion assembly(GO:0051894) |
| 0.1 | 0.3 | GO:0019835 | cytolysis(GO:0019835) |
| 0.1 | 0.3 | GO:0045829 | negative regulation of isotype switching(GO:0045829) |
| 0.1 | 5.2 | GO:0006120 | mitochondrial electron transport, NADH to ubiquinone(GO:0006120) |
| 0.1 | 0.6 | GO:2000389 | regulation of neutrophil extravasation(GO:2000389) |
| 0.1 | 0.5 | GO:0010571 | positive regulation of nuclear cell cycle DNA replication(GO:0010571) |
| 0.1 | 1.2 | GO:0035020 | regulation of Rac protein signal transduction(GO:0035020) |
| 0.1 | 0.2 | GO:0016199 | axon midline choice point recognition(GO:0016199) |
| 0.1 | 0.8 | GO:0019800 | peptide cross-linking via chondroitin 4-sulfate glycosaminoglycan(GO:0019800) |
| 0.1 | 0.2 | GO:0060370 | susceptibility to T cell mediated cytotoxicity(GO:0060370) |
| 0.1 | 2.5 | GO:0007176 | regulation of epidermal growth factor-activated receptor activity(GO:0007176) |
| 0.1 | 0.8 | GO:0060315 | negative regulation of ryanodine-sensitive calcium-release channel activity(GO:0060315) |
| 0.1 | 0.7 | GO:0043550 | regulation of lipid kinase activity(GO:0043550) |
| 0.1 | 0.2 | GO:0043932 | ossification involved in bone remodeling(GO:0043932) |
| 0.1 | 0.8 | GO:1900119 | positive regulation of execution phase of apoptosis(GO:1900119) |
| 0.1 | 0.6 | GO:0002638 | negative regulation of immunoglobulin production(GO:0002638) negative regulation of mast cell degranulation(GO:0043305) |
| 0.1 | 0.3 | GO:1902044 | regulation of Fas signaling pathway(GO:1902044) positive regulation of blood vessel remodeling(GO:2000504) |
| 0.1 | 0.2 | GO:1901899 | positive regulation of relaxation of cardiac muscle(GO:1901899) regulation of calcium ion import into sarcoplasmic reticulum(GO:1902080) negative regulation of calcium ion import into sarcoplasmic reticulum(GO:1902081) |
| 0.1 | 0.3 | GO:0051492 | regulation of stress fiber assembly(GO:0051492) |
| 0.1 | 0.2 | GO:0061687 | detoxification of inorganic compound(GO:0061687) |
| 0.1 | 1.8 | GO:2000178 | negative regulation of neural precursor cell proliferation(GO:2000178) |
| 0.1 | 1.7 | GO:0046688 | response to copper ion(GO:0046688) |
| 0.1 | 0.4 | GO:1903976 | negative regulation of glial cell migration(GO:1903976) |
| 0.1 | 0.1 | GO:0032911 | negative regulation of transforming growth factor beta1 production(GO:0032911) cardiac vascular smooth muscle cell differentiation(GO:0060947) |
| 0.1 | 0.2 | GO:0044782 | cilium organization(GO:0044782) |
| 0.1 | 0.8 | GO:0070070 | proton-transporting V-type ATPase complex assembly(GO:0070070) vacuolar proton-transporting V-type ATPase complex assembly(GO:0070072) |
| 0.1 | 0.3 | GO:0001957 | intramembranous ossification(GO:0001957) direct ossification(GO:0036072) positive regulation of cell chemotaxis to fibroblast growth factor(GO:1904849) positive regulation of endothelial cell chemotaxis to fibroblast growth factor(GO:2000546) |
| 0.1 | 1.3 | GO:0030502 | negative regulation of bone mineralization(GO:0030502) |
| 0.1 | 0.3 | GO:0097113 | AMPA glutamate receptor clustering(GO:0097113) glutamate receptor clustering(GO:0097688) |
| 0.1 | 0.9 | GO:0006986 | response to unfolded protein(GO:0006986) |
| 0.1 | 0.2 | GO:0019442 | tryptophan catabolic process to acetyl-CoA(GO:0019442) |
| 0.1 | 1.0 | GO:0090136 | epithelial cell-cell adhesion(GO:0090136) |
| 0.1 | 2.3 | GO:0015986 | energy coupled proton transport, down electrochemical gradient(GO:0015985) ATP synthesis coupled proton transport(GO:0015986) |
| 0.1 | 1.5 | GO:0097067 | cellular response to thyroid hormone stimulus(GO:0097067) |
| 0.1 | 0.3 | GO:0030200 | heparan sulfate proteoglycan catabolic process(GO:0030200) |
| 0.1 | 1.2 | GO:0014733 | regulation of skeletal muscle adaptation(GO:0014733) |
| 0.1 | 1.6 | GO:0071294 | cellular response to zinc ion(GO:0071294) |
| 0.1 | 1.3 | GO:0032012 | regulation of ARF protein signal transduction(GO:0032012) |
| 0.1 | 0.3 | GO:0002084 | protein depalmitoylation(GO:0002084) |
| 0.1 | 0.3 | GO:1903588 | negative regulation of blood vessel endothelial cell proliferation involved in sprouting angiogenesis(GO:1903588) |
| 0.1 | 0.6 | GO:2000601 | positive regulation of Arp2/3 complex-mediated actin nucleation(GO:2000601) |
| 0.1 | 0.9 | GO:0019511 | peptidyl-proline hydroxylation(GO:0019511) |
| 0.1 | 0.5 | GO:2000766 | negative regulation of cytoplasmic translation(GO:2000766) |
| 0.1 | 0.6 | GO:2001214 | positive regulation of vasculogenesis(GO:2001214) |
| 0.1 | 0.8 | GO:0034975 | protein folding in endoplasmic reticulum(GO:0034975) |
| 0.1 | 1.0 | GO:0032802 | low-density lipoprotein particle receptor catabolic process(GO:0032802) |
| 0.1 | 0.8 | GO:0071318 | cellular response to ATP(GO:0071318) |
| 0.1 | 0.3 | GO:0032509 | endosome transport via multivesicular body sorting pathway(GO:0032509) |
| 0.1 | 1.6 | GO:1901685 | glutathione derivative metabolic process(GO:1901685) glutathione derivative biosynthetic process(GO:1901687) |
| 0.1 | 1.9 | GO:0000188 | inactivation of MAPK activity(GO:0000188) |
| 0.1 | 0.2 | GO:0003095 | pressure natriuresis(GO:0003095) |
| 0.1 | 0.8 | GO:0000338 | protein deneddylation(GO:0000338) |
| 0.1 | 0.6 | GO:1903608 | protein localization to cytoplasmic stress granule(GO:1903608) |
| 0.1 | 0.5 | GO:0031115 | negative regulation of microtubule polymerization(GO:0031115) |
| 0.1 | 0.5 | GO:0038028 | insulin receptor signaling pathway via phosphatidylinositol 3-kinase(GO:0038028) |
| 0.1 | 0.4 | GO:0048050 | post-embryonic eye morphogenesis(GO:0048050) |
| 0.1 | 0.2 | GO:0097089 | methyl-branched fatty acid metabolic process(GO:0097089) |
| 0.1 | 0.1 | GO:0043311 | positive regulation of eosinophil degranulation(GO:0043311) positive regulation of eosinophil activation(GO:1902568) |
| 0.1 | 1.3 | GO:0015813 | L-glutamate transport(GO:0015813) |
| 0.1 | 0.3 | GO:1904141 | positive regulation of odontogenesis of dentin-containing tooth(GO:0042488) mammary gland fat development(GO:0060611) positive regulation of macrophage colony-stimulating factor signaling pathway(GO:1902228) positive regulation of response to macrophage colony-stimulating factor(GO:1903971) positive regulation of cellular response to macrophage colony-stimulating factor stimulus(GO:1903974) microglial cell migration(GO:1904124) regulation of microglial cell migration(GO:1904139) positive regulation of microglial cell migration(GO:1904141) |
| 0.1 | 0.7 | GO:1902236 | negative regulation of endoplasmic reticulum stress-induced intrinsic apoptotic signaling pathway(GO:1902236) |
| 0.1 | 0.2 | GO:0046125 | thymidine metabolic process(GO:0046104) pyrimidine deoxyribonucleoside metabolic process(GO:0046125) |
| 0.1 | 0.6 | GO:0006030 | chitin metabolic process(GO:0006030) chitin catabolic process(GO:0006032) |
| 0.1 | 0.3 | GO:0051012 | microtubule sliding(GO:0051012) |
| 0.1 | 0.4 | GO:0032700 | negative regulation of interleukin-17 production(GO:0032700) |
| 0.1 | 0.2 | GO:0046726 | positive regulation by virus of viral protein levels in host cell(GO:0046726) |
| 0.1 | 0.6 | GO:0008212 | mineralocorticoid biosynthetic process(GO:0006705) mineralocorticoid metabolic process(GO:0008212) |
| 0.1 | 3.1 | GO:0009142 | nucleoside triphosphate biosynthetic process(GO:0009142) |
| 0.0 | 0.4 | GO:0038007 | netrin-activated signaling pathway(GO:0038007) |
| 0.0 | 0.1 | GO:0014054 | positive regulation of gamma-aminobutyric acid secretion(GO:0014054) |
| 0.0 | 0.3 | GO:0071104 | response to interleukin-9(GO:0071104) |
| 0.0 | 0.2 | GO:0032025 | response to cobalt ion(GO:0032025) |
| 0.0 | 0.4 | GO:2000042 | negative regulation of double-strand break repair via homologous recombination(GO:2000042) |
| 0.0 | 0.2 | GO:2000418 | positive regulation of eosinophil migration(GO:2000418) |
| 0.0 | 0.1 | GO:0019482 | beta-alanine metabolic process(GO:0019482) |
| 0.0 | 0.2 | GO:0071306 | cellular response to vitamin E(GO:0071306) response to metformin(GO:1901558) negative regulation of pancreatic stellate cell proliferation(GO:2000230) |
| 0.0 | 3.1 | GO:0030574 | collagen catabolic process(GO:0030574) |
| 0.0 | 0.2 | GO:0042412 | taurine biosynthetic process(GO:0042412) |
| 0.0 | 0.2 | GO:0045981 | positive regulation of nucleotide metabolic process(GO:0045981) positive regulation of purine nucleotide metabolic process(GO:1900544) |
| 0.0 | 0.1 | GO:0048852 | hypophysis morphogenesis(GO:0048850) diencephalon morphogenesis(GO:0048852) |
| 0.0 | 0.8 | GO:0033141 | positive regulation of peptidyl-serine phosphorylation of STAT protein(GO:0033141) |
| 0.0 | 0.4 | GO:1901223 | negative regulation of NIK/NF-kappaB signaling(GO:1901223) |
| 0.0 | 0.1 | GO:2001206 | positive regulation of osteoclast development(GO:2001206) |
| 0.0 | 0.2 | GO:0098795 | mRNA cleavage involved in gene silencing by miRNA(GO:0035279) mRNA cleavage involved in gene silencing by siRNA(GO:0090625) mRNA cleavage involved in gene silencing(GO:0098795) |
| 0.0 | 0.1 | GO:1990164 | histone H2A phosphorylation(GO:1990164) |
| 0.0 | 0.1 | GO:0006121 | mitochondrial electron transport, succinate to ubiquinone(GO:0006121) |
| 0.0 | 0.6 | GO:0043374 | CD8-positive, alpha-beta T cell differentiation(GO:0043374) |
| 0.0 | 0.6 | GO:0045161 | neuronal ion channel clustering(GO:0045161) |
| 0.0 | 0.4 | GO:0015889 | cobalamin transport(GO:0015889) |
| 0.0 | 0.4 | GO:1904354 | negative regulation of telomere capping(GO:1904354) |
| 0.0 | 0.0 | GO:0006620 | posttranslational protein targeting to membrane(GO:0006620) |
| 0.0 | 0.4 | GO:0090292 | nuclear matrix anchoring at nuclear membrane(GO:0090292) |
| 0.0 | 0.7 | GO:0002686 | negative regulation of leukocyte migration(GO:0002686) |
| 0.0 | 0.2 | GO:0018101 | protein citrullination(GO:0018101) histone citrullination(GO:0036414) |
| 0.0 | 0.1 | GO:0030046 | parallel actin filament bundle assembly(GO:0030046) |
| 0.0 | 0.1 | GO:0061419 | arterial endothelial cell fate commitment(GO:0060844) positive regulation of transcription from RNA polymerase II promoter in response to hypoxia(GO:0061419) blood vessel lumenization(GO:0072554) positive regulation of ephrin receptor signaling pathway(GO:1901189) positive regulation of canonical Wnt signaling pathway involved in cardiac muscle cell fate commitment(GO:1901297) positive regulation of canonical Wnt signaling pathway involved in heart development(GO:1905068) |
| 0.0 | 0.5 | GO:0043162 | ubiquitin-dependent protein catabolic process via the multivesicular body sorting pathway(GO:0043162) |
| 0.0 | 1.1 | GO:0052472 | modulation by host of viral transcription(GO:0043921) modulation by host of symbiont transcription(GO:0052472) |
| 0.0 | 0.2 | GO:0035507 | regulation of myosin-light-chain-phosphatase activity(GO:0035507) |
| 0.0 | 0.2 | GO:2000324 | positive regulation of glucocorticoid receptor signaling pathway(GO:2000324) |
| 0.0 | 0.6 | GO:0006768 | biotin metabolic process(GO:0006768) |
| 0.0 | 0.5 | GO:0035641 | locomotory exploration behavior(GO:0035641) |
| 0.0 | 2.4 | GO:0008589 | regulation of smoothened signaling pathway(GO:0008589) |
| 0.0 | 0.5 | GO:0034063 | stress granule assembly(GO:0034063) |
| 0.0 | 1.0 | GO:0051491 | positive regulation of filopodium assembly(GO:0051491) |
| 0.0 | 0.7 | GO:0090190 | positive regulation of branching involved in ureteric bud morphogenesis(GO:0090190) |
| 0.0 | 0.1 | GO:0030035 | microspike assembly(GO:0030035) |
| 0.0 | 0.2 | GO:1990822 | basic amino acid transmembrane transport(GO:1990822) |
| 0.0 | 0.0 | GO:0006059 | hexitol metabolic process(GO:0006059) |
| 0.0 | 0.7 | GO:0010226 | response to lithium ion(GO:0010226) |
| 0.0 | 0.1 | GO:1904823 | pyrimidine nucleobase transport(GO:0015855) purine nucleobase transmembrane transport(GO:1904823) |
| 0.0 | 0.2 | GO:0021540 | corpus callosum morphogenesis(GO:0021540) |
| 0.0 | 1.0 | GO:0003091 | renal water homeostasis(GO:0003091) |
| 0.0 | 0.5 | GO:0070914 | UV-damage excision repair(GO:0070914) |
| 0.0 | 0.8 | GO:0015988 | energy coupled proton transmembrane transport, against electrochemical gradient(GO:0015988) ATP hydrolysis coupled proton transport(GO:0015991) |
| 0.0 | 0.7 | GO:0003334 | keratinocyte development(GO:0003334) |
| 0.0 | 0.1 | GO:0070902 | mitochondrial tRNA pseudouridine synthesis(GO:0070902) |
| 0.0 | 0.1 | GO:0036353 | histone H2A-K119 monoubiquitination(GO:0036353) |
| 0.0 | 0.2 | GO:2001180 | negative regulation of interleukin-10 secretion(GO:2001180) negative regulation of interleukin-12 secretion(GO:2001183) |
| 0.0 | 1.2 | GO:0045737 | positive regulation of cyclin-dependent protein serine/threonine kinase activity(GO:0045737) |
| 0.0 | 0.1 | GO:0002018 | renin-angiotensin regulation of aldosterone production(GO:0002018) |
| 0.0 | 0.1 | GO:0030854 | positive regulation of granulocyte differentiation(GO:0030854) |
| 0.0 | 0.3 | GO:0071799 | response to prostaglandin D(GO:0071798) cellular response to prostaglandin D stimulus(GO:0071799) |
| 0.0 | 0.8 | GO:0097435 | fibril organization(GO:0097435) |
| 0.0 | 0.3 | GO:0007568 | aging(GO:0007568) |
| 0.0 | 0.3 | GO:1900227 | positive regulation of NLRP3 inflammasome complex assembly(GO:1900227) |
| 0.0 | 0.4 | GO:2000774 | positive regulation of cellular senescence(GO:2000774) |
| 0.0 | 0.1 | GO:0008582 | regulation of synaptic growth at neuromuscular junction(GO:0008582) |
| 0.0 | 0.3 | GO:0033327 | Leydig cell differentiation(GO:0033327) |
| 0.0 | 0.1 | GO:0006987 | activation of signaling protein activity involved in unfolded protein response(GO:0006987) |
| 0.0 | 0.2 | GO:0021520 | spinal cord motor neuron cell fate specification(GO:0021520) |
| 0.0 | 0.2 | GO:0019532 | oxalate transport(GO:0019532) |
| 0.0 | 0.1 | GO:0070601 | centromeric sister chromatid cohesion(GO:0070601) |
| 0.0 | 0.2 | GO:0097428 | protein maturation by iron-sulfur cluster transfer(GO:0097428) |
| 0.0 | 0.7 | GO:0032463 | negative regulation of protein homooligomerization(GO:0032463) |
| 0.0 | 0.3 | GO:0051601 | exocyst localization(GO:0051601) |
| 0.0 | 0.3 | GO:0006661 | phosphatidylinositol biosynthetic process(GO:0006661) |
| 0.0 | 0.1 | GO:0021633 | optic nerve structural organization(GO:0021633) |
| 0.0 | 1.2 | GO:0003333 | amino acid transmembrane transport(GO:0003333) |
| 0.0 | 1.1 | GO:0006699 | bile acid biosynthetic process(GO:0006699) |
| 0.0 | 0.3 | GO:0019509 | L-methionine biosynthetic process from methylthioadenosine(GO:0019509) |
| 0.0 | 0.2 | GO:0007168 | receptor guanylyl cyclase signaling pathway(GO:0007168) |
| 0.0 | 0.1 | GO:0046533 | negative regulation of photoreceptor cell differentiation(GO:0046533) |
| 0.0 | 0.0 | GO:0051988 | regulation of attachment of spindle microtubules to kinetochore(GO:0051988) |
| 0.0 | 0.2 | GO:0090344 | negative regulation of cell aging(GO:0090344) |
| 0.0 | 0.2 | GO:0060056 | mammary gland involution(GO:0060056) |
| 0.0 | 0.1 | GO:0090074 | negative regulation of protein homodimerization activity(GO:0090074) |
| 0.0 | 0.2 | GO:0070986 | left/right axis specification(GO:0070986) |
| 0.0 | 1.1 | GO:0030318 | melanocyte differentiation(GO:0030318) |
| 0.0 | 0.1 | GO:0070131 | positive regulation of mitochondrial translation(GO:0070131) |
| 0.0 | 0.1 | GO:0035965 | cardiolipin acyl-chain remodeling(GO:0035965) |
| 0.0 | 0.2 | GO:0006307 | DNA dealkylation involved in DNA repair(GO:0006307) |
| 0.0 | 1.5 | GO:0000381 | regulation of alternative mRNA splicing, via spliceosome(GO:0000381) |
| 0.0 | 1.0 | GO:0006376 | mRNA splice site selection(GO:0006376) |
| 0.0 | 0.2 | GO:1904706 | negative regulation of vascular smooth muscle cell proliferation(GO:1904706) |
| 0.0 | 0.1 | GO:0042536 | negative regulation of tumor necrosis factor biosynthetic process(GO:0042536) positive regulation of interleukin-10 biosynthetic process(GO:0045082) |
| 0.0 | 0.1 | GO:0032815 | negative regulation of natural killer cell activation(GO:0032815) |
| 0.0 | 0.1 | GO:0032418 | lysosome localization(GO:0032418) |
| 0.0 | 0.2 | GO:0072321 | chaperone-mediated protein transport(GO:0072321) |
| 0.0 | 0.5 | GO:0043011 | myeloid dendritic cell differentiation(GO:0043011) |
| 0.0 | 0.1 | GO:0034351 | regulation of glial cell apoptotic process(GO:0034350) negative regulation of glial cell apoptotic process(GO:0034351) |
| 0.0 | 0.3 | GO:0002479 | antigen processing and presentation of exogenous peptide antigen via MHC class I, TAP-dependent(GO:0002479) |
| 0.0 | 0.1 | GO:0021523 | somatic motor neuron differentiation(GO:0021523) |
| 0.0 | 0.8 | GO:0007271 | synaptic transmission, cholinergic(GO:0007271) |
| 0.0 | 0.3 | GO:2000052 | positive regulation of non-canonical Wnt signaling pathway(GO:2000052) |
| 0.0 | 0.6 | GO:0045668 | negative regulation of osteoblast differentiation(GO:0045668) |
| 0.0 | 1.0 | GO:0003254 | regulation of membrane depolarization(GO:0003254) |
| 0.0 | 0.1 | GO:0070932 | histone H3 deacetylation(GO:0070932) |
| 0.0 | 0.1 | GO:0005997 | xylulose metabolic process(GO:0005997) |
| 0.0 | 0.1 | GO:0033629 | negative regulation of cell adhesion mediated by integrin(GO:0033629) |
| 0.0 | 0.0 | GO:2000653 | regulation of genetic imprinting(GO:2000653) |
| 0.0 | 0.5 | GO:0071577 | zinc II ion transmembrane transport(GO:0071577) |
| 0.0 | 0.1 | GO:0060754 | positive regulation of mast cell chemotaxis(GO:0060754) |
| 0.0 | 0.3 | GO:0002003 | angiotensin maturation(GO:0002003) |
| 0.0 | 0.1 | GO:0016127 | cholesterol catabolic process(GO:0006707) sterol catabolic process(GO:0016127) |
| 0.0 | 0.2 | GO:0007144 | female meiosis I(GO:0007144) |
| 0.0 | 0.3 | GO:1904714 | regulation of chaperone-mediated autophagy(GO:1904714) |
| 0.0 | 0.1 | GO:0043137 | DNA replication, removal of RNA primer(GO:0043137) |
| 0.0 | 1.8 | GO:0036498 | IRE1-mediated unfolded protein response(GO:0036498) |
| 0.0 | 0.3 | GO:0032506 | cytokinetic process(GO:0032506) |
| 0.0 | 0.1 | GO:0007172 | signal complex assembly(GO:0007172) |
| 0.0 | 0.4 | GO:0071425 | hematopoietic stem cell proliferation(GO:0071425) |
| 0.0 | 0.2 | GO:0030951 | establishment or maintenance of microtubule cytoskeleton polarity(GO:0030951) |
| 0.0 | 0.1 | GO:0006741 | NADP biosynthetic process(GO:0006741) |
| 0.0 | 1.3 | GO:0030032 | lamellipodium assembly(GO:0030032) |
| 0.0 | 0.2 | GO:0048026 | positive regulation of mRNA splicing, via spliceosome(GO:0048026) |
| 0.0 | 0.3 | GO:0010811 | positive regulation of cell-substrate adhesion(GO:0010811) |
| 0.0 | 0.1 | GO:0010764 | negative regulation of fibroblast migration(GO:0010764) |
| 0.0 | 0.2 | GO:0048096 | chromatin-mediated maintenance of transcription(GO:0048096) |
| 0.0 | 0.2 | GO:2000210 | positive regulation of anoikis(GO:2000210) |
| 0.0 | 0.5 | GO:0048935 | peripheral nervous system neuron differentiation(GO:0048934) peripheral nervous system neuron development(GO:0048935) |
| 0.0 | 0.1 | GO:0001207 | histone displacement(GO:0001207) regulation of transcription involved in meiotic cell cycle(GO:0051037) positive regulation of transcription involved in meiotic cell cycle(GO:0051039) |
| 0.0 | 0.1 | GO:0070537 | histone H2A K63-linked deubiquitination(GO:0070537) |
| 0.0 | 0.0 | GO:0060979 | vasculogenesis involved in coronary vascular morphogenesis(GO:0060979) |
| 0.0 | 0.1 | GO:0006398 | mRNA 3'-end processing by stem-loop binding and cleavage(GO:0006398) |
| 0.0 | 0.1 | GO:0032470 | regulation of twitch skeletal muscle contraction(GO:0014724) regulation of fast-twitch skeletal muscle fiber contraction(GO:0031446) positive regulation of fast-twitch skeletal muscle fiber contraction(GO:0031448) positive regulation of endoplasmic reticulum calcium ion concentration(GO:0032470) |
| 0.0 | 0.1 | GO:0090118 | receptor-mediated endocytosis of low-density lipoprotein particle involved in cholesterol transport(GO:0090118) |
| 0.0 | 0.1 | GO:0043280 | positive regulation of cysteine-type endopeptidase activity involved in apoptotic process(GO:0043280) |
| 0.0 | 0.2 | GO:0048169 | regulation of long-term neuronal synaptic plasticity(GO:0048169) |
| 0.0 | 0.3 | GO:0016024 | CDP-diacylglycerol biosynthetic process(GO:0016024) |
| 0.0 | 0.2 | GO:0070365 | hepatocyte differentiation(GO:0070365) |
| 0.0 | 1.5 | GO:1900034 | regulation of cellular response to heat(GO:1900034) |
| 0.0 | 0.3 | GO:1902807 | negative regulation of cell cycle G1/S phase transition(GO:1902807) negative regulation of G1/S transition of mitotic cell cycle(GO:2000134) |
| 0.0 | 0.4 | GO:0007286 | spermatid development(GO:0007286) |
| 0.0 | 0.2 | GO:0036092 | phosphatidylinositol-3-phosphate biosynthetic process(GO:0036092) |
| 0.0 | 0.2 | GO:0000920 | cell separation after cytokinesis(GO:0000920) |
| 0.0 | 0.0 | GO:0033603 | positive regulation of dopamine secretion(GO:0033603) negative regulation of luteinizing hormone secretion(GO:0033685) |
| 0.0 | 0.4 | GO:0050718 | positive regulation of interleukin-1 beta secretion(GO:0050718) |
| 0.0 | 0.2 | GO:0071850 | mitotic cell cycle arrest(GO:0071850) |
| 0.0 | 0.6 | GO:0032467 | positive regulation of cytokinesis(GO:0032467) |
| 0.0 | 0.2 | GO:0006828 | manganese ion transport(GO:0006828) |
| 0.0 | 0.2 | GO:1900078 | positive regulation of cellular response to insulin stimulus(GO:1900078) |
| 0.0 | 0.1 | GO:0033133 | positive regulation of glucokinase activity(GO:0033133) positive regulation of hexokinase activity(GO:1903301) |
| 0.0 | 0.1 | GO:0089700 | protein kinase D signaling(GO:0089700) |
| 0.0 | 0.4 | GO:0008038 | neuron recognition(GO:0008038) |
| 0.0 | 0.4 | GO:0030728 | ovulation(GO:0030728) |
| 0.0 | 0.2 | GO:0016540 | protein autoprocessing(GO:0016540) |
| 0.0 | 0.5 | GO:0043001 | Golgi to plasma membrane protein transport(GO:0043001) |
| 0.0 | 0.1 | GO:2001269 | positive regulation of cysteine-type endopeptidase activity involved in apoptotic signaling pathway(GO:2001269) |
| 0.0 | 0.0 | GO:0072385 | minus-end-directed organelle transport along microtubule(GO:0072385) |
| 0.0 | 0.1 | GO:0010634 | positive regulation of epithelial cell migration(GO:0010634) |
| 0.0 | 0.1 | GO:0070301 | cellular response to hydrogen peroxide(GO:0070301) |
| 0.0 | 0.1 | GO:0000183 | chromatin silencing at rDNA(GO:0000183) |
| 0.0 | 0.0 | GO:0002314 | germinal center B cell differentiation(GO:0002314) |
| 0.0 | 0.1 | GO:0071260 | cellular response to mechanical stimulus(GO:0071260) |
| 0.0 | 0.1 | GO:0060136 | embryonic process involved in female pregnancy(GO:0060136) |
| 0.0 | 0.1 | GO:0002774 | Fc receptor mediated inhibitory signaling pathway(GO:0002774) |
| 0.0 | 0.2 | GO:0007368 | determination of left/right symmetry(GO:0007368) |
| 0.0 | 0.0 | GO:0030718 | germ-line stem cell population maintenance(GO:0030718) |
| 0.0 | 0.1 | GO:0035871 | protein K11-linked deubiquitination(GO:0035871) |
| 0.0 | 0.1 | GO:0007320 | insemination(GO:0007320) |
| 0.0 | 0.4 | GO:0042325 | regulation of phosphorylation(GO:0042325) |
| 0.0 | 0.1 | GO:1902268 | negative regulation of polyamine transmembrane transport(GO:1902268) |
| 0.0 | 0.1 | GO:1901911 | diadenosine polyphosphate catabolic process(GO:0015961) diphosphoinositol polyphosphate metabolic process(GO:0071543) diadenosine pentaphosphate metabolic process(GO:1901906) diadenosine pentaphosphate catabolic process(GO:1901907) diadenosine hexaphosphate metabolic process(GO:1901908) diadenosine hexaphosphate catabolic process(GO:1901909) adenosine 5'-(hexahydrogen pentaphosphate) metabolic process(GO:1901910) adenosine 5'-(hexahydrogen pentaphosphate) catabolic process(GO:1901911) |
| 0.0 | 1.5 | GO:0007605 | sensory perception of sound(GO:0007605) |
| 0.0 | 0.2 | GO:0098915 | membrane repolarization during ventricular cardiac muscle cell action potential(GO:0098915) |
| 0.0 | 0.2 | GO:0014002 | astrocyte development(GO:0014002) |
| 0.0 | 0.3 | GO:0048024 | regulation of mRNA splicing, via spliceosome(GO:0048024) |
| 0.0 | 0.4 | GO:0022400 | regulation of rhodopsin mediated signaling pathway(GO:0022400) |
| 0.0 | 0.2 | GO:0021772 | olfactory bulb development(GO:0021772) |
| 0.0 | 0.4 | GO:0006468 | protein phosphorylation(GO:0006468) |
| 0.0 | 0.0 | GO:0006788 | heme oxidation(GO:0006788) |
| 0.0 | 0.1 | GO:1904776 | regulation of protein localization to cell cortex(GO:1904776) positive regulation of protein localization to cell cortex(GO:1904778) |
| 0.0 | 0.1 | GO:0001672 | regulation of chromatin assembly or disassembly(GO:0001672) |
| 0.0 | 0.0 | GO:0070989 | alkaloid catabolic process(GO:0009822) oxidative demethylation(GO:0070989) |
| 0.0 | 0.1 | GO:1901475 | pyruvate transport(GO:0006848) pyruvate transmembrane transport(GO:1901475) |
| 0.0 | 0.2 | GO:0031167 | rRNA methylation(GO:0031167) |
| 0.0 | 0.1 | GO:0030335 | positive regulation of cell migration(GO:0030335) |
| 0.0 | 0.2 | GO:1902600 | hydrogen ion transmembrane transport(GO:1902600) |
| 0.0 | 0.1 | GO:0090199 | release of cytochrome c from mitochondria(GO:0001836) regulation of release of cytochrome c from mitochondria(GO:0090199) |
| 0.0 | 0.1 | GO:0009125 | nucleoside monophosphate catabolic process(GO:0009125) |
| 0.0 | 0.4 | GO:0005980 | glycogen catabolic process(GO:0005980) |
| 0.0 | 0.2 | GO:0097120 | receptor localization to synapse(GO:0097120) |
Gene overrepresentation in C2:CP:REACTOME category:
| Log-likelihood per target | Total log-likelihood | Term | Description |
|---|---|---|---|
| 0.3 | 10.1 | REACTOME CHONDROITIN SULFATE BIOSYNTHESIS | Genes involved in Chondroitin sulfate biosynthesis |
| 0.2 | 6.1 | REACTOME TIE2 SIGNALING | Genes involved in Tie2 Signaling |
| 0.2 | 5.8 | REACTOME CASPASE MEDIATED CLEAVAGE OF CYTOSKELETAL PROTEINS | Genes involved in Caspase-mediated cleavage of cytoskeletal proteins |
| 0.2 | 2.0 | REACTOME IKK COMPLEX RECRUITMENT MEDIATED BY RIP1 | Genes involved in IKK complex recruitment mediated by RIP1 |
| 0.2 | 2.7 | REACTOME ADENYLATE CYCLASE INHIBITORY PATHWAY | Genes involved in Adenylate cyclase inhibitory pathway |
| 0.2 | 2.4 | REACTOME IL 7 SIGNALING | Genes involved in Interleukin-7 signaling |
| 0.1 | 4.1 | REACTOME CELL EXTRACELLULAR MATRIX INTERACTIONS | Genes involved in Cell-extracellular matrix interactions |
| 0.1 | 9.3 | REACTOME COLLAGEN FORMATION | Genes involved in Collagen formation |
| 0.1 | 2.4 | REACTOME GAP JUNCTION DEGRADATION | Genes involved in Gap junction degradation |
| 0.1 | 0.3 | REACTOME TRANSFERRIN ENDOCYTOSIS AND RECYCLING | Genes involved in Transferrin endocytosis and recycling |
| 0.1 | 3.7 | REACTOME PYRUVATE METABOLISM | Genes involved in Pyruvate metabolism |
| 0.1 | 2.3 | REACTOME REGULATION OF RHEB GTPASE ACTIVITY BY AMPK | Genes involved in Regulation of Rheb GTPase activity by AMPK |
| 0.1 | 6.7 | REACTOME SMOOTH MUSCLE CONTRACTION | Genes involved in Smooth Muscle Contraction |
| 0.1 | 2.0 | REACTOME SEMA3A PLEXIN REPULSION SIGNALING BY INHIBITING INTEGRIN ADHESION | Genes involved in SEMA3A-Plexin repulsion signaling by inhibiting Integrin adhesion |
| 0.1 | 2.8 | REACTOME REGULATION OF COMPLEMENT CASCADE | Genes involved in Regulation of Complement cascade |
| 0.1 | 1.5 | REACTOME SYNTHESIS OF SUBSTRATES IN N GLYCAN BIOSYTHESIS | Genes involved in Synthesis of substrates in N-glycan biosythesis |
| 0.1 | 0.9 | REACTOME REGULATION OF ORNITHINE DECARBOXYLASE ODC | Genes involved in Regulation of ornithine decarboxylase (ODC) |
| 0.1 | 3.1 | REACTOME SYNTHESIS AND INTERCONVERSION OF NUCLEOTIDE DI AND TRIPHOSPHATES | Genes involved in Synthesis and interconversion of nucleotide di- and triphosphates |
| 0.1 | 1.0 | REACTOME CREATION OF C4 AND C2 ACTIVATORS | Genes involved in Creation of C4 and C2 activators |
| 0.1 | 1.1 | REACTOME ROLE OF DCC IN REGULATING APOPTOSIS | Genes involved in Role of DCC in regulating apoptosis |
| 0.1 | 0.6 | REACTOME AQUAPORIN MEDIATED TRANSPORT | Genes involved in Aquaporin-mediated transport |
| 0.1 | 1.8 | REACTOME FORMATION OF ATP BY CHEMIOSMOTIC COUPLING | Genes involved in Formation of ATP by chemiosmotic coupling |
| 0.1 | 1.1 | REACTOME PASSIVE TRANSPORT BY AQUAPORINS | Genes involved in Passive Transport by Aquaporins |
| 0.1 | 2.0 | REACTOME HORMONE SENSITIVE LIPASE HSL MEDIATED TRIACYLGLYCEROL HYDROLYSIS | Genes involved in Hormone-sensitive lipase (HSL)-mediated triacylglycerol hydrolysis |
| 0.1 | 5.7 | REACTOME RESPIRATORY ELECTRON TRANSPORT | Genes involved in Respiratory electron transport |
| 0.1 | 1.3 | REACTOME SIGNALLING TO P38 VIA RIT AND RIN | Genes involved in Signalling to p38 via RIT and RIN |
| 0.1 | 1.3 | REACTOME SYNTHESIS OF PIPS AT THE GOLGI MEMBRANE | Genes involved in Synthesis of PIPs at the Golgi membrane |
| 0.1 | 2.3 | REACTOME SEMA4D INDUCED CELL MIGRATION AND GROWTH CONE COLLAPSE | Genes involved in Sema4D induced cell migration and growth-cone collapse |
| 0.1 | 2.3 | REACTOME GROWTH HORMONE RECEPTOR SIGNALING | Genes involved in Growth hormone receptor signaling |
| 0.1 | 1.4 | REACTOME ENDOSOMAL SORTING COMPLEX REQUIRED FOR TRANSPORT ESCRT | Genes involved in Endosomal Sorting Complex Required For Transport (ESCRT) |
| 0.1 | 5.4 | REACTOME TRANSCRIPTIONAL REGULATION OF WHITE ADIPOCYTE DIFFERENTIATION | Genes involved in Transcriptional Regulation of White Adipocyte Differentiation |
| 0.1 | 2.0 | REACTOME GLUTATHIONE CONJUGATION | Genes involved in Glutathione conjugation |
| 0.1 | 1.1 | REACTOME REGULATION OF IFNA SIGNALING | Genes involved in Regulation of IFNA signaling |
| 0.1 | 1.2 | REACTOME AMINE DERIVED HORMONES | Genes involved in Amine-derived hormones |
| 0.1 | 0.8 | REACTOME ACYL CHAIN REMODELLING OF PS | Genes involved in Acyl chain remodelling of PS |
| 0.0 | 1.8 | REACTOME CYTOSOLIC TRNA AMINOACYLATION | Genes involved in Cytosolic tRNA aminoacylation |
| 0.0 | 2.6 | REACTOME MITOCHONDRIAL PROTEIN IMPORT | Genes involved in Mitochondrial Protein Import |
| 0.0 | 1.3 | REACTOME RECYCLING PATHWAY OF L1 | Genes involved in Recycling pathway of L1 |
| 0.0 | 0.9 | REACTOME GLYCOGEN BREAKDOWN GLYCOGENOLYSIS | Genes involved in Glycogen breakdown (glycogenolysis) |
| 0.0 | 1.0 | REACTOME EXTRINSIC PATHWAY FOR APOPTOSIS | Genes involved in Extrinsic Pathway for Apoptosis |
| 0.0 | 0.6 | REACTOME IL RECEPTOR SHC SIGNALING | Genes involved in Interleukin receptor SHC signaling |
| 0.0 | 1.1 | REACTOME SYNTHESIS OF PIPS AT THE PLASMA MEMBRANE | Genes involved in Synthesis of PIPs at the plasma membrane |
| 0.0 | 0.4 | REACTOME PROSTANOID LIGAND RECEPTORS | Genes involved in Prostanoid ligand receptors |
| 0.0 | 0.9 | REACTOME METAL ION SLC TRANSPORTERS | Genes involved in Metal ion SLC transporters |
| 0.0 | 1.0 | REACTOME METABOLISM OF PORPHYRINS | Genes involved in Metabolism of porphyrins |
| 0.0 | 4.2 | REACTOME INTEGRIN CELL SURFACE INTERACTIONS | Genes involved in Integrin cell surface interactions |
| 0.0 | 1.7 | REACTOME MUSCLE CONTRACTION | Genes involved in Muscle contraction |
| 0.0 | 0.6 | REACTOME SIGNAL REGULATORY PROTEIN SIRP FAMILY INTERACTIONS | Genes involved in Signal regulatory protein (SIRP) family interactions |
| 0.0 | 2.4 | REACTOME CROSS PRESENTATION OF SOLUBLE EXOGENOUS ANTIGENS ENDOSOMES | Genes involved in Cross-presentation of soluble exogenous antigens (endosomes) |
| 0.0 | 0.9 | REACTOME SYNTHESIS OF PC | Genes involved in Synthesis of PC |
| 0.0 | 1.0 | REACTOME DOWNREGULATION OF TGF BETA RECEPTOR SIGNALING | Genes involved in Downregulation of TGF-beta receptor signaling |
| 0.0 | 0.5 | REACTOME NEPHRIN INTERACTIONS | Genes involved in Nephrin interactions |
| 0.0 | 2.2 | REACTOME ACTIVATION OF CHAPERONE GENES BY XBP1S | Genes involved in Activation of Chaperone Genes by XBP1(S) |
| 0.0 | 1.5 | REACTOME MYOGENESIS | Genes involved in Myogenesis |
| 0.0 | 0.2 | REACTOME TGF BETA RECEPTOR SIGNALING ACTIVATES SMADS | Genes involved in TGF-beta receptor signaling activates SMADs |
| 0.0 | 0.8 | REACTOME ACTIVATED NOTCH1 TRANSMITS SIGNAL TO THE NUCLEUS | Genes involved in Activated NOTCH1 Transmits Signal to the Nucleus |
| 0.0 | 1.1 | REACTOME NETRIN1 SIGNALING | Genes involved in Netrin-1 signaling |
| 0.0 | 0.8 | REACTOME INTERACTION BETWEEN L1 AND ANKYRINS | Genes involved in Interaction between L1 and Ankyrins |
| 0.0 | 0.3 | REACTOME ANDROGEN BIOSYNTHESIS | Genes involved in Androgen biosynthesis |
| 0.0 | 0.4 | REACTOME SYNTHESIS SECRETION AND INACTIVATION OF GIP | Genes involved in Synthesis, Secretion, and Inactivation of Glucose-dependent Insulinotropic Polypeptide (GIP) |
| 0.0 | 0.8 | REACTOME OXYGEN DEPENDENT PROLINE HYDROXYLATION OF HYPOXIA INDUCIBLE FACTOR ALPHA | Genes involved in Oxygen-dependent Proline Hydroxylation of Hypoxia-inducible Factor Alpha |
| 0.0 | 0.3 | REACTOME GLYCOPROTEIN HORMONES | Genes involved in Glycoprotein hormones |
| 0.0 | 0.6 | REACTOME INSULIN RECEPTOR RECYCLING | Genes involved in Insulin receptor recycling |
| 0.0 | 0.4 | REACTOME APOPTOSIS INDUCED DNA FRAGMENTATION | Genes involved in Apoptosis induced DNA fragmentation |
| 0.0 | 0.5 | REACTOME NUCLEOTIDE LIKE PURINERGIC RECEPTORS | Genes involved in Nucleotide-like (purinergic) receptors |
| 0.0 | 0.6 | REACTOME FORMATION OF INCISION COMPLEX IN GG NER | Genes involved in Formation of incision complex in GG-NER |
| 0.0 | 0.1 | REACTOME TRANSPORT OF MATURE MRNA DERIVED FROM AN INTRONLESS TRANSCRIPT | Genes involved in Transport of Mature mRNA Derived from an Intronless Transcript |
| 0.0 | 0.8 | REACTOME NEGATIVE REGULATORS OF RIG I MDA5 SIGNALING | Genes involved in Negative regulators of RIG-I/MDA5 signaling |
| 0.0 | 0.1 | REACTOME SLBP DEPENDENT PROCESSING OF REPLICATION DEPENDENT HISTONE PRE MRNAS | Genes involved in SLBP Dependent Processing of Replication-Dependent Histone Pre-mRNAs |
| 0.0 | 0.4 | REACTOME SCFSKP2 MEDIATED DEGRADATION OF P27 P21 | Genes involved in SCF(Skp2)-mediated degradation of p27/p21 |
| 0.0 | 0.4 | REACTOME HOMOLOGOUS RECOMBINATION REPAIR OF REPLICATION INDEPENDENT DOUBLE STRAND BREAKS | Genes involved in Homologous recombination repair of replication-independent double-strand breaks |
| 0.0 | 0.6 | REACTOME FORMATION OF TUBULIN FOLDING INTERMEDIATES BY CCT TRIC | Genes involved in Formation of tubulin folding intermediates by CCT/TriC |
| 0.0 | 0.3 | REACTOME ENDOGENOUS STEROLS | Genes involved in Endogenous sterols |
| 0.0 | 0.5 | REACTOME METABOLISM OF NON CODING RNA | Genes involved in Metabolism of non-coding RNA |
| 0.0 | 1.2 | REACTOME PHASE II CONJUGATION | Genes involved in Phase II conjugation |
| 0.0 | 2.4 | REACTOME FACTORS INVOLVED IN MEGAKARYOCYTE DEVELOPMENT AND PLATELET PRODUCTION | Genes involved in Factors involved in megakaryocyte development and platelet production |
| 0.0 | 0.5 | REACTOME REGULATION OF INSULIN LIKE GROWTH FACTOR IGF ACTIVITY BY INSULIN LIKE GROWTH FACTOR BINDING PROTEINS IGFBPS | Genes involved in Regulation of Insulin-like Growth Factor (IGF) Activity by Insulin-like Growth Factor Binding Proteins (IGFBPs) |
| 0.0 | 0.6 | REACTOME SPHINGOLIPID DE NOVO BIOSYNTHESIS | Genes involved in Sphingolipid de novo biosynthesis |
| 0.0 | 0.3 | REACTOME CALNEXIN CALRETICULIN CYCLE | Genes involved in Calnexin/calreticulin cycle |
| 0.0 | 0.3 | REACTOME SYNTHESIS OF PA | Genes involved in Synthesis of PA |
| 0.0 | 0.0 | REACTOME SHC MEDIATED SIGNALLING | Genes involved in SHC-mediated signalling |
| 0.0 | 0.3 | REACTOME OTHER SEMAPHORIN INTERACTIONS | Genes involved in Other semaphorin interactions |
| 0.0 | 0.2 | REACTOME TRYPTOPHAN CATABOLISM | Genes involved in Tryptophan catabolism |
| 0.0 | 0.4 | REACTOME GLUTAMATE NEUROTRANSMITTER RELEASE CYCLE | Genes involved in Glutamate Neurotransmitter Release Cycle |
| 0.0 | 0.1 | REACTOME ACTIVATION OF BH3 ONLY PROTEINS | Genes involved in Activation of BH3-only proteins |
| 0.0 | 0.3 | REACTOME METABOLISM OF POLYAMINES | Genes involved in Metabolism of polyamines |
| 0.0 | 0.3 | REACTOME SRP DEPENDENT COTRANSLATIONAL PROTEIN TARGETING TO MEMBRANE | Genes involved in SRP-dependent cotranslational protein targeting to membrane |
| 0.0 | 0.9 | REACTOME LOSS OF NLP FROM MITOTIC CENTROSOMES | Genes involved in Loss of Nlp from mitotic centrosomes |
| 0.0 | 0.1 | REACTOME NOTCH HLH TRANSCRIPTION PATHWAY | Genes involved in Notch-HLH transcription pathway |
| 0.0 | 0.5 | REACTOME G ALPHA Z SIGNALLING EVENTS | Genes involved in G alpha (z) signalling events |
| 0.0 | 0.6 | REACTOME ION TRANSPORT BY P TYPE ATPASES | Genes involved in Ion transport by P-type ATPases |
Gene overrepresentation in cellular_component category:
| Log-likelihood per target | Total log-likelihood | Term | Description |
|---|---|---|---|
| 1.2 | 3.7 | GO:0005607 | laminin-2 complex(GO:0005607) |
| 0.9 | 12.4 | GO:0005589 | collagen type VI trimer(GO:0005589) collagen beaded filament(GO:0098647) |
| 0.8 | 2.5 | GO:0005588 | collagen type V trimer(GO:0005588) |
| 0.5 | 7.3 | GO:0097512 | cardiac myofibril(GO:0097512) |
| 0.4 | 2.6 | GO:0070435 | Shc-EGFR complex(GO:0070435) |
| 0.4 | 0.8 | GO:1990584 | cardiac Troponin complex(GO:1990584) |
| 0.4 | 2.0 | GO:0046696 | lipopolysaccharide receptor complex(GO:0046696) |
| 0.3 | 1.5 | GO:0001652 | granular component(GO:0001652) |
| 0.3 | 1.2 | GO:0045273 | mitochondrial respiratory chain complex II, succinate dehydrogenase complex (ubiquinone)(GO:0005749) succinate dehydrogenase complex (ubiquinone)(GO:0045257) respiratory chain complex II(GO:0045273) succinate dehydrogenase complex(GO:0045281) fumarate reductase complex(GO:0045283) |
| 0.3 | 1.7 | GO:0005927 | muscle tendon junction(GO:0005927) |
| 0.3 | 1.7 | GO:0034274 | Atg12-Atg5-Atg16 complex(GO:0034274) |
| 0.3 | 3.0 | GO:0033018 | sarcoplasmic reticulum lumen(GO:0033018) |
| 0.3 | 1.8 | GO:0005742 | mitochondrial outer membrane translocase complex(GO:0005742) |
| 0.2 | 0.2 | GO:0031526 | brush border membrane(GO:0031526) |
| 0.2 | 1.9 | GO:0036056 | filtration diaphragm(GO:0036056) slit diaphragm(GO:0036057) |
| 0.2 | 1.1 | GO:0070826 | paraferritin complex(GO:0070826) |
| 0.2 | 2.0 | GO:0098643 | fibrillar collagen trimer(GO:0005583) banded collagen fibril(GO:0098643) |
| 0.2 | 3.8 | GO:0005862 | muscle thin filament tropomyosin(GO:0005862) |
| 0.2 | 1.6 | GO:0005587 | collagen type IV trimer(GO:0005587) |
| 0.2 | 0.6 | GO:0036396 | MIS complex(GO:0036396) mRNA editing complex(GO:0045293) |
| 0.2 | 0.9 | GO:0005602 | complement component C1 complex(GO:0005602) |
| 0.2 | 2.1 | GO:0043203 | axon hillock(GO:0043203) |
| 0.2 | 0.3 | GO:0001673 | male germ cell nucleus(GO:0001673) germ cell nucleus(GO:0043073) |
| 0.2 | 0.5 | GO:0020003 | symbiont-containing vacuole(GO:0020003) symbiont-containing vacuole membrane(GO:0020005) |
| 0.2 | 0.5 | GO:0043291 | RAVE complex(GO:0043291) |
| 0.2 | 4.4 | GO:0031143 | pseudopodium(GO:0031143) |
| 0.2 | 1.7 | GO:0002116 | semaphorin receptor complex(GO:0002116) |
| 0.2 | 2.6 | GO:0034045 | pre-autophagosomal structure membrane(GO:0034045) |
| 0.1 | 2.1 | GO:0005833 | hemoglobin complex(GO:0005833) |
| 0.1 | 4.8 | GO:0031527 | filopodium membrane(GO:0031527) |
| 0.1 | 0.9 | GO:0030991 | intraciliary transport particle A(GO:0030991) |
| 0.1 | 0.4 | GO:0043159 | acrosomal matrix(GO:0043159) |
| 0.1 | 5.8 | GO:0043034 | costamere(GO:0043034) |
| 0.1 | 1.7 | GO:0034098 | VCP-NPL4-UFD1 AAA ATPase complex(GO:0034098) |
| 0.1 | 4.4 | GO:0005859 | muscle myosin complex(GO:0005859) |
| 0.1 | 1.0 | GO:0071144 | SMAD2-SMAD3 protein complex(GO:0071144) |
| 0.1 | 1.1 | GO:0072546 | ER membrane protein complex(GO:0072546) |
| 0.1 | 2.3 | GO:0031588 | nucleotide-activated protein kinase complex(GO:0031588) |
| 0.1 | 1.4 | GO:0005744 | mitochondrial inner membrane presequence translocase complex(GO:0005744) |
| 0.1 | 0.3 | GO:0008282 | ATP-sensitive potassium channel complex(GO:0008282) |
| 0.1 | 1.4 | GO:0000815 | ESCRT III complex(GO:0000815) |
| 0.1 | 0.6 | GO:0035032 | phosphatidylinositol 3-kinase complex, class III(GO:0035032) |
| 0.1 | 0.7 | GO:0061617 | MICOS complex(GO:0061617) |
| 0.1 | 0.3 | GO:0097057 | TRAF2-GSTP1 complex(GO:0097057) |
| 0.1 | 0.9 | GO:0005964 | phosphorylase kinase complex(GO:0005964) |
| 0.1 | 0.4 | GO:0000333 | telomerase catalytic core complex(GO:0000333) |
| 0.1 | 1.7 | GO:0000276 | mitochondrial proton-transporting ATP synthase complex, coupling factor F(o)(GO:0000276) |
| 0.1 | 1.4 | GO:0008305 | integrin complex(GO:0008305) |
| 0.1 | 1.8 | GO:0001527 | microfibril(GO:0001527) fibril(GO:0043205) |
| 0.1 | 5.2 | GO:0005747 | mitochondrial respiratory chain complex I(GO:0005747) NADH dehydrogenase complex(GO:0030964) respiratory chain complex I(GO:0045271) |
| 0.1 | 1.3 | GO:0001518 | voltage-gated sodium channel complex(GO:0001518) |
| 0.1 | 1.9 | GO:0031092 | platelet alpha granule membrane(GO:0031092) |
| 0.1 | 0.9 | GO:0031595 | nuclear proteasome complex(GO:0031595) |
| 0.1 | 1.0 | GO:0032591 | dendritic spine membrane(GO:0032591) |
| 0.1 | 0.8 | GO:0005614 | interstitial matrix(GO:0005614) |
| 0.1 | 1.3 | GO:0005832 | chaperonin-containing T-complex(GO:0005832) |
| 0.1 | 0.8 | GO:0099634 | postsynaptic specialization membrane(GO:0099634) |
| 0.1 | 0.5 | GO:0072669 | tRNA-splicing ligase complex(GO:0072669) |
| 0.1 | 1.0 | GO:0030478 | actin cap(GO:0030478) |
| 0.1 | 0.5 | GO:0000110 | nucleotide-excision repair factor 1 complex(GO:0000110) |
| 0.1 | 0.5 | GO:0097165 | nuclear stress granule(GO:0097165) |
| 0.1 | 7.3 | GO:0005882 | intermediate filament(GO:0005882) |
| 0.1 | 1.7 | GO:0005640 | nuclear outer membrane(GO:0005640) |
| 0.1 | 0.4 | GO:0061700 | GATOR2 complex(GO:0061700) |
| 0.1 | 0.4 | GO:0000813 | ESCRT I complex(GO:0000813) |
| 0.1 | 0.2 | GO:0070695 | FHF complex(GO:0070695) |
| 0.1 | 2.4 | GO:0099738 | cell cortex region(GO:0099738) |
| 0.1 | 1.0 | GO:0030122 | AP-2 adaptor complex(GO:0030122) |
| 0.1 | 0.2 | GO:0098858 | actin-based cell projection(GO:0098858) |
| 0.1 | 1.7 | GO:0016581 | NuRD complex(GO:0016581) CHD-type complex(GO:0090545) |
| 0.1 | 0.8 | GO:0031362 | anchored component of external side of plasma membrane(GO:0031362) |
| 0.1 | 0.4 | GO:0042382 | paraspeckles(GO:0042382) |
| 0.1 | 0.6 | GO:0005577 | fibrinogen complex(GO:0005577) |
| 0.1 | 1.8 | GO:0032420 | stereocilium(GO:0032420) |
| 0.1 | 0.3 | GO:0001740 | Barr body(GO:0001740) |
| 0.1 | 0.2 | GO:0005967 | mitochondrial pyruvate dehydrogenase complex(GO:0005967) |
| 0.0 | 1.8 | GO:0005605 | basal lamina(GO:0005605) |
| 0.0 | 0.3 | GO:0097427 | microtubule bundle(GO:0097427) |
| 0.0 | 2.4 | GO:0043198 | dendritic shaft(GO:0043198) |
| 0.0 | 1.3 | GO:0005865 | striated muscle thin filament(GO:0005865) myofilament(GO:0036379) |
| 0.0 | 0.2 | GO:0043293 | apoptosome(GO:0043293) |
| 0.0 | 0.2 | GO:0033263 | CORVET complex(GO:0033263) |
| 0.0 | 1.5 | GO:0000421 | autophagosome membrane(GO:0000421) |
| 0.0 | 0.5 | GO:0005677 | chromatin silencing complex(GO:0005677) |
| 0.0 | 2.6 | GO:0005604 | basement membrane(GO:0005604) |
| 0.0 | 1.2 | GO:0034451 | centriolar satellite(GO:0034451) |
| 0.0 | 1.0 | GO:0016327 | apicolateral plasma membrane(GO:0016327) |
| 0.0 | 0.8 | GO:0031305 | intrinsic component of mitochondrial inner membrane(GO:0031304) integral component of mitochondrial inner membrane(GO:0031305) |
| 0.0 | 0.3 | GO:1990131 | EGO complex(GO:0034448) Gtr1-Gtr2 GTPase complex(GO:1990131) |
| 0.0 | 0.3 | GO:1990682 | CSF1-CSF1R complex(GO:1990682) |
| 0.0 | 0.6 | GO:0031209 | SCAR complex(GO:0031209) |
| 0.0 | 0.9 | GO:0031941 | filamentous actin(GO:0031941) |
| 0.0 | 0.5 | GO:0030008 | TRAPP complex(GO:0030008) |
| 0.0 | 0.4 | GO:0061574 | ASAP complex(GO:0061574) |
| 0.0 | 1.2 | GO:0005868 | cytoplasmic dynein complex(GO:0005868) |
| 0.0 | 0.7 | GO:0031932 | TORC2 complex(GO:0031932) |
| 0.0 | 1.5 | GO:0016592 | mediator complex(GO:0016592) |
| 0.0 | 0.9 | GO:0033178 | proton-transporting two-sector ATPase complex, catalytic domain(GO:0033178) |
| 0.0 | 0.2 | GO:1990726 | Lsm1-7-Pat1 complex(GO:1990726) |
| 0.0 | 0.2 | GO:0044233 | ER-mitochondrion membrane contact site(GO:0044233) |
| 0.0 | 0.3 | GO:0000220 | vacuolar proton-transporting V-type ATPase, V0 domain(GO:0000220) |
| 0.0 | 0.6 | GO:1990124 | messenger ribonucleoprotein complex(GO:1990124) |
| 0.0 | 0.3 | GO:0031465 | Cul4B-RING E3 ubiquitin ligase complex(GO:0031465) |
| 0.0 | 0.3 | GO:0042788 | polysomal ribosome(GO:0042788) |
| 0.0 | 0.2 | GO:1990425 | ryanodine receptor complex(GO:1990425) |
| 0.0 | 2.6 | GO:0005791 | rough endoplasmic reticulum(GO:0005791) |
| 0.0 | 0.3 | GO:0030688 | preribosome, small subunit precursor(GO:0030688) |
| 0.0 | 0.1 | GO:0070876 | SOSS complex(GO:0070876) |
| 0.0 | 0.5 | GO:0030285 | integral component of synaptic vesicle membrane(GO:0030285) intrinsic component of synaptic vesicle membrane(GO:0098563) |
| 0.0 | 1.0 | GO:0016459 | myosin complex(GO:0016459) |
| 0.0 | 2.1 | GO:0030672 | synaptic vesicle membrane(GO:0030672) exocytic vesicle membrane(GO:0099501) |
| 0.0 | 0.1 | GO:0035838 | growing cell tip(GO:0035838) |
| 0.0 | 0.2 | GO:0033269 | internode region of axon(GO:0033269) |
| 0.0 | 0.2 | GO:0005853 | eukaryotic translation elongation factor 1 complex(GO:0005853) |
| 0.0 | 0.7 | GO:0008074 | guanylate cyclase complex, soluble(GO:0008074) |
| 0.0 | 0.1 | GO:1990851 | Wnt-Frizzled-LRP5/6 complex(GO:1990851) |
| 0.0 | 3.2 | GO:1902554 | serine/threonine protein kinase complex(GO:1902554) |
| 0.0 | 0.9 | GO:0030315 | T-tubule(GO:0030315) |
| 0.0 | 0.2 | GO:0035068 | micro-ribonucleoprotein complex(GO:0035068) |
| 0.0 | 0.1 | GO:0043219 | lateral loop(GO:0043219) |
| 0.0 | 0.9 | GO:0005856 | cytoskeleton(GO:0005856) |
| 0.0 | 0.5 | GO:0034709 | methylosome(GO:0034709) |
| 0.0 | 0.1 | GO:0030914 | STAGA complex(GO:0030914) |
| 0.0 | 0.0 | GO:0070381 | endosome to plasma membrane transport vesicle(GO:0070381) |
| 0.0 | 0.4 | GO:0097440 | apical dendrite(GO:0097440) |
| 0.0 | 0.7 | GO:0030687 | preribosome, large subunit precursor(GO:0030687) |
| 0.0 | 0.1 | GO:0002193 | MAML1-RBP-Jkappa- ICN1 complex(GO:0002193) |
| 0.0 | 1.5 | GO:0043195 | terminal bouton(GO:0043195) |
| 0.0 | 4.2 | GO:0030016 | myofibril(GO:0030016) |
| 0.0 | 0.5 | GO:0005790 | smooth endoplasmic reticulum(GO:0005790) |
| 0.0 | 3.0 | GO:0016605 | PML body(GO:0016605) |
| 0.0 | 2.0 | GO:0035580 | specific granule lumen(GO:0035580) |
| 0.0 | 0.7 | GO:0008180 | COP9 signalosome(GO:0008180) |
| 0.0 | 0.3 | GO:0035102 | PRC1 complex(GO:0035102) |
| 0.0 | 1.7 | GO:0101003 | ficolin-1-rich granule membrane(GO:0101003) |
| 0.0 | 1.8 | GO:0031093 | platelet alpha granule lumen(GO:0031093) |
| 0.0 | 1.7 | GO:0032587 | ruffle membrane(GO:0032587) |
| 0.0 | 1.2 | GO:0000118 | histone deacetylase complex(GO:0000118) |
| 0.0 | 0.2 | GO:0070652 | HAUS complex(GO:0070652) |
| 0.0 | 0.5 | GO:0080008 | Cul4-RING E3 ubiquitin ligase complex(GO:0080008) |
| 0.0 | 3.3 | GO:0030496 | midbody(GO:0030496) |
| 0.0 | 0.2 | GO:0071204 | histone pre-mRNA 3'end processing complex(GO:0071204) |
| 0.0 | 0.4 | GO:0097546 | ciliary base(GO:0097546) |
| 0.0 | 0.1 | GO:0001520 | outer dense fiber(GO:0001520) |
| 0.0 | 0.1 | GO:0016442 | RISC complex(GO:0016442) RNAi effector complex(GO:0031332) |
| 0.0 | 0.8 | GO:0005876 | spindle microtubule(GO:0005876) |
| 0.0 | 2.2 | GO:0031012 | extracellular matrix(GO:0031012) |
| 0.0 | 0.2 | GO:0000125 | PCAF complex(GO:0000125) |
| 0.0 | 0.1 | GO:0031616 | spindle pole centrosome(GO:0031616) |
| 0.0 | 10.6 | GO:0005924 | cell-substrate adherens junction(GO:0005924) |
| 0.0 | 5.0 | GO:0005578 | proteinaceous extracellular matrix(GO:0005578) |
| 0.0 | 0.1 | GO:0032584 | growth cone membrane(GO:0032584) |
| 0.0 | 0.4 | GO:0000812 | Swr1 complex(GO:0000812) |
| 0.0 | 2.2 | GO:0042995 | cell projection(GO:0042995) |
| 0.0 | 0.3 | GO:0005686 | U2 snRNP(GO:0005686) |
| 0.0 | 0.2 | GO:0044327 | dendritic spine head(GO:0044327) |
| 0.0 | 0.6 | GO:0005665 | DNA-directed RNA polymerase II, core complex(GO:0005665) |
| 0.0 | 0.1 | GO:0000445 | THO complex(GO:0000347) THO complex part of transcription export complex(GO:0000445) |
| 0.0 | 0.3 | GO:0035145 | exon-exon junction complex(GO:0035145) |
| 0.0 | 0.2 | GO:0000124 | SAGA complex(GO:0000124) |
| 0.0 | 0.3 | GO:0035861 | site of double-strand break(GO:0035861) |
| 0.0 | 4.1 | GO:0045121 | membrane raft(GO:0045121) membrane microdomain(GO:0098857) |
| 0.0 | 0.1 | GO:0071203 | F-actin capping protein complex(GO:0008290) WASH complex(GO:0071203) |
| 0.0 | 0.2 | GO:0000788 | nuclear nucleosome(GO:0000788) |
| 0.0 | 0.1 | GO:0005851 | eukaryotic translation initiation factor 2B complex(GO:0005851) |
| 0.0 | 0.2 | GO:0097542 | ciliary tip(GO:0097542) |
| 0.0 | 0.7 | GO:0031965 | nuclear membrane(GO:0031965) |
| 0.0 | 0.3 | GO:0017101 | aminoacyl-tRNA synthetase multienzyme complex(GO:0017101) |
| 0.0 | 1.5 | GO:0030427 | site of polarized growth(GO:0030427) |
| 0.0 | 0.2 | GO:0005689 | U12-type spliceosomal complex(GO:0005689) |
| 0.0 | 1.7 | GO:0031901 | early endosome membrane(GO:0031901) |
| 0.0 | 2.7 | GO:0031252 | cell leading edge(GO:0031252) |
| 0.0 | 1.6 | GO:0031225 | anchored component of membrane(GO:0031225) |
| 0.0 | 0.2 | GO:0031906 | late endosome lumen(GO:0031906) |
| 0.0 | 0.1 | GO:0019773 | proteasome core complex, alpha-subunit complex(GO:0019773) |
| 0.0 | 0.1 | GO:0000145 | exocyst(GO:0000145) |
| 0.0 | 0.3 | GO:0070971 | endoplasmic reticulum exit site(GO:0070971) |
| 0.0 | 0.3 | GO:1904724 | tertiary granule lumen(GO:1904724) |
| 0.0 | 0.1 | GO:0036513 | Derlin-1 retrotranslocation complex(GO:0036513) |
| 0.0 | 0.4 | GO:0055038 | recycling endosome membrane(GO:0055038) |
| 0.0 | 0.2 | GO:0005664 | origin recognition complex(GO:0000808) nuclear origin of replication recognition complex(GO:0005664) |
| 0.0 | 0.1 | GO:1990635 | proximal dendrite(GO:1990635) |
| 0.0 | 0.4 | GO:0030173 | integral component of Golgi membrane(GO:0030173) |
| 0.0 | 0.2 | GO:0005721 | pericentric heterochromatin(GO:0005721) |
| 0.0 | 0.2 | GO:0031463 | Cul3-RING ubiquitin ligase complex(GO:0031463) |
Gene overrepresentation in C2:CP category:
| Log-likelihood per target | Total log-likelihood | Term | Description |
|---|---|---|---|
| 0.2 | 24.3 | PID INTEGRIN1 PATHWAY | Beta1 integrin cell surface interactions |
| 0.2 | 6.0 | PID ANTHRAX PATHWAY | Cellular roles of Anthrax toxin |
| 0.2 | 10.2 | NABA PROTEOGLYCANS | Genes encoding proteoglycans |
| 0.2 | 1.8 | ST IL 13 PATHWAY | Interleukin 13 (IL-13) Pathway |
| 0.1 | 2.3 | PID ALK2 PATHWAY | ALK2 signaling events |
| 0.1 | 1.8 | PID VEGF VEGFR PATHWAY | VEGF and VEGFR signaling network |
| 0.1 | 3.4 | SA PTEN PATHWAY | PTEN is a tumor suppressor that dephosphorylates the lipid messenger phosphatidylinositol triphosphate. |
| 0.1 | 2.4 | PID S1P S1P1 PATHWAY | S1P1 pathway |
| 0.1 | 4.5 | PID BMP PATHWAY | BMP receptor signaling |
| 0.1 | 1.5 | PID SMAD2 3PATHWAY | Regulation of cytoplasmic and nuclear SMAD2/3 signaling |
| 0.1 | 1.3 | PID FAK PATHWAY | Signaling events mediated by focal adhesion kinase |
| 0.1 | 2.0 | PID VEGFR1 PATHWAY | VEGFR1 specific signals |
| 0.1 | 2.1 | PID TOLL ENDOGENOUS PATHWAY | Endogenous TLR signaling |
| 0.1 | 6.0 | PID ILK PATHWAY | Integrin-linked kinase signaling |
| 0.1 | 4.5 | PID AURORA B PATHWAY | Aurora B signaling |
| 0.1 | 3.0 | PID SHP2 PATHWAY | SHP2 signaling |
| 0.1 | 2.1 | PID WNT SIGNALING PATHWAY | Wnt signaling network |
| 0.1 | 1.9 | PID UPA UPAR PATHWAY | Urokinase-type plasminogen activator (uPA) and uPAR-mediated signaling |
| 0.1 | 4.6 | PID TRKR PATHWAY | Neurotrophic factor-mediated Trk receptor signaling |
| 0.1 | 1.3 | PID PRL SIGNALING EVENTS PATHWAY | Signaling events mediated by PRL |
| 0.1 | 3.2 | PID RHOA PATHWAY | RhoA signaling pathway |
| 0.1 | 1.3 | PID ARF 3PATHWAY | Arf1 pathway |
| 0.1 | 2.2 | PID IL2 1PATHWAY | IL2-mediated signaling events |
| 0.1 | 0.6 | PID REELIN PATHWAY | Reelin signaling pathway |
| 0.1 | 3.9 | PID HNF3A PATHWAY | FOXA1 transcription factor network |
| 0.1 | 1.4 | PID RET PATHWAY | Signaling events regulated by Ret tyrosine kinase |
| 0.0 | 9.0 | NABA ECM GLYCOPROTEINS | Genes encoding structural ECM glycoproteins |
| 0.0 | 0.9 | PID IFNG PATHWAY | IFN-gamma pathway |
| 0.0 | 0.9 | PID IL2 STAT5 PATHWAY | IL2 signaling events mediated by STAT5 |
| 0.0 | 1.1 | SA MMP CYTOKINE CONNECTION | Cytokines can induce activation of matrix metalloproteinases, which degrade extracellular matrix. |
| 0.0 | 0.6 | PID ERBB1 RECEPTOR PROXIMAL PATHWAY | EGF receptor (ErbB1) signaling pathway |
| 0.0 | 1.0 | PID EPHRINB REV PATHWAY | Ephrin B reverse signaling |
| 0.0 | 1.6 | PID HIF2PATHWAY | HIF-2-alpha transcription factor network |
| 0.0 | 1.4 | PID ERBB1 INTERNALIZATION PATHWAY | Internalization of ErbB1 |
| 0.0 | 1.8 | PID P38 ALPHA BETA DOWNSTREAM PATHWAY | Signaling mediated by p38-alpha and p38-beta |
| 0.0 | 1.7 | SIG CHEMOTAXIS | Genes related to chemotaxis |
| 0.0 | 0.3 | PID ERB GENOMIC PATHWAY | Validated nuclear estrogen receptor beta network |
| 0.0 | 0.9 | PID FOXO PATHWAY | FoxO family signaling |
| 0.0 | 0.4 | PID P38 MK2 PATHWAY | p38 signaling mediated by MAPKAP kinases |
| 0.0 | 0.6 | PID BETA CATENIN DEG PATHWAY | Degradation of beta catenin |
| 0.0 | 0.6 | PID IL8 CXCR2 PATHWAY | IL8- and CXCR2-mediated signaling events |
| 0.0 | 1.7 | PID MTOR 4PATHWAY | mTOR signaling pathway |
| 0.0 | 0.2 | PID INTEGRIN3 PATHWAY | Beta3 integrin cell surface interactions |
| 0.0 | 0.6 | PID CASPASE PATHWAY | Caspase cascade in apoptosis |
| 0.0 | 0.1 | PID NFKAPPAB ATYPICAL PATHWAY | Atypical NF-kappaB pathway |
| 0.0 | 0.4 | ST DIFFERENTIATION PATHWAY IN PC12 CELLS | Differentiation Pathway in PC12 Cells; this is a specific case of PAC1 Receptor Pathway. |
| 0.0 | 0.2 | PID LPA4 PATHWAY | LPA4-mediated signaling events |
| 0.0 | 3.0 | NABA ECM AFFILIATED | Genes encoding proteins affiliated structurally or functionally to extracellular matrix proteins |
| 0.0 | 0.3 | PID ATF2 PATHWAY | ATF-2 transcription factor network |
| 0.0 | 0.2 | PID IL27 PATHWAY | IL27-mediated signaling events |
| 0.0 | 0.7 | PID CD8 TCR DOWNSTREAM PATHWAY | Downstream signaling in naïve CD8+ T cells |
| 0.0 | 0.5 | PID LIS1 PATHWAY | Lissencephaly gene (LIS1) in neuronal migration and development |
| 0.0 | 0.4 | PID CONE PATHWAY | Visual signal transduction: Cones |
| 0.0 | 0.3 | ST MYOCYTE AD PATHWAY | Myocyte Adrenergic Pathway is a specific case of the generalized Adrenergic Pathway. |
| 0.0 | 0.5 | PID AVB3 INTEGRIN PATHWAY | Integrins in angiogenesis |
| 0.0 | 1.1 | PID PDGFRB PATHWAY | PDGFR-beta signaling pathway |
| 0.0 | 0.5 | PID AJDISS 2PATHWAY | Posttranslational regulation of adherens junction stability and dissassembly |
| 0.0 | 0.3 | PID CDC42 PATHWAY | CDC42 signaling events |
| 0.0 | 0.2 | PID AURORA A PATHWAY | Aurora A signaling |
| 0.0 | 0.3 | PID FOXM1 PATHWAY | FOXM1 transcription factor network |
| 0.0 | 0.2 | PID P38 MKK3 6PATHWAY | p38 MAPK signaling pathway |
Gene overrepresentation in molecular_function category:
| Log-likelihood per target | Total log-likelihood | Term | Description |
|---|---|---|---|
| 0.8 | 3.1 | GO:0004667 | prostaglandin-D synthase activity(GO:0004667) |
| 0.7 | 2.7 | GO:0008449 | N-acetylglucosamine-6-sulfatase activity(GO:0008449) |
| 0.6 | 1.9 | GO:0070052 | collagen V binding(GO:0070052) |
| 0.6 | 4.2 | GO:0016015 | morphogen activity(GO:0016015) |
| 0.6 | 3.6 | GO:1990254 | keratin filament binding(GO:1990254) |
| 0.6 | 1.7 | GO:0070320 | inward rectifier potassium channel inhibitor activity(GO:0070320) |
| 0.5 | 2.2 | GO:0008112 | nicotinamide N-methyltransferase activity(GO:0008112) pyridine N-methyltransferase activity(GO:0030760) |
| 0.5 | 4.3 | GO:0019215 | intermediate filament binding(GO:0019215) |
| 0.4 | 1.2 | GO:0051538 | 3 iron, 4 sulfur cluster binding(GO:0051538) |
| 0.4 | 2.8 | GO:0004459 | lactate dehydrogenase activity(GO:0004457) L-lactate dehydrogenase activity(GO:0004459) |
| 0.4 | 1.6 | GO:0016361 | activin receptor activity, type I(GO:0016361) |
| 0.4 | 4.3 | GO:0030274 | LIM domain binding(GO:0030274) |
| 0.4 | 2.6 | GO:0048408 | epidermal growth factor binding(GO:0048408) |
| 0.3 | 2.0 | GO:0008269 | JAK pathway signal transduction adaptor activity(GO:0008269) |
| 0.3 | 1.0 | GO:0086062 | voltage-gated sodium channel activity involved in Purkinje myocyte action potential(GO:0086062) |
| 0.3 | 1.0 | GO:0031896 | V2 vasopressin receptor binding(GO:0031896) |
| 0.3 | 1.3 | GO:0004074 | biliverdin reductase activity(GO:0004074) |
| 0.3 | 1.9 | GO:0004741 | [pyruvate dehydrogenase (lipoamide)] phosphatase activity(GO:0004741) |
| 0.3 | 1.5 | GO:0004830 | tryptophan-tRNA ligase activity(GO:0004830) |
| 0.3 | 3.1 | GO:0015266 | protein channel activity(GO:0015266) |
| 0.3 | 1.7 | GO:0019776 | Atg8 ligase activity(GO:0019776) |
| 0.3 | 3.3 | GO:0004017 | adenylate kinase activity(GO:0004017) |
| 0.3 | 0.8 | GO:0004040 | amidase activity(GO:0004040) |
| 0.2 | 1.5 | GO:0008568 | microtubule-severing ATPase activity(GO:0008568) |
| 0.2 | 0.2 | GO:0005041 | low-density lipoprotein receptor activity(GO:0005041) |
| 0.2 | 1.5 | GO:0004614 | phosphoglucomutase activity(GO:0004614) |
| 0.2 | 6.8 | GO:0005212 | structural constituent of eye lens(GO:0005212) |
| 0.2 | 1.4 | GO:0005134 | interleukin-2 receptor binding(GO:0005134) |
| 0.2 | 1.9 | GO:0030023 | extracellular matrix constituent conferring elasticity(GO:0030023) |
| 0.2 | 1.2 | GO:0004656 | procollagen-proline 4-dioxygenase activity(GO:0004656) procollagen-proline dioxygenase activity(GO:0019798) |
| 0.2 | 2.3 | GO:0008607 | phosphorylase kinase regulator activity(GO:0008607) |
| 0.2 | 1.6 | GO:0070492 | oligosaccharide binding(GO:0070492) |
| 0.2 | 1.1 | GO:0015087 | cadmium ion transmembrane transporter activity(GO:0015086) cobalt ion transmembrane transporter activity(GO:0015087) lead ion transmembrane transporter activity(GO:0015094) ferrous iron uptake transmembrane transporter activity(GO:0015639) |
| 0.2 | 2.0 | GO:0001875 | lipopolysaccharide receptor activity(GO:0001875) |
| 0.2 | 2.0 | GO:0016721 | superoxide dismutase activity(GO:0004784) oxidoreductase activity, acting on superoxide radicals as acceptor(GO:0016721) |
| 0.2 | 0.9 | GO:0035374 | chondroitin sulfate binding(GO:0035374) |
| 0.2 | 0.7 | GO:0003924 | GTPase activity(GO:0003924) |
| 0.2 | 0.9 | GO:0004142 | diacylglycerol cholinephosphotransferase activity(GO:0004142) |
| 0.2 | 5.4 | GO:0043395 | heparan sulfate proteoglycan binding(GO:0043395) |
| 0.2 | 1.3 | GO:0004471 | malate dehydrogenase (decarboxylating) (NAD+) activity(GO:0004471) malate dehydrogenase (decarboxylating) (NADP+) activity(GO:0004473) oxaloacetate decarboxylase activity(GO:0008948) |
| 0.2 | 13.7 | GO:0050840 | extracellular matrix binding(GO:0050840) |
| 0.2 | 1.0 | GO:0043120 | tumor necrosis factor binding(GO:0043120) |
| 0.2 | 2.0 | GO:0089720 | caspase binding(GO:0089720) |
| 0.2 | 1.2 | GO:0102336 | fatty acid elongase activity(GO:0009922) 3-oxo-arachidoyl-CoA synthase activity(GO:0102336) 3-oxo-cerotoyl-CoA synthase activity(GO:0102337) 3-oxo-lignoceronyl-CoA synthase activity(GO:0102338) |
| 0.2 | 1.0 | GO:0031962 | mineralocorticoid receptor binding(GO:0031962) |
| 0.2 | 1.2 | GO:0004800 | thyroxine 5'-deiodinase activity(GO:0004800) |
| 0.2 | 2.3 | GO:0031821 | G-protein coupled serotonin receptor binding(GO:0031821) |
| 0.2 | 1.7 | GO:0038085 | vascular endothelial growth factor binding(GO:0038085) |
| 0.2 | 0.2 | GO:0031996 | thioesterase binding(GO:0031996) |
| 0.2 | 1.0 | GO:0072320 | volume-sensitive chloride channel activity(GO:0072320) |
| 0.2 | 0.5 | GO:0035379 | carbon dioxide transmembrane transporter activity(GO:0035379) |
| 0.2 | 0.8 | GO:0015193 | L-proline transmembrane transporter activity(GO:0015193) |
| 0.2 | 0.5 | GO:0034714 | type III transforming growth factor beta receptor binding(GO:0034714) |
| 0.2 | 2.1 | GO:0005344 | oxygen transporter activity(GO:0005344) |
| 0.2 | 0.5 | GO:0070984 | SET domain binding(GO:0070984) |
| 0.2 | 0.8 | GO:0047237 | glucuronylgalactosylproteoglycan 4-beta-N-acetylgalactosaminyltransferase activity(GO:0047237) |
| 0.1 | 0.9 | GO:0010858 | calcium-dependent protein kinase regulator activity(GO:0010858) |
| 0.1 | 0.7 | GO:0048039 | ubiquinone binding(GO:0048039) |
| 0.1 | 0.4 | GO:0001069 | regulatory region RNA binding(GO:0001069) |
| 0.1 | 0.5 | GO:0005026 | transforming growth factor beta receptor activity, type II(GO:0005026) |
| 0.1 | 2.9 | GO:0051371 | muscle alpha-actinin binding(GO:0051371) |
| 0.1 | 0.4 | GO:0004515 | nicotinate-nucleotide adenylyltransferase activity(GO:0004515) |
| 0.1 | 0.5 | GO:0047708 | biotinidase activity(GO:0047708) |
| 0.1 | 0.5 | GO:0030899 | calcium-dependent ATPase activity(GO:0030899) |
| 0.1 | 0.5 | GO:0015254 | glycerol channel activity(GO:0015254) |
| 0.1 | 0.6 | GO:0008597 | calcium-dependent protein serine/threonine phosphatase regulator activity(GO:0008597) |
| 0.1 | 0.5 | GO:0000179 | rRNA (adenine-N6,N6-)-dimethyltransferase activity(GO:0000179) |
| 0.1 | 0.6 | GO:0052740 | 1-acyl-2-lysophosphatidylserine acylhydrolase activity(GO:0052740) |
| 0.1 | 0.5 | GO:0030172 | troponin C binding(GO:0030172) |
| 0.1 | 0.3 | GO:0032089 | NACHT domain binding(GO:0032089) |
| 0.1 | 0.3 | GO:0003854 | 3-beta-hydroxy-delta5-steroid dehydrogenase activity(GO:0003854) steroid delta-isomerase activity(GO:0004769) |
| 0.1 | 0.9 | GO:0004111 | creatine kinase activity(GO:0004111) |
| 0.1 | 0.3 | GO:0017098 | sulfonylurea receptor binding(GO:0017098) |
| 0.1 | 0.3 | GO:1904288 | BAT3 complex binding(GO:1904288) |
| 0.1 | 0.6 | GO:0031013 | troponin I binding(GO:0031013) |
| 0.1 | 1.3 | GO:1990239 | steroid hormone binding(GO:1990239) |
| 0.1 | 9.4 | GO:0005201 | extracellular matrix structural constituent(GO:0005201) |
| 0.1 | 0.5 | GO:0031697 | beta-1 adrenergic receptor binding(GO:0031697) |
| 0.1 | 0.5 | GO:0032795 | heterotrimeric G-protein binding(GO:0032795) |
| 0.1 | 1.0 | GO:0045159 | myosin II binding(GO:0045159) |
| 0.1 | 0.4 | GO:0004727 | prenylated protein tyrosine phosphatase activity(GO:0004727) |
| 0.1 | 0.2 | GO:0008235 | metalloexopeptidase activity(GO:0008235) |
| 0.1 | 0.3 | GO:0004878 | complement component C5a receptor activity(GO:0004878) |
| 0.1 | 0.4 | GO:0031871 | proteinase activated receptor binding(GO:0031871) |
| 0.1 | 8.1 | GO:0008307 | structural constituent of muscle(GO:0008307) |
| 0.1 | 0.9 | GO:0004689 | phosphorylase kinase activity(GO:0004689) |
| 0.1 | 1.0 | GO:0005049 | nuclear export signal receptor activity(GO:0005049) |
| 0.1 | 1.0 | GO:0039706 | co-receptor binding(GO:0039706) |
| 0.1 | 0.6 | GO:0004430 | 1-phosphatidylinositol 4-kinase activity(GO:0004430) |
| 0.1 | 4.8 | GO:0005518 | collagen binding(GO:0005518) |
| 0.1 | 4.1 | GO:0004864 | protein phosphatase inhibitor activity(GO:0004864) |
| 0.1 | 0.3 | GO:0042134 | rRNA primary transcript binding(GO:0042134) |
| 0.1 | 0.2 | GO:0016532 | superoxide dismutase copper chaperone activity(GO:0016532) |
| 0.1 | 1.1 | GO:0045294 | alpha-catenin binding(GO:0045294) |
| 0.1 | 0.3 | GO:0004958 | prostaglandin F receptor activity(GO:0004958) |
| 0.1 | 0.7 | GO:0008379 | thioredoxin peroxidase activity(GO:0008379) |
| 0.1 | 0.4 | GO:0016520 | growth hormone-releasing hormone receptor activity(GO:0016520) |
| 0.1 | 0.3 | GO:0042954 | lipoprotein transporter activity(GO:0042954) |
| 0.1 | 3.5 | GO:0001972 | retinoic acid binding(GO:0001972) |
| 0.1 | 0.9 | GO:0036402 | proteasome-activating ATPase activity(GO:0036402) |
| 0.1 | 1.7 | GO:0008191 | metalloendopeptidase inhibitor activity(GO:0008191) |
| 0.1 | 1.0 | GO:0052658 | inositol-1,4,5-trisphosphate 5-phosphatase activity(GO:0052658) |
| 0.1 | 1.1 | GO:0005132 | type I interferon receptor binding(GO:0005132) |
| 0.1 | 4.2 | GO:0008137 | NADH dehydrogenase (ubiquinone) activity(GO:0008137) NADH dehydrogenase (quinone) activity(GO:0050136) |
| 0.1 | 0.1 | GO:0010698 | acetyltransferase activator activity(GO:0010698) |
| 0.1 | 0.4 | GO:0008479 | queuine tRNA-ribosyltransferase activity(GO:0008479) |
| 0.1 | 0.4 | GO:0008240 | tripeptidyl-peptidase activity(GO:0008240) |
| 0.1 | 1.3 | GO:0008093 | cytoskeletal adaptor activity(GO:0008093) |
| 0.1 | 0.1 | GO:0050501 | hyaluronan synthase activity(GO:0050501) |
| 0.1 | 0.5 | GO:0031726 | CCR1 chemokine receptor binding(GO:0031726) |
| 0.1 | 0.4 | GO:0032190 | acrosin binding(GO:0032190) |
| 0.1 | 1.9 | GO:0032266 | phosphatidylinositol-3-phosphate binding(GO:0032266) |
| 0.1 | 0.2 | GO:0004797 | thymidine kinase activity(GO:0004797) |
| 0.1 | 0.3 | GO:0016509 | long-chain-3-hydroxyacyl-CoA dehydrogenase activity(GO:0016509) |
| 0.1 | 0.4 | GO:0004118 | cGMP-stimulated cyclic-nucleotide phosphodiesterase activity(GO:0004118) |
| 0.1 | 0.5 | GO:0008565 | protein transporter activity(GO:0008565) |
| 0.1 | 1.4 | GO:0045504 | dynein heavy chain binding(GO:0045504) |
| 0.1 | 0.3 | GO:0005105 | type 1 fibroblast growth factor receptor binding(GO:0005105) |
| 0.1 | 0.2 | GO:0016418 | S-acetyltransferase activity(GO:0016418) |
| 0.1 | 0.3 | GO:0008823 | cupric reductase activity(GO:0008823) ferric-chelate reductase (NADPH) activity(GO:0052851) |
| 0.1 | 0.7 | GO:0031995 | insulin-like growth factor II binding(GO:0031995) |
| 0.1 | 1.8 | GO:0042056 | chemoattractant activity(GO:0042056) |
| 0.1 | 0.2 | GO:0004833 | tryptophan 2,3-dioxygenase activity(GO:0004833) |
| 0.1 | 0.4 | GO:0061649 | ubiquitinated histone binding(GO:0061649) |
| 0.1 | 0.6 | GO:0032036 | myosin heavy chain binding(GO:0032036) |
| 0.1 | 1.9 | GO:0004602 | glutathione peroxidase activity(GO:0004602) |
| 0.1 | 0.3 | GO:0005375 | copper ion transmembrane transporter activity(GO:0005375) |
| 0.1 | 1.1 | GO:0035615 | clathrin adaptor activity(GO:0035615) endocytic adaptor activity(GO:0098748) |
| 0.1 | 0.7 | GO:0055131 | C3HC4-type RING finger domain binding(GO:0055131) |
| 0.1 | 0.2 | GO:0001968 | fibronectin binding(GO:0001968) |
| 0.1 | 0.3 | GO:0010465 | nerve growth factor receptor activity(GO:0010465) |
| 0.1 | 0.3 | GO:1904929 | coreceptor activity involved in Wnt signaling pathway, planar cell polarity pathway(GO:1904929) |
| 0.1 | 0.4 | GO:0061575 | cyclin-dependent protein serine/threonine kinase activator activity(GO:0061575) |
| 0.1 | 0.2 | GO:0050509 | N-acetylglucosaminyl-proteoglycan 4-beta-glucuronosyltransferase activity(GO:0050509) |
| 0.1 | 0.5 | GO:0016888 | endodeoxyribonuclease activity, producing 5'-phosphomonoesters(GO:0016888) |
| 0.1 | 0.2 | GO:0018685 | alkane 1-monooxygenase activity(GO:0018685) |
| 0.1 | 0.3 | GO:0060961 | phospholipase D inhibitor activity(GO:0060961) |
| 0.1 | 0.7 | GO:0001087 | transcription factor activity, sequence-specific DNA binding, RNA polymerase recruiting(GO:0001011) transcription factor activity, TFIIB-class binding(GO:0001087) |
| 0.1 | 0.8 | GO:1990381 | ubiquitin-specific protease binding(GO:1990381) |
| 0.1 | 1.3 | GO:0005086 | ARF guanyl-nucleotide exchange factor activity(GO:0005086) |
| 0.1 | 0.2 | GO:0004466 | long-chain-acyl-CoA dehydrogenase activity(GO:0004466) |
| 0.1 | 0.9 | GO:0043522 | leucine zipper domain binding(GO:0043522) |
| 0.1 | 0.3 | GO:0005157 | macrophage colony-stimulating factor receptor binding(GO:0005157) |
| 0.1 | 0.2 | GO:1904455 | ubiquitin-specific protease activity involved in negative regulation of ERAD pathway(GO:1904455) |
| 0.0 | 0.7 | GO:0019707 | protein-cysteine S-palmitoyltransferase activity(GO:0019706) protein-cysteine S-acyltransferase activity(GO:0019707) |
| 0.0 | 1.1 | GO:0070001 | aspartic-type endopeptidase activity(GO:0004190) aspartic-type peptidase activity(GO:0070001) |
| 0.0 | 0.1 | GO:0033867 | Fas-activated serine/threonine kinase activity(GO:0033867) |
| 0.0 | 3.5 | GO:0030971 | receptor tyrosine kinase binding(GO:0030971) |
| 0.0 | 0.2 | GO:0031728 | CCR3 chemokine receptor binding(GO:0031728) |
| 0.0 | 1.3 | GO:0005031 | tumor necrosis factor-activated receptor activity(GO:0005031) death receptor activity(GO:0005035) |
| 0.0 | 0.2 | GO:0004782 | sulfinoalanine decarboxylase activity(GO:0004782) |
| 0.0 | 0.8 | GO:0008510 | sodium:bicarbonate symporter activity(GO:0008510) |
| 0.0 | 1.3 | GO:0005527 | macrolide binding(GO:0005527) FK506 binding(GO:0005528) |
| 0.0 | 0.9 | GO:0042813 | Wnt-activated receptor activity(GO:0042813) |
| 0.0 | 0.5 | GO:0000774 | adenyl-nucleotide exchange factor activity(GO:0000774) |
| 0.0 | 0.2 | GO:0004966 | galanin receptor activity(GO:0004966) |
| 0.0 | 1.2 | GO:0070182 | DNA polymerase binding(GO:0070182) |
| 0.0 | 0.2 | GO:0052812 | phosphatidylinositol-3,4-bisphosphate 5-kinase activity(GO:0052812) |
| 0.0 | 0.2 | GO:0019855 | calcium channel inhibitor activity(GO:0019855) |
| 0.0 | 0.1 | GO:0004775 | succinate-CoA ligase (ADP-forming) activity(GO:0004775) |
| 0.0 | 2.0 | GO:0044769 | ATPase activity, coupled to transmembrane movement of ions, rotational mechanism(GO:0044769) |
| 0.0 | 0.5 | GO:0008253 | 5'-nucleotidase activity(GO:0008253) |
| 0.0 | 0.2 | GO:0005078 | MAP-kinase scaffold activity(GO:0005078) |
| 0.0 | 0.2 | GO:0015297 | antiporter activity(GO:0015297) |
| 0.0 | 6.0 | GO:0008201 | heparin binding(GO:0008201) |
| 0.0 | 0.2 | GO:0004668 | protein-arginine deiminase activity(GO:0004668) |
| 0.0 | 1.0 | GO:0004383 | guanylate cyclase activity(GO:0004383) |
| 0.0 | 0.3 | GO:0015280 | ligand-gated sodium channel activity(GO:0015280) |
| 0.0 | 1.6 | GO:0004950 | G-protein coupled chemoattractant receptor activity(GO:0001637) chemokine receptor activity(GO:0004950) |
| 0.0 | 0.3 | GO:0098599 | palmitoyl-(protein) hydrolase activity(GO:0008474) palmitoyl hydrolase activity(GO:0098599) |
| 0.0 | 1.3 | GO:0044183 | protein binding involved in protein folding(GO:0044183) |
| 0.0 | 1.3 | GO:0005158 | insulin receptor binding(GO:0005158) |
| 0.0 | 0.2 | GO:0047685 | amine sulfotransferase activity(GO:0047685) |
| 0.0 | 0.6 | GO:0033130 | acetylcholine receptor binding(GO:0033130) |
| 0.0 | 0.8 | GO:0050811 | GABA receptor binding(GO:0050811) |
| 0.0 | 3.2 | GO:0004867 | serine-type endopeptidase inhibitor activity(GO:0004867) |
| 0.0 | 0.2 | GO:0003998 | acylphosphatase activity(GO:0003998) |
| 0.0 | 0.6 | GO:0008432 | JUN kinase binding(GO:0008432) |
| 0.0 | 0.9 | GO:0098641 | cadherin binding involved in cell-cell adhesion(GO:0098641) |
| 0.0 | 0.2 | GO:0019531 | oxalate transmembrane transporter activity(GO:0019531) |
| 0.0 | 1.2 | GO:0004198 | calcium-dependent cysteine-type endopeptidase activity(GO:0004198) |
| 0.0 | 1.1 | GO:0005388 | calcium-transporting ATPase activity(GO:0005388) |
| 0.0 | 0.2 | GO:0036122 | BMP binding(GO:0036122) |
| 0.0 | 2.3 | GO:0001104 | RNA polymerase II transcription cofactor activity(GO:0001104) |
| 0.0 | 0.2 | GO:0034597 | phosphatidylinositol-3,4-bisphosphate 4-phosphatase activity(GO:0016316) inositol-1,3,4-trisphosphate 4-phosphatase activity(GO:0017161) phosphatidylinositol-4,5-bisphosphate 4-phosphatase activity(GO:0034597) inositol-3,4-bisphosphate 4-phosphatase activity(GO:0052828) |
| 0.0 | 0.8 | GO:0030898 | actin-dependent ATPase activity(GO:0030898) |
| 0.0 | 0.3 | GO:0000182 | rDNA binding(GO:0000182) |
| 0.0 | 0.1 | GO:0005350 | pyrimidine nucleobase transmembrane transporter activity(GO:0005350) pyrimidine- and adenine-specific:sodium symporter activity(GO:0015389) |
| 0.0 | 0.1 | GO:0004730 | pseudouridylate synthase activity(GO:0004730) |
| 0.0 | 0.2 | GO:0004468 | lysine N-acetyltransferase activity, acting on acetyl phosphate as donor(GO:0004468) |
| 0.0 | 0.2 | GO:0005143 | interleukin-12 receptor binding(GO:0005143) |
| 0.0 | 0.1 | GO:0000702 | oxidized base lesion DNA N-glycosylase activity(GO:0000702) |
| 0.0 | 0.5 | GO:0004723 | calcium-dependent protein serine/threonine phosphatase activity(GO:0004723) |
| 0.0 | 1.3 | GO:0008536 | Ran GTPase binding(GO:0008536) |
| 0.0 | 0.2 | GO:0016765 | transferase activity, transferring alkyl or aryl (other than methyl) groups(GO:0016765) |
| 0.0 | 1.4 | GO:0070412 | R-SMAD binding(GO:0070412) |
| 0.0 | 0.1 | GO:0004119 | cGMP-inhibited cyclic-nucleotide phosphodiesterase activity(GO:0004119) |
| 0.0 | 1.4 | GO:0070888 | E-box binding(GO:0070888) |
| 0.0 | 0.3 | GO:0019784 | NEDD8-specific protease activity(GO:0019784) |
| 0.0 | 0.2 | GO:0050692 | DBD domain binding(GO:0050692) |
| 0.0 | 0.5 | GO:0035925 | mRNA 3'-UTR AU-rich region binding(GO:0035925) |
| 0.0 | 0.1 | GO:0022850 | serotonin-gated cation channel activity(GO:0022850) |
| 0.0 | 0.3 | GO:0004579 | dolichyl-diphosphooligosaccharide-protein glycotransferase activity(GO:0004579) |
| 0.0 | 0.4 | GO:0004887 | thyroid hormone receptor activity(GO:0004887) |
| 0.0 | 0.1 | GO:0035612 | AP-2 adaptor complex binding(GO:0035612) |
| 0.0 | 0.4 | GO:0016273 | arginine N-methyltransferase activity(GO:0016273) protein-arginine N-methyltransferase activity(GO:0016274) |
| 0.0 | 0.3 | GO:0016857 | racemase and epimerase activity, acting on carbohydrates and derivatives(GO:0016857) |
| 0.0 | 0.1 | GO:0005159 | insulin-like growth factor receptor binding(GO:0005159) |
| 0.0 | 0.1 | GO:0016230 | sphingomyelin phosphodiesterase activator activity(GO:0016230) |
| 0.0 | 0.1 | GO:0004699 | calcium-independent protein kinase C activity(GO:0004699) |
| 0.0 | 0.1 | GO:0015319 | sodium:inorganic phosphate symporter activity(GO:0015319) |
| 0.0 | 0.9 | GO:0036002 | pre-mRNA binding(GO:0036002) |
| 0.0 | 0.8 | GO:0001965 | G-protein alpha-subunit binding(GO:0001965) |
| 0.0 | 0.4 | GO:0032794 | GTPase activating protein binding(GO:0032794) |
| 0.0 | 0.3 | GO:0008429 | phosphatidylethanolamine binding(GO:0008429) |
| 0.0 | 0.2 | GO:0019763 | immunoglobulin receptor activity(GO:0019763) |
| 0.0 | 0.2 | GO:0031014 | troponin T binding(GO:0031014) |
| 0.0 | 0.3 | GO:0005123 | death receptor binding(GO:0005123) |
| 0.0 | 6.3 | GO:0003714 | transcription corepressor activity(GO:0003714) |
| 0.0 | 3.3 | GO:0047485 | protein N-terminus binding(GO:0047485) |
| 0.0 | 0.4 | GO:0008656 | cysteine-type endopeptidase activator activity involved in apoptotic process(GO:0008656) |
| 0.0 | 0.3 | GO:0017166 | vinculin binding(GO:0017166) |
| 0.0 | 1.3 | GO:0004693 | cyclin-dependent protein serine/threonine kinase activity(GO:0004693) |
| 0.0 | 0.5 | GO:0004857 | enzyme inhibitor activity(GO:0004857) |
| 0.0 | 0.2 | GO:0019237 | centromeric DNA binding(GO:0019237) |
| 0.0 | 0.4 | GO:0005385 | zinc ion transmembrane transporter activity(GO:0005385) |
| 0.0 | 0.2 | GO:0017070 | U6 snRNA binding(GO:0017070) |
| 0.0 | 0.3 | GO:0031957 | very long-chain fatty acid-CoA ligase activity(GO:0031957) |
| 0.0 | 0.1 | GO:0033149 | FFAT motif binding(GO:0033149) |
| 0.0 | 0.1 | GO:0005477 | pyruvate secondary active transmembrane transporter activity(GO:0005477) |
| 0.0 | 1.9 | GO:0005089 | Rho guanyl-nucleotide exchange factor activity(GO:0005089) |
| 0.0 | 0.1 | GO:0071535 | RING-like zinc finger domain binding(GO:0071535) |
| 0.0 | 0.2 | GO:0070679 | inositol 1,4,5 trisphosphate binding(GO:0070679) |
| 0.0 | 0.6 | GO:0001848 | complement binding(GO:0001848) |
| 0.0 | 0.2 | GO:0004957 | prostaglandin E receptor activity(GO:0004957) |
| 0.0 | 0.2 | GO:0015174 | basic amino acid transmembrane transporter activity(GO:0015174) |
| 0.0 | 0.4 | GO:0005003 | ephrin receptor activity(GO:0005003) |
| 0.0 | 0.3 | GO:0008484 | sulfuric ester hydrolase activity(GO:0008484) |
| 0.0 | 1.2 | GO:0048306 | calcium-dependent protein binding(GO:0048306) |
| 0.0 | 0.1 | GO:0016744 | transferase activity, transferring aldehyde or ketonic groups(GO:0016744) |
| 0.0 | 1.3 | GO:0015171 | amino acid transmembrane transporter activity(GO:0015171) |
| 0.0 | 0.3 | GO:0004691 | cAMP-dependent protein kinase activity(GO:0004691) |
| 0.0 | 1.7 | GO:0004896 | cytokine receptor activity(GO:0004896) |
| 0.0 | 0.2 | GO:0000980 | RNA polymerase II distal enhancer sequence-specific DNA binding(GO:0000980) |
| 0.0 | 0.2 | GO:0031419 | cobalamin binding(GO:0031419) |
| 0.0 | 0.0 | GO:0005260 | channel-conductance-controlling ATPase activity(GO:0005260) |
| 0.0 | 0.4 | GO:0042169 | SH2 domain binding(GO:0042169) |
| 0.0 | 0.1 | GO:0032396 | inhibitory MHC class I receptor activity(GO:0032396) |
| 0.0 | 0.4 | GO:0005521 | lamin binding(GO:0005521) |
| 0.0 | 0.1 | GO:0016714 | oxidoreductase activity, acting on paired donors, with incorporation or reduction of molecular oxygen, reduced pteridine as one donor, and incorporation of one atom of oxygen(GO:0016714) |
| 0.0 | 0.3 | GO:0015035 | protein disulfide oxidoreductase activity(GO:0015035) |
| 0.0 | 0.1 | GO:0048156 | tau protein binding(GO:0048156) |
| 0.0 | 0.1 | GO:0070095 | fructose-6-phosphate binding(GO:0070095) |
| 0.0 | 0.1 | GO:0008073 | ornithine decarboxylase inhibitor activity(GO:0008073) |
| 0.0 | 0.1 | GO:0052846 | endopolyphosphatase activity(GO:0000298) diphosphoinositol-polyphosphate diphosphatase activity(GO:0008486) bis(5'-adenosyl)-hexaphosphatase activity(GO:0034431) bis(5'-adenosyl)-pentaphosphatase activity(GO:0034432) inositol diphosphate tetrakisphosphate diphosphatase activity(GO:0052840) inositol bisdiphosphate tetrakisphosphate diphosphatase activity(GO:0052841) inositol diphosphate pentakisphosphate diphosphatase activity(GO:0052842) inositol-1-diphosphate-2,3,4,5,6-pentakisphosphate diphosphatase activity(GO:0052843) inositol-3-diphosphate-1,2,4,5,6-pentakisphosphate diphosphatase activity(GO:0052844) inositol-5-diphosphate-1,2,3,4,6-pentakisphosphate diphosphatase activity(GO:0052845) inositol-1,5-bisdiphosphate-2,3,4,6-tetrakisphosphate 1-diphosphatase activity(GO:0052846) inositol-1,5-bisdiphosphate-2,3,4,6-tetrakisphosphate 5-diphosphatase activity(GO:0052847) inositol-3,5-bisdiphosphate-2,3,4,6-tetrakisphosphate 5-diphosphatase activity(GO:0052848) |
| 0.0 | 0.2 | GO:0051087 | chaperone binding(GO:0051087) |
| 0.0 | 0.4 | GO:0043531 | ADP binding(GO:0043531) |
| 0.0 | 0.5 | GO:0001784 | phosphotyrosine binding(GO:0001784) |
| 0.0 | 0.1 | GO:0035381 | extracellular ATP-gated cation channel activity(GO:0004931) ATP-gated ion channel activity(GO:0035381) |
| 0.0 | 1.3 | GO:0005178 | integrin binding(GO:0005178) |
| 0.0 | 0.4 | GO:0004364 | glutathione transferase activity(GO:0004364) |
| 0.0 | 0.3 | GO:0005251 | delayed rectifier potassium channel activity(GO:0005251) |
| 0.0 | 0.1 | GO:0019864 | IgG binding(GO:0019864) |
| 0.0 | 0.2 | GO:0035198 | miRNA binding(GO:0035198) |
| 0.0 | 0.1 | GO:0051021 | GDP-dissociation inhibitor binding(GO:0051021) Rho GDP-dissociation inhibitor binding(GO:0051022) |
| 0.0 | 0.1 | GO:0034185 | apolipoprotein binding(GO:0034185) |
| 0.0 | 0.1 | GO:0043225 | anion transmembrane-transporting ATPase activity(GO:0043225) |
| 0.0 | 0.1 | GO:0000340 | RNA 7-methylguanosine cap binding(GO:0000340) |
| 0.0 | 0.1 | GO:0003831 | beta-N-acetylglucosaminylglycopeptide beta-1,4-galactosyltransferase activity(GO:0003831) |
| 0.0 | 0.1 | GO:0004977 | melanocortin receptor activity(GO:0004977) |
| 0.0 | 0.8 | GO:0035591 | signaling adaptor activity(GO:0035591) |
| 0.0 | 0.2 | GO:0004062 | aryl sulfotransferase activity(GO:0004062) |