Project
ENCODE cell lines, expression (Ernst 2011)
Navigation
Downloads
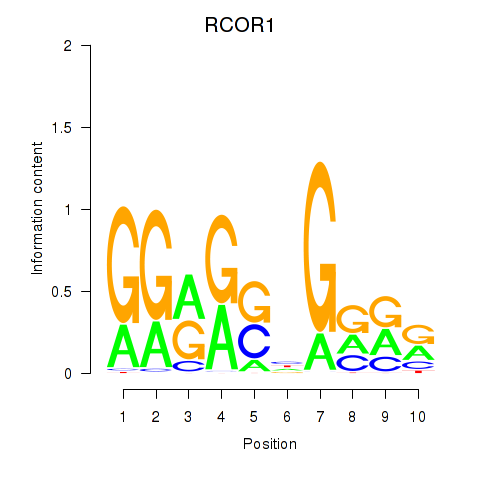
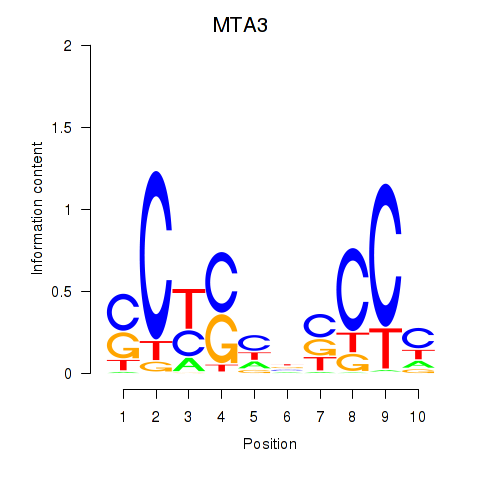
Results for RCOR1_MTA3
Z-value: 2.17
Motif logo
Transcription factors associated with RCOR1_MTA3
| Gene Symbol | Gene ID | Gene Info |
|---|---|---|
|
RCOR1
|
ENSG00000089902.8 | RCOR1 |
|
MTA3
|
ENSG00000057935.9 | MTA3 |
Activity-expression correlation:
| Gene | Promoter | Pearson corr. coef. | P-value | Plot |
|---|---|---|---|---|
| RCOR1 | hg19_v2_chr14_+_103058948_103059005 | 0.12 | 6.6e-01 | Click! |
Activity profile of RCOR1_MTA3 motif
Sorted Z-values of RCOR1_MTA3 motif
Network of associatons between targets according to the STRING database.

First level regulatory network of RCOR1_MTA3
| Promoter | Score | Transcript | Gene | Gene Info |
|---|---|---|---|---|
| chr11_-_12030629 | 12.27 |
ENST00000396505.2 |
DKK3 |
dickkopf WNT signaling pathway inhibitor 3 |
| chr8_+_54793425 | 11.37 |
ENST00000522225.1 |
RGS20 |
regulator of G-protein signaling 20 |
| chr14_-_105420241 | 11.28 |
ENST00000557457.1 |
AHNAK2 |
AHNAK nucleoprotein 2 |
| chr19_-_51504852 | 10.62 |
ENST00000391806.2 ENST00000347619.4 ENST00000291726.7 ENST00000320838.5 |
KLK8 |
kallikrein-related peptidase 8 |
| chr8_+_54793454 | 10.61 |
ENST00000276500.4 |
RGS20 |
regulator of G-protein signaling 20 |
| chr19_+_35609380 | 10.35 |
ENST00000604621.1 |
FXYD3 |
FXYD domain containing ion transport regulator 3 |
| chr5_-_127873659 | 9.83 |
ENST00000262464.4 |
FBN2 |
fibrillin 2 |
| chr19_+_35645618 | 9.81 |
ENST00000392218.2 ENST00000543307.1 ENST00000392219.2 ENST00000541435.2 ENST00000590686.1 ENST00000342879.3 ENST00000588699.1 |
FXYD5 |
FXYD domain containing ion transport regulator 5 |
| chr7_-_93519471 | 9.69 |
ENST00000451238.1 |
TFPI2 |
tissue factor pathway inhibitor 2 |
| chr19_+_35645817 | 9.65 |
ENST00000423817.3 |
FXYD5 |
FXYD domain containing ion transport regulator 5 |
| chr19_-_51504411 | 9.32 |
ENST00000593490.1 |
KLK8 |
kallikrein-related peptidase 8 |
| chr11_-_12030905 | 9.30 |
ENST00000326932.4 |
DKK3 |
dickkopf WNT signaling pathway inhibitor 3 |
| chr15_+_101420028 | 9.06 |
ENST00000557963.1 ENST00000346623.6 |
ALDH1A3 |
aldehyde dehydrogenase 1 family, member A3 |
| chr19_-_51456344 | 9.05 |
ENST00000336334.3 ENST00000593428.1 |
KLK5 |
kallikrein-related peptidase 5 |
| chr10_+_88728189 | 8.77 |
ENST00000416348.1 |
ADIRF |
adipogenesis regulatory factor |
| chr7_+_116165754 | 8.45 |
ENST00000405348.1 |
CAV1 |
caveolin 1, caveolae protein, 22kDa |
| chr10_-_126849068 | 8.30 |
ENST00000494626.2 ENST00000337195.5 |
CTBP2 |
C-terminal binding protein 2 |
| chr19_-_51456321 | 8.23 |
ENST00000391809.2 |
KLK5 |
kallikrein-related peptidase 5 |
| chr10_-_126849588 | 7.98 |
ENST00000411419.2 |
CTBP2 |
C-terminal binding protein 2 |
| chr7_+_116166331 | 7.91 |
ENST00000393468.1 ENST00000393467.1 |
CAV1 |
caveolin 1, caveolae protein, 22kDa |
| chr17_-_39928106 | 7.86 |
ENST00000540235.1 |
JUP |
junction plakoglobin |
| chr12_+_6309517 | 7.41 |
ENST00000382519.4 ENST00000009180.4 |
CD9 |
CD9 molecule |
| chr18_+_21269556 | 7.12 |
ENST00000399516.3 |
LAMA3 |
laminin, alpha 3 |
| chr1_+_35247859 | 7.08 |
ENST00000373362.3 |
GJB3 |
gap junction protein, beta 3, 31kDa |
| chr19_+_48281803 | 7.07 |
ENST00000601048.1 |
SEPW1 |
selenoprotein W, 1 |
| chr19_-_51487071 | 7.02 |
ENST00000391807.1 ENST00000593904.1 |
KLK7 |
kallikrein-related peptidase 7 |
| chr19_-_51487282 | 7.02 |
ENST00000595820.1 ENST00000597707.1 ENST00000336317.4 |
KLK7 |
kallikrein-related peptidase 7 |
| chr18_+_21269404 | 7.01 |
ENST00000313654.9 |
LAMA3 |
laminin, alpha 3 |
| chr4_+_4388805 | 7.00 |
ENST00000504171.1 |
NSG1 |
Homo sapiens neuron specific gene family member 1 (NSG1), transcript variant 3, mRNA. |
| chr19_+_48281928 | 6.98 |
ENST00000593892.1 |
SEPW1 |
selenoprotein W, 1 |
| chr21_-_28217721 | 6.91 |
ENST00000284984.3 |
ADAMTS1 |
ADAM metallopeptidase with thrombospondin type 1 motif, 1 |
| chr1_-_153538292 | 6.90 |
ENST00000497140.1 ENST00000368708.3 |
S100A2 |
S100 calcium binding protein A2 |
| chr11_+_35160709 | 6.69 |
ENST00000415148.2 ENST00000433354.2 ENST00000449691.2 ENST00000437706.2 ENST00000360158.4 ENST00000428726.2 ENST00000526669.2 ENST00000433892.2 ENST00000278386.6 ENST00000434472.2 ENST00000352818.4 ENST00000442151.2 |
CD44 |
CD44 molecule (Indian blood group) |
| chr7_+_116139744 | 6.65 |
ENST00000343213.2 |
CAV2 |
caveolin 2 |
| chr8_+_31497271 | 6.63 |
ENST00000520407.1 |
NRG1 |
neuregulin 1 |
| chr2_-_235405679 | 6.44 |
ENST00000390645.2 |
ARL4C |
ADP-ribosylation factor-like 4C |
| chr19_-_51522955 | 6.43 |
ENST00000358789.3 |
KLK10 |
kallikrein-related peptidase 10 |
| chr12_-_21810726 | 6.37 |
ENST00000396076.1 |
LDHB |
lactate dehydrogenase B |
| chr19_+_35606692 | 6.27 |
ENST00000406242.3 ENST00000454903.2 |
FXYD3 |
FXYD domain containing ion transport regulator 3 |
| chr16_+_68679193 | 6.08 |
ENST00000581171.1 |
CDH3 |
cadherin 3, type 1, P-cadherin (placental) |
| chr6_+_83073952 | 6.08 |
ENST00000543496.1 |
TPBG |
trophoblast glycoprotein |
| chr19_+_48281946 | 5.99 |
ENST00000595615.1 |
SEPW1 |
selenoprotein W, 1 |
| chr14_-_105635090 | 5.99 |
ENST00000331782.3 ENST00000347004.2 |
JAG2 |
jagged 2 |
| chr19_+_48281842 | 5.98 |
ENST00000509570.2 |
SEPW1 |
selenoprotein W, 1 |
| chr10_+_3109695 | 5.96 |
ENST00000381125.4 |
PFKP |
phosphofructokinase, platelet |
| chr12_+_6309963 | 5.90 |
ENST00000382515.2 |
CD9 |
CD9 molecule |
| chr12_+_52626898 | 5.88 |
ENST00000331817.5 |
KRT7 |
keratin 7 |
| chr17_-_39677971 | 5.80 |
ENST00000393976.2 |
KRT15 |
keratin 15 |
| chr1_-_59043166 | 5.78 |
ENST00000371225.2 |
TACSTD2 |
tumor-associated calcium signal transducer 2 |
| chr12_-_47473707 | 5.78 |
ENST00000429635.1 |
AMIGO2 |
adhesion molecule with Ig-like domain 2 |
| chr12_-_47473425 | 5.76 |
ENST00000550413.1 |
AMIGO2 |
adhesion molecule with Ig-like domain 2 |
| chr1_-_209979375 | 5.68 |
ENST00000367021.3 |
IRF6 |
interferon regulatory factor 6 |
| chr12_-_52845910 | 5.65 |
ENST00000252252.3 |
KRT6B |
keratin 6B |
| chrX_-_38080077 | 5.62 |
ENST00000378533.3 ENST00000544439.1 ENST00000432886.2 ENST00000538295.1 |
SRPX |
sushi-repeat containing protein, X-linked |
| chr12_-_21810765 | 5.55 |
ENST00000450584.1 ENST00000350669.1 |
LDHB |
lactate dehydrogenase B |
| chr19_-_51456198 | 5.41 |
ENST00000594846.1 |
KLK5 |
kallikrein-related peptidase 5 |
| chr12_+_6308881 | 5.40 |
ENST00000382518.1 ENST00000536586.1 |
CD9 |
CD9 molecule |
| chr1_-_153538011 | 5.40 |
ENST00000368707.4 |
S100A2 |
S100 calcium binding protein A2 |
| chr20_-_56284816 | 5.32 |
ENST00000395819.3 ENST00000341744.3 |
PMEPA1 |
prostate transmembrane protein, androgen induced 1 |
| chr10_+_47746929 | 5.28 |
ENST00000340243.6 ENST00000374277.5 ENST00000449464.2 ENST00000538825.1 ENST00000335083.5 |
ANXA8L2 AL603965.1 |
annexin A8-like 2 Protein LOC100996760 |
| chr20_-_56285595 | 5.20 |
ENST00000395816.3 ENST00000347215.4 |
PMEPA1 |
prostate transmembrane protein, androgen induced 1 |
| chr6_+_116692102 | 5.20 |
ENST00000359564.2 |
DSE |
dermatan sulfate epimerase |
| chr1_-_153588765 | 5.15 |
ENST00000368701.1 ENST00000344616.2 |
S100A14 |
S100 calcium binding protein A14 |
| chr11_+_2398524 | 5.14 |
ENST00000263645.5 |
CD81 |
CD81 molecule |
| chr8_+_86376081 | 5.13 |
ENST00000285379.5 |
CA2 |
carbonic anhydrase II |
| chr10_-_33625154 | 5.13 |
ENST00000265371.4 |
NRP1 |
neuropilin 1 |
| chr4_+_75311019 | 5.07 |
ENST00000502307.1 |
AREG |
amphiregulin |
| chr2_-_220118631 | 4.93 |
ENST00000248437.4 |
TUBA4A |
tubulin, alpha 4a |
| chr1_-_209824643 | 4.90 |
ENST00000391911.1 ENST00000415782.1 |
LAMB3 |
laminin, beta 3 |
| chr19_+_39279838 | 4.88 |
ENST00000314980.4 |
LGALS7B |
lectin, galactoside-binding, soluble, 7B |
| chr6_+_83072923 | 4.86 |
ENST00000535040.1 |
TPBG |
trophoblast glycoprotein |
| chr2_-_56150910 | 4.83 |
ENST00000424836.2 ENST00000438672.1 ENST00000440439.1 ENST00000429909.1 ENST00000424207.1 ENST00000452337.1 ENST00000355426.3 ENST00000439193.1 ENST00000421664.1 |
EFEMP1 |
EGF containing fibulin-like extracellular matrix protein 1 |
| chr4_+_74735102 | 4.81 |
ENST00000395761.3 |
CXCL1 |
chemokine (C-X-C motif) ligand 1 (melanoma growth stimulating activity, alpha) |
| chr2_-_1748214 | 4.76 |
ENST00000433670.1 ENST00000425171.1 ENST00000252804.4 |
PXDN |
peroxidasin homolog (Drosophila) |
| chr4_+_174089904 | 4.75 |
ENST00000265000.4 |
GALNT7 |
UDP-N-acetyl-alpha-D-galactosamine:polypeptide N-acetylgalactosaminyltransferase 7 (GalNAc-T7) |
| chr14_-_67859422 | 4.75 |
ENST00000556532.1 |
PLEK2 |
pleckstrin 2 |
| chr21_+_42539701 | 4.70 |
ENST00000330333.6 ENST00000328735.6 ENST00000347667.5 |
BACE2 |
beta-site APP-cleaving enzyme 2 |
| chr4_+_75310851 | 4.66 |
ENST00000395748.3 ENST00000264487.2 |
AREG |
amphiregulin |
| chr12_-_47473642 | 4.60 |
ENST00000266581.4 |
AMIGO2 |
adhesion molecule with Ig-like domain 2 |
| chr22_+_43547937 | 4.59 |
ENST00000329563.4 |
TSPO |
translocator protein (18kDa) |
| chr1_+_20915409 | 4.58 |
ENST00000375071.3 |
CDA |
cytidine deaminase |
| chr19_+_38755203 | 4.58 |
ENST00000587090.1 ENST00000454580.3 |
SPINT2 |
serine peptidase inhibitor, Kunitz type, 2 |
| chr14_-_105444694 | 4.55 |
ENST00000333244.5 |
AHNAK2 |
AHNAK nucleoprotein 2 |
| chr19_+_38755042 | 4.54 |
ENST00000301244.7 |
SPINT2 |
serine peptidase inhibitor, Kunitz type, 2 |
| chr19_-_39264072 | 4.53 |
ENST00000599035.1 ENST00000378626.4 |
LGALS7 |
lectin, galactoside-binding, soluble, 7 |
| chr15_-_83953466 | 4.52 |
ENST00000345382.2 |
BNC1 |
basonuclin 1 |
| chr20_+_62327996 | 4.51 |
ENST00000369996.1 |
TNFRSF6B |
tumor necrosis factor receptor superfamily, member 6b, decoy |
| chr4_+_87515454 | 4.51 |
ENST00000427191.2 ENST00000436978.1 ENST00000502971.1 |
PTPN13 |
protein tyrosine phosphatase, non-receptor type 13 (APO-1/CD95 (Fas)-associated phosphatase) |
| chr10_+_75670862 | 4.49 |
ENST00000446342.1 ENST00000372764.3 ENST00000372762.4 |
PLAU |
plasminogen activator, urokinase |
| chr7_+_116139424 | 4.46 |
ENST00000222693.4 |
CAV2 |
caveolin 2 |
| chr1_+_44401479 | 4.46 |
ENST00000438616.3 |
ARTN |
artemin |
| chr8_+_95653427 | 4.46 |
ENST00000454170.2 |
ESRP1 |
epithelial splicing regulatory protein 1 |
| chr16_-_31214051 | 4.39 |
ENST00000350605.4 |
PYCARD |
PYD and CARD domain containing |
| chr16_+_68678892 | 4.38 |
ENST00000429102.2 |
CDH3 |
cadherin 3, type 1, P-cadherin (placental) |
| chr19_+_35606777 | 4.36 |
ENST00000604404.1 ENST00000435734.2 ENST00000603181.1 |
FXYD3 |
FXYD domain containing ion transport regulator 3 |
| chr7_-_93520191 | 4.34 |
ENST00000545378.1 |
TFPI2 |
tissue factor pathway inhibitor 2 |
| chr1_-_152009460 | 4.32 |
ENST00000271638.2 |
S100A11 |
S100 calcium binding protein A11 |
| chr4_-_90758227 | 4.30 |
ENST00000506691.1 ENST00000394986.1 ENST00000506244.1 ENST00000394989.2 ENST00000394991.3 |
SNCA |
synuclein, alpha (non A4 component of amyloid precursor) |
| chr7_+_65670186 | 4.29 |
ENST00000304842.5 ENST00000442120.1 |
TPST1 |
tyrosylprotein sulfotransferase 1 |
| chr8_+_95653373 | 4.27 |
ENST00000358397.5 |
ESRP1 |
epithelial splicing regulatory protein 1 |
| chr6_+_83073334 | 4.25 |
ENST00000369750.3 |
TPBG |
trophoblast glycoprotein |
| chr4_-_177713788 | 4.24 |
ENST00000280193.2 |
VEGFC |
vascular endothelial growth factor C |
| chr7_+_79764104 | 4.24 |
ENST00000351004.3 |
GNAI1 |
guanine nucleotide binding protein (G protein), alpha inhibiting activity polypeptide 1 |
| chr2_-_20425158 | 4.24 |
ENST00000381150.1 |
SDC1 |
syndecan 1 |
| chr12_-_53009116 | 4.23 |
ENST00000552855.1 |
KRT73 |
keratin 73 |
| chr10_+_17271266 | 4.19 |
ENST00000224237.5 |
VIM |
vimentin |
| chr12_-_28122980 | 4.15 |
ENST00000395868.3 ENST00000534890.1 |
PTHLH |
parathyroid hormone-like hormone |
| chr11_+_69931519 | 4.11 |
ENST00000316296.5 ENST00000530676.1 |
ANO1 |
anoctamin 1, calcium activated chloride channel |
| chr3_-_120170052 | 4.09 |
ENST00000295633.3 |
FSTL1 |
follistatin-like 1 |
| chr14_+_73704201 | 4.08 |
ENST00000340738.5 ENST00000427855.1 ENST00000381166.3 |
PAPLN |
papilin, proteoglycan-like sulfated glycoprotein |
| chr3_-_158390282 | 4.08 |
ENST00000264265.3 |
LXN |
latexin |
| chr8_-_41166953 | 4.07 |
ENST00000220772.3 |
SFRP1 |
secreted frizzled-related protein 1 |
| chr7_-_151329416 | 4.05 |
ENST00000418337.2 |
PRKAG2 |
protein kinase, AMP-activated, gamma 2 non-catalytic subunit |
| chr10_+_17270214 | 4.03 |
ENST00000544301.1 |
VIM |
vimentin |
| chr7_-_87849340 | 4.03 |
ENST00000419179.1 ENST00000265729.2 |
SRI |
sorcin |
| chr8_-_23261589 | 4.02 |
ENST00000524168.1 ENST00000523833.2 ENST00000519243.1 ENST00000389131.3 |
LOXL2 |
lysyl oxidase-like 2 |
| chr12_-_47473557 | 4.02 |
ENST00000321382.3 |
AMIGO2 |
adhesion molecule with Ig-like domain 2 |
| chr12_-_28123206 | 3.97 |
ENST00000542963.1 ENST00000535992.1 |
PTHLH |
parathyroid hormone-like hormone |
| chr2_-_24307635 | 3.96 |
ENST00000313482.4 |
TP53I3 |
tumor protein p53 inducible protein 3 |
| chr15_+_92396920 | 3.95 |
ENST00000318445.6 |
SLCO3A1 |
solute carrier organic anion transporter family, member 3A1 |
| chr18_+_21452804 | 3.94 |
ENST00000269217.6 |
LAMA3 |
laminin, alpha 3 |
| chr18_+_47088401 | 3.90 |
ENST00000261292.4 ENST00000427224.2 ENST00000580036.1 |
LIPG |
lipase, endothelial |
| chr1_-_175162048 | 3.85 |
ENST00000444639.1 |
KIAA0040 |
KIAA0040 |
| chr17_-_39780819 | 3.85 |
ENST00000311208.8 |
KRT17 |
keratin 17 |
| chr19_-_291365 | 3.84 |
ENST00000591572.1 ENST00000269812.3 ENST00000434325.2 |
PPAP2C |
phosphatidic acid phosphatase type 2C |
| chr7_-_93520259 | 3.82 |
ENST00000222543.5 |
TFPI2 |
tissue factor pathway inhibitor 2 |
| chr11_+_2405833 | 3.81 |
ENST00000527343.1 ENST00000464784.2 |
CD81 |
CD81 molecule |
| chr1_-_95007193 | 3.80 |
ENST00000370207.4 ENST00000334047.7 |
F3 |
coagulation factor III (thromboplastin, tissue factor) |
| chr9_-_136344197 | 3.79 |
ENST00000414172.1 ENST00000371897.4 |
SLC2A6 |
solute carrier family 2 (facilitated glucose transporter), member 6 |
| chr8_+_95653302 | 3.78 |
ENST00000423620.2 ENST00000433389.2 |
ESRP1 |
epithelial splicing regulatory protein 1 |
| chr10_+_124221036 | 3.78 |
ENST00000368984.3 |
HTRA1 |
HtrA serine peptidase 1 |
| chr22_+_43547877 | 3.76 |
ENST00000428336.1 |
TSPO |
translocator protein (18kDa) |
| chr17_-_74582191 | 3.74 |
ENST00000225276.5 |
ST6GALNAC2 |
ST6 (alpha-N-acetyl-neuraminyl-2,3-beta-galactosyl-1,3)-N-acetylgalactosaminide alpha-2,6-sialyltransferase 2 |
| chr4_+_79472673 | 3.74 |
ENST00000264908.6 |
ANXA3 |
annexin A3 |
| chr7_+_121513143 | 3.73 |
ENST00000393386.2 |
PTPRZ1 |
protein tyrosine phosphatase, receptor-type, Z polypeptide 1 |
| chr1_-_153588334 | 3.73 |
ENST00000476873.1 |
S100A14 |
S100 calcium binding protein A14 |
| chr19_+_35607166 | 3.73 |
ENST00000604255.1 ENST00000346446.5 ENST00000344013.6 ENST00000603449.1 ENST00000406988.1 ENST00000605550.1 ENST00000604804.1 ENST00000605552.1 |
FXYD3 |
FXYD domain containing ion transport regulator 3 |
| chr18_+_12308231 | 3.72 |
ENST00000590103.1 ENST00000591909.1 ENST00000586653.1 ENST00000592683.1 ENST00000590967.1 ENST00000591208.1 ENST00000591463.1 |
TUBB6 |
tubulin, beta 6 class V |
| chr7_+_155089486 | 3.72 |
ENST00000340368.4 ENST00000344756.4 ENST00000425172.1 ENST00000342407.5 |
INSIG1 |
insulin induced gene 1 |
| chr11_-_87908600 | 3.68 |
ENST00000531138.1 ENST00000526372.1 ENST00000243662.6 |
RAB38 |
RAB38, member RAS oncogene family |
| chr9_-_21974820 | 3.66 |
ENST00000579122.1 ENST00000498124.1 |
CDKN2A |
cyclin-dependent kinase inhibitor 2A |
| chr4_-_84255935 | 3.66 |
ENST00000513463.1 |
HPSE |
heparanase |
| chr9_-_35691017 | 3.65 |
ENST00000378292.3 |
TPM2 |
tropomyosin 2 (beta) |
| chr11_-_119993979 | 3.64 |
ENST00000524816.3 ENST00000525327.1 |
TRIM29 |
tripartite motif containing 29 |
| chr12_+_53491220 | 3.64 |
ENST00000548547.1 ENST00000301464.3 |
IGFBP6 |
insulin-like growth factor binding protein 6 |
| chr9_-_136344237 | 3.63 |
ENST00000432868.1 ENST00000371899.4 |
SLC2A6 |
solute carrier family 2 (facilitated glucose transporter), member 6 |
| chr16_+_56642041 | 3.62 |
ENST00000245185.5 |
MT2A |
metallothionein 2A |
| chr13_+_110959598 | 3.62 |
ENST00000360467.5 |
COL4A2 |
collagen, type IV, alpha 2 |
| chr4_+_79472888 | 3.62 |
ENST00000512884.1 ENST00000512542.1 ENST00000503570.2 |
ANXA3 |
annexin A3 |
| chr2_+_102608306 | 3.61 |
ENST00000332549.3 |
IL1R2 |
interleukin 1 receptor, type II |
| chr11_-_119999539 | 3.61 |
ENST00000541857.1 |
TRIM29 |
tripartite motif containing 29 |
| chr14_-_67878917 | 3.57 |
ENST00000216446.4 |
PLEK2 |
pleckstrin 2 |
| chr11_-_535515 | 3.57 |
ENST00000311189.7 ENST00000451590.1 ENST00000417302.1 |
HRAS |
Harvey rat sarcoma viral oncogene homolog |
| chr16_+_68678739 | 3.56 |
ENST00000264012.4 |
CDH3 |
cadherin 3, type 1, P-cadherin (placental) |
| chr4_+_89299994 | 3.54 |
ENST00000264346.7 |
HERC6 |
HECT and RLD domain containing E3 ubiquitin protein ligase family member 6 |
| chr10_-_126847276 | 3.54 |
ENST00000531469.1 |
CTBP2 |
C-terminal binding protein 2 |
| chr7_+_116165038 | 3.51 |
ENST00000393470.1 |
CAV1 |
caveolin 1, caveolae protein, 22kDa |
| chr10_+_17272608 | 3.50 |
ENST00000421459.2 |
VIM |
vimentin |
| chr20_+_4667094 | 3.47 |
ENST00000424424.1 ENST00000457586.1 |
PRNP |
prion protein |
| chr1_-_153363452 | 3.46 |
ENST00000368732.1 ENST00000368733.3 |
S100A8 |
S100 calcium binding protein A8 |
| chr15_+_41136586 | 3.45 |
ENST00000431806.1 |
SPINT1 |
serine peptidase inhibitor, Kunitz type 1 |
| chr3_-_189838670 | 3.44 |
ENST00000319332.5 |
LEPREL1 |
leprecan-like 1 |
| chr22_+_43547520 | 3.43 |
ENST00000337554.3 ENST00000396265.3 ENST00000583777.1 |
TSPO |
translocator protein (18kDa) |
| chr9_-_99801592 | 3.43 |
ENST00000259470.5 |
CTSV |
cathepsin V |
| chr2_-_166651191 | 3.42 |
ENST00000392701.3 |
GALNT3 |
UDP-N-acetyl-alpha-D-galactosamine:polypeptide N-acetylgalactosaminyltransferase 3 (GalNAc-T3) |
| chr1_+_223889285 | 3.42 |
ENST00000433674.2 |
CAPN2 |
calpain 2, (m/II) large subunit |
| chr5_+_131593364 | 3.36 |
ENST00000253754.3 ENST00000379018.3 |
PDLIM4 |
PDZ and LIM domain 4 |
| chr4_-_15939963 | 3.36 |
ENST00000259988.2 |
FGFBP1 |
fibroblast growth factor binding protein 1 |
| chr3_-_111314230 | 3.36 |
ENST00000317012.4 |
ZBED2 |
zinc finger, BED-type containing 2 |
| chr22_-_37640277 | 3.35 |
ENST00000401529.3 ENST00000249071.6 |
RAC2 |
ras-related C3 botulinum toxin substrate 2 (rho family, small GTP binding protein Rac2) |
| chr6_-_138428613 | 3.33 |
ENST00000421351.3 |
PERP |
PERP, TP53 apoptosis effector |
| chr11_-_2950642 | 3.30 |
ENST00000314222.4 |
PHLDA2 |
pleckstrin homology-like domain, family A, member 2 |
| chr2_-_106015491 | 3.29 |
ENST00000408995.1 ENST00000393353.3 ENST00000322142.8 |
FHL2 |
four and a half LIM domains 2 |
| chr1_+_153004800 | 3.28 |
ENST00000392661.3 |
SPRR1B |
small proline-rich protein 1B |
| chr17_+_48133459 | 3.28 |
ENST00000320031.8 |
ITGA3 |
integrin, alpha 3 (antigen CD49C, alpha 3 subunit of VLA-3 receptor) |
| chr4_-_25865159 | 3.28 |
ENST00000502949.1 ENST00000264868.5 ENST00000513691.1 ENST00000514872.1 |
SEL1L3 |
sel-1 suppressor of lin-12-like 3 (C. elegans) |
| chr19_-_45926739 | 3.24 |
ENST00000589381.1 ENST00000591636.1 ENST00000013807.5 ENST00000592023.1 |
ERCC1 |
excision repair cross-complementing rodent repair deficiency, complementation group 1 (includes overlapping antisense sequence) |
| chr1_-_209825674 | 3.24 |
ENST00000367030.3 ENST00000356082.4 |
LAMB3 |
laminin, beta 3 |
| chr20_-_57582296 | 3.24 |
ENST00000217131.5 |
CTSZ |
cathepsin Z |
| chr1_+_35220613 | 3.23 |
ENST00000338513.1 |
GJB5 |
gap junction protein, beta 5, 31.1kDa |
| chr11_+_35198118 | 3.23 |
ENST00000525211.1 ENST00000526000.1 ENST00000279452.6 ENST00000527889.1 |
CD44 |
CD44 molecule (Indian blood group) |
| chrX_+_152082969 | 3.23 |
ENST00000535861.1 ENST00000539731.1 ENST00000449285.2 ENST00000318504.7 ENST00000324823.6 ENST00000370268.4 ENST00000370270.2 |
ZNF185 |
zinc finger protein 185 (LIM domain) |
| chr11_-_6341844 | 3.22 |
ENST00000303927.3 |
PRKCDBP |
protein kinase C, delta binding protein |
| chr2_-_20424844 | 3.21 |
ENST00000403076.1 ENST00000254351.4 |
SDC1 |
syndecan 1 |
| chr9_-_21975038 | 3.21 |
ENST00000446177.1 |
CDKN2A |
cyclin-dependent kinase inhibitor 2A |
| chr4_-_99579733 | 3.21 |
ENST00000305798.3 |
TSPAN5 |
tetraspanin 5 |
| chr3_-_107809816 | 3.21 |
ENST00000361309.5 ENST00000355354.7 |
CD47 |
CD47 molecule |
| chr11_-_122933043 | 3.20 |
ENST00000534624.1 ENST00000453788.2 ENST00000527387.1 |
HSPA8 |
heat shock 70kDa protein 8 |
| chr4_+_4388245 | 3.19 |
ENST00000433139.2 |
NSG1 |
Homo sapiens neuron specific gene family member 1 (NSG1), transcript variant 3, mRNA. |
| chr1_+_165600436 | 3.19 |
ENST00000367888.4 ENST00000367885.1 ENST00000367884.2 |
MGST3 |
microsomal glutathione S-transferase 3 |
| chr2_-_113594279 | 3.18 |
ENST00000416750.1 ENST00000418817.1 ENST00000263341.2 |
IL1B |
interleukin 1, beta |
| chrX_+_49028265 | 3.18 |
ENST00000376322.3 ENST00000376327.5 |
PLP2 |
proteolipid protein 2 (colonic epithelium-enriched) |
| chr4_-_74964904 | 3.18 |
ENST00000508487.2 |
CXCL2 |
chemokine (C-X-C motif) ligand 2 |
| chr16_-_65155979 | 3.18 |
ENST00000562325.1 ENST00000268603.4 |
CDH11 |
cadherin 11, type 2, OB-cadherin (osteoblast) |
| chr9_-_21995300 | 3.16 |
ENST00000498628.2 |
CDKN2A |
cyclin-dependent kinase inhibitor 2A |
| chr12_-_50677255 | 3.14 |
ENST00000551691.1 ENST00000394943.3 ENST00000341247.4 |
LIMA1 |
LIM domain and actin binding 1 |
| chrX_+_64887512 | 3.12 |
ENST00000360270.5 |
MSN |
moesin |
| chr19_+_6531010 | 3.10 |
ENST00000245817.3 |
TNFSF9 |
tumor necrosis factor (ligand) superfamily, member 9 |
| chr12_-_54813229 | 3.09 |
ENST00000293379.4 |
ITGA5 |
integrin, alpha 5 (fibronectin receptor, alpha polypeptide) |
| chr8_-_29208183 | 3.09 |
ENST00000240100.2 |
DUSP4 |
dual specificity phosphatase 4 |
Gene Ontology Analysis
Gene overrepresentation in C2:CP category:
| Log-likelihood per target | Total log-likelihood | Term | Description |
|---|---|---|---|
| 2.0 | 3.9 | NABA BASEMENT MEMBRANES | Genes encoding structural components of basement membranes |
| 1.8 | 40.9 | PID INTEGRIN4 PATHWAY | Alpha6 beta4 integrin-ligand interactions |
| 1.3 | 27.8 | PID ERBB NETWORK PATHWAY | ErbB receptor signaling network |
| 0.9 | 23.4 | SA REG CASCADE OF CYCLIN EXPR | Expression of cyclins regulates progression through the cell cycle by activating cyclin-dependent kinases. |
| 0.8 | 36.6 | ST WNT BETA CATENIN PATHWAY | Wnt/beta-catenin Pathway |
| 0.7 | 50.9 | PID A6B1 A6B4 INTEGRIN PATHWAY | a6b1 and a6b4 Integrin signaling |
| 0.7 | 19.5 | PID VEGFR1 PATHWAY | VEGFR1 specific signals |
| 0.7 | 23.8 | SA MMP CYTOKINE CONNECTION | Cytokines can induce activation of matrix metalloproteinases, which degrade extracellular matrix. |
| 0.7 | 13.5 | PID VEGF VEGFR PATHWAY | VEGF and VEGFR signaling network |
| 0.6 | 0.6 | ST T CELL SIGNAL TRANSDUCTION | T Cell Signal Transduction |
| 0.6 | 9.0 | PID S1P S1P4 PATHWAY | S1P4 pathway |
| 0.5 | 8.2 | SA G1 AND S PHASES | Cdk2, 4, and 6 bind cyclin D in G1, while cdk2/cyclin E promotes the G1/S transition. |
| 0.5 | 19.3 | PID SYNDECAN 2 PATHWAY | Syndecan-2-mediated signaling events |
| 0.5 | 8.2 | PID ECADHERIN KERATINOCYTE PATHWAY | E-cadherin signaling in keratinocytes |
| 0.4 | 8.5 | PID HEDGEHOG 2PATHWAY | Signaling events mediated by the Hedgehog family |
| 0.4 | 45.4 | WNT SIGNALING | Genes related to Wnt-mediated signal transduction |
| 0.4 | 24.6 | PID ALPHA SYNUCLEIN PATHWAY | Alpha-synuclein signaling |
| 0.4 | 28.9 | PID TAP63 PATHWAY | Validated transcriptional targets of TAp63 isoforms |
| 0.4 | 10.4 | PID GLYPICAN 1PATHWAY | Glypican 1 network |
| 0.4 | 10.7 | PID INTEGRIN A9B1 PATHWAY | Alpha9 beta1 integrin signaling events |
| 0.4 | 9.4 | PID INTEGRIN3 PATHWAY | Beta3 integrin cell surface interactions |
| 0.4 | 7.7 | PID ANTHRAX PATHWAY | Cellular roles of Anthrax toxin |
| 0.4 | 3.0 | PID S1P S1P1 PATHWAY | S1P1 pathway |
| 0.4 | 10.8 | PID TOLL ENDOGENOUS PATHWAY | Endogenous TLR signaling |
| 0.4 | 0.7 | PID LPA4 PATHWAY | LPA4-mediated signaling events |
| 0.4 | 18.1 | SIG REGULATION OF THE ACTIN CYTOSKELETON BY RHO GTPASES | Genes related to regulation of the actin cytoskeleton |
| 0.4 | 28.0 | PID NOTCH PATHWAY | Notch signaling pathway |
| 0.4 | 7.9 | PID AVB3 OPN PATHWAY | Osteopontin-mediated events |
| 0.4 | 14.3 | ST G ALPHA I PATHWAY | G alpha i Pathway |
| 0.4 | 8.1 | PID IL8 CXCR2 PATHWAY | IL8- and CXCR2-mediated signaling events |
| 0.3 | 0.7 | PID IL8 CXCR1 PATHWAY | IL8- and CXCR1-mediated signaling events |
| 0.3 | 1.2 | SIG CHEMOTAXIS | Genes related to chemotaxis |
| 0.3 | 15.8 | PID SYNDECAN 1 PATHWAY | Syndecan-1-mediated signaling events |
| 0.3 | 5.5 | SIG IL4RECEPTOR IN B LYPHOCYTES | Genes related to IL4 rceptor signaling in B lymphocytes |
| 0.3 | 9.2 | PID LIS1 PATHWAY | Lissencephaly gene (LIS1) in neuronal migration and development |
| 0.3 | 1.7 | ST GRANULE CELL SURVIVAL PATHWAY | Granule Cell Survival Pathway is a specific case of more general PAC1 Receptor Pathway. |
| 0.3 | 10.9 | PID DELTA NP63 PATHWAY | Validated transcriptional targets of deltaNp63 isoforms |
| 0.3 | 3.1 | PID NEPHRIN NEPH1 PATHWAY | Nephrin/Neph1 signaling in the kidney podocyte |
| 0.3 | 3.0 | PID RANBP2 PATHWAY | Sumoylation by RanBP2 regulates transcriptional repression |
| 0.3 | 14.1 | PID MTOR 4PATHWAY | mTOR signaling pathway |
| 0.2 | 5.7 | PID P38 MKK3 6PATHWAY | p38 MAPK signaling pathway |
| 0.2 | 5.9 | PID ER NONGENOMIC PATHWAY | Plasma membrane estrogen receptor signaling |
| 0.2 | 5.8 | PID ENDOTHELIN PATHWAY | Endothelins |
| 0.2 | 43.0 | NABA ECM GLYCOPROTEINS | Genes encoding structural ECM glycoproteins |
| 0.2 | 19.1 | PID CASPASE PATHWAY | Caspase cascade in apoptosis |
| 0.2 | 8.6 | PID LYSOPHOSPHOLIPID PATHWAY | LPA receptor mediated events |
| 0.2 | 2.1 | SIG PIP3 SIGNALING IN CARDIAC MYOCTES | Genes related to PIP3 signaling in cardiac myocytes |
| 0.2 | 6.8 | PID HDAC CLASSIII PATHWAY | Signaling events mediated by HDAC Class III |
| 0.2 | 5.7 | PID HIF1A PATHWAY | Hypoxic and oxygen homeostasis regulation of HIF-1-alpha |
| 0.2 | 5.3 | PID EPHRINB REV PATHWAY | Ephrin B reverse signaling |
| 0.2 | 1.3 | ST JAK STAT PATHWAY | Jak-STAT Pathway |
| 0.2 | 4.5 | PID IL1 PATHWAY | IL1-mediated signaling events |
| 0.2 | 1.7 | ST DIFFERENTIATION PATHWAY IN PC12 CELLS | Differentiation Pathway in PC12 Cells; this is a specific case of PAC1 Receptor Pathway. |
| 0.2 | 7.1 | PID IL23 PATHWAY | IL23-mediated signaling events |
| 0.2 | 7.3 | SIG BCR SIGNALING PATHWAY | Members of the BCR signaling pathway |
| 0.2 | 2.5 | PID INSULIN PATHWAY | Insulin Pathway |
| 0.2 | 2.7 | SIG PIP3 SIGNALING IN B LYMPHOCYTES | Genes related to PIP3 signaling in B lymphocytes |
| 0.2 | 8.3 | PID FAK PATHWAY | Signaling events mediated by focal adhesion kinase |
| 0.2 | 3.4 | SIG INSULIN RECEPTOR PATHWAY IN CARDIAC MYOCYTES | Genes related to the insulin receptor pathway |
| 0.2 | 3.6 | PID PI3KCI PATHWAY | Class I PI3K signaling events |
| 0.2 | 3.8 | PID ARF 3PATHWAY | Arf1 pathway |
| 0.2 | 6.9 | PID PTP1B PATHWAY | Signaling events mediated by PTP1B |
| 0.2 | 3.7 | PID DNA PK PATHWAY | DNA-PK pathway in nonhomologous end joining |
| 0.2 | 0.4 | PID PI3KCI AKT PATHWAY | Class I PI3K signaling events mediated by Akt |
| 0.2 | 5.9 | ST P38 MAPK PATHWAY | p38 MAPK Pathway |
| 0.2 | 8.6 | PID P75 NTR PATHWAY | p75(NTR)-mediated signaling |
| 0.2 | 2.4 | SA G2 AND M PHASES | Cdc25 activates the cdc2/cyclin B complex to induce the G2/M transition. |
| 0.2 | 2.3 | PID HDAC CLASSII PATHWAY | Signaling events mediated by HDAC Class II |
| 0.2 | 2.9 | SIG CD40PATHWAYMAP | Genes related to CD40 signaling |
| 0.2 | 9.5 | PID CDC42 PATHWAY | CDC42 signaling events |
| 0.2 | 3.4 | PID NFKAPPAB CANONICAL PATHWAY | Canonical NF-kappaB pathway |
| 0.2 | 0.8 | PID EPHB FWD PATHWAY | EPHB forward signaling |
| 0.2 | 3.4 | PID NCADHERIN PATHWAY | N-cadherin signaling events |
| 0.2 | 1.8 | ST JNK MAPK PATHWAY | JNK MAPK Pathway |
| 0.1 | 3.5 | PID RAS PATHWAY | Regulation of Ras family activation |
| 0.1 | 1.1 | PID INSULIN GLUCOSE PATHWAY | Insulin-mediated glucose transport |
| 0.1 | 3.3 | PID ARF6 PATHWAY | Arf6 signaling events |
| 0.1 | 0.9 | ST G ALPHA S PATHWAY | G alpha s Pathway |
| 0.1 | 2.7 | PID MAPK TRK PATHWAY | Trk receptor signaling mediated by the MAPK pathway |
| 0.1 | 5.1 | PID ATR PATHWAY | ATR signaling pathway |
| 0.1 | 3.2 | PID MYC PATHWAY | C-MYC pathway |
| 0.1 | 1.0 | PID MET PATHWAY | Signaling events mediated by Hepatocyte Growth Factor Receptor (c-Met) |
| 0.1 | 0.9 | PID WNT SIGNALING PATHWAY | Wnt signaling network |
| 0.1 | 1.5 | PID EPHA FWDPATHWAY | EPHA forward signaling |
| 0.1 | 2.5 | PID ERBB1 INTERNALIZATION PATHWAY | Internalization of ErbB1 |
| 0.1 | 0.7 | PID BARD1 PATHWAY | BARD1 signaling events |
| 0.1 | 1.7 | PID IL6 7 PATHWAY | IL6-mediated signaling events |
| 0.1 | 1.6 | PID ALK2 PATHWAY | ALK2 signaling events |
| 0.1 | 1.9 | PID AP1 PATHWAY | AP-1 transcription factor network |
| 0.1 | 0.2 | ST INTERLEUKIN 4 PATHWAY | Interleukin 4 (IL-4) Pathway |
| 0.1 | 3.1 | PID RHODOPSIN PATHWAY | Visual signal transduction: Rods |
| 0.1 | 0.6 | PID PS1 PATHWAY | Presenilin action in Notch and Wnt signaling |
| 0.1 | 0.2 | PID TRAIL PATHWAY | TRAIL signaling pathway |
| 0.1 | 0.7 | PID SYNDECAN 3 PATHWAY | Syndecan-3-mediated signaling events |
| 0.1 | 1.4 | PID CIRCADIAN PATHWAY | Circadian rhythm pathway |
| 0.1 | 2.2 | PID KIT PATHWAY | Signaling events mediated by Stem cell factor receptor (c-Kit) |
| 0.1 | 0.1 | PID IL27 PATHWAY | IL27-mediated signaling events |
| 0.1 | 10.9 | NABA ECM AFFILIATED | Genes encoding proteins affiliated structurally or functionally to extracellular matrix proteins |
| 0.1 | 1.5 | PID P73PATHWAY | p73 transcription factor network |
| 0.1 | 0.1 | PID REELIN PATHWAY | Reelin signaling pathway |
| 0.1 | 0.6 | PID FRA PATHWAY | Validated transcriptional targets of AP1 family members Fra1 and Fra2 |
| 0.1 | 1.0 | PID TNF PATHWAY | TNF receptor signaling pathway |
| 0.1 | 1.9 | PID ECADHERIN STABILIZATION PATHWAY | Stabilization and expansion of the E-cadherin adherens junction |
| 0.1 | 0.2 | PID CXCR3 PATHWAY | CXCR3-mediated signaling events |
| 0.1 | 1.6 | PID FANCONI PATHWAY | Fanconi anemia pathway |
| 0.1 | 0.4 | PID S1P META PATHWAY | Sphingosine 1-phosphate (S1P) pathway |
| 0.1 | 0.1 | ST WNT CA2 CYCLIC GMP PATHWAY | Wnt/Ca2+/cyclic GMP signaling. |
| 0.1 | 0.1 | PID TCPTP PATHWAY | Signaling events mediated by TCPTP |
| 0.1 | 0.2 | ST IL 13 PATHWAY | Interleukin 13 (IL-13) Pathway |
| 0.1 | 0.3 | PID AR NONGENOMIC PATHWAY | Nongenotropic Androgen signaling |
| 0.0 | 1.8 | PID CDC42 REG PATHWAY | Regulation of CDC42 activity |
| 0.0 | 0.7 | PID AURORA A PATHWAY | Aurora A signaling |
| 0.0 | 0.9 | PID SMAD2 3PATHWAY | Regulation of cytoplasmic and nuclear SMAD2/3 signaling |
| 0.0 | 0.7 | PID CXCR4 PATHWAY | CXCR4-mediated signaling events |
| 0.0 | 0.9 | PID ATF2 PATHWAY | ATF-2 transcription factor network |
| 0.0 | 3.9 | PID P53 DOWNSTREAM PATHWAY | Direct p53 effectors |
| 0.0 | 0.3 | ST GA12 PATHWAY | G alpha 12 Pathway |
| 0.0 | 0.9 | PID TRKR PATHWAY | Neurotrophic factor-mediated Trk receptor signaling |
| 0.0 | 0.2 | PID ERBB2 ERBB3 PATHWAY | ErbB2/ErbB3 signaling events |
| 0.0 | 0.3 | PID CONE PATHWAY | Visual signal transduction: Cones |
| 0.0 | 0.2 | PID IL2 STAT5 PATHWAY | IL2 signaling events mediated by STAT5 |
| 0.0 | 0.0 | SA B CELL RECEPTOR COMPLEXES | Antigen binding to B cell receptors activates protein tyrosine kinases, such as the Src family, which ultimate activate MAP kinases. |
| 0.0 | 0.1 | PID IL5 PATHWAY | IL5-mediated signaling events |
| 0.0 | 0.1 | ST TYPE I INTERFERON PATHWAY | Type I Interferon (alpha/beta IFN) Pathway |
| 0.0 | 0.5 | PID LKB1 PATHWAY | LKB1 signaling events |
| 0.0 | 0.1 | PID UPA UPAR PATHWAY | Urokinase-type plasminogen activator (uPA) and uPAR-mediated signaling |
| 0.0 | 0.1 | NABA COLLAGENS | Genes encoding collagen proteins |
| 0.0 | 0.0 | PID NFKAPPAB ATYPICAL PATHWAY | Atypical NF-kappaB pathway |
Gene overrepresentation in molecular_function category:
| Log-likelihood per target | Total log-likelihood | Term | Description |
|---|---|---|---|
| 6.6 | 19.9 | GO:0070320 | inward rectifier potassium channel inhibitor activity(GO:0070320) |
| 3.5 | 24.5 | GO:0030267 | hydroxypyruvate reductase activity(GO:0016618) glyoxylate reductase (NADP) activity(GO:0030267) |
| 2.5 | 12.7 | GO:0005006 | epidermal growth factor-activated receptor activity(GO:0005006) |
| 2.5 | 7.6 | GO:0047757 | chondroitin-glucuronate 5-epimerase activity(GO:0047757) |
| 2.5 | 15.0 | GO:1990254 | keratin filament binding(GO:1990254) |
| 2.4 | 14.3 | GO:0019834 | phospholipase A2 inhibitor activity(GO:0019834) |
| 2.1 | 8.3 | GO:0004850 | uridine phosphorylase activity(GO:0004850) |
| 1.9 | 9.5 | GO:0060961 | phospholipase D inhibitor activity(GO:0060961) |
| 1.9 | 7.6 | GO:0035651 | AP-3 adaptor complex binding(GO:0035651) |
| 1.9 | 13.0 | GO:0004457 | lactate dehydrogenase activity(GO:0004457) L-lactate dehydrogenase activity(GO:0004459) |
| 1.8 | 5.4 | GO:0008426 | protein kinase C inhibitor activity(GO:0008426) |
| 1.8 | 5.4 | GO:0035662 | Toll-like receptor 4 binding(GO:0035662) |
| 1.8 | 5.3 | GO:0001665 | alpha-N-acetylgalactosaminide alpha-2,6-sialyltransferase activity(GO:0001665) |
| 1.7 | 5.0 | GO:0032090 | Pyrin domain binding(GO:0032090) |
| 1.6 | 13.2 | GO:0030023 | extracellular matrix constituent conferring elasticity(GO:0030023) |
| 1.6 | 4.7 | GO:0030984 | kininogen binding(GO:0030984) |
| 1.6 | 6.2 | GO:0030305 | heparanase activity(GO:0030305) |
| 1.5 | 4.6 | GO:0004731 | purine-nucleoside phosphorylase activity(GO:0004731) |
| 1.5 | 9.2 | GO:0038064 | collagen receptor activity(GO:0038064) |
| 1.5 | 13.6 | GO:0032051 | clathrin light chain binding(GO:0032051) |
| 1.5 | 7.5 | GO:0015111 | iodide transmembrane transporter activity(GO:0015111) |
| 1.5 | 9.0 | GO:0003960 | NADPH:quinone reductase activity(GO:0003960) |
| 1.5 | 11.8 | GO:0005497 | androgen binding(GO:0005497) |
| 1.4 | 8.6 | GO:0003872 | 6-phosphofructokinase activity(GO:0003872) |
| 1.4 | 4.2 | GO:0008476 | protein-tyrosine sulfotransferase activity(GO:0008476) |
| 1.4 | 5.6 | GO:0008112 | nicotinamide N-methyltransferase activity(GO:0008112) pyridine N-methyltransferase activity(GO:0030760) |
| 1.4 | 13.7 | GO:0005176 | ErbB-2 class receptor binding(GO:0005176) |
| 1.4 | 12.2 | GO:0086083 | cell adhesive protein binding involved in bundle of His cell-Purkinje myocyte communication(GO:0086083) |
| 1.3 | 4.0 | GO:0030377 | urokinase plasminogen activator receptor activity(GO:0030377) |
| 1.3 | 2.6 | GO:0048185 | activin binding(GO:0048185) |
| 1.3 | 7.7 | GO:0004741 | [pyruvate dehydrogenase (lipoamide)] phosphatase activity(GO:0004741) |
| 1.3 | 3.8 | GO:0030158 | protein xylosyltransferase activity(GO:0030158) |
| 1.2 | 4.9 | GO:0031852 | mu-type opioid receptor binding(GO:0031852) |
| 1.2 | 3.6 | GO:0032422 | purine-rich negative regulatory element binding(GO:0032422) |
| 1.2 | 4.7 | GO:0050473 | arachidonate 15-lipoxygenase activity(GO:0050473) |
| 1.2 | 7.0 | GO:0010859 | calcium-dependent cysteine-type endopeptidase inhibitor activity(GO:0010859) |
| 1.2 | 4.6 | GO:0008184 | glycogen phosphorylase activity(GO:0008184) |
| 1.1 | 16.7 | GO:0004653 | polypeptide N-acetylgalactosaminyltransferase activity(GO:0004653) |
| 1.1 | 1.1 | GO:0004735 | pyrroline-5-carboxylate reductase activity(GO:0004735) |
| 1.1 | 4.3 | GO:0008431 | vitamin E binding(GO:0008431) |
| 1.1 | 19.0 | GO:0004861 | cyclin-dependent protein serine/threonine kinase inhibitor activity(GO:0004861) |
| 1.1 | 9.5 | GO:0038085 | vascular endothelial growth factor binding(GO:0038085) |
| 1.0 | 3.1 | GO:0080019 | fatty-acyl-CoA reductase (alcohol-forming) activity(GO:0080019) |
| 1.0 | 7.2 | GO:1990599 | 3' overhang single-stranded DNA endodeoxyribonuclease activity(GO:1990599) |
| 1.0 | 4.1 | GO:1990190 | peptide-glutamate-N-acetyltransferase activity(GO:1990190) |
| 1.0 | 3.1 | GO:0008330 | protein tyrosine/threonine phosphatase activity(GO:0008330) |
| 1.0 | 5.1 | GO:0004910 | interleukin-1, Type II, blocking receptor activity(GO:0004910) |
| 1.0 | 3.0 | GO:0070006 | metalloaminopeptidase activity(GO:0070006) |
| 1.0 | 6.0 | GO:1903135 | cupric ion binding(GO:1903135) |
| 1.0 | 1.0 | GO:0055077 | gap junction hemi-channel activity(GO:0055077) |
| 1.0 | 5.0 | GO:0005152 | interleukin-1 receptor antagonist activity(GO:0005152) |
| 1.0 | 3.0 | GO:0016603 | glutaminyl-peptide cyclotransferase activity(GO:0016603) |
| 1.0 | 6.8 | GO:0047134 | protein-disulfide reductase activity(GO:0047134) |
| 1.0 | 8.7 | GO:0048495 | Roundabout binding(GO:0048495) |
| 0.9 | 6.6 | GO:0060072 | large conductance calcium-activated potassium channel activity(GO:0060072) |
| 0.9 | 2.8 | GO:0004939 | beta-adrenergic receptor activity(GO:0004939) |
| 0.9 | 2.7 | GO:0004666 | prostaglandin-endoperoxide synthase activity(GO:0004666) |
| 0.9 | 2.7 | GO:0043398 | HLH domain binding(GO:0043398) |
| 0.9 | 1.8 | GO:0019103 | pyrimidine nucleotide binding(GO:0019103) |
| 0.9 | 2.7 | GO:0004821 | histidine-tRNA ligase activity(GO:0004821) |
| 0.9 | 0.9 | GO:0004103 | choline kinase activity(GO:0004103) |
| 0.9 | 1.7 | GO:0019534 | toxin transporter activity(GO:0019534) |
| 0.9 | 0.9 | GO:0008131 | primary amine oxidase activity(GO:0008131) |
| 0.9 | 3.4 | GO:0017089 | glycolipid transporter activity(GO:0017089) |
| 0.9 | 5.1 | GO:0008467 | [heparan sulfate]-glucosamine 3-sulfotransferase 1 activity(GO:0008467) |
| 0.8 | 5.1 | GO:0008948 | malate dehydrogenase (decarboxylating) (NAD+) activity(GO:0004471) malate dehydrogenase (decarboxylating) (NADP+) activity(GO:0004473) oxaloacetate decarboxylase activity(GO:0008948) |
| 0.8 | 4.1 | GO:0086075 | gap junction channel activity involved in cardiac conduction electrical coupling(GO:0086075) |
| 0.8 | 1.6 | GO:0050072 | m7G(5')pppN diphosphatase activity(GO:0050072) |
| 0.8 | 5.7 | GO:0070492 | oligosaccharide binding(GO:0070492) |
| 0.8 | 4.0 | GO:0016300 | tRNA (uracil) methyltransferase activity(GO:0016300) |
| 0.8 | 4.0 | GO:0046912 | transferase activity, transferring acyl groups, acyl groups converted into alkyl on transfer(GO:0046912) |
| 0.8 | 7.9 | GO:0008607 | phosphorylase kinase regulator activity(GO:0008607) |
| 0.8 | 4.5 | GO:0008553 | hydrogen-exporting ATPase activity, phosphorylative mechanism(GO:0008553) |
| 0.8 | 18.2 | GO:0098641 | cadherin binding involved in cell-cell adhesion(GO:0098641) |
| 0.8 | 3.0 | GO:0046404 | ATP-dependent polydeoxyribonucleotide 5'-hydroxyl-kinase activity(GO:0046404) polydeoxyribonucleotide kinase activity(GO:0051733) ATP-dependent polynucleotide kinase activity(GO:0051734) |
| 0.8 | 0.8 | GO:0004769 | steroid delta-isomerase activity(GO:0004769) |
| 0.8 | 0.8 | GO:0005150 | interleukin-1, Type I receptor binding(GO:0005150) |
| 0.7 | 5.2 | GO:0004126 | cytidine deaminase activity(GO:0004126) |
| 0.7 | 3.0 | GO:0048408 | epidermal growth factor binding(GO:0048408) |
| 0.7 | 3.7 | GO:0030348 | syntaxin-3 binding(GO:0030348) |
| 0.7 | 2.2 | GO:0008195 | phosphatidate phosphatase activity(GO:0008195) |
| 0.7 | 0.7 | GO:0051731 | polynucleotide 5'-hydroxyl-kinase activity(GO:0051731) |
| 0.7 | 5.9 | GO:0047144 | 2-acylglycerol-3-phosphate O-acyltransferase activity(GO:0047144) |
| 0.7 | 2.2 | GO:0004515 | nicotinate-nucleotide adenylyltransferase activity(GO:0004515) |
| 0.7 | 7.3 | GO:0005094 | Rho GDP-dissociation inhibitor activity(GO:0005094) |
| 0.7 | 5.9 | GO:0005243 | gap junction channel activity(GO:0005243) |
| 0.7 | 5.8 | GO:0003847 | 1-alkyl-2-acetylglycerophosphocholine esterase activity(GO:0003847) |
| 0.7 | 4.3 | GO:0005134 | interleukin-2 receptor binding(GO:0005134) |
| 0.7 | 4.3 | GO:0008269 | JAK pathway signal transduction adaptor activity(GO:0008269) |
| 0.7 | 6.4 | GO:0046703 | natural killer cell lectin-like receptor binding(GO:0046703) |
| 0.7 | 3.5 | GO:0001010 | transcription factor activity, sequence-specific DNA binding transcription factor recruiting(GO:0001010) |
| 0.7 | 1.4 | GO:0070052 | collagen V binding(GO:0070052) |
| 0.7 | 2.1 | GO:0070984 | SET domain binding(GO:0070984) |
| 0.7 | 9.0 | GO:0038132 | neuregulin binding(GO:0038132) |
| 0.7 | 2.8 | GO:0061769 | ribosylnicotinamide kinase activity(GO:0050262) ribosylnicotinate kinase activity(GO:0061769) |
| 0.7 | 3.4 | GO:0050815 | phosphoserine binding(GO:0050815) |
| 0.7 | 7.5 | GO:0055131 | C3HC4-type RING finger domain binding(GO:0055131) |
| 0.7 | 4.1 | GO:0023025 | MHC class Ib protein complex binding(GO:0023025) MHC class Ib protein binding, via antigen binding groove(GO:0023030) |
| 0.7 | 2.7 | GO:0015319 | sodium:inorganic phosphate symporter activity(GO:0015319) |
| 0.7 | 8.0 | GO:1990459 | transferrin receptor binding(GO:1990459) |
| 0.7 | 6.0 | GO:0070915 | lysophosphatidic acid receptor activity(GO:0070915) |
| 0.7 | 2.0 | GO:0045127 | N-acetylglucosamine kinase activity(GO:0045127) |
| 0.7 | 2.0 | GO:0004814 | arginine-tRNA ligase activity(GO:0004814) |
| 0.7 | 5.2 | GO:0036312 | phosphatidylinositol 3-kinase regulatory subunit binding(GO:0036312) |
| 0.6 | 18.8 | GO:0005540 | hyaluronic acid binding(GO:0005540) |
| 0.6 | 6.5 | GO:0032036 | myosin heavy chain binding(GO:0032036) |
| 0.6 | 2.5 | GO:0050220 | prostaglandin-E synthase activity(GO:0050220) |
| 0.6 | 5.0 | GO:0017166 | vinculin binding(GO:0017166) |
| 0.6 | 33.8 | GO:0017080 | sodium channel regulator activity(GO:0017080) |
| 0.6 | 3.1 | GO:0004647 | phosphoserine phosphatase activity(GO:0004647) |
| 0.6 | 2.5 | GO:0031685 | adenosine receptor binding(GO:0031685) |
| 0.6 | 7.4 | GO:0031386 | protein tag(GO:0031386) |
| 0.6 | 0.6 | GO:0016638 | oxidoreductase activity, acting on the CH-NH2 group of donors(GO:0016638) |
| 0.6 | 1.8 | GO:0019826 | oxygen sensor activity(GO:0019826) |
| 0.6 | 7.2 | GO:0010385 | double-stranded methylated DNA binding(GO:0010385) |
| 0.6 | 7.8 | GO:0047372 | acylglycerol lipase activity(GO:0047372) |
| 0.6 | 4.2 | GO:0000014 | single-stranded DNA endodeoxyribonuclease activity(GO:0000014) |
| 0.6 | 3.0 | GO:0016316 | phosphatidylinositol-3,4-bisphosphate 4-phosphatase activity(GO:0016316) inositol-1,3,4-trisphosphate 4-phosphatase activity(GO:0017161) phosphatidylinositol-4,5-bisphosphate 4-phosphatase activity(GO:0034597) inositol-3,4-bisphosphate 4-phosphatase activity(GO:0052828) |
| 0.6 | 2.4 | GO:0047288 | monosialoganglioside sialyltransferase activity(GO:0047288) |
| 0.6 | 6.5 | GO:0001758 | retinal dehydrogenase activity(GO:0001758) |
| 0.6 | 0.6 | GO:0070404 | NADH binding(GO:0070404) |
| 0.6 | 5.3 | GO:0008526 | phosphatidylinositol transporter activity(GO:0008526) |
| 0.6 | 5.8 | GO:0051371 | muscle alpha-actinin binding(GO:0051371) |
| 0.6 | 7.0 | GO:0035256 | G-protein coupled glutamate receptor binding(GO:0035256) |
| 0.6 | 2.3 | GO:0042731 | PH domain binding(GO:0042731) |
| 0.6 | 4.6 | GO:0000295 | adenine nucleotide transmembrane transporter activity(GO:0000295) purine ribonucleotide transmembrane transporter activity(GO:0005346) ATP transmembrane transporter activity(GO:0005347) purine nucleotide transmembrane transporter activity(GO:0015216) ADP transmembrane transporter activity(GO:0015217) |
| 0.6 | 5.8 | GO:0019784 | NEDD8-specific protease activity(GO:0019784) |
| 0.6 | 3.4 | GO:0035374 | chondroitin sulfate binding(GO:0035374) |
| 0.6 | 2.3 | GO:0008568 | microtubule-severing ATPase activity(GO:0008568) |
| 0.6 | 2.3 | GO:0052851 | cupric reductase activity(GO:0008823) ferric-chelate reductase (NADPH) activity(GO:0052851) |
| 0.6 | 9.0 | GO:0004526 | ribonuclease P activity(GO:0004526) |
| 0.6 | 3.4 | GO:0004465 | lipoprotein lipase activity(GO:0004465) |
| 0.6 | 2.2 | GO:0050509 | N-acetylglucosaminyl-proteoglycan 4-beta-glucuronosyltransferase activity(GO:0050509) |
| 0.6 | 5.6 | GO:0046870 | cadmium ion binding(GO:0046870) |
| 0.6 | 25.1 | GO:0050699 | WW domain binding(GO:0050699) |
| 0.6 | 1.7 | GO:0008177 | succinate dehydrogenase (ubiquinone) activity(GO:0008177) |
| 0.6 | 2.2 | GO:0004743 | pyruvate kinase activity(GO:0004743) |
| 0.6 | 0.6 | GO:0016846 | carbon-sulfur lyase activity(GO:0016846) |
| 0.6 | 3.3 | GO:0005499 | vitamin D binding(GO:0005499) |
| 0.6 | 2.2 | GO:0003827 | alpha-1,3-mannosylglycoprotein 2-beta-N-acetylglucosaminyltransferase activity(GO:0003827) |
| 0.6 | 1.7 | GO:0003854 | 3-beta-hydroxy-delta5-steroid dehydrogenase activity(GO:0003854) |
| 0.5 | 1.6 | GO:0016215 | stearoyl-CoA 9-desaturase activity(GO:0004768) acyl-CoA desaturase activity(GO:0016215) |
| 0.5 | 3.3 | GO:0010858 | calcium-dependent protein kinase regulator activity(GO:0010858) |
| 0.5 | 1.6 | GO:0001609 | G-protein coupled adenosine receptor activity(GO:0001609) |
| 0.5 | 8.7 | GO:0045236 | CXCR chemokine receptor binding(GO:0045236) |
| 0.5 | 2.2 | GO:0022865 | transmembrane electron transfer carrier(GO:0022865) |
| 0.5 | 9.2 | GO:0015250 | water channel activity(GO:0015250) |
| 0.5 | 7.5 | GO:0030280 | structural constituent of epidermis(GO:0030280) |
| 0.5 | 1.6 | GO:0003978 | UDP-N-acetylglucosamine 4-epimerase activity(GO:0003974) UDP-glucose 4-epimerase activity(GO:0003978) |
| 0.5 | 2.1 | GO:0051996 | farnesyl-diphosphate farnesyltransferase activity(GO:0004310) squalene synthase activity(GO:0051996) |
| 0.5 | 0.5 | GO:0016863 | intramolecular oxidoreductase activity, transposing C=C bonds(GO:0016863) |
| 0.5 | 6.3 | GO:0032050 | clathrin heavy chain binding(GO:0032050) |
| 0.5 | 14.7 | GO:0030506 | ankyrin binding(GO:0030506) |
| 0.5 | 2.6 | GO:0016312 | inositol bisphosphate phosphatase activity(GO:0016312) |
| 0.5 | 1.6 | GO:0004032 | alditol:NADP+ 1-oxidoreductase activity(GO:0004032) |
| 0.5 | 2.1 | GO:0004598 | peptidylglycine monooxygenase activity(GO:0004504) peptidylamidoglycolate lyase activity(GO:0004598) |
| 0.5 | 9.9 | GO:0005112 | Notch binding(GO:0005112) |
| 0.5 | 5.7 | GO:0070300 | phosphatidic acid binding(GO:0070300) |
| 0.5 | 4.1 | GO:0045545 | syndecan binding(GO:0045545) |
| 0.5 | 3.0 | GO:0019776 | Atg8 ligase activity(GO:0019776) |
| 0.5 | 8.1 | GO:0070411 | I-SMAD binding(GO:0070411) |
| 0.5 | 7.6 | GO:0005149 | interleukin-1 receptor binding(GO:0005149) |
| 0.5 | 2.5 | GO:0016015 | morphogen activity(GO:0016015) |
| 0.5 | 11.0 | GO:0080025 | phosphatidylinositol-3,5-bisphosphate binding(GO:0080025) |
| 0.5 | 1.5 | GO:0047273 | galactosylgalactosylglucosylceramide beta-D-acetylgalactosaminyltransferase activity(GO:0047273) |
| 0.5 | 1.5 | GO:0004170 | dUTP diphosphatase activity(GO:0004170) |
| 0.5 | 1.5 | GO:0042799 | histone methyltransferase activity (H4-K20 specific)(GO:0042799) |
| 0.5 | 2.0 | GO:0005105 | type 1 fibroblast growth factor receptor binding(GO:0005105) |
| 0.5 | 2.5 | GO:0031962 | mineralocorticoid receptor binding(GO:0031962) |
| 0.5 | 2.9 | GO:0042296 | ISG15 transferase activity(GO:0042296) |
| 0.5 | 6.3 | GO:0005172 | vascular endothelial growth factor receptor binding(GO:0005172) |
| 0.5 | 11.4 | GO:0043236 | laminin binding(GO:0043236) |
| 0.5 | 1.4 | GO:0032089 | NACHT domain binding(GO:0032089) |
| 0.5 | 4.7 | GO:0036042 | long-chain fatty acyl-CoA binding(GO:0036042) |
| 0.5 | 3.7 | GO:0004396 | glucokinase activity(GO:0004340) hexokinase activity(GO:0004396) fructokinase activity(GO:0008865) mannokinase activity(GO:0019158) |
| 0.5 | 0.5 | GO:0032810 | sterol response element binding(GO:0032810) |
| 0.5 | 2.8 | GO:0046979 | TAP2 binding(GO:0046979) |
| 0.5 | 1.9 | GO:0016842 | amidine-lyase activity(GO:0016842) |
| 0.5 | 1.9 | GO:0043208 | glycosphingolipid binding(GO:0043208) |
| 0.5 | 1.9 | GO:0004449 | isocitrate dehydrogenase (NAD+) activity(GO:0004449) |
| 0.5 | 1.8 | GO:0019828 | aspartic-type endopeptidase inhibitor activity(GO:0019828) |
| 0.5 | 0.9 | GO:0048407 | platelet-derived growth factor binding(GO:0048407) |
| 0.5 | 1.4 | GO:0016262 | protein N-acetylglucosaminyltransferase activity(GO:0016262) |
| 0.5 | 1.4 | GO:0071566 | UFM1 activating enzyme activity(GO:0071566) |
| 0.5 | 1.4 | GO:0005457 | GDP-fucose transmembrane transporter activity(GO:0005457) purine nucleotide-sugar transmembrane transporter activity(GO:0036080) |
| 0.5 | 0.5 | GO:0000104 | succinate dehydrogenase activity(GO:0000104) |
| 0.4 | 0.4 | GO:0016866 | intramolecular transferase activity(GO:0016866) |
| 0.4 | 17.4 | GO:0004198 | calcium-dependent cysteine-type endopeptidase activity(GO:0004198) |
| 0.4 | 19.6 | GO:0003785 | actin monomer binding(GO:0003785) |
| 0.4 | 2.7 | GO:0015057 | thrombin receptor activity(GO:0015057) |
| 0.4 | 2.2 | GO:0070568 | guanylyltransferase activity(GO:0070568) |
| 0.4 | 3.1 | GO:0005432 | calcium:sodium antiporter activity(GO:0005432) |
| 0.4 | 5.3 | GO:0089720 | caspase binding(GO:0089720) |
| 0.4 | 2.6 | GO:0034513 | box H/ACA snoRNA binding(GO:0034513) |
| 0.4 | 0.4 | GO:0051139 | metal ion:proton antiporter activity(GO:0051139) |
| 0.4 | 2.2 | GO:0050436 | microfibril binding(GO:0050436) |
| 0.4 | 2.6 | GO:0016681 | ubiquinol-cytochrome-c reductase activity(GO:0008121) oxidoreductase activity, acting on diphenols and related substances as donors, cytochrome as acceptor(GO:0016681) |
| 0.4 | 0.4 | GO:0033265 | choline binding(GO:0033265) |
| 0.4 | 1.3 | GO:0005246 | calcium channel regulator activity(GO:0005246) |
| 0.4 | 3.0 | GO:0015288 | porin activity(GO:0015288) |
| 0.4 | 1.7 | GO:0031871 | proteinase activated receptor binding(GO:0031871) |
| 0.4 | 4.3 | GO:0033192 | calmodulin-dependent protein phosphatase activity(GO:0033192) |
| 0.4 | 7.3 | GO:0004089 | carbonate dehydratase activity(GO:0004089) |
| 0.4 | 6.4 | GO:0048018 | receptor agonist activity(GO:0048018) |
| 0.4 | 1.3 | GO:0035671 | 3-oxo-5-alpha-steroid 4-dehydrogenase activity(GO:0003865) steroid dehydrogenase activity, acting on the CH-CH group of donors(GO:0033765) enone reductase activity(GO:0035671) cholestenone 5-alpha-reductase activity(GO:0047751) |
| 0.4 | 1.3 | GO:0016838 | carbon-oxygen lyase activity, acting on phosphates(GO:0016838) |
| 0.4 | 1.3 | GO:0003883 | CTP synthase activity(GO:0003883) |
| 0.4 | 1.3 | GO:0033878 | hormone-sensitive lipase activity(GO:0033878) |
| 0.4 | 1.2 | GO:0042134 | rRNA primary transcript binding(GO:0042134) |
| 0.4 | 1.2 | GO:0043739 | G/U mismatch-specific uracil-DNA glycosylase activity(GO:0043739) |
| 0.4 | 2.1 | GO:0015307 | drug:proton antiporter activity(GO:0015307) |
| 0.4 | 0.4 | GO:0001968 | fibronectin binding(GO:0001968) |
| 0.4 | 3.7 | GO:0043426 | MRF binding(GO:0043426) |
| 0.4 | 1.2 | GO:0004947 | bradykinin receptor activity(GO:0004947) |
| 0.4 | 6.1 | GO:0016174 | NAD(P)H oxidase activity(GO:0016174) |
| 0.4 | 1.6 | GO:0052591 | sn-glycerol-3-phosphate:ubiquinone oxidoreductase activity(GO:0052590) sn-glycerol-3-phosphate:ubiquinone-8 oxidoreductase activity(GO:0052591) |
| 0.4 | 1.6 | GO:0004074 | biliverdin reductase activity(GO:0004074) |
| 0.4 | 1.2 | GO:0051377 | mannose-ethanolamine phosphotransferase activity(GO:0051377) |
| 0.4 | 11.1 | GO:0043014 | alpha-tubulin binding(GO:0043014) |
| 0.4 | 44.1 | GO:0004222 | metalloendopeptidase activity(GO:0004222) |
| 0.4 | 2.4 | GO:0008443 | phosphofructokinase activity(GO:0008443) |
| 0.4 | 1.2 | GO:0003863 | alpha-ketoacid dehydrogenase activity(GO:0003826) 3-methyl-2-oxobutanoate dehydrogenase (2-methylpropanoyl-transferring) activity(GO:0003863) |
| 0.4 | 0.4 | GO:0030197 | extracellular matrix constituent, lubricant activity(GO:0030197) |
| 0.4 | 0.8 | GO:0008263 | pyrimidine-specific mismatch base pair DNA N-glycosylase activity(GO:0008263) |
| 0.4 | 1.2 | GO:0015361 | low-affinity sodium:dicarboxylate symporter activity(GO:0015361) |
| 0.4 | 2.4 | GO:0030346 | protein phosphatase 2B binding(GO:0030346) |
| 0.4 | 1.2 | GO:0035539 | 8-oxo-7,8-dihydroguanosine triphosphate pyrophosphatase activity(GO:0008413) 8-oxo-7,8-dihydrodeoxyguanosine triphosphate pyrophosphatase activity(GO:0035539) |
| 0.4 | 16.1 | GO:0005154 | epidermal growth factor receptor binding(GO:0005154) |
| 0.4 | 1.6 | GO:0004549 | tRNA-specific ribonuclease activity(GO:0004549) |
| 0.4 | 2.3 | GO:0043141 | ATP-dependent 5'-3' DNA helicase activity(GO:0043141) |
| 0.4 | 0.4 | GO:0098518 | polynucleotide phosphatase activity(GO:0098518) |
| 0.4 | 1.1 | GO:0003858 | 3-hydroxybutyrate dehydrogenase activity(GO:0003858) |
| 0.4 | 3.8 | GO:0015280 | ligand-gated sodium channel activity(GO:0015280) |
| 0.4 | 1.5 | GO:0004427 | inorganic diphosphatase activity(GO:0004427) |
| 0.4 | 1.1 | GO:0033858 | N-acetylgalactosamine kinase activity(GO:0033858) |
| 0.4 | 5.6 | GO:0005351 | sugar:proton symporter activity(GO:0005351) cation:sugar symporter activity(GO:0005402) |
| 0.4 | 28.7 | GO:0019003 | GDP binding(GO:0019003) |
| 0.4 | 0.4 | GO:1990239 | steroid hormone binding(GO:1990239) |
| 0.4 | 0.4 | GO:0042806 | fucose binding(GO:0042806) |
| 0.4 | 3.3 | GO:0004969 | histamine receptor activity(GO:0004969) |
| 0.4 | 0.7 | GO:0001222 | transcription corepressor binding(GO:0001222) |
| 0.4 | 2.6 | GO:0061575 | cyclin-dependent protein serine/threonine kinase activator activity(GO:0061575) |
| 0.4 | 1.1 | GO:0000983 | transcription factor activity, RNA polymerase II core promoter sequence-specific(GO:0000983) |
| 0.4 | 5.1 | GO:0031489 | myosin V binding(GO:0031489) |
| 0.4 | 0.4 | GO:0000900 | translation repressor activity, nucleic acid binding(GO:0000900) |
| 0.4 | 2.2 | GO:0009922 | fatty acid elongase activity(GO:0009922) 3-oxo-arachidoyl-CoA synthase activity(GO:0102336) 3-oxo-cerotoyl-CoA synthase activity(GO:0102337) 3-oxo-lignoceronyl-CoA synthase activity(GO:0102338) |
| 0.4 | 5.0 | GO:0017049 | GTP-Rho binding(GO:0017049) |
| 0.4 | 1.4 | GO:0038025 | reelin receptor activity(GO:0038025) |
| 0.4 | 0.7 | GO:0008409 | 5'-3' exonuclease activity(GO:0008409) |
| 0.4 | 0.4 | GO:0004917 | interleukin-7 receptor activity(GO:0004917) |
| 0.4 | 0.4 | GO:0015230 | FAD transmembrane transporter activity(GO:0015230) |
| 0.4 | 1.1 | GO:0030297 | transmembrane receptor protein tyrosine kinase activator activity(GO:0030297) |
| 0.3 | 3.5 | GO:0015266 | protein channel activity(GO:0015266) |
| 0.3 | 0.7 | GO:0000293 | ferric-chelate reductase activity(GO:0000293) |
| 0.3 | 0.7 | GO:0070697 | activin receptor binding(GO:0070697) |
| 0.3 | 1.4 | GO:0004082 | bisphosphoglycerate mutase activity(GO:0004082) phosphoglycerate mutase activity(GO:0004619) 2,3-bisphosphoglycerate-dependent phosphoglycerate mutase activity(GO:0046538) |
| 0.3 | 0.7 | GO:0019912 | cyclin-dependent protein kinase activating kinase activity(GO:0019912) |
| 0.3 | 6.1 | GO:0044548 | S100 protein binding(GO:0044548) |
| 0.3 | 1.4 | GO:0035402 | histone kinase activity (H3-T11 specific)(GO:0035402) |
| 0.3 | 1.0 | GO:0046625 | sphingolipid binding(GO:0046625) |
| 0.3 | 0.3 | GO:0008309 | double-stranded DNA exodeoxyribonuclease activity(GO:0008309) |
| 0.3 | 3.0 | GO:0034713 | type I transforming growth factor beta receptor binding(GO:0034713) |
| 0.3 | 2.3 | GO:0016206 | catechol O-methyltransferase activity(GO:0016206) |
| 0.3 | 1.7 | GO:0015193 | L-proline transmembrane transporter activity(GO:0015193) |
| 0.3 | 2.3 | GO:0043008 | ATP-dependent protein binding(GO:0043008) |
| 0.3 | 1.6 | GO:0015295 | solute:proton symporter activity(GO:0015295) |
| 0.3 | 1.0 | GO:0050610 | oxidoreductase activity, acting on a sulfur group of donors, quinone or similar compound as acceptor(GO:0016672) glutathione dehydrogenase (ascorbate) activity(GO:0045174) methylarsonate reductase activity(GO:0050610) |
| 0.3 | 1.6 | GO:0008113 | peptide-methionine (S)-S-oxide reductase activity(GO:0008113) |
| 0.3 | 2.3 | GO:0070891 | lipoteichoic acid binding(GO:0070891) |
| 0.3 | 8.0 | GO:0051428 | peptide hormone receptor binding(GO:0051428) |
| 0.3 | 5.4 | GO:0008432 | JUN kinase binding(GO:0008432) |
| 0.3 | 2.9 | GO:0022840 | leak channel activity(GO:0022840) narrow pore channel activity(GO:0022842) |
| 0.3 | 2.5 | GO:0008565 | protein transporter activity(GO:0008565) |
| 0.3 | 0.9 | GO:0035251 | UDP-glucosyltransferase activity(GO:0035251) |
| 0.3 | 4.1 | GO:0050786 | RAGE receptor binding(GO:0050786) |
| 0.3 | 3.1 | GO:0070053 | thrombospondin receptor activity(GO:0070053) |
| 0.3 | 2.2 | GO:1990226 | histone methyltransferase binding(GO:1990226) |
| 0.3 | 0.3 | GO:0030898 | actin-dependent ATPase activity(GO:0030898) |
| 0.3 | 1.9 | GO:0016416 | O-palmitoyltransferase activity(GO:0016416) |
| 0.3 | 3.4 | GO:0008253 | 5'-nucleotidase activity(GO:0008253) |
| 0.3 | 0.6 | GO:0051010 | microtubule plus-end binding(GO:0051010) |
| 0.3 | 0.6 | GO:0004477 | methenyltetrahydrofolate cyclohydrolase activity(GO:0004477) methylenetetrahydrofolate dehydrogenase (NAD+) activity(GO:0004487) methylenetetrahydrofolate dehydrogenase (NADP+) activity(GO:0004488) |
| 0.3 | 0.3 | GO:0004345 | glucose-6-phosphate dehydrogenase activity(GO:0004345) |
| 0.3 | 1.8 | GO:0039552 | RIG-I binding(GO:0039552) |
| 0.3 | 1.2 | GO:0004348 | glucosylceramidase activity(GO:0004348) |
| 0.3 | 4.3 | GO:0017160 | Ral GTPase binding(GO:0017160) |
| 0.3 | 1.2 | GO:0004826 | phenylalanine-tRNA ligase activity(GO:0004826) |
| 0.3 | 4.2 | GO:0032395 | MHC class II receptor activity(GO:0032395) |
| 0.3 | 4.8 | GO:0035615 | clathrin adaptor activity(GO:0035615) endocytic adaptor activity(GO:0098748) |
| 0.3 | 2.1 | GO:0016176 | superoxide-generating NADPH oxidase activator activity(GO:0016176) |
| 0.3 | 2.1 | GO:0030911 | TPR domain binding(GO:0030911) |
| 0.3 | 0.9 | GO:0045155 | electron transporter, transferring electrons from CoQH2-cytochrome c reductase complex and cytochrome c oxidase complex activity(GO:0045155) |
| 0.3 | 0.6 | GO:0098519 | nucleotide phosphatase activity, acting on free nucleotides(GO:0098519) |
| 0.3 | 0.6 | GO:0015433 | peptide antigen-transporting ATPase activity(GO:0015433) |
| 0.3 | 1.8 | GO:0038049 | transcription factor activity, ligand-activated RNA polymerase II transcription factor binding(GO:0038049) |
| 0.3 | 1.2 | GO:0005222 | intracellular cAMP activated cation channel activity(GO:0005222) |
| 0.3 | 1.8 | GO:0004169 | dolichyl-phosphate-mannose-protein mannosyltransferase activity(GO:0004169) |
| 0.3 | 1.8 | GO:0043532 | angiostatin binding(GO:0043532) |
| 0.3 | 1.2 | GO:0043812 | phosphatidylinositol-4-phosphate phosphatase activity(GO:0043812) |
| 0.3 | 1.2 | GO:0001855 | complement component C4b binding(GO:0001855) |
| 0.3 | 5.3 | GO:0015035 | protein disulfide oxidoreductase activity(GO:0015035) |
| 0.3 | 0.3 | GO:0036033 | mediator complex binding(GO:0036033) |
| 0.3 | 1.2 | GO:0022850 | serotonin-gated cation channel activity(GO:0022850) |
| 0.3 | 1.2 | GO:0004376 | glycolipid mannosyltransferase activity(GO:0004376) |
| 0.3 | 2.3 | GO:0004000 | adenosine deaminase activity(GO:0004000) |
| 0.3 | 8.7 | GO:0070003 | threonine-type endopeptidase activity(GO:0004298) threonine-type peptidase activity(GO:0070003) |
| 0.3 | 0.9 | GO:0003983 | UTP:glucose-1-phosphate uridylyltransferase activity(GO:0003983) UTP-monosaccharide-1-phosphate uridylyltransferase activity(GO:0051748) |
| 0.3 | 1.4 | GO:0004882 | androgen receptor activity(GO:0004882) |
| 0.3 | 0.3 | GO:0016595 | glutamate binding(GO:0016595) |
| 0.3 | 1.7 | GO:0008481 | sphinganine kinase activity(GO:0008481) D-erythro-sphingosine kinase activity(GO:0017050) |
| 0.3 | 6.0 | GO:0031683 | G-protein beta/gamma-subunit complex binding(GO:0031683) |
| 0.3 | 0.8 | GO:0010698 | acetyltransferase activator activity(GO:0010698) |
| 0.3 | 1.1 | GO:0003746 | translation elongation factor activity(GO:0003746) |
| 0.3 | 0.8 | GO:0016531 | copper chaperone activity(GO:0016531) |
| 0.3 | 2.5 | GO:0036402 | proteasome-activating ATPase activity(GO:0036402) |
| 0.3 | 0.8 | GO:0008386 | cholesterol monooxygenase (side-chain-cleaving) activity(GO:0008386) |
| 0.3 | 44.0 | GO:0005200 | structural constituent of cytoskeleton(GO:0005200) |
| 0.3 | 1.7 | GO:0004705 | JUN kinase activity(GO:0004705) SAP kinase activity(GO:0016909) |
| 0.3 | 1.1 | GO:0030337 | DNA polymerase processivity factor activity(GO:0030337) |
| 0.3 | 9.3 | GO:0015020 | glucuronosyltransferase activity(GO:0015020) |
| 0.3 | 0.3 | GO:0005330 | dopamine:sodium symporter activity(GO:0005330) |
| 0.3 | 2.5 | GO:0008158 | hedgehog receptor activity(GO:0008158) |
| 0.3 | 1.1 | GO:0003938 | IMP dehydrogenase activity(GO:0003938) |
| 0.3 | 1.6 | GO:0008440 | inositol-1,4,5-trisphosphate 3-kinase activity(GO:0008440) |
| 0.3 | 4.6 | GO:0045505 | dynein intermediate chain binding(GO:0045505) |
| 0.3 | 1.6 | GO:0001849 | complement component C1q binding(GO:0001849) |
| 0.3 | 1.6 | GO:0061649 | ubiquitinated histone binding(GO:0061649) |
| 0.3 | 4.0 | GO:0005092 | GDP-dissociation inhibitor activity(GO:0005092) |
| 0.3 | 4.9 | GO:0001965 | G-protein alpha-subunit binding(GO:0001965) |
| 0.3 | 0.3 | GO:0050508 | glucuronosyl-N-acetylglucosaminyl-proteoglycan 4-alpha-N-acetylglucosaminyltransferase activity(GO:0050508) |
| 0.3 | 1.1 | GO:0004748 | ribonucleoside-diphosphate reductase activity, thioredoxin disulfide as acceptor(GO:0004748) oxidoreductase activity, acting on CH or CH2 groups, disulfide as acceptor(GO:0016728) ribonucleoside-diphosphate reductase activity(GO:0061731) |
| 0.3 | 0.8 | GO:0004766 | spermidine synthase activity(GO:0004766) |
| 0.3 | 3.4 | GO:0001087 | transcription factor activity, sequence-specific DNA binding, RNA polymerase recruiting(GO:0001011) transcription factor activity, TFIIB-class binding(GO:0001087) |
| 0.3 | 0.8 | GO:0033867 | Fas-activated serine/threonine kinase activity(GO:0033867) |
| 0.3 | 0.3 | GO:0017108 | 5'-flap endonuclease activity(GO:0017108) |
| 0.3 | 4.1 | GO:0051537 | 2 iron, 2 sulfur cluster binding(GO:0051537) |
| 0.3 | 0.8 | GO:0016309 | 1-phosphatidylinositol-5-phosphate 4-kinase activity(GO:0016309) |
| 0.3 | 3.1 | GO:0032407 | MutSalpha complex binding(GO:0032407) |
| 0.3 | 0.3 | GO:0032767 | copper-dependent protein binding(GO:0032767) |
| 0.3 | 2.5 | GO:0001730 | 2'-5'-oligoadenylate synthetase activity(GO:0001730) |
| 0.3 | 0.5 | GO:0051021 | GDP-dissociation inhibitor binding(GO:0051021) Rho GDP-dissociation inhibitor binding(GO:0051022) |
| 0.3 | 4.8 | GO:0008327 | methyl-CpG binding(GO:0008327) |
| 0.3 | 0.5 | GO:0005375 | copper ion transmembrane transporter activity(GO:0005375) |
| 0.3 | 1.0 | GO:0016744 | transferase activity, transferring aldehyde or ketonic groups(GO:0016744) |
| 0.3 | 1.8 | GO:0030274 | LIM domain binding(GO:0030274) |
| 0.2 | 0.2 | GO:0031433 | telethonin binding(GO:0031433) |
| 0.2 | 2.0 | GO:0004957 | prostaglandin E receptor activity(GO:0004957) |
| 0.2 | 1.2 | GO:0071208 | histone pre-mRNA DCP binding(GO:0071208) |
| 0.2 | 3.9 | GO:0004691 | cAMP-dependent protein kinase activity(GO:0004691) |
| 0.2 | 0.7 | GO:0004139 | deoxyribose-phosphate aldolase activity(GO:0004139) |
| 0.2 | 0.7 | GO:0031877 | somatostatin receptor binding(GO:0031877) |
| 0.2 | 0.2 | GO:0047498 | calcium-dependent phospholipase A2 activity(GO:0047498) |
| 0.2 | 1.7 | GO:0001640 | adenylate cyclase inhibiting G-protein coupled glutamate receptor activity(GO:0001640) G-protein coupled glutamate receptor activity(GO:0098988) |
| 0.2 | 1.5 | GO:0031705 | bombesin receptor binding(GO:0031705) |
| 0.2 | 8.0 | GO:0000146 | microfilament motor activity(GO:0000146) |
| 0.2 | 1.9 | GO:0004111 | creatine kinase activity(GO:0004111) |
| 0.2 | 1.4 | GO:0008241 | peptidyl-dipeptidase activity(GO:0008241) |
| 0.2 | 5.5 | GO:0008353 | RNA polymerase II carboxy-terminal domain kinase activity(GO:0008353) |
| 0.2 | 0.7 | GO:0016406 | carnitine O-acyltransferase activity(GO:0016406) |
| 0.2 | 0.9 | GO:0042132 | fructose 1,6-bisphosphate 1-phosphatase activity(GO:0042132) |
| 0.2 | 0.7 | GO:0000386 | second spliceosomal transesterification activity(GO:0000386) |
| 0.2 | 0.7 | GO:0051766 | inositol trisphosphate kinase activity(GO:0051766) |
| 0.2 | 0.5 | GO:0019959 | interleukin-8 binding(GO:0019959) |
| 0.2 | 1.4 | GO:1904929 | coreceptor activity involved in Wnt signaling pathway, planar cell polarity pathway(GO:1904929) |
| 0.2 | 2.8 | GO:0008656 | cysteine-type endopeptidase activator activity involved in apoptotic process(GO:0008656) |
| 0.2 | 1.2 | GO:0004645 | phosphorylase activity(GO:0004645) |
| 0.2 | 5.1 | GO:0000339 | RNA cap binding(GO:0000339) |
| 0.2 | 1.1 | GO:0071074 | eukaryotic initiation factor eIF2 binding(GO:0071074) |
| 0.2 | 2.3 | GO:0008428 | ribonuclease inhibitor activity(GO:0008428) |
| 0.2 | 10.2 | GO:0005484 | SNAP receptor activity(GO:0005484) |
| 0.2 | 2.9 | GO:0016538 | cyclin-dependent protein serine/threonine kinase regulator activity(GO:0016538) |
| 0.2 | 0.2 | GO:0016404 | 15-hydroxyprostaglandin dehydrogenase (NAD+) activity(GO:0016404) |
| 0.2 | 0.7 | GO:0034511 | U3 snoRNA binding(GO:0034511) |
| 0.2 | 1.4 | GO:0052656 | branched-chain-amino-acid transaminase activity(GO:0004084) L-leucine transaminase activity(GO:0052654) L-valine transaminase activity(GO:0052655) L-isoleucine transaminase activity(GO:0052656) |
| 0.2 | 3.1 | GO:0043138 | 3'-5' DNA helicase activity(GO:0043138) |
| 0.2 | 1.8 | GO:0004865 | protein serine/threonine phosphatase inhibitor activity(GO:0004865) |
| 0.2 | 55.2 | GO:0004252 | serine-type endopeptidase activity(GO:0004252) |
| 0.2 | 0.4 | GO:0003678 | DNA helicase activity(GO:0003678) |
| 0.2 | 2.9 | GO:0004985 | opioid receptor activity(GO:0004985) |
| 0.2 | 0.4 | GO:0004045 | aminoacyl-tRNA hydrolase activity(GO:0004045) |
| 0.2 | 1.5 | GO:0030021 | extracellular matrix structural constituent conferring compression resistance(GO:0030021) structural constituent of tooth enamel(GO:0030345) |
| 0.2 | 5.0 | GO:0003950 | NAD+ ADP-ribosyltransferase activity(GO:0003950) |
| 0.2 | 3.9 | GO:0015467 | G-protein activated inward rectifier potassium channel activity(GO:0015467) |
| 0.2 | 1.1 | GO:0008073 | ornithine decarboxylase inhibitor activity(GO:0008073) |
| 0.2 | 3.7 | GO:0004143 | diacylglycerol kinase activity(GO:0004143) |
| 0.2 | 0.2 | GO:0016813 | hydrolase activity, acting on carbon-nitrogen (but not peptide) bonds, in linear amidines(GO:0016813) |
| 0.2 | 0.4 | GO:0042903 | tubulin deacetylase activity(GO:0042903) |
| 0.2 | 0.8 | GO:0004132 | dCMP deaminase activity(GO:0004132) |
| 0.2 | 2.5 | GO:0097027 | ubiquitin-protein transferase activator activity(GO:0097027) |
| 0.2 | 0.8 | GO:0004115 | 3',5'-cyclic-AMP phosphodiesterase activity(GO:0004115) |
| 0.2 | 1.5 | GO:0032027 | myosin light chain binding(GO:0032027) |
| 0.2 | 1.0 | GO:0043120 | tumor necrosis factor binding(GO:0043120) |
| 0.2 | 0.6 | GO:0000253 | 3-keto sterol reductase activity(GO:0000253) |
| 0.2 | 7.2 | GO:0019894 | kinesin binding(GO:0019894) |
| 0.2 | 1.0 | GO:0004839 | ubiquitin activating enzyme activity(GO:0004839) |
| 0.2 | 1.0 | GO:0030628 | pre-mRNA 3'-splice site binding(GO:0030628) |
| 0.2 | 5.7 | GO:0071889 | 14-3-3 protein binding(GO:0071889) |
| 0.2 | 0.6 | GO:0004817 | cysteine-tRNA ligase activity(GO:0004817) |
| 0.2 | 0.6 | GO:0004779 | adenylylsulfate kinase activity(GO:0004020) sulfate adenylyltransferase activity(GO:0004779) sulfate adenylyltransferase (ATP) activity(GO:0004781) |
| 0.2 | 0.2 | GO:0005119 | smoothened binding(GO:0005119) |
| 0.2 | 0.6 | GO:0004983 | neuropeptide Y receptor activity(GO:0004983) |
| 0.2 | 1.0 | GO:0005384 | manganese ion transmembrane transporter activity(GO:0005384) |
| 0.2 | 1.6 | GO:0004652 | polynucleotide adenylyltransferase activity(GO:0004652) |
| 0.2 | 4.4 | GO:0005104 | fibroblast growth factor receptor binding(GO:0005104) |
| 0.2 | 0.8 | GO:0048039 | ubiquinone binding(GO:0048039) |
| 0.2 | 0.6 | GO:0004616 | phosphogluconate dehydrogenase (decarboxylating) activity(GO:0004616) |
| 0.2 | 0.6 | GO:0003976 | UDP-N-acetylglucosamine-lysosomal-enzyme N-acetylglucosaminephosphotransferase activity(GO:0003976) |
| 0.2 | 1.2 | GO:0008201 | heparin binding(GO:0008201) |
| 0.2 | 3.7 | GO:0051400 | BH domain binding(GO:0051400) |
| 0.2 | 0.6 | GO:0005381 | iron ion transmembrane transporter activity(GO:0005381) |
| 0.2 | 4.1 | GO:0001055 | RNA polymerase II activity(GO:0001055) |
| 0.2 | 5.0 | GO:0004003 | ATP-dependent DNA helicase activity(GO:0004003) |
| 0.2 | 0.4 | GO:0004365 | glyceraldehyde-3-phosphate dehydrogenase (NAD+) (phosphorylating) activity(GO:0004365) glyceraldehyde-3-phosphate dehydrogenase (NAD(P)+) (phosphorylating) activity(GO:0043891) |
| 0.2 | 8.1 | GO:0061650 | ubiquitin-like protein conjugating enzyme activity(GO:0061650) |
| 0.2 | 0.6 | GO:0005171 | hepatocyte growth factor receptor binding(GO:0005171) |
| 0.2 | 5.4 | GO:0017022 | myosin binding(GO:0017022) |
| 0.2 | 0.2 | GO:0019166 | trans-2-enoyl-CoA reductase (NADPH) activity(GO:0019166) |
| 0.2 | 0.6 | GO:0031727 | CCR2 chemokine receptor binding(GO:0031727) |
| 0.2 | 0.6 | GO:0008310 | single-stranded DNA 3'-5' exodeoxyribonuclease activity(GO:0008310) |
| 0.2 | 0.4 | GO:0047223 | beta-1,3-galactosyl-O-glycosyl-glycoprotein beta-1,3-N-acetylglucosaminyltransferase activity(GO:0047223) |
| 0.2 | 14.4 | GO:0032947 | protein complex scaffold(GO:0032947) |
| 0.2 | 0.9 | GO:0015183 | L-aspartate transmembrane transporter activity(GO:0015183) |
| 0.2 | 13.0 | GO:0005201 | extracellular matrix structural constituent(GO:0005201) |
| 0.2 | 0.2 | GO:0016623 | oxidoreductase activity, acting on the aldehyde or oxo group of donors, oxygen as acceptor(GO:0016623) |
| 0.2 | 0.9 | GO:0004161 | dimethylallyltranstransferase activity(GO:0004161) geranyltranstransferase activity(GO:0004337) |
| 0.2 | 0.7 | GO:0008410 | CoA-transferase activity(GO:0008410) |
| 0.2 | 2.0 | GO:0017070 | U6 snRNA binding(GO:0017070) |
| 0.2 | 0.5 | GO:0051373 | FATZ binding(GO:0051373) |
| 0.2 | 1.5 | GO:0005546 | phosphatidylinositol-4,5-bisphosphate binding(GO:0005546) |
| 0.2 | 0.4 | GO:0017129 | triglyceride binding(GO:0017129) |
| 0.2 | 0.2 | GO:0004813 | alanine-tRNA ligase activity(GO:0004813) |
| 0.2 | 6.7 | GO:0017137 | Rab GTPase binding(GO:0017137) |
| 0.2 | 0.2 | GO:0046573 | lactonohydrolase activity(GO:0046573) acyl-L-homoserine-lactone lactonohydrolase activity(GO:0102007) |
| 0.2 | 5.8 | GO:0004385 | guanylate kinase activity(GO:0004385) |
| 0.2 | 0.2 | GO:0004087 | carbamoyl-phosphate synthase (ammonia) activity(GO:0004087) carbamoyl-phosphate synthase (glutamine-hydrolyzing) activity(GO:0004088) |
| 0.2 | 7.7 | GO:0005544 | calcium-dependent phospholipid binding(GO:0005544) |
| 0.2 | 0.5 | GO:0031748 | D1 dopamine receptor binding(GO:0031748) |
| 0.2 | 0.9 | GO:0004999 | vasoactive intestinal polypeptide receptor activity(GO:0004999) |
| 0.2 | 0.4 | GO:0030296 | protein tyrosine kinase activator activity(GO:0030296) |
| 0.2 | 1.0 | GO:0008079 | translation release factor activity(GO:0003747) translation termination factor activity(GO:0008079) |
| 0.2 | 0.2 | GO:0047238 | glucuronosyl-N-acetylgalactosaminyl-proteoglycan 4-beta-N-acetylgalactosaminyltransferase activity(GO:0047238) |
| 0.2 | 0.3 | GO:0034437 | glycoprotein transporter activity(GO:0034437) |
| 0.2 | 1.2 | GO:0003810 | protein-glutamine gamma-glutamyltransferase activity(GO:0003810) |
| 0.2 | 0.5 | GO:0004962 | endothelin receptor activity(GO:0004962) |
| 0.2 | 0.7 | GO:0046935 | 1-phosphatidylinositol-3-kinase regulator activity(GO:0046935) |
| 0.2 | 0.5 | GO:0008172 | S-methyltransferase activity(GO:0008172) |
| 0.2 | 1.4 | GO:0019788 | NEDD8 transferase activity(GO:0019788) |
| 0.2 | 0.7 | GO:0004461 | lactose synthase activity(GO:0004461) |
| 0.2 | 0.5 | GO:0036435 | K48-linked polyubiquitin binding(GO:0036435) |
| 0.2 | 0.3 | GO:0005047 | signal recognition particle binding(GO:0005047) |
| 0.2 | 0.2 | GO:0004966 | galanin receptor activity(GO:0004966) |
| 0.2 | 1.7 | GO:0043995 | histone acetyltransferase activity (H4-K5 specific)(GO:0043995) histone acetyltransferase activity (H4-K8 specific)(GO:0043996) histone acetyltransferase activity (H4-K16 specific)(GO:0046972) |
| 0.2 | 0.7 | GO:0004740 | pyruvate dehydrogenase (acetyl-transferring) kinase activity(GO:0004740) |
| 0.2 | 0.2 | GO:0047184 | 1-acylglycerophosphocholine O-acyltransferase activity(GO:0047184) |
| 0.2 | 1.0 | GO:1990446 | U1 snRNP binding(GO:1990446) |
| 0.2 | 2.6 | GO:0071855 | neuropeptide receptor binding(GO:0071855) |
| 0.2 | 1.0 | GO:0008821 | crossover junction endodeoxyribonuclease activity(GO:0008821) |
| 0.2 | 4.6 | GO:0017025 | TBP-class protein binding(GO:0017025) |
| 0.2 | 1.0 | GO:0016433 | rRNA (adenine) methyltransferase activity(GO:0016433) |
| 0.2 | 1.0 | GO:0017150 | tRNA dihydrouridine synthase activity(GO:0017150) |
| 0.2 | 1.8 | GO:0070679 | inositol 1,4,5 trisphosphate binding(GO:0070679) |
| 0.2 | 0.7 | GO:0004723 | calcium-dependent protein serine/threonine phosphatase activity(GO:0004723) |
| 0.2 | 52.3 | GO:0045296 | cadherin binding(GO:0045296) |
| 0.2 | 1.9 | GO:0016886 | ligase activity, forming phosphoric ester bonds(GO:0016886) |
| 0.2 | 0.6 | GO:0008336 | gamma-butyrobetaine dioxygenase activity(GO:0008336) |
| 0.2 | 0.2 | GO:0004909 | interleukin-1, Type I, activating receptor activity(GO:0004909) |
| 0.2 | 0.2 | GO:0061628 | H3K27me3 modified histone binding(GO:0061628) |
| 0.2 | 0.3 | GO:0005459 | UDP-galactose transmembrane transporter activity(GO:0005459) |
| 0.2 | 0.3 | GO:0019763 | immunoglobulin receptor activity(GO:0019763) |
| 0.2 | 7.6 | GO:0008137 | NADH dehydrogenase (ubiquinone) activity(GO:0008137) NADH dehydrogenase (quinone) activity(GO:0050136) |
| 0.2 | 1.3 | GO:0043142 | single-stranded DNA-dependent ATPase activity(GO:0043142) |
| 0.2 | 0.6 | GO:0016882 | cyclo-ligase activity(GO:0016882) |
| 0.2 | 1.3 | GO:0042301 | phosphate ion binding(GO:0042301) |
| 0.2 | 0.8 | GO:0047820 | D-glutamate cyclase activity(GO:0047820) |
| 0.2 | 0.3 | GO:0035198 | miRNA binding(GO:0035198) |
| 0.2 | 1.4 | GO:0008199 | ferric iron binding(GO:0008199) |
| 0.2 | 0.5 | GO:0017057 | 6-phosphogluconolactonase activity(GO:0017057) |
| 0.2 | 0.8 | GO:0016765 | transferase activity, transferring alkyl or aryl (other than methyl) groups(GO:0016765) |
| 0.2 | 0.5 | GO:0004874 | aryl hydrocarbon receptor activity(GO:0004874) |
| 0.2 | 0.3 | GO:0008525 | phosphatidylcholine transporter activity(GO:0008525) |
| 0.2 | 0.2 | GO:0017098 | sulfonylurea receptor binding(GO:0017098) |
| 0.2 | 0.5 | GO:0015226 | amino-acid betaine transmembrane transporter activity(GO:0015199) carnitine transmembrane transporter activity(GO:0015226) |
| 0.1 | 0.4 | GO:0004853 | uroporphyrinogen decarboxylase activity(GO:0004853) |
| 0.1 | 0.7 | GO:0005219 | ryanodine-sensitive calcium-release channel activity(GO:0005219) |
| 0.1 | 0.4 | GO:0004711 | ribosomal protein S6 kinase activity(GO:0004711) |
| 0.1 | 1.5 | GO:0035240 | dopamine binding(GO:0035240) |
| 0.1 | 2.0 | GO:0070402 | NADPH binding(GO:0070402) |
| 0.1 | 2.6 | GO:0070001 | aspartic-type endopeptidase activity(GO:0004190) aspartic-type peptidase activity(GO:0070001) |
| 0.1 | 0.3 | GO:0008046 | axon guidance receptor activity(GO:0008046) |
| 0.1 | 0.4 | GO:0004775 | succinate-CoA ligase activity(GO:0004774) succinate-CoA ligase (ADP-forming) activity(GO:0004775) |
| 0.1 | 0.6 | GO:0008900 | hydrogen:potassium-exchanging ATPase activity(GO:0008900) |
| 0.1 | 0.4 | GO:0004730 | pseudouridylate synthase activity(GO:0004730) |
| 0.1 | 0.3 | GO:0023029 | MHC class Ib protein binding(GO:0023029) |
| 0.1 | 0.1 | GO:1990841 | promoter-specific chromatin binding(GO:1990841) |
| 0.1 | 0.3 | GO:0008271 | secondary active sulfate transmembrane transporter activity(GO:0008271) |
| 0.1 | 0.4 | GO:0102008 | cytosolic dipeptidase activity(GO:0102008) |
| 0.1 | 1.1 | GO:0003682 | chromatin binding(GO:0003682) |
| 0.1 | 0.4 | GO:0005549 | odorant binding(GO:0005549) |
| 0.1 | 2.6 | GO:0019956 | chemokine binding(GO:0019956) |
| 0.1 | 3.2 | GO:0046933 | proton-transporting ATP synthase activity, rotational mechanism(GO:0046933) |
| 0.1 | 5.0 | GO:0004693 | cyclin-dependent protein serine/threonine kinase activity(GO:0004693) |
| 0.1 | 0.4 | GO:0032427 | GBD domain binding(GO:0032427) |
| 0.1 | 0.1 | GO:0016755 | transferase activity, transferring amino-acyl groups(GO:0016755) |
| 0.1 | 2.0 | GO:0042288 | MHC class I protein binding(GO:0042288) |
| 0.1 | 2.6 | GO:0010857 | calcium-dependent protein serine/threonine kinase activity(GO:0009931) calcium-dependent protein kinase activity(GO:0010857) |
| 0.1 | 0.1 | GO:0016832 | aldehyde-lyase activity(GO:0016832) |
| 0.1 | 1.2 | GO:0048019 | receptor antagonist activity(GO:0048019) |
| 0.1 | 1.8 | GO:0015095 | magnesium ion transmembrane transporter activity(GO:0015095) |
| 0.1 | 0.5 | GO:0016361 | activin receptor activity, type I(GO:0016361) |
| 0.1 | 0.4 | GO:0004924 | oncostatin-M receptor activity(GO:0004924) |
| 0.1 | 0.5 | GO:0016499 | orexin receptor activity(GO:0016499) |
| 0.1 | 0.6 | GO:0004704 | NF-kappaB-inducing kinase activity(GO:0004704) |
| 0.1 | 4.5 | GO:0000175 | 3'-5'-exoribonuclease activity(GO:0000175) |
| 0.1 | 1.0 | GO:0008301 | DNA binding, bending(GO:0008301) |
| 0.1 | 1.3 | GO:0017176 | phosphatidylinositol N-acetylglucosaminyltransferase activity(GO:0017176) |
| 0.1 | 0.3 | GO:0034452 | dynactin binding(GO:0034452) |
| 0.1 | 0.6 | GO:0036122 | BMP binding(GO:0036122) |
| 0.1 | 0.9 | GO:0000268 | peroxisome targeting sequence binding(GO:0000268) |
| 0.1 | 0.6 | GO:0051425 | PTB domain binding(GO:0051425) |
| 0.1 | 1.2 | GO:0004117 | calmodulin-dependent cyclic-nucleotide phosphodiesterase activity(GO:0004117) |
| 0.1 | 1.2 | GO:0016018 | cyclosporin A binding(GO:0016018) |
| 0.1 | 0.6 | GO:0048156 | tau protein binding(GO:0048156) |
| 0.1 | 0.6 | GO:0031681 | G-protein beta-subunit binding(GO:0031681) |
| 0.1 | 0.5 | GO:0004963 | follicle-stimulating hormone receptor activity(GO:0004963) |
| 0.1 | 0.7 | GO:0016713 | oxidoreductase activity, acting on paired donors, with incorporation or reduction of molecular oxygen, reduced iron-sulfur protein as one donor, and incorporation of one atom of oxygen(GO:0016713) |
| 0.1 | 0.2 | GO:0045322 | unmethylated CpG binding(GO:0045322) |
| 0.1 | 0.4 | GO:0043423 | 3-phosphoinositide-dependent protein kinase binding(GO:0043423) |
| 0.1 | 0.6 | GO:0004994 | somatostatin receptor activity(GO:0004994) |
| 0.1 | 0.1 | GO:0005221 | intracellular cyclic nucleotide activated cation channel activity(GO:0005221) cyclic nucleotide-gated ion channel activity(GO:0043855) |
| 0.1 | 2.9 | GO:0005272 | sodium channel activity(GO:0005272) |
| 0.1 | 1.9 | GO:0097602 | cullin family protein binding(GO:0097602) |
| 0.1 | 2.5 | GO:0051721 | protein phosphatase 2A binding(GO:0051721) |
| 0.1 | 0.6 | GO:0004445 | inositol-polyphosphate 5-phosphatase activity(GO:0004445) |
| 0.1 | 1.0 | GO:0070696 | transmembrane receptor protein serine/threonine kinase binding(GO:0070696) |
| 0.1 | 0.7 | GO:0005242 | inward rectifier potassium channel activity(GO:0005242) |
| 0.1 | 0.4 | GO:0001094 | TFIID-class transcription factor binding(GO:0001094) |
| 0.1 | 1.7 | GO:0004745 | retinol dehydrogenase activity(GO:0004745) |
| 0.1 | 0.1 | GO:0015440 | peptide-transporting ATPase activity(GO:0015440) |
| 0.1 | 0.9 | GO:0004303 | estradiol 17-beta-dehydrogenase activity(GO:0004303) |
| 0.1 | 0.4 | GO:0004531 | deoxyribonuclease II activity(GO:0004531) |
| 0.1 | 0.1 | GO:0005315 | inorganic phosphate transmembrane transporter activity(GO:0005315) |
| 0.1 | 0.1 | GO:0003689 | DNA clamp loader activity(GO:0003689) protein-DNA loading ATPase activity(GO:0033170) |
| 0.1 | 0.6 | GO:0004687 | myosin light chain kinase activity(GO:0004687) |
| 0.1 | 0.5 | GO:0004468 | lysine N-acetyltransferase activity, acting on acetyl phosphate as donor(GO:0004468) |
| 0.1 | 1.1 | GO:0043621 | protein self-association(GO:0043621) |
| 0.1 | 3.0 | GO:0044183 | protein binding involved in protein folding(GO:0044183) |
| 0.1 | 0.1 | GO:0004040 | amidase activity(GO:0004040) |
| 0.1 | 0.2 | GO:1901612 | phosphatidylglycerol binding(GO:1901611) cardiolipin binding(GO:1901612) |
| 0.1 | 1.4 | GO:0098847 | sequence-specific single stranded DNA binding(GO:0098847) |
| 0.1 | 0.5 | GO:0000155 | phosphorelay sensor kinase activity(GO:0000155) |
| 0.1 | 5.9 | GO:0008307 | structural constituent of muscle(GO:0008307) |
| 0.1 | 0.5 | GO:0016520 | growth hormone-releasing hormone receptor activity(GO:0016520) |
| 0.1 | 0.1 | GO:1902282 | voltage-gated potassium channel activity involved in ventricular cardiac muscle cell action potential repolarization(GO:1902282) |
| 0.1 | 2.0 | GO:0045504 | dynein heavy chain binding(GO:0045504) |
| 0.1 | 0.4 | GO:0015143 | urate transmembrane transporter activity(GO:0015143) salt transmembrane transporter activity(GO:1901702) |
| 0.1 | 0.4 | GO:0016748 | succinyltransferase activity(GO:0016748) |
| 0.1 | 2.0 | GO:0005251 | delayed rectifier potassium channel activity(GO:0005251) |
| 0.1 | 2.7 | GO:0008191 | metalloendopeptidase inhibitor activity(GO:0008191) |
| 0.1 | 0.1 | GO:0004677 | DNA-dependent protein kinase activity(GO:0004677) |
| 0.1 | 0.3 | GO:0004797 | thymidine kinase activity(GO:0004797) |
| 0.1 | 0.3 | GO:0004392 | heme oxygenase (decyclizing) activity(GO:0004392) |
| 0.1 | 2.4 | GO:0046875 | ephrin receptor binding(GO:0046875) |
| 0.1 | 0.5 | GO:0004991 | parathyroid hormone receptor activity(GO:0004991) |
| 0.1 | 0.2 | GO:0005080 | protein kinase C binding(GO:0005080) |
| 0.1 | 1.6 | GO:0016500 | protein-hormone receptor activity(GO:0016500) |
| 0.1 | 1.4 | GO:0019201 | nucleotide kinase activity(GO:0019201) |
| 0.1 | 0.2 | GO:0019237 | centromeric DNA binding(GO:0019237) |
| 0.1 | 0.1 | GO:0008297 | single-stranded DNA exodeoxyribonuclease activity(GO:0008297) |
| 0.1 | 0.3 | GO:0034237 | protein kinase A regulatory subunit binding(GO:0034237) |
| 0.1 | 0.5 | GO:0015252 | hydrogen ion channel activity(GO:0015252) |
| 0.1 | 0.2 | GO:0005113 | patched binding(GO:0005113) |
| 0.1 | 0.3 | GO:0004492 | methylmalonyl-CoA decarboxylase activity(GO:0004492) |
| 0.1 | 0.3 | GO:0004608 | phosphatidyl-N-methylethanolamine N-methyltransferase activity(GO:0000773) phosphatidylethanolamine N-methyltransferase activity(GO:0004608) phosphatidyl-N-dimethylethanolamine N-methyltransferase activity(GO:0080101) |
| 0.1 | 1.9 | GO:0045028 | G-protein coupled nucleotide receptor activity(GO:0001608) G-protein coupled purinergic nucleotide receptor activity(GO:0045028) |
| 0.1 | 0.1 | GO:0031543 | peptidyl-proline dioxygenase activity(GO:0031543) |
| 0.1 | 0.6 | GO:0008379 | thioredoxin peroxidase activity(GO:0008379) |
| 0.1 | 0.5 | GO:0002046 | opsin binding(GO:0002046) |
| 0.1 | 0.4 | GO:0004312 | fatty acid synthase activity(GO:0004312) |
| 0.1 | 2.3 | GO:0005520 | insulin-like growth factor binding(GO:0005520) |
| 0.1 | 0.4 | GO:0005477 | pyruvate secondary active transmembrane transporter activity(GO:0005477) |
| 0.1 | 3.6 | GO:0035035 | histone acetyltransferase binding(GO:0035035) |
| 0.1 | 0.2 | GO:0008252 | nucleotidase activity(GO:0008252) |
| 0.1 | 4.0 | GO:0050839 | cell adhesion molecule binding(GO:0050839) |
| 0.1 | 1.9 | GO:0005527 | macrolide binding(GO:0005527) FK506 binding(GO:0005528) |
| 0.1 | 0.3 | GO:0002113 | interleukin-33 binding(GO:0002113) |
| 0.1 | 0.3 | GO:0004913 | interleukin-4 receptor activity(GO:0004913) |
| 0.1 | 0.2 | GO:0046965 | retinoid X receptor binding(GO:0046965) |
| 0.1 | 0.2 | GO:0004470 | malic enzyme activity(GO:0004470) |
| 0.1 | 1.9 | GO:0000217 | DNA secondary structure binding(GO:0000217) |
| 0.1 | 0.3 | GO:0030957 | Tat protein binding(GO:0030957) |
| 0.1 | 1.3 | GO:0009881 | photoreceptor activity(GO:0009881) |
| 0.1 | 0.4 | GO:0043023 | ribosomal large subunit binding(GO:0043023) |
| 0.1 | 0.2 | GO:0017018 | myosin phosphatase activity(GO:0017018) |
| 0.1 | 3.1 | GO:0036002 | pre-mRNA binding(GO:0036002) |
| 0.1 | 1.5 | GO:0005523 | tropomyosin binding(GO:0005523) |
| 0.1 | 0.3 | GO:0047631 | ADP-ribose diphosphatase activity(GO:0047631) |
| 0.1 | 0.3 | GO:0047696 | beta-adrenergic receptor kinase activity(GO:0047696) |
| 0.1 | 0.3 | GO:0033906 | hyaluronoglucuronidase activity(GO:0033906) |
| 0.1 | 1.1 | GO:0019206 | nucleoside kinase activity(GO:0019206) |
| 0.1 | 0.2 | GO:0008142 | oxysterol binding(GO:0008142) |
| 0.1 | 1.0 | GO:0005049 | nuclear export signal receptor activity(GO:0005049) |
| 0.1 | 17.0 | GO:0003924 | GTPase activity(GO:0003924) |
| 0.1 | 0.4 | GO:0043295 | glutathione binding(GO:0043295) |
| 0.1 | 2.7 | GO:0043425 | bHLH transcription factor binding(GO:0043425) |
| 0.1 | 0.8 | GO:0016836 | hydro-lyase activity(GO:0016836) |
| 0.1 | 0.4 | GO:0046527 | glucosyltransferase activity(GO:0046527) |
| 0.1 | 9.7 | GO:0005178 | integrin binding(GO:0005178) |
| 0.1 | 0.5 | GO:0003917 | DNA topoisomerase type I activity(GO:0003917) |
| 0.1 | 0.3 | GO:0001875 | lipopolysaccharide receptor activity(GO:0001875) |
| 0.1 | 0.6 | GO:0005332 | gamma-aminobutyric acid:sodium symporter activity(GO:0005332) gamma-aminobutyric acid transmembrane transporter activity(GO:0015185) |
| 0.1 | 0.4 | GO:0015350 | reduced folate carrier activity(GO:0008518) methotrexate transporter activity(GO:0015350) |
| 0.1 | 0.6 | GO:0008093 | cytoskeletal adaptor activity(GO:0008093) |
| 0.1 | 0.9 | GO:0030883 | lipid antigen binding(GO:0030882) endogenous lipid antigen binding(GO:0030883) exogenous lipid antigen binding(GO:0030884) |
| 0.1 | 0.5 | GO:0000182 | rDNA binding(GO:0000182) |
| 0.1 | 0.5 | GO:0005000 | vasopressin receptor activity(GO:0005000) |
| 0.1 | 0.1 | GO:0034714 | type III transforming growth factor beta receptor binding(GO:0034714) |
| 0.1 | 3.7 | GO:0004364 | glutathione transferase activity(GO:0004364) |
| 0.1 | 1.0 | GO:0001075 | transcription factor activity, RNA polymerase II core promoter sequence-specific binding involved in preinitiation complex assembly(GO:0001075) |
| 0.1 | 0.2 | GO:0004052 | arachidonate 12-lipoxygenase activity(GO:0004052) |
| 0.1 | 0.4 | GO:0004105 | choline-phosphate cytidylyltransferase activity(GO:0004105) |
| 0.1 | 2.0 | GO:0017056 | structural constituent of nuclear pore(GO:0017056) |
| 0.1 | 35.6 | GO:0005198 | structural molecule activity(GO:0005198) |
| 0.1 | 0.4 | GO:0016427 | tRNA (cytosine) methyltransferase activity(GO:0016427) |
| 0.1 | 0.1 | GO:0030343 | vitamin D3 25-hydroxylase activity(GO:0030343) vitamin D 25-hydroxylase activity(GO:0070643) |
| 0.1 | 1.5 | GO:0070182 | DNA polymerase binding(GO:0070182) |
| 0.1 | 0.3 | GO:0031493 | nucleosomal histone binding(GO:0031493) |
| 0.1 | 0.1 | GO:0019869 | chloride channel inhibitor activity(GO:0019869) |
| 0.1 | 0.3 | GO:0003796 | lysozyme activity(GO:0003796) |
| 0.1 | 1.4 | GO:0004435 | phosphatidylinositol phospholipase C activity(GO:0004435) |
| 0.1 | 0.2 | GO:0001540 | beta-amyloid binding(GO:0001540) |
| 0.1 | 3.3 | GO:0042379 | chemokine receptor binding(GO:0042379) |
| 0.1 | 2.5 | GO:0070888 | E-box binding(GO:0070888) |
| 0.1 | 0.3 | GO:0004738 | pyruvate dehydrogenase activity(GO:0004738) pyruvate dehydrogenase [NAD(P)+] activity(GO:0034603) pyruvate dehydrogenase (NAD+) activity(GO:0034604) |
| 0.1 | 1.5 | GO:0050811 | GABA receptor binding(GO:0050811) |
| 0.1 | 0.2 | GO:0016019 | peptidoglycan receptor activity(GO:0016019) |
| 0.1 | 2.8 | GO:0005245 | voltage-gated calcium channel activity(GO:0005245) |
| 0.1 | 2.5 | GO:0015301 | anion:anion antiporter activity(GO:0015301) |
| 0.1 | 1.3 | GO:0001106 | RNA polymerase II transcription corepressor activity(GO:0001106) |
| 0.1 | 0.5 | GO:0004972 | NMDA glutamate receptor activity(GO:0004972) |
| 0.1 | 0.2 | GO:0051011 | microtubule minus-end binding(GO:0051011) |
| 0.1 | 0.4 | GO:0030332 | cyclin binding(GO:0030332) |
| 0.1 | 0.1 | GO:1904288 | BAT3 complex binding(GO:1904288) |
| 0.1 | 2.2 | GO:0005035 | tumor necrosis factor-activated receptor activity(GO:0005031) death receptor activity(GO:0005035) |
| 0.1 | 0.2 | GO:1990430 | extracellular matrix protein binding(GO:1990430) |
| 0.1 | 0.2 | GO:0046974 | histone methyltransferase activity (H3-K9 specific)(GO:0046974) |
| 0.1 | 2.0 | GO:0003887 | DNA-directed DNA polymerase activity(GO:0003887) |
| 0.1 | 0.2 | GO:0004914 | interleukin-5 receptor activity(GO:0004914) |
| 0.1 | 0.2 | GO:0043531 | ADP binding(GO:0043531) |
| 0.1 | 0.5 | GO:0070513 | death domain binding(GO:0070513) |
| 0.1 | 1.6 | GO:0005388 | calcium-transporting ATPase activity(GO:0005388) |
| 0.1 | 0.3 | GO:1990381 | ubiquitin-specific protease binding(GO:1990381) |
| 0.1 | 0.2 | GO:0003954 | NADH dehydrogenase activity(GO:0003954) |
| 0.1 | 0.1 | GO:0070035 | ATP-dependent helicase activity(GO:0008026) purine NTP-dependent helicase activity(GO:0070035) |
| 0.1 | 0.2 | GO:0003998 | acylphosphatase activity(GO:0003998) |
| 0.1 | 1.7 | GO:0001071 | nucleic acid binding transcription factor activity(GO:0001071) transcription factor activity, sequence-specific DNA binding(GO:0003700) |
| 0.1 | 1.5 | GO:0016701 | oxidoreductase activity, acting on single donors with incorporation of molecular oxygen(GO:0016701) |
| 0.1 | 0.2 | GO:0004307 | ethanolaminephosphotransferase activity(GO:0004307) |
| 0.1 | 0.1 | GO:0071813 | lipoprotein particle binding(GO:0071813) protein-lipid complex binding(GO:0071814) |
| 0.1 | 0.2 | GO:0004090 | carbonyl reductase (NADPH) activity(GO:0004090) |
| 0.1 | 0.1 | GO:0004915 | interleukin-6 receptor activity(GO:0004915) interleukin-6 binding(GO:0019981) |
| 0.1 | 0.7 | GO:0071837 | HMG box domain binding(GO:0071837) |
| 0.1 | 0.6 | GO:0031419 | cobalamin binding(GO:0031419) |
| 0.1 | 0.2 | GO:0004937 | alpha1-adrenergic receptor activity(GO:0004937) |
| 0.1 | 0.2 | GO:0004967 | glucagon receptor activity(GO:0004967) |
| 0.1 | 1.8 | GO:0005001 | transmembrane receptor protein tyrosine phosphatase activity(GO:0005001) transmembrane receptor protein phosphatase activity(GO:0019198) |
| 0.1 | 0.3 | GO:0035939 | microsatellite binding(GO:0035939) |
| 0.1 | 1.5 | GO:0051059 | NF-kappaB binding(GO:0051059) |
| 0.1 | 0.2 | GO:0008140 | cAMP response element binding protein binding(GO:0008140) |
| 0.1 | 0.2 | GO:0008532 | N-acetyllactosaminide beta-1,3-N-acetylglucosaminyltransferase activity(GO:0008532) |
| 0.1 | 0.1 | GO:0005314 | high-affinity glutamate transmembrane transporter activity(GO:0005314) |
| 0.1 | 3.6 | GO:0017112 | Rab guanyl-nucleotide exchange factor activity(GO:0017112) |
| 0.1 | 0.1 | GO:0016891 | endoribonuclease activity, producing 5'-phosphomonoesters(GO:0016891) |
| 0.1 | 0.6 | GO:0030276 | clathrin binding(GO:0030276) |
| 0.1 | 2.7 | GO:0050681 | androgen receptor binding(GO:0050681) |
| 0.1 | 0.3 | GO:0005412 | glucose:sodium symporter activity(GO:0005412) |
| 0.1 | 0.2 | GO:0015204 | urea transmembrane transporter activity(GO:0015204) |
| 0.1 | 0.1 | GO:0005536 | glucose binding(GO:0005536) |
| 0.1 | 0.3 | GO:0008508 | bile acid:sodium symporter activity(GO:0008508) |
| 0.1 | 0.3 | GO:0005166 | neurotrophin p75 receptor binding(GO:0005166) |
| 0.1 | 0.7 | GO:0008503 | benzodiazepine receptor activity(GO:0008503) |
| 0.1 | 0.1 | GO:0008494 | translation activator activity(GO:0008494) |
| 0.1 | 0.2 | GO:0070878 | primary miRNA binding(GO:0070878) |
| 0.1 | 0.1 | GO:0030547 | receptor inhibitor activity(GO:0030547) |
| 0.1 | 0.8 | GO:0004806 | triglyceride lipase activity(GO:0004806) |
| 0.1 | 0.1 | GO:0043015 | gamma-tubulin binding(GO:0043015) |
| 0.1 | 1.7 | GO:0008066 | glutamate receptor activity(GO:0008066) |
| 0.1 | 0.2 | GO:1901682 | sulfur compound transmembrane transporter activity(GO:1901682) |
| 0.1 | 0.2 | GO:0016833 | oxo-acid-lyase activity(GO:0016833) |
| 0.1 | 1.5 | GO:0000993 | RNA polymerase II core binding(GO:0000993) |
| 0.1 | 0.2 | GO:0000099 | sulfur amino acid transmembrane transporter activity(GO:0000099) |
| 0.1 | 0.1 | GO:0034040 | lipid-transporting ATPase activity(GO:0034040) |
| 0.1 | 0.9 | GO:0005132 | type I interferon receptor binding(GO:0005132) |
| 0.1 | 0.3 | GO:0001594 | trace-amine receptor activity(GO:0001594) |
| 0.1 | 0.7 | GO:0019205 | nucleobase-containing compound kinase activity(GO:0019205) |
| 0.1 | 0.3 | GO:0046976 | histone methyltransferase activity (H3-K27 specific)(GO:0046976) |
| 0.1 | 0.2 | GO:0001181 | transcription factor activity, core RNA polymerase I binding(GO:0001181) |
| 0.1 | 0.5 | GO:0004568 | chitinase activity(GO:0004568) chitin binding(GO:0008061) |
| 0.1 | 0.2 | GO:0005250 | A-type (transient outward) potassium channel activity(GO:0005250) |
| 0.1 | 0.2 | GO:0004379 | glycylpeptide N-tetradecanoyltransferase activity(GO:0004379) myristoyltransferase activity(GO:0019107) |
| 0.1 | 5.7 | GO:0051015 | actin filament binding(GO:0051015) |
| 0.1 | 3.8 | GO:0004175 | endopeptidase activity(GO:0004175) |
| 0.1 | 0.1 | GO:0004832 | valine-tRNA ligase activity(GO:0004832) |
| 0.1 | 0.3 | GO:0004668 | protein-arginine deiminase activity(GO:0004668) |
| 0.1 | 0.2 | GO:0015222 | serotonin transmembrane transporter activity(GO:0015222) |
| 0.1 | 0.2 | GO:0004982 | N-formyl peptide receptor activity(GO:0004982) |
| 0.1 | 0.3 | GO:0005436 | sodium:phosphate symporter activity(GO:0005436) |
| 0.1 | 0.1 | GO:0015245 | fatty acid transporter activity(GO:0015245) |
| 0.1 | 1.4 | GO:0008139 | nuclear localization sequence binding(GO:0008139) |
| 0.1 | 0.6 | GO:0004065 | arylsulfatase activity(GO:0004065) |
| 0.1 | 23.4 | GO:0005509 | calcium ion binding(GO:0005509) |
| 0.1 | 0.2 | GO:0004822 | isoleucine-tRNA ligase activity(GO:0004822) |
| 0.1 | 0.2 | GO:0002114 | interleukin-33 receptor activity(GO:0002114) |
| 0.1 | 0.1 | GO:0010181 | FMN binding(GO:0010181) |
| 0.1 | 0.7 | GO:0005003 | ephrin receptor activity(GO:0005003) |
| 0.1 | 0.2 | GO:0004960 | thromboxane receptor activity(GO:0004960) thromboxane A2 receptor activity(GO:0004961) |
| 0.1 | 1.1 | GO:0030553 | cGMP binding(GO:0030553) |
| 0.1 | 0.3 | GO:0030250 | cyclase activator activity(GO:0010853) guanylate cyclase activator activity(GO:0030250) |
| 0.1 | 0.2 | GO:0004060 | arylamine N-acetyltransferase activity(GO:0004060) |
| 0.1 | 3.7 | GO:0005070 | SH3/SH2 adaptor activity(GO:0005070) |
| 0.0 | 0.3 | GO:0032393 | MHC class I receptor activity(GO:0032393) |
| 0.0 | 0.2 | GO:0001530 | lipopolysaccharide binding(GO:0001530) |
| 0.0 | 1.6 | GO:0017048 | Rho GTPase binding(GO:0017048) |
| 0.0 | 0.6 | GO:0016814 | hydrolase activity, acting on carbon-nitrogen (but not peptide) bonds, in cyclic amidines(GO:0016814) |
| 0.0 | 0.1 | GO:0050698 | proteoglycan sulfotransferase activity(GO:0050698) |
| 0.0 | 0.0 | GO:0034236 | protein kinase A catalytic subunit binding(GO:0034236) |
| 0.0 | 0.4 | GO:0017110 | nucleoside-diphosphatase activity(GO:0017110) |
| 0.0 | 0.4 | GO:0015299 | solute:proton antiporter activity(GO:0015299) |
| 0.0 | 3.4 | GO:0044325 | ion channel binding(GO:0044325) |
| 0.0 | 0.4 | GO:0004536 | deoxyribonuclease activity(GO:0004536) |
| 0.0 | 0.0 | GO:1990189 | peptide-serine-N-acetyltransferase activity(GO:1990189) |
| 0.0 | 0.1 | GO:0016429 | tRNA (adenine) methyltransferase activity(GO:0016426) tRNA (adenine-N1-)-methyltransferase activity(GO:0016429) |
| 0.0 | 0.1 | GO:0004703 | G-protein coupled receptor kinase activity(GO:0004703) |
| 0.0 | 1.1 | GO:0004383 | guanylate cyclase activity(GO:0004383) |
| 0.0 | 0.1 | GO:0003696 | satellite DNA binding(GO:0003696) |
| 0.0 | 0.2 | GO:0042834 | peptidoglycan binding(GO:0042834) |
| 0.0 | 0.1 | GO:0004878 | complement component C5a receptor activity(GO:0004878) |
| 0.0 | 0.1 | GO:0071933 | Arp2/3 complex binding(GO:0071933) |
| 0.0 | 0.7 | GO:0017046 | peptide hormone binding(GO:0017046) |
| 0.0 | 0.5 | GO:0005337 | nucleoside transmembrane transporter activity(GO:0005337) |
| 0.0 | 0.2 | GO:1904492 | Ac-Asp-Glu binding(GO:1904492) tetrahydrofolyl-poly(glutamate) polymer binding(GO:1904493) |
| 0.0 | 0.0 | GO:0042813 | Wnt-activated receptor activity(GO:0042813) |
| 0.0 | 0.8 | GO:0030544 | Hsp70 protein binding(GO:0030544) |
| 0.0 | 2.7 | GO:0000979 | RNA polymerase II core promoter sequence-specific DNA binding(GO:0000979) |
| 0.0 | 0.4 | GO:0015631 | tubulin binding(GO:0015631) |
| 0.0 | 0.0 | GO:0004908 | interleukin-1 receptor activity(GO:0004908) |
| 0.0 | 0.2 | GO:0015278 | calcium-release channel activity(GO:0015278) ligand-gated calcium channel activity(GO:0099604) |
| 0.0 | 0.1 | GO:0001206 | transcriptional repressor activity, RNA polymerase II distal enhancer sequence-specific binding(GO:0001206) |
| 0.0 | 0.3 | GO:0004563 | beta-N-acetylhexosaminidase activity(GO:0004563) |
| 0.0 | 0.1 | GO:0036310 | annealing helicase activity(GO:0036310) |
| 0.0 | 0.5 | GO:0035258 | steroid hormone receptor binding(GO:0035258) |
| 0.0 | 0.1 | GO:0015375 | neutral L-amino acid secondary active transmembrane transporter activity(GO:0005294) glycine:sodium symporter activity(GO:0015375) |
| 0.0 | 1.6 | GO:0034987 | immunoglobulin receptor binding(GO:0034987) |
| 0.0 | 0.4 | GO:0017147 | Wnt-protein binding(GO:0017147) |
| 0.0 | 0.4 | GO:0043548 | phosphatidylinositol 3-kinase binding(GO:0043548) |
| 0.0 | 0.1 | GO:0005165 | neurotrophin receptor binding(GO:0005165) |
| 0.0 | 1.6 | GO:0004984 | olfactory receptor activity(GO:0004984) |
| 0.0 | 0.2 | GO:0016286 | small conductance calcium-activated potassium channel activity(GO:0016286) |
| 0.0 | 0.1 | GO:0016899 | oxidoreductase activity, acting on the CH-OH group of donors, oxygen as acceptor(GO:0016899) |
| 0.0 | 0.3 | GO:0042056 | chemoattractant activity(GO:0042056) |
| 0.0 | 0.2 | GO:0008484 | sulfuric ester hydrolase activity(GO:0008484) |
| 0.0 | 0.1 | GO:0016434 | rRNA (cytosine) methyltransferase activity(GO:0016434) |
| 0.0 | 0.3 | GO:0015174 | basic amino acid transmembrane transporter activity(GO:0015174) |
| 0.0 | 1.9 | GO:0032813 | tumor necrosis factor receptor superfamily binding(GO:0032813) |
| 0.0 | 0.0 | GO:0004662 | CAAX-protein geranylgeranyltransferase activity(GO:0004662) |
| 0.0 | 0.1 | GO:0004035 | alkaline phosphatase activity(GO:0004035) |
| 0.0 | 0.1 | GO:0004887 | thyroid hormone receptor activity(GO:0004887) |
| 0.0 | 0.1 | GO:0016155 | formyltetrahydrofolate dehydrogenase activity(GO:0016155) |
| 0.0 | 0.5 | GO:0038191 | neuropilin binding(GO:0038191) |
| 0.0 | 0.2 | GO:0048487 | beta-tubulin binding(GO:0048487) |
| 0.0 | 0.0 | GO:0016889 | endodeoxyribonuclease activity, producing 3'-phosphomonoesters(GO:0016889) |
| 0.0 | 0.0 | GO:0051380 | norepinephrine binding(GO:0051380) |
| 0.0 | 0.1 | GO:0004949 | cannabinoid receptor activity(GO:0004949) |
| 0.0 | 0.1 | GO:0033695 | oxidoreductase activity, acting on CH or CH2 groups, quinone or similar compound as acceptor(GO:0033695) caffeine oxidase activity(GO:0034875) |
| 0.0 | 0.2 | GO:0005542 | folic acid binding(GO:0005542) |
| 0.0 | 0.1 | GO:0004661 | protein geranylgeranyltransferase activity(GO:0004661) |
| 0.0 | 0.1 | GO:0047045 | testosterone 17-beta-dehydrogenase (NADP+) activity(GO:0047045) |
| 0.0 | 0.0 | GO:0008889 | glycerophosphodiester phosphodiesterase activity(GO:0008889) |
| 0.0 | 0.2 | GO:0035612 | AP-2 adaptor complex binding(GO:0035612) |
| 0.0 | 0.1 | GO:0001069 | regulatory region RNA binding(GO:0001069) |
| 0.0 | 6.8 | GO:0030695 | GTPase regulator activity(GO:0030695) |
| 0.0 | 0.2 | GO:0050733 | RS domain binding(GO:0050733) |
| 0.0 | 0.1 | GO:0008499 | UDP-galactose:beta-N-acetylglucosamine beta-1,3-galactosyltransferase activity(GO:0008499) |
| 0.0 | 0.2 | GO:0008510 | sodium:bicarbonate symporter activity(GO:0008510) |
| 0.0 | 0.0 | GO:0002060 | purine nucleobase binding(GO:0002060) |
| 0.0 | 0.0 | GO:0010997 | anaphase-promoting complex binding(GO:0010997) |
| 0.0 | 0.0 | GO:0002054 | nucleobase binding(GO:0002054) |
| 0.0 | 0.1 | GO:0033691 | sialic acid binding(GO:0033691) |
| 0.0 | 0.6 | GO:0004715 | non-membrane spanning protein tyrosine kinase activity(GO:0004715) |
| 0.0 | 0.1 | GO:0005021 | vascular endothelial growth factor-activated receptor activity(GO:0005021) |
| 0.0 | 0.0 | GO:0017002 | activin-activated receptor activity(GO:0017002) |
| 0.0 | 0.2 | GO:0033038 | bitter taste receptor activity(GO:0033038) |
| 0.0 | 0.1 | GO:0070840 | dynein complex binding(GO:0070840) |
| 0.0 | 0.1 | GO:0004346 | glucose-6-phosphatase activity(GO:0004346) sugar-terminal-phosphatase activity(GO:0050309) |
| 0.0 | 0.5 | GO:0016676 | cytochrome-c oxidase activity(GO:0004129) heme-copper terminal oxidase activity(GO:0015002) oxidoreductase activity, acting on a heme group of donors, oxygen as acceptor(GO:0016676) |
| 0.0 | 0.0 | GO:1904455 | ubiquitin-specific protease activity involved in negative regulation of ERAD pathway(GO:1904455) |
| 0.0 | 0.2 | GO:1990825 | sequence-specific mRNA binding(GO:1990825) |
| 0.0 | 0.0 | GO:0016401 | palmitoyl-CoA oxidase activity(GO:0016401) |
| 0.0 | 0.3 | GO:0008239 | dipeptidyl-peptidase activity(GO:0008239) |
| 0.0 | 0.0 | GO:0035727 | lysophosphatidic acid binding(GO:0035727) |
| 0.0 | 0.4 | GO:0031267 | small GTPase binding(GO:0031267) |
| 0.0 | 0.1 | GO:0005041 | low-density lipoprotein receptor activity(GO:0005041) |
| 0.0 | 0.5 | GO:0001205 | transcriptional activator activity, RNA polymerase II distal enhancer sequence-specific binding(GO:0001205) |
| 0.0 | 0.1 | GO:0015925 | galactosidase activity(GO:0015925) |
| 0.0 | 0.1 | GO:0051879 | Hsp90 protein binding(GO:0051879) |
| 0.0 | 0.1 | GO:0005161 | platelet-derived growth factor receptor binding(GO:0005161) |
| 0.0 | 0.3 | GO:0004864 | protein phosphatase inhibitor activity(GO:0004864) |
| 0.0 | 0.0 | GO:0044547 | DNA topoisomerase binding(GO:0044547) |
| 0.0 | 0.2 | GO:0016712 | oxidoreductase activity, acting on paired donors, with incorporation or reduction of molecular oxygen, reduced flavin or flavoprotein as one donor, and incorporation of one atom of oxygen(GO:0016712) |
| 0.0 | 0.1 | GO:0052866 | phosphatidylinositol phosphate phosphatase activity(GO:0052866) |
| 0.0 | 0.0 | GO:0003680 | AT DNA binding(GO:0003680) |
| 0.0 | 0.0 | GO:0004523 | RNA-DNA hybrid ribonuclease activity(GO:0004523) |
| 0.0 | 0.0 | GO:0015450 | P-P-bond-hydrolysis-driven protein transmembrane transporter activity(GO:0015450) |
Gene overrepresentation in biological_process category:
| Log-likelihood per target | Total log-likelihood | Term | Description |
|---|---|---|---|
| 7.1 | 21.2 | GO:0046586 | regulation of calcium-dependent cell-cell adhesion(GO:0046586) |
| 6.6 | 19.9 | GO:1900085 | negative regulation of peptidyl-tyrosine autophosphorylation(GO:1900085) negative regulation of inward rectifier potassium channel activity(GO:1903609) |
| 5.9 | 35.4 | GO:0002760 | positive regulation of antimicrobial peptide production(GO:0002225) positive regulation of antimicrobial humoral response(GO:0002760) positive regulation of antibacterial peptide production(GO:0002803) |
| 5.4 | 21.6 | GO:1902612 | regulation of anti-Mullerian hormone signaling pathway(GO:1902612) negative regulation of anti-Mullerian hormone signaling pathway(GO:1902613) anti-Mullerian hormone signaling pathway(GO:1990262) |
| 4.7 | 14.0 | GO:0032773 | regulation of monophenol monooxygenase activity(GO:0032771) positive regulation of monophenol monooxygenase activity(GO:0032773) negative regulation of catagen(GO:0051796) regulation of hair cycle by canonical Wnt signaling pathway(GO:0060901) positive regulation of melanosome transport(GO:1902910) |
| 3.1 | 12.5 | GO:0043128 | regulation of 1-phosphatidylinositol 4-kinase activity(GO:0043126) positive regulation of 1-phosphatidylinositol 4-kinase activity(GO:0043128) |
| 3.0 | 8.9 | GO:0048627 | myoblast development(GO:0048627) |
| 2.9 | 8.8 | GO:0060166 | olfactory pit development(GO:0060166) |
| 2.8 | 11.2 | GO:0060671 | epithelial cell differentiation involved in embryonic placenta development(GO:0060671) epithelial cell morphogenesis involved in placental branching(GO:0060672) |
| 2.8 | 25.0 | GO:0048386 | positive regulation of retinoic acid receptor signaling pathway(GO:0048386) |
| 2.6 | 10.6 | GO:0075509 | receptor-mediated endocytosis of virus by host cell(GO:0019065) endocytosis involved in viral entry into host cell(GO:0075509) |
| 2.5 | 19.8 | GO:0031642 | negative regulation of myelination(GO:0031642) |
| 2.4 | 19.2 | GO:1900625 | regulation of monocyte aggregation(GO:1900623) positive regulation of monocyte aggregation(GO:1900625) |
| 2.4 | 7.2 | GO:1990764 | regulation of myofibroblast contraction(GO:1904328) myofibroblast contraction(GO:1990764) |
| 2.3 | 67.3 | GO:0031581 | hemidesmosome assembly(GO:0031581) |
| 2.3 | 6.8 | GO:0019858 | cytosine metabolic process(GO:0019858) |
| 2.2 | 6.5 | GO:0002588 | positive regulation of antigen processing and presentation of peptide or polysaccharide antigen via MHC class II(GO:0002582) positive regulation of antigen processing and presentation of peptide antigen(GO:0002585) positive regulation of antigen processing and presentation of peptide antigen via MHC class II(GO:0002588) |
| 2.1 | 8.3 | GO:0046108 | uridine catabolic process(GO:0006218) uridine metabolic process(GO:0046108) |
| 2.0 | 13.9 | GO:0021842 | directional guidance of interneurons involved in migration from the subpallium to the cortex(GO:0021840) chemorepulsion involved in interneuron migration from the subpallium to the cortex(GO:0021842) |
| 2.0 | 7.9 | GO:0003104 | positive regulation of glomerular filtration(GO:0003104) |
| 1.9 | 5.8 | GO:1901301 | regulation of cargo loading into COPII-coated vesicle(GO:1901301) |
| 1.9 | 1.9 | GO:0072076 | nephrogenic mesenchyme development(GO:0072076) |
| 1.9 | 5.7 | GO:1902938 | regulation of intracellular calcium activated chloride channel activity(GO:1902938) |
| 1.9 | 1.9 | GO:2001238 | positive regulation of extrinsic apoptotic signaling pathway(GO:2001238) |
| 1.9 | 9.5 | GO:0097102 | vestibulocochlear nerve structural organization(GO:0021649) positive regulation of cytokine activity(GO:0060301) ganglion morphogenesis(GO:0061552) endothelial tip cell fate specification(GO:0097102) VEGF-activated neuropilin signaling pathway involved in axon guidance(GO:1902378) dorsal root ganglion morphogenesis(GO:1904835) otic placode development(GO:1905040) |
| 1.9 | 9.5 | GO:1903284 | negative regulation of dopamine uptake involved in synaptic transmission(GO:0051585) norepinephrine uptake(GO:0051620) regulation of norepinephrine uptake(GO:0051621) negative regulation of norepinephrine uptake(GO:0051622) negative regulation of catecholamine uptake involved in synaptic transmission(GO:0051945) regulation of glutathione peroxidase activity(GO:1903282) positive regulation of glutathione peroxidase activity(GO:1903284) positive regulation of hydrogen peroxide catabolic process(GO:1903285) regulation of peroxidase activity(GO:2000468) positive regulation of peroxidase activity(GO:2000470) |
| 1.8 | 9.2 | GO:0002159 | desmosome assembly(GO:0002159) |
| 1.8 | 12.8 | GO:0035583 | sequestering of TGFbeta in extracellular matrix(GO:0035583) |
| 1.8 | 9.0 | GO:0055011 | atrial cardiac muscle cell differentiation(GO:0055011) atrial cardiac muscle cell development(GO:0055014) |
| 1.8 | 1.8 | GO:0003213 | cardiac right atrium morphogenesis(GO:0003213) |
| 1.7 | 8.7 | GO:0061146 | Peyer's patch morphogenesis(GO:0061146) |
| 1.7 | 5.2 | GO:0046066 | dGDP metabolic process(GO:0046066) |
| 1.7 | 6.9 | GO:0046086 | adenosine biosynthetic process(GO:0046086) |
| 1.7 | 11.9 | GO:0010940 | positive regulation of necrotic cell death(GO:0010940) |
| 1.7 | 1.7 | GO:1900242 | regulation of synaptic vesicle endocytosis(GO:1900242) positive regulation of synaptic vesicle endocytosis(GO:1900244) positive regulation of synaptic vesicle recycling(GO:1903423) |
| 1.7 | 5.0 | GO:0032849 | positive regulation of cellular pH reduction(GO:0032849) |
| 1.7 | 11.7 | GO:0035166 | post-embryonic hemopoiesis(GO:0035166) |
| 1.7 | 8.3 | GO:0030200 | heparan sulfate proteoglycan catabolic process(GO:0030200) |
| 1.7 | 18.2 | GO:0009414 | response to water deprivation(GO:0009414) |
| 1.6 | 4.9 | GO:0043006 | activation of phospholipase A2 activity by calcium-mediated signaling(GO:0043006) |
| 1.6 | 1.6 | GO:0001913 | T cell mediated cytotoxicity(GO:0001913) |
| 1.6 | 4.9 | GO:0002541 | activation of plasma proteins involved in acute inflammatory response(GO:0002541) |
| 1.6 | 9.7 | GO:0006789 | bilirubin conjugation(GO:0006789) |
| 1.6 | 1.6 | GO:0048817 | negative regulation of hair follicle maturation(GO:0048817) |
| 1.6 | 17.7 | GO:0035986 | senescence-associated heterochromatin focus assembly(GO:0035986) |
| 1.6 | 6.4 | GO:0010986 | positive regulation of lipoprotein particle clearance(GO:0010986) |
| 1.6 | 6.4 | GO:0003409 | optic cup structural organization(GO:0003409) |
| 1.6 | 6.3 | GO:0033484 | nitric oxide homeostasis(GO:0033484) |
| 1.6 | 7.8 | GO:0051610 | negative regulation of neurotransmitter uptake(GO:0051581) serotonin uptake(GO:0051610) regulation of serotonin uptake(GO:0051611) negative regulation of serotonin uptake(GO:0051612) |
| 1.5 | 6.2 | GO:0071461 | cellular response to redox state(GO:0071461) |
| 1.5 | 1.5 | GO:0061441 | renal artery morphogenesis(GO:0061441) |
| 1.5 | 4.6 | GO:0006738 | nicotinamide riboside catabolic process(GO:0006738) nicotinamide riboside metabolic process(GO:0046495) pyridine nucleoside metabolic process(GO:0070637) pyridine nucleoside catabolic process(GO:0070638) |
| 1.5 | 4.6 | GO:2000097 | regulation of smooth muscle cell-matrix adhesion(GO:2000097) |
| 1.5 | 3.0 | GO:0046136 | positive regulation of vitamin metabolic process(GO:0046136) positive regulation of vitamin D biosynthetic process(GO:0060557) positive regulation of calcidiol 1-monooxygenase activity(GO:0060559) |
| 1.5 | 6.0 | GO:0001971 | negative regulation of activation of membrane attack complex(GO:0001971) |
| 1.5 | 3.0 | GO:0003308 | negative regulation of Wnt signaling pathway involved in heart development(GO:0003308) |
| 1.5 | 1.5 | GO:0009996 | negative regulation of cell fate specification(GO:0009996) |
| 1.5 | 3.0 | GO:2000683 | regulation of cellular response to X-ray(GO:2000683) |
| 1.5 | 4.4 | GO:0035329 | hippo signaling(GO:0035329) |
| 1.5 | 4.4 | GO:0090244 | Wnt signaling pathway involved in somitogenesis(GO:0090244) |
| 1.5 | 8.8 | GO:0002934 | desmosome organization(GO:0002934) |
| 1.4 | 17.2 | GO:0001778 | plasma membrane repair(GO:0001778) |
| 1.4 | 4.3 | GO:0061357 | positive regulation of Wnt protein secretion(GO:0061357) |
| 1.4 | 12.8 | GO:0048050 | post-embryonic eye morphogenesis(GO:0048050) |
| 1.4 | 4.2 | GO:0006478 | peptidyl-tyrosine sulfation(GO:0006478) |
| 1.4 | 15.5 | GO:0099639 | neurotransmitter receptor transport, endosome to postsynaptic membrane(GO:0098887) endosome to plasma membrane protein transport(GO:0099638) neurotransmitter receptor transport, endosome to plasma membrane(GO:0099639) |
| 1.4 | 1.4 | GO:0072023 | thick ascending limb development(GO:0072023) metanephric thick ascending limb development(GO:0072233) |
| 1.4 | 11.2 | GO:0042695 | thelarche(GO:0042695) mammary gland branching involved in thelarche(GO:0060744) |
| 1.4 | 1.4 | GO:1900274 | positive regulation of phospholipase C activity(GO:0010863) regulation of phospholipase C activity(GO:1900274) |
| 1.4 | 2.8 | GO:0060447 | bud outgrowth involved in lung branching(GO:0060447) |
| 1.4 | 6.9 | GO:0030047 | actin modification(GO:0030047) |
| 1.4 | 6.8 | GO:1904764 | negative regulation of fibril organization(GO:1902904) chaperone-mediated autophagy translocation complex disassembly(GO:1904764) |
| 1.4 | 5.4 | GO:0032690 | negative regulation of interleukin-1 alpha production(GO:0032690) negative regulation of interleukin-1 alpha secretion(GO:0050712) |
| 1.4 | 4.1 | GO:0093001 | glycolysis from storage polysaccharide through glucose-1-phosphate(GO:0093001) |
| 1.3 | 9.4 | GO:0050703 | interleukin-1 alpha secretion(GO:0050703) |
| 1.3 | 2.7 | GO:2000309 | positive regulation of tumor necrosis factor (ligand) superfamily member 11 production(GO:2000309) |
| 1.3 | 4.0 | GO:2001280 | positive regulation of prostaglandin biosynthetic process(GO:0031394) positive regulation of unsaturated fatty acid biosynthetic process(GO:2001280) |
| 1.3 | 3.9 | GO:2000645 | negative regulation of low-density lipoprotein particle receptor catabolic process(GO:0032804) negative regulation of receptor catabolic process(GO:2000645) |
| 1.3 | 11.8 | GO:0060020 | Bergmann glial cell differentiation(GO:0060020) |
| 1.3 | 2.6 | GO:0060066 | oviduct development(GO:0060066) |
| 1.3 | 32.0 | GO:0071294 | cellular response to zinc ion(GO:0071294) |
| 1.2 | 3.7 | GO:1905205 | positive regulation of connective tissue replacement(GO:1905205) |
| 1.2 | 6.2 | GO:1904579 | response to thapsigargin(GO:1904578) cellular response to thapsigargin(GO:1904579) |
| 1.2 | 5.0 | GO:1900533 | medium-chain fatty-acyl-CoA catabolic process(GO:0036114) long-chain fatty-acyl-CoA catabolic process(GO:0036116) palmitic acid metabolic process(GO:1900533) palmitic acid biosynthetic process(GO:1900535) |
| 1.2 | 4.8 | GO:0061364 | apoptotic process involved in luteolysis(GO:0061364) |
| 1.2 | 7.2 | GO:0045743 | positive regulation of fibroblast growth factor receptor signaling pathway(GO:0045743) |
| 1.2 | 4.8 | GO:0035900 | response to isolation stress(GO:0035900) |
| 1.2 | 3.6 | GO:0098746 | fast, calcium ion-dependent exocytosis of neurotransmitter(GO:0098746) |
| 1.2 | 7.1 | GO:0072719 | cellular response to cisplatin(GO:0072719) |
| 1.2 | 5.9 | GO:0097527 | necroptotic signaling pathway(GO:0097527) |
| 1.2 | 4.6 | GO:0019747 | regulation of isoprenoid metabolic process(GO:0019747) |
| 1.1 | 4.5 | GO:1904565 | response to 1-oleoyl-sn-glycerol 3-phosphate(GO:1904565) cellular response to 1-oleoyl-sn-glycerol 3-phosphate(GO:1904566) |
| 1.1 | 7.9 | GO:2000124 | regulation of endocannabinoid signaling pathway(GO:2000124) |
| 1.1 | 13.5 | GO:0010991 | negative regulation of SMAD protein complex assembly(GO:0010991) |
| 1.1 | 3.3 | GO:0033341 | regulation of collagen binding(GO:0033341) |
| 1.1 | 4.4 | GO:0042335 | cuticle development(GO:0042335) |
| 1.1 | 3.2 | GO:1903722 | regulation of centriole elongation(GO:1903722) |
| 1.1 | 4.3 | GO:1902766 | skeletal muscle satellite cell migration(GO:1902766) |
| 1.1 | 1.1 | GO:0071670 | smooth muscle cell chemotaxis(GO:0071670) |
| 1.1 | 4.2 | GO:0036072 | intramembranous ossification(GO:0001957) direct ossification(GO:0036072) |
| 1.0 | 3.1 | GO:0010166 | wax biosynthetic process(GO:0010025) wax metabolic process(GO:0010166) |
| 1.0 | 2.0 | GO:0060057 | apoptotic process involved in mammary gland involution(GO:0060057) positive regulation of apoptotic process involved in mammary gland involution(GO:0060058) positive regulation of apoptotic process involved in morphogenesis(GO:1902339) regulation of mammary gland involution(GO:1903519) positive regulation of mammary gland involution(GO:1903521) positive regulation of apoptotic process involved in development(GO:1904747) |
| 1.0 | 3.1 | GO:0006550 | isoleucine catabolic process(GO:0006550) |
| 1.0 | 11.2 | GO:0060753 | regulation of mast cell chemotaxis(GO:0060753) |
| 1.0 | 4.1 | GO:0030920 | N-terminal peptidyl-serine acetylation(GO:0017198) N-terminal peptidyl-glutamic acid acetylation(GO:0018002) peptidyl-serine acetylation(GO:0030920) |
| 1.0 | 5.1 | GO:0007386 | compartment pattern specification(GO:0007386) |
| 1.0 | 8.0 | GO:0030579 | ubiquitin-dependent SMAD protein catabolic process(GO:0030579) |
| 1.0 | 3.0 | GO:0051710 | regulation of cytolysis in other organism(GO:0051710) |
| 1.0 | 8.0 | GO:0060244 | negative regulation of cell proliferation involved in contact inhibition(GO:0060244) |
| 1.0 | 5.0 | GO:1990834 | response to odorant(GO:1990834) |
| 1.0 | 2.0 | GO:0036149 | phosphatidylinositol acyl-chain remodeling(GO:0036149) |
| 1.0 | 1.0 | GO:0045976 | negative regulation of mitotic cell cycle, embryonic(GO:0045976) |
| 1.0 | 5.9 | GO:0048549 | positive regulation of pinocytosis(GO:0048549) |
| 1.0 | 12.8 | GO:0038063 | collagen-activated tyrosine kinase receptor signaling pathway(GO:0038063) collagen-activated signaling pathway(GO:0038065) |
| 1.0 | 3.0 | GO:0017186 | peptidyl-pyroglutamic acid biosynthetic process, using glutaminyl-peptide cyclotransferase(GO:0017186) |
| 1.0 | 3.9 | GO:0046952 | ketone body catabolic process(GO:0046952) |
| 1.0 | 2.9 | GO:1904181 | positive regulation of mitochondrial depolarization(GO:0051901) positive regulation of membrane depolarization(GO:1904181) |
| 1.0 | 2.9 | GO:1904504 | regulation of lipophagy(GO:1904502) positive regulation of lipophagy(GO:1904504) |
| 1.0 | 3.9 | GO:1902903 | regulation of fibril organization(GO:1902903) |
| 1.0 | 1.9 | GO:2000374 | regulation of oxygen metabolic process(GO:2000374) |
| 1.0 | 5.8 | GO:2000483 | negative regulation of interleukin-8 secretion(GO:2000483) |
| 1.0 | 2.9 | GO:1903070 | negative regulation of ER-associated ubiquitin-dependent protein catabolic process(GO:1903070) |
| 1.0 | 3.8 | GO:0018242 | protein O-linked glycosylation via serine(GO:0018242) |
| 0.9 | 3.8 | GO:0044837 | assembly of actomyosin apparatus involved in cytokinesis(GO:0000912) actomyosin contractile ring assembly(GO:0000915) actomyosin contractile ring organization(GO:0044837) |
| 0.9 | 2.8 | GO:0032289 | central nervous system myelin formation(GO:0032289) |
| 0.9 | 2.8 | GO:1900224 | positive regulation of nodal signaling pathway involved in determination of lateral mesoderm left/right asymmetry(GO:1900224) |
| 0.9 | 18.6 | GO:0071803 | positive regulation of podosome assembly(GO:0071803) |
| 0.9 | 14.0 | GO:0090168 | Golgi reassembly(GO:0090168) |
| 0.9 | 4.6 | GO:0031585 | regulation of inositol 1,4,5-trisphosphate-sensitive calcium-release channel activity(GO:0031585) |
| 0.9 | 2.8 | GO:0007412 | axon target recognition(GO:0007412) |
| 0.9 | 3.6 | GO:0038195 | urokinase plasminogen activator signaling pathway(GO:0038195) |
| 0.9 | 0.9 | GO:0031017 | exocrine pancreas development(GO:0031017) |
| 0.9 | 0.9 | GO:0072709 | cellular response to sorbitol(GO:0072709) |
| 0.9 | 7.2 | GO:0006659 | phosphatidylserine biosynthetic process(GO:0006659) |
| 0.9 | 2.7 | GO:0018199 | peptidyl-glutamine modification(GO:0018199) |
| 0.9 | 2.7 | GO:0006427 | histidyl-tRNA aminoacylation(GO:0006427) |
| 0.9 | 3.5 | GO:0060718 | chorionic trophoblast cell differentiation(GO:0060718) |
| 0.9 | 3.5 | GO:0060708 | spongiotrophoblast differentiation(GO:0060708) |
| 0.9 | 6.1 | GO:0032119 | sequestering of zinc ion(GO:0032119) |
| 0.9 | 0.9 | GO:0060830 | ciliary receptor clustering involved in smoothened signaling pathway(GO:0060830) |
| 0.9 | 3.4 | GO:0046836 | glycolipid transport(GO:0046836) |
| 0.9 | 3.4 | GO:0046110 | xanthine metabolic process(GO:0046110) |
| 0.9 | 0.9 | GO:1905244 | regulation of modification of synaptic structure(GO:1905244) |
| 0.9 | 10.3 | GO:1900028 | negative regulation of ruffle assembly(GO:1900028) |
| 0.9 | 3.4 | GO:0045065 | cytotoxic T cell differentiation(GO:0045065) |
| 0.9 | 7.7 | GO:0015705 | iodide transport(GO:0015705) |
| 0.8 | 3.4 | GO:0045110 | intermediate filament bundle assembly(GO:0045110) |
| 0.8 | 0.8 | GO:0003273 | cell migration involved in endocardial cushion formation(GO:0003273) |
| 0.8 | 5.0 | GO:0009912 | auditory receptor cell fate commitment(GO:0009912) inner ear receptor cell fate commitment(GO:0060120) |
| 0.8 | 6.7 | GO:0070444 | oligodendrocyte progenitor proliferation(GO:0070444) regulation of oligodendrocyte progenitor proliferation(GO:0070445) |
| 0.8 | 0.8 | GO:0048295 | positive regulation of isotype switching to IgE isotypes(GO:0048295) |
| 0.8 | 3.3 | GO:0099640 | axo-dendritic protein transport(GO:0099640) |
| 0.8 | 2.5 | GO:0044034 | negative stranded viral RNA replication(GO:0039689) multi-organism biosynthetic process(GO:0044034) |
| 0.8 | 10.7 | GO:0006089 | lactate metabolic process(GO:0006089) |
| 0.8 | 0.8 | GO:0006651 | diacylglycerol biosynthetic process(GO:0006651) |
| 0.8 | 3.2 | GO:1905007 | positive regulation of epithelial to mesenchymal transition involved in endocardial cushion formation(GO:1905007) |
| 0.8 | 1.6 | GO:0071681 | response to indole-3-methanol(GO:0071680) cellular response to indole-3-methanol(GO:0071681) |
| 0.8 | 5.6 | GO:0097577 | intracellular sequestering of iron ion(GO:0006880) sequestering of iron ion(GO:0097577) |
| 0.8 | 1.6 | GO:1903542 | negative regulation of exosomal secretion(GO:1903542) |
| 0.8 | 2.4 | GO:2000521 | negative regulation of immunological synapse formation(GO:2000521) |
| 0.8 | 1.6 | GO:0071542 | dopaminergic neuron differentiation(GO:0071542) |
| 0.8 | 6.3 | GO:0046826 | negative regulation of protein export from nucleus(GO:0046826) |
| 0.8 | 5.5 | GO:1902031 | regulation of NADP metabolic process(GO:1902031) |
| 0.8 | 12.5 | GO:0016540 | protein autoprocessing(GO:0016540) |
| 0.8 | 3.1 | GO:1904199 | positive regulation of cardiac conduction(GO:1903781) positive regulation of atrial cardiac muscle cell action potential(GO:1903949) positive regulation of regulation of vascular smooth muscle cell membrane depolarization(GO:1904199) regulation of vascular smooth muscle cell membrane depolarization(GO:1990736) |
| 0.8 | 3.9 | GO:0072656 | maintenance of protein location in mitochondrion(GO:0072656) |
| 0.8 | 7.0 | GO:1902412 | regulation of mitotic cytokinesis(GO:1902412) |
| 0.8 | 0.8 | GO:0042249 | establishment of planar polarity of embryonic epithelium(GO:0042249) |
| 0.8 | 6.2 | GO:0003065 | positive regulation of heart rate by epinephrine(GO:0003065) |
| 0.8 | 5.4 | GO:0032510 | endosome to lysosome transport via multivesicular body sorting pathway(GO:0032510) |
| 0.8 | 5.4 | GO:0046469 | platelet activating factor metabolic process(GO:0046469) |
| 0.8 | 0.8 | GO:2000777 | positive regulation of proteasomal ubiquitin-dependent protein catabolic process involved in cellular response to hypoxia(GO:2000777) |
| 0.7 | 2.2 | GO:0090362 | positive regulation of platelet-derived growth factor production(GO:0090362) |
| 0.7 | 2.2 | GO:0042450 | arginine biosynthetic process via ornithine(GO:0042450) |
| 0.7 | 5.2 | GO:0052696 | flavonoid glucuronidation(GO:0052696) xenobiotic glucuronidation(GO:0052697) |
| 0.7 | 2.2 | GO:0051414 | response to cortisol(GO:0051414) |
| 0.7 | 1.5 | GO:0036518 | chemorepulsion of dopaminergic neuron axon(GO:0036518) chemorepulsion of axon(GO:0061643) |
| 0.7 | 5.9 | GO:0060056 | mammary gland involution(GO:0060056) |
| 0.7 | 5.1 | GO:1903232 | melanosome assembly(GO:1903232) |
| 0.7 | 4.3 | GO:0015820 | leucine transport(GO:0015820) |
| 0.7 | 2.1 | GO:0019417 | sulfur oxidation(GO:0019417) |
| 0.7 | 1.4 | GO:0010652 | regulation of cell communication by chemical coupling(GO:0010645) positive regulation of cell communication by chemical coupling(GO:0010652) |
| 0.7 | 4.3 | GO:0061343 | cell adhesion involved in heart morphogenesis(GO:0061343) |
| 0.7 | 0.7 | GO:0044860 | protein localization to plasma membrane raft(GO:0044860) |
| 0.7 | 1.4 | GO:0035567 | non-canonical Wnt signaling pathway(GO:0035567) Wnt signaling pathway, planar cell polarity pathway(GO:0060071) |
| 0.7 | 2.1 | GO:0070901 | mitochondrial tRNA methylation(GO:0070901) |
| 0.7 | 3.5 | GO:0006696 | ergosterol biosynthetic process(GO:0006696) ergosterol metabolic process(GO:0008204) |
| 0.7 | 2.8 | GO:0060594 | mammary gland specification(GO:0060594) |
| 0.7 | 1.4 | GO:1903553 | positive regulation of extracellular exosome assembly(GO:1903553) |
| 0.7 | 2.1 | GO:0010571 | positive regulation of nuclear cell cycle DNA replication(GO:0010571) |
| 0.7 | 2.1 | GO:0071692 | protein localization to extracellular region(GO:0071692) maintenance of protein location in extracellular region(GO:0071694) |
| 0.7 | 0.7 | GO:0090149 | mitochondrial membrane fission(GO:0090149) |
| 0.7 | 9.6 | GO:0035970 | peptidyl-threonine dephosphorylation(GO:0035970) |
| 0.7 | 3.4 | GO:0035617 | stress granule disassembly(GO:0035617) |
| 0.7 | 0.7 | GO:0003241 | growth involved in heart morphogenesis(GO:0003241) |
| 0.7 | 3.4 | GO:0000389 | mRNA 3'-splice site recognition(GO:0000389) |
| 0.7 | 1.4 | GO:0002188 | translation reinitiation(GO:0002188) |
| 0.7 | 0.7 | GO:0043457 | regulation of cellular respiration(GO:0043457) |
| 0.7 | 8.1 | GO:1904322 | response to forskolin(GO:1904321) cellular response to forskolin(GO:1904322) |
| 0.7 | 3.3 | GO:0010482 | epidermal cell division(GO:0010481) regulation of epidermal cell division(GO:0010482) |
| 0.7 | 7.3 | GO:0051798 | positive regulation of hair follicle development(GO:0051798) |
| 0.7 | 1.3 | GO:0006788 | heme oxidation(GO:0006788) |
| 0.7 | 2.0 | GO:0006420 | arginyl-tRNA aminoacylation(GO:0006420) |
| 0.7 | 3.3 | GO:0009149 | pyrimidine nucleoside triphosphate catabolic process(GO:0009149) pyrimidine deoxyribonucleoside triphosphate catabolic process(GO:0009213) |
| 0.7 | 3.9 | GO:1900029 | positive regulation of ruffle assembly(GO:1900029) |
| 0.7 | 3.3 | GO:0035063 | nuclear speck organization(GO:0035063) |
| 0.7 | 2.0 | GO:0043328 | protein targeting to vacuole involved in ubiquitin-dependent protein catabolic process via the multivesicular body sorting pathway(GO:0043328) |
| 0.6 | 6.5 | GO:0002480 | antigen processing and presentation of exogenous peptide antigen via MHC class I, TAP-independent(GO:0002480) |
| 0.6 | 2.6 | GO:2001151 | regulation of renal water transport(GO:2001151) positive regulation of renal water transport(GO:2001153) |
| 0.6 | 1.3 | GO:0007113 | endomitotic cell cycle(GO:0007113) |
| 0.6 | 2.6 | GO:1903778 | protein localization to vacuolar membrane(GO:1903778) |
| 0.6 | 1.9 | GO:0002276 | basophil activation involved in immune response(GO:0002276) |
| 0.6 | 3.8 | GO:1903960 | regulation of plasma membrane long-chain fatty acid transport(GO:0010746) negative regulation of plasma membrane long-chain fatty acid transport(GO:0010748) negative regulation of anion transmembrane transport(GO:1903960) |
| 0.6 | 1.9 | GO:1902463 | protein localization to cell leading edge(GO:1902463) |
| 0.6 | 3.2 | GO:1900041 | negative regulation of interleukin-2 secretion(GO:1900041) |
| 0.6 | 3.1 | GO:0055064 | chloride ion homeostasis(GO:0055064) |
| 0.6 | 3.1 | GO:0008588 | release of cytoplasmic sequestered NF-kappaB(GO:0008588) |
| 0.6 | 3.1 | GO:2000110 | negative regulation of macrophage apoptotic process(GO:2000110) |
| 0.6 | 6.9 | GO:0030043 | actin filament fragmentation(GO:0030043) |
| 0.6 | 2.5 | GO:0042231 | interleukin-13 biosynthetic process(GO:0042231) |
| 0.6 | 0.6 | GO:1902957 | negative regulation of mitochondrial electron transport, NADH to ubiquinone(GO:1902957) |
| 0.6 | 3.7 | GO:0032287 | peripheral nervous system myelin maintenance(GO:0032287) |
| 0.6 | 1.2 | GO:0036023 | limb joint morphogenesis(GO:0036022) embryonic skeletal limb joint morphogenesis(GO:0036023) |
| 0.6 | 0.6 | GO:0010726 | positive regulation of hydrogen peroxide metabolic process(GO:0010726) |
| 0.6 | 1.2 | GO:0043132 | NAD transport(GO:0043132) |
| 0.6 | 1.8 | GO:2000687 | negative regulation of rubidium ion transport(GO:2000681) negative regulation of rubidium ion transmembrane transporter activity(GO:2000687) |
| 0.6 | 33.7 | GO:0007157 | heterophilic cell-cell adhesion via plasma membrane cell adhesion molecules(GO:0007157) |
| 0.6 | 0.6 | GO:0010561 | negative regulation of glycoprotein biosynthetic process(GO:0010561) |
| 0.6 | 8.9 | GO:0032060 | bleb assembly(GO:0032060) |
| 0.6 | 5.9 | GO:0034356 | NAD biosynthesis via nicotinamide riboside salvage pathway(GO:0034356) |
| 0.6 | 2.9 | GO:0006015 | 5-phosphoribose 1-diphosphate biosynthetic process(GO:0006015) 5-phosphoribose 1-diphosphate metabolic process(GO:0046391) |
| 0.6 | 1.2 | GO:0032687 | negative regulation of interferon-alpha production(GO:0032687) |
| 0.6 | 1.8 | GO:0090155 | negative regulation of sphingolipid biosynthetic process(GO:0090155) negative regulation of ceramide biosynthetic process(GO:1900060) |
| 0.6 | 1.7 | GO:2000282 | regulation of cellular amine catabolic process(GO:0033241) negative regulation of cellular amine catabolic process(GO:0033242) negative regulation of the force of heart contraction(GO:0098736) regulation of arginine catabolic process(GO:1900081) negative regulation of arginine catabolic process(GO:1900082) regulation of adrenergic receptor signaling pathway involved in heart process(GO:1901204) negative regulation of adrenergic receptor signaling pathway involved in heart process(GO:1901205) regulation of citrulline biosynthetic process(GO:1903248) negative regulation of citrulline biosynthetic process(GO:1903249) regulation of cellular amino acid biosynthetic process(GO:2000282) negative regulation of cellular amino acid biosynthetic process(GO:2000283) |
| 0.6 | 0.6 | GO:1903336 | negative regulation of vacuolar transport(GO:1903336) |
| 0.6 | 2.3 | GO:0085020 | protein K6-linked ubiquitination(GO:0085020) |
| 0.6 | 3.4 | GO:0015866 | ADP transport(GO:0015866) ATP transport(GO:0015867) adenine nucleotide transport(GO:0051503) |
| 0.6 | 2.3 | GO:0051013 | microtubule severing(GO:0051013) |
| 0.6 | 2.8 | GO:0098502 | DNA dephosphorylation(GO:0098502) |
| 0.6 | 6.2 | GO:0034465 | response to carbon monoxide(GO:0034465) |
| 0.6 | 2.3 | GO:0038089 | positive regulation of cell migration by vascular endothelial growth factor signaling pathway(GO:0038089) |
| 0.6 | 1.7 | GO:0071030 | nuclear mRNA surveillance of spliceosomal pre-mRNA splicing(GO:0071030) nuclear retention of unspliced pre-mRNA at the site of transcription(GO:0071048) |
| 0.6 | 1.7 | GO:0046521 | sphingoid catabolic process(GO:0046521) |
| 0.6 | 3.9 | GO:0070294 | renal sodium ion absorption(GO:0070294) |
| 0.6 | 1.7 | GO:0016344 | meiotic chromosome movement towards spindle pole(GO:0016344) |
| 0.6 | 0.6 | GO:0006106 | fumarate metabolic process(GO:0006106) |
| 0.6 | 0.6 | GO:0051987 | positive regulation of attachment of spindle microtubules to kinetochore(GO:0051987) |
| 0.6 | 2.2 | GO:0006049 | UDP-N-acetylglucosamine catabolic process(GO:0006049) |
| 0.6 | 0.6 | GO:0090646 | mitochondrial tRNA processing(GO:0090646) |
| 0.5 | 1.6 | GO:0090403 | oxidative stress-induced premature senescence(GO:0090403) |
| 0.5 | 1.1 | GO:0051547 | regulation of keratinocyte migration(GO:0051547) positive regulation of keratinocyte migration(GO:0051549) |
| 0.5 | 1.1 | GO:0035712 | T-helper 2 cell activation(GO:0035712) regulation of T-helper 2 cell activation(GO:2000569) positive regulation of T-helper 2 cell activation(GO:2000570) |
| 0.5 | 2.7 | GO:0010519 | negative regulation of phospholipase activity(GO:0010519) |
| 0.5 | 3.2 | GO:0051121 | hepoxilin metabolic process(GO:0051121) hepoxilin biosynthetic process(GO:0051122) |
| 0.5 | 2.2 | GO:0006051 | mannosamine metabolic process(GO:0006050) N-acetylmannosamine metabolic process(GO:0006051) |
| 0.5 | 0.5 | GO:0035910 | ascending aorta development(GO:0035905) ascending aorta morphogenesis(GO:0035910) |
| 0.5 | 2.7 | GO:0015891 | iron chelate transport(GO:0015688) siderophore transport(GO:0015891) |
| 0.5 | 4.8 | GO:0031444 | slow-twitch skeletal muscle fiber contraction(GO:0031444) |
| 0.5 | 5.3 | GO:0035826 | rubidium ion transport(GO:0035826) regulation of rubidium ion transport(GO:2000680) |
| 0.5 | 1.1 | GO:1902044 | regulation of Fas signaling pathway(GO:1902044) |
| 0.5 | 3.2 | GO:0035803 | egg coat formation(GO:0035803) |
| 0.5 | 10.0 | GO:0090026 | positive regulation of monocyte chemotaxis(GO:0090026) |
| 0.5 | 0.5 | GO:0006145 | purine nucleobase catabolic process(GO:0006145) |
| 0.5 | 1.0 | GO:0051461 | positive regulation of corticotropin secretion(GO:0051461) |
| 0.5 | 50.3 | GO:0070268 | cornification(GO:0070268) |
| 0.5 | 2.1 | GO:1901164 | negative regulation of trophoblast cell migration(GO:1901164) |
| 0.5 | 1.0 | GO:0072385 | minus-end-directed organelle transport along microtubule(GO:0072385) |
| 0.5 | 2.1 | GO:0018032 | peptide amidation(GO:0001519) protein amidation(GO:0018032) peptide modification(GO:0031179) |
| 0.5 | 3.1 | GO:0072131 | kidney mesenchyme morphogenesis(GO:0072131) metanephric mesenchyme morphogenesis(GO:0072133) |
| 0.5 | 2.1 | GO:0046490 | isopentenyl diphosphate biosynthetic process(GO:0009240) isopentenyl diphosphate metabolic process(GO:0046490) |
| 0.5 | 2.6 | GO:0007161 | calcium-independent cell-matrix adhesion(GO:0007161) |
| 0.5 | 1.5 | GO:0035021 | negative regulation of Rac protein signal transduction(GO:0035021) |
| 0.5 | 0.5 | GO:0007041 | lysosomal transport(GO:0007041) |
| 0.5 | 1.0 | GO:0051386 | regulation of neurotrophin TRK receptor signaling pathway(GO:0051386) |
| 0.5 | 1.5 | GO:0051086 | chaperone mediated protein folding independent of cofactor(GO:0051086) |
| 0.5 | 2.6 | GO:0031120 | snRNA pseudouridine synthesis(GO:0031120) |
| 0.5 | 6.6 | GO:0090084 | negative regulation of inclusion body assembly(GO:0090084) |
| 0.5 | 0.5 | GO:0072683 | T cell extravasation(GO:0072683) |
| 0.5 | 1.5 | GO:0071790 | spindle pole body duplication(GO:0030474) spindle pole body organization(GO:0051300) spindle pole body localization(GO:0070631) establishment of spindle pole body localization(GO:0070632) spindle pole body localization to nuclear envelope(GO:0071789) establishment of spindle pole body localization to nuclear envelope(GO:0071790) |
| 0.5 | 0.5 | GO:0007089 | traversing start control point of mitotic cell cycle(GO:0007089) |
| 0.5 | 1.5 | GO:0071344 | diphosphate metabolic process(GO:0071344) |
| 0.5 | 1.5 | GO:0033140 | negative regulation of peptidyl-serine phosphorylation of STAT protein(GO:0033140) |
| 0.5 | 3.0 | GO:0097428 | protein maturation by iron-sulfur cluster transfer(GO:0097428) |
| 0.5 | 9.0 | GO:0044030 | regulation of DNA methylation(GO:0044030) |
| 0.5 | 0.5 | GO:0009438 | methylglyoxal metabolic process(GO:0009438) |
| 0.5 | 3.0 | GO:0070221 | sulfide oxidation(GO:0019418) sulfide oxidation, using sulfide:quinone oxidoreductase(GO:0070221) |
| 0.5 | 1.5 | GO:0031938 | regulation of chromatin silencing at telomere(GO:0031938) |
| 0.5 | 2.5 | GO:1903243 | negative regulation of cardiac muscle adaptation(GO:0010616) transforming growth factor beta3 production(GO:0032907) regulation of transforming growth factor beta3 production(GO:0032910) positive regulation of transforming growth factor beta3 production(GO:0032916) negative regulation of lung blood pressure(GO:0061767) negative regulation of cardiac muscle hypertrophy in response to stress(GO:1903243) |
| 0.5 | 0.5 | GO:0090118 | receptor-mediated endocytosis of low-density lipoprotein particle involved in cholesterol transport(GO:0090118) |
| 0.5 | 3.4 | GO:1902455 | negative regulation of stem cell population maintenance(GO:1902455) |
| 0.5 | 2.0 | GO:2000620 | positive regulation of histone H4-K16 acetylation(GO:2000620) |
| 0.5 | 3.4 | GO:0021740 | trigeminal sensory nucleus development(GO:0021730) principal sensory nucleus of trigeminal nerve development(GO:0021740) negative regulation of epithelial cell proliferation involved in lung morphogenesis(GO:2000795) |
| 0.5 | 1.5 | GO:0071109 | superior temporal gyrus development(GO:0071109) |
| 0.5 | 1.9 | GO:0033278 | cell proliferation in midbrain(GO:0033278) |
| 0.5 | 1.5 | GO:0045918 | negative regulation of cytolysis(GO:0045918) |
| 0.5 | 7.2 | GO:0009629 | response to gravity(GO:0009629) |
| 0.5 | 2.4 | GO:0070682 | proteasome regulatory particle assembly(GO:0070682) |
| 0.5 | 0.5 | GO:1903672 | positive regulation of sprouting angiogenesis(GO:1903672) |
| 0.5 | 1.9 | GO:0002296 | T-helper 1 cell lineage commitment(GO:0002296) |
| 0.5 | 1.4 | GO:0015800 | acidic amino acid transport(GO:0015800) |
| 0.5 | 1.0 | GO:0019482 | beta-alanine metabolic process(GO:0019482) |
| 0.5 | 1.0 | GO:0051534 | negative regulation of NFAT protein import into nucleus(GO:0051534) |
| 0.5 | 1.0 | GO:0043311 | regulation of eosinophil degranulation(GO:0043309) positive regulation of eosinophil degranulation(GO:0043311) positive regulation of eosinophil activation(GO:1902568) |
| 0.5 | 1.4 | GO:0060151 | peroxisome localization(GO:0060151) microtubule-based peroxisome localization(GO:0060152) |
| 0.5 | 3.3 | GO:0070235 | regulation of activation-induced cell death of T cells(GO:0070235) negative regulation of activation-induced cell death of T cells(GO:0070236) |
| 0.5 | 7.1 | GO:0008105 | asymmetric protein localization(GO:0008105) |
| 0.5 | 1.4 | GO:1990022 | RNA polymerase II complex import to nucleus(GO:0044376) RNA polymerase III complex localization to nucleus(GO:1990022) |
| 0.5 | 0.5 | GO:0090315 | negative regulation of protein targeting to membrane(GO:0090315) |
| 0.5 | 2.4 | GO:0098706 | ferric iron import(GO:0033216) ferric iron import into cell(GO:0097461) ferric iron import across plasma membrane(GO:0098706) |
| 0.5 | 0.5 | GO:0060394 | negative regulation of pathway-restricted SMAD protein phosphorylation(GO:0060394) |
| 0.5 | 3.8 | GO:0021957 | corticospinal tract morphogenesis(GO:0021957) |
| 0.5 | 0.5 | GO:0071158 | positive regulation of cell cycle arrest(GO:0071158) |
| 0.5 | 0.9 | GO:0051036 | regulation of endosome size(GO:0051036) |
| 0.5 | 8.4 | GO:0001682 | tRNA 5'-leader removal(GO:0001682) |
| 0.5 | 0.9 | GO:0090086 | negative regulation of protein deubiquitination(GO:0090086) |
| 0.5 | 2.3 | GO:0006003 | fructose 2,6-bisphosphate metabolic process(GO:0006003) |
| 0.5 | 2.8 | GO:0051708 | intracellular transport of viral protein in host cell(GO:0019060) symbiont intracellular protein transport in host(GO:0030581) intracellular protein transport in other organism involved in symbiotic interaction(GO:0051708) |
| 0.5 | 1.4 | GO:0060174 | limb bud formation(GO:0060174) |
| 0.5 | 0.9 | GO:0019322 | pentose biosynthetic process(GO:0019322) |
| 0.5 | 0.9 | GO:0006294 | nucleotide-excision repair, preincision complex assembly(GO:0006294) |
| 0.5 | 0.5 | GO:1903056 | regulation of melanosome organization(GO:1903056) |
| 0.5 | 8.6 | GO:0007084 | mitotic nuclear envelope reassembly(GO:0007084) |
| 0.5 | 1.4 | GO:0015783 | GDP-fucose transport(GO:0015783) purine nucleotide-sugar transport(GO:0036079) |
| 0.5 | 3.6 | GO:0045345 | positive regulation of MHC class I biosynthetic process(GO:0045345) |
| 0.5 | 0.5 | GO:0030423 | targeting of mRNA for destruction involved in RNA interference(GO:0030423) siRNA loading onto RISC involved in RNA interference(GO:0035087) |
| 0.4 | 1.3 | GO:0001732 | formation of cytoplasmic translation initiation complex(GO:0001732) |
| 0.4 | 1.3 | GO:0032815 | negative regulation of natural killer cell activation(GO:0032815) |
| 0.4 | 4.9 | GO:0043248 | proteasome assembly(GO:0043248) |
| 0.4 | 0.4 | GO:0033146 | regulation of intracellular estrogen receptor signaling pathway(GO:0033146) |
| 0.4 | 3.1 | GO:2001137 | positive regulation of endocytic recycling(GO:2001137) |
| 0.4 | 1.8 | GO:0048145 | regulation of fibroblast proliferation(GO:0048145) |
| 0.4 | 0.9 | GO:1900016 | negative regulation of cytokine production involved in inflammatory response(GO:1900016) |
| 0.4 | 1.8 | GO:0043321 | regulation of natural killer cell degranulation(GO:0043321) positive regulation of natural killer cell degranulation(GO:0043323) |
| 0.4 | 1.8 | GO:0001927 | exocyst assembly(GO:0001927) |
| 0.4 | 3.1 | GO:0033183 | negative regulation of histone ubiquitination(GO:0033183) negative regulation of protein K63-linked ubiquitination(GO:1900045) regulation of histone H2A K63-linked ubiquitination(GO:1901314) negative regulation of histone H2A K63-linked ubiquitination(GO:1901315) negative regulation of protein polyubiquitination(GO:1902915) |
| 0.4 | 0.9 | GO:1900133 | regulation of renin secretion into blood stream(GO:1900133) |
| 0.4 | 0.4 | GO:0014045 | establishment of endothelial blood-brain barrier(GO:0014045) central nervous system vasculogenesis(GO:0022009) |
| 0.4 | 8.8 | GO:0010800 | positive regulation of peptidyl-threonine phosphorylation(GO:0010800) |
| 0.4 | 0.9 | GO:0015853 | adenine transport(GO:0015853) |
| 0.4 | 2.2 | GO:0001842 | neural fold formation(GO:0001842) |
| 0.4 | 2.2 | GO:0002084 | protein depalmitoylation(GO:0002084) |
| 0.4 | 8.7 | GO:0003334 | keratinocyte development(GO:0003334) |
| 0.4 | 2.6 | GO:2000567 | memory T cell activation(GO:0035709) regulation of memory T cell activation(GO:2000567) positive regulation of memory T cell activation(GO:2000568) |
| 0.4 | 2.2 | GO:0034036 | purine ribonucleoside bisphosphate biosynthetic process(GO:0034036) 3'-phosphoadenosine 5'-phosphosulfate biosynthetic process(GO:0050428) |
| 0.4 | 1.7 | GO:0001992 | regulation of systemic arterial blood pressure by vasopressin(GO:0001992) |
| 0.4 | 0.4 | GO:0008291 | acetylcholine metabolic process(GO:0008291) acetate ester metabolic process(GO:1900619) |
| 0.4 | 0.4 | GO:0070101 | positive regulation of chemokine-mediated signaling pathway(GO:0070101) |
| 0.4 | 6.0 | GO:0051639 | actin filament network formation(GO:0051639) |
| 0.4 | 1.3 | GO:1903674 | regulation of cap-dependent translational initiation(GO:1903674) positive regulation of cap-dependent translational initiation(GO:1903676) |
| 0.4 | 2.6 | GO:0045162 | clustering of voltage-gated sodium channels(GO:0045162) |
| 0.4 | 4.7 | GO:0045040 | protein import into mitochondrial outer membrane(GO:0045040) |
| 0.4 | 3.9 | GO:0036010 | protein localization to endosome(GO:0036010) |
| 0.4 | 1.3 | GO:0036484 | trunk segmentation(GO:0035290) trunk neural crest cell migration(GO:0036484) ventral trunk neural crest cell migration(GO:0036486) |
| 0.4 | 1.3 | GO:0086092 | regulation of the force of heart contraction by cardiac conduction(GO:0086092) |
| 0.4 | 1.7 | GO:0072675 | multinuclear osteoclast differentiation(GO:0072674) osteoclast fusion(GO:0072675) |
| 0.4 | 1.3 | GO:0044210 | 'de novo' CTP biosynthetic process(GO:0044210) |
| 0.4 | 0.4 | GO:0003415 | chondrocyte hypertrophy(GO:0003415) |
| 0.4 | 1.3 | GO:0009051 | pentose-phosphate shunt, oxidative branch(GO:0009051) |
| 0.4 | 0.8 | GO:1904338 | regulation of dopaminergic neuron differentiation(GO:1904338) |
| 0.4 | 1.7 | GO:0002880 | chronic inflammatory response to non-antigenic stimulus(GO:0002545) regulation of chronic inflammatory response to non-antigenic stimulus(GO:0002880) |
| 0.4 | 3.3 | GO:0042985 | negative regulation of amyloid precursor protein biosynthetic process(GO:0042985) |
| 0.4 | 3.3 | GO:2000252 | negative regulation of feeding behavior(GO:2000252) |
| 0.4 | 2.1 | GO:0018125 | peptidyl-cysteine methylation(GO:0018125) |
| 0.4 | 3.3 | GO:0060075 | regulation of resting membrane potential(GO:0060075) |
| 0.4 | 0.4 | GO:1902954 | regulation of early endosome to recycling endosome transport(GO:1902954) |
| 0.4 | 2.0 | GO:0071763 | nuclear membrane organization(GO:0071763) |
| 0.4 | 0.4 | GO:0097694 | establishment of RNA localization to telomere(GO:0097694) establishment of macromolecular complex localization to telomere(GO:0097695) |
| 0.4 | 0.4 | GO:0048703 | embryonic viscerocranium morphogenesis(GO:0048703) |
| 0.4 | 0.8 | GO:0045080 | positive regulation of chemokine biosynthetic process(GO:0045080) |
| 0.4 | 1.6 | GO:0051187 | cofactor catabolic process(GO:0051187) |
| 0.4 | 0.4 | GO:2000348 | regulation of CD40 signaling pathway(GO:2000348) |
| 0.4 | 1.6 | GO:0072136 | kidney mesenchymal cell proliferation(GO:0072135) metanephric mesenchymal cell proliferation involved in metanephros development(GO:0072136) |
| 0.4 | 0.8 | GO:1902445 | regulation of mitochondrial membrane permeability involved in programmed necrotic cell death(GO:1902445) |
| 0.4 | 0.4 | GO:0003404 | optic vesicle morphogenesis(GO:0003404) |
| 0.4 | 1.6 | GO:0046502 | uroporphyrinogen III biosynthetic process(GO:0006780) uroporphyrinogen III metabolic process(GO:0046502) |
| 0.4 | 1.6 | GO:0016557 | peroxisome membrane biogenesis(GO:0016557) |
| 0.4 | 0.4 | GO:1900451 | positive regulation of glutamate receptor signaling pathway(GO:1900451) |
| 0.4 | 0.4 | GO:0045617 | negative regulation of keratinocyte differentiation(GO:0045617) |
| 0.4 | 0.4 | GO:1905064 | negative regulation of vascular smooth muscle cell differentiation(GO:1905064) |
| 0.4 | 1.2 | GO:0006597 | spermine biosynthetic process(GO:0006597) |
| 0.4 | 0.8 | GO:0045906 | negative regulation of vasoconstriction(GO:0045906) |
| 0.4 | 0.4 | GO:0006114 | glycerol biosynthetic process(GO:0006114) alditol biosynthetic process(GO:0019401) |
| 0.4 | 2.3 | GO:2000825 | positive regulation of androgen receptor activity(GO:2000825) |
| 0.4 | 6.6 | GO:0007213 | G-protein coupled acetylcholine receptor signaling pathway(GO:0007213) |
| 0.4 | 2.7 | GO:0032808 | lacrimal gland development(GO:0032808) |
| 0.4 | 3.1 | GO:0034214 | protein hexamerization(GO:0034214) |
| 0.4 | 1.2 | GO:1905224 | clathrin-coated pit assembly(GO:1905224) |
| 0.4 | 0.8 | GO:0016476 | regulation of embryonic cell shape(GO:0016476) |
| 0.4 | 3.9 | GO:0060712 | spongiotrophoblast layer development(GO:0060712) |
| 0.4 | 4.2 | GO:0035269 | protein O-linked mannosylation(GO:0035269) |
| 0.4 | 1.9 | GO:0044351 | macropinocytosis(GO:0044351) |
| 0.4 | 1.5 | GO:2000860 | positive regulation of mineralocorticoid secretion(GO:2000857) positive regulation of aldosterone secretion(GO:2000860) |
| 0.4 | 0.4 | GO:1903566 | regulation of protein localization to cilium(GO:1903564) positive regulation of protein localization to cilium(GO:1903566) |
| 0.4 | 0.8 | GO:0001951 | intestinal D-glucose absorption(GO:0001951) |
| 0.4 | 1.1 | GO:0002184 | cytoplasmic translational termination(GO:0002184) |
| 0.4 | 9.1 | GO:0007216 | G-protein coupled glutamate receptor signaling pathway(GO:0007216) |
| 0.4 | 1.5 | GO:0046967 | cytosol to ER transport(GO:0046967) |
| 0.4 | 0.8 | GO:1903301 | positive regulation of glucokinase activity(GO:0033133) positive regulation of hexokinase activity(GO:1903301) |
| 0.4 | 1.1 | GO:0070885 | negative regulation of calcineurin-NFAT signaling cascade(GO:0070885) |
| 0.4 | 0.4 | GO:0032096 | negative regulation of response to food(GO:0032096) negative regulation of appetite(GO:0032099) |
| 0.4 | 2.3 | GO:0030948 | negative regulation of vascular endothelial growth factor receptor signaling pathway(GO:0030948) |
| 0.4 | 0.4 | GO:0015917 | aminophospholipid transport(GO:0015917) |
| 0.4 | 1.1 | GO:0043353 | enucleate erythrocyte differentiation(GO:0043353) |
| 0.4 | 0.7 | GO:1990164 | histone H2A phosphorylation(GO:1990164) |
| 0.4 | 1.1 | GO:2001169 | regulation of ATP biosynthetic process(GO:2001169) positive regulation of ATP biosynthetic process(GO:2001171) |
| 0.4 | 0.4 | GO:0000103 | sulfate assimilation(GO:0000103) |
| 0.4 | 0.7 | GO:0060437 | lung growth(GO:0060437) |
| 0.4 | 3.7 | GO:0070973 | protein localization to endoplasmic reticulum exit site(GO:0070973) |
| 0.4 | 0.4 | GO:0003250 | cell proliferation involved in heart valve morphogenesis(GO:0003249) regulation of cell proliferation involved in heart valve morphogenesis(GO:0003250) |
| 0.4 | 0.7 | GO:0034393 | positive regulation of smooth muscle cell apoptotic process(GO:0034393) |
| 0.4 | 0.4 | GO:0006290 | pyrimidine dimer repair(GO:0006290) |
| 0.4 | 0.7 | GO:0097212 | lysosomal membrane organization(GO:0097212) regulation of late endosome to lysosome transport(GO:1902822) |
| 0.4 | 0.4 | GO:0060769 | positive regulation of epithelial cell proliferation involved in prostate gland development(GO:0060769) |
| 0.4 | 1.5 | GO:0035511 | oxidative DNA demethylation(GO:0035511) |
| 0.4 | 0.7 | GO:0002371 | dendritic cell cytokine production(GO:0002371) |
| 0.4 | 0.7 | GO:0021540 | corpus callosum morphogenesis(GO:0021540) |
| 0.4 | 3.7 | GO:0006002 | fructose 6-phosphate metabolic process(GO:0006002) |
| 0.4 | 2.6 | GO:1900084 | regulation of peptidyl-tyrosine autophosphorylation(GO:1900084) |
| 0.4 | 2.2 | GO:1904925 | positive regulation of macromitophagy(GO:1901526) positive regulation of mitophagy in response to mitochondrial depolarization(GO:1904925) |
| 0.4 | 1.1 | GO:0048168 | regulation of neuronal synaptic plasticity(GO:0048168) |
| 0.4 | 1.1 | GO:0018076 | N-terminal peptidyl-lysine acetylation(GO:0018076) |
| 0.4 | 10.2 | GO:0071498 | cellular response to fluid shear stress(GO:0071498) |
| 0.4 | 1.5 | GO:0090160 | Golgi to lysosome transport(GO:0090160) |
| 0.4 | 2.6 | GO:0098881 | exocytic insertion of neurotransmitter receptor to plasma membrane(GO:0098881) exocytic insertion of neurotransmitter receptor to postsynaptic membrane(GO:0098967) |
| 0.4 | 2.2 | GO:0034626 | fatty acid elongation, saturated fatty acid(GO:0019367) fatty acid elongation, unsaturated fatty acid(GO:0019368) fatty acid elongation, monounsaturated fatty acid(GO:0034625) fatty acid elongation, polyunsaturated fatty acid(GO:0034626) |
| 0.4 | 1.4 | GO:0044375 | regulation of peroxisome size(GO:0044375) |
| 0.4 | 2.2 | GO:1904417 | regulation of xenophagy(GO:1904415) positive regulation of xenophagy(GO:1904417) |
| 0.4 | 0.4 | GO:1902583 | multi-organism intracellular transport(GO:1902583) |
| 0.4 | 1.1 | GO:0001923 | B-1 B cell differentiation(GO:0001923) |
| 0.4 | 0.4 | GO:0014002 | astrocyte development(GO:0014002) |
| 0.4 | 2.1 | GO:0032468 | Golgi calcium ion homeostasis(GO:0032468) |
| 0.4 | 0.4 | GO:1900223 | positive regulation of beta-amyloid clearance(GO:1900223) |
| 0.4 | 1.1 | GO:0071140 | resolution of recombination intermediates(GO:0071139) resolution of mitotic recombination intermediates(GO:0071140) |
| 0.4 | 0.7 | GO:0043376 | regulation of CD8-positive, alpha-beta T cell differentiation(GO:0043376) |
| 0.4 | 0.4 | GO:0015883 | FAD transport(GO:0015883) FAD transmembrane transport(GO:0035350) |
| 0.4 | 1.4 | GO:0031291 | Ran protein signal transduction(GO:0031291) |
| 0.4 | 1.1 | GO:1904799 | negative regulation of dendrite extension(GO:1903860) regulation of neuron remodeling(GO:1904799) negative regulation of neuron remodeling(GO:1904800) negative regulation of branching morphogenesis of a nerve(GO:2000173) |
| 0.4 | 1.4 | GO:0072658 | positive regulation of cell communication by electrical coupling(GO:0010650) maintenance of protein location in membrane(GO:0072658) maintenance of protein location in plasma membrane(GO:0072660) positive regulation of membrane depolarization during cardiac muscle cell action potential(GO:1900827) |
| 0.4 | 0.7 | GO:0003149 | membranous septum morphogenesis(GO:0003149) |
| 0.4 | 1.1 | GO:0052027 | modulation of signal transduction in other organism(GO:0044501) modulation by symbiont of host signal transduction pathway(GO:0052027) modulation of signal transduction in other organism involved in symbiotic interaction(GO:0052250) modulation by symbiont of host I-kappaB kinase/NF-kappaB cascade(GO:0085032) |
| 0.4 | 1.1 | GO:0030327 | prenylated protein catabolic process(GO:0030327) |
| 0.4 | 2.8 | GO:0046847 | filopodium assembly(GO:0046847) |
| 0.4 | 14.7 | GO:0050690 | regulation of defense response to virus by virus(GO:0050690) |
| 0.4 | 2.8 | GO:0017183 | peptidyl-diphthamide metabolic process(GO:0017182) peptidyl-diphthamide biosynthetic process from peptidyl-histidine(GO:0017183) |
| 0.3 | 9.1 | GO:0032456 | endocytic recycling(GO:0032456) |
| 0.3 | 2.8 | GO:0035733 | hepatic stellate cell activation(GO:0035733) |
| 0.3 | 2.8 | GO:0032020 | ISG15-protein conjugation(GO:0032020) |
| 0.3 | 0.7 | GO:0003418 | growth plate cartilage chondrocyte differentiation(GO:0003418) |
| 0.3 | 0.7 | GO:0021773 | striatal medium spiny neuron differentiation(GO:0021773) |
| 0.3 | 1.4 | GO:0075044 | autophagy of host cells involved in interaction with symbiont(GO:0075044) autophagy involved in symbiotic interaction(GO:0075071) |
| 0.3 | 2.8 | GO:2000172 | regulation of branching morphogenesis of a nerve(GO:2000172) |
| 0.3 | 0.7 | GO:1903595 | positive regulation of histamine secretion by mast cell(GO:1903595) |
| 0.3 | 1.4 | GO:0090050 | positive regulation of cell migration involved in sprouting angiogenesis(GO:0090050) |
| 0.3 | 1.4 | GO:0010767 | regulation of transcription from RNA polymerase II promoter in response to UV-induced DNA damage(GO:0010767) |
| 0.3 | 2.4 | GO:0010792 | DNA double-strand break processing involved in repair via single-strand annealing(GO:0010792) |
| 0.3 | 0.7 | GO:0018243 | protein O-linked glycosylation via threonine(GO:0018243) |
| 0.3 | 0.3 | GO:1902410 | mitotic cytokinetic process(GO:1902410) |
| 0.3 | 1.7 | GO:2001076 | regulation of metanephric ureteric bud development(GO:2001074) positive regulation of metanephric ureteric bud development(GO:2001076) |
| 0.3 | 1.0 | GO:0000379 | tRNA-type intron splice site recognition and cleavage(GO:0000379) |
| 0.3 | 0.3 | GO:1902473 | regulation of protein localization to synapse(GO:1902473) |
| 0.3 | 0.3 | GO:1902548 | negative regulation of cellular response to vascular endothelial growth factor stimulus(GO:1902548) |
| 0.3 | 1.3 | GO:0015793 | glycerol transport(GO:0015793) |
| 0.3 | 0.7 | GO:0002901 | mature B cell apoptotic process(GO:0002901) regulation of mature B cell apoptotic process(GO:0002905) negative regulation of mature B cell apoptotic process(GO:0002906) |
| 0.3 | 5.0 | GO:0031954 | positive regulation of protein autophosphorylation(GO:0031954) |
| 0.3 | 1.0 | GO:1900186 | negative regulation of clathrin-mediated endocytosis(GO:1900186) |
| 0.3 | 5.3 | GO:0032331 | negative regulation of chondrocyte differentiation(GO:0032331) |
| 0.3 | 3.0 | GO:0002318 | myeloid progenitor cell differentiation(GO:0002318) |
| 0.3 | 0.7 | GO:1900127 | positive regulation of hyaluronan biosynthetic process(GO:1900127) |
| 0.3 | 0.3 | GO:0060074 | synapse maturation(GO:0060074) |
| 0.3 | 1.0 | GO:1901571 | icosanoid transport(GO:0071715) fatty acid derivative transport(GO:1901571) |
| 0.3 | 0.7 | GO:0070933 | histone H4 deacetylation(GO:0070933) |
| 0.3 | 1.3 | GO:0048698 | negative regulation of collateral sprouting in absence of injury(GO:0048698) |
| 0.3 | 1.0 | GO:0070370 | heat acclimation(GO:0010286) cellular heat acclimation(GO:0070370) |
| 0.3 | 1.0 | GO:0090487 | toxin catabolic process(GO:0009407) secondary metabolite catabolic process(GO:0090487) |
| 0.3 | 1.3 | GO:0051563 | smooth endoplasmic reticulum calcium ion homeostasis(GO:0051563) |
| 0.3 | 1.0 | GO:2001160 | regulation of histone H3-K79 methylation(GO:2001160) positive regulation of histone H3-K79 methylation(GO:2001162) |
| 0.3 | 11.4 | GO:1904031 | positive regulation of cyclin-dependent protein kinase activity(GO:1904031) |
| 0.3 | 0.3 | GO:2001020 | regulation of response to DNA damage stimulus(GO:2001020) |
| 0.3 | 0.6 | GO:0086021 | SA node cell to atrial cardiac muscle cell communication by electrical coupling(GO:0086021) AV node cell to bundle of His cell communication by electrical coupling(GO:0086053) |
| 0.3 | 0.3 | GO:0030316 | osteoclast differentiation(GO:0030316) |
| 0.3 | 1.0 | GO:0060392 | negative regulation of SMAD protein import into nucleus(GO:0060392) |
| 0.3 | 20.3 | GO:0051965 | positive regulation of synapse assembly(GO:0051965) |
| 0.3 | 0.3 | GO:0043651 | linoleic acid metabolic process(GO:0043651) |
| 0.3 | 1.3 | GO:0035634 | response to stilbenoid(GO:0035634) |
| 0.3 | 2.2 | GO:0002457 | T cell antigen processing and presentation(GO:0002457) |
| 0.3 | 1.0 | GO:0034344 | type III interferon production(GO:0034343) regulation of type III interferon production(GO:0034344) |
| 0.3 | 1.6 | GO:0010757 | negative regulation of plasminogen activation(GO:0010757) |
| 0.3 | 0.3 | GO:0000290 | deadenylation-dependent decapping of nuclear-transcribed mRNA(GO:0000290) |
| 0.3 | 0.9 | GO:0032713 | negative regulation of interleukin-4 production(GO:0032713) |
| 0.3 | 0.9 | GO:0051088 | PMA-inducible membrane protein ectodomain proteolysis(GO:0051088) |
| 0.3 | 0.9 | GO:0042700 | luteinizing hormone signaling pathway(GO:0042700) |
| 0.3 | 0.6 | GO:0018065 | protein-cofactor linkage(GO:0018065) |
| 0.3 | 1.3 | GO:0060040 | retinal bipolar neuron differentiation(GO:0060040) |
| 0.3 | 0.9 | GO:0090283 | regulation of protein glycosylation in Golgi(GO:0090283) |
| 0.3 | 1.9 | GO:0016191 | synaptic vesicle uncoating(GO:0016191) |
| 0.3 | 1.9 | GO:0021603 | cranial nerve formation(GO:0021603) |
| 0.3 | 0.6 | GO:0060510 | Type II pneumocyte differentiation(GO:0060510) |
| 0.3 | 3.1 | GO:0010265 | SCF complex assembly(GO:0010265) |
| 0.3 | 2.2 | GO:0007183 | SMAD protein complex assembly(GO:0007183) |
| 0.3 | 1.9 | GO:0048280 | vesicle fusion with Golgi apparatus(GO:0048280) |
| 0.3 | 0.6 | GO:0042149 | cellular response to glucose starvation(GO:0042149) |
| 0.3 | 0.3 | GO:0043987 | histone H3-S10 phosphorylation(GO:0043987) |
| 0.3 | 2.8 | GO:0038145 | macrophage colony-stimulating factor signaling pathway(GO:0038145) |
| 0.3 | 0.9 | GO:0051493 | regulation of cytoskeleton organization(GO:0051493) |
| 0.3 | 0.9 | GO:0045838 | positive regulation of membrane potential(GO:0045838) |
| 0.3 | 1.5 | GO:0006127 | glycerophosphate shuttle(GO:0006127) |
| 0.3 | 1.2 | GO:0042256 | mature ribosome assembly(GO:0042256) |
| 0.3 | 1.2 | GO:2000035 | regulation of stem cell division(GO:2000035) |
| 0.3 | 1.2 | GO:0090202 | transcriptional activation by promoter-enhancer looping(GO:0071733) gene looping(GO:0090202) dsDNA loop formation(GO:0090579) |
| 0.3 | 0.3 | GO:2000182 | regulation of progesterone biosynthetic process(GO:2000182) |
| 0.3 | 1.2 | GO:0006432 | phenylalanyl-tRNA aminoacylation(GO:0006432) |
| 0.3 | 1.5 | GO:0010724 | regulation of definitive erythrocyte differentiation(GO:0010724) |
| 0.3 | 0.6 | GO:0032780 | negative regulation of ATPase activity(GO:0032780) |
| 0.3 | 5.7 | GO:0031529 | ruffle organization(GO:0031529) |
| 0.3 | 1.2 | GO:0031114 | regulation of microtubule depolymerization(GO:0031114) |
| 0.3 | 0.6 | GO:0010944 | negative regulation of transcription by competitive promoter binding(GO:0010944) |
| 0.3 | 7.5 | GO:0030208 | dermatan sulfate biosynthetic process(GO:0030208) |
| 0.3 | 0.9 | GO:2000824 | negative regulation of androgen receptor activity(GO:2000824) |
| 0.3 | 1.5 | GO:1902902 | negative regulation of autophagosome assembly(GO:1902902) |
| 0.3 | 0.9 | GO:0046061 | dATP catabolic process(GO:0046061) |
| 0.3 | 0.3 | GO:0051784 | negative regulation of nuclear division(GO:0051784) |
| 0.3 | 0.9 | GO:1903546 | protein localization to photoreceptor outer segment(GO:1903546) |
| 0.3 | 1.8 | GO:0050689 | negative regulation of defense response to virus by host(GO:0050689) |
| 0.3 | 0.9 | GO:0060084 | synaptic transmission involved in micturition(GO:0060084) |
| 0.3 | 0.3 | GO:0043407 | negative regulation of MAP kinase activity(GO:0043407) |
| 0.3 | 0.9 | GO:0000729 | DNA double-strand break processing(GO:0000729) |
| 0.3 | 0.6 | GO:0098902 | regulation of membrane depolarization during action potential(GO:0098902) |
| 0.3 | 1.8 | GO:0034260 | negative regulation of GTPase activity(GO:0034260) |
| 0.3 | 6.4 | GO:0043616 | keratinocyte proliferation(GO:0043616) |
| 0.3 | 0.6 | GO:0045074 | interleukin-10 biosynthetic process(GO:0042091) regulation of interleukin-10 biosynthetic process(GO:0045074) |
| 0.3 | 12.0 | GO:0035735 | intraciliary transport involved in cilium morphogenesis(GO:0035735) |
| 0.3 | 1.5 | GO:0015862 | uridine transport(GO:0015862) |
| 0.3 | 1.8 | GO:1903921 | protein processing in phagocytic vesicle(GO:1900756) regulation of protein processing in phagocytic vesicle(GO:1903921) positive regulation of protein processing in phagocytic vesicle(GO:1903923) |
| 0.3 | 0.3 | GO:0042074 | cell migration involved in gastrulation(GO:0042074) |
| 0.3 | 0.9 | GO:0006627 | protein processing involved in protein targeting to mitochondrion(GO:0006627) |
| 0.3 | 2.3 | GO:0060670 | branching involved in labyrinthine layer morphogenesis(GO:0060670) |
| 0.3 | 0.6 | GO:1990086 | lens fiber cell apoptotic process(GO:1990086) |
| 0.3 | 0.9 | GO:0018377 | protein myristoylation(GO:0018377) |
| 0.3 | 0.3 | GO:0006679 | glucosylceramide biosynthetic process(GO:0006679) |
| 0.3 | 0.9 | GO:0051102 | DNA ligation involved in DNA recombination(GO:0051102) |
| 0.3 | 0.9 | GO:0006102 | isocitrate metabolic process(GO:0006102) |
| 0.3 | 1.2 | GO:0061053 | somite development(GO:0061053) |
| 0.3 | 1.2 | GO:0008616 | queuosine biosynthetic process(GO:0008616) queuosine metabolic process(GO:0046116) |
| 0.3 | 0.9 | GO:1901842 | negative regulation of high voltage-gated calcium channel activity(GO:1901842) |
| 0.3 | 1.4 | GO:0090161 | Golgi ribbon formation(GO:0090161) |
| 0.3 | 3.7 | GO:0098903 | regulation of membrane repolarization during action potential(GO:0098903) |
| 0.3 | 2.9 | GO:0015691 | cadmium ion transport(GO:0015691) cadmium ion transmembrane transport(GO:0070574) |
| 0.3 | 3.7 | GO:0031268 | pseudopodium organization(GO:0031268) |
| 0.3 | 1.4 | GO:0010745 | negative regulation of macrophage derived foam cell differentiation(GO:0010745) |
| 0.3 | 0.9 | GO:0090187 | positive regulation of pancreatic juice secretion(GO:0090187) |
| 0.3 | 1.1 | GO:0003157 | endocardium development(GO:0003157) |
| 0.3 | 0.9 | GO:1903028 | positive regulation of opsonization(GO:1903028) |
| 0.3 | 0.3 | GO:0086091 | regulation of heart rate by cardiac conduction(GO:0086091) |
| 0.3 | 2.0 | GO:0070863 | positive regulation of protein exit from endoplasmic reticulum(GO:0070863) |
| 0.3 | 1.1 | GO:0006196 | AMP catabolic process(GO:0006196) |
| 0.3 | 0.8 | GO:0032747 | positive regulation of interleukin-23 production(GO:0032747) |
| 0.3 | 1.7 | GO:0043653 | mitochondrial fragmentation involved in apoptotic process(GO:0043653) |
| 0.3 | 2.5 | GO:0039536 | negative regulation of RIG-I signaling pathway(GO:0039536) |
| 0.3 | 0.6 | GO:0003278 | apoptotic process involved in heart morphogenesis(GO:0003278) |
| 0.3 | 1.1 | GO:0097084 | vascular smooth muscle cell development(GO:0097084) |
| 0.3 | 0.3 | GO:0032055 | negative regulation of translation in response to stress(GO:0032055) negative regulation of translational initiation in response to stress(GO:0032057) |
| 0.3 | 3.9 | GO:0001542 | ovulation from ovarian follicle(GO:0001542) |
| 0.3 | 7.2 | GO:0009235 | cobalamin metabolic process(GO:0009235) |
| 0.3 | 0.8 | GO:0021569 | rhombomere 3 development(GO:0021569) |
| 0.3 | 1.9 | GO:0010835 | regulation of protein ADP-ribosylation(GO:0010835) |
| 0.3 | 1.7 | GO:0070966 | nuclear-transcribed mRNA catabolic process, no-go decay(GO:0070966) |
| 0.3 | 1.4 | GO:0033314 | mitotic DNA replication checkpoint(GO:0033314) |
| 0.3 | 1.1 | GO:0051490 | negative regulation of filopodium assembly(GO:0051490) |
| 0.3 | 0.6 | GO:0001806 | type IV hypersensitivity(GO:0001806) |
| 0.3 | 2.8 | GO:0039530 | MDA-5 signaling pathway(GO:0039530) |
| 0.3 | 0.3 | GO:0021798 | forebrain dorsal/ventral pattern formation(GO:0021798) |
| 0.3 | 1.6 | GO:1903378 | positive regulation of oxidative stress-induced neuron intrinsic apoptotic signaling pathway(GO:1903378) |
| 0.3 | 1.9 | GO:0050863 | regulation of T cell activation(GO:0050863) |
| 0.3 | 0.8 | GO:0036353 | histone H2A-K119 monoubiquitination(GO:0036353) |
| 0.3 | 0.5 | GO:0071603 | endothelial cell-cell adhesion(GO:0071603) |
| 0.3 | 1.1 | GO:0035026 | leading edge cell differentiation(GO:0035026) |
| 0.3 | 0.5 | GO:0014054 | positive regulation of gamma-aminobutyric acid secretion(GO:0014054) |
| 0.3 | 0.5 | GO:1901656 | glycoside transport(GO:1901656) |
| 0.3 | 0.5 | GO:0042761 | fatty acid elongation(GO:0030497) very long-chain fatty acid biosynthetic process(GO:0042761) |
| 0.3 | 0.5 | GO:1902309 | negative regulation of peptidyl-serine dephosphorylation(GO:1902309) |
| 0.3 | 0.3 | GO:0010634 | positive regulation of epithelial cell migration(GO:0010634) |
| 0.3 | 1.1 | GO:0034334 | adherens junction maintenance(GO:0034334) |
| 0.3 | 0.3 | GO:0016081 | synaptic vesicle docking(GO:0016081) |
| 0.3 | 0.8 | GO:0030860 | regulation of polarized epithelial cell differentiation(GO:0030860) |
| 0.3 | 1.1 | GO:0030807 | positive regulation of cyclic nucleotide catabolic process(GO:0030807) positive regulation of cAMP catabolic process(GO:0030822) positive regulation of purine nucleotide catabolic process(GO:0033123) |
| 0.3 | 1.6 | GO:0051012 | microtubule sliding(GO:0051012) |
| 0.3 | 2.1 | GO:0072733 | response to staurosporine(GO:0072733) cellular response to staurosporine(GO:0072734) |
| 0.3 | 0.5 | GO:0021785 | branchiomotor neuron axon guidance(GO:0021785) |
| 0.3 | 0.8 | GO:1904354 | negative regulation of telomere capping(GO:1904354) |
| 0.3 | 0.5 | GO:0002001 | renal response to blood flow involved in circulatory renin-angiotensin regulation of systemic arterial blood pressure(GO:0001999) renin secretion into blood stream(GO:0002001) |
| 0.3 | 0.8 | GO:1990108 | protein linear deubiquitination(GO:1990108) |
| 0.3 | 0.3 | GO:0032472 | Golgi calcium ion transport(GO:0032472) |
| 0.3 | 0.8 | GO:0014735 | regulation of muscle atrophy(GO:0014735) negative regulation of muscle atrophy(GO:0014736) response to injury involved in regulation of muscle adaptation(GO:0014876) |
| 0.3 | 0.3 | GO:1900039 | positive regulation of cellular response to hypoxia(GO:1900039) |
| 0.3 | 2.9 | GO:0043374 | CD8-positive, alpha-beta T cell differentiation(GO:0043374) |
| 0.3 | 3.4 | GO:0071397 | cellular response to cholesterol(GO:0071397) |
| 0.3 | 6.9 | GO:0043968 | histone H2A acetylation(GO:0043968) |
| 0.3 | 0.5 | GO:0072321 | chaperone-mediated protein transport(GO:0072321) |
| 0.3 | 0.8 | GO:0045210 | FasL biosynthetic process(GO:0045210) |
| 0.3 | 5.5 | GO:0071624 | positive regulation of granulocyte chemotaxis(GO:0071624) |
| 0.3 | 1.8 | GO:0006531 | aspartate metabolic process(GO:0006531) |
| 0.3 | 2.1 | GO:0046825 | regulation of protein export from nucleus(GO:0046825) |
| 0.3 | 0.3 | GO:0033326 | cerebrospinal fluid secretion(GO:0033326) |
| 0.3 | 0.3 | GO:0031340 | positive regulation of vesicle fusion(GO:0031340) |
| 0.3 | 0.5 | GO:0006382 | adenosine to inosine editing(GO:0006382) |
| 0.3 | 0.3 | GO:2001015 | negative regulation of skeletal muscle cell differentiation(GO:2001015) |
| 0.3 | 2.6 | GO:0000972 | transcription-dependent tethering of RNA polymerase II gene DNA at nuclear periphery(GO:0000972) |
| 0.3 | 0.5 | GO:0031573 | intra-S DNA damage checkpoint(GO:0031573) |
| 0.3 | 7.2 | GO:0070987 | error-free translesion synthesis(GO:0070987) |
| 0.3 | 1.0 | GO:0032273 | positive regulation of protein polymerization(GO:0032273) |
| 0.3 | 7.7 | GO:0070911 | global genome nucleotide-excision repair(GO:0070911) |
| 0.3 | 0.3 | GO:0006271 | DNA strand elongation involved in DNA replication(GO:0006271) |
| 0.3 | 1.5 | GO:0006489 | dolichyl diphosphate biosynthetic process(GO:0006489) dolichyl diphosphate metabolic process(GO:0046465) |
| 0.3 | 1.3 | GO:0034351 | regulation of glial cell apoptotic process(GO:0034350) negative regulation of glial cell apoptotic process(GO:0034351) |
| 0.3 | 0.5 | GO:0010643 | cell communication by chemical coupling(GO:0010643) |
| 0.3 | 0.8 | GO:0048842 | positive regulation of axon extension involved in axon guidance(GO:0048842) |
| 0.3 | 0.3 | GO:0060081 | membrane hyperpolarization(GO:0060081) |
| 0.3 | 1.3 | GO:0010917 | negative regulation of mitochondrial membrane potential(GO:0010917) |
| 0.3 | 1.5 | GO:0006509 | membrane protein ectodomain proteolysis(GO:0006509) |
| 0.3 | 0.3 | GO:0030205 | dermatan sulfate metabolic process(GO:0030205) |
| 0.3 | 3.0 | GO:0030150 | protein import into mitochondrial matrix(GO:0030150) |
| 0.3 | 0.3 | GO:0045776 | negative regulation of blood pressure(GO:0045776) |
| 0.3 | 3.0 | GO:0035372 | protein localization to microtubule(GO:0035372) |
| 0.2 | 0.2 | GO:0060298 | positive regulation of sarcomere organization(GO:0060298) |
| 0.2 | 1.2 | GO:2000323 | negative regulation of glucocorticoid receptor signaling pathway(GO:2000323) |
| 0.2 | 2.0 | GO:0044341 | sodium-dependent phosphate transport(GO:0044341) |
| 0.2 | 2.0 | GO:0045905 | translational frameshifting(GO:0006452) positive regulation of translational termination(GO:0045905) |
| 0.2 | 1.2 | GO:0034316 | negative regulation of Arp2/3 complex-mediated actin nucleation(GO:0034316) |
| 0.2 | 1.0 | GO:0032058 | positive regulation of translational initiation in response to stress(GO:0032058) |
| 0.2 | 0.5 | GO:0016045 | detection of bacterium(GO:0016045) |
| 0.2 | 1.0 | GO:0018364 | peptidyl-glutamine methylation(GO:0018364) |
| 0.2 | 3.0 | GO:0006122 | mitochondrial electron transport, ubiquinol to cytochrome c(GO:0006122) |
| 0.2 | 0.5 | GO:2000504 | positive regulation of blood vessel remodeling(GO:2000504) |
| 0.2 | 0.5 | GO:2000870 | regulation of progesterone secretion(GO:2000870) |
| 0.2 | 0.7 | GO:0046121 | deoxyribonucleoside catabolic process(GO:0046121) |
| 0.2 | 0.7 | GO:0021559 | trigeminal nerve development(GO:0021559) |
| 0.2 | 0.7 | GO:0050894 | determination of affect(GO:0050894) |
| 0.2 | 0.7 | GO:0090527 | actin filament reorganization(GO:0090527) |
| 0.2 | 0.2 | GO:0018027 | peptidyl-lysine dimethylation(GO:0018027) |
| 0.2 | 1.0 | GO:0060729 | intestinal epithelial structure maintenance(GO:0060729) |
| 0.2 | 1.2 | GO:0033128 | negative regulation of histone phosphorylation(GO:0033128) |
| 0.2 | 1.5 | GO:0009134 | nucleoside diphosphate catabolic process(GO:0009134) |
| 0.2 | 0.7 | GO:0044467 | glial cell-derived neurotrophic factor secretion(GO:0044467) regulation of glial cell-derived neurotrophic factor secretion(GO:1900166) positive regulation of glial cell-derived neurotrophic factor secretion(GO:1900168) |
| 0.2 | 0.2 | GO:1903748 | negative regulation of establishment of protein localization to mitochondrion(GO:1903748) |
| 0.2 | 1.0 | GO:0090045 | positive regulation of deacetylase activity(GO:0090045) |
| 0.2 | 0.7 | GO:0035723 | interleukin-15-mediated signaling pathway(GO:0035723) extrathymic T cell selection(GO:0045062) cellular response to interleukin-15(GO:0071350) regulation of protein O-linked glycosylation(GO:1904098) positive regulation of protein O-linked glycosylation(GO:1904100) |
| 0.2 | 0.7 | GO:0030451 | regulation of complement activation, alternative pathway(GO:0030451) negative regulation of complement activation, alternative pathway(GO:0045957) |
| 0.2 | 1.7 | GO:0051415 | interphase microtubule nucleation by interphase microtubule organizing center(GO:0051415) microtubule nucleation by microtubule organizing center(GO:0051418) |
| 0.2 | 0.2 | GO:0048733 | sebaceous gland development(GO:0048733) |
| 0.2 | 0.7 | GO:0051311 | meiotic metaphase I plate congression(GO:0043060) meiotic spindle midzone assembly(GO:0051257) meiotic metaphase plate congression(GO:0051311) |
| 0.2 | 0.2 | GO:0032241 | positive regulation of nucleobase-containing compound transport(GO:0032241) |
| 0.2 | 0.2 | GO:0051918 | negative regulation of fibrinolysis(GO:0051918) |
| 0.2 | 1.4 | GO:0042747 | circadian sleep/wake cycle, REM sleep(GO:0042747) |
| 0.2 | 0.2 | GO:0086036 | regulation of cardiac muscle cell membrane potential(GO:0086036) |
| 0.2 | 0.9 | GO:0039663 | fusion of virus membrane with host plasma membrane(GO:0019064) membrane fusion involved in viral entry into host cell(GO:0039663) multi-organism membrane fusion(GO:0044800) |
| 0.2 | 0.5 | GO:0098759 | response to interleukin-8(GO:0098758) cellular response to interleukin-8(GO:0098759) |
| 0.2 | 0.9 | GO:0060088 | auditory receptor cell stereocilium organization(GO:0060088) |
| 0.2 | 0.2 | GO:0042220 | response to cocaine(GO:0042220) |
| 0.2 | 1.4 | GO:0071321 | cellular response to cGMP(GO:0071321) |
| 0.2 | 0.7 | GO:0048200 | COPI-coated vesicle budding(GO:0035964) Golgi transport vesicle coating(GO:0048200) COPI coating of Golgi vesicle(GO:0048205) |
| 0.2 | 0.5 | GO:2000542 | negative regulation of gastrulation(GO:2000542) |
| 0.2 | 3.5 | GO:0019371 | cyclooxygenase pathway(GO:0019371) |
| 0.2 | 14.0 | GO:1900181 | negative regulation of protein localization to nucleus(GO:1900181) |
| 0.2 | 2.7 | GO:0007220 | Notch receptor processing(GO:0007220) |
| 0.2 | 6.9 | GO:0097435 | fibril organization(GO:0097435) |
| 0.2 | 2.3 | GO:1901621 | negative regulation of smoothened signaling pathway involved in dorsal/ventral neural tube patterning(GO:1901621) |
| 0.2 | 0.5 | GO:0060796 | regulation of transcription involved in primary germ layer cell fate commitment(GO:0060796) |
| 0.2 | 0.5 | GO:0032486 | Rap protein signal transduction(GO:0032486) |
| 0.2 | 3.2 | GO:0038003 | opioid receptor signaling pathway(GO:0038003) |
| 0.2 | 0.5 | GO:1904259 | regulation of basement membrane assembly involved in embryonic body morphogenesis(GO:1904259) positive regulation of basement membrane assembly involved in embryonic body morphogenesis(GO:1904261) basement membrane assembly involved in embryonic body morphogenesis(GO:2001197) |
| 0.2 | 0.5 | GO:0016129 | phytosteroid metabolic process(GO:0016128) phytosteroid biosynthetic process(GO:0016129) |
| 0.2 | 0.2 | GO:0032714 | negative regulation of interleukin-5 production(GO:0032714) |
| 0.2 | 3.4 | GO:0000338 | protein deneddylation(GO:0000338) |
| 0.2 | 1.1 | GO:0006541 | glutamine metabolic process(GO:0006541) |
| 0.2 | 1.8 | GO:0010172 | embryonic body morphogenesis(GO:0010172) |
| 0.2 | 0.9 | GO:0007619 | courtship behavior(GO:0007619) |
| 0.2 | 0.9 | GO:0070841 | inclusion body assembly(GO:0070841) |
| 0.2 | 0.2 | GO:0046101 | hypoxanthine metabolic process(GO:0046100) hypoxanthine biosynthetic process(GO:0046101) |
| 0.2 | 1.8 | GO:2000271 | positive regulation of fibroblast apoptotic process(GO:2000271) |
| 0.2 | 1.1 | GO:0045919 | positive regulation of cytolysis(GO:0045919) |
| 0.2 | 1.1 | GO:0090080 | positive regulation of MAPKKK cascade by fibroblast growth factor receptor signaling pathway(GO:0090080) |
| 0.2 | 0.2 | GO:0097296 | activation of cysteine-type endopeptidase activity involved in apoptotic signaling pathway(GO:0097296) |
| 0.2 | 1.1 | GO:0046477 | glycosylceramide catabolic process(GO:0046477) |
| 0.2 | 1.3 | GO:0046604 | positive regulation of mitotic centrosome separation(GO:0046604) |
| 0.2 | 0.7 | GO:1902017 | regulation of cilium assembly(GO:1902017) |
| 0.2 | 0.4 | GO:0015670 | carbon dioxide transport(GO:0015670) |
| 0.2 | 0.7 | GO:0035457 | cellular response to interferon-alpha(GO:0035457) |
| 0.2 | 0.7 | GO:0033489 | cholesterol biosynthetic process via desmosterol(GO:0033489) cholesterol biosynthetic process via lathosterol(GO:0033490) |
| 0.2 | 0.2 | GO:0060992 | response to fungicide(GO:0060992) |
| 0.2 | 12.4 | GO:0045071 | negative regulation of viral genome replication(GO:0045071) |
| 0.2 | 1.1 | GO:2001034 | positive regulation of double-strand break repair via nonhomologous end joining(GO:2001034) |
| 0.2 | 0.7 | GO:0007079 | mitotic chromosome movement towards spindle pole(GO:0007079) |
| 0.2 | 2.6 | GO:1903504 | regulation of mitotic cell cycle spindle assembly checkpoint(GO:0090266) regulation of mitotic spindle checkpoint(GO:1903504) |
| 0.2 | 6.3 | GO:1901030 | positive regulation of mitochondrial outer membrane permeabilization involved in apoptotic signaling pathway(GO:1901030) |
| 0.2 | 8.8 | GO:0070979 | protein K11-linked ubiquitination(GO:0070979) |
| 0.2 | 0.9 | GO:0000076 | DNA replication checkpoint(GO:0000076) |
| 0.2 | 0.9 | GO:0061179 | negative regulation of insulin secretion involved in cellular response to glucose stimulus(GO:0061179) |
| 0.2 | 1.1 | GO:1902268 | negative regulation of polyamine transmembrane transport(GO:1902268) |
| 0.2 | 0.4 | GO:1990737 | response to manganese-induced endoplasmic reticulum stress(GO:1990737) |
| 0.2 | 3.0 | GO:0031441 | negative regulation of mRNA 3'-end processing(GO:0031441) |
| 0.2 | 0.4 | GO:2000253 | positive regulation of feeding behavior(GO:2000253) |
| 0.2 | 0.4 | GO:0015911 | plasma membrane long-chain fatty acid transport(GO:0015911) |
| 0.2 | 0.2 | GO:0051792 | medium-chain fatty acid biosynthetic process(GO:0051792) |
| 0.2 | 0.2 | GO:0000255 | allantoin metabolic process(GO:0000255) |
| 0.2 | 1.5 | GO:0045995 | regulation of embryonic development(GO:0045995) |
| 0.2 | 1.7 | GO:0001711 | endodermal cell fate commitment(GO:0001711) |
| 0.2 | 0.2 | GO:0070305 | response to cGMP(GO:0070305) |
| 0.2 | 1.1 | GO:0044362 | modulation of molecular function in other organism(GO:0044359) negative regulation of molecular function in other organism(GO:0044362) negative regulation of molecular function in other organism involved in symbiotic interaction(GO:0052204) modulation of molecular function in other organism involved in symbiotic interaction(GO:0052205) modification by host of symbiont molecular function(GO:0052428) |
| 0.2 | 0.6 | GO:0001866 | NK T cell proliferation(GO:0001866) |
| 0.2 | 0.4 | GO:0010155 | regulation of proton transport(GO:0010155) |
| 0.2 | 0.8 | GO:0006226 | dUMP biosynthetic process(GO:0006226) |
| 0.2 | 1.5 | GO:0002191 | cap-dependent translational initiation(GO:0002191) |
| 0.2 | 0.4 | GO:0006404 | RNA import into nucleus(GO:0006404) |
| 0.2 | 0.2 | GO:0016246 | RNA interference(GO:0016246) |
| 0.2 | 0.8 | GO:0042986 | positive regulation of amyloid precursor protein biosynthetic process(GO:0042986) |
| 0.2 | 4.2 | GO:0001829 | trophectodermal cell differentiation(GO:0001829) |
| 0.2 | 0.2 | GO:0001768 | establishment of T cell polarity(GO:0001768) |
| 0.2 | 0.2 | GO:0038034 | signal transduction in absence of ligand(GO:0038034) extrinsic apoptotic signaling pathway in absence of ligand(GO:0097192) |
| 0.2 | 0.4 | GO:0030174 | regulation of DNA-dependent DNA replication initiation(GO:0030174) |
| 0.2 | 0.8 | GO:0090647 | modulation of age-related behavioral decline(GO:0090647) |
| 0.2 | 1.3 | GO:0048680 | positive regulation of axon regeneration(GO:0048680) |
| 0.2 | 0.2 | GO:0098877 | neurotransmitter receptor transport to plasma membrane(GO:0098877) neurotransmitter receptor transport to postsynaptic membrane(GO:0098969) establishment of protein localization to postsynaptic membrane(GO:1903540) |
| 0.2 | 2.7 | GO:0015732 | prostaglandin transport(GO:0015732) |
| 0.2 | 1.5 | GO:0002692 | negative regulation of cellular extravasation(GO:0002692) |
| 0.2 | 1.4 | GO:0000056 | ribosomal small subunit export from nucleus(GO:0000056) |
| 0.2 | 5.6 | GO:2000249 | regulation of actin cytoskeleton reorganization(GO:2000249) |
| 0.2 | 0.6 | GO:0009597 | detection of virus(GO:0009597) |
| 0.2 | 1.0 | GO:1900112 | regulation of histone H3-K9 trimethylation(GO:1900112) |
| 0.2 | 6.2 | GO:0034314 | Arp2/3 complex-mediated actin nucleation(GO:0034314) |
| 0.2 | 0.4 | GO:1904885 | beta-catenin destruction complex assembly(GO:1904885) |
| 0.2 | 0.6 | GO:0010936 | negative regulation of macrophage cytokine production(GO:0010936) |
| 0.2 | 0.4 | GO:2000774 | positive regulation of cellular senescence(GO:2000774) |
| 0.2 | 1.8 | GO:1903441 | protein localization to ciliary membrane(GO:1903441) |
| 0.2 | 0.2 | GO:0035621 | ER to Golgi ceramide transport(GO:0035621) |
| 0.2 | 0.6 | GO:0046900 | tetrahydrofolylpolyglutamate metabolic process(GO:0046900) |
| 0.2 | 0.6 | GO:0006423 | cysteinyl-tRNA aminoacylation(GO:0006423) |
| 0.2 | 1.0 | GO:0032418 | lysosome localization(GO:0032418) |
| 0.2 | 0.8 | GO:0008299 | isoprenoid biosynthetic process(GO:0008299) |
| 0.2 | 1.4 | GO:0046618 | drug export(GO:0046618) |
| 0.2 | 0.4 | GO:0002572 | pro-T cell differentiation(GO:0002572) |
| 0.2 | 0.6 | GO:0048511 | rhythmic process(GO:0048511) |
| 0.2 | 0.4 | GO:0014859 | negative regulation of skeletal muscle cell proliferation(GO:0014859) negative regulation of skeletal muscle satellite cell proliferation(GO:1902723) |
| 0.2 | 1.0 | GO:0007028 | cytoplasm organization(GO:0007028) |
| 0.2 | 0.4 | GO:0042116 | macrophage activation(GO:0042116) |
| 0.2 | 0.2 | GO:0008631 | intrinsic apoptotic signaling pathway in response to oxidative stress(GO:0008631) |
| 0.2 | 0.4 | GO:0032570 | response to progesterone(GO:0032570) |
| 0.2 | 0.4 | GO:0014067 | negative regulation of phosphatidylinositol 3-kinase signaling(GO:0014067) |
| 0.2 | 0.6 | GO:2000587 | negative regulation of platelet-derived growth factor receptor-beta signaling pathway(GO:2000587) |
| 0.2 | 0.2 | GO:0045410 | positive regulation of interleukin-6 biosynthetic process(GO:0045410) |
| 0.2 | 0.6 | GO:0021796 | cerebral cortex regionalization(GO:0021796) |
| 0.2 | 1.2 | GO:0000727 | double-strand break repair via break-induced replication(GO:0000727) |
| 0.2 | 0.4 | GO:0038178 | complement component C5a signaling pathway(GO:0038178) negative regulation of granulocyte chemotaxis(GO:0071623) negative regulation of neutrophil chemotaxis(GO:0090024) negative regulation of neutrophil migration(GO:1902623) |
| 0.2 | 0.4 | GO:0051138 | positive regulation of NK T cell differentiation(GO:0051138) |
| 0.2 | 0.6 | GO:0048250 | mitochondrial iron ion transport(GO:0048250) |
| 0.2 | 9.9 | GO:0016266 | O-glycan processing(GO:0016266) |
| 0.2 | 0.2 | GO:1902177 | positive regulation of oxidative stress-induced intrinsic apoptotic signaling pathway(GO:1902177) |
| 0.2 | 0.2 | GO:0051964 | negative regulation of synapse assembly(GO:0051964) |
| 0.2 | 0.4 | GO:0006110 | regulation of glycolytic process(GO:0006110) regulation of nucleotide catabolic process(GO:0030811) |
| 0.2 | 1.4 | GO:0030091 | protein repair(GO:0030091) |
| 0.2 | 1.0 | GO:0030522 | intracellular receptor signaling pathway(GO:0030522) |
| 0.2 | 0.4 | GO:0043489 | RNA stabilization(GO:0043489) |
| 0.2 | 0.4 | GO:1902774 | late endosome to lysosome transport(GO:1902774) |
| 0.2 | 0.8 | GO:0055118 | negative regulation of cardiac muscle contraction(GO:0055118) |
| 0.2 | 1.3 | GO:0051292 | nuclear pore complex assembly(GO:0051292) |
| 0.2 | 0.2 | GO:0009651 | response to salt stress(GO:0009651) |
| 0.2 | 0.4 | GO:0000305 | response to oxygen radical(GO:0000305) |
| 0.2 | 1.1 | GO:1903435 | positive regulation of constitutive secretory pathway(GO:1903435) |
| 0.2 | 1.3 | GO:0045059 | positive thymic T cell selection(GO:0045059) |
| 0.2 | 0.8 | GO:0035845 | photoreceptor cell outer segment organization(GO:0035845) |
| 0.2 | 1.3 | GO:0002315 | marginal zone B cell differentiation(GO:0002315) |
| 0.2 | 0.9 | GO:2000786 | positive regulation of autophagosome assembly(GO:2000786) |
| 0.2 | 0.2 | GO:0036115 | fatty-acyl-CoA catabolic process(GO:0036115) |
| 0.2 | 0.4 | GO:0009227 | UDP-glucose catabolic process(GO:0006258) nucleotide-sugar catabolic process(GO:0009227) |
| 0.2 | 0.2 | GO:1900864 | mitochondrial tRNA modification(GO:0070900) mitochondrial RNA modification(GO:1900864) |
| 0.2 | 0.4 | GO:1903025 | regulation of RNA polymerase II regulatory region sequence-specific DNA binding(GO:1903025) |
| 0.2 | 1.3 | GO:0001878 | response to yeast(GO:0001878) |
| 0.2 | 0.9 | GO:0089712 | L-aspartate transport(GO:0070778) L-aspartate transmembrane transport(GO:0089712) |
| 0.2 | 0.2 | GO:0009441 | glycolate metabolic process(GO:0009441) |
| 0.2 | 0.9 | GO:0045338 | farnesyl diphosphate metabolic process(GO:0045338) |
| 0.2 | 1.1 | GO:0006177 | GMP biosynthetic process(GO:0006177) |
| 0.2 | 0.2 | GO:0060982 | coronary artery morphogenesis(GO:0060982) |
| 0.2 | 0.9 | GO:0021936 | regulation of cerebellar granule cell precursor proliferation(GO:0021936) |
| 0.2 | 6.1 | GO:0006739 | NADP metabolic process(GO:0006739) |
| 0.2 | 0.6 | GO:0050917 | sensory perception of umami taste(GO:0050917) |
| 0.2 | 0.2 | GO:1900226 | negative regulation of NLRP3 inflammasome complex assembly(GO:1900226) |
| 0.2 | 1.1 | GO:0051694 | pointed-end actin filament capping(GO:0051694) |
| 0.2 | 0.6 | GO:0070272 | proton-transporting ATP synthase complex assembly(GO:0043461) proton-transporting ATP synthase complex biogenesis(GO:0070272) |
| 0.2 | 2.2 | GO:2000675 | negative regulation of type B pancreatic cell apoptotic process(GO:2000675) |
| 0.2 | 0.4 | GO:0009186 | deoxyribonucleoside diphosphate metabolic process(GO:0009186) |
| 0.2 | 0.4 | GO:0045653 | negative regulation of megakaryocyte differentiation(GO:0045653) |
| 0.2 | 1.1 | GO:0006308 | DNA catabolic process(GO:0006308) |
| 0.2 | 0.9 | GO:0075525 | viral translational termination-reinitiation(GO:0075525) |
| 0.2 | 0.4 | GO:0002314 | germinal center B cell differentiation(GO:0002314) |
| 0.2 | 0.7 | GO:0006668 | sphinganine-1-phosphate metabolic process(GO:0006668) |
| 0.2 | 1.1 | GO:0072592 | oxygen metabolic process(GO:0072592) |
| 0.2 | 0.2 | GO:1900227 | positive regulation of NLRP3 inflammasome complex assembly(GO:1900227) |
| 0.2 | 0.4 | GO:0071963 | establishment or maintenance of cell polarity regulating cell shape(GO:0071963) |
| 0.2 | 2.3 | GO:0007250 | activation of NF-kappaB-inducing kinase activity(GO:0007250) |
| 0.2 | 0.5 | GO:0051697 | protein delipidation(GO:0051697) |
| 0.2 | 0.5 | GO:0043012 | regulation of fusion of sperm to egg plasma membrane(GO:0043012) |
| 0.2 | 3.4 | GO:0060765 | regulation of androgen receptor signaling pathway(GO:0060765) |
| 0.2 | 0.7 | GO:0033567 | DNA replication, Okazaki fragment processing(GO:0033567) |
| 0.2 | 0.2 | GO:0098789 | pre-mRNA cleavage required for polyadenylation(GO:0098789) |
| 0.2 | 0.2 | GO:0002644 | negative regulation of tolerance induction(GO:0002644) |
| 0.2 | 0.9 | GO:0035926 | chemokine (C-C motif) ligand 2 secretion(GO:0035926) |
| 0.2 | 1.2 | GO:0015693 | magnesium ion transport(GO:0015693) |
| 0.2 | 0.5 | GO:1901350 | cell-cell signaling involved in cell-cell junction organization(GO:1901350) |
| 0.2 | 0.2 | GO:0018171 | peptidyl-cysteine oxidation(GO:0018171) |
| 0.2 | 1.1 | GO:0043619 | regulation of transcription from RNA polymerase II promoter in response to oxidative stress(GO:0043619) |
| 0.2 | 1.4 | GO:0048245 | eosinophil chemotaxis(GO:0048245) |
| 0.2 | 1.6 | GO:0034498 | early endosome to Golgi transport(GO:0034498) |
| 0.2 | 1.1 | GO:1990592 | protein polyufmylation(GO:1990564) protein K69-linked ufmylation(GO:1990592) |
| 0.2 | 1.1 | GO:2001300 | lipoxin metabolic process(GO:2001300) |
| 0.2 | 0.7 | GO:0035385 | Roundabout signaling pathway(GO:0035385) |
| 0.2 | 0.2 | GO:0060316 | positive regulation of ryanodine-sensitive calcium-release channel activity(GO:0060316) |
| 0.2 | 0.7 | GO:0031069 | hair follicle morphogenesis(GO:0031069) |
| 0.2 | 0.2 | GO:2000807 | regulation of synaptic vesicle clustering(GO:2000807) |
| 0.2 | 0.2 | GO:0061073 | ciliary body morphogenesis(GO:0061073) |
| 0.2 | 0.7 | GO:1904046 | negative regulation of vascular endothelial growth factor production(GO:1904046) |
| 0.2 | 0.2 | GO:0038001 | paracrine signaling(GO:0038001) |
| 0.2 | 0.5 | GO:0009447 | putrescine catabolic process(GO:0009447) |
| 0.2 | 0.5 | GO:0006121 | mitochondrial electron transport, succinate to ubiquinone(GO:0006121) |
| 0.2 | 0.2 | GO:0050651 | dermatan sulfate proteoglycan biosynthetic process(GO:0050651) |
| 0.2 | 0.7 | GO:0000012 | single strand break repair(GO:0000012) |
| 0.2 | 0.2 | GO:0014043 | negative regulation of neuron maturation(GO:0014043) |
| 0.2 | 0.5 | GO:0036150 | phosphatidylserine acyl-chain remodeling(GO:0036150) |
| 0.2 | 0.3 | GO:0055099 | detection of endogenous stimulus(GO:0009726) response to high density lipoprotein particle(GO:0055099) |
| 0.2 | 0.5 | GO:0002949 | tRNA threonylcarbamoyladenosine modification(GO:0002949) |
| 0.2 | 0.3 | GO:0002025 | vasodilation by norepinephrine-epinephrine involved in regulation of systemic arterial blood pressure(GO:0002025) |
| 0.2 | 0.5 | GO:0048147 | negative regulation of fibroblast proliferation(GO:0048147) |
| 0.2 | 0.5 | GO:0061537 | glycine secretion(GO:0061536) glycine secretion, neurotransmission(GO:0061537) |
| 0.2 | 0.5 | GO:0086100 | endothelin receptor signaling pathway(GO:0086100) |
| 0.2 | 0.5 | GO:0010002 | cardioblast differentiation(GO:0010002) |
| 0.2 | 0.2 | GO:0002286 | T cell activation involved in immune response(GO:0002286) |
| 0.2 | 0.2 | GO:0086073 | cardiac muscle cell-cardiac muscle cell adhesion(GO:0086042) bundle of His cell-Purkinje myocyte adhesion involved in cell communication(GO:0086073) |
| 0.2 | 0.2 | GO:1904430 | negative regulation of t-circle formation(GO:1904430) |
| 0.2 | 0.3 | GO:1902630 | regulation of membrane hyperpolarization(GO:1902630) |
| 0.2 | 2.9 | GO:0045899 | positive regulation of RNA polymerase II transcriptional preinitiation complex assembly(GO:0045899) |
| 0.2 | 0.2 | GO:0072369 | regulation of lipid transport by positive regulation of transcription from RNA polymerase II promoter(GO:0072369) |
| 0.2 | 0.2 | GO:0050850 | positive regulation of calcium-mediated signaling(GO:0050850) |
| 0.2 | 0.3 | GO:0048102 | autophagic cell death(GO:0048102) |
| 0.2 | 0.2 | GO:1901673 | regulation of mitotic spindle assembly(GO:1901673) |
| 0.2 | 0.5 | GO:0036018 | cellular response to erythropoietin(GO:0036018) |
| 0.2 | 0.2 | GO:0032632 | interleukin-3 production(GO:0032632) |
| 0.2 | 0.2 | GO:0035455 | response to interferon-alpha(GO:0035455) |
| 0.2 | 0.3 | GO:0061298 | retina vasculature development in camera-type eye(GO:0061298) |
| 0.2 | 1.3 | GO:0006878 | cellular copper ion homeostasis(GO:0006878) |
| 0.2 | 2.6 | GO:0031115 | negative regulation of microtubule polymerization(GO:0031115) |
| 0.2 | 5.6 | GO:0060396 | growth hormone receptor signaling pathway(GO:0060396) |
| 0.2 | 1.6 | GO:0006600 | creatine metabolic process(GO:0006600) |
| 0.2 | 2.5 | GO:0046688 | response to copper ion(GO:0046688) |
| 0.2 | 1.8 | GO:0097150 | neuronal stem cell population maintenance(GO:0097150) |
| 0.2 | 1.0 | GO:0042407 | cristae formation(GO:0042407) |
| 0.2 | 1.0 | GO:0002943 | tRNA dihydrouridine synthesis(GO:0002943) |
| 0.2 | 1.1 | GO:0032695 | negative regulation of interleukin-12 production(GO:0032695) |
| 0.2 | 0.3 | GO:1903233 | regulation of calcium ion-dependent exocytosis of neurotransmitter(GO:1903233) |
| 0.2 | 1.0 | GO:0060701 | regulation of mRNA cleavage(GO:0031437) negative regulation of mRNA cleavage(GO:0031438) negative regulation of immunoglobulin secretion(GO:0051025) negative regulation of ribonuclease activity(GO:0060701) negative regulation of endoribonuclease activity(GO:0060702) regulation of mRNA endonucleolytic cleavage involved in unfolded protein response(GO:1904720) negative regulation of mRNA endonucleolytic cleavage involved in unfolded protein response(GO:1904721) |
| 0.2 | 0.7 | GO:0010814 | substance P catabolic process(GO:0010814) calcitonin catabolic process(GO:0010816) endothelin maturation(GO:0034959) |
| 0.2 | 1.1 | GO:0014029 | neural crest formation(GO:0014029) |
| 0.2 | 0.3 | GO:0038007 | netrin-activated signaling pathway(GO:0038007) |
| 0.2 | 0.5 | GO:0038060 | nitric oxide-cGMP-mediated signaling pathway(GO:0038060) |
| 0.2 | 0.2 | GO:0021913 | regulation of transcription from RNA polymerase II promoter involved in ventral spinal cord interneuron specification(GO:0021913) |
| 0.2 | 0.8 | GO:2000767 | positive regulation of cytoplasmic translation(GO:2000767) |
| 0.2 | 0.3 | GO:0006348 | chromatin silencing at telomere(GO:0006348) |
| 0.2 | 0.2 | GO:0035588 | G-protein coupled purinergic receptor signaling pathway(GO:0035588) |
| 0.2 | 0.8 | GO:0006398 | mRNA 3'-end processing by stem-loop binding and cleavage(GO:0006398) |
| 0.2 | 0.3 | GO:1901491 | negative regulation of lymphangiogenesis(GO:1901491) |
| 0.2 | 0.6 | GO:1903204 | negative regulation of oxidative stress-induced neuron death(GO:1903204) |
| 0.2 | 0.3 | GO:0031118 | rRNA pseudouridine synthesis(GO:0031118) |
| 0.2 | 0.6 | GO:0030950 | establishment or maintenance of actin cytoskeleton polarity(GO:0030950) |
| 0.2 | 4.0 | GO:0010107 | potassium ion import(GO:0010107) |
| 0.2 | 0.3 | GO:1903608 | protein localization to cytoplasmic stress granule(GO:1903608) |
| 0.2 | 1.9 | GO:0050961 | detection of temperature stimulus involved in sensory perception(GO:0050961) detection of temperature stimulus involved in sensory perception of pain(GO:0050965) |
| 0.2 | 0.3 | GO:0015785 | UDP-galactose transport(GO:0015785) UDP-galactose transmembrane transport(GO:0072334) |
| 0.2 | 2.7 | GO:0070306 | lens fiber cell differentiation(GO:0070306) |
| 0.2 | 5.0 | GO:0090382 | phagosome maturation(GO:0090382) |
| 0.2 | 3.9 | GO:0006101 | citrate metabolic process(GO:0006101) |
| 0.2 | 0.3 | GO:0036166 | phenotypic switching(GO:0036166) regulation of phenotypic switching(GO:1900239) |
| 0.2 | 0.5 | GO:1904646 | cellular response to beta-amyloid(GO:1904646) |
| 0.2 | 4.8 | GO:0048791 | calcium ion-regulated exocytosis of neurotransmitter(GO:0048791) |
| 0.2 | 5.4 | GO:0006283 | transcription-coupled nucleotide-excision repair(GO:0006283) |
| 0.2 | 0.2 | GO:0021772 | olfactory bulb development(GO:0021772) |
| 0.2 | 1.2 | GO:0030050 | vesicle transport along actin filament(GO:0030050) |
| 0.2 | 0.5 | GO:0035581 | sequestering of extracellular ligand from receptor(GO:0035581) |
| 0.2 | 0.2 | GO:0016233 | telomere capping(GO:0016233) |
| 0.2 | 0.3 | GO:1902202 | regulation of hepatocyte growth factor receptor signaling pathway(GO:1902202) |
| 0.2 | 0.3 | GO:0002826 | negative regulation of T-helper 1 type immune response(GO:0002826) |
| 0.2 | 0.3 | GO:0009386 | translational attenuation(GO:0009386) |
| 0.2 | 0.3 | GO:0010888 | negative regulation of lipid storage(GO:0010888) negative regulation of sequestering of triglyceride(GO:0010891) |
| 0.2 | 0.3 | GO:0001994 | norepinephrine-epinephrine vasoconstriction involved in regulation of systemic arterial blood pressure(GO:0001994) |
| 0.2 | 0.9 | GO:1903830 | magnesium ion transmembrane transport(GO:1903830) |
| 0.2 | 1.2 | GO:0006268 | DNA unwinding involved in DNA replication(GO:0006268) |
| 0.2 | 1.2 | GO:0051496 | positive regulation of stress fiber assembly(GO:0051496) |
| 0.2 | 0.5 | GO:0061484 | hematopoietic stem cell homeostasis(GO:0061484) |
| 0.2 | 0.2 | GO:0048631 | regulation of skeletal muscle tissue growth(GO:0048631) |
| 0.2 | 0.3 | GO:2000354 | regulation of ovarian follicle development(GO:2000354) |
| 0.2 | 2.4 | GO:0006012 | galactose metabolic process(GO:0006012) |
| 0.2 | 0.2 | GO:0000350 | generation of catalytic spliceosome for second transesterification step(GO:0000350) |
| 0.2 | 0.5 | GO:0060453 | regulation of gastric acid secretion(GO:0060453) |
| 0.2 | 0.5 | GO:0016198 | axon choice point recognition(GO:0016198) |
| 0.2 | 0.5 | GO:1902037 | negative regulation of hematopoietic stem cell differentiation(GO:1902037) |
| 0.2 | 0.8 | GO:0002175 | protein localization to paranode region of axon(GO:0002175) |
| 0.2 | 0.8 | GO:2000074 | regulation of type B pancreatic cell development(GO:2000074) |
| 0.2 | 0.2 | GO:0099563 | modification of synaptic structure(GO:0099563) |
| 0.2 | 0.2 | GO:0042989 | sequestering of actin monomers(GO:0042989) |
| 0.1 | 0.1 | GO:0002415 | immunoglobulin transcytosis in epithelial cells mediated by polymeric immunoglobulin receptor(GO:0002415) |
| 0.1 | 0.1 | GO:0060385 | axonogenesis involved in innervation(GO:0060385) |
| 0.1 | 0.4 | GO:0051083 | 'de novo' cotranslational protein folding(GO:0051083) |
| 0.1 | 0.1 | GO:0060613 | fat pad development(GO:0060613) |
| 0.1 | 1.3 | GO:0002098 | tRNA wobble uridine modification(GO:0002098) |
| 0.1 | 9.2 | GO:0031146 | SCF-dependent proteasomal ubiquitin-dependent protein catabolic process(GO:0031146) |
| 0.1 | 0.4 | GO:1901341 | activation of store-operated calcium channel activity(GO:0032237) positive regulation of store-operated calcium channel activity(GO:1901341) |
| 0.1 | 0.3 | GO:0002725 | negative regulation of T cell cytokine production(GO:0002725) |
| 0.1 | 1.6 | GO:0000920 | cell separation after cytokinesis(GO:0000920) |
| 0.1 | 0.1 | GO:0007217 | tachykinin receptor signaling pathway(GO:0007217) |
| 0.1 | 0.3 | GO:0045898 | regulation of RNA polymerase II transcriptional preinitiation complex assembly(GO:0045898) |
| 0.1 | 0.7 | GO:0034472 | snRNA 3'-end processing(GO:0034472) |
| 0.1 | 0.6 | GO:0035616 | histone H2B conserved C-terminal lysine deubiquitination(GO:0035616) |
| 0.1 | 0.4 | GO:1904637 | response to ionomycin(GO:1904636) cellular response to ionomycin(GO:1904637) |
| 0.1 | 0.3 | GO:0048227 | plasma membrane to endosome transport(GO:0048227) |
| 0.1 | 1.9 | GO:0002230 | positive regulation of defense response to virus by host(GO:0002230) |
| 0.1 | 8.2 | GO:0006120 | mitochondrial electron transport, NADH to ubiquinone(GO:0006120) |
| 0.1 | 0.1 | GO:1905073 | occluding junction disassembly(GO:1905071) regulation of occluding junction disassembly(GO:1905073) positive regulation of occluding junction disassembly(GO:1905075) |
| 0.1 | 0.3 | GO:0006707 | cholesterol catabolic process(GO:0006707) sterol catabolic process(GO:0016127) |
| 0.1 | 0.1 | GO:0035627 | ceramide transport(GO:0035627) |
| 0.1 | 0.7 | GO:0007635 | chemosensory behavior(GO:0007635) |
| 0.1 | 1.9 | GO:0002089 | lens morphogenesis in camera-type eye(GO:0002089) |
| 0.1 | 0.4 | GO:0002818 | intracellular defense response(GO:0002818) |
| 0.1 | 1.7 | GO:0045063 | T-helper 1 cell differentiation(GO:0045063) |
| 0.1 | 0.9 | GO:0033211 | adiponectin-activated signaling pathway(GO:0033211) |
| 0.1 | 0.3 | GO:0030259 | lipid glycosylation(GO:0030259) |
| 0.1 | 0.7 | GO:0014050 | negative regulation of glutamate secretion(GO:0014050) |
| 0.1 | 0.4 | GO:0010992 | ubiquitin homeostasis(GO:0010992) |
| 0.1 | 1.6 | GO:1900120 | regulation of receptor binding(GO:1900120) |
| 0.1 | 0.1 | GO:0097647 | dimeric G-protein coupled receptor signaling pathway(GO:0038042) calcitonin family receptor signaling pathway(GO:0097646) amylin receptor signaling pathway(GO:0097647) |
| 0.1 | 0.4 | GO:0008063 | Toll signaling pathway(GO:0008063) |
| 0.1 | 2.4 | GO:0009312 | oligosaccharide biosynthetic process(GO:0009312) |
| 0.1 | 11.8 | GO:0006415 | translational termination(GO:0006415) |
| 0.1 | 0.7 | GO:0009256 | 10-formyltetrahydrofolate metabolic process(GO:0009256) |
| 0.1 | 0.3 | GO:0000710 | meiotic mismatch repair(GO:0000710) |
| 0.1 | 0.4 | GO:0070902 | mitochondrial tRNA pseudouridine synthesis(GO:0070902) |
| 0.1 | 0.3 | GO:0002774 | Fc receptor mediated inhibitory signaling pathway(GO:0002774) |
| 0.1 | 0.3 | GO:0032621 | interleukin-18 production(GO:0032621) |
| 0.1 | 0.1 | GO:0032506 | cytokinetic process(GO:0032506) |
| 0.1 | 0.4 | GO:0019605 | benzoate metabolic process(GO:0018874) butyrate metabolic process(GO:0019605) |
| 0.1 | 0.3 | GO:0003358 | noradrenergic neuron development(GO:0003358) |
| 0.1 | 0.6 | GO:2000811 | negative regulation of anoikis(GO:2000811) |
| 0.1 | 0.1 | GO:0071896 | protein localization to adherens junction(GO:0071896) |
| 0.1 | 1.5 | GO:0032292 | myelination in peripheral nervous system(GO:0022011) peripheral nervous system axon ensheathment(GO:0032292) |
| 0.1 | 0.6 | GO:0006054 | N-acetylneuraminate metabolic process(GO:0006054) |
| 0.1 | 0.1 | GO:0097491 | sympathetic neuron projection extension(GO:0097490) sympathetic neuron projection guidance(GO:0097491) |
| 0.1 | 2.5 | GO:0097031 | NADH dehydrogenase complex assembly(GO:0010257) mitochondrial respiratory chain complex I assembly(GO:0032981) mitochondrial respiratory chain complex I biogenesis(GO:0097031) |
| 0.1 | 5.9 | GO:1902305 | regulation of sodium ion transmembrane transport(GO:1902305) |
| 0.1 | 0.1 | GO:0090296 | regulation of mitochondrial DNA replication(GO:0090296) regulation of mitochondrial DNA metabolic process(GO:1901858) |
| 0.1 | 0.7 | GO:0035865 | cellular response to potassium ion(GO:0035865) |
| 0.1 | 1.9 | GO:0006703 | estrogen biosynthetic process(GO:0006703) |
| 0.1 | 0.4 | GO:0036058 | filtration diaphragm assembly(GO:0036058) slit diaphragm assembly(GO:0036060) negative regulation of retinal ganglion cell axon guidance(GO:0090260) |
| 0.1 | 0.1 | GO:0014004 | microglia differentiation(GO:0014004) microglia development(GO:0014005) |
| 0.1 | 0.1 | GO:0042756 | drinking behavior(GO:0042756) |
| 0.1 | 0.7 | GO:0015074 | DNA integration(GO:0015074) |
| 0.1 | 0.1 | GO:1903525 | regulation of membrane tubulation(GO:1903525) |
| 0.1 | 0.4 | GO:0031365 | N-terminal protein amino acid modification(GO:0031365) |
| 0.1 | 0.1 | GO:0070127 | tRNA aminoacylation for mitochondrial protein translation(GO:0070127) |
| 0.1 | 1.1 | GO:0051095 | regulation of helicase activity(GO:0051095) |
| 0.1 | 1.6 | GO:0045332 | lipid translocation(GO:0034204) phospholipid translocation(GO:0045332) |
| 0.1 | 0.3 | GO:0036093 | male germ cell proliferation(GO:0002176) germ cell proliferation(GO:0036093) |
| 0.1 | 0.4 | GO:0070142 | synaptic vesicle budding(GO:0070142) |
| 0.1 | 0.3 | GO:1900153 | regulation of nuclear-transcribed mRNA catabolic process, deadenylation-dependent decay(GO:1900151) positive regulation of nuclear-transcribed mRNA catabolic process, deadenylation-dependent decay(GO:1900153) |
| 0.1 | 0.1 | GO:0009211 | pyrimidine deoxyribonucleoside triphosphate metabolic process(GO:0009211) |
| 0.1 | 0.8 | GO:0006931 | substrate-dependent cell migration, cell attachment to substrate(GO:0006931) |
| 0.1 | 0.1 | GO:0050968 | detection of chemical stimulus involved in sensory perception of pain(GO:0050968) |
| 0.1 | 0.4 | GO:0033089 | positive regulation of T cell differentiation in thymus(GO:0033089) positive regulation of thymocyte aggregation(GO:2000400) |
| 0.1 | 0.5 | GO:0048749 | compound eye development(GO:0048749) |
| 0.1 | 0.1 | GO:0035524 | proline transmembrane transport(GO:0035524) |
| 0.1 | 3.0 | GO:0060563 | neuroepithelial cell differentiation(GO:0060563) |
| 0.1 | 0.7 | GO:0098779 | mitophagy in response to mitochondrial depolarization(GO:0098779) |
| 0.1 | 0.8 | GO:0097411 | hypoxia-inducible factor-1alpha signaling pathway(GO:0097411) |
| 0.1 | 0.1 | GO:0021854 | hypothalamus development(GO:0021854) |
| 0.1 | 3.3 | GO:0003254 | regulation of membrane depolarization(GO:0003254) |
| 0.1 | 0.7 | GO:1902001 | fatty acid transmembrane transport(GO:1902001) |
| 0.1 | 0.7 | GO:0035881 | amacrine cell differentiation(GO:0035881) |
| 0.1 | 0.5 | GO:0060849 | radial pattern formation(GO:0009956) regulation of transcription involved in lymphatic endothelial cell fate commitment(GO:0060849) |
| 0.1 | 1.4 | GO:0007623 | circadian rhythm(GO:0007623) |
| 0.1 | 1.4 | GO:0032201 | telomere maintenance via semi-conservative replication(GO:0032201) |
| 0.1 | 0.9 | GO:0045039 | protein import into mitochondrial inner membrane(GO:0045039) |
| 0.1 | 0.6 | GO:2000042 | negative regulation of double-strand break repair via homologous recombination(GO:2000042) |
| 0.1 | 1.2 | GO:0097264 | self proteolysis(GO:0097264) |
| 0.1 | 0.3 | GO:0010499 | proteasomal ubiquitin-independent protein catabolic process(GO:0010499) |
| 0.1 | 0.4 | GO:0046931 | pore complex assembly(GO:0046931) |
| 0.1 | 0.4 | GO:0035995 | detection of muscle stretch(GO:0035995) |
| 0.1 | 0.3 | GO:0030186 | melatonin metabolic process(GO:0030186) melatonin biosynthetic process(GO:0030187) |
| 0.1 | 0.4 | GO:0031284 | positive regulation of guanylate cyclase activity(GO:0031284) |
| 0.1 | 1.1 | GO:0035024 | negative regulation of Rho protein signal transduction(GO:0035024) |
| 0.1 | 0.1 | GO:0071910 | determination of digestive tract left/right asymmetry(GO:0071907) determination of liver left/right asymmetry(GO:0071910) |
| 0.1 | 0.5 | GO:0031053 | primary miRNA processing(GO:0031053) |
| 0.1 | 0.4 | GO:0050760 | negative regulation of thymidylate synthase biosynthetic process(GO:0050760) |
| 0.1 | 0.3 | GO:0043388 | positive regulation of DNA binding(GO:0043388) |
| 0.1 | 0.5 | GO:0006930 | substrate-dependent cell migration, cell extension(GO:0006930) |
| 0.1 | 0.6 | GO:0032957 | inositol trisphosphate metabolic process(GO:0032957) |
| 0.1 | 0.3 | GO:1903799 | negative regulation of production of miRNAs involved in gene silencing by miRNA(GO:1903799) |
| 0.1 | 0.3 | GO:1902931 | negative regulation of alcohol biosynthetic process(GO:1902931) |
| 0.1 | 0.5 | GO:0002483 | antigen processing and presentation of endogenous peptide antigen(GO:0002483) |
| 0.1 | 0.9 | GO:1990126 | retrograde transport, endosome to plasma membrane(GO:1990126) |
| 0.1 | 0.2 | GO:0090204 | protein localization to nuclear pore(GO:0090204) |
| 0.1 | 0.6 | GO:0038170 | somatostatin receptor signaling pathway(GO:0038169) somatostatin signaling pathway(GO:0038170) |
| 0.1 | 0.4 | GO:0010735 | positive regulation of transcription via serum response element binding(GO:0010735) |
| 0.1 | 0.4 | GO:0072402 | response to cell cycle checkpoint signaling(GO:0072396) response to DNA integrity checkpoint signaling(GO:0072402) response to DNA damage checkpoint signaling(GO:0072423) |
| 0.1 | 1.0 | GO:0033692 | cellular polysaccharide biosynthetic process(GO:0033692) |
| 0.1 | 1.3 | GO:1902166 | negative regulation of intrinsic apoptotic signaling pathway in response to DNA damage by p53 class mediator(GO:1902166) |
| 0.1 | 0.1 | GO:0060463 | lung lobe development(GO:0060462) lung lobe morphogenesis(GO:0060463) |
| 0.1 | 0.6 | GO:0034770 | histone H4-K20 methylation(GO:0034770) |
| 0.1 | 1.2 | GO:0051437 | positive regulation of ubiquitin-protein ligase activity involved in regulation of mitotic cell cycle transition(GO:0051437) |
| 0.1 | 0.2 | GO:1901355 | response to rapamycin(GO:1901355) |
| 0.1 | 0.5 | GO:0033387 | putrescine biosynthetic process from ornithine(GO:0033387) |
| 0.1 | 3.7 | GO:0032508 | DNA duplex unwinding(GO:0032508) |
| 0.1 | 0.7 | GO:0015742 | alpha-ketoglutarate transport(GO:0015742) |
| 0.1 | 1.8 | GO:0048268 | clathrin coat assembly(GO:0048268) |
| 0.1 | 1.7 | GO:0072583 | clathrin-mediated endocytosis(GO:0072583) |
| 0.1 | 0.1 | GO:0035672 | oligopeptide transmembrane transport(GO:0035672) |
| 0.1 | 7.3 | GO:0006501 | C-terminal protein lipidation(GO:0006501) |
| 0.1 | 0.6 | GO:0051176 | positive regulation of sulfur metabolic process(GO:0051176) |
| 0.1 | 2.3 | GO:0016254 | preassembly of GPI anchor in ER membrane(GO:0016254) |
| 0.1 | 0.1 | GO:0043455 | regulation of secondary metabolic process(GO:0043455) |
| 0.1 | 0.4 | GO:0007171 | activation of transmembrane receptor protein tyrosine kinase activity(GO:0007171) |
| 0.1 | 0.1 | GO:0006498 | N-terminal protein lipidation(GO:0006498) |
| 0.1 | 2.0 | GO:0035589 | G-protein coupled purinergic nucleotide receptor signaling pathway(GO:0035589) |
| 0.1 | 0.3 | GO:0034067 | protein localization to Golgi apparatus(GO:0034067) |
| 0.1 | 0.1 | GO:0032543 | mitochondrial translation(GO:0032543) |
| 0.1 | 0.3 | GO:0032700 | negative regulation of interleukin-17 production(GO:0032700) |
| 0.1 | 0.9 | GO:0048096 | chromatin-mediated maintenance of transcription(GO:0048096) |
| 0.1 | 0.5 | GO:0050915 | sensory perception of sour taste(GO:0050915) |
| 0.1 | 0.1 | GO:0032481 | positive regulation of type I interferon production(GO:0032481) |
| 0.1 | 0.8 | GO:0038203 | TORC2 signaling(GO:0038203) |
| 0.1 | 0.3 | GO:0018197 | peptidyl-aspartic acid modification(GO:0018197) |
| 0.1 | 1.3 | GO:0042755 | eating behavior(GO:0042755) |
| 0.1 | 0.5 | GO:0007341 | penetration of zona pellucida(GO:0007341) |
| 0.1 | 3.8 | GO:0060113 | inner ear receptor cell differentiation(GO:0060113) |
| 0.1 | 0.1 | GO:0042137 | sequestering of neurotransmitter(GO:0042137) |
| 0.1 | 0.1 | GO:0098915 | membrane repolarization during ventricular cardiac muscle cell action potential(GO:0098915) |
| 0.1 | 0.2 | GO:0070541 | response to platinum ion(GO:0070541) |
| 0.1 | 0.1 | GO:0010042 | response to manganese ion(GO:0010042) |
| 0.1 | 0.1 | GO:0090212 | regulation of establishment of blood-brain barrier(GO:0090210) negative regulation of establishment of blood-brain barrier(GO:0090212) |
| 0.1 | 0.1 | GO:2000381 | negative regulation of mesoderm development(GO:2000381) |
| 0.1 | 0.2 | GO:0031295 | T cell costimulation(GO:0031295) |
| 0.1 | 0.8 | GO:0045329 | carnitine biosynthetic process(GO:0045329) |
| 0.1 | 0.3 | GO:0036289 | peptidyl-serine autophosphorylation(GO:0036289) |
| 0.1 | 0.4 | GO:0008295 | spermidine biosynthetic process(GO:0008295) |
| 0.1 | 1.0 | GO:0007176 | regulation of epidermal growth factor-activated receptor activity(GO:0007176) |
| 0.1 | 0.2 | GO:0035864 | response to potassium ion(GO:0035864) |
| 0.1 | 0.4 | GO:0018101 | protein citrullination(GO:0018101) histone citrullination(GO:0036414) |
| 0.1 | 0.3 | GO:0046125 | thymidine metabolic process(GO:0046104) pyrimidine deoxyribonucleoside metabolic process(GO:0046125) |
| 0.1 | 0.4 | GO:0031023 | microtubule organizing center organization(GO:0031023) |
| 0.1 | 0.2 | GO:0007023 | post-chaperonin tubulin folding pathway(GO:0007023) |
| 0.1 | 1.3 | GO:0048017 | inositol lipid-mediated signaling(GO:0048017) |
| 0.1 | 0.2 | GO:0043449 | cellular alkene metabolic process(GO:0043449) |
| 0.1 | 0.3 | GO:0045900 | negative regulation of translational elongation(GO:0045900) |
| 0.1 | 3.6 | GO:0000460 | maturation of 5.8S rRNA(GO:0000460) |
| 0.1 | 0.9 | GO:0060576 | intestinal epithelial cell development(GO:0060576) |
| 0.1 | 0.1 | GO:0015722 | canalicular bile acid transport(GO:0015722) |
| 0.1 | 0.4 | GO:0060482 | lobar bronchus epithelium development(GO:0060481) lobar bronchus development(GO:0060482) |
| 0.1 | 0.1 | GO:0043624 | cellular protein complex disassembly(GO:0043624) |
| 0.1 | 0.1 | GO:1901374 | acetate ester transport(GO:1901374) |
| 0.1 | 0.1 | GO:0071468 | cellular response to acidic pH(GO:0071468) |
| 0.1 | 1.3 | GO:0070286 | axonemal dynein complex assembly(GO:0070286) |
| 0.1 | 2.2 | GO:0045747 | positive regulation of Notch signaling pathway(GO:0045747) |
| 0.1 | 2.3 | GO:0015012 | heparan sulfate proteoglycan biosynthetic process(GO:0015012) |
| 0.1 | 0.3 | GO:0050747 | positive regulation of lipoprotein metabolic process(GO:0050747) |
| 0.1 | 0.9 | GO:0035067 | negative regulation of histone acetylation(GO:0035067) |
| 0.1 | 0.1 | GO:0060972 | left/right pattern formation(GO:0060972) |
| 0.1 | 0.2 | GO:0030997 | regulation of centriole-centriole cohesion(GO:0030997) |
| 0.1 | 0.1 | GO:0009204 | deoxyribonucleoside triphosphate catabolic process(GO:0009204) |
| 0.1 | 0.4 | GO:0070070 | proton-transporting V-type ATPase complex assembly(GO:0070070) vacuolar proton-transporting V-type ATPase complex assembly(GO:0070072) |
| 0.1 | 0.5 | GO:0009162 | deoxyribonucleoside monophosphate metabolic process(GO:0009162) |
| 0.1 | 0.2 | GO:0036034 | mediator complex assembly(GO:0036034) regulation of mediator complex assembly(GO:2001176) positive regulation of mediator complex assembly(GO:2001178) |
| 0.1 | 0.3 | GO:0042670 | retinal cone cell differentiation(GO:0042670) retinal cone cell development(GO:0046549) |
| 0.1 | 0.6 | GO:0007506 | gonadal mesoderm development(GO:0007506) |
| 0.1 | 0.1 | GO:0097327 | response to antineoplastic agent(GO:0097327) |
| 0.1 | 2.1 | GO:0007265 | Ras protein signal transduction(GO:0007265) |
| 0.1 | 0.3 | GO:0014744 | positive regulation of muscle adaptation(GO:0014744) |
| 0.1 | 0.5 | GO:0015747 | urate transport(GO:0015747) |
| 0.1 | 0.8 | GO:0016180 | snRNA processing(GO:0016180) |
| 0.1 | 0.7 | GO:0030252 | growth hormone secretion(GO:0030252) |
| 0.1 | 0.7 | GO:0031122 | cytoplasmic microtubule organization(GO:0031122) |
| 0.1 | 1.4 | GO:0043981 | histone H4-K5 acetylation(GO:0043981) histone H4-K8 acetylation(GO:0043982) |
| 0.1 | 1.8 | GO:0001958 | endochondral ossification(GO:0001958) replacement ossification(GO:0036075) |
| 0.1 | 0.1 | GO:0002291 | T cell activation via T cell receptor contact with antigen bound to MHC molecule on antigen presenting cell(GO:0002291) |
| 0.1 | 0.3 | GO:1903593 | regulation of histamine secretion by mast cell(GO:1903593) |
| 0.1 | 1.2 | GO:0030431 | sleep(GO:0030431) |
| 0.1 | 0.7 | GO:0090136 | epithelial cell-cell adhesion(GO:0090136) |
| 0.1 | 3.4 | GO:0046785 | microtubule polymerization(GO:0046785) |
| 0.1 | 1.8 | GO:0007141 | male meiosis I(GO:0007141) |
| 0.1 | 0.2 | GO:0071774 | response to fibroblast growth factor(GO:0071774) |
| 0.1 | 1.8 | GO:0070935 | 3'-UTR-mediated mRNA stabilization(GO:0070935) |
| 0.1 | 0.1 | GO:0036090 | cleavage furrow ingression(GO:0036090) |
| 0.1 | 0.2 | GO:0042780 | tRNA 3'-end processing(GO:0042780) |
| 0.1 | 6.2 | GO:0035725 | sodium ion transmembrane transport(GO:0035725) |
| 0.1 | 0.3 | GO:0071888 | macrophage apoptotic process(GO:0071888) |
| 0.1 | 0.5 | GO:0006265 | DNA topological change(GO:0006265) |
| 0.1 | 0.2 | GO:0097116 | gephyrin clustering involved in postsynaptic density assembly(GO:0097116) |
| 0.1 | 0.7 | GO:0043508 | negative regulation of JUN kinase activity(GO:0043508) |
| 0.1 | 0.1 | GO:0010520 | regulation of reciprocal meiotic recombination(GO:0010520) positive regulation of reciprocal meiotic recombination(GO:0010845) |
| 0.1 | 0.5 | GO:0097267 | omega-hydroxylase P450 pathway(GO:0097267) |
| 0.1 | 0.3 | GO:0036491 | regulation of translation in response to endoplasmic reticulum stress(GO:0036490) regulation of translation initiation in response to endoplasmic reticulum stress(GO:0036491) eiF2alpha phosphorylation in response to endoplasmic reticulum stress(GO:0036492) negative regulation of endoplasmic reticulum stress-induced eIF2 alpha phosphorylation(GO:1903912) |
| 0.1 | 0.4 | GO:0038165 | oncostatin-M-mediated signaling pathway(GO:0038165) |
| 0.1 | 0.2 | GO:0060158 | phospholipase C-activating dopamine receptor signaling pathway(GO:0060158) |
| 0.1 | 0.4 | GO:0051958 | methotrexate transport(GO:0051958) reduced folate transmembrane transport(GO:0098838) |
| 0.1 | 0.1 | GO:0051835 | positive regulation of synapse structural plasticity(GO:0051835) |
| 0.1 | 0.5 | GO:0016098 | monoterpenoid metabolic process(GO:0016098) |
| 0.1 | 1.5 | GO:0006298 | mismatch repair(GO:0006298) |
| 0.1 | 0.5 | GO:1903321 | negative regulation of protein modification by small protein conjugation or removal(GO:1903321) |
| 0.1 | 0.3 | GO:0035092 | sperm chromatin condensation(GO:0035092) |
| 0.1 | 0.8 | GO:0031290 | retinal ganglion cell axon guidance(GO:0031290) |
| 0.1 | 0.1 | GO:2001269 | positive regulation of cysteine-type endopeptidase activity involved in apoptotic signaling pathway(GO:2001269) |
| 0.1 | 0.5 | GO:0051775 | response to redox state(GO:0051775) |
| 0.1 | 1.3 | GO:0050716 | positive regulation of interleukin-1 secretion(GO:0050716) |
| 0.1 | 0.4 | GO:0060665 | regulation of branching involved in salivary gland morphogenesis by mesenchymal-epithelial signaling(GO:0060665) regulation of branching involved in salivary gland morphogenesis(GO:0060693) |
| 0.1 | 0.9 | GO:0036035 | osteoclast development(GO:0036035) |
| 0.1 | 2.0 | GO:0031397 | negative regulation of protein ubiquitination(GO:0031397) |
| 0.1 | 0.8 | GO:0048853 | forebrain morphogenesis(GO:0048853) |
| 0.1 | 0.3 | GO:2000503 | positive regulation of natural killer cell chemotaxis(GO:2000503) |
| 0.1 | 0.1 | GO:0007039 | protein catabolic process in the vacuole(GO:0007039) |
| 0.1 | 0.3 | GO:0046602 | regulation of mitotic centrosome separation(GO:0046602) |
| 0.1 | 0.9 | GO:1901072 | glucosamine-containing compound catabolic process(GO:1901072) |
| 0.1 | 0.3 | GO:0010764 | negative regulation of fibroblast migration(GO:0010764) |
| 0.1 | 2.4 | GO:0043928 | exonucleolytic nuclear-transcribed mRNA catabolic process involved in deadenylation-dependent decay(GO:0043928) |
| 0.1 | 8.0 | GO:0015992 | proton transport(GO:0015992) |
| 0.1 | 0.2 | GO:0032525 | somite rostral/caudal axis specification(GO:0032525) |
| 0.1 | 0.1 | GO:0044108 | cellular alcohol metabolic process(GO:0044107) cellular alcohol biosynthetic process(GO:0044108) |
| 0.1 | 0.3 | GO:0031914 | negative regulation of synaptic plasticity(GO:0031914) |
| 0.1 | 1.1 | GO:0007140 | male meiosis(GO:0007140) |
| 0.1 | 0.5 | GO:2000194 | regulation of female gonad development(GO:2000194) |
| 0.1 | 0.8 | GO:0007252 | I-kappaB phosphorylation(GO:0007252) |
| 0.1 | 0.1 | GO:0060584 | regulation of prostaglandin-endoperoxide synthase activity(GO:0060584) positive regulation of prostaglandin-endoperoxide synthase activity(GO:0060585) |
| 0.1 | 0.3 | GO:0045598 | regulation of fat cell differentiation(GO:0045598) |
| 0.1 | 0.9 | GO:0019800 | peptide cross-linking via chondroitin 4-sulfate glycosaminoglycan(GO:0019800) |
| 0.1 | 0.4 | GO:0001865 | NK T cell differentiation(GO:0001865) |
| 0.1 | 2.3 | GO:0007205 | protein kinase C-activating G-protein coupled receptor signaling pathway(GO:0007205) |
| 0.1 | 0.2 | GO:0098501 | polynucleotide dephosphorylation(GO:0098501) |
| 0.1 | 0.3 | GO:0006421 | asparaginyl-tRNA aminoacylation(GO:0006421) |
| 0.1 | 0.7 | GO:2000576 | positive regulation of microtubule motor activity(GO:2000576) regulation of ATP-dependent microtubule motor activity, plus-end-directed(GO:2000580) positive regulation of ATP-dependent microtubule motor activity, plus-end-directed(GO:2000582) |
| 0.1 | 0.3 | GO:1901873 | regulation of post-translational protein modification(GO:1901873) |
| 0.1 | 0.2 | GO:0001757 | somite specification(GO:0001757) |
| 0.1 | 0.6 | GO:0009263 | deoxyribonucleotide biosynthetic process(GO:0009263) |
| 0.1 | 0.3 | GO:0021814 | cell motility involved in cerebral cortex radial glia guided migration(GO:0021814) |
| 0.1 | 0.2 | GO:0046294 | formaldehyde catabolic process(GO:0046294) |
| 0.1 | 0.7 | GO:1903020 | positive regulation of glycoprotein metabolic process(GO:1903020) |
| 0.1 | 0.2 | GO:0038027 | apolipoprotein A-I-mediated signaling pathway(GO:0038027) negative regulation of low-density lipoprotein particle receptor biosynthetic process(GO:0045715) |
| 0.1 | 0.3 | GO:0007258 | JUN phosphorylation(GO:0007258) |
| 0.1 | 0.1 | GO:0010216 | maintenance of DNA methylation(GO:0010216) |
| 0.1 | 1.1 | GO:0001502 | cartilage condensation(GO:0001502) |
| 0.1 | 0.2 | GO:0030886 | negative regulation of myeloid dendritic cell activation(GO:0030886) |
| 0.1 | 0.6 | GO:0042461 | photoreceptor cell development(GO:0042461) |
| 0.1 | 0.6 | GO:0090312 | positive regulation of protein deacetylation(GO:0090312) |
| 0.1 | 0.2 | GO:0036124 | histone H3-K9 trimethylation(GO:0036124) |
| 0.1 | 0.1 | GO:0035563 | positive regulation of chromatin binding(GO:0035563) |
| 0.1 | 0.2 | GO:0043984 | histone H4-K16 acetylation(GO:0043984) |
| 0.1 | 0.5 | GO:0070475 | rRNA base methylation(GO:0070475) |
| 0.1 | 0.1 | GO:0090670 | RNA localization to Cajal body(GO:0090670) telomerase RNA localization to Cajal body(GO:0090671) telomerase RNA localization(GO:0090672) |
| 0.1 | 0.5 | GO:0035331 | negative regulation of hippo signaling(GO:0035331) |
| 0.1 | 0.1 | GO:0032304 | negative regulation of icosanoid secretion(GO:0032304) |
| 0.1 | 0.1 | GO:0055095 | lipoprotein particle mediated signaling(GO:0055095) low-density lipoprotein particle mediated signaling(GO:0055096) |
| 0.1 | 0.2 | GO:0038043 | interleukin-5-mediated signaling pathway(GO:0038043) |
| 0.1 | 0.3 | GO:0006264 | mitochondrial DNA replication(GO:0006264) |
| 0.1 | 1.3 | GO:0003351 | epithelial cilium movement(GO:0003351) |
| 0.1 | 0.5 | GO:2000210 | positive regulation of anoikis(GO:2000210) |
| 0.1 | 0.2 | GO:0007198 | adenylate cyclase-inhibiting serotonin receptor signaling pathway(GO:0007198) |
| 0.1 | 0.2 | GO:0060612 | adipose tissue development(GO:0060612) |
| 0.1 | 0.1 | GO:0019856 | 'de novo' pyrimidine nucleobase biosynthetic process(GO:0006207) pyrimidine nucleobase biosynthetic process(GO:0019856) |
| 0.1 | 0.9 | GO:0045116 | protein neddylation(GO:0045116) |
| 0.1 | 1.2 | GO:0043401 | steroid hormone mediated signaling pathway(GO:0043401) |
| 0.1 | 0.9 | GO:0006995 | cellular response to nitrogen starvation(GO:0006995) cellular response to nitrogen levels(GO:0043562) |
| 0.1 | 1.2 | GO:0031440 | regulation of mRNA 3'-end processing(GO:0031440) |
| 0.1 | 0.5 | GO:0048298 | positive regulation of isotype switching to IgA isotypes(GO:0048298) |
| 0.1 | 0.6 | GO:0048854 | brain morphogenesis(GO:0048854) |
| 0.1 | 0.4 | GO:0003360 | brainstem development(GO:0003360) |
| 0.1 | 0.3 | GO:0045722 | positive regulation of gluconeogenesis(GO:0045722) |
| 0.1 | 0.2 | GO:0038109 | response to stem cell factor(GO:0036215) cellular response to stem cell factor stimulus(GO:0036216) Kit signaling pathway(GO:0038109) |
| 0.1 | 1.3 | GO:0016339 | calcium-dependent cell-cell adhesion via plasma membrane cell adhesion molecules(GO:0016339) |
| 0.1 | 0.1 | GO:0010966 | regulation of phosphate transport(GO:0010966) |
| 0.1 | 0.9 | GO:0035246 | peptidyl-arginine N-methylation(GO:0035246) |
| 0.1 | 0.4 | GO:0003091 | renal water homeostasis(GO:0003091) |
| 0.1 | 0.7 | GO:0006851 | mitochondrial calcium ion transport(GO:0006851) |
| 0.1 | 0.3 | GO:0050928 | Tie signaling pathway(GO:0048014) negative regulation of positive chemotaxis(GO:0050928) |
| 0.1 | 1.0 | GO:0019054 | modulation by virus of host process(GO:0019054) |
| 0.1 | 0.3 | GO:0002638 | negative regulation of immunoglobulin production(GO:0002638) |
| 0.1 | 0.2 | GO:1902490 | regulation of sperm capacitation(GO:1902490) |
| 0.1 | 0.2 | GO:2000821 | regulation of grooming behavior(GO:2000821) |
| 0.1 | 0.2 | GO:0051988 | regulation of attachment of spindle microtubules to kinetochore(GO:0051988) |
| 0.1 | 1.6 | GO:0038202 | TORC1 signaling(GO:0038202) |
| 0.1 | 0.1 | GO:0002384 | hepatic immune response(GO:0002384) |
| 0.1 | 1.2 | GO:0042501 | serine phosphorylation of STAT protein(GO:0042501) |
| 0.1 | 0.4 | GO:0006616 | SRP-dependent cotranslational protein targeting to membrane, translocation(GO:0006616) |
| 0.1 | 0.2 | GO:0042822 | pyridoxal phosphate metabolic process(GO:0042822) pyridoxal phosphate biosynthetic process(GO:0042823) |
| 0.1 | 0.1 | GO:0044205 | 'de novo' UMP biosynthetic process(GO:0044205) |
| 0.1 | 0.9 | GO:0090503 | RNA phosphodiester bond hydrolysis, exonucleolytic(GO:0090503) |
| 0.1 | 0.1 | GO:1904668 | positive regulation of ubiquitin protein ligase activity(GO:1904668) |
| 0.1 | 0.1 | GO:0000212 | meiotic spindle organization(GO:0000212) |
| 0.1 | 1.0 | GO:1902259 | regulation of delayed rectifier potassium channel activity(GO:1902259) |
| 0.1 | 0.5 | GO:0001967 | suckling behavior(GO:0001967) |
| 0.1 | 0.4 | GO:0031468 | nuclear envelope reassembly(GO:0031468) |
| 0.1 | 1.3 | GO:0061418 | regulation of transcription from RNA polymerase II promoter in response to hypoxia(GO:0061418) |
| 0.1 | 3.4 | GO:0008543 | fibroblast growth factor receptor signaling pathway(GO:0008543) |
| 0.1 | 0.1 | GO:0060346 | bone trabecula formation(GO:0060346) |
| 0.1 | 0.1 | GO:0002024 | diet induced thermogenesis(GO:0002024) |
| 0.1 | 0.1 | GO:0006172 | ADP biosynthetic process(GO:0006172) |
| 0.1 | 0.6 | GO:0007187 | G-protein coupled receptor signaling pathway, coupled to cyclic nucleotide second messenger(GO:0007187) |
| 0.1 | 0.4 | GO:0023058 | adaptation of signaling pathway(GO:0023058) |
| 0.1 | 0.2 | GO:1901317 | regulation of sperm motility(GO:1901317) |
| 0.1 | 0.1 | GO:0098870 | neuronal action potential propagation(GO:0019227) action potential propagation(GO:0098870) |
| 0.1 | 0.5 | GO:0060628 | regulation of ER to Golgi vesicle-mediated transport(GO:0060628) |
| 0.1 | 0.4 | GO:0098535 | de novo centriole assembly(GO:0098535) |
| 0.1 | 0.1 | GO:0002829 | negative regulation of type 2 immune response(GO:0002829) |
| 0.1 | 0.4 | GO:0003341 | cilium movement(GO:0003341) |
| 0.1 | 0.8 | GO:0019722 | calcium-mediated signaling(GO:0019722) |
| 0.1 | 0.1 | GO:0070781 | response to biotin(GO:0070781) |
| 0.1 | 0.2 | GO:1900383 | regulation of synaptic plasticity by receptor localization to synapse(GO:1900383) |
| 0.1 | 0.1 | GO:0061684 | chaperone-mediated autophagy(GO:0061684) |
| 0.1 | 0.3 | GO:0007468 | regulation of rhodopsin gene expression(GO:0007468) |
| 0.1 | 1.0 | GO:0051457 | maintenance of protein location in nucleus(GO:0051457) |
| 0.1 | 0.2 | GO:0071918 | urea transmembrane transport(GO:0071918) |
| 0.1 | 0.1 | GO:1901509 | regulation of endothelial tube morphogenesis(GO:1901509) |
| 0.1 | 0.4 | GO:0007625 | grooming behavior(GO:0007625) |
| 0.1 | 0.1 | GO:0072602 | interleukin-4 secretion(GO:0072602) |
| 0.1 | 0.2 | GO:0045824 | negative regulation of innate immune response(GO:0045824) |
| 0.1 | 0.2 | GO:0045647 | negative regulation of erythrocyte differentiation(GO:0045647) |
| 0.1 | 0.2 | GO:0002043 | blood vessel endothelial cell proliferation involved in sprouting angiogenesis(GO:0002043) |
| 0.1 | 0.2 | GO:0032926 | negative regulation of activin receptor signaling pathway(GO:0032926) |
| 0.1 | 0.1 | GO:1900037 | regulation of cellular response to hypoxia(GO:1900037) |
| 0.1 | 0.7 | GO:0033120 | positive regulation of RNA splicing(GO:0033120) |
| 0.1 | 0.2 | GO:0070601 | centromeric sister chromatid cohesion(GO:0070601) |
| 0.1 | 0.1 | GO:1901655 | cellular response to ketone(GO:1901655) |
| 0.1 | 0.1 | GO:0000055 | ribosomal subunit export from nucleus(GO:0000054) ribosomal large subunit export from nucleus(GO:0000055) ribosome localization(GO:0033750) establishment of ribosome localization(GO:0033753) |
| 0.1 | 1.0 | GO:0048008 | platelet-derived growth factor receptor signaling pathway(GO:0048008) |
| 0.1 | 4.1 | GO:0008277 | regulation of G-protein coupled receptor protein signaling pathway(GO:0008277) |
| 0.1 | 0.1 | GO:0009624 | response to nematode(GO:0009624) |
| 0.1 | 0.4 | GO:0010919 | regulation of inositol phosphate biosynthetic process(GO:0010919) |
| 0.1 | 0.1 | GO:0002586 | regulation of antigen processing and presentation of peptide antigen via MHC class II(GO:0002586) |
| 0.1 | 0.1 | GO:0090263 | positive regulation of canonical Wnt signaling pathway(GO:0090263) |
| 0.1 | 0.2 | GO:0032461 | positive regulation of protein oligomerization(GO:0032461) positive regulation of protein homooligomerization(GO:0032464) |
| 0.1 | 0.4 | GO:0030322 | stabilization of membrane potential(GO:0030322) |
| 0.1 | 1.2 | GO:0042267 | natural killer cell mediated cytotoxicity(GO:0042267) |
| 0.1 | 1.0 | GO:0042744 | hydrogen peroxide catabolic process(GO:0042744) |
| 0.1 | 0.3 | GO:0061000 | negative regulation of dendritic spine development(GO:0061000) |
| 0.1 | 2.7 | GO:0007602 | phototransduction(GO:0007602) |
| 0.1 | 0.4 | GO:0031167 | rRNA methylation(GO:0031167) |
| 0.1 | 0.2 | GO:1903800 | positive regulation of production of miRNAs involved in gene silencing by miRNA(GO:1903800) |
| 0.1 | 0.9 | GO:0002183 | cytoplasmic translational initiation(GO:0002183) |
| 0.1 | 0.1 | GO:0043634 | polyadenylation-dependent ncRNA catabolic process(GO:0043634) |
| 0.1 | 0.2 | GO:0021511 | spinal cord patterning(GO:0021511) |
| 0.1 | 0.1 | GO:2000189 | positive regulation of cholesterol homeostasis(GO:2000189) |
| 0.1 | 0.1 | GO:0044829 | positive regulation by host of viral genome replication(GO:0044829) |
| 0.1 | 1.7 | GO:0033119 | negative regulation of RNA splicing(GO:0033119) |
| 0.1 | 0.7 | GO:0051123 | RNA polymerase II transcriptional preinitiation complex assembly(GO:0051123) |
| 0.1 | 0.1 | GO:1905146 | lysosomal protein catabolic process(GO:1905146) |
| 0.1 | 0.6 | GO:0022900 | electron transport chain(GO:0022900) |
| 0.1 | 0.1 | GO:0006438 | valyl-tRNA aminoacylation(GO:0006438) |
| 0.1 | 0.2 | GO:0007288 | sperm axoneme assembly(GO:0007288) |
| 0.1 | 0.3 | GO:0030238 | male sex determination(GO:0030238) |
| 0.1 | 0.1 | GO:0002862 | negative regulation of inflammatory response to antigenic stimulus(GO:0002862) |
| 0.1 | 0.1 | GO:0032091 | negative regulation of protein binding(GO:0032091) |
| 0.1 | 0.3 | GO:1990822 | basic amino acid transmembrane transport(GO:1990822) |
| 0.1 | 0.3 | GO:0002051 | osteoblast fate commitment(GO:0002051) |
| 0.1 | 0.1 | GO:0014809 | regulation of skeletal muscle contraction by regulation of release of sequestered calcium ion(GO:0014809) |
| 0.1 | 0.1 | GO:1903959 | regulation of anion transmembrane transport(GO:1903959) |
| 0.1 | 0.1 | GO:0014816 | skeletal muscle satellite cell differentiation(GO:0014816) |
| 0.1 | 0.2 | GO:0097112 | gamma-aminobutyric acid receptor clustering(GO:0097112) |
| 0.1 | 0.1 | GO:0016080 | synaptic vesicle targeting(GO:0016080) |
| 0.1 | 0.4 | GO:0043402 | glucocorticoid mediated signaling pathway(GO:0043402) |
| 0.1 | 0.2 | GO:0051103 | DNA ligation involved in DNA repair(GO:0051103) |
| 0.1 | 0.2 | GO:1902172 | keratinocyte apoptotic process(GO:0097283) regulation of keratinocyte apoptotic process(GO:1902172) |
| 0.1 | 0.5 | GO:1901070 | guanosine-containing compound biosynthetic process(GO:1901070) |
| 0.1 | 0.1 | GO:0071105 | response to interleukin-11(GO:0071105) |
| 0.1 | 0.2 | GO:0045347 | negative regulation of MHC class II biosynthetic process(GO:0045347) |
| 0.1 | 0.6 | GO:0019363 | nicotinamide nucleotide biosynthetic process(GO:0019359) pyridine nucleotide biosynthetic process(GO:0019363) |
| 0.1 | 0.2 | GO:0006428 | isoleucyl-tRNA aminoacylation(GO:0006428) |
| 0.1 | 0.1 | GO:1902310 | positive regulation of peptidyl-serine dephosphorylation(GO:1902310) |
| 0.1 | 0.4 | GO:0034501 | protein localization to kinetochore(GO:0034501) |
| 0.1 | 0.1 | GO:0042416 | dopamine biosynthetic process(GO:0042416) |
| 0.1 | 0.2 | GO:0006704 | glucocorticoid biosynthetic process(GO:0006704) |
| 0.1 | 0.3 | GO:0010457 | centriole-centriole cohesion(GO:0010457) |
| 0.1 | 0.2 | GO:0010765 | positive regulation of sodium ion transport(GO:0010765) |
| 0.1 | 0.2 | GO:0038193 | thromboxane A2 signaling pathway(GO:0038193) |
| 0.1 | 0.2 | GO:0006624 | vacuolar protein processing(GO:0006624) |
| 0.1 | 0.1 | GO:0035610 | protein side chain deglutamylation(GO:0035610) |
| 0.1 | 0.3 | GO:0042737 | drug catabolic process(GO:0042737) |
| 0.0 | 0.5 | GO:0090162 | establishment of epithelial cell polarity(GO:0090162) |
| 0.0 | 0.0 | GO:2000757 | negative regulation of peptidyl-lysine acetylation(GO:2000757) |
| 0.0 | 0.1 | GO:0048213 | Golgi vesicle prefusion complex stabilization(GO:0048213) |
| 0.0 | 0.8 | GO:0061099 | negative regulation of protein tyrosine kinase activity(GO:0061099) |
| 0.0 | 0.1 | GO:0031282 | regulation of guanylate cyclase activity(GO:0031282) |
| 0.0 | 0.2 | GO:0060571 | morphogenesis of an epithelial fold(GO:0060571) |
| 0.0 | 0.1 | GO:0043201 | response to leucine(GO:0043201) |
| 0.0 | 1.0 | GO:0036092 | phosphatidylinositol-3-phosphate biosynthetic process(GO:0036092) |
| 0.0 | 0.0 | GO:1903306 | negative regulation of regulated secretory pathway(GO:1903306) |
| 0.0 | 0.6 | GO:0007021 | tubulin complex assembly(GO:0007021) |
| 0.0 | 0.4 | GO:0002475 | antigen processing and presentation via MHC class Ib(GO:0002475) antigen processing and presentation of lipid antigen via MHC class Ib(GO:0048003) antigen processing and presentation, exogenous lipid antigen via MHC class Ib(GO:0048007) |
| 0.0 | 0.4 | GO:0070507 | regulation of microtubule cytoskeleton organization(GO:0070507) |
| 0.0 | 0.3 | GO:0003215 | cardiac right ventricle morphogenesis(GO:0003215) |
| 0.0 | 0.3 | GO:0061014 | positive regulation of mRNA catabolic process(GO:0061014) |
| 0.0 | 0.1 | GO:2000286 | receptor internalization involved in canonical Wnt signaling pathway(GO:2000286) |
| 0.0 | 0.1 | GO:0015864 | pyrimidine nucleoside transport(GO:0015864) |
| 0.0 | 3.6 | GO:0051054 | positive regulation of DNA metabolic process(GO:0051054) |
| 0.0 | 0.1 | GO:1900154 | regulation of bone trabecula formation(GO:1900154) negative regulation of bone trabecula formation(GO:1900155) |
| 0.0 | 0.3 | GO:0002710 | negative regulation of T cell mediated immunity(GO:0002710) |
| 0.0 | 0.0 | GO:0032611 | interleukin-1 beta production(GO:0032611) |
| 0.0 | 3.9 | GO:0007156 | homophilic cell adhesion via plasma membrane adhesion molecules(GO:0007156) |
| 0.0 | 0.1 | GO:0060405 | regulation of penile erection(GO:0060405) |
| 0.0 | 2.6 | GO:0050871 | positive regulation of B cell activation(GO:0050871) |
| 0.0 | 0.1 | GO:0001545 | primary ovarian follicle growth(GO:0001545) |
| 0.0 | 1.0 | GO:0036151 | phosphatidylcholine acyl-chain remodeling(GO:0036151) |
| 0.0 | 0.0 | GO:0042447 | hormone catabolic process(GO:0042447) |
| 0.0 | 0.3 | GO:0007077 | mitotic nuclear envelope disassembly(GO:0007077) |
| 0.0 | 0.1 | GO:0003218 | cardiac left ventricle formation(GO:0003218) |
| 0.0 | 0.0 | GO:1902742 | apoptotic process involved in morphogenesis(GO:0060561) apoptotic process involved in development(GO:1902742) |
| 0.0 | 0.5 | GO:0007191 | adenylate cyclase-activating dopamine receptor signaling pathway(GO:0007191) |
| 0.0 | 0.0 | GO:0031860 | telomeric loop formation(GO:0031627) telomeric 3' overhang formation(GO:0031860) |
| 0.0 | 0.1 | GO:0061450 | trophoblast cell migration(GO:0061450) regulation of trophoblast cell migration(GO:1901163) |
| 0.0 | 0.2 | GO:0051561 | positive regulation of mitochondrial calcium ion concentration(GO:0051561) |
| 0.0 | 0.0 | GO:2001184 | positive regulation of interleukin-12 secretion(GO:2001184) |
| 0.0 | 0.0 | GO:0043268 | positive regulation of potassium ion transport(GO:0043268) |
| 0.0 | 0.1 | GO:0050893 | sensory processing(GO:0050893) |
| 0.0 | 0.6 | GO:0006611 | protein export from nucleus(GO:0006611) |
| 0.0 | 0.2 | GO:0031666 | positive regulation of lipopolysaccharide-mediated signaling pathway(GO:0031666) |
| 0.0 | 3.0 | GO:0019886 | antigen processing and presentation of exogenous peptide antigen via MHC class II(GO:0019886) |
| 0.0 | 0.0 | GO:0061117 | negative regulation of cardiac muscle tissue growth(GO:0055022) negative regulation of heart growth(GO:0061117) |
| 0.0 | 0.6 | GO:0031424 | keratinization(GO:0031424) |
| 0.0 | 0.1 | GO:0032070 | regulation of deoxyribonuclease activity(GO:0032070) |
| 0.0 | 0.0 | GO:0070244 | negative regulation of thymocyte apoptotic process(GO:0070244) |
| 0.0 | 0.0 | GO:0007127 | meiosis I(GO:0007127) |
| 0.0 | 0.2 | GO:0086046 | membrane depolarization during SA node cell action potential(GO:0086046) |
| 0.0 | 0.2 | GO:0006516 | glycoprotein catabolic process(GO:0006516) |
| 0.0 | 0.2 | GO:0000160 | phosphorelay signal transduction system(GO:0000160) |
| 0.0 | 0.1 | GO:0021523 | somatic motor neuron differentiation(GO:0021523) |
| 0.0 | 0.1 | GO:0048069 | eye pigmentation(GO:0048069) |
| 0.0 | 0.1 | GO:0090656 | t-circle formation(GO:0090656) |
| 0.0 | 0.3 | GO:1901841 | regulation of high voltage-gated calcium channel activity(GO:1901841) |
| 0.0 | 0.3 | GO:0032098 | regulation of appetite(GO:0032098) |
| 0.0 | 0.1 | GO:0070634 | transepithelial ammonium transport(GO:0070634) |
| 0.0 | 0.1 | GO:0034653 | diterpenoid catabolic process(GO:0016103) retinoic acid catabolic process(GO:0034653) |
| 0.0 | 0.1 | GO:0043031 | negative regulation of macrophage activation(GO:0043031) |
| 0.0 | 0.0 | GO:0060236 | regulation of mitotic spindle organization(GO:0060236) |
| 0.0 | 0.1 | GO:0021759 | globus pallidus development(GO:0021759) |
| 0.0 | 0.1 | GO:0099525 | presynaptic dense core granule exocytosis(GO:0099525) |
| 0.0 | 0.2 | GO:0007223 | Wnt signaling pathway, calcium modulating pathway(GO:0007223) |
| 0.0 | 0.4 | GO:0051894 | positive regulation of focal adhesion assembly(GO:0051894) |
| 0.0 | 0.3 | GO:0008053 | mitochondrial fusion(GO:0008053) |
| 0.0 | 0.6 | GO:0032467 | positive regulation of cytokinesis(GO:0032467) |
| 0.0 | 0.1 | GO:0001575 | globoside metabolic process(GO:0001575) |
| 0.0 | 0.2 | GO:0008045 | motor neuron axon guidance(GO:0008045) |
| 0.0 | 1.7 | GO:0006890 | retrograde vesicle-mediated transport, Golgi to ER(GO:0006890) |
| 0.0 | 1.6 | GO:0050911 | detection of chemical stimulus involved in sensory perception of smell(GO:0050911) |
| 0.0 | 0.1 | GO:0002005 | angiotensin catabolic process in blood(GO:0002005) |
| 0.0 | 0.2 | GO:0045022 | early endosome to late endosome transport(GO:0045022) |
| 0.0 | 0.4 | GO:0002227 | innate immune response in mucosa(GO:0002227) |
| 0.0 | 0.0 | GO:0038163 | thrombopoietin-mediated signaling pathway(GO:0038163) |
| 0.0 | 0.3 | GO:0032897 | negative regulation of viral transcription(GO:0032897) |
| 0.0 | 0.4 | GO:0007214 | gamma-aminobutyric acid signaling pathway(GO:0007214) |
| 0.0 | 0.0 | GO:0051771 | negative regulation of nitric-oxide synthase biosynthetic process(GO:0051771) |
| 0.0 | 0.3 | GO:0042355 | fucose catabolic process(GO:0019317) L-fucose metabolic process(GO:0042354) L-fucose catabolic process(GO:0042355) |
| 0.0 | 0.1 | GO:0070316 | regulation of G0 to G1 transition(GO:0070316) |
| 0.0 | 0.0 | GO:0070170 | regulation of tooth mineralization(GO:0070170) |
| 0.0 | 0.2 | GO:0021615 | glossopharyngeal nerve morphogenesis(GO:0021615) |
| 0.0 | 1.0 | GO:0071377 | cellular response to glucagon stimulus(GO:0071377) |
| 0.0 | 0.0 | GO:0002331 | pre-B cell differentiation(GO:0002329) pre-B cell allelic exclusion(GO:0002331) |
| 0.0 | 0.2 | GO:0006817 | phosphate ion transport(GO:0006817) |
| 0.0 | 0.1 | GO:1904645 | response to beta-amyloid(GO:1904645) |
| 0.0 | 0.0 | GO:0009953 | dorsal/ventral pattern formation(GO:0009953) |
| 0.0 | 0.2 | GO:0097354 | protein prenylation(GO:0018342) prenylation(GO:0097354) |
| 0.0 | 0.1 | GO:0019896 | axonal transport of mitochondrion(GO:0019896) |
| 0.0 | 0.1 | GO:0042226 | interleukin-6 biosynthetic process(GO:0042226) |
| 0.0 | 0.3 | GO:0016486 | peptide hormone processing(GO:0016486) |
| 0.0 | 0.0 | GO:1902231 | positive regulation of intrinsic apoptotic signaling pathway in response to DNA damage(GO:1902231) |
| 0.0 | 0.3 | GO:0018023 | peptidyl-lysine trimethylation(GO:0018023) |
| 0.0 | 0.1 | GO:0018149 | peptide cross-linking(GO:0018149) |
| 0.0 | 0.1 | GO:0010566 | regulation of ketone biosynthetic process(GO:0010566) |
| 0.0 | 0.1 | GO:0090234 | regulation of kinetochore assembly(GO:0090234) |
| 0.0 | 0.1 | GO:0048312 | intracellular distribution of mitochondria(GO:0048312) |
| 0.0 | 0.4 | GO:0006284 | base-excision repair(GO:0006284) |
| 0.0 | 0.1 | GO:0061370 | testosterone biosynthetic process(GO:0061370) |
| 0.0 | 0.2 | GO:0006772 | thiamine metabolic process(GO:0006772) |
| 0.0 | 0.4 | GO:0071425 | hematopoietic stem cell proliferation(GO:0071425) |
| 0.0 | 0.1 | GO:0015842 | aminergic neurotransmitter loading into synaptic vesicle(GO:0015842) |
| 0.0 | 0.0 | GO:0043506 | regulation of JUN kinase activity(GO:0043506) |
| 0.0 | 0.0 | GO:0060013 | righting reflex(GO:0060013) |
| 0.0 | 0.2 | GO:0071420 | cellular response to histamine(GO:0071420) |
| 0.0 | 0.0 | GO:0001920 | negative regulation of receptor recycling(GO:0001920) |
| 0.0 | 0.0 | GO:0071985 | multivesicular body sorting pathway(GO:0071985) |
| 0.0 | 0.3 | GO:0086010 | membrane depolarization during action potential(GO:0086010) |
| 0.0 | 0.1 | GO:0000154 | rRNA modification(GO:0000154) |
| 0.0 | 0.2 | GO:0001574 | ganglioside biosynthetic process(GO:0001574) |
| 0.0 | 0.1 | GO:0050918 | positive chemotaxis(GO:0050918) |
| 0.0 | 0.4 | GO:0051058 | negative regulation of small GTPase mediated signal transduction(GO:0051058) |
| 0.0 | 0.0 | GO:0045901 | positive regulation of translational elongation(GO:0045901) |
| 0.0 | 0.0 | GO:0015760 | hexose phosphate transport(GO:0015712) glucose-6-phosphate transport(GO:0015760) |
| 0.0 | 0.0 | GO:0046784 | viral mRNA export from host cell nucleus(GO:0046784) |
| 0.0 | 0.0 | GO:0043084 | penile erection(GO:0043084) |
| 0.0 | 0.0 | GO:0072595 | maintenance of protein localization in organelle(GO:0072595) |
| 0.0 | 0.1 | GO:1901862 | negative regulation of striated muscle tissue development(GO:0045843) negative regulation of muscle tissue development(GO:1901862) |
| 0.0 | 0.1 | GO:0070166 | enamel mineralization(GO:0070166) |
| 0.0 | 0.1 | GO:0045903 | positive regulation of translational fidelity(GO:0045903) |
| 0.0 | 0.0 | GO:0001555 | oocyte growth(GO:0001555) |
| 0.0 | 0.0 | GO:0051764 | actin crosslink formation(GO:0051764) |
| 0.0 | 0.0 | GO:2001026 | regulation of endothelial cell chemotaxis(GO:2001026) |
| 0.0 | 0.0 | GO:0035973 | aggrephagy(GO:0035973) |
| 0.0 | 0.2 | GO:0070262 | peptidyl-serine dephosphorylation(GO:0070262) |
| 0.0 | 0.1 | GO:0071318 | cellular response to ATP(GO:0071318) |
| 0.0 | 0.1 | GO:1900745 | positive regulation of p38MAPK cascade(GO:1900745) |
| 0.0 | 0.0 | GO:1901186 | positive regulation of epidermal growth factor receptor signaling pathway(GO:0045742) positive regulation of ERBB signaling pathway(GO:1901186) |
| 0.0 | 0.0 | GO:0048635 | negative regulation of muscle organ development(GO:0048635) |
| 0.0 | 0.1 | GO:0010818 | T cell chemotaxis(GO:0010818) |
| 0.0 | 0.0 | GO:1902573 | positive regulation of serine-type endopeptidase activity(GO:1900005) positive regulation of serine-type peptidase activity(GO:1902573) |
| 0.0 | 0.1 | GO:0030382 | sperm mitochondrion organization(GO:0030382) |
| 0.0 | 0.0 | GO:0071850 | mitotic cell cycle arrest(GO:0071850) |
| 0.0 | 0.0 | GO:0044268 | multicellular organismal protein metabolic process(GO:0044268) |
| 0.0 | 0.0 | GO:0033313 | meiotic cell cycle checkpoint(GO:0033313) |
| 0.0 | 0.0 | GO:0051797 | regulation of hair follicle development(GO:0051797) |
| 0.0 | 0.1 | GO:0032660 | regulation of interleukin-17 production(GO:0032660) |
| 0.0 | 0.1 | GO:0006490 | oligosaccharide-lipid intermediate biosynthetic process(GO:0006490) |
| 0.0 | 0.0 | GO:0008298 | intracellular mRNA localization(GO:0008298) |
| 0.0 | 0.0 | GO:0002765 | immune response-inhibiting signal transduction(GO:0002765) immune response-inhibiting cell surface receptor signaling pathway(GO:0002767) |
| 0.0 | 0.0 | GO:0099566 | regulation of postsynaptic cytosolic calcium ion concentration(GO:0099566) |
| 0.0 | 0.0 | GO:0070816 | phosphorylation of RNA polymerase II C-terminal domain(GO:0070816) |
| 0.0 | 0.3 | GO:0015701 | bicarbonate transport(GO:0015701) |
| 0.0 | 0.0 | GO:0070233 | negative regulation of T cell apoptotic process(GO:0070233) |
| 0.0 | 0.0 | GO:0044090 | positive regulation of vacuole organization(GO:0044090) |
| 0.0 | 0.0 | GO:1904425 | negative regulation of GTP binding(GO:1904425) |
| 0.0 | 0.1 | GO:0003322 | pancreatic A cell development(GO:0003322) |
| 0.0 | 0.0 | GO:0019442 | tryptophan catabolic process to acetyl-CoA(GO:0019442) |
| 0.0 | 0.0 | GO:1901876 | regulation of calcium ion binding(GO:1901876) negative regulation of calcium ion binding(GO:1901877) |
| 0.0 | 0.0 | GO:0046085 | adenosine metabolic process(GO:0046085) |
| 0.0 | 0.0 | GO:0045213 | neurotransmitter receptor metabolic process(GO:0045213) |
| 0.0 | 0.0 | GO:0045448 | regulation of mitotic cell cycle, embryonic(GO:0009794) mitotic cell cycle, embryonic(GO:0045448) |
| 0.0 | 0.0 | GO:2001054 | negative regulation of mesenchymal cell apoptotic process(GO:2001054) |
| 0.0 | 0.0 | GO:2000392 | regulation of lamellipodium morphogenesis(GO:2000392) |
| 0.0 | 0.0 | GO:0032435 | negative regulation of proteasomal ubiquitin-dependent protein catabolic process(GO:0032435) |
| 0.0 | 0.0 | GO:0035747 | natural killer cell chemotaxis(GO:0035747) negative regulation of lymphocyte chemotaxis(GO:1901624) negative regulation of lymphocyte migration(GO:2000402) |
| 0.0 | 0.0 | GO:0007210 | serotonin receptor signaling pathway(GO:0007210) |
Gene overrepresentation in cellular_component category:
| Log-likelihood per target | Total log-likelihood | Term | Description |
|---|---|---|---|
| 5.3 | 37.1 | GO:0097209 | epidermal lamellar body(GO:0097209) |
| 3.8 | 30.4 | GO:0005610 | laminin-5 complex(GO:0005610) |
| 2.6 | 17.9 | GO:0035692 | macrophage migration inhibitory factor receptor complex(GO:0035692) |
| 2.1 | 26.8 | GO:0097470 | ribbon synapse(GO:0097470) |
| 1.9 | 15.0 | GO:0098845 | postsynaptic endosome(GO:0098845) |
| 1.8 | 5.4 | GO:0097057 | TRAF2-GSTP1 complex(GO:0097057) |
| 1.8 | 5.4 | GO:0034667 | integrin alpha3-beta1 complex(GO:0034667) |
| 1.6 | 4.9 | GO:0097489 | multivesicular body, internal vesicle lumen(GO:0097489) |
| 1.6 | 4.9 | GO:0034666 | integrin alpha2-beta1 complex(GO:0034666) |
| 1.6 | 17.7 | GO:0035985 | senescence-associated heterochromatin focus(GO:0035985) |
| 1.6 | 36.6 | GO:0030056 | hemidesmosome(GO:0030056) |
| 1.5 | 20.5 | GO:0034098 | VCP-NPL4-UFD1 AAA ATPase complex(GO:0034098) |
| 1.4 | 7.2 | GO:0031905 | early endosome lumen(GO:0031905) |
| 1.4 | 8.6 | GO:0072558 | NLRP1 inflammasome complex(GO:0072558) |
| 1.4 | 4.2 | GO:0044393 | microspike(GO:0044393) |
| 1.2 | 3.7 | GO:0072534 | perineuronal net(GO:0072534) |
| 1.2 | 13.4 | GO:0097443 | sorting endosome(GO:0097443) |
| 1.1 | 8.0 | GO:0000110 | nucleotide-excision repair factor 1 complex(GO:0000110) |
| 1.1 | 5.6 | GO:0044352 | pinosome(GO:0044352) macropinosome(GO:0044354) |
| 1.0 | 15.6 | GO:0090543 | Flemming body(GO:0090543) |
| 1.0 | 1.0 | GO:0030289 | protein phosphatase 4 complex(GO:0030289) |
| 1.0 | 22.3 | GO:0001527 | microfibril(GO:0001527) fibril(GO:0043205) |
| 1.0 | 4.9 | GO:0045323 | interleukin-1 receptor complex(GO:0045323) |
| 1.0 | 4.8 | GO:0097123 | cyclin A1-CDK2 complex(GO:0097123) |
| 1.0 | 29.7 | GO:0031092 | platelet alpha granule membrane(GO:0031092) |
| 0.9 | 6.4 | GO:0032593 | insulin-responsive compartment(GO:0032593) |
| 0.9 | 9.0 | GO:0042584 | chromaffin granule membrane(GO:0042584) |
| 0.9 | 2.6 | GO:0071065 | alpha9-beta1 integrin-vascular cell adhesion molecule-1 complex(GO:0071065) |
| 0.9 | 8.5 | GO:0097197 | tetraspanin-enriched microdomain(GO:0097197) |
| 0.9 | 17.1 | GO:0005885 | Arp2/3 protein complex(GO:0005885) |
| 0.9 | 8.5 | GO:0005655 | nucleolar ribonuclease P complex(GO:0005655) |
| 0.8 | 2.5 | GO:0070435 | Shc-EGFR complex(GO:0070435) |
| 0.8 | 3.2 | GO:0032937 | SREBP-SCAP-Insig complex(GO:0032937) |
| 0.8 | 4.0 | GO:0071438 | invadopodium membrane(GO:0071438) |
| 0.8 | 13.4 | GO:0005922 | connexon complex(GO:0005922) |
| 0.8 | 14.7 | GO:0005862 | muscle thin filament tropomyosin(GO:0005862) |
| 0.8 | 6.1 | GO:0000235 | astral microtubule(GO:0000235) aster(GO:0005818) |
| 0.8 | 6.0 | GO:0005587 | collagen type IV trimer(GO:0005587) |
| 0.8 | 0.8 | GO:1990246 | uniplex complex(GO:1990246) |
| 0.7 | 4.4 | GO:0097129 | cyclin D2-CDK4 complex(GO:0097129) |
| 0.7 | 2.2 | GO:0036128 | CatSper complex(GO:0036128) |
| 0.7 | 5.0 | GO:0031415 | NatA complex(GO:0031415) |
| 0.7 | 5.0 | GO:0098575 | lumenal side of lysosomal membrane(GO:0098575) |
| 0.7 | 1.4 | GO:0097342 | ripoptosome(GO:0097342) |
| 0.7 | 2.8 | GO:1990075 | periciliary membrane compartment(GO:1990075) |
| 0.7 | 2.1 | GO:0043235 | receptor complex(GO:0043235) |
| 0.7 | 2.7 | GO:0031232 | extrinsic component of external side of plasma membrane(GO:0031232) |
| 0.7 | 18.1 | GO:0097228 | sperm principal piece(GO:0097228) |
| 0.7 | 2.0 | GO:0045180 | basal cortex(GO:0045180) |
| 0.7 | 5.3 | GO:0071144 | SMAD2-SMAD3 protein complex(GO:0071144) |
| 0.7 | 3.3 | GO:0048787 | presynaptic active zone membrane(GO:0048787) |
| 0.6 | 28.5 | GO:0045095 | keratin filament(GO:0045095) |
| 0.6 | 3.2 | GO:0000221 | vacuolar proton-transporting V-type ATPase, V1 domain(GO:0000221) |
| 0.6 | 3.2 | GO:0071986 | Ragulator complex(GO:0071986) |
| 0.6 | 5.1 | GO:1990111 | spermatoproteasome complex(GO:1990111) |
| 0.6 | 1.9 | GO:0005826 | actomyosin contractile ring(GO:0005826) |
| 0.6 | 1.3 | GO:0098592 | cytoplasmic side of apical plasma membrane(GO:0098592) |
| 0.6 | 2.5 | GO:0030936 | collagen type XIII trimer(GO:0005600) transmembrane collagen trimer(GO:0030936) |
| 0.6 | 3.7 | GO:0051286 | cell tip(GO:0051286) |
| 0.6 | 9.8 | GO:0031362 | anchored component of external side of plasma membrane(GO:0031362) |
| 0.6 | 4.3 | GO:0030121 | AP-1 adaptor complex(GO:0030121) |
| 0.6 | 2.9 | GO:0097149 | centralspindlin complex(GO:0097149) |
| 0.6 | 1.7 | GO:0070557 | PCNA-p21 complex(GO:0070557) |
| 0.6 | 5.2 | GO:0097487 | multivesicular body, internal vesicle(GO:0097487) |
| 0.6 | 28.8 | GO:0001533 | cornified envelope(GO:0001533) |
| 0.6 | 0.6 | GO:0098642 | network-forming collagen trimer(GO:0098642) collagen network(GO:0098645) |
| 0.6 | 1.7 | GO:0048269 | methionine adenosyltransferase complex(GO:0048269) |
| 0.6 | 1.1 | GO:0098576 | lumenal side of membrane(GO:0098576) |
| 0.6 | 2.3 | GO:0060171 | myosin I complex(GO:0045160) stereocilium membrane(GO:0060171) |
| 0.5 | 2.7 | GO:0032449 | CBM complex(GO:0032449) |
| 0.5 | 4.9 | GO:0070022 | transforming growth factor beta receptor homodimeric complex(GO:0070022) |
| 0.5 | 1.1 | GO:0097454 | Schwann cell microvillus(GO:0097454) |
| 0.5 | 2.1 | GO:0045283 | mitochondrial respiratory chain complex II, succinate dehydrogenase complex (ubiquinone)(GO:0005749) succinate dehydrogenase complex (ubiquinone)(GO:0045257) respiratory chain complex II(GO:0045273) succinate dehydrogenase complex(GO:0045281) fumarate reductase complex(GO:0045283) |
| 0.5 | 7.4 | GO:0098563 | integral component of synaptic vesicle membrane(GO:0030285) intrinsic component of synaptic vesicle membrane(GO:0098563) |
| 0.5 | 14.3 | GO:0031143 | pseudopodium(GO:0031143) |
| 0.5 | 2.1 | GO:0034045 | pre-autophagosomal structure membrane(GO:0034045) |
| 0.5 | 2.1 | GO:0043541 | UDP-N-acetylglucosamine transferase complex(GO:0043541) |
| 0.5 | 2.6 | GO:0008622 | epsilon DNA polymerase complex(GO:0008622) |
| 0.5 | 3.1 | GO:0042406 | extrinsic component of endoplasmic reticulum membrane(GO:0042406) |
| 0.5 | 1.5 | GO:0070762 | nuclear pore transmembrane ring(GO:0070762) |
| 0.5 | 1.0 | GO:0097135 | cyclin E2-CDK2 complex(GO:0097135) |
| 0.5 | 1.5 | GO:0030017 | sarcomere(GO:0030017) |
| 0.5 | 4.9 | GO:0042612 | MHC class I protein complex(GO:0042612) |
| 0.5 | 4.3 | GO:0030057 | desmosome(GO:0030057) |
| 0.5 | 2.8 | GO:0098560 | cytoplasmic side of late endosome membrane(GO:0098560) |
| 0.5 | 3.3 | GO:0030130 | clathrin coat of trans-Golgi network vesicle(GO:0030130) |
| 0.5 | 1.9 | GO:0005863 | striated muscle myosin thick filament(GO:0005863) |
| 0.5 | 1.4 | GO:0002081 | outer acrosomal membrane(GO:0002081) |
| 0.4 | 2.6 | GO:0090661 | box H/ACA snoRNP complex(GO:0031429) box H/ACA RNP complex(GO:0072588) box H/ACA scaRNP complex(GO:0072589) box H/ACA telomerase RNP complex(GO:0090661) |
| 0.4 | 1.3 | GO:0043159 | acrosomal matrix(GO:0043159) |
| 0.4 | 1.3 | GO:0012510 | trans-Golgi network transport vesicle membrane(GO:0012510) |
| 0.4 | 2.6 | GO:0032010 | phagolysosome(GO:0032010) |
| 0.4 | 9.0 | GO:0002080 | acrosomal membrane(GO:0002080) |
| 0.4 | 0.9 | GO:0031205 | endoplasmic reticulum Sec complex(GO:0031205) |
| 0.4 | 1.7 | GO:0036449 | microtubule minus-end(GO:0036449) |
| 0.4 | 5.3 | GO:0097433 | dense body(GO:0097433) |
| 0.4 | 0.4 | GO:0071203 | WASH complex(GO:0071203) |
| 0.4 | 2.4 | GO:0034274 | Atg12-Atg5-Atg16 complex(GO:0034274) |
| 0.4 | 2.0 | GO:0034750 | Scrib-APC-beta-catenin complex(GO:0034750) |
| 0.4 | 3.6 | GO:0005955 | calcineurin complex(GO:0005955) |
| 0.4 | 1.2 | GO:0016938 | kinesin I complex(GO:0016938) |
| 0.4 | 3.1 | GO:0005672 | transcription factor TFIIA complex(GO:0005672) |
| 0.4 | 1.2 | GO:0005850 | eukaryotic translation initiation factor 2 complex(GO:0005850) |
| 0.4 | 1.2 | GO:0036387 | nuclear pre-replicative complex(GO:0005656) pre-replicative complex(GO:0036387) |
| 0.4 | 1.9 | GO:1902937 | inward rectifier potassium channel complex(GO:1902937) |
| 0.4 | 2.3 | GO:0034448 | EGO complex(GO:0034448) Gtr1-Gtr2 GTPase complex(GO:1990131) |
| 0.4 | 1.2 | GO:0044609 | DBIRD complex(GO:0044609) |
| 0.4 | 1.9 | GO:0030678 | mitochondrial ribonuclease P complex(GO:0030678) |
| 0.4 | 10.0 | GO:0031231 | integral component of peroxisomal membrane(GO:0005779) intrinsic component of peroxisomal membrane(GO:0031231) |
| 0.4 | 1.5 | GO:0055087 | Ski complex(GO:0055087) |
| 0.4 | 4.2 | GO:0098799 | outer mitochondrial membrane protein complex(GO:0098799) |
| 0.4 | 38.1 | GO:0005913 | cell-cell adherens junction(GO:0005913) |
| 0.4 | 1.1 | GO:0018444 | translation release factor complex(GO:0018444) |
| 0.4 | 1.5 | GO:0070822 | Sin3-type complex(GO:0070822) |
| 0.4 | 20.9 | GO:0005882 | intermediate filament(GO:0005882) |
| 0.4 | 0.4 | GO:1902555 | endoribonuclease complex(GO:1902555) |
| 0.4 | 0.4 | GO:1990909 | Wnt signalosome(GO:1990909) |
| 0.4 | 1.9 | GO:0099568 | cytoplasmic region(GO:0099568) |
| 0.4 | 13.5 | GO:0043034 | costamere(GO:0043034) |
| 0.4 | 3.3 | GO:0097413 | Lewy body(GO:0097413) |
| 0.4 | 4.4 | GO:0000815 | ESCRT III complex(GO:0000815) |
| 0.4 | 1.5 | GO:0000214 | tRNA-intron endonuclease complex(GO:0000214) |
| 0.4 | 1.1 | GO:0035869 | ciliary transition zone(GO:0035869) |
| 0.4 | 3.6 | GO:0044300 | cerebellar mossy fiber(GO:0044300) |
| 0.4 | 1.1 | GO:0001940 | male pronucleus(GO:0001940) |
| 0.4 | 2.5 | GO:0072487 | MSL complex(GO:0072487) |
| 0.4 | 5.3 | GO:0005869 | dynactin complex(GO:0005869) |
| 0.4 | 0.4 | GO:0048237 | rough endoplasmic reticulum lumen(GO:0048237) |
| 0.4 | 0.4 | GO:0097422 | tubular endosome(GO:0097422) |
| 0.4 | 2.8 | GO:0033391 | chromatoid body(GO:0033391) |
| 0.4 | 1.1 | GO:0044423 | virion(GO:0019012) virion part(GO:0044423) |
| 0.4 | 2.5 | GO:0031941 | filamentous actin(GO:0031941) |
| 0.3 | 0.3 | GO:0042272 | nuclear RNA export factor complex(GO:0042272) |
| 0.3 | 3.5 | GO:0008541 | proteasome regulatory particle, lid subcomplex(GO:0008541) |
| 0.3 | 1.4 | GO:0031211 | serine C-palmitoyltransferase complex(GO:0017059) endoplasmic reticulum palmitoyltransferase complex(GO:0031211) |
| 0.3 | 1.7 | GO:0033176 | proton-transporting V-type ATPase complex(GO:0033176) |
| 0.3 | 1.4 | GO:0070985 | TFIIK complex(GO:0070985) |
| 0.3 | 1.0 | GO:0000308 | cytoplasmic cyclin-dependent protein kinase holoenzyme complex(GO:0000308) |
| 0.3 | 6.4 | GO:0035578 | azurophil granule lumen(GO:0035578) |
| 0.3 | 2.7 | GO:0008290 | F-actin capping protein complex(GO:0008290) |
| 0.3 | 1.7 | GO:0020018 | ciliary pocket(GO:0020016) ciliary pocket membrane(GO:0020018) |
| 0.3 | 0.3 | GO:0042721 | mitochondrial inner membrane protein insertion complex(GO:0042721) |
| 0.3 | 1.0 | GO:0097441 | basilar dendrite(GO:0097441) |
| 0.3 | 2.3 | GO:1990726 | Lsm1-7-Pat1 complex(GO:1990726) |
| 0.3 | 3.0 | GO:0071541 | eukaryotic translation initiation factor 3 complex, eIF3m(GO:0071541) |
| 0.3 | 1.6 | GO:0009368 | endopeptidase Clp complex(GO:0009368) |
| 0.3 | 1.3 | GO:0032311 | angiogenin-PRI complex(GO:0032311) |
| 0.3 | 1.0 | GO:0071020 | post-spliceosomal complex(GO:0071020) |
| 0.3 | 1.0 | GO:0034271 | phosphatidylinositol 3-kinase complex, class III, type I(GO:0034271) phosphatidylinositol 3-kinase complex, class III, type II(GO:0034272) |
| 0.3 | 0.6 | GO:0001739 | sex chromatin(GO:0001739) |
| 0.3 | 9.2 | GO:0031258 | lamellipodium membrane(GO:0031258) |
| 0.3 | 4.5 | GO:0036020 | endolysosome membrane(GO:0036020) |
| 0.3 | 10.4 | GO:0070069 | cytochrome complex(GO:0070069) |
| 0.3 | 0.6 | GO:0001939 | female pronucleus(GO:0001939) |
| 0.3 | 1.6 | GO:0042643 | actomyosin, actin portion(GO:0042643) |
| 0.3 | 1.2 | GO:0042587 | glycogen granule(GO:0042587) |
| 0.3 | 24.6 | GO:0034707 | chloride channel complex(GO:0034707) |
| 0.3 | 2.5 | GO:0036056 | filtration diaphragm(GO:0036056) slit diaphragm(GO:0036057) |
| 0.3 | 0.3 | GO:0031465 | Cul4B-RING E3 ubiquitin ligase complex(GO:0031465) |
| 0.3 | 0.3 | GO:0033553 | rDNA heterochromatin(GO:0033553) |
| 0.3 | 12.9 | GO:0001772 | immunological synapse(GO:0001772) |
| 0.3 | 1.2 | GO:0044611 | nuclear pore inner ring(GO:0044611) |
| 0.3 | 1.2 | GO:0032777 | Piccolo NuA4 histone acetyltransferase complex(GO:0032777) |
| 0.3 | 5.1 | GO:0030992 | intraciliary transport particle B(GO:0030992) |
| 0.3 | 2.1 | GO:0031526 | brush border membrane(GO:0031526) |
| 0.3 | 2.0 | GO:0061617 | MICOS complex(GO:0061617) |
| 0.3 | 0.9 | GO:0071751 | IgA immunoglobulin complex(GO:0071745) IgA immunoglobulin complex, circulating(GO:0071746) monomeric IgA immunoglobulin complex(GO:0071748) polymeric IgA immunoglobulin complex(GO:0071749) secretory IgA immunoglobulin complex(GO:0071751) |
| 0.3 | 6.3 | GO:0005838 | proteasome regulatory particle(GO:0005838) |
| 0.3 | 1.7 | GO:0031467 | Cul7-RING ubiquitin ligase complex(GO:0031467) |
| 0.3 | 2.9 | GO:0005641 | nuclear envelope lumen(GO:0005641) |
| 0.3 | 2.8 | GO:0097255 | R2TP complex(GO:0097255) |
| 0.3 | 1.7 | GO:0097449 | astrocyte projection(GO:0097449) |
| 0.3 | 1.1 | GO:0005889 | hydrogen:potassium-exchanging ATPase complex(GO:0005889) |
| 0.3 | 10.7 | GO:0002102 | podosome(GO:0002102) |
| 0.3 | 0.8 | GO:0031372 | UBC13-MMS2 complex(GO:0031372) |
| 0.3 | 1.4 | GO:0005753 | mitochondrial proton-transporting ATP synthase complex(GO:0005753) |
| 0.3 | 7.6 | GO:0005868 | cytoplasmic dynein complex(GO:0005868) |
| 0.3 | 1.1 | GO:0005971 | ribonucleoside-diphosphate reductase complex(GO:0005971) |
| 0.3 | 0.5 | GO:0071012 | catalytic step 1 spliceosome(GO:0071012) |
| 0.3 | 2.1 | GO:0031931 | TORC1 complex(GO:0031931) |
| 0.3 | 2.9 | GO:0070765 | gamma-secretase complex(GO:0070765) |
| 0.3 | 1.6 | GO:0005688 | U6 snRNP(GO:0005688) |
| 0.3 | 0.3 | GO:0035976 | AP1 complex(GO:0035976) |
| 0.3 | 1.3 | GO:0005947 | mitochondrial alpha-ketoglutarate dehydrogenase complex(GO:0005947) |
| 0.3 | 0.3 | GO:0036398 | TCR signalosome(GO:0036398) |
| 0.3 | 3.1 | GO:0097431 | mitotic spindle pole(GO:0097431) |
| 0.3 | 1.5 | GO:0005958 | DNA-dependent protein kinase-DNA ligase 4 complex(GO:0005958) |
| 0.3 | 0.8 | GO:0097059 | CNTFR-CLCF1 complex(GO:0097059) |
| 0.3 | 0.8 | GO:0031264 | death-inducing signaling complex(GO:0031264) |
| 0.2 | 7.7 | GO:0030673 | axolemma(GO:0030673) |
| 0.2 | 10.2 | GO:0000307 | cyclin-dependent protein kinase holoenzyme complex(GO:0000307) |
| 0.2 | 1.0 | GO:0016012 | dystroglycan complex(GO:0016011) sarcoglycan complex(GO:0016012) |
| 0.2 | 4.9 | GO:0042629 | mast cell granule(GO:0042629) |
| 0.2 | 0.7 | GO:0005785 | signal recognition particle receptor complex(GO:0005785) |
| 0.2 | 1.5 | GO:0031597 | cytosolic proteasome complex(GO:0031597) |
| 0.2 | 2.2 | GO:0005642 | annulate lamellae(GO:0005642) |
| 0.2 | 2.9 | GO:1990454 | L-type voltage-gated calcium channel complex(GO:1990454) |
| 0.2 | 1.0 | GO:0030896 | checkpoint clamp complex(GO:0030896) |
| 0.2 | 2.9 | GO:0033643 | host cell part(GO:0033643) |
| 0.2 | 1.7 | GO:0000923 | equatorial microtubule organizing center(GO:0000923) |
| 0.2 | 2.9 | GO:0043219 | lateral loop(GO:0043219) |
| 0.2 | 0.7 | GO:0005715 | late recombination nodule(GO:0005715) |
| 0.2 | 4.7 | GO:0031588 | nucleotide-activated protein kinase complex(GO:0031588) |
| 0.2 | 9.9 | GO:0043198 | dendritic shaft(GO:0043198) |
| 0.2 | 1.6 | GO:0033269 | internode region of axon(GO:0033269) |
| 0.2 | 1.9 | GO:0005921 | gap junction(GO:0005921) |
| 0.2 | 4.4 | GO:0016471 | vacuolar proton-transporting V-type ATPase complex(GO:0016471) |
| 0.2 | 0.2 | GO:0031224 | intrinsic component of membrane(GO:0031224) |
| 0.2 | 0.7 | GO:0010009 | cytoplasmic side of endosome membrane(GO:0010009) cytoplasmic side of early endosome membrane(GO:0098559) |
| 0.2 | 0.9 | GO:1990423 | RZZ complex(GO:1990423) |
| 0.2 | 0.7 | GO:0031430 | M band(GO:0031430) |
| 0.2 | 0.5 | GO:0001917 | photoreceptor inner segment(GO:0001917) |
| 0.2 | 2.3 | GO:0033162 | melanosome membrane(GO:0033162) chitosome(GO:0045009) |
| 0.2 | 1.8 | GO:0042824 | MHC class I peptide loading complex(GO:0042824) |
| 0.2 | 1.1 | GO:0005663 | DNA replication factor C complex(GO:0005663) |
| 0.2 | 0.4 | GO:1990357 | terminal web(GO:1990357) |
| 0.2 | 9.3 | GO:0005881 | cytoplasmic microtubule(GO:0005881) |
| 0.2 | 2.2 | GO:0033178 | proton-transporting two-sector ATPase complex, catalytic domain(GO:0033178) |
| 0.2 | 0.9 | GO:0030893 | meiotic cohesin complex(GO:0030893) |
| 0.2 | 1.1 | GO:0000138 | Golgi trans cisterna(GO:0000138) |
| 0.2 | 5.4 | GO:0032839 | dendrite cytoplasm(GO:0032839) |
| 0.2 | 2.6 | GO:0033093 | Weibel-Palade body(GO:0033093) |
| 0.2 | 0.9 | GO:0097224 | sperm connecting piece(GO:0097224) |
| 0.2 | 0.4 | GO:0031229 | integral component of nuclear inner membrane(GO:0005639) intrinsic component of nuclear inner membrane(GO:0031229) nuclear membrane part(GO:0044453) |
| 0.2 | 0.6 | GO:0005953 | CAAX-protein geranylgeranyltransferase complex(GO:0005953) |
| 0.2 | 2.6 | GO:0019773 | proteasome core complex, alpha-subunit complex(GO:0019773) |
| 0.2 | 0.8 | GO:0030891 | VCB complex(GO:0030891) |
| 0.2 | 10.7 | GO:0005834 | heterotrimeric G-protein complex(GO:0005834) |
| 0.2 | 2.3 | GO:0030125 | clathrin vesicle coat(GO:0030125) |
| 0.2 | 1.0 | GO:0071148 | TEAD-1-YAP complex(GO:0071148) |
| 0.2 | 2.1 | GO:0031932 | TORC2 complex(GO:0031932) TOR complex(GO:0038201) |
| 0.2 | 1.0 | GO:1990425 | ryanodine receptor complex(GO:1990425) |
| 0.2 | 0.6 | GO:0030906 | retromer, cargo-selective complex(GO:0030906) |
| 0.2 | 1.2 | GO:0070852 | cell body fiber(GO:0070852) |
| 0.2 | 1.0 | GO:0089701 | U2AF(GO:0089701) |
| 0.2 | 2.8 | GO:0036038 | MKS complex(GO:0036038) |
| 0.2 | 0.6 | GO:0098536 | deuterosome(GO:0098536) |
| 0.2 | 0.4 | GO:0044615 | nuclear pore nuclear basket(GO:0044615) |
| 0.2 | 0.6 | GO:0031166 | integral component of vacuolar membrane(GO:0031166) |
| 0.2 | 1.6 | GO:0071204 | histone pre-mRNA 3'end processing complex(GO:0071204) |
| 0.2 | 2.3 | GO:0030008 | TRAPP complex(GO:0030008) |
| 0.2 | 1.2 | GO:0009331 | glycerol-3-phosphate dehydrogenase complex(GO:0009331) |
| 0.2 | 1.7 | GO:0031371 | ubiquitin conjugating enzyme complex(GO:0031371) |
| 0.2 | 6.3 | GO:0030670 | phagocytic vesicle membrane(GO:0030670) |
| 0.2 | 1.7 | GO:0000439 | core TFIIH complex(GO:0000439) |
| 0.2 | 11.6 | GO:0043195 | terminal bouton(GO:0043195) |
| 0.2 | 4.1 | GO:0031082 | BLOC complex(GO:0031082) |
| 0.2 | 1.7 | GO:0043218 | compact myelin(GO:0043218) |
| 0.2 | 0.6 | GO:0030135 | coated vesicle(GO:0030135) |
| 0.2 | 3.4 | GO:0000276 | mitochondrial proton-transporting ATP synthase complex, coupling factor F(o)(GO:0000276) |
| 0.2 | 89.4 | GO:0005925 | focal adhesion(GO:0005925) |
| 0.2 | 2.2 | GO:0005744 | mitochondrial inner membrane presequence translocase complex(GO:0005744) |
| 0.2 | 0.7 | GO:0002189 | ribose phosphate diphosphokinase complex(GO:0002189) |
| 0.2 | 2.2 | GO:0030131 | clathrin adaptor complex(GO:0030131) |
| 0.2 | 3.1 | GO:0043189 | NuA4 histone acetyltransferase complex(GO:0035267) H4/H2A histone acetyltransferase complex(GO:0043189) H4 histone acetyltransferase complex(GO:1902562) |
| 0.2 | 0.4 | GO:0044308 | axonal spine(GO:0044308) |
| 0.2 | 0.5 | GO:0005588 | collagen type V trimer(GO:0005588) |
| 0.2 | 9.8 | GO:0045171 | intercellular bridge(GO:0045171) |
| 0.2 | 6.1 | GO:0000159 | protein phosphatase type 2A complex(GO:0000159) |
| 0.2 | 1.8 | GO:0032433 | filopodium tip(GO:0032433) |
| 0.2 | 3.2 | GO:0031265 | CD95 death-inducing signaling complex(GO:0031265) |
| 0.2 | 0.5 | GO:0045293 | MIS complex(GO:0036396) mRNA editing complex(GO:0045293) |
| 0.2 | 1.4 | GO:0035579 | specific granule membrane(GO:0035579) |
| 0.2 | 11.6 | GO:0042734 | presynaptic membrane(GO:0042734) |
| 0.2 | 3.8 | GO:0046930 | pore complex(GO:0046930) |
| 0.2 | 1.9 | GO:0044463 | cell projection part(GO:0044463) |
| 0.2 | 3.5 | GO:0001750 | photoreceptor outer segment(GO:0001750) |
| 0.2 | 3.3 | GO:0071782 | endoplasmic reticulum tubular network(GO:0071782) |
| 0.2 | 0.8 | GO:0017146 | NMDA selective glutamate receptor complex(GO:0017146) |
| 0.2 | 1.3 | GO:0036019 | endolysosome(GO:0036019) |
| 0.2 | 0.7 | GO:0000333 | telomerase catalytic core complex(GO:0000333) |
| 0.2 | 0.8 | GO:0005943 | phosphatidylinositol 3-kinase complex, class IA(GO:0005943) |
| 0.2 | 5.0 | GO:0005665 | DNA-directed RNA polymerase II, core complex(GO:0005665) |
| 0.2 | 2.3 | GO:0005662 | DNA replication factor A complex(GO:0005662) |
| 0.2 | 11.9 | GO:0035580 | specific granule lumen(GO:0035580) |
| 0.2 | 0.3 | GO:1990462 | omegasome(GO:1990462) |
| 0.2 | 0.2 | GO:1990604 | IRE1-TRAF2-ASK1 complex(GO:1990604) |
| 0.2 | 1.3 | GO:0030478 | actin cap(GO:0030478) |
| 0.2 | 1.8 | GO:0000176 | nuclear exosome (RNase complex)(GO:0000176) |
| 0.2 | 0.8 | GO:0032009 | early phagosome(GO:0032009) |
| 0.2 | 3.9 | GO:0034706 | sodium channel complex(GO:0034706) |
| 0.2 | 0.5 | GO:0031428 | box C/D snoRNP complex(GO:0031428) |
| 0.2 | 0.5 | GO:0072557 | IPAF inflammasome complex(GO:0072557) |
| 0.2 | 0.8 | GO:0000801 | central element(GO:0000801) |
| 0.2 | 0.5 | GO:0010370 | perinucleolar chromocenter(GO:0010370) |
| 0.2 | 1.4 | GO:0000125 | PCAF complex(GO:0000125) |
| 0.2 | 0.5 | GO:0043291 | RAVE complex(GO:0043291) |
| 0.2 | 4.6 | GO:0005680 | anaphase-promoting complex(GO:0005680) |
| 0.2 | 0.8 | GO:0005905 | clathrin-coated pit(GO:0005905) |
| 0.2 | 1.2 | GO:0030688 | preribosome, small subunit precursor(GO:0030688) |
| 0.2 | 6.0 | GO:0005762 | organellar large ribosomal subunit(GO:0000315) mitochondrial large ribosomal subunit(GO:0005762) |
| 0.1 | 6.1 | GO:0070161 | adherens junction(GO:0005912) anchoring junction(GO:0070161) |
| 0.1 | 0.4 | GO:0031515 | tRNA (m1A) methyltransferase complex(GO:0031515) |
| 0.1 | 1.0 | GO:0042719 | mitochondrial intermembrane space protein transporter complex(GO:0042719) |
| 0.1 | 5.2 | GO:0045178 | basal part of cell(GO:0045178) |
| 0.1 | 1.0 | GO:0072669 | tRNA-splicing ligase complex(GO:0072669) |
| 0.1 | 9.3 | GO:0012507 | ER to Golgi transport vesicle membrane(GO:0012507) |
| 0.1 | 2.8 | GO:0005832 | chaperonin-containing T-complex(GO:0005832) |
| 0.1 | 1.2 | GO:0042382 | paraspeckles(GO:0042382) |
| 0.1 | 0.4 | GO:0097013 | phagocytic vesicle lumen(GO:0097013) |
| 0.1 | 1.3 | GO:0042599 | lamellar body(GO:0042599) |
| 0.1 | 0.8 | GO:0070545 | PeBoW complex(GO:0070545) |
| 0.1 | 0.1 | GO:0070761 | pre-snoRNP complex(GO:0070761) |
| 0.1 | 0.1 | GO:0042581 | specific granule(GO:0042581) |
| 0.1 | 1.0 | GO:0005787 | signal peptidase complex(GO:0005787) |
| 0.1 | 1.0 | GO:0016593 | Cdc73/Paf1 complex(GO:0016593) |
| 0.1 | 2.9 | GO:0008180 | COP9 signalosome(GO:0008180) |
| 0.1 | 0.4 | GO:0097440 | apical dendrite(GO:0097440) |
| 0.1 | 0.7 | GO:0009897 | external side of plasma membrane(GO:0009897) |
| 0.1 | 0.4 | GO:0030904 | retromer complex(GO:0030904) |
| 0.1 | 2.2 | GO:0005852 | eukaryotic translation initiation factor 3 complex(GO:0005852) |
| 0.1 | 0.7 | GO:0000408 | EKC/KEOPS complex(GO:0000408) |
| 0.1 | 0.5 | GO:0070695 | FHF complex(GO:0070695) |
| 0.1 | 0.5 | GO:0030868 | smooth endoplasmic reticulum membrane(GO:0030868) smooth endoplasmic reticulum part(GO:0097425) |
| 0.1 | 1.5 | GO:0032432 | actin filament bundle(GO:0032432) |
| 0.1 | 0.5 | GO:0030123 | AP-3 adaptor complex(GO:0030123) |
| 0.1 | 0.5 | GO:0031510 | SUMO activating enzyme complex(GO:0031510) |
| 0.1 | 0.7 | GO:0043564 | Ku70:Ku80 complex(GO:0043564) |
| 0.1 | 3.3 | GO:0000314 | organellar small ribosomal subunit(GO:0000314) mitochondrial small ribosomal subunit(GO:0005763) |
| 0.1 | 0.5 | GO:0016533 | cyclin-dependent protein kinase 5 holoenzyme complex(GO:0016533) |
| 0.1 | 0.1 | GO:1902710 | GABA receptor complex(GO:1902710) |
| 0.1 | 0.8 | GO:0001740 | Barr body(GO:0001740) |
| 0.1 | 0.4 | GO:0098553 | integral component of lumenal side of endoplasmic reticulum membrane(GO:0071556) lumenal side of endoplasmic reticulum membrane(GO:0098553) |
| 0.1 | 1.9 | GO:0048786 | presynaptic active zone(GO:0048786) |
| 0.1 | 0.4 | GO:0042588 | zymogen granule(GO:0042588) |
| 0.1 | 2.2 | GO:0034709 | methylosome(GO:0034709) |
| 0.1 | 1.3 | GO:0000506 | glycosylphosphatidylinositol-N-acetylglucosaminyltransferase (GPI-GnT) complex(GO:0000506) |
| 0.1 | 1.0 | GO:0005911 | cell-cell junction(GO:0005911) |
| 0.1 | 0.6 | GO:0034388 | Pwp2p-containing subcomplex of 90S preribosome(GO:0034388) |
| 0.1 | 0.4 | GO:0000818 | nuclear MIS12/MIND complex(GO:0000818) |
| 0.1 | 0.4 | GO:0000242 | pericentriolar material(GO:0000242) |
| 0.1 | 8.5 | GO:0070469 | respiratory chain(GO:0070469) |
| 0.1 | 1.8 | GO:0005801 | cis-Golgi network(GO:0005801) |
| 0.1 | 0.5 | GO:0043625 | delta DNA polymerase complex(GO:0043625) |
| 0.1 | 25.7 | GO:0098857 | membrane raft(GO:0045121) membrane microdomain(GO:0098857) |
| 0.1 | 0.4 | GO:0033597 | mitotic checkpoint complex(GO:0033597) bub1-bub3 complex(GO:1990298) |
| 0.1 | 0.1 | GO:0000177 | cytoplasmic exosome (RNase complex)(GO:0000177) |
| 0.1 | 0.7 | GO:0044327 | dendritic spine head(GO:0044327) |
| 0.1 | 0.4 | GO:0043511 | inhibin complex(GO:0043511) inhibin A complex(GO:0043512) |
| 0.1 | 0.6 | GO:0032045 | guanyl-nucleotide exchange factor complex(GO:0032045) |
| 0.1 | 0.8 | GO:1990452 | Parkin-FBXW7-Cul1 ubiquitin ligase complex(GO:1990452) |
| 0.1 | 0.2 | GO:0070419 | nonhomologous end joining complex(GO:0070419) |
| 0.1 | 0.3 | GO:0030677 | ribonuclease P complex(GO:0030677) |
| 0.1 | 0.4 | GO:0033018 | sarcoplasmic reticulum lumen(GO:0033018) |
| 0.1 | 0.5 | GO:0031501 | mannosyltransferase complex(GO:0031501) |
| 0.1 | 0.5 | GO:0005602 | complement component C1 complex(GO:0005602) |
| 0.1 | 10.5 | GO:0031901 | early endosome membrane(GO:0031901) |
| 0.1 | 11.0 | GO:0048471 | perinuclear region of cytoplasm(GO:0048471) |
| 0.1 | 0.6 | GO:0043240 | Fanconi anaemia nuclear complex(GO:0043240) |
| 0.1 | 0.4 | GO:0031436 | BRCA1-BARD1 complex(GO:0031436) |
| 0.1 | 0.7 | GO:0034663 | endoplasmic reticulum chaperone complex(GO:0034663) |
| 0.1 | 0.5 | GO:0035061 | interchromatin granule(GO:0035061) |
| 0.1 | 1.6 | GO:0030014 | CCR4-NOT complex(GO:0030014) |
| 0.1 | 0.3 | GO:0008282 | ATP-sensitive potassium channel complex(GO:0008282) |
| 0.1 | 1.0 | GO:0005884 | actin filament(GO:0005884) |
| 0.1 | 0.2 | GO:0031088 | platelet dense granule membrane(GO:0031088) |
| 0.1 | 0.1 | GO:0016461 | unconventional myosin complex(GO:0016461) |
| 0.1 | 3.6 | GO:1904724 | tertiary granule lumen(GO:1904724) |
| 0.1 | 0.1 | GO:0070938 | contractile ring(GO:0070938) |
| 0.1 | 0.2 | GO:0005736 | DNA-directed RNA polymerase I complex(GO:0005736) |
| 0.1 | 0.3 | GO:0046696 | lipopolysaccharide receptor complex(GO:0046696) |
| 0.1 | 0.6 | GO:0036452 | ESCRT complex(GO:0036452) |
| 0.1 | 0.4 | GO:0071001 | U4/U6 snRNP(GO:0071001) |
| 0.1 | 0.8 | GO:0034464 | BBSome(GO:0034464) |
| 0.1 | 0.4 | GO:1990130 | Iml1 complex(GO:1990130) |
| 0.1 | 0.8 | GO:0032039 | integrator complex(GO:0032039) |
| 0.1 | 0.6 | GO:0019774 | proteasome core complex, beta-subunit complex(GO:0019774) |
| 0.1 | 0.4 | GO:1904115 | axon cytoplasm(GO:1904115) |
| 0.1 | 0.7 | GO:0043194 | axon initial segment(GO:0043194) |
| 0.1 | 0.6 | GO:0030870 | Mre11 complex(GO:0030870) |
| 0.1 | 0.2 | GO:0048500 | signal recognition particle(GO:0048500) |
| 0.1 | 0.2 | GO:0044294 | dendritic growth cone(GO:0044294) |
| 0.1 | 0.3 | GO:0044194 | cytolytic granule(GO:0044194) |
| 0.1 | 0.3 | GO:0000800 | lateral element(GO:0000800) |
| 0.1 | 0.8 | GO:0036454 | insulin-like growth factor binding protein complex(GO:0016942) growth factor complex(GO:0036454) |
| 0.1 | 0.6 | GO:0070531 | BRCA1-A complex(GO:0070531) |
| 0.1 | 0.6 | GO:0034451 | centriolar satellite(GO:0034451) |
| 0.1 | 0.7 | GO:0005875 | microtubule associated complex(GO:0005875) |
| 0.1 | 0.2 | GO:0030119 | AP-type membrane coat adaptor complex(GO:0030119) |
| 0.1 | 0.2 | GO:0034686 | integrin alphav-beta8 complex(GO:0034686) |
| 0.1 | 1.5 | GO:0032281 | AMPA glutamate receptor complex(GO:0032281) |
| 0.1 | 7.5 | GO:0101002 | ficolin-1-rich granule(GO:0101002) ficolin-1-rich granule lumen(GO:1904813) |
| 0.1 | 9.4 | GO:0001726 | ruffle(GO:0001726) |
| 0.1 | 0.6 | GO:0034719 | SMN-Sm protein complex(GO:0034719) |
| 0.1 | 0.7 | GO:0097550 | transcriptional preinitiation complex(GO:0097550) |
| 0.1 | 0.3 | GO:0044613 | nuclear pore central transport channel(GO:0044613) |
| 0.1 | 0.7 | GO:0043073 | germ cell nucleus(GO:0043073) |
| 0.1 | 0.2 | GO:0033186 | CAF-1 complex(GO:0033186) |
| 0.1 | 0.4 | GO:0044614 | nuclear pore cytoplasmic filaments(GO:0044614) |
| 0.1 | 1.2 | GO:0031304 | intrinsic component of mitochondrial inner membrane(GO:0031304) integral component of mitochondrial inner membrane(GO:0031305) |
| 0.1 | 2.9 | GO:0045111 | intermediate filament cytoskeleton(GO:0045111) |
| 0.1 | 1.5 | GO:0030315 | T-tubule(GO:0030315) |
| 0.1 | 3.6 | GO:0042571 | immunoglobulin complex, circulating(GO:0042571) |
| 0.1 | 0.5 | GO:0097546 | ciliary base(GO:0097546) |
| 0.1 | 1.5 | GO:0016235 | aggresome(GO:0016235) |
| 0.1 | 4.4 | GO:0015934 | large ribosomal subunit(GO:0015934) |
| 0.1 | 1.5 | GO:0043209 | myelin sheath(GO:0043209) |
| 0.1 | 0.5 | GO:0031298 | replication fork protection complex(GO:0031298) |
| 0.1 | 0.9 | GO:0000930 | gamma-tubulin complex(GO:0000930) |
| 0.1 | 0.6 | GO:0071141 | SMAD protein complex(GO:0071141) |
| 0.1 | 0.4 | GO:0043196 | varicosity(GO:0043196) |
| 0.1 | 0.4 | GO:0030991 | intraciliary transport particle A(GO:0030991) |
| 0.1 | 0.4 | GO:0044298 | neuronal cell body membrane(GO:0032809) cell body membrane(GO:0044298) |
| 0.1 | 1.3 | GO:0032420 | stereocilium(GO:0032420) |
| 0.1 | 1.2 | GO:0016327 | apicolateral plasma membrane(GO:0016327) |
| 0.1 | 0.2 | GO:0005652 | nuclear lamina(GO:0005652) |
| 0.1 | 0.2 | GO:0032444 | activin responsive factor complex(GO:0032444) |
| 0.1 | 0.2 | GO:0030895 | apolipoprotein B mRNA editing enzyme complex(GO:0030895) |
| 0.1 | 1.4 | GO:0097381 | photoreceptor disc membrane(GO:0097381) |
| 0.1 | 1.3 | GO:0030687 | preribosome, large subunit precursor(GO:0030687) |
| 0.1 | 0.3 | GO:0032389 | MutLalpha complex(GO:0032389) |
| 0.1 | 0.9 | GO:0031618 | nuclear pericentric heterochromatin(GO:0031618) |
| 0.1 | 0.4 | GO:0016272 | prefoldin complex(GO:0016272) |
| 0.1 | 0.2 | GO:0030314 | junctional membrane complex(GO:0030314) |
| 0.1 | 2.6 | GO:0001669 | acrosomal vesicle(GO:0001669) |
| 0.1 | 0.7 | GO:0044306 | neuron projection terminus(GO:0044306) |
| 0.1 | 0.1 | GO:0001520 | outer dense fiber(GO:0001520) |
| 0.1 | 0.1 | GO:0016514 | SWI/SNF complex(GO:0016514) |
| 0.1 | 3.0 | GO:0015030 | Cajal body(GO:0015030) |
| 0.1 | 0.1 | GO:0000805 | X chromosome(GO:0000805) |
| 0.1 | 3.8 | GO:0017053 | transcriptional repressor complex(GO:0017053) |
| 0.1 | 0.6 | GO:0097542 | ciliary tip(GO:0097542) |
| 0.1 | 2.3 | GO:0030175 | filopodium(GO:0030175) |
| 0.1 | 0.2 | GO:0060198 | clathrin-sculpted vesicle(GO:0060198) |
| 0.1 | 0.4 | GO:0045239 | tricarboxylic acid cycle enzyme complex(GO:0045239) |
| 0.1 | 3.2 | GO:0005811 | lipid particle(GO:0005811) |
| 0.1 | 0.2 | GO:0033268 | node of Ranvier(GO:0033268) |
| 0.1 | 0.1 | GO:0043083 | synaptic cleft(GO:0043083) |
| 0.0 | 0.2 | GO:0035253 | ciliary rootlet(GO:0035253) |
| 0.0 | 1.1 | GO:0005776 | autophagosome(GO:0005776) |
| 0.0 | 0.7 | GO:0031012 | extracellular matrix(GO:0031012) |
| 0.0 | 0.1 | GO:0051233 | spindle midzone(GO:0051233) |
| 0.0 | 0.1 | GO:0070195 | growth hormone receptor complex(GO:0070195) |
| 0.0 | 0.6 | GO:0000164 | protein phosphatase type 1 complex(GO:0000164) |
| 0.0 | 6.2 | GO:0019898 | extrinsic component of membrane(GO:0019898) |
| 0.0 | 0.3 | GO:0097524 | sperm plasma membrane(GO:0097524) |
| 0.0 | 0.1 | GO:0071546 | pi-body(GO:0071546) |
| 0.0 | 0.4 | GO:0030126 | COPI vesicle coat(GO:0030126) |
| 0.0 | 0.5 | GO:0005689 | U12-type spliceosomal complex(GO:0005689) |
| 0.0 | 0.2 | GO:0032156 | septin cytoskeleton(GO:0032156) |
| 0.0 | 0.1 | GO:0033150 | perinuclear theca(GO:0033011) cytoskeletal calyx(GO:0033150) |
| 0.0 | 0.8 | GO:0000922 | spindle pole(GO:0000922) |
| 0.0 | 9.3 | GO:0005874 | microtubule(GO:0005874) |
| 0.0 | 1.9 | GO:0042641 | actomyosin(GO:0042641) |
| 0.0 | 0.3 | GO:0032391 | photoreceptor connecting cilium(GO:0032391) |
| 0.0 | 0.1 | GO:0071565 | nBAF complex(GO:0071565) |
| 0.0 | 9.9 | GO:0005578 | proteinaceous extracellular matrix(GO:0005578) |
| 0.0 | 0.3 | GO:0055038 | recycling endosome membrane(GO:0055038) |
| 0.0 | 1.8 | GO:0031252 | cell leading edge(GO:0031252) |
| 0.0 | 0.1 | GO:0033588 | Elongator holoenzyme complex(GO:0033588) |
| 0.0 | 0.1 | GO:0005968 | Rab-protein geranylgeranyltransferase complex(GO:0005968) |
| 0.0 | 0.1 | GO:0030894 | replisome(GO:0030894) nuclear replisome(GO:0043601) |
| 0.0 | 16.6 | GO:0016604 | nuclear body(GO:0016604) |
| 0.0 | 0.1 | GO:0005677 | chromatin silencing complex(GO:0005677) |
| 0.0 | 0.1 | GO:0097225 | sperm midpiece(GO:0097225) |
| 0.0 | 0.0 | GO:0097447 | dendritic tree(GO:0097447) |
| 0.0 | 0.3 | GO:0005671 | Ada2/Gcn5/Ada3 transcription activator complex(GO:0005671) |
| 0.0 | 0.1 | GO:0031233 | intrinsic component of external side of plasma membrane(GO:0031233) |
| 0.0 | 0.6 | GO:0043025 | neuronal cell body(GO:0043025) |
| 0.0 | 0.0 | GO:0014701 | junctional sarcoplasmic reticulum membrane(GO:0014701) |
| 0.0 | 0.4 | GO:0032040 | small-subunit processome(GO:0032040) |
| 0.0 | 0.0 | GO:0034673 | inhibin-betaglycan-ActRII complex(GO:0034673) |
| 0.0 | 0.0 | GO:0032806 | holo TFIIH complex(GO:0005675) carboxy-terminal domain protein kinase complex(GO:0032806) |
| 0.0 | 0.9 | GO:0044309 | neuron spine(GO:0044309) |
| 0.0 | 0.1 | GO:0043190 | ATP-binding cassette (ABC) transporter complex(GO:0043190) |
| 0.0 | 0.3 | GO:0030134 | ER to Golgi transport vesicle(GO:0030134) |
| 0.0 | 0.3 | GO:0000145 | exocyst(GO:0000145) |
| 0.0 | 0.1 | GO:0031466 | Cul5-RING ubiquitin ligase complex(GO:0031466) |
| 0.0 | 0.1 | GO:0044224 | juxtaparanode region of axon(GO:0044224) |
| 0.0 | 0.0 | GO:0070187 | telosome(GO:0070187) |
| 0.0 | 1.9 | GO:0031225 | anchored component of membrane(GO:0031225) |
| 0.0 | 0.1 | GO:0005851 | eukaryotic translation initiation factor 2B complex(GO:0005851) |
| 0.0 | 0.6 | GO:0010494 | cytoplasmic stress granule(GO:0010494) |
| 0.0 | 0.3 | GO:0008074 | guanylate cyclase complex, soluble(GO:0008074) |
| 0.0 | 0.0 | GO:0002139 | stereocilia coupling link(GO:0002139) |
| 0.0 | 0.0 | GO:0019814 | immunoglobulin complex(GO:0019814) |
| 0.0 | 0.5 | GO:0005929 | cilium(GO:0005929) |
| 0.0 | 0.1 | GO:0042555 | MCM complex(GO:0042555) |
| 0.0 | 0.0 | GO:0072559 | NLRP3 inflammasome complex(GO:0072559) |
Gene overrepresentation in C2:CP:REACTOME category:
| Log-likelihood per target | Total log-likelihood | Term | Description |
|---|---|---|---|
| 1.5 | 3.0 | REACTOME SOS MEDIATED SIGNALLING | Genes involved in SOS-mediated signalling |
| 1.2 | 4.9 | REACTOME SHC1 EVENTS IN EGFR SIGNALING | Genes involved in SHC1 events in EGFR signaling |
| 1.2 | 12.9 | REACTOME PURINE CATABOLISM | Genes involved in Purine catabolism |
| 1.1 | 32.2 | REACTOME HORMONE SENSITIVE LIPASE HSL MEDIATED TRIACYLGLYCEROL HYDROLYSIS | Genes involved in Hormone-sensitive lipase (HSL)-mediated triacylglycerol hydrolysis |
| 1.1 | 9.7 | REACTOME PYRIMIDINE CATABOLISM | Genes involved in Pyrimidine catabolism |
| 1.1 | 1.1 | REACTOME INTERACTIONS OF VPR WITH HOST CELLULAR PROTEINS | Genes involved in Interactions of Vpr with host cellular proteins |
| 1.1 | 7.4 | REACTOME RECEPTOR LIGAND BINDING INITIATES THE SECOND PROTEOLYTIC CLEAVAGE OF NOTCH RECEPTOR | Genes involved in Receptor-ligand binding initiates the second proteolytic cleavage of Notch receptor |
| 1.0 | 2.0 | REACTOME ACYL CHAIN REMODELLING OF PI | Genes involved in Acyl chain remodelling of PI |
| 0.9 | 0.9 | REACTOME MRNA DECAY BY 3 TO 5 EXORIBONUCLEASE | Genes involved in mRNA Decay by 3' to 5' Exoribonuclease |
| 0.9 | 28.9 | REACTOME ADHERENS JUNCTIONS INTERACTIONS | Genes involved in Adherens junctions interactions |
| 0.8 | 13.4 | REACTOME GAP JUNCTION ASSEMBLY | Genes involved in Gap junction assembly |
| 0.8 | 15.0 | REACTOME VEGF LIGAND RECEPTOR INTERACTIONS | Genes involved in VEGF ligand-receptor interactions |
| 0.8 | 66.4 | REACTOME CELL JUNCTION ORGANIZATION | Genes involved in Cell junction organization |
| 0.8 | 0.8 | REACTOME G ALPHA1213 SIGNALLING EVENTS | Genes involved in G alpha (12/13) signalling events |
| 0.7 | 27.0 | REACTOME DOWNREGULATION OF TGF BETA RECEPTOR SIGNALING | Genes involved in Downregulation of TGF-beta receptor signaling |
| 0.7 | 13.8 | REACTOME HYALURONAN UPTAKE AND DEGRADATION | Genes involved in Hyaluronan uptake and degradation |
| 0.6 | 3.9 | REACTOME ERKS ARE INACTIVATED | Genes involved in ERKs are inactivated |
| 0.6 | 6.2 | REACTOME ENDOSOMAL VACUOLAR PATHWAY | Genes involved in Endosomal/Vacuolar pathway |
| 0.6 | 22.8 | REACTOME SHC1 EVENTS IN ERBB4 SIGNALING | Genes involved in SHC1 events in ERBB4 signaling |
| 0.6 | 11.1 | REACTOME THE NLRP3 INFLAMMASOME | Genes involved in The NLRP3 inflammasome |
| 0.6 | 4.0 | REACTOME ABACAVIR TRANSPORT AND METABOLISM | Genes involved in Abacavir transport and metabolism |
| 0.6 | 9.7 | REACTOME ADENYLATE CYCLASE INHIBITORY PATHWAY | Genes involved in Adenylate cyclase inhibitory pathway |
| 0.6 | 15.6 | REACTOME PYRUVATE METABOLISM | Genes involved in Pyruvate metabolism |
| 0.6 | 6.6 | REACTOME NEF MEDIATED DOWNREGULATION OF MHC CLASS I COMPLEX CELL SURFACE EXPRESSION | Genes involved in Nef mediated downregulation of MHC class I complex cell surface expression |
| 0.5 | 16.7 | REACTOME FORMATION OF TUBULIN FOLDING INTERMEDIATES BY CCT TRIC | Genes involved in Formation of tubulin folding intermediates by CCT/TriC |
| 0.5 | 34.3 | REACTOME G1 PHASE | Genes involved in G1 Phase |
| 0.5 | 3.2 | REACTOME AQUAPORIN MEDIATED TRANSPORT | Genes involved in Aquaporin-mediated transport |
| 0.5 | 0.5 | REACTOME NEP NS2 INTERACTS WITH THE CELLULAR EXPORT MACHINERY | Genes involved in NEP/NS2 Interacts with the Cellular Export Machinery |
| 0.5 | 7.8 | REACTOME REVERSIBLE HYDRATION OF CARBON DIOXIDE | Genes involved in Reversible Hydration of Carbon Dioxide |
| 0.5 | 2.1 | REACTOME NFKB ACTIVATION THROUGH FADD RIP1 PATHWAY MEDIATED BY CASPASE 8 AND10 | Genes involved in NF-kB activation through FADD/RIP-1 pathway mediated by caspase-8 and -10 |
| 0.5 | 23.9 | REACTOME G ALPHA Z SIGNALLING EVENTS | Genes involved in G alpha (z) signalling events |
| 0.5 | 10.7 | REACTOME ACTIVATION OF RAC | Genes involved in Activation of Rac |
| 0.5 | 2.4 | REACTOME SEMA3A PAK DEPENDENT AXON REPULSION | Genes involved in Sema3A PAK dependent Axon repulsion |
| 0.4 | 3.1 | REACTOME ADP SIGNALLING THROUGH P2RY1 | Genes involved in ADP signalling through P2Y purinoceptor 1 |
| 0.4 | 7.1 | REACTOME ACTIVATION OF IRF3 IRF7 MEDIATED BY TBK1 IKK EPSILON | Genes involved in Activation of IRF3/IRF7 mediated by TBK1/IKK epsilon |
| 0.4 | 0.9 | REACTOME TRANSFERRIN ENDOCYTOSIS AND RECYCLING | Genes involved in Transferrin endocytosis and recycling |
| 0.4 | 5.3 | REACTOME GAP JUNCTION DEGRADATION | Genes involved in Gap junction degradation |
| 0.4 | 10.6 | REACTOME REGULATION OF AMPK ACTIVITY VIA LKB1 | Genes involved in Regulation of AMPK activity via LKB1 |
| 0.4 | 2.6 | REACTOME CROSS PRESENTATION OF SOLUBLE EXOGENOUS ANTIGENS ENDOSOMES | Genes involved in Cross-presentation of soluble exogenous antigens (endosomes) |
| 0.4 | 7.3 | REACTOME SYNTHESIS SECRETION AND DEACYLATION OF GHRELIN | Genes involved in Synthesis, Secretion, and Deacylation of Ghrelin |
| 0.4 | 13.3 | REACTOME LYSOSOME VESICLE BIOGENESIS | Genes involved in Lysosome Vesicle Biogenesis |
| 0.4 | 11.9 | REACTOME INSULIN RECEPTOR RECYCLING | Genes involved in Insulin receptor recycling |
| 0.4 | 3.0 | REACTOME TANDEM PORE DOMAIN POTASSIUM CHANNELS | Genes involved in Tandem pore domain potassium channels |
| 0.4 | 4.6 | REACTOME SYNTHESIS OF PIPS AT THE GOLGI MEMBRANE | Genes involved in Synthesis of PIPs at the Golgi membrane |
| 0.4 | 4.1 | REACTOME VIF MEDIATED DEGRADATION OF APOBEC3G | Genes involved in Vif-mediated degradation of APOBEC3G |
| 0.4 | 2.4 | REACTOME SPRY REGULATION OF FGF SIGNALING | Genes involved in Spry regulation of FGF signaling |
| 0.4 | 7.0 | REACTOME NOREPINEPHRINE NEUROTRANSMITTER RELEASE CYCLE | Genes involved in Norepinephrine Neurotransmitter Release Cycle |
| 0.4 | 13.0 | REACTOME RECYCLING PATHWAY OF L1 | Genes involved in Recycling pathway of L1 |
| 0.4 | 1.1 | REACTOME TGF BETA RECEPTOR SIGNALING ACTIVATES SMADS | Genes involved in TGF-beta receptor signaling activates SMADs |
| 0.4 | 10.0 | REACTOME METABOLISM OF PORPHYRINS | Genes involved in Metabolism of porphyrins |
| 0.4 | 8.7 | REACTOME FORMATION OF INCISION COMPLEX IN GG NER | Genes involved in Formation of incision complex in GG-NER |
| 0.4 | 7.3 | REACTOME INSULIN SYNTHESIS AND PROCESSING | Genes involved in Insulin Synthesis and Processing |
| 0.3 | 10.8 | REACTOME CHOLESTEROL BIOSYNTHESIS | Genes involved in Cholesterol biosynthesis |
| 0.3 | 4.8 | REACTOME SYNTHESIS OF PIPS AT THE EARLY ENDOSOME MEMBRANE | Genes involved in Synthesis of PIPs at the early endosome membrane |
| 0.3 | 6.1 | REACTOME SIGNALING BY HIPPO | Genes involved in Signaling by Hippo |
| 0.3 | 21.0 | REACTOME SMOOTH MUSCLE CONTRACTION | Genes involved in Smooth Muscle Contraction |
| 0.3 | 0.3 | REACTOME ALPHA LINOLENIC ACID ALA METABOLISM | Genes involved in alpha-linolenic acid (ALA) metabolism |
| 0.3 | 6.7 | REACTOME PYRIMIDINE METABOLISM | Genes involved in Pyrimidine metabolism |
| 0.3 | 6.7 | REACTOME ENDOSOMAL SORTING COMPLEX REQUIRED FOR TRANSPORT ESCRT | Genes involved in Endosomal Sorting Complex Required For Transport (ESCRT) |
| 0.3 | 4.7 | REACTOME APOPTOTIC CLEAVAGE OF CELL ADHESION PROTEINS | Genes involved in Apoptotic cleavage of cell adhesion proteins |
| 0.3 | 8.1 | REACTOME CASPASE MEDIATED CLEAVAGE OF CYTOSKELETAL PROTEINS | Genes involved in Caspase-mediated cleavage of cytoskeletal proteins |
| 0.3 | 1.9 | REACTOME ACTIVATED TAK1 MEDIATES P38 MAPK ACTIVATION | Genes involved in activated TAK1 mediates p38 MAPK activation |
| 0.3 | 7.9 | REACTOME DESTABILIZATION OF MRNA BY KSRP | Genes involved in Destabilization of mRNA by KSRP |
| 0.3 | 2.7 | REACTOME PREFOLDIN MEDIATED TRANSFER OF SUBSTRATE TO CCT TRIC | Genes involved in Prefoldin mediated transfer of substrate to CCT/TriC |
| 0.3 | 24.6 | REACTOME CYCLIN E ASSOCIATED EVENTS DURING G1 S TRANSITION | Genes involved in Cyclin E associated events during G1/S transition |
| 0.3 | 12.0 | REACTOME O LINKED GLYCOSYLATION OF MUCINS | Genes involved in O-linked glycosylation of mucins |
| 0.3 | 1.7 | REACTOME SCF BETA TRCP MEDIATED DEGRADATION OF EMI1 | Genes involved in SCF-beta-TrCP mediated degradation of Emi1 |
| 0.3 | 3.9 | REACTOME GLOBAL GENOMIC NER GG NER | Genes involved in Global Genomic NER (GG-NER) |
| 0.3 | 4.4 | REACTOME CHONDROITIN SULFATE DERMATAN SULFATE METABOLISM | Genes involved in Chondroitin sulfate/dermatan sulfate metabolism |
| 0.3 | 6.0 | REACTOME SIGNALING BY NODAL | Genes involved in Signaling by NODAL |
| 0.3 | 20.6 | REACTOME INTERFERON GAMMA SIGNALING | Genes involved in Interferon gamma signaling |
| 0.3 | 6.5 | REACTOME PROTEOLYTIC CLEAVAGE OF SNARE COMPLEX PROTEINS | Genes involved in Proteolytic cleavage of SNARE complex proteins |
| 0.3 | 11.0 | REACTOME COLLAGEN FORMATION | Genes involved in Collagen formation |
| 0.3 | 3.9 | REACTOME PLATELET ADHESION TO EXPOSED COLLAGEN | Genes involved in Platelet Adhesion to exposed collagen |
| 0.3 | 2.1 | REACTOME INHIBITION OF INSULIN SECRETION BY ADRENALINE NORADRENALINE | Genes involved in Inhibition of Insulin Secretion by Adrenaline/Noradrenaline |
| 0.3 | 1.8 | REACTOME DOUBLE STRAND BREAK REPAIR | Genes involved in Double-Strand Break Repair |
| 0.3 | 4.5 | REACTOME ACTIVATION OF BH3 ONLY PROTEINS | Genes involved in Activation of BH3-only proteins |
| 0.2 | 8.1 | REACTOME SIGNALING BY BMP | Genes involved in Signaling by BMP |
| 0.2 | 6.0 | REACTOME SIGNAL REGULATORY PROTEIN SIRP FAMILY INTERACTIONS | Genes involved in Signal regulatory protein (SIRP) family interactions |
| 0.2 | 1.4 | REACTOME JNK C JUN KINASES PHOSPHORYLATION AND ACTIVATION MEDIATED BY ACTIVATED HUMAN TAK1 | Genes involved in JNK (c-Jun kinases) phosphorylation and activation mediated by activated human TAK1 |
| 0.2 | 4.0 | REACTOME DESTABILIZATION OF MRNA BY AUF1 HNRNP D0 | Genes involved in Destabilization of mRNA by AUF1 (hnRNP D0) |
| 0.2 | 5.4 | REACTOME ADVANCED GLYCOSYLATION ENDPRODUCT RECEPTOR SIGNALING | Genes involved in Advanced glycosylation endproduct receptor signaling |
| 0.2 | 4.4 | REACTOME EXTENSION OF TELOMERES | Genes involved in Extension of Telomeres |
| 0.2 | 3.2 | REACTOME MTORC1 MEDIATED SIGNALLING | Genes involved in mTORC1-mediated signalling |
| 0.2 | 2.5 | REACTOME SIGNALING BY NOTCH2 | Genes involved in Signaling by NOTCH2 |
| 0.2 | 5.8 | REACTOME APOPTOTIC CLEAVAGE OF CELLULAR PROTEINS | Genes involved in Apoptotic cleavage of cellular proteins |
| 0.2 | 0.9 | REACTOME SIGNAL AMPLIFICATION | Genes involved in Signal amplification |
| 0.2 | 2.2 | REACTOME REGULATION OF INSULIN SECRETION BY GLUCAGON LIKE PEPTIDE1 | Genes involved in Regulation of Insulin Secretion by Glucagon-like Peptide-1 |
| 0.2 | 5.7 | REACTOME SIGNALING BY ROBO RECEPTOR | Genes involved in Signaling by Robo receptor |
| 0.2 | 6.1 | REACTOME BASIGIN INTERACTIONS | Genes involved in Basigin interactions |
| 0.2 | 8.5 | REACTOME METABOLISM OF STEROID HORMONES AND VITAMINS A AND D | Genes involved in Metabolism of steroid hormones and vitamins A and D |
| 0.2 | 4.8 | REACTOME FORMATION OF ATP BY CHEMIOSMOTIC COUPLING | Genes involved in Formation of ATP by chemiosmotic coupling |
| 0.2 | 8.4 | REACTOME SEMA4D IN SEMAPHORIN SIGNALING | Genes involved in Sema4D in semaphorin signaling |
| 0.2 | 6.0 | REACTOME NEGATIVE REGULATORS OF RIG I MDA5 SIGNALING | Genes involved in Negative regulators of RIG-I/MDA5 signaling |
| 0.2 | 4.0 | REACTOME FACILITATIVE NA INDEPENDENT GLUCOSE TRANSPORTERS | Genes involved in Facilitative Na+-independent glucose transporters |
| 0.2 | 2.5 | REACTOME ER PHAGOSOME PATHWAY | Genes involved in ER-Phagosome pathway |
| 0.2 | 2.9 | REACTOME CLASS C 3 METABOTROPIC GLUTAMATE PHEROMONE RECEPTORS | Genes involved in Class C/3 (Metabotropic glutamate/pheromone receptors) |
| 0.2 | 10.1 | REACTOME NCAM1 INTERACTIONS | Genes involved in NCAM1 interactions |
| 0.2 | 6.0 | REACTOME POST TRANSLATIONAL MODIFICATION SYNTHESIS OF GPI ANCHORED PROTEINS | Genes involved in Post-translational modification: synthesis of GPI-anchored proteins |
| 0.2 | 2.9 | REACTOME FGFR2C LIGAND BINDING AND ACTIVATION | Genes involved in FGFR2c ligand binding and activation |
| 0.2 | 9.8 | REACTOME MITOCHONDRIAL PROTEIN IMPORT | Genes involved in Mitochondrial Protein Import |
| 0.2 | 1.4 | REACTOME PROSTANOID LIGAND RECEPTORS | Genes involved in Prostanoid ligand receptors |
| 0.2 | 2.1 | REACTOME OXYGEN DEPENDENT PROLINE HYDROXYLATION OF HYPOXIA INDUCIBLE FACTOR ALPHA | Genes involved in Oxygen-dependent Proline Hydroxylation of Hypoxia-inducible Factor Alpha |
| 0.2 | 2.2 | REACTOME GLUCOSE TRANSPORT | Genes involved in Glucose transport |
| 0.2 | 1.2 | REACTOME POTASSIUM CHANNELS | Genes involved in Potassium Channels |
| 0.2 | 4.1 | REACTOME FORMATION OF TRANSCRIPTION COUPLED NER TC NER REPAIR COMPLEX | Genes involved in Formation of transcription-coupled NER (TC-NER) repair complex |
| 0.2 | 7.5 | REACTOME IL1 SIGNALING | Genes involved in Interleukin-1 signaling |
| 0.2 | 0.2 | REACTOME RETROGRADE NEUROTROPHIN SIGNALLING | Genes involved in Retrograde neurotrophin signalling |
| 0.2 | 1.2 | REACTOME ACTIVATION OF NF KAPPAB IN B CELLS | Genes involved in Activation of NF-kappaB in B Cells |
| 0.2 | 3.3 | REACTOME GROWTH HORMONE RECEPTOR SIGNALING | Genes involved in Growth hormone receptor signaling |
| 0.1 | 12.5 | REACTOME RESPIRATORY ELECTRON TRANSPORT | Genes involved in Respiratory electron transport |
| 0.1 | 2.2 | REACTOME SIGNALING BY CONSTITUTIVELY ACTIVE EGFR | Genes involved in Signaling by constitutively active EGFR |
| 0.1 | 4.0 | REACTOME RNA POL II TRANSCRIPTION PRE INITIATION AND PROMOTER OPENING | Genes involved in RNA Polymerase II Transcription Pre-Initiation And Promoter Opening |
| 0.1 | 2.9 | REACTOME ORGANIC CATION ANION ZWITTERION TRANSPORT | Genes involved in Organic cation/anion/zwitterion transport |
| 0.1 | 2.0 | REACTOME PASSIVE TRANSPORT BY AQUAPORINS | Genes involved in Passive Transport by Aquaporins |
| 0.1 | 0.6 | REACTOME BINDING AND ENTRY OF HIV VIRION | Genes involved in Binding and entry of HIV virion |
| 0.1 | 2.0 | REACTOME RECRUITMENT OF NUMA TO MITOTIC CENTROSOMES | Genes involved in Recruitment of NuMA to mitotic centrosomes |
| 0.1 | 11.9 | REACTOME CLASS B 2 SECRETIN FAMILY RECEPTORS | Genes involved in Class B/2 (Secretin family receptors) |
| 0.1 | 4.4 | REACTOME SPHINGOLIPID DE NOVO BIOSYNTHESIS | Genes involved in Sphingolipid de novo biosynthesis |
| 0.1 | 2.7 | REACTOME GLYCOGEN BREAKDOWN GLYCOGENOLYSIS | Genes involved in Glycogen breakdown (glycogenolysis) |
| 0.1 | 5.3 | REACTOME AMINE LIGAND BINDING RECEPTORS | Genes involved in Amine ligand-binding receptors |
| 0.1 | 1.7 | REACTOME ROLE OF SECOND MESSENGERS IN NETRIN1 SIGNALING | Genes involved in Role of second messengers in netrin-1 signaling |
| 0.1 | 0.5 | REACTOME TRAF3 DEPENDENT IRF ACTIVATION PATHWAY | Genes involved in TRAF3-dependent IRF activation pathway |
| 0.1 | 2.6 | REACTOME APC C CDC20 MEDIATED DEGRADATION OF CYCLIN B | Genes involved in APC/C:Cdc20 mediated degradation of Cyclin B |
| 0.1 | 2.3 | REACTOME CRMPS IN SEMA3A SIGNALING | Genes involved in CRMPs in Sema3A signaling |
| 0.1 | 0.5 | REACTOME DESTABILIZATION OF MRNA BY TRISTETRAPROLIN TTP | Genes involved in Destabilization of mRNA by Tristetraprolin (TTP) |
| 0.1 | 1.7 | REACTOME MRNA DECAY BY 5 TO 3 EXORIBONUCLEASE | Genes involved in mRNA Decay by 5' to 3' Exoribonuclease |
| 0.1 | 0.9 | REACTOME SIGNALLING TO P38 VIA RIT AND RIN | Genes involved in Signalling to p38 via RIT and RIN |
| 0.1 | 4.2 | REACTOME EXTRACELLULAR MATRIX ORGANIZATION | Genes involved in Extracellular matrix organization |
| 0.1 | 0.2 | REACTOME MEMBRANE BINDING AND TARGETTING OF GAG PROTEINS | Genes involved in Membrane binding and targetting of GAG proteins |
| 0.1 | 4.5 | REACTOME ACTIVATION OF ATR IN RESPONSE TO REPLICATION STRESS | Genes involved in Activation of ATR in response to replication stress |
| 0.1 | 4.0 | REACTOME GLUTATHIONE CONJUGATION | Genes involved in Glutathione conjugation |
| 0.1 | 0.3 | REACTOME GABA RECEPTOR ACTIVATION | Genes involved in GABA receptor activation |
| 0.1 | 2.5 | REACTOME NETRIN1 SIGNALING | Genes involved in Netrin-1 signaling |
| 0.1 | 6.5 | REACTOME P75 NTR RECEPTOR MEDIATED SIGNALLING | Genes involved in p75 NTR receptor-mediated signalling |
| 0.1 | 5.5 | REACTOME TRNA AMINOACYLATION | Genes involved in tRNA Aminoacylation |
| 0.1 | 13.8 | REACTOME ANTIGEN PROCESSING UBIQUITINATION PROTEASOME DEGRADATION | Genes involved in Antigen processing: Ubiquitination & Proteasome degradation |
| 0.1 | 6.4 | REACTOME HEPARAN SULFATE HEPARIN HS GAG METABOLISM | Genes involved in Heparan sulfate/heparin (HS-GAG) metabolism |
| 0.1 | 0.1 | REACTOME DSCAM INTERACTIONS | Genes involved in DSCAM interactions |
| 0.1 | 3.1 | REACTOME GABA A RECEPTOR ACTIVATION | Genes involved in GABA A receptor activation |
| 0.1 | 0.1 | REACTOME P130CAS LINKAGE TO MAPK SIGNALING FOR INTEGRINS | Genes involved in p130Cas linkage to MAPK signaling for integrins |
| 0.1 | 2.2 | REACTOME PURINE SALVAGE | Genes involved in Purine salvage |
| 0.1 | 2.6 | REACTOME INWARDLY RECTIFYING K CHANNELS | Genes involved in Inwardly rectifying K+ channels |
| 0.1 | 0.5 | REACTOME INHIBITION OF THE PROTEOLYTIC ACTIVITY OF APC C REQUIRED FOR THE ONSET OF ANAPHASE BY MITOTIC SPINDLE CHECKPOINT COMPONENTS | Genes involved in Inhibition of the proteolytic activity of APC/C required for the onset of anaphase by mitotic spindle checkpoint components |
| 0.1 | 2.1 | REACTOME NUCLEOTIDE LIKE PURINERGIC RECEPTORS | Genes involved in Nucleotide-like (purinergic) receptors |
| 0.1 | 2.0 | REACTOME EXTRINSIC PATHWAY FOR APOPTOSIS | Genes involved in Extrinsic Pathway for Apoptosis |
| 0.1 | 0.8 | REACTOME ACTIVATED AMPK STIMULATES FATTY ACID OXIDATION IN MUSCLE | Genes involved in Activated AMPK stimulates fatty-acid oxidation in muscle |
| 0.1 | 5.4 | REACTOME ANTIVIRAL MECHANISM BY IFN STIMULATED GENES | Genes involved in Antiviral mechanism by IFN-stimulated genes |
| 0.1 | 1.5 | REACTOME EARLY PHASE OF HIV LIFE CYCLE | Genes involved in Early Phase of HIV Life Cycle |
| 0.1 | 0.6 | REACTOME NEGATIVE REGULATION OF THE PI3K AKT NETWORK | Genes involved in Negative regulation of the PI3K/AKT network |
| 0.1 | 1.5 | REACTOME PRESYNAPTIC NICOTINIC ACETYLCHOLINE RECEPTORS | Genes involved in Presynaptic nicotinic acetylcholine receptors |
| 0.1 | 2.1 | REACTOME METABOLISM OF NON CODING RNA | Genes involved in Metabolism of non-coding RNA |
| 0.1 | 0.2 | REACTOME PLC BETA MEDIATED EVENTS | Genes involved in PLC beta mediated events |
| 0.1 | 1.4 | REACTOME RESOLUTION OF AP SITES VIA THE MULTIPLE NUCLEOTIDE PATCH REPLACEMENT PATHWAY | Genes involved in Resolution of AP sites via the multiple-nucleotide patch replacement pathway |
| 0.1 | 0.2 | REACTOME TRAF6 MEDIATED IRF7 ACTIVATION IN TLR7 8 OR 9 SIGNALING | Genes involved in TRAF6 mediated IRF7 activation in TLR7/8 or 9 signaling |
| 0.1 | 1.4 | REACTOME DEADENYLATION OF MRNA | Genes involved in Deadenylation of mRNA |
| 0.1 | 10.7 | REACTOME G ALPHA Q SIGNALLING EVENTS | Genes involved in G alpha (q) signalling events |
| 0.1 | 0.8 | REACTOME OPSINS | Genes involved in Opsins |
| 0.1 | 0.3 | REACTOME UNWINDING OF DNA | Genes involved in Unwinding of DNA |
| 0.1 | 1.1 | REACTOME ZINC TRANSPORTERS | Genes involved in Zinc transporters |
| 0.1 | 1.2 | REACTOME IONOTROPIC ACTIVITY OF KAINATE RECEPTORS | Genes involved in Ionotropic activity of Kainate Receptors |
| 0.1 | 0.1 | REACTOME ERK MAPK TARGETS | Genes involved in ERK/MAPK targets |
| 0.1 | 1.5 | REACTOME KINESINS | Genes involved in Kinesins |
| 0.1 | 0.4 | REACTOME ACETYLCHOLINE NEUROTRANSMITTER RELEASE CYCLE | Genes involved in Acetylcholine Neurotransmitter Release Cycle |
| 0.1 | 0.8 | REACTOME TIE2 SIGNALING | Genes involved in Tie2 Signaling |
| 0.1 | 1.6 | REACTOME HOST INTERACTIONS OF HIV FACTORS | Genes involved in Host Interactions of HIV factors |
| 0.1 | 1.3 | REACTOME RNA POL III TRANSCRIPTION TERMINATION | Genes involved in RNA Polymerase III Transcription Termination |
| 0.1 | 2.2 | REACTOME TRANSPORT OF MATURE TRANSCRIPT TO CYTOPLASM | Genes involved in Transport of Mature Transcript to Cytoplasm |
| 0.1 | 0.5 | REACTOME REGULATION OF MRNA STABILITY BY PROTEINS THAT BIND AU RICH ELEMENTS | Genes involved in Regulation of mRNA Stability by Proteins that Bind AU-rich Elements |
| 0.1 | 2.9 | REACTOME VOLTAGE GATED POTASSIUM CHANNELS | Genes involved in Voltage gated Potassium channels |
| 0.1 | 0.8 | REACTOME TRAFFICKING OF GLUR2 CONTAINING AMPA RECEPTORS | Genes involved in Trafficking of GluR2-containing AMPA receptors |
| 0.1 | 0.4 | REACTOME INFLUENZA VIRAL RNA TRANSCRIPTION AND REPLICATION | Genes involved in Influenza Viral RNA Transcription and Replication |
| 0.1 | 0.9 | REACTOME PLATELET CALCIUM HOMEOSTASIS | Genes involved in Platelet calcium homeostasis |
| 0.1 | 0.3 | REACTOME MRNA CAPPING | Genes involved in mRNA Capping |
| 0.0 | 0.5 | REACTOME BETA DEFENSINS | Genes involved in Beta defensins |
| 0.0 | 0.8 | REACTOME RECYCLING OF BILE ACIDS AND SALTS | Genes involved in Recycling of bile acids and salts |
| 0.0 | 0.3 | REACTOME PROLONGED ERK ACTIVATION EVENTS | Genes involved in Prolonged ERK activation events |
| 0.0 | 1.0 | REACTOME NA CL DEPENDENT NEUROTRANSMITTER TRANSPORTERS | Genes involved in Na+/Cl- dependent neurotransmitter transporters |
| 0.0 | 0.3 | REACTOME UNBLOCKING OF NMDA RECEPTOR GLUTAMATE BINDING AND ACTIVATION | Genes involved in Unblocking of NMDA receptor, glutamate binding and activation |
| 0.0 | 2.5 | REACTOME CHEMOKINE RECEPTORS BIND CHEMOKINES | Genes involved in Chemokine receptors bind chemokines |
| 0.0 | 0.6 | REACTOME INTRINSIC PATHWAY FOR APOPTOSIS | Genes involved in Intrinsic Pathway for Apoptosis |
| 0.0 | 0.5 | REACTOME THE ACTIVATION OF ARYLSULFATASES | Genes involved in The activation of arylsulfatases |
| 0.0 | 0.5 | REACTOME PRE NOTCH TRANSCRIPTION AND TRANSLATION | Genes involved in Pre-NOTCH Transcription and Translation |
| 0.0 | 0.4 | REACTOME REGULATION OF ORNITHINE DECARBOXYLASE ODC | Genes involved in Regulation of ornithine decarboxylase (ODC) |
| 0.0 | 0.3 | REACTOME YAP1 AND WWTR1 TAZ STIMULATED GENE EXPRESSION | Genes involved in YAP1- and WWTR1 (TAZ)-stimulated gene expression |
| 0.0 | 0.3 | REACTOME INFLAMMASOMES | Genes involved in Inflammasomes |
| 0.0 | 0.5 | REACTOME HORMONE LIGAND BINDING RECEPTORS | Genes involved in Hormone ligand-binding receptors |
| 0.0 | 0.5 | REACTOME NEPHRIN INTERACTIONS | Genes involved in Nephrin interactions |
| 0.0 | 4.2 | REACTOME SIGNALING BY RHO GTPASES | Genes involved in Signaling by Rho GTPases |
| 0.0 | 2.6 | REACTOME MHC CLASS II ANTIGEN PRESENTATION | Genes involved in MHC class II antigen presentation |
| 0.0 | 0.4 | REACTOME DIGESTION OF DIETARY CARBOHYDRATE | Genes involved in Digestion of dietary carbohydrate |
| 0.0 | 1.1 | REACTOME DARPP 32 EVENTS | Genes involved in DARPP-32 events |
| 0.0 | 0.0 | REACTOME TRANSLOCATION OF ZAP 70 TO IMMUNOLOGICAL SYNAPSE | Genes involved in Translocation of ZAP-70 to Immunological synapse |
| 0.0 | 0.8 | REACTOME ACYL CHAIN REMODELLING OF PE | Genes involved in Acyl chain remodelling of PE |
| 0.0 | 0.7 | REACTOME GLUCURONIDATION | Genes involved in Glucuronidation |
| 0.0 | 0.1 | REACTOME BILE ACID AND BILE SALT METABOLISM | Genes involved in Bile acid and bile salt metabolism |
| 0.0 | 0.1 | REACTOME REGULATION OF HYPOXIA INDUCIBLE FACTOR HIF BY OXYGEN | Genes involved in Regulation of Hypoxia-inducible Factor (HIF) by Oxygen |
| 0.0 | 0.1 | REACTOME ACYL CHAIN REMODELLING OF PC | Genes involved in Acyl chain remodelling of PC |
| 0.0 | 1.2 | REACTOME INTERFERON SIGNALING | Genes involved in Interferon Signaling |
| 0.0 | 1.2 | REACTOME OLFACTORY SIGNALING PATHWAY | Genes involved in Olfactory Signaling Pathway |
| 0.0 | 0.4 | REACTOME OTHER SEMAPHORIN INTERACTIONS | Genes involved in Other semaphorin interactions |
| 0.0 | 0.2 | REACTOME LIGAND GATED ION CHANNEL TRANSPORT | Genes involved in Ligand-gated ion channel transport |
| 0.0 | 0.0 | REACTOME DOWNSTREAM TCR SIGNALING | Genes involved in Downstream TCR signaling |
| 0.0 | 0.0 | REACTOME DOWNSTREAM SIGNALING EVENTS OF B CELL RECEPTOR BCR | Genes involved in Downstream Signaling Events Of B Cell Receptor (BCR) |
| 0.0 | 0.3 | REACTOME P38MAPK EVENTS | Genes involved in p38MAPK events |
| 0.0 | 0.1 | REACTOME PD1 SIGNALING | Genes involved in PD-1 signaling |
| 0.0 | 0.0 | REACTOME REGULATION OF INSULIN SECRETION BY ACETYLCHOLINE | Genes involved in Regulation of Insulin Secretion by Acetylcholine |
| 0.0 | 0.0 | REACTOME SIGNAL ATTENUATION | Genes involved in Signal attenuation |
| 0.0 | 1.3 | REACTOME IMMUNOREGULATORY INTERACTIONS BETWEEN A LYMPHOID AND A NON LYMPHOID CELL | Genes involved in Immunoregulatory interactions between a Lymphoid and a non-Lymphoid cell |
| 0.0 | 0.4 | REACTOME RNA POL I TRANSCRIPTION | Genes involved in RNA Polymerase I Transcription |