Project
ENCODE cell lines, expression (Ernst 2011)
Navigation
Downloads
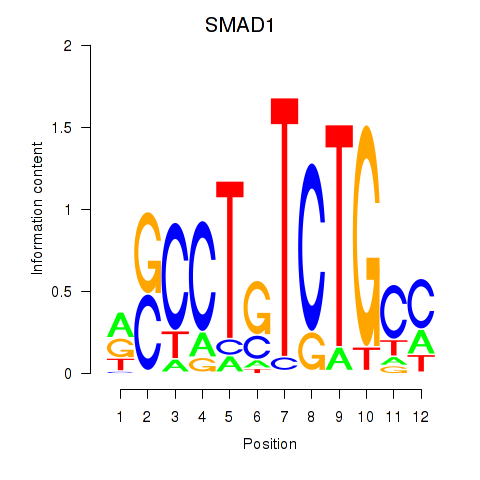
Results for SMAD1
Z-value: 2.46
Motif logo
Transcription factors associated with SMAD1
| Gene Symbol | Gene ID | Gene Info |
|---|---|---|
|
SMAD1
|
ENSG00000170365.5 | SMAD1 |
Activity-expression correlation:
| Gene | Promoter | Pearson corr. coef. | P-value | Plot |
|---|---|---|---|---|
| SMAD1 | hg19_v2_chr4_+_146402925_146402957 | 0.12 | 6.5e-01 | Click! |
Activity profile of SMAD1 motif
Sorted Z-values of SMAD1 motif
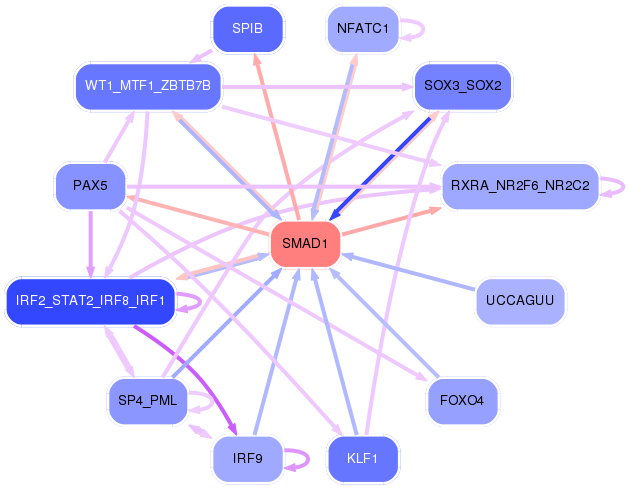
Network of associatons between targets according to the STRING database.

First level regulatory network of SMAD1
| Promoter | Score | Transcript | Gene | Gene Info |
|---|---|---|---|---|
| chr2_+_102608306 | 13.21 |
ENST00000332549.3 |
IL1R2 |
interleukin 1 receptor, type II |
| chr6_-_33048483 | 8.00 |
ENST00000419277.1 |
HLA-DPA1 |
major histocompatibility complex, class II, DP alpha 1 |
| chr14_-_106209368 | 7.18 |
ENST00000390548.2 ENST00000390549.2 ENST00000390542.2 |
IGHG1 |
immunoglobulin heavy constant gamma 1 (G1m marker) |
| chr22_+_23077065 | 5.89 |
ENST00000390310.2 |
IGLV2-18 |
immunoglobulin lambda variable 2-18 |
| chr18_-_11148587 | 5.38 |
ENST00000302079.6 ENST00000580640.1 ENST00000503781.3 |
PIEZO2 |
piezo-type mechanosensitive ion channel component 2 |
| chr11_+_121461097 | 5.17 |
ENST00000527934.1 |
SORL1 |
sortilin-related receptor, L(DLR class) A repeats containing |
| chr22_+_23040274 | 4.91 |
ENST00000390306.2 |
IGLV2-23 |
immunoglobulin lambda variable 2-23 |
| chr22_+_23247030 | 4.91 |
ENST00000390324.2 |
IGLJ3 |
immunoglobulin lambda joining 3 |
| chr14_-_106111127 | 4.78 |
ENST00000390545.2 |
IGHG2 |
immunoglobulin heavy constant gamma 2 (G2m marker) |
| chr14_-_106092403 | 4.56 |
ENST00000390543.2 |
IGHG4 |
immunoglobulin heavy constant gamma 4 (G4m marker) |
| chr22_+_23241661 | 4.53 |
ENST00000390322.2 |
IGLJ2 |
immunoglobulin lambda joining 2 |
| chr14_-_106237742 | 4.49 |
ENST00000390551.2 |
IGHG3 |
immunoglobulin heavy constant gamma 3 (G3m marker) |
| chr21_-_46330545 | 4.45 |
ENST00000320216.6 ENST00000397852.1 |
ITGB2 |
integrin, beta 2 (complement component 3 receptor 3 and 4 subunit) |
| chr22_+_23134974 | 4.32 |
ENST00000390314.2 |
IGLV2-11 |
immunoglobulin lambda variable 2-11 |
| chr15_+_89181974 | 4.21 |
ENST00000306072.5 |
ISG20 |
interferon stimulated exonuclease gene 20kDa |
| chr6_+_33043703 | 4.14 |
ENST00000418931.2 ENST00000535465.1 |
HLA-DPB1 |
major histocompatibility complex, class II, DP beta 1 |
| chr22_+_23264766 | 4.05 |
ENST00000390331.2 |
IGLC7 |
immunoglobulin lambda constant 7 |
| chr19_+_4229495 | 3.96 |
ENST00000221847.5 |
EBI3 |
Epstein-Barr virus induced 3 |
| chr2_+_102624977 | 3.66 |
ENST00000441002.1 |
IL1R2 |
interleukin 1 receptor, type II |
| chr6_+_33048222 | 3.63 |
ENST00000428835.1 |
HLA-DPB1 |
major histocompatibility complex, class II, DP beta 1 |
| chr6_-_31239846 | 3.58 |
ENST00000415537.1 ENST00000376228.5 ENST00000383329.3 |
HLA-C |
major histocompatibility complex, class I, C |
| chr6_+_29910301 | 3.42 |
ENST00000376809.5 ENST00000376802.2 |
HLA-A |
major histocompatibility complex, class I, A |
| chr15_+_89182178 | 3.42 |
ENST00000559876.1 |
ISG20 |
interferon stimulated exonuclease gene 20kDa |
| chr15_+_89182156 | 3.35 |
ENST00000379224.5 |
ISG20 |
interferon stimulated exonuclease gene 20kDa |
| chr3_+_53195136 | 3.26 |
ENST00000394729.2 ENST00000330452.3 |
PRKCD |
protein kinase C, delta |
| chr6_+_32709119 | 3.25 |
ENST00000374940.3 |
HLA-DQA2 |
major histocompatibility complex, class II, DQ alpha 2 |
| chr14_-_106692191 | 3.18 |
ENST00000390607.2 |
IGHV3-21 |
immunoglobulin heavy variable 3-21 |
| chr6_-_29527702 | 3.17 |
ENST00000377050.4 |
UBD |
ubiquitin D |
| chr19_+_49838653 | 3.11 |
ENST00000598095.1 ENST00000426897.2 ENST00000323906.4 ENST00000535669.2 ENST00000597602.1 ENST00000595660.1 |
CD37 |
CD37 molecule |
| chr19_-_7764281 | 3.09 |
ENST00000360067.4 |
FCER2 |
Fc fragment of IgE, low affinity II, receptor for (CD23) |
| chr16_+_3115378 | 2.92 |
ENST00000529550.1 ENST00000551122.1 ENST00000525643.2 ENST00000548807.1 ENST00000528163.2 |
IL32 |
interleukin 32 |
| chr1_+_192544857 | 2.83 |
ENST00000367459.3 ENST00000469578.2 |
RGS1 |
regulator of G-protein signaling 1 |
| chr2_-_158345462 | 2.82 |
ENST00000439355.1 ENST00000540637.1 |
CYTIP |
cytohesin 1 interacting protein |
| chr19_+_6531010 | 2.79 |
ENST00000245817.3 |
TNFSF9 |
tumor necrosis factor (ligand) superfamily, member 9 |
| chr22_+_23243156 | 2.73 |
ENST00000390323.2 |
IGLC2 |
immunoglobulin lambda constant 2 (Kern-Oz- marker) |
| chr22_+_23237555 | 2.72 |
ENST00000390321.2 |
IGLC1 |
immunoglobulin lambda constant 1 (Mcg marker) |
| chr6_+_32605195 | 2.71 |
ENST00000374949.2 |
HLA-DQA1 |
major histocompatibility complex, class II, DQ alpha 1 |
| chr22_+_23165153 | 2.70 |
ENST00000390317.2 |
IGLV2-8 |
immunoglobulin lambda variable 2-8 |
| chr6_+_31583761 | 2.69 |
ENST00000376049.4 |
AIF1 |
allograft inflammatory factor 1 |
| chr22_+_23101182 | 2.55 |
ENST00000390312.2 |
IGLV2-14 |
immunoglobulin lambda variable 2-14 |
| chr14_-_106406090 | 2.54 |
ENST00000390593.2 |
IGHV6-1 |
immunoglobulin heavy variable 6-1 |
| chr6_-_32784687 | 2.54 |
ENST00000447394.1 ENST00000438763.2 |
HLA-DOB |
major histocompatibility complex, class II, DO beta |
| chr11_+_121447469 | 2.52 |
ENST00000532694.1 ENST00000534286.1 |
SORL1 |
sortilin-related receptor, L(DLR class) A repeats containing |
| chr16_+_3115323 | 2.48 |
ENST00000531965.1 ENST00000396887.3 ENST00000529699.1 ENST00000526464.2 ENST00000440815.3 |
IL32 |
interleukin 32 |
| chr4_+_128554081 | 2.48 |
ENST00000335251.6 ENST00000296461.5 |
INTU |
inturned planar cell polarity protein |
| chr19_+_42381337 | 2.46 |
ENST00000597454.1 ENST00000444740.2 |
CD79A |
CD79a molecule, immunoglobulin-associated alpha |
| chr7_+_73623717 | 2.45 |
ENST00000344995.5 ENST00000460943.1 |
LAT2 |
linker for activation of T cells family, member 2 |
| chr16_-_11681316 | 2.42 |
ENST00000571688.1 |
LITAF |
lipopolysaccharide-induced TNF factor |
| chr16_+_32077386 | 2.37 |
ENST00000354689.6 |
IGHV3OR16-9 |
immunoglobulin heavy variable 3/OR16-9 (non-functional) |
| chr15_+_81589254 | 2.33 |
ENST00000394652.2 |
IL16 |
interleukin 16 |
| chr16_+_3115298 | 2.33 |
ENST00000325568.5 ENST00000534507.1 |
IL32 |
interleukin 32 |
| chr14_-_106054659 | 2.33 |
ENST00000390539.2 |
IGHA2 |
immunoglobulin heavy constant alpha 2 (A2m marker) |
| chr12_+_7055631 | 2.30 |
ENST00000543115.1 ENST00000399448.1 |
PTPN6 |
protein tyrosine phosphatase, non-receptor type 6 |
| chr6_+_29691198 | 2.30 |
ENST00000440587.2 ENST00000434407.2 |
HLA-F |
major histocompatibility complex, class I, F |
| chr19_-_7766991 | 2.29 |
ENST00000597921.1 ENST00000346664.5 |
FCER2 |
Fc fragment of IgE, low affinity II, receptor for (CD23) |
| chr14_-_106471723 | 2.28 |
ENST00000390595.2 |
IGHV1-3 |
immunoglobulin heavy variable 1-3 |
| chr15_-_79237433 | 2.26 |
ENST00000220166.5 |
CTSH |
cathepsin H |
| chr17_-_29641104 | 2.24 |
ENST00000577894.1 ENST00000330927.4 |
EVI2B |
ecotropic viral integration site 2B |
| chr6_-_31324943 | 2.23 |
ENST00000412585.2 ENST00000434333.1 |
HLA-B |
major histocompatibility complex, class I, B |
| chr6_-_31550192 | 2.22 |
ENST00000429299.2 ENST00000446745.2 |
LTB |
lymphotoxin beta (TNF superfamily, member 3) |
| chr18_-_74844713 | 2.20 |
ENST00000397860.3 |
MBP |
myelin basic protein |
| chr17_+_34640031 | 2.20 |
ENST00000339270.6 ENST00000482104.1 |
CCL4L2 |
chemokine (C-C motif) ligand 4-like 2 |
| chr19_+_42381173 | 2.19 |
ENST00000221972.3 |
CD79A |
CD79a molecule, immunoglobulin-associated alpha |
| chr15_+_75074410 | 2.16 |
ENST00000439220.2 |
CSK |
c-src tyrosine kinase |
| chr22_+_21133469 | 2.16 |
ENST00000406799.1 |
SERPIND1 |
serpin peptidase inhibitor, clade D (heparin cofactor), member 1 |
| chr19_+_18284477 | 2.15 |
ENST00000407280.3 |
IFI30 |
interferon, gamma-inducible protein 30 |
| chr2_+_68592305 | 2.15 |
ENST00000234313.7 |
PLEK |
pleckstrin |
| chr14_+_105953204 | 2.12 |
ENST00000409393.2 |
CRIP1 |
cysteine-rich protein 1 (intestinal) |
| chr22_-_37545972 | 2.11 |
ENST00000216223.5 |
IL2RB |
interleukin 2 receptor, beta |
| chr20_+_49411523 | 2.10 |
ENST00000371608.2 |
BCAS4 |
breast carcinoma amplified sequence 4 |
| chr1_+_32739733 | 2.10 |
ENST00000333070.4 |
LCK |
lymphocyte-specific protein tyrosine kinase |
| chr14_+_105953246 | 2.08 |
ENST00000392531.3 |
CRIP1 |
cysteine-rich protein 1 (intestinal) |
| chr9_+_137298396 | 2.07 |
ENST00000540193.1 |
RXRA |
retinoid X receptor, alpha |
| chr1_+_12185949 | 2.05 |
ENST00000413146.2 |
TNFRSF8 |
tumor necrosis factor receptor superfamily, member 8 |
| chr6_+_32605134 | 2.02 |
ENST00000343139.5 ENST00000395363.1 ENST00000496318.1 |
HLA-DQA1 |
major histocompatibility complex, class II, DQ alpha 1 |
| chr12_-_8765446 | 2.00 |
ENST00000537228.1 ENST00000229335.6 |
AICDA |
activation-induced cytidine deaminase |
| chr22_+_23229960 | 1.99 |
ENST00000526893.1 ENST00000532223.2 ENST00000531372.1 |
IGLL5 |
immunoglobulin lambda-like polypeptide 5 |
| chr4_-_40517984 | 1.98 |
ENST00000381795.6 |
RBM47 |
RNA binding motif protein 47 |
| chr6_+_6588316 | 1.97 |
ENST00000379953.2 |
LY86 |
lymphocyte antigen 86 |
| chr17_+_34431212 | 1.97 |
ENST00000394495.1 |
CCL4 |
chemokine (C-C motif) ligand 4 |
| chr19_+_50922187 | 1.97 |
ENST00000595883.1 ENST00000597855.1 ENST00000596074.1 ENST00000439922.2 ENST00000594685.1 ENST00000270632.7 |
SPIB |
Spi-B transcription factor (Spi-1/PU.1 related) |
| chr17_+_34639793 | 1.96 |
ENST00000394465.2 ENST00000394463.2 ENST00000378342.4 |
CCL4L2 |
chemokine (C-C motif) ligand 4-like 2 |
| chr16_+_3115611 | 1.95 |
ENST00000530890.1 ENST00000444393.3 ENST00000533097.2 ENST00000008180.9 ENST00000396890.2 ENST00000525228.1 ENST00000548652.1 ENST00000525377.2 ENST00000530538.2 ENST00000549213.1 ENST00000552936.1 ENST00000548476.1 ENST00000552664.1 ENST00000552356.1 ENST00000551513.1 ENST00000382213.3 ENST00000548246.1 |
IL32 |
interleukin 32 |
| chr1_+_207627575 | 1.94 |
ENST00000367058.3 ENST00000367057.3 ENST00000367059.3 |
CR2 |
complement component (3d/Epstein Barr virus) receptor 2 |
| chr19_-_2041159 | 1.94 |
ENST00000589441.1 |
MKNK2 |
MAP kinase interacting serine/threonine kinase 2 |
| chr14_-_106174960 | 1.92 |
ENST00000390547.2 |
IGHA1 |
immunoglobulin heavy constant alpha 1 |
| chr12_+_113344582 | 1.92 |
ENST00000202917.5 ENST00000445409.2 ENST00000452357.2 |
OAS1 |
2'-5'-oligoadenylate synthetase 1, 40/46kDa |
| chr17_-_46507567 | 1.91 |
ENST00000584924.1 |
SKAP1 |
src kinase associated phosphoprotein 1 |
| chr17_-_29641084 | 1.90 |
ENST00000544462.1 |
EVI2B |
ecotropic viral integration site 2B |
| chr14_+_105952648 | 1.89 |
ENST00000330233.7 |
CRIP1 |
cysteine-rich protein 1 (intestinal) |
| chr14_-_106322288 | 1.89 |
ENST00000390559.2 |
IGHM |
immunoglobulin heavy constant mu |
| chr15_+_45926919 | 1.88 |
ENST00000561735.1 ENST00000260324.7 |
SQRDL |
sulfide quinone reductase-like (yeast) |
| chr14_-_106539557 | 1.88 |
ENST00000390599.2 |
IGHV1-8 |
immunoglobulin heavy variable 1-8 |
| chr11_-_116708302 | 1.87 |
ENST00000375320.1 ENST00000359492.2 ENST00000375329.2 ENST00000375323.1 |
APOA1 |
apolipoprotein A-I |
| chr17_+_41158742 | 1.86 |
ENST00000415816.2 ENST00000438323.2 |
IFI35 |
interferon-induced protein 35 |
| chr14_-_107219365 | 1.86 |
ENST00000424969.2 |
IGHV3-74 |
immunoglobulin heavy variable 3-74 |
| chr19_-_39108568 | 1.84 |
ENST00000586296.1 |
MAP4K1 |
mitogen-activated protein kinase kinase kinase kinase 1 |
| chr3_+_52828805 | 1.83 |
ENST00000416872.2 ENST00000449956.2 |
ITIH3 |
inter-alpha-trypsin inhibitor heavy chain 3 |
| chr14_+_21249200 | 1.82 |
ENST00000304677.2 |
RNASE6 |
ribonuclease, RNase A family, k6 |
| chr14_-_106733624 | 1.82 |
ENST00000390610.2 |
IGHV1-24 |
immunoglobulin heavy variable 1-24 |
| chr8_+_123793633 | 1.80 |
ENST00000314393.4 |
ZHX2 |
zinc fingers and homeoboxes 2 |
| chr14_-_96180435 | 1.80 |
ENST00000556450.1 ENST00000555202.1 ENST00000554012.1 ENST00000402399.1 |
TCL1A |
T-cell leukemia/lymphoma 1A |
| chr1_-_31230650 | 1.75 |
ENST00000294507.3 |
LAPTM5 |
lysosomal protein transmembrane 5 |
| chr14_+_23016437 | 1.75 |
ENST00000478163.3 |
TRAC |
T cell receptor alpha constant |
| chr12_+_7060432 | 1.75 |
ENST00000318974.9 ENST00000456013.1 |
PTPN6 |
protein tyrosine phosphatase, non-receptor type 6 |
| chr16_-_55866997 | 1.75 |
ENST00000360526.3 ENST00000361503.4 |
CES1 |
carboxylesterase 1 |
| chr15_-_20193370 | 1.74 |
ENST00000558565.2 |
IGHV3OR15-7 |
immunoglobulin heavy variable 3/OR15-7 (pseudogene) |
| chr11_+_46740730 | 1.74 |
ENST00000311907.5 ENST00000530231.1 ENST00000442468.1 |
F2 |
coagulation factor II (thrombin) |
| chr19_-_23578220 | 1.74 |
ENST00000595533.1 ENST00000397082.2 ENST00000599743.1 ENST00000300619.7 |
ZNF91 |
zinc finger protein 91 |
| chr6_+_106959718 | 1.73 |
ENST00000369066.3 |
AIM1 |
absent in melanoma 1 |
| chr2_+_33701286 | 1.73 |
ENST00000403687.3 |
RASGRP3 |
RAS guanyl releasing protein 3 (calcium and DAG-regulated) |
| chr16_+_30483962 | 1.73 |
ENST00000356798.6 |
ITGAL |
integrin, alpha L (antigen CD11A (p180), lymphocyte function-associated antigen 1; alpha polypeptide) |
| chr13_-_99959641 | 1.69 |
ENST00000376414.4 |
GPR183 |
G protein-coupled receptor 183 |
| chr12_+_7055767 | 1.69 |
ENST00000447931.2 |
PTPN6 |
protein tyrosine phosphatase, non-receptor type 6 |
| chr1_+_65613340 | 1.66 |
ENST00000546702.1 |
AK4 |
adenylate kinase 4 |
| chr1_+_79086088 | 1.65 |
ENST00000370751.5 ENST00000342282.3 |
IFI44L |
interferon-induced protein 44-like |
| chr1_-_207095324 | 1.65 |
ENST00000530505.1 ENST00000367091.3 ENST00000442471.2 |
FAIM3 |
Fas apoptotic inhibitory molecule 3 |
| chr16_+_33605231 | 1.63 |
ENST00000570121.2 |
IGHV3OR16-12 |
immunoglobulin heavy variable 3/OR16-12 (non-functional) |
| chr1_-_27961720 | 1.63 |
ENST00000545953.1 ENST00000374005.3 |
FGR |
feline Gardner-Rasheed sarcoma viral oncogene homolog |
| chr19_-_2051223 | 1.62 |
ENST00000309340.7 ENST00000589534.1 ENST00000250896.3 ENST00000589509.1 |
MKNK2 |
MAP kinase interacting serine/threonine kinase 2 |
| chr1_+_28206150 | 1.62 |
ENST00000456990.1 |
THEMIS2 |
thymocyte selection associated family member 2 |
| chr1_-_111746966 | 1.61 |
ENST00000369752.5 |
DENND2D |
DENN/MADD domain containing 2D |
| chr6_+_29691056 | 1.61 |
ENST00000414333.1 ENST00000334668.4 ENST00000259951.7 |
HLA-F |
major histocompatibility complex, class I, F |
| chr22_+_18593446 | 1.60 |
ENST00000316027.6 |
TUBA8 |
tubulin, alpha 8 |
| chr16_+_28943260 | 1.58 |
ENST00000538922.1 ENST00000324662.3 ENST00000567541.1 |
CD19 |
CD19 molecule |
| chr7_+_73624327 | 1.58 |
ENST00000361082.3 ENST00000275635.7 ENST00000470709.1 |
LAT2 |
linker for activation of T cells family, member 2 |
| chr8_-_101348408 | 1.57 |
ENST00000519527.1 ENST00000522369.1 |
RNF19A |
ring finger protein 19A, RBR E3 ubiquitin protein ligase |
| chr22_+_25003626 | 1.57 |
ENST00000451366.1 ENST00000406383.2 ENST00000428855.1 |
GGT1 |
gamma-glutamyltransferase 1 |
| chr20_+_37434329 | 1.56 |
ENST00000299824.1 ENST00000373331.2 |
PPP1R16B |
protein phosphatase 1, regulatory subunit 16B |
| chr9_-_116840728 | 1.55 |
ENST00000265132.3 |
AMBP |
alpha-1-microglobulin/bikunin precursor |
| chr15_+_81591757 | 1.54 |
ENST00000558332.1 |
IL16 |
interleukin 16 |
| chr12_-_719573 | 1.54 |
ENST00000397265.3 |
NINJ2 |
ninjurin 2 |
| chr1_+_6105974 | 1.53 |
ENST00000378083.3 |
KCNAB2 |
potassium voltage-gated channel, shaker-related subfamily, beta member 2 |
| chr7_-_24797546 | 1.52 |
ENST00000414428.1 ENST00000419307.1 ENST00000342947.3 |
DFNA5 |
deafness, autosomal dominant 5 |
| chr19_-_12777509 | 1.52 |
ENST00000221363.4 ENST00000598876.1 ENST00000456935.2 ENST00000486847.2 |
MAN2B1 |
mannosidase, alpha, class 2B, member 1 |
| chr1_+_13516066 | 1.52 |
ENST00000332192.6 |
PRAMEF21 |
PRAME family member 21 |
| chr21_-_43816052 | 1.51 |
ENST00000398405.1 |
TMPRSS3 |
transmembrane protease, serine 3 |
| chr19_+_55141948 | 1.49 |
ENST00000396332.4 ENST00000427581.2 |
LILRB1 |
leukocyte immunoglobulin-like receptor, subfamily B (with TM and ITIM domains), member 1 |
| chr2_+_90077680 | 1.48 |
ENST00000390270.2 |
IGKV3D-20 |
immunoglobulin kappa variable 3D-20 |
| chr8_+_28174649 | 1.48 |
ENST00000301908.3 |
PNOC |
prepronociceptin |
| chr1_-_160681593 | 1.47 |
ENST00000368045.3 ENST00000368046.3 |
CD48 |
CD48 molecule |
| chr9_-_37034028 | 1.47 |
ENST00000520281.1 ENST00000446742.1 ENST00000522003.1 ENST00000523145.1 ENST00000414447.1 ENST00000377847.2 ENST00000377853.2 ENST00000377852.2 ENST00000523241.1 ENST00000520154.1 ENST00000358127.4 |
PAX5 |
paired box 5 |
| chr16_+_8806800 | 1.46 |
ENST00000561870.1 ENST00000396600.2 |
ABAT |
4-aminobutyrate aminotransferase |
| chr19_+_39897453 | 1.45 |
ENST00000597629.1 ENST00000248673.3 ENST00000594045.1 ENST00000594442.1 |
ZFP36 |
ZFP36 ring finger protein |
| chr19_-_6481776 | 1.45 |
ENST00000543576.1 ENST00000590173.1 ENST00000381480.2 |
DENND1C |
DENN/MADD domain containing 1C |
| chr14_-_106994333 | 1.44 |
ENST00000390624.2 |
IGHV3-48 |
immunoglobulin heavy variable 3-48 |
| chr17_+_34430980 | 1.42 |
ENST00000250151.4 |
CCL4 |
chemokine (C-C motif) ligand 4 |
| chr6_+_29795595 | 1.41 |
ENST00000360323.6 ENST00000376818.3 ENST00000376815.3 |
HLA-G |
major histocompatibility complex, class I, G |
| chr6_-_90121789 | 1.40 |
ENST00000359203.3 |
RRAGD |
Ras-related GTP binding D |
| chr1_+_207627697 | 1.40 |
ENST00000458541.2 |
CR2 |
complement component (3d/Epstein Barr virus) receptor 2 |
| chr22_-_20368028 | 1.40 |
ENST00000404912.1 |
GGTLC3 |
gamma-glutamyltransferase light chain 3 |
| chr1_+_156123318 | 1.39 |
ENST00000368285.3 |
SEMA4A |
sema domain, immunoglobulin domain (Ig), transmembrane domain (TM) and short cytoplasmic domain, (semaphorin) 4A |
| chr1_+_65613217 | 1.39 |
ENST00000545314.1 |
AK4 |
adenylate kinase 4 |
| chr1_-_9131776 | 1.37 |
ENST00000484798.1 |
SLC2A5 |
solute carrier family 2 (facilitated glucose/fructose transporter), member 5 |
| chr2_+_95691417 | 1.37 |
ENST00000309988.4 |
MAL |
mal, T-cell differentiation protein |
| chr14_+_24563262 | 1.37 |
ENST00000559250.1 ENST00000216780.4 ENST00000560736.1 ENST00000396973.4 ENST00000559837.1 |
PCK2 |
phosphoenolpyruvate carboxykinase 2 (mitochondrial) |
| chr11_-_67205538 | 1.36 |
ENST00000326294.3 |
PTPRCAP |
protein tyrosine phosphatase, receptor type, C-associated protein |
| chr12_+_113344755 | 1.36 |
ENST00000550883.1 |
OAS1 |
2'-5'-oligoadenylate synthetase 1, 40/46kDa |
| chr10_+_114135004 | 1.36 |
ENST00000393081.1 |
ACSL5 |
acyl-CoA synthetase long-chain family member 5 |
| chr1_+_65613513 | 1.36 |
ENST00000395334.2 |
AK4 |
adenylate kinase 4 |
| chr14_-_106963409 | 1.36 |
ENST00000390621.2 |
IGHV1-45 |
immunoglobulin heavy variable 1-45 |
| chr12_+_113354341 | 1.35 |
ENST00000553152.1 |
OAS1 |
2'-5'-oligoadenylate synthetase 1, 40/46kDa |
| chr1_+_160709055 | 1.35 |
ENST00000368043.3 ENST00000368042.3 ENST00000458602.2 ENST00000458104.2 |
SLAMF7 |
SLAM family member 7 |
| chr1_+_32716840 | 1.35 |
ENST00000336890.5 |
LCK |
lymphocyte-specific protein tyrosine kinase |
| chr19_-_51875523 | 1.35 |
ENST00000593572.1 ENST00000595157.1 |
NKG7 |
natural killer cell group 7 sequence |
| chr19_-_6690723 | 1.35 |
ENST00000601008.1 |
C3 |
complement component 3 |
| chr15_+_75335604 | 1.34 |
ENST00000563393.1 |
PPCDC |
phosphopantothenoylcysteine decarboxylase |
| chr1_+_32716857 | 1.34 |
ENST00000482949.1 ENST00000495610.2 |
LCK |
lymphocyte-specific protein tyrosine kinase |
| chr20_+_49411431 | 1.33 |
ENST00000358791.5 ENST00000262591.5 |
BCAS4 |
breast carcinoma amplified sequence 4 |
| chr17_-_26903900 | 1.33 |
ENST00000395319.3 ENST00000581807.1 ENST00000584086.1 ENST00000395321.2 |
ALDOC |
aldolase C, fructose-bisphosphate |
| chr8_+_28351707 | 1.33 |
ENST00000537916.1 ENST00000523546.1 ENST00000240093.3 |
FZD3 |
frizzled family receptor 3 |
| chr17_-_7080227 | 1.33 |
ENST00000574330.1 |
ASGR1 |
asialoglycoprotein receptor 1 |
| chr22_-_37640456 | 1.33 |
ENST00000405484.1 ENST00000441619.1 ENST00000406508.1 |
RAC2 |
ras-related C3 botulinum toxin substrate 2 (rho family, small GTP binding protein Rac2) |
| chr6_-_32812420 | 1.32 |
ENST00000374881.2 |
PSMB8 |
proteasome (prosome, macropain) subunit, beta type, 8 |
| chr4_+_15779901 | 1.32 |
ENST00000226279.3 |
CD38 |
CD38 molecule |
| chr12_+_113416191 | 1.31 |
ENST00000342315.4 ENST00000392583.2 |
OAS2 |
2'-5'-oligoadenylate synthetase 2, 69/71kDa |
| chr19_+_1067271 | 1.31 |
ENST00000536472.1 ENST00000590214.1 |
HMHA1 |
histocompatibility (minor) HA-1 |
| chr10_+_114133773 | 1.30 |
ENST00000354655.4 |
ACSL5 |
acyl-CoA synthetase long-chain family member 5 |
| chr7_-_37024665 | 1.30 |
ENST00000396040.2 |
ELMO1 |
engulfment and cell motility 1 |
| chr3_-_49395705 | 1.29 |
ENST00000419349.1 |
GPX1 |
glutathione peroxidase 1 |
| chr6_+_13272904 | 1.28 |
ENST00000379335.3 ENST00000379329.1 |
PHACTR1 |
phosphatase and actin regulator 1 |
| chr18_-_10701979 | 1.28 |
ENST00000538948.1 ENST00000285141.4 |
PIEZO2 |
piezo-type mechanosensitive ion channel component 2 |
| chr19_-_6591113 | 1.28 |
ENST00000423145.3 ENST00000245903.3 |
CD70 |
CD70 molecule |
| chr1_-_169680745 | 1.28 |
ENST00000236147.4 |
SELL |
selectin L |
| chr9_+_71320596 | 1.27 |
ENST00000265382.3 |
PIP5K1B |
phosphatidylinositol-4-phosphate 5-kinase, type I, beta |
| chr12_+_27485785 | 1.26 |
ENST00000544915.1 |
ARNTL2 |
aryl hydrocarbon receptor nuclear translocator-like 2 |
| chr22_+_22930626 | 1.25 |
ENST00000390302.2 |
IGLV2-33 |
immunoglobulin lambda variable 2-33 (non-functional) |
| chr3_+_121554046 | 1.24 |
ENST00000273668.2 ENST00000451944.2 |
EAF2 |
ELL associated factor 2 |
| chr7_+_101928380 | 1.24 |
ENST00000536178.1 |
SH2B2 |
SH2B adaptor protein 2 |
| chr1_-_207095212 | 1.24 |
ENST00000420007.2 |
FAIM3 |
Fas apoptotic inhibitory molecule 3 |
| chr14_+_24563510 | 1.23 |
ENST00000545054.2 ENST00000561286.1 ENST00000558096.1 |
PCK2 |
phosphoenolpyruvate carboxykinase 2 (mitochondrial) |
| chrX_-_131547596 | 1.23 |
ENST00000538204.1 ENST00000370849.3 |
MBNL3 |
muscleblind-like splicing regulator 3 |
| chr17_-_62009621 | 1.22 |
ENST00000349817.2 ENST00000392795.3 |
CD79B |
CD79b molecule, immunoglobulin-associated beta |
| chr11_+_5617952 | 1.22 |
ENST00000354852.5 |
TRIM6-TRIM34 |
TRIM6-TRIM34 readthrough |
| chr1_+_111770232 | 1.21 |
ENST00000369744.2 |
CHI3L2 |
chitinase 3-like 2 |
| chr2_+_241564655 | 1.20 |
ENST00000407714.1 |
GPR35 |
G protein-coupled receptor 35 |
| chr17_+_67498538 | 1.20 |
ENST00000589647.1 |
MAP2K6 |
mitogen-activated protein kinase kinase 6 |
| chr13_-_47012325 | 1.20 |
ENST00000409879.2 |
KIAA0226L |
KIAA0226-like |
| chr6_-_154677900 | 1.19 |
ENST00000265198.4 ENST00000520261.1 |
IPCEF1 |
interaction protein for cytohesin exchange factors 1 |
| chr6_+_14117872 | 1.19 |
ENST00000379153.3 |
CD83 |
CD83 molecule |
Gene Ontology Analysis
Gene overrepresentation in molecular_function category:
| Log-likelihood per target | Total log-likelihood | Term | Description |
|---|---|---|---|
| 3.7 | 18.6 | GO:0004910 | interleukin-1, Type II, blocking receptor activity(GO:0004910) |
| 3.7 | 11.0 | GO:0008859 | exoribonuclease II activity(GO:0008859) |
| 1.5 | 20.4 | GO:0032395 | MHC class II receptor activity(GO:0032395) |
| 1.3 | 8.9 | GO:0030369 | ICAM-3 receptor activity(GO:0030369) |
| 1.1 | 62.2 | GO:0034987 | immunoglobulin receptor binding(GO:0034987) |
| 1.1 | 6.7 | GO:0008381 | mechanically-gated ion channel activity(GO:0008381) mechanically gated channel activity(GO:0022833) |
| 1.1 | 4.4 | GO:0046899 | nucleoside triphosphate adenylate kinase activity(GO:0046899) |
| 0.9 | 5.5 | GO:0042610 | CD8 receptor binding(GO:0042610) |
| 0.9 | 2.6 | GO:0004613 | phosphoenolpyruvate carboxykinase activity(GO:0004611) phosphoenolpyruvate carboxykinase (GTP) activity(GO:0004613) |
| 0.8 | 24.1 | GO:0042605 | peptide antigen binding(GO:0042605) |
| 0.8 | 4.1 | GO:0004699 | calcium-independent protein kinase C activity(GO:0004699) |
| 0.8 | 1.7 | GO:0019770 | IgG receptor activity(GO:0019770) |
| 0.7 | 7.0 | GO:0001730 | 2'-5'-oligoadenylate synthetase activity(GO:0001730) |
| 0.7 | 2.1 | GO:0052810 | 1-phosphatidylinositol-5-kinase activity(GO:0052810) |
| 0.7 | 5.4 | GO:0019863 | IgE binding(GO:0019863) |
| 0.6 | 2.5 | GO:0030107 | HLA-A specific inhibitory MHC class I receptor activity(GO:0030107) |
| 0.6 | 1.8 | GO:0004464 | leukotriene-C4 synthase activity(GO:0004464) |
| 0.6 | 2.4 | GO:0003867 | 4-aminobutyrate transaminase activity(GO:0003867) succinate-semialdehyde dehydrogenase binding(GO:0032145) (S)-3-amino-2-methylpropionate transaminase activity(GO:0047298) |
| 0.5 | 1.6 | GO:0003835 | beta-galactoside alpha-2,6-sialyltransferase activity(GO:0003835) |
| 0.5 | 7.6 | GO:0036374 | glutathione hydrolase activity(GO:0036374) |
| 0.5 | 2.1 | GO:0004911 | interleukin-2 receptor activity(GO:0004911) interleukin-2 binding(GO:0019976) |
| 0.5 | 2.1 | GO:0070653 | high-density lipoprotein particle receptor binding(GO:0070653) |
| 0.5 | 2.1 | GO:0004886 | 9-cis retinoic acid receptor activity(GO:0004886) |
| 0.5 | 8.2 | GO:0030306 | ADP-ribosylation factor binding(GO:0030306) |
| 0.5 | 2.1 | GO:0019862 | IgA binding(GO:0019862) |
| 0.5 | 0.5 | GO:0001540 | beta-amyloid binding(GO:0001540) |
| 0.5 | 1.5 | GO:0017129 | triglyceride binding(GO:0017129) |
| 0.5 | 2.5 | GO:0047374 | methylumbelliferyl-acetate deacetylase activity(GO:0047374) |
| 0.5 | 1.9 | GO:0052798 | beta-galactoside alpha-2,3-sialyltransferase activity(GO:0052798) |
| 0.5 | 3.9 | GO:0004873 | asialoglycoprotein receptor activity(GO:0004873) |
| 0.5 | 0.5 | GO:0005124 | scavenger receptor binding(GO:0005124) |
| 0.5 | 0.9 | GO:0045322 | unmethylated CpG binding(GO:0045322) |
| 0.5 | 1.8 | GO:0004657 | proline dehydrogenase activity(GO:0004657) |
| 0.5 | 3.2 | GO:0031726 | CCR1 chemokine receptor binding(GO:0031726) |
| 0.4 | 3.1 | GO:0016176 | superoxide-generating NADPH oxidase activator activity(GO:0016176) |
| 0.4 | 5.3 | GO:0019911 | structural constituent of myelin sheath(GO:0019911) |
| 0.4 | 1.3 | GO:0003953 | NAD+ nucleosidase activity(GO:0003953) NAD(P)+ nucleosidase activity(GO:0050135) |
| 0.4 | 0.9 | GO:0051213 | dioxygenase activity(GO:0051213) |
| 0.4 | 1.3 | GO:0043423 | 3-phosphoinositide-dependent protein kinase binding(GO:0043423) |
| 0.4 | 2.9 | GO:0001515 | opioid peptide activity(GO:0001515) |
| 0.4 | 4.1 | GO:0070324 | thyroid hormone binding(GO:0070324) |
| 0.4 | 1.2 | GO:0003826 | alpha-ketoacid dehydrogenase activity(GO:0003826) 3-methyl-2-oxobutanoate dehydrogenase (2-methylpropanoyl-transferring) activity(GO:0003863) |
| 0.4 | 2.0 | GO:0060230 | lipoprotein lipase activator activity(GO:0060230) |
| 0.4 | 1.2 | GO:0072510 | ferric iron transmembrane transporter activity(GO:0015091) trivalent inorganic cation transmembrane transporter activity(GO:0072510) |
| 0.4 | 1.5 | GO:0016822 | hydrolase activity, acting on acid carbon-carbon bonds(GO:0016822) hydrolase activity, acting on acid carbon-carbon bonds, in ketonic substances(GO:0016823) |
| 0.4 | 1.1 | GO:0016314 | phosphatidylinositol-3,4,5-trisphosphate 3-phosphatase activity(GO:0016314) |
| 0.4 | 1.1 | GO:0015218 | pyrimidine nucleotide transmembrane transporter activity(GO:0015218) |
| 0.4 | 2.5 | GO:0005353 | fructose transmembrane transporter activity(GO:0005353) |
| 0.4 | 6.1 | GO:0003680 | AT DNA binding(GO:0003680) |
| 0.4 | 0.7 | GO:0034648 | histone demethylase activity (H3-dimethyl-K4 specific)(GO:0034648) |
| 0.4 | 1.4 | GO:0034186 | apolipoprotein A-I binding(GO:0034186) |
| 0.3 | 1.0 | GO:0003858 | 3-hydroxybutyrate dehydrogenase activity(GO:0003858) |
| 0.3 | 1.0 | GO:0047150 | betaine-homocysteine S-methyltransferase activity(GO:0047150) |
| 0.3 | 1.0 | GO:0031731 | CCR6 chemokine receptor binding(GO:0031731) |
| 0.3 | 2.2 | GO:0004126 | cytidine deaminase activity(GO:0004126) |
| 0.3 | 0.9 | GO:0045127 | N-acetylglucosamine kinase activity(GO:0045127) |
| 0.3 | 5.6 | GO:0009931 | calcium-dependent protein serine/threonine kinase activity(GO:0009931) |
| 0.3 | 0.3 | GO:0015563 | uptake transmembrane transporter activity(GO:0015563) |
| 0.3 | 2.4 | GO:0016778 | diphosphotransferase activity(GO:0016778) |
| 0.3 | 1.4 | GO:0043120 | tumor necrosis factor binding(GO:0043120) |
| 0.3 | 1.1 | GO:0004307 | ethanolaminephosphotransferase activity(GO:0004307) |
| 0.3 | 1.7 | GO:0016531 | copper chaperone activity(GO:0016531) |
| 0.3 | 0.6 | GO:0000827 | inositol-1,3,4,5,6-pentakisphosphate kinase activity(GO:0000827) inositol hexakisphosphate kinase activity(GO:0000828) inositol heptakisphosphate kinase activity(GO:0000829) inositol hexakisphosphate 5-kinase activity(GO:0000832) inositol hexakisphosphate 1-kinase activity(GO:0052723) inositol hexakisphosphate 3-kinase activity(GO:0052724) |
| 0.3 | 1.6 | GO:0019238 | cyclohydrolase activity(GO:0019238) |
| 0.3 | 1.9 | GO:0043208 | glycosphingolipid binding(GO:0043208) |
| 0.3 | 0.8 | GO:0061663 | NEDD8 ligase activity(GO:0061663) |
| 0.3 | 1.0 | GO:0004505 | phenylalanine 4-monooxygenase activity(GO:0004505) |
| 0.3 | 3.6 | GO:0004875 | complement receptor activity(GO:0004875) |
| 0.3 | 4.1 | GO:0042609 | CD4 receptor binding(GO:0042609) |
| 0.2 | 1.7 | GO:0005087 | Ran guanyl-nucleotide exchange factor activity(GO:0005087) |
| 0.2 | 34.0 | GO:0003823 | antigen binding(GO:0003823) |
| 0.2 | 0.7 | GO:0004347 | glucose-6-phosphate isomerase activity(GO:0004347) |
| 0.2 | 0.7 | GO:0004768 | stearoyl-CoA 9-desaturase activity(GO:0004768) acyl-CoA desaturase activity(GO:0016215) |
| 0.2 | 0.7 | GO:0035663 | Toll-like receptor 2 binding(GO:0035663) |
| 0.2 | 0.7 | GO:0016749 | 5-aminolevulinate synthase activity(GO:0003870) N-succinyltransferase activity(GO:0016749) |
| 0.2 | 1.6 | GO:0008142 | oxysterol binding(GO:0008142) |
| 0.2 | 10.9 | GO:0005164 | tumor necrosis factor receptor binding(GO:0005164) |
| 0.2 | 0.9 | GO:0005220 | inositol 1,4,5-trisphosphate-sensitive calcium-release channel activity(GO:0005220) |
| 0.2 | 1.3 | GO:0008853 | exodeoxyribonuclease III activity(GO:0008853) |
| 0.2 | 1.1 | GO:0004095 | carnitine O-palmitoyltransferase activity(GO:0004095) |
| 0.2 | 10.5 | GO:0042169 | SH2 domain binding(GO:0042169) |
| 0.2 | 0.7 | GO:0047696 | beta-adrenergic receptor kinase activity(GO:0047696) |
| 0.2 | 0.9 | GO:0018479 | benzaldehyde dehydrogenase (NAD+) activity(GO:0018479) |
| 0.2 | 4.3 | GO:0051400 | BH domain binding(GO:0051400) |
| 0.2 | 0.6 | GO:0004605 | phosphatidate cytidylyltransferase activity(GO:0004605) |
| 0.2 | 0.8 | GO:0031735 | CCR10 chemokine receptor binding(GO:0031735) |
| 0.2 | 1.0 | GO:0031802 | type 5 metabotropic glutamate receptor binding(GO:0031802) |
| 0.2 | 1.7 | GO:0034711 | inhibin binding(GO:0034711) |
| 0.2 | 0.6 | GO:0019166 | trans-2-enoyl-CoA reductase (NADPH) activity(GO:0019166) |
| 0.2 | 1.0 | GO:0004485 | methylcrotonoyl-CoA carboxylase activity(GO:0004485) |
| 0.2 | 1.4 | GO:0061133 | endopeptidase activator activity(GO:0061133) |
| 0.2 | 3.1 | GO:0008140 | cAMP response element binding protein binding(GO:0008140) |
| 0.2 | 0.6 | GO:0047631 | ADP-ribose diphosphatase activity(GO:0047631) |
| 0.2 | 0.8 | GO:0034481 | chondroitin sulfotransferase activity(GO:0034481) |
| 0.2 | 0.6 | GO:0005150 | interleukin-1, Type I receptor binding(GO:0005150) |
| 0.2 | 3.5 | GO:0008349 | MAP kinase kinase kinase kinase activity(GO:0008349) |
| 0.2 | 3.2 | GO:0038191 | neuropilin binding(GO:0038191) |
| 0.2 | 0.2 | GO:0050613 | delta14-sterol reductase activity(GO:0050613) |
| 0.2 | 1.3 | GO:0001875 | lipopolysaccharide receptor activity(GO:0001875) |
| 0.2 | 0.6 | GO:0022897 | peptide:proton symporter activity(GO:0015333) proton-dependent peptide secondary active transmembrane transporter activity(GO:0022897) |
| 0.2 | 0.9 | GO:0047820 | D-glutamate cyclase activity(GO:0047820) |
| 0.2 | 0.6 | GO:0016899 | oxidoreductase activity, acting on the CH-OH group of donors, oxygen as acceptor(GO:0016899) |
| 0.2 | 1.5 | GO:0004000 | adenosine deaminase activity(GO:0004000) |
| 0.2 | 0.5 | GO:0044549 | GTP cyclohydrolase binding(GO:0044549) |
| 0.2 | 0.7 | GO:0033829 | O-fucosylpeptide 3-beta-N-acetylglucosaminyltransferase activity(GO:0033829) |
| 0.2 | 0.4 | GO:0034061 | DNA polymerase activity(GO:0034061) |
| 0.2 | 1.8 | GO:0048406 | nerve growth factor binding(GO:0048406) |
| 0.2 | 0.5 | GO:0047192 | 1-alkylglycerophosphocholine O-acetyltransferase activity(GO:0047192) |
| 0.2 | 2.4 | GO:0003993 | acid phosphatase activity(GO:0003993) |
| 0.2 | 4.3 | GO:0034236 | protein kinase A catalytic subunit binding(GO:0034236) |
| 0.2 | 0.3 | GO:0001102 | RNA polymerase II activating transcription factor binding(GO:0001102) |
| 0.2 | 0.2 | GO:0032767 | copper-dependent protein binding(GO:0032767) |
| 0.2 | 1.9 | GO:0004332 | fructose-bisphosphate aldolase activity(GO:0004332) |
| 0.2 | 0.3 | GO:0008047 | enzyme activator activity(GO:0008047) |
| 0.2 | 1.7 | GO:0070053 | thrombospondin receptor activity(GO:0070053) |
| 0.2 | 0.8 | GO:0070095 | fructose-6-phosphate binding(GO:0070095) |
| 0.2 | 1.2 | GO:0008109 | N-acetyllactosaminide beta-1,6-N-acetylglucosaminyltransferase activity(GO:0008109) |
| 0.2 | 1.3 | GO:0015349 | thyroid hormone transmembrane transporter activity(GO:0015349) |
| 0.2 | 0.3 | GO:1990254 | keratin filament binding(GO:1990254) |
| 0.2 | 0.6 | GO:0017040 | ceramidase activity(GO:0017040) |
| 0.2 | 0.6 | GO:0032408 | MutLbeta complex binding(GO:0032406) MutSbeta complex binding(GO:0032408) |
| 0.2 | 0.5 | GO:0004731 | purine-nucleoside phosphorylase activity(GO:0004731) |
| 0.2 | 0.5 | GO:1902122 | chenodeoxycholic acid binding(GO:1902122) |
| 0.2 | 0.8 | GO:0004066 | asparagine synthase (glutamine-hydrolyzing) activity(GO:0004066) |
| 0.2 | 2.7 | GO:0102391 | decanoate--CoA ligase activity(GO:0102391) |
| 0.2 | 1.7 | GO:0016494 | C-X-C chemokine receptor activity(GO:0016494) |
| 0.2 | 1.4 | GO:0043426 | MRF binding(GO:0043426) |
| 0.1 | 0.6 | GO:0016841 | ammonia-lyase activity(GO:0016841) |
| 0.1 | 0.4 | GO:0052870 | tocopherol omega-hydroxylase activity(GO:0052870) alpha-tocopherol omega-hydroxylase activity(GO:0052871) 20-hydroxy-leukotriene B4 omega oxidase activity(GO:0097258) 20-aldehyde-leukotriene B4 20-monooxygenase activity(GO:0097259) |
| 0.1 | 0.4 | GO:0036134 | thromboxane-A synthase activity(GO:0004796) 12-hydroxyheptadecatrienoic acid synthase activity(GO:0036134) |
| 0.1 | 1.5 | GO:0019957 | C-C chemokine binding(GO:0019957) |
| 0.1 | 0.4 | GO:0004677 | DNA-dependent protein kinase activity(GO:0004677) |
| 0.1 | 0.4 | GO:0052596 | tryptamine:oxygen oxidoreductase (deaminating) activity(GO:0052593) aminoacetone:oxygen oxidoreductase(deaminating) activity(GO:0052594) aliphatic-amine oxidase activity(GO:0052595) phenethylamine:oxygen oxidoreductase (deaminating) activity(GO:0052596) |
| 0.1 | 0.4 | GO:0015119 | hexose phosphate transmembrane transporter activity(GO:0015119) organophosphate:inorganic phosphate antiporter activity(GO:0015315) hexose-phosphate:inorganic phosphate antiporter activity(GO:0015526) glucose 6-phosphate:inorganic phosphate antiporter activity(GO:0061513) |
| 0.1 | 0.4 | GO:0004817 | cysteine-tRNA ligase activity(GO:0004817) |
| 0.1 | 0.6 | GO:0004140 | dephospho-CoA kinase activity(GO:0004140) |
| 0.1 | 0.1 | GO:0034041 | sterol-transporting ATPase activity(GO:0034041) |
| 0.1 | 0.8 | GO:0016657 | GMP reductase activity(GO:0003920) oxidoreductase activity, acting on NAD(P)H, nitrogenous group as acceptor(GO:0016657) |
| 0.1 | 0.9 | GO:1990381 | ubiquitin-specific protease binding(GO:1990381) |
| 0.1 | 1.3 | GO:0015232 | heme transporter activity(GO:0015232) |
| 0.1 | 0.9 | GO:0030368 | interleukin-17 receptor activity(GO:0030368) |
| 0.1 | 0.5 | GO:0004165 | dodecenoyl-CoA delta-isomerase activity(GO:0004165) |
| 0.1 | 0.4 | GO:0030272 | 5-formyltetrahydrofolate cyclo-ligase activity(GO:0030272) |
| 0.1 | 0.3 | GO:0008379 | thioredoxin peroxidase activity(GO:0008379) |
| 0.1 | 0.8 | GO:0003810 | protein-glutamine gamma-glutamyltransferase activity(GO:0003810) |
| 0.1 | 0.5 | GO:0038025 | glycoprotein transporter activity(GO:0034437) reelin receptor activity(GO:0038025) |
| 0.1 | 1.0 | GO:0090599 | alpha-glucosidase activity(GO:0090599) |
| 0.1 | 0.9 | GO:0019534 | toxin transporter activity(GO:0019534) |
| 0.1 | 0.4 | GO:0004362 | glutathione-disulfide reductase activity(GO:0004362) |
| 0.1 | 4.5 | GO:0051183 | vitamin transporter activity(GO:0051183) |
| 0.1 | 0.6 | GO:0004906 | interferon-gamma receptor activity(GO:0004906) |
| 0.1 | 1.1 | GO:0008526 | phosphatidylinositol transporter activity(GO:0008526) |
| 0.1 | 0.7 | GO:0043533 | inositol 1,3,4,5 tetrakisphosphate binding(GO:0043533) |
| 0.1 | 1.5 | GO:0008429 | phosphatidylethanolamine binding(GO:0008429) |
| 0.1 | 0.4 | GO:0015361 | low-affinity sodium:dicarboxylate symporter activity(GO:0015361) |
| 0.1 | 2.4 | GO:0070628 | proteasome binding(GO:0070628) |
| 0.1 | 5.4 | GO:0001205 | transcriptional activator activity, RNA polymerase II distal enhancer sequence-specific binding(GO:0001205) |
| 0.1 | 2.2 | GO:0005385 | zinc ion transmembrane transporter activity(GO:0005385) |
| 0.1 | 0.4 | GO:0032427 | GBD domain binding(GO:0032427) |
| 0.1 | 0.4 | GO:0004514 | nicotinate-nucleotide diphosphorylase (carboxylating) activity(GO:0004514) |
| 0.1 | 3.2 | GO:0004602 | glutathione peroxidase activity(GO:0004602) |
| 0.1 | 0.3 | GO:0004914 | interleukin-5 receptor activity(GO:0004914) |
| 0.1 | 0.3 | GO:0047757 | chondroitin-glucuronate 5-epimerase activity(GO:0047757) |
| 0.1 | 0.3 | GO:0000995 | transcription factor activity, core RNA polymerase III binding(GO:0000995) |
| 0.1 | 0.6 | GO:0004663 | Rab geranylgeranyltransferase activity(GO:0004663) |
| 0.1 | 0.3 | GO:0016401 | palmitoyl-CoA oxidase activity(GO:0016401) |
| 0.1 | 3.2 | GO:0097200 | cysteine-type endopeptidase activity involved in execution phase of apoptosis(GO:0097200) |
| 0.1 | 0.4 | GO:0036033 | mediator complex binding(GO:0036033) |
| 0.1 | 0.3 | GO:0000253 | 3-keto sterol reductase activity(GO:0000253) |
| 0.1 | 0.9 | GO:0000340 | RNA 7-methylguanosine cap binding(GO:0000340) |
| 0.1 | 0.2 | GO:0005151 | interleukin-1, Type II receptor binding(GO:0005151) |
| 0.1 | 0.6 | GO:0008048 | calcium sensitive guanylate cyclase activator activity(GO:0008048) |
| 0.1 | 0.7 | GO:0001225 | RNA polymerase II transcription coactivator binding(GO:0001225) |
| 0.1 | 0.5 | GO:0052834 | inositol monophosphate 1-phosphatase activity(GO:0008934) inositol monophosphate 3-phosphatase activity(GO:0052832) inositol monophosphate 4-phosphatase activity(GO:0052833) inositol monophosphate phosphatase activity(GO:0052834) |
| 0.1 | 0.4 | GO:0035473 | lipase binding(GO:0035473) |
| 0.1 | 0.1 | GO:0016748 | succinyltransferase activity(GO:0016748) |
| 0.1 | 1.3 | GO:0004726 | non-membrane spanning protein tyrosine phosphatase activity(GO:0004726) |
| 0.1 | 0.4 | GO:0004530 | deoxyribonuclease I activity(GO:0004530) |
| 0.1 | 0.3 | GO:0016730 | ferredoxin-NADP+ reductase activity(GO:0004324) NADPH-adrenodoxin reductase activity(GO:0015039) oxidoreductase activity, acting on iron-sulfur proteins as donors(GO:0016730) oxidoreductase activity, acting on iron-sulfur proteins as donors, NAD or NADP as acceptor(GO:0016731) |
| 0.1 | 1.8 | GO:0043560 | insulin receptor substrate binding(GO:0043560) |
| 0.1 | 0.6 | GO:0050291 | sphingosine N-acyltransferase activity(GO:0050291) |
| 0.1 | 0.6 | GO:0008046 | axon guidance receptor activity(GO:0008046) |
| 0.1 | 0.4 | GO:0032396 | inhibitory MHC class I receptor activity(GO:0032396) |
| 0.1 | 0.1 | GO:0016421 | CoA carboxylase activity(GO:0016421) |
| 0.1 | 1.1 | GO:0008061 | chitinase activity(GO:0004568) chitin binding(GO:0008061) |
| 0.1 | 0.5 | GO:0015307 | drug:proton antiporter activity(GO:0015307) |
| 0.1 | 0.2 | GO:0008192 | RNA guanylyltransferase activity(GO:0008192) |
| 0.1 | 1.1 | GO:0003909 | DNA ligase activity(GO:0003909) |
| 0.1 | 0.2 | GO:0000701 | purine-specific mismatch base pair DNA N-glycosylase activity(GO:0000701) |
| 0.1 | 0.4 | GO:0004920 | interleukin-10 receptor activity(GO:0004920) |
| 0.1 | 0.4 | GO:0004740 | pyruvate dehydrogenase (acetyl-transferring) kinase activity(GO:0004740) |
| 0.1 | 0.6 | GO:0004167 | dopachrome isomerase activity(GO:0004167) |
| 0.1 | 0.4 | GO:0005471 | ATP:ADP antiporter activity(GO:0005471) adenine transmembrane transporter activity(GO:0015207) |
| 0.1 | 0.2 | GO:0030371 | translation repressor activity(GO:0030371) |
| 0.1 | 0.6 | GO:0004741 | [pyruvate dehydrogenase (lipoamide)] phosphatase activity(GO:0004741) |
| 0.1 | 0.3 | GO:0071209 | U7 snRNA binding(GO:0071209) |
| 0.1 | 0.4 | GO:0008422 | beta-glucosidase activity(GO:0008422) |
| 0.1 | 2.2 | GO:0042288 | MHC class I protein binding(GO:0042288) |
| 0.1 | 0.3 | GO:0004137 | deoxycytidine kinase activity(GO:0004137) |
| 0.1 | 1.7 | GO:0019992 | diacylglycerol binding(GO:0019992) |
| 0.1 | 2.1 | GO:0043325 | phosphatidylinositol-3,4-bisphosphate binding(GO:0043325) |
| 0.1 | 0.3 | GO:0030158 | protein xylosyltransferase activity(GO:0030158) |
| 0.1 | 0.6 | GO:0015501 | glutamate:sodium symporter activity(GO:0015501) |
| 0.1 | 0.6 | GO:0070087 | chromo shadow domain binding(GO:0070087) |
| 0.1 | 0.7 | GO:0070181 | small ribosomal subunit rRNA binding(GO:0070181) |
| 0.1 | 0.3 | GO:0001665 | alpha-N-acetylgalactosaminide alpha-2,6-sialyltransferase activity(GO:0001665) |
| 0.1 | 0.2 | GO:0004830 | tryptophan-tRNA ligase activity(GO:0004830) |
| 0.1 | 0.3 | GO:0005504 | fatty acid binding(GO:0005504) |
| 0.1 | 0.3 | GO:0004331 | 6-phosphofructo-2-kinase activity(GO:0003873) fructose-2,6-bisphosphate 2-phosphatase activity(GO:0004331) |
| 0.1 | 0.2 | GO:0015037 | peptide disulfide oxidoreductase activity(GO:0015037) |
| 0.1 | 0.4 | GO:0016846 | carbon-sulfur lyase activity(GO:0016846) |
| 0.1 | 0.7 | GO:0005534 | galactose binding(GO:0005534) |
| 0.1 | 1.0 | GO:0034452 | dynactin binding(GO:0034452) |
| 0.1 | 0.3 | GO:0004949 | cannabinoid receptor activity(GO:0004949) |
| 0.1 | 0.8 | GO:0050700 | CARD domain binding(GO:0050700) |
| 0.1 | 1.9 | GO:0005095 | GTPase inhibitor activity(GO:0005095) |
| 0.1 | 2.5 | GO:0017075 | syntaxin-1 binding(GO:0017075) |
| 0.1 | 0.2 | GO:0004300 | enoyl-CoA hydratase activity(GO:0004300) |
| 0.1 | 0.2 | GO:0050501 | hyaluronan synthase activity(GO:0050501) |
| 0.1 | 0.3 | GO:0004102 | choline O-acetyltransferase activity(GO:0004102) |
| 0.1 | 4.4 | GO:0017112 | Rab guanyl-nucleotide exchange factor activity(GO:0017112) |
| 0.1 | 0.2 | GO:0044547 | DNA topoisomerase binding(GO:0044547) |
| 0.1 | 0.2 | GO:0005148 | prolactin receptor binding(GO:0005148) |
| 0.1 | 3.1 | GO:0043539 | protein serine/threonine kinase activator activity(GO:0043539) |
| 0.1 | 0.5 | GO:0036312 | phosphatidylinositol 3-kinase regulatory subunit binding(GO:0036312) |
| 0.1 | 0.3 | GO:0016979 | lipoate-protein ligase activity(GO:0016979) |
| 0.1 | 0.2 | GO:0008309 | double-stranded DNA exodeoxyribonuclease activity(GO:0008309) |
| 0.1 | 1.0 | GO:0004128 | cytochrome-b5 reductase activity, acting on NAD(P)H(GO:0004128) |
| 0.1 | 0.1 | GO:0050508 | glucuronosyl-N-acetylglucosaminyl-proteoglycan 4-alpha-N-acetylglucosaminyltransferase activity(GO:0050508) |
| 0.1 | 0.4 | GO:0061665 | SUMO ligase activity(GO:0061665) |
| 0.1 | 0.2 | GO:0016454 | serine C-palmitoyltransferase activity(GO:0004758) C-palmitoyltransferase activity(GO:0016454) |
| 0.1 | 0.5 | GO:0008269 | JAK pathway signal transduction adaptor activity(GO:0008269) |
| 0.1 | 0.4 | GO:0070576 | vitamin D 24-hydroxylase activity(GO:0070576) |
| 0.1 | 0.1 | GO:0015616 | DNA translocase activity(GO:0015616) |
| 0.1 | 0.4 | GO:0070363 | mitochondrial light strand promoter sense binding(GO:0070363) |
| 0.1 | 1.0 | GO:0047429 | nucleoside-triphosphate diphosphatase activity(GO:0047429) |
| 0.1 | 0.4 | GO:0004176 | ATP-dependent peptidase activity(GO:0004176) |
| 0.1 | 0.2 | GO:0032139 | dinucleotide insertion or deletion binding(GO:0032139) |
| 0.1 | 1.9 | GO:0016805 | dipeptidase activity(GO:0016805) |
| 0.1 | 0.2 | GO:0035276 | ethanol binding(GO:0035276) |
| 0.1 | 0.3 | GO:0099602 | acetylcholine receptor regulator activity(GO:0030548) neurotransmitter receptor regulator activity(GO:0099602) |
| 0.1 | 0.2 | GO:0017130 | poly(C) RNA binding(GO:0017130) |
| 0.1 | 0.4 | GO:0050436 | microfibril binding(GO:0050436) |
| 0.1 | 0.6 | GO:0004689 | phosphorylase kinase activity(GO:0004689) |
| 0.1 | 0.9 | GO:0070700 | BMP receptor binding(GO:0070700) |
| 0.1 | 0.1 | GO:0016713 | oxidoreductase activity, acting on paired donors, with incorporation or reduction of molecular oxygen, reduced iron-sulfur protein as one donor, and incorporation of one atom of oxygen(GO:0016713) |
| 0.1 | 2.7 | GO:0050699 | WW domain binding(GO:0050699) |
| 0.1 | 0.2 | GO:0017147 | Wnt-protein binding(GO:0017147) |
| 0.1 | 0.3 | GO:0005477 | pyruvate secondary active transmembrane transporter activity(GO:0005477) |
| 0.1 | 0.9 | GO:0015643 | toxic substance binding(GO:0015643) |
| 0.1 | 0.5 | GO:0035312 | 5'-3' exodeoxyribonuclease activity(GO:0035312) |
| 0.1 | 1.5 | GO:0000062 | fatty-acyl-CoA binding(GO:0000062) |
| 0.1 | 0.3 | GO:0004449 | isocitrate dehydrogenase (NAD+) activity(GO:0004449) |
| 0.1 | 0.2 | GO:0017057 | 6-phosphogluconolactonase activity(GO:0017057) |
| 0.1 | 0.4 | GO:0039552 | RIG-I binding(GO:0039552) |
| 0.1 | 0.2 | GO:0019003 | GDP binding(GO:0019003) |
| 0.1 | 0.1 | GO:0001758 | retinal dehydrogenase activity(GO:0001758) |
| 0.1 | 1.0 | GO:0005402 | sugar:proton symporter activity(GO:0005351) cation:sugar symporter activity(GO:0005402) |
| 0.1 | 0.8 | GO:0042379 | chemokine receptor binding(GO:0042379) |
| 0.1 | 0.6 | GO:0016634 | oxidoreductase activity, acting on the CH-CH group of donors, oxygen as acceptor(GO:0016634) |
| 0.1 | 0.5 | GO:0047499 | calcium-independent phospholipase A2 activity(GO:0047499) |
| 0.1 | 0.3 | GO:0004427 | inorganic diphosphatase activity(GO:0004427) |
| 0.1 | 0.2 | GO:0030984 | kininogen binding(GO:0030984) |
| 0.1 | 1.7 | GO:0015269 | calcium-activated potassium channel activity(GO:0015269) |
| 0.1 | 0.3 | GO:0042910 | xenobiotic-transporting ATPase activity(GO:0008559) xenobiotic transporter activity(GO:0042910) |
| 0.1 | 0.3 | GO:0001594 | trace-amine receptor activity(GO:0001594) |
| 0.1 | 0.4 | GO:0015038 | glutathione disulfide oxidoreductase activity(GO:0015038) |
| 0.1 | 0.3 | GO:0038051 | glucocorticoid receptor activity(GO:0004883) glucocorticoid-activated RNA polymerase II transcription factor binding transcription factor activity(GO:0038051) |
| 0.1 | 0.1 | GO:0051120 | hepoxilin A3 synthase activity(GO:0051120) |
| 0.1 | 0.2 | GO:0008900 | hydrogen:potassium-exchanging ATPase activity(GO:0008900) |
| 0.1 | 0.3 | GO:0008174 | mRNA methyltransferase activity(GO:0008174) |
| 0.1 | 0.5 | GO:0004563 | beta-N-acetylhexosaminidase activity(GO:0004563) |
| 0.1 | 0.4 | GO:0046975 | histone methyltransferase activity (H3-K36 specific)(GO:0046975) |
| 0.1 | 0.2 | GO:0042134 | rRNA primary transcript binding(GO:0042134) |
| 0.1 | 0.2 | GO:0016509 | long-chain-3-hydroxyacyl-CoA dehydrogenase activity(GO:0016509) |
| 0.1 | 0.2 | GO:0008940 | nitrate reductase activity(GO:0008940) |
| 0.1 | 0.4 | GO:0003689 | DNA clamp loader activity(GO:0003689) protein-DNA loading ATPase activity(GO:0033170) |
| 0.1 | 0.2 | GO:0008532 | N-acetyllactosaminide beta-1,3-N-acetylglucosaminyltransferase activity(GO:0008532) |
| 0.1 | 0.4 | GO:0017018 | myosin phosphatase activity(GO:0017018) |
| 0.1 | 0.3 | GO:0015056 | corticotrophin-releasing factor receptor activity(GO:0015056) |
| 0.1 | 0.6 | GO:0022820 | potassium:chloride symporter activity(GO:0015379) potassium ion symporter activity(GO:0022820) |
| 0.1 | 0.3 | GO:0004634 | phosphopyruvate hydratase activity(GO:0004634) |
| 0.1 | 0.3 | GO:0030620 | U2 snRNA binding(GO:0030620) |
| 0.1 | 0.2 | GO:0050473 | arachidonate 15-lipoxygenase activity(GO:0050473) |
| 0.1 | 0.5 | GO:0086083 | cell adhesive protein binding involved in bundle of His cell-Purkinje myocyte communication(GO:0086083) |
| 0.1 | 0.2 | GO:0032564 | adenyl deoxyribonucleotide binding(GO:0032558) dATP binding(GO:0032564) |
| 0.1 | 0.2 | GO:0016784 | 3-mercaptopyruvate sulfurtransferase activity(GO:0016784) |
| 0.1 | 1.0 | GO:0004559 | alpha-mannosidase activity(GO:0004559) |
| 0.1 | 0.2 | GO:0042975 | peroxisome proliferator activated receptor binding(GO:0042975) |
| 0.1 | 0.6 | GO:0000014 | single-stranded DNA endodeoxyribonuclease activity(GO:0000014) |
| 0.1 | 0.2 | GO:0042562 | hormone binding(GO:0042562) |
| 0.1 | 0.4 | GO:0005319 | lipid transporter activity(GO:0005319) |
| 0.1 | 0.2 | GO:0003827 | alpha-1,3-mannosylglycoprotein 2-beta-N-acetylglucosaminyltransferase activity(GO:0003827) |
| 0.1 | 0.5 | GO:0004707 | MAP kinase activity(GO:0004707) |
| 0.1 | 0.6 | GO:0031852 | opioid receptor binding(GO:0031628) mu-type opioid receptor binding(GO:0031852) |
| 0.1 | 0.4 | GO:0016290 | palmitoyl-CoA hydrolase activity(GO:0016290) |
| 0.1 | 0.2 | GO:0000179 | rRNA (adenine-N6,N6-)-dimethyltransferase activity(GO:0000179) |
| 0.1 | 0.1 | GO:0004691 | cyclic nucleotide-dependent protein kinase activity(GO:0004690) cAMP-dependent protein kinase activity(GO:0004691) |
| 0.1 | 0.3 | GO:0044388 | small protein activating enzyme binding(GO:0044388) |
| 0.1 | 0.3 | GO:0030628 | pre-mRNA 3'-splice site binding(GO:0030628) |
| 0.1 | 0.1 | GO:0061752 | telomeric repeat-containing RNA binding(GO:0061752) |
| 0.1 | 0.3 | GO:0098821 | BMP receptor activity(GO:0098821) |
| 0.1 | 0.3 | GO:0004591 | oxoglutarate dehydrogenase (succinyl-transferring) activity(GO:0004591) |
| 0.1 | 0.1 | GO:0090554 | apolipoprotein A-I receptor activity(GO:0034188) phosphatidylcholine-translocating ATPase activity(GO:0090554) phosphatidylserine-translocating ATPase activity(GO:0090556) |
| 0.1 | 0.1 | GO:0086006 | voltage-gated sodium channel activity involved in cardiac muscle cell action potential(GO:0086006) |
| 0.1 | 0.2 | GO:0016972 | flavin-linked sulfhydryl oxidase activity(GO:0016971) thiol oxidase activity(GO:0016972) |
| 0.1 | 0.2 | GO:0070996 | type 1 melanocortin receptor binding(GO:0070996) |
| 0.1 | 0.1 | GO:1904929 | coreceptor activity involved in Wnt signaling pathway, planar cell polarity pathway(GO:1904929) |
| 0.1 | 0.9 | GO:0004861 | cyclin-dependent protein serine/threonine kinase inhibitor activity(GO:0004861) |
| 0.1 | 0.5 | GO:0031386 | protein tag(GO:0031386) |
| 0.1 | 0.5 | GO:0009982 | pseudouridine synthase activity(GO:0009982) |
| 0.1 | 0.4 | GO:0017077 | oxidative phosphorylation uncoupler activity(GO:0017077) |
| 0.1 | 0.2 | GO:0016406 | carnitine O-acyltransferase activity(GO:0016406) |
| 0.1 | 1.8 | GO:0031593 | polyubiquitin binding(GO:0031593) |
| 0.0 | 0.4 | GO:0097016 | L27 domain binding(GO:0097016) |
| 0.0 | 0.2 | GO:0001025 | RNA polymerase III transcription factor binding(GO:0001025) |
| 0.0 | 0.1 | GO:0047493 | sphingomyelin synthase activity(GO:0033188) ceramide cholinephosphotransferase activity(GO:0047493) |
| 0.0 | 0.3 | GO:0008467 | [heparan sulfate]-glucosamine 3-sulfotransferase 1 activity(GO:0008467) |
| 0.0 | 0.5 | GO:0022841 | potassium ion leak channel activity(GO:0022841) |
| 0.0 | 0.6 | GO:0043295 | glutathione binding(GO:0043295) |
| 0.0 | 0.9 | GO:0008157 | protein phosphatase 1 binding(GO:0008157) |
| 0.0 | 0.2 | GO:0030976 | thiamine pyrophosphate binding(GO:0030976) |
| 0.0 | 0.3 | GO:0034062 | DNA-directed RNA polymerase activity(GO:0003899) RNA polymerase activity(GO:0034062) |
| 0.0 | 0.3 | GO:0004185 | serine-type carboxypeptidase activity(GO:0004185) |
| 0.0 | 0.3 | GO:0001591 | dopamine neurotransmitter receptor activity, coupled via Gi/Go(GO:0001591) |
| 0.0 | 0.1 | GO:0003918 | DNA topoisomerase type II (ATP-hydrolyzing) activity(GO:0003918) DNA topoisomerase II activity(GO:0061505) |
| 0.0 | 0.1 | GO:0004618 | phosphoglycerate kinase activity(GO:0004618) |
| 0.0 | 0.2 | GO:0030197 | extracellular matrix constituent, lubricant activity(GO:0030197) |
| 0.0 | 0.1 | GO:0004983 | neuropeptide Y receptor activity(GO:0004983) |
| 0.0 | 0.0 | GO:0015199 | amino-acid betaine transmembrane transporter activity(GO:0015199) carnitine transmembrane transporter activity(GO:0015226) |
| 0.0 | 0.3 | GO:0038052 | RNA polymerase II transcription factor activity, estrogen-activated sequence-specific DNA binding(GO:0038052) |
| 0.0 | 0.7 | GO:0008391 | arachidonic acid monooxygenase activity(GO:0008391) arachidonic acid epoxygenase activity(GO:0008392) |
| 0.0 | 1.3 | GO:0031624 | ubiquitin conjugating enzyme binding(GO:0031624) |
| 0.0 | 0.2 | GO:0015181 | arginine transmembrane transporter activity(GO:0015181) |
| 0.0 | 0.5 | GO:0003857 | 3-hydroxyacyl-CoA dehydrogenase activity(GO:0003857) |
| 0.0 | 0.1 | GO:0042015 | interleukin-20 binding(GO:0042015) |
| 0.0 | 2.3 | GO:0043621 | protein self-association(GO:0043621) |
| 0.0 | 0.3 | GO:0032051 | clathrin light chain binding(GO:0032051) |
| 0.0 | 0.2 | GO:0044323 | retinoic acid-responsive element binding(GO:0044323) |
| 0.0 | 0.1 | GO:0035662 | Toll-like receptor 4 binding(GO:0035662) |
| 0.0 | 1.8 | GO:0016831 | carboxy-lyase activity(GO:0016831) |
| 0.0 | 0.6 | GO:0045295 | gamma-catenin binding(GO:0045295) |
| 0.0 | 0.3 | GO:0001206 | transcriptional repressor activity, RNA polymerase II distal enhancer sequence-specific binding(GO:0001206) |
| 0.0 | 0.5 | GO:0030280 | structural constituent of epidermis(GO:0030280) |
| 0.0 | 0.4 | GO:0004645 | phosphorylase activity(GO:0004645) |
| 0.0 | 0.2 | GO:0004447 | iodide peroxidase activity(GO:0004447) |
| 0.0 | 0.6 | GO:0016854 | racemase and epimerase activity(GO:0016854) |
| 0.0 | 0.5 | GO:0042809 | vitamin D receptor binding(GO:0042809) |
| 0.0 | 0.3 | GO:0004305 | ethanolamine kinase activity(GO:0004305) |
| 0.0 | 0.1 | GO:0035727 | lysophosphatidic acid binding(GO:0035727) |
| 0.0 | 0.1 | GO:0016936 | galactoside binding(GO:0016936) |
| 0.0 | 0.1 | GO:0016019 | peptidoglycan receptor activity(GO:0016019) |
| 0.0 | 0.2 | GO:0003916 | DNA topoisomerase activity(GO:0003916) DNA topoisomerase type I activity(GO:0003917) |
| 0.0 | 0.1 | GO:0004999 | vasoactive intestinal polypeptide receptor activity(GO:0004999) |
| 0.0 | 0.1 | GO:0001851 | complement component C3b binding(GO:0001851) |
| 0.0 | 1.4 | GO:0015020 | glucuronosyltransferase activity(GO:0015020) |
| 0.0 | 0.5 | GO:0038132 | neuregulin binding(GO:0038132) |
| 0.0 | 0.4 | GO:0035613 | RNA stem-loop binding(GO:0035613) |
| 0.0 | 0.4 | GO:0017034 | Rap guanyl-nucleotide exchange factor activity(GO:0017034) |
| 0.0 | 0.3 | GO:0004372 | glycine hydroxymethyltransferase activity(GO:0004372) threonine aldolase activity(GO:0004793) L-allo-threonine aldolase activity(GO:0008732) |
| 0.0 | 0.1 | GO:0030551 | cyclic nucleotide binding(GO:0030551) |
| 0.0 | 0.1 | GO:0005078 | MAP-kinase scaffold activity(GO:0005078) |
| 0.0 | 0.3 | GO:0016861 | intramolecular oxidoreductase activity, interconverting aldoses and ketoses(GO:0016861) |
| 0.0 | 0.2 | GO:0051575 | 5'-deoxyribose-5-phosphate lyase activity(GO:0051575) |
| 0.0 | 0.2 | GO:0051033 | nucleic acid transmembrane transporter activity(GO:0051032) RNA transmembrane transporter activity(GO:0051033) |
| 0.0 | 0.5 | GO:0004065 | arylsulfatase activity(GO:0004065) |
| 0.0 | 0.9 | GO:0004181 | metallocarboxypeptidase activity(GO:0004181) |
| 0.0 | 0.8 | GO:0043236 | laminin binding(GO:0043236) |
| 0.0 | 0.2 | GO:0008420 | CTD phosphatase activity(GO:0008420) |
| 0.0 | 0.2 | GO:0010484 | H3 histone acetyltransferase activity(GO:0010484) |
| 0.0 | 0.9 | GO:0008143 | poly(A) binding(GO:0008143) |
| 0.0 | 0.1 | GO:0005134 | interleukin-2 receptor binding(GO:0005134) |
| 0.0 | 0.3 | GO:0003720 | telomerase activity(GO:0003720) RNA-directed DNA polymerase activity(GO:0003964) |
| 0.0 | 0.2 | GO:0097371 | MDM2/MDM4 family protein binding(GO:0097371) |
| 0.0 | 0.2 | GO:0051525 | NFAT protein binding(GO:0051525) |
| 0.0 | 0.7 | GO:0017081 | chloride channel regulator activity(GO:0017081) |
| 0.0 | 0.1 | GO:0052591 | sn-glycerol-3-phosphate:ubiquinone oxidoreductase activity(GO:0052590) sn-glycerol-3-phosphate:ubiquinone-8 oxidoreductase activity(GO:0052591) |
| 0.0 | 0.2 | GO:0008484 | sulfuric ester hydrolase activity(GO:0008484) |
| 0.0 | 0.3 | GO:0019871 | sodium channel inhibitor activity(GO:0019871) |
| 0.0 | 0.4 | GO:0000774 | adenyl-nucleotide exchange factor activity(GO:0000774) |
| 0.0 | 0.3 | GO:0003995 | acyl-CoA dehydrogenase activity(GO:0003995) |
| 0.0 | 0.0 | GO:0000990 | transcription factor activity, core RNA polymerase binding(GO:0000990) |
| 0.0 | 0.1 | GO:0004517 | nitric-oxide synthase activity(GO:0004517) |
| 0.0 | 0.5 | GO:0022884 | macromolecule transmembrane transporter activity(GO:0022884) |
| 0.0 | 0.4 | GO:0019104 | DNA N-glycosylase activity(GO:0019104) |
| 0.0 | 1.3 | GO:0043027 | cysteine-type endopeptidase inhibitor activity involved in apoptotic process(GO:0043027) |
| 0.0 | 0.1 | GO:0008502 | melatonin receptor activity(GO:0008502) |
| 0.0 | 0.1 | GO:0030292 | protein tyrosine kinase inhibitor activity(GO:0030292) |
| 0.0 | 0.1 | GO:0051425 | PTB domain binding(GO:0051425) |
| 0.0 | 0.1 | GO:0070740 | tubulin-glutamic acid ligase activity(GO:0070740) |
| 0.0 | 0.1 | GO:0008329 | signaling pattern recognition receptor activity(GO:0008329) pattern recognition receptor activity(GO:0038187) |
| 0.0 | 0.3 | GO:0034713 | type I transforming growth factor beta receptor binding(GO:0034713) |
| 0.0 | 0.5 | GO:0005522 | profilin binding(GO:0005522) |
| 0.0 | 0.2 | GO:0052650 | NADP-retinol dehydrogenase activity(GO:0052650) |
| 0.0 | 0.1 | GO:0031877 | somatostatin receptor binding(GO:0031877) |
| 0.0 | 0.2 | GO:0015186 | L-glutamine transmembrane transporter activity(GO:0015186) |
| 0.0 | 0.1 | GO:1990430 | extracellular matrix protein binding(GO:1990430) |
| 0.0 | 0.3 | GO:0047623 | AMP deaminase activity(GO:0003876) adenosine-phosphate deaminase activity(GO:0047623) |
| 0.0 | 0.7 | GO:0071889 | 14-3-3 protein binding(GO:0071889) |
| 0.0 | 0.1 | GO:0051880 | G-quadruplex DNA binding(GO:0051880) |
| 0.0 | 0.1 | GO:0031545 | peptidyl-proline 4-dioxygenase activity(GO:0031545) |
| 0.0 | 0.2 | GO:0047555 | 3',5'-cyclic-GMP phosphodiesterase activity(GO:0047555) |
| 0.0 | 1.0 | GO:0070577 | lysine-acetylated histone binding(GO:0070577) |
| 0.0 | 0.1 | GO:0017159 | pantetheine hydrolase activity(GO:0017159) |
| 0.0 | 0.3 | GO:0070016 | armadillo repeat domain binding(GO:0070016) |
| 0.0 | 0.1 | GO:0004528 | phosphodiesterase I activity(GO:0004528) |
| 0.0 | 0.6 | GO:0002162 | dystroglycan binding(GO:0002162) |
| 0.0 | 0.1 | GO:0004994 | somatostatin receptor activity(GO:0004994) |
| 0.0 | 0.1 | GO:0086077 | gap junction channel activity involved in SA node cell-atrial cardiac muscle cell electrical coupling(GO:0086020) gap junction channel activity involved in AV node cell-bundle of His cell electrical coupling(GO:0086077) |
| 0.0 | 0.5 | GO:0000993 | RNA polymerase II core binding(GO:0000993) |
| 0.0 | 0.1 | GO:0015111 | iodide transmembrane transporter activity(GO:0015111) |
| 0.0 | 0.4 | GO:0016864 | protein disulfide isomerase activity(GO:0003756) intramolecular oxidoreductase activity, transposing S-S bonds(GO:0016864) |
| 0.0 | 0.2 | GO:0001727 | lipid kinase activity(GO:0001727) |
| 0.0 | 0.1 | GO:0070735 | protein-glycine ligase activity(GO:0070735) |
| 0.0 | 0.0 | GO:0071532 | ankyrin repeat binding(GO:0071532) |
| 0.0 | 0.3 | GO:0003996 | acyl-CoA ligase activity(GO:0003996) |
| 0.0 | 0.1 | GO:0003956 | NAD(P)+-protein-arginine ADP-ribosyltransferase activity(GO:0003956) |
| 0.0 | 0.0 | GO:0004998 | transferrin receptor activity(GO:0004998) |
| 0.0 | 0.1 | GO:0031811 | G-protein coupled nucleotide receptor binding(GO:0031811) P2Y1 nucleotide receptor binding(GO:0031812) |
| 0.0 | 0.1 | GO:0004706 | JUN kinase kinase kinase activity(GO:0004706) |
| 0.0 | 0.2 | GO:0052658 | inositol-1,4,5-trisphosphate 5-phosphatase activity(GO:0052658) |
| 0.0 | 0.3 | GO:0019706 | protein-cysteine S-palmitoyltransferase activity(GO:0019706) protein-cysteine S-acyltransferase activity(GO:0019707) |
| 0.0 | 0.3 | GO:0070840 | dynein complex binding(GO:0070840) |
| 0.0 | 0.4 | GO:0005112 | Notch binding(GO:0005112) |
| 0.0 | 1.6 | GO:0004843 | thiol-dependent ubiquitin-specific protease activity(GO:0004843) |
| 0.0 | 0.5 | GO:0001056 | RNA polymerase III activity(GO:0001056) |
| 0.0 | 0.1 | GO:0016434 | rRNA (cytosine) methyltransferase activity(GO:0016434) |
| 0.0 | 0.2 | GO:0005007 | fibroblast growth factor-activated receptor activity(GO:0005007) |
| 0.0 | 0.4 | GO:0051959 | dynein light intermediate chain binding(GO:0051959) |
| 0.0 | 0.1 | GO:0030621 | U4 snRNA binding(GO:0030621) |
| 0.0 | 0.1 | GO:0005277 | acetylcholine transmembrane transporter activity(GO:0005277) acetate ester transmembrane transporter activity(GO:1901375) |
| 0.0 | 0.1 | GO:0030160 | GKAP/Homer scaffold activity(GO:0030160) |
| 0.0 | 0.3 | GO:0047372 | acylglycerol lipase activity(GO:0047372) |
| 0.0 | 0.1 | GO:0017150 | tRNA dihydrouridine synthase activity(GO:0017150) |
| 0.0 | 0.2 | GO:0001042 | RNA polymerase I core binding(GO:0001042) |
| 0.0 | 0.7 | GO:0004532 | exoribonuclease activity(GO:0004532) |
| 0.0 | 0.3 | GO:0043522 | leucine zipper domain binding(GO:0043522) |
| 0.0 | 0.1 | GO:0046538 | bisphosphoglycerate mutase activity(GO:0004082) phosphoglycerate mutase activity(GO:0004619) 2,3-bisphosphoglycerate-dependent phosphoglycerate mutase activity(GO:0046538) |
| 0.0 | 0.0 | GO:0051870 | methotrexate binding(GO:0051870) |
| 0.0 | 0.1 | GO:0060175 | brain-derived neurotrophic factor-activated receptor activity(GO:0060175) |
| 0.0 | 0.1 | GO:0005149 | interleukin-1 receptor binding(GO:0005149) |
| 0.0 | 0.1 | GO:1903136 | cuprous ion binding(GO:1903136) |
| 0.0 | 0.1 | GO:0044378 | non-sequence-specific DNA binding, bending(GO:0044378) |
| 0.0 | 0.1 | GO:0032451 | demethylase activity(GO:0032451) |
| 0.0 | 1.0 | GO:0008270 | zinc ion binding(GO:0008270) |
| 0.0 | 2.1 | GO:0017124 | SH3 domain binding(GO:0017124) |
| 0.0 | 0.3 | GO:0004659 | prenyltransferase activity(GO:0004659) |
| 0.0 | 0.5 | GO:0005540 | hyaluronic acid binding(GO:0005540) |
| 0.0 | 0.3 | GO:0017017 | MAP kinase tyrosine/serine/threonine phosphatase activity(GO:0017017) |
| 0.0 | 0.0 | GO:0016653 | oxidoreductase activity, acting on NAD(P)H, heme protein as acceptor(GO:0016653) |
| 0.0 | 0.7 | GO:0030332 | cyclin binding(GO:0030332) |
| 0.0 | 0.1 | GO:0051184 | cofactor transporter activity(GO:0051184) |
| 0.0 | 0.4 | GO:0015175 | neutral amino acid transmembrane transporter activity(GO:0015175) |
| 0.0 | 0.1 | GO:0046912 | transferase activity, transferring acyl groups, acyl groups converted into alkyl on transfer(GO:0046912) |
| 0.0 | 0.5 | GO:0070003 | threonine-type endopeptidase activity(GO:0004298) threonine-type peptidase activity(GO:0070003) |
| 0.0 | 0.0 | GO:0019981 | interleukin-6 receptor activity(GO:0004915) interleukin-6 binding(GO:0019981) |
| 0.0 | 1.0 | GO:0046934 | phosphatidylinositol-4,5-bisphosphate 3-kinase activity(GO:0046934) |
| 0.0 | 0.1 | GO:0047045 | testosterone 17-beta-dehydrogenase (NADP+) activity(GO:0047045) |
| 0.0 | 0.1 | GO:0030020 | extracellular matrix structural constituent conferring tensile strength(GO:0030020) |
| 0.0 | 0.2 | GO:0016018 | cyclosporin A binding(GO:0016018) |
| 0.0 | 0.1 | GO:0030275 | LRR domain binding(GO:0030275) |
| 0.0 | 0.1 | GO:0000822 | inositol hexakisphosphate binding(GO:0000822) |
| 0.0 | 0.2 | GO:0016813 | hydrolase activity, acting on carbon-nitrogen (but not peptide) bonds, in linear amidines(GO:0016813) |
| 0.0 | 0.1 | GO:0016715 | oxidoreductase activity, acting on paired donors, with incorporation or reduction of molecular oxygen, reduced ascorbate as one donor, and incorporation of one atom of oxygen(GO:0016715) |
| 0.0 | 0.1 | GO:0004980 | melanocyte-stimulating hormone receptor activity(GO:0004980) |
| 0.0 | 0.1 | GO:0016895 | exodeoxyribonuclease activity(GO:0004529) exodeoxyribonuclease activity, producing 5'-phosphomonoesters(GO:0016895) |
| 0.0 | 1.4 | GO:0030165 | PDZ domain binding(GO:0030165) |
| 0.0 | 0.3 | GO:0004012 | phospholipid-translocating ATPase activity(GO:0004012) |
| 0.0 | 0.8 | GO:0000049 | tRNA binding(GO:0000049) |
| 0.0 | 0.2 | GO:0071837 | HMG box domain binding(GO:0071837) |
| 0.0 | 0.6 | GO:0004890 | GABA-A receptor activity(GO:0004890) |
| 0.0 | 0.0 | GO:0052659 | inositol-1,3,4,5-tetrakisphosphate 5-phosphatase activity(GO:0052659) inositol tetrakisphosphate phosphatase activity(GO:0052743) |
| 0.0 | 0.2 | GO:0101005 | thiol-dependent ubiquitinyl hydrolase activity(GO:0036459) ubiquitinyl hydrolase activity(GO:0101005) |
| 0.0 | 0.1 | GO:0004518 | nuclease activity(GO:0004518) |
| 0.0 | 2.3 | GO:0001078 | transcriptional repressor activity, RNA polymerase II core promoter proximal region sequence-specific binding(GO:0001078) |
| 0.0 | 0.0 | GO:0099529 | neurotransmitter receptor activity involved in regulation of postsynaptic membrane potential(GO:0099529) transmitter-gated ion channel activity involved in regulation of postsynaptic membrane potential(GO:1904315) |
| 0.0 | 0.1 | GO:0036310 | annealing helicase activity(GO:0036310) |
| 0.0 | 0.1 | GO:0004971 | AMPA glutamate receptor activity(GO:0004971) |
| 0.0 | 0.1 | GO:0001099 | basal transcription machinery binding(GO:0001098) basal RNA polymerase II transcription machinery binding(GO:0001099) |
| 0.0 | 0.3 | GO:0003746 | translation elongation factor activity(GO:0003746) |
| 0.0 | 0.1 | GO:0019215 | intermediate filament binding(GO:0019215) |
| 0.0 | 0.1 | GO:0015385 | monovalent cation:proton antiporter activity(GO:0005451) sodium:proton antiporter activity(GO:0015385) potassium:proton antiporter activity(GO:0015386) |
| 0.0 | 0.1 | GO:0004996 | thyroid-stimulating hormone receptor activity(GO:0004996) |
| 0.0 | 0.1 | GO:0005391 | sodium:potassium-exchanging ATPase activity(GO:0005391) potassium-transporting ATPase activity(GO:0008556) |
| 0.0 | 0.1 | GO:0004306 | ethanolamine-phosphate cytidylyltransferase activity(GO:0004306) |
| 0.0 | 0.4 | GO:0005547 | phosphatidylinositol-3,4,5-trisphosphate binding(GO:0005547) |
| 0.0 | 0.1 | GO:0003796 | lysozyme activity(GO:0003796) |
| 0.0 | 0.1 | GO:0051011 | microtubule minus-end binding(GO:0051011) |
| 0.0 | 0.1 | GO:0033613 | activating transcription factor binding(GO:0033613) |
| 0.0 | 0.1 | GO:0016493 | C-C chemokine receptor activity(GO:0016493) |
| 0.0 | 0.1 | GO:0038047 | beta-endorphin receptor activity(GO:0004979) morphine receptor activity(GO:0038047) |
| 0.0 | 0.1 | GO:0050682 | AF-2 domain binding(GO:0050682) |
| 0.0 | 0.3 | GO:0008139 | nuclear localization sequence binding(GO:0008139) |
| 0.0 | 0.2 | GO:0001105 | RNA polymerase II transcription coactivator activity(GO:0001105) |
| 0.0 | 0.6 | GO:0003678 | DNA helicase activity(GO:0003678) |
| 0.0 | 0.0 | GO:0033906 | hyaluronoglucuronidase activity(GO:0033906) |
| 0.0 | 0.4 | GO:0015464 | acetylcholine receptor activity(GO:0015464) |
| 0.0 | 0.2 | GO:0005159 | insulin-like growth factor receptor binding(GO:0005159) |
| 0.0 | 0.2 | GO:0016922 | ligand-dependent nuclear receptor binding(GO:0016922) |
| 0.0 | 0.1 | GO:0050733 | RS domain binding(GO:0050733) |
| 0.0 | 0.1 | GO:0030742 | GTP-dependent protein binding(GO:0030742) |
| 0.0 | 0.2 | GO:0019843 | rRNA binding(GO:0019843) |
| 0.0 | 0.3 | GO:0004520 | endodeoxyribonuclease activity(GO:0004520) |
| 0.0 | 0.1 | GO:0009374 | biotin binding(GO:0009374) |
| 0.0 | 0.0 | GO:0005154 | epidermal growth factor receptor binding(GO:0005154) |
| 0.0 | 0.3 | GO:0030676 | Rac guanyl-nucleotide exchange factor activity(GO:0030676) |
| 0.0 | 0.3 | GO:0031492 | nucleosomal DNA binding(GO:0031492) |
| 0.0 | 0.1 | GO:1904264 | ubiquitin protein ligase activity involved in ERAD pathway(GO:1904264) |
| 0.0 | 0.1 | GO:0008408 | 3'-5' exonuclease activity(GO:0008408) |
| 0.0 | 0.1 | GO:0005250 | A-type (transient outward) potassium channel activity(GO:0005250) |
| 0.0 | 0.3 | GO:0043015 | gamma-tubulin binding(GO:0043015) |
| 0.0 | 0.0 | GO:0010698 | acetyltransferase activator activity(GO:0010698) |
| 0.0 | 0.1 | GO:0019789 | SUMO transferase activity(GO:0019789) |
| 0.0 | 0.0 | GO:0005222 | intracellular cAMP activated cation channel activity(GO:0005222) |
| 0.0 | 0.1 | GO:0003688 | DNA replication origin binding(GO:0003688) |
| 0.0 | 0.1 | GO:0042043 | neurexin family protein binding(GO:0042043) |
| 0.0 | 0.1 | GO:0051059 | NF-kappaB binding(GO:0051059) |
| 0.0 | 0.2 | GO:0004708 | MAP kinase kinase activity(GO:0004708) |
| 0.0 | 0.1 | GO:0015467 | G-protein activated inward rectifier potassium channel activity(GO:0015467) |
| 0.0 | 0.1 | GO:0051864 | histone demethylase activity (H3-K36 specific)(GO:0051864) |
Gene overrepresentation in cellular_component category:
| Log-likelihood per target | Total log-likelihood | Term | Description |
|---|---|---|---|
| 1.6 | 4.7 | GO:0071751 | IgA immunoglobulin complex(GO:0071745) IgA immunoglobulin complex, circulating(GO:0071746) monomeric IgA immunoglobulin complex(GO:0071748) polymeric IgA immunoglobulin complex(GO:0071749) secretory IgA immunoglobulin complex(GO:0071751) |
| 1.5 | 9.0 | GO:0034687 | integrin alphaL-beta2 complex(GO:0034687) |
| 1.4 | 29.7 | GO:0042613 | MHC class II protein complex(GO:0042613) |
| 1.4 | 14.9 | GO:0042611 | MHC protein complex(GO:0042611) MHC class I protein complex(GO:0042612) |
| 1.2 | 57.0 | GO:0042571 | immunoglobulin complex, circulating(GO:0042571) |
| 1.0 | 7.0 | GO:0019815 | B cell receptor complex(GO:0019815) |
| 0.6 | 0.6 | GO:0036019 | endolysosome(GO:0036019) |
| 0.6 | 1.9 | GO:0034365 | discoidal high-density lipoprotein particle(GO:0034365) |
| 0.6 | 2.4 | GO:0032144 | 4-aminobutyrate transaminase complex(GO:0032144) |
| 0.5 | 0.5 | GO:0034688 | integrin alphaM-beta2 complex(GO:0034688) |
| 0.5 | 2.0 | GO:1990031 | pinceau fiber(GO:1990031) |
| 0.5 | 5.2 | GO:0042105 | alpha-beta T cell receptor complex(GO:0042105) |
| 0.5 | 3.7 | GO:0032010 | phagolysosome(GO:0032010) |
| 0.5 | 6.9 | GO:0005641 | nuclear envelope lumen(GO:0005641) |
| 0.5 | 3.7 | GO:0045179 | apical cortex(GO:0045179) |
| 0.5 | 1.8 | GO:0034669 | integrin alpha4-beta7 complex(GO:0034669) |
| 0.4 | 2.4 | GO:0098560 | cytoplasmic side of late endosome membrane(GO:0098560) |
| 0.4 | 2.0 | GO:0036398 | TCR signalosome(GO:0036398) |
| 0.4 | 0.4 | GO:0032591 | dendritic spine membrane(GO:0032591) |
| 0.4 | 0.4 | GO:0005683 | U7 snRNP(GO:0005683) |
| 0.4 | 2.3 | GO:0097208 | alveolar lamellar body(GO:0097208) |
| 0.4 | 0.7 | GO:0005876 | spindle microtubule(GO:0005876) |
| 0.3 | 4.1 | GO:0032045 | guanyl-nucleotide exchange factor complex(GO:0032045) |
| 0.3 | 1.9 | GO:0030893 | meiotic cohesin complex(GO:0030893) |
| 0.3 | 2.2 | GO:0033269 | internode region of axon(GO:0033269) |
| 0.3 | 5.9 | GO:0001891 | phagocytic cup(GO:0001891) |
| 0.3 | 1.5 | GO:0034666 | integrin alpha2-beta1 complex(GO:0034666) |
| 0.3 | 0.3 | GO:0001750 | photoreceptor outer segment(GO:0001750) |
| 0.3 | 1.7 | GO:0035692 | macrophage migration inhibitory factor receptor complex(GO:0035692) |
| 0.3 | 2.2 | GO:1990111 | spermatoproteasome complex(GO:1990111) |
| 0.3 | 1.1 | GO:0070876 | SOSS complex(GO:0070876) |
| 0.3 | 1.3 | GO:0030678 | mitochondrial ribonuclease P complex(GO:0030678) |
| 0.2 | 1.0 | GO:0005846 | nuclear cap binding complex(GO:0005846) |
| 0.2 | 0.7 | GO:0030895 | apolipoprotein B mRNA editing enzyme complex(GO:0030895) |
| 0.2 | 1.4 | GO:0008537 | proteasome activator complex(GO:0008537) |
| 0.2 | 1.2 | GO:0005947 | mitochondrial alpha-ketoglutarate dehydrogenase complex(GO:0005947) |
| 0.2 | 1.2 | GO:0031232 | extrinsic component of external side of plasma membrane(GO:0031232) |
| 0.2 | 0.7 | GO:0035354 | Toll-like receptor 1-Toll-like receptor 2 protein complex(GO:0035354) |
| 0.2 | 0.9 | GO:0033257 | Bcl3/NF-kappaB2 complex(GO:0033257) |
| 0.2 | 1.3 | GO:1990131 | EGO complex(GO:0034448) Gtr1-Gtr2 GTPase complex(GO:1990131) |
| 0.2 | 1.1 | GO:0032449 | CBM complex(GO:0032449) |
| 0.2 | 3.9 | GO:0031083 | BLOC-1 complex(GO:0031083) |
| 0.2 | 1.0 | GO:1905202 | 3-methylcrotonyl-CoA carboxylase complex, mitochondrial(GO:0002169) methylcrotonoyl-CoA carboxylase complex(GO:1905202) |
| 0.2 | 4.6 | GO:0000242 | pericentriolar material(GO:0000242) |
| 0.2 | 0.8 | GO:0034098 | VCP-NPL4-UFD1 AAA ATPase complex(GO:0034098) |
| 0.2 | 1.1 | GO:0034363 | intermediate-density lipoprotein particle(GO:0034363) |
| 0.2 | 0.2 | GO:0036477 | somatodendritic compartment(GO:0036477) |
| 0.2 | 1.7 | GO:0016529 | sarcoplasmic reticulum(GO:0016529) |
| 0.2 | 0.5 | GO:0070032 | synaptobrevin 2-SNAP-25-syntaxin-1a-complexin I complex(GO:0070032) |
| 0.2 | 12.2 | GO:0015030 | Cajal body(GO:0015030) |
| 0.2 | 0.2 | GO:0044295 | axonal growth cone(GO:0044295) |
| 0.2 | 0.3 | GO:0031045 | dense core granule(GO:0031045) |
| 0.2 | 0.2 | GO:0032838 | cell projection cytoplasm(GO:0032838) |
| 0.2 | 0.8 | GO:0005945 | 6-phosphofructokinase complex(GO:0005945) |
| 0.2 | 0.6 | GO:0000811 | GINS complex(GO:0000811) |
| 0.2 | 0.5 | GO:1990622 | CHOP-ATF3 complex(GO:1990622) |
| 0.1 | 1.3 | GO:0097413 | Lewy body(GO:0097413) |
| 0.1 | 3.9 | GO:0000178 | exosome (RNase complex)(GO:0000178) |
| 0.1 | 2.6 | GO:0032433 | filopodium tip(GO:0032433) |
| 0.1 | 2.4 | GO:0042101 | T cell receptor complex(GO:0042101) |
| 0.1 | 0.1 | GO:0005663 | DNA replication factor C complex(GO:0005663) |
| 0.1 | 0.4 | GO:0031417 | NatC complex(GO:0031417) |
| 0.1 | 3.3 | GO:0031528 | microvillus membrane(GO:0031528) |
| 0.1 | 7.2 | GO:0016235 | aggresome(GO:0016235) |
| 0.1 | 0.1 | GO:1990425 | ryanodine receptor complex(GO:1990425) |
| 0.1 | 0.7 | GO:0097179 | protease inhibitor complex(GO:0097179) |
| 0.1 | 0.8 | GO:1902560 | GMP reductase complex(GO:1902560) |
| 0.1 | 2.5 | GO:0034663 | endoplasmic reticulum chaperone complex(GO:0034663) |
| 0.1 | 0.4 | GO:0030289 | protein phosphatase 4 complex(GO:0030289) |
| 0.1 | 1.0 | GO:0033256 | I-kappaB/NF-kappaB complex(GO:0033256) |
| 0.1 | 0.1 | GO:0042567 | insulin-like growth factor ternary complex(GO:0042567) |
| 0.1 | 2.9 | GO:0031264 | death-inducing signaling complex(GO:0031264) |
| 0.1 | 0.7 | GO:0032280 | symmetric synapse(GO:0032280) |
| 0.1 | 0.1 | GO:0035061 | interchromatin granule(GO:0035061) |
| 0.1 | 0.2 | GO:0097443 | sorting endosome(GO:0097443) |
| 0.1 | 0.5 | GO:0002189 | ribose phosphate diphosphokinase complex(GO:0002189) |
| 0.1 | 0.3 | GO:0070695 | FHF complex(GO:0070695) |
| 0.1 | 0.7 | GO:1990589 | ATF4-CREB1 transcription factor complex(GO:1990589) |
| 0.1 | 2.1 | GO:0031254 | uropod(GO:0001931) cell trailing edge(GO:0031254) |
| 0.1 | 0.3 | GO:0009330 | DNA topoisomerase complex (ATP-hydrolyzing)(GO:0009330) |
| 0.1 | 0.4 | GO:0031085 | BLOC-3 complex(GO:0031085) |
| 0.1 | 0.2 | GO:0030314 | junctional membrane complex(GO:0030314) |
| 0.1 | 1.3 | GO:0042555 | MCM complex(GO:0042555) |
| 0.1 | 1.3 | GO:0097136 | Bcl-2 family protein complex(GO:0097136) |
| 0.1 | 0.4 | GO:0031905 | early endosome lumen(GO:0031905) |
| 0.1 | 0.5 | GO:0043296 | apical junction complex(GO:0043296) |
| 0.1 | 0.9 | GO:0071437 | invadopodium(GO:0071437) |
| 0.1 | 0.5 | GO:0071008 | U2-type post-mRNA release spliceosomal complex(GO:0071008) |
| 0.1 | 0.3 | GO:0097447 | dendritic tree(GO:0097447) |
| 0.1 | 0.5 | GO:0044279 | other organism cell membrane(GO:0044218) other organism membrane(GO:0044279) |
| 0.1 | 0.4 | GO:0030485 | smooth muscle contractile fiber(GO:0030485) |
| 0.1 | 0.9 | GO:0043190 | ATP-binding cassette (ABC) transporter complex(GO:0043190) |
| 0.1 | 0.3 | GO:0071595 | Nem1-Spo7 phosphatase complex(GO:0071595) |
| 0.1 | 0.3 | GO:0033648 | host intracellular organelle(GO:0033647) host intracellular membrane-bounded organelle(GO:0033648) |
| 0.1 | 0.7 | GO:0005610 | laminin-5 complex(GO:0005610) |
| 0.1 | 0.3 | GO:0005869 | dynactin complex(GO:0005869) |
| 0.1 | 0.3 | GO:0071062 | alphav-beta3 integrin-vitronectin complex(GO:0071062) |
| 0.1 | 0.3 | GO:1990462 | omegasome(GO:1990462) |
| 0.1 | 0.3 | GO:0005968 | Rab-protein geranylgeranyltransferase complex(GO:0005968) |
| 0.1 | 0.2 | GO:0070195 | growth hormone receptor complex(GO:0070195) |
| 0.1 | 0.3 | GO:0032937 | SREBP-SCAP-Insig complex(GO:0032937) |
| 0.1 | 1.3 | GO:0005687 | U4 snRNP(GO:0005687) |
| 0.1 | 0.6 | GO:0036157 | outer dynein arm(GO:0036157) |
| 0.1 | 0.9 | GO:0035985 | senescence-associated heterochromatin focus(GO:0035985) |
| 0.1 | 0.5 | GO:0070033 | synaptobrevin 2-SNAP-25-syntaxin-1a-complexin II complex(GO:0070033) |
| 0.1 | 1.0 | GO:0097433 | dense body(GO:0097433) |
| 0.1 | 0.5 | GO:0016600 | flotillin complex(GO:0016600) |
| 0.1 | 0.4 | GO:0009368 | endopeptidase Clp complex(GO:0009368) |
| 0.1 | 0.2 | GO:0034686 | integrin alphav-beta8 complex(GO:0034686) |
| 0.1 | 0.5 | GO:0005854 | nascent polypeptide-associated complex(GO:0005854) |
| 0.1 | 1.2 | GO:0031095 | platelet dense tubular network membrane(GO:0031095) |
| 0.1 | 0.2 | GO:0031904 | endosome lumen(GO:0031904) |
| 0.1 | 0.4 | GO:0035370 | UBC13-UEV1A complex(GO:0035370) |
| 0.1 | 0.2 | GO:0032302 | MutSbeta complex(GO:0032302) |
| 0.1 | 0.2 | GO:1990851 | Wnt-Frizzled-LRP5/6 complex(GO:1990851) |
| 0.1 | 0.1 | GO:0035859 | Seh1-associated complex(GO:0035859) GATOR2 complex(GO:0061700) |
| 0.1 | 0.4 | GO:0032444 | activin responsive factor complex(GO:0032444) |
| 0.1 | 0.3 | GO:0072557 | IPAF inflammasome complex(GO:0072557) |
| 0.1 | 0.6 | GO:0005964 | phosphorylase kinase complex(GO:0005964) |
| 0.1 | 0.3 | GO:0070847 | core mediator complex(GO:0070847) |
| 0.1 | 0.3 | GO:0030057 | desmosome(GO:0030057) |
| 0.1 | 0.2 | GO:0005850 | eukaryotic translation initiation factor 2 complex(GO:0005850) |
| 0.1 | 0.2 | GO:0070557 | PCNA-p21 complex(GO:0070557) |
| 0.1 | 0.5 | GO:0030870 | Mre11 complex(GO:0030870) |
| 0.1 | 0.2 | GO:0043511 | inhibin complex(GO:0043511) inhibin A complex(GO:0043512) |
| 0.1 | 0.2 | GO:0033597 | mitotic checkpoint complex(GO:0033597) bub1-bub3 complex(GO:1990298) |
| 0.1 | 0.4 | GO:0005858 | axonemal dynein complex(GO:0005858) |
| 0.1 | 1.2 | GO:0031235 | intrinsic component of the cytoplasmic side of the plasma membrane(GO:0031235) |
| 0.1 | 0.3 | GO:0089701 | U2AF(GO:0089701) |
| 0.1 | 0.5 | GO:0043196 | varicosity(GO:0043196) |
| 0.1 | 0.5 | GO:0000322 | storage vacuole(GO:0000322) |
| 0.1 | 1.0 | GO:0031527 | filopodium membrane(GO:0031527) |
| 0.1 | 0.6 | GO:0042587 | glycogen granule(GO:0042587) |
| 0.1 | 0.3 | GO:0032059 | bleb(GO:0032059) |
| 0.1 | 0.2 | GO:0046696 | lipopolysaccharide receptor complex(GO:0046696) |
| 0.1 | 0.2 | GO:0072534 | perineuronal net(GO:0072534) |
| 0.1 | 0.2 | GO:0005965 | protein farnesyltransferase complex(GO:0005965) |
| 0.1 | 0.2 | GO:0031510 | SUMO activating enzyme complex(GO:0031510) |
| 0.1 | 0.5 | GO:0035631 | CD40 receptor complex(GO:0035631) |
| 0.1 | 0.1 | GO:0005875 | microtubule associated complex(GO:0005875) |
| 0.1 | 0.4 | GO:0030008 | TRAPP complex(GO:0030008) |
| 0.1 | 0.8 | GO:0048188 | Set1C/COMPASS complex(GO:0048188) |
| 0.1 | 0.4 | GO:0044294 | dendritic growth cone(GO:0044294) |
| 0.1 | 0.3 | GO:0000015 | phosphopyruvate hydratase complex(GO:0000015) |
| 0.1 | 0.7 | GO:0001673 | male germ cell nucleus(GO:0001673) |
| 0.1 | 14.4 | GO:0009897 | external side of plasma membrane(GO:0009897) |
| 0.1 | 0.2 | GO:0017059 | serine C-palmitoyltransferase complex(GO:0017059) endoplasmic reticulum palmitoyltransferase complex(GO:0031211) |
| 0.1 | 0.7 | GO:0017146 | NMDA selective glutamate receptor complex(GO:0017146) |
| 0.1 | 0.9 | GO:0031089 | platelet dense granule lumen(GO:0031089) |
| 0.1 | 0.5 | GO:0019907 | cyclin-dependent protein kinase activating kinase holoenzyme complex(GO:0019907) |
| 0.1 | 0.3 | GO:0000836 | Hrd1p ubiquitin ligase complex(GO:0000836) |
| 0.1 | 0.2 | GO:0031251 | PAN complex(GO:0031251) |
| 0.1 | 0.4 | GO:0043240 | Fanconi anaemia nuclear complex(GO:0043240) |
| 0.1 | 1.0 | GO:0005890 | sodium:potassium-exchanging ATPase complex(GO:0005890) |
| 0.1 | 0.4 | GO:0090576 | RNA polymerase III transcription factor complex(GO:0090576) |
| 0.0 | 1.1 | GO:0000795 | synaptonemal complex(GO:0000795) |
| 0.0 | 0.9 | GO:0046930 | pore complex(GO:0046930) |
| 0.0 | 0.2 | GO:0034751 | aryl hydrocarbon receptor complex(GO:0034751) |
| 0.0 | 0.1 | GO:0044214 | spanning component of plasma membrane(GO:0044214) spanning component of membrane(GO:0089717) |
| 0.0 | 0.4 | GO:0031465 | Cul4B-RING E3 ubiquitin ligase complex(GO:0031465) |
| 0.0 | 0.3 | GO:0032039 | integrator complex(GO:0032039) |
| 0.0 | 0.3 | GO:0042825 | TAP complex(GO:0042825) |
| 0.0 | 0.4 | GO:0031594 | neuromuscular junction(GO:0031594) |
| 0.0 | 0.3 | GO:0031390 | Ctf18 RFC-like complex(GO:0031390) |
| 0.0 | 0.2 | GO:0031205 | endoplasmic reticulum Sec complex(GO:0031205) |
| 0.0 | 0.2 | GO:0034457 | Mpp10 complex(GO:0034457) |
| 0.0 | 0.2 | GO:0043564 | Ku70:Ku80 complex(GO:0043564) |
| 0.0 | 0.2 | GO:0042405 | nuclear inclusion body(GO:0042405) |
| 0.0 | 0.1 | GO:0033063 | DNA recombinase mediator complex(GO:0033061) Rad51B-Rad51C-Rad51D-XRCC2 complex(GO:0033063) |
| 0.0 | 0.3 | GO:0046581 | intercellular canaliculus(GO:0046581) |
| 0.0 | 0.2 | GO:0030133 | transport vesicle(GO:0030133) |
| 0.0 | 4.6 | GO:0035578 | azurophil granule lumen(GO:0035578) |
| 0.0 | 0.7 | GO:0000145 | exocyst(GO:0000145) |
| 0.0 | 0.2 | GO:0070369 | beta-catenin-TCF7L2 complex(GO:0070369) |
| 0.0 | 0.4 | GO:0033588 | Elongator holoenzyme complex(GO:0033588) |
| 0.0 | 0.3 | GO:0005771 | multivesicular body(GO:0005771) |
| 0.0 | 1.5 | GO:0001772 | immunological synapse(GO:0001772) |
| 0.0 | 0.7 | GO:0005922 | connexon complex(GO:0005922) |
| 0.0 | 0.7 | GO:0097225 | sperm midpiece(GO:0097225) |
| 0.0 | 0.1 | GO:0000818 | nuclear MIS12/MIND complex(GO:0000818) |
| 0.0 | 0.2 | GO:0035867 | alphav-beta3 integrin-IGF-1-IGF1R complex(GO:0035867) |
| 0.0 | 2.2 | GO:0001533 | cornified envelope(GO:0001533) |
| 0.0 | 0.9 | GO:0031105 | septin complex(GO:0031105) |
| 0.0 | 0.0 | GO:0071817 | MMXD complex(GO:0071817) |
| 0.0 | 0.3 | GO:0070522 | ERCC4-ERCC1 complex(GO:0070522) |
| 0.0 | 0.4 | GO:0005776 | autophagosome(GO:0005776) |
| 0.0 | 0.0 | GO:0001652 | granular component(GO:0001652) |
| 0.0 | 0.2 | GO:0000791 | euchromatin(GO:0000791) |
| 0.0 | 0.1 | GO:0071546 | pi-body(GO:0071546) |
| 0.0 | 0.3 | GO:0044194 | cytolytic granule(GO:0044194) |
| 0.0 | 0.1 | GO:0032593 | insulin-responsive compartment(GO:0032593) |
| 0.0 | 0.1 | GO:0030897 | HOPS complex(GO:0030897) |
| 0.0 | 1.2 | GO:0001669 | acrosomal vesicle(GO:0001669) |
| 0.0 | 0.3 | GO:0097486 | multivesicular body lumen(GO:0097486) |
| 0.0 | 0.1 | GO:0045298 | tubulin complex(GO:0045298) |
| 0.0 | 0.4 | GO:0005847 | mRNA cleavage and polyadenylation specificity factor complex(GO:0005847) |
| 0.0 | 0.1 | GO:0002945 | cyclin K-CDK13 complex(GO:0002945) |
| 0.0 | 6.8 | GO:0019897 | extrinsic component of plasma membrane(GO:0019897) |
| 0.0 | 0.2 | GO:0097425 | smooth endoplasmic reticulum membrane(GO:0030868) smooth endoplasmic reticulum part(GO:0097425) |
| 0.0 | 0.4 | GO:0030123 | AP-3 adaptor complex(GO:0030123) |
| 0.0 | 0.1 | GO:0009986 | cell surface(GO:0009986) |
| 0.0 | 1.6 | GO:0008023 | transcription elongation factor complex(GO:0008023) |
| 0.0 | 0.2 | GO:0005744 | mitochondrial inner membrane presequence translocase complex(GO:0005744) |
| 0.0 | 0.4 | GO:0035097 | histone methyltransferase complex(GO:0035097) |
| 0.0 | 0.2 | GO:0001740 | Barr body(GO:0001740) |
| 0.0 | 0.2 | GO:0072357 | PTW/PP1 phosphatase complex(GO:0072357) |
| 0.0 | 0.3 | GO:0000782 | telomere cap complex(GO:0000782) nuclear telomere cap complex(GO:0000783) |
| 0.0 | 0.3 | GO:0005827 | polar microtubule(GO:0005827) |
| 0.0 | 0.1 | GO:0043293 | apoptosome(GO:0043293) |
| 0.0 | 1.6 | GO:0031514 | motile cilium(GO:0031514) |
| 0.0 | 0.2 | GO:0005587 | collagen type IV trimer(GO:0005587) |
| 0.0 | 0.2 | GO:0014802 | terminal cisterna(GO:0014802) |
| 0.0 | 0.2 | GO:0098845 | postsynaptic endosome(GO:0098845) |
| 0.0 | 0.1 | GO:0045272 | plasma membrane respiratory chain complex I(GO:0045272) |
| 0.0 | 0.9 | GO:0005719 | nuclear euchromatin(GO:0005719) |
| 0.0 | 0.1 | GO:0036128 | CatSper complex(GO:0036128) |
| 0.0 | 0.1 | GO:0018444 | translation release factor complex(GO:0018444) |
| 0.0 | 0.4 | GO:0030666 | endocytic vesicle membrane(GO:0030666) |
| 0.0 | 1.1 | GO:0030173 | integral component of Golgi membrane(GO:0030173) |
| 0.0 | 1.5 | GO:0005758 | mitochondrial intermembrane space(GO:0005758) |
| 0.0 | 0.1 | GO:0000275 | mitochondrial proton-transporting ATP synthase complex, catalytic core F(1)(GO:0000275) |
| 0.0 | 0.1 | GO:0034362 | low-density lipoprotein particle(GO:0034362) |
| 0.0 | 0.3 | GO:0090544 | BAF-type complex(GO:0090544) |
| 0.0 | 2.9 | GO:0022625 | cytosolic large ribosomal subunit(GO:0022625) |
| 0.0 | 0.1 | GO:0043541 | UDP-N-acetylglucosamine transferase complex(GO:0043541) |
| 0.0 | 0.1 | GO:0005967 | mitochondrial pyruvate dehydrogenase complex(GO:0005967) |
| 0.0 | 0.2 | GO:0035327 | transcriptionally active chromatin(GO:0035327) |
| 0.0 | 0.5 | GO:0005697 | telomerase holoenzyme complex(GO:0005697) |
| 0.0 | 0.2 | GO:0005577 | fibrinogen complex(GO:0005577) |
| 0.0 | 0.1 | GO:0045293 | MIS complex(GO:0036396) mRNA editing complex(GO:0045293) |
| 0.0 | 0.1 | GO:0005594 | collagen type IX trimer(GO:0005594) |
| 0.0 | 0.3 | GO:0000796 | condensin complex(GO:0000796) |
| 0.0 | 4.7 | GO:0005741 | mitochondrial outer membrane(GO:0005741) |
| 0.0 | 0.2 | GO:0071541 | eukaryotic translation initiation factor 3 complex, eIF3m(GO:0071541) |
| 0.0 | 0.3 | GO:0005751 | mitochondrial respiratory chain complex IV(GO:0005751) |
| 0.0 | 0.4 | GO:0034451 | centriolar satellite(GO:0034451) |
| 0.0 | 0.6 | GO:0005666 | DNA-directed RNA polymerase III complex(GO:0005666) |
| 0.0 | 1.4 | GO:0001650 | fibrillar center(GO:0001650) |
| 0.0 | 0.2 | GO:0072669 | tRNA-splicing ligase complex(GO:0072669) |
| 0.0 | 0.1 | GO:0005604 | basement membrane(GO:0005604) |
| 0.0 | 0.1 | GO:0002177 | manchette(GO:0002177) |
| 0.0 | 0.1 | GO:0031673 | H zone(GO:0031673) |
| 0.0 | 0.8 | GO:1902711 | GABA-A receptor complex(GO:1902711) |
| 0.0 | 1.3 | GO:0030670 | phagocytic vesicle membrane(GO:0030670) |
| 0.0 | 0.3 | GO:0001741 | XY body(GO:0001741) |
| 0.0 | 0.0 | GO:0030062 | mitochondrial tricarboxylic acid cycle enzyme complex(GO:0030062) |
| 0.0 | 1.0 | GO:0009295 | nucleoid(GO:0009295) mitochondrial nucleoid(GO:0042645) |
| 0.0 | 0.3 | GO:0005905 | clathrin-coated pit(GO:0005905) |
| 0.0 | 0.1 | GO:0060201 | clathrin-sculpted acetylcholine transport vesicle(GO:0060200) clathrin-sculpted acetylcholine transport vesicle membrane(GO:0060201) |
| 0.0 | 0.4 | GO:0001726 | ruffle(GO:0001726) |
| 0.0 | 9.2 | GO:0005759 | mitochondrial matrix(GO:0005759) |
| 0.0 | 0.7 | GO:0005882 | intermediate filament(GO:0005882) |
| 0.0 | 0.1 | GO:0071203 | WASH complex(GO:0071203) |
| 0.0 | 0.1 | GO:0043679 | axon terminus(GO:0043679) |
| 0.0 | 0.3 | GO:0000307 | cyclin-dependent protein kinase holoenzyme complex(GO:0000307) |
| 0.0 | 0.1 | GO:0001520 | outer dense fiber(GO:0001520) |
| 0.0 | 0.3 | GO:0031332 | RISC complex(GO:0016442) RNAi effector complex(GO:0031332) |
| 0.0 | 0.1 | GO:0005766 | primary lysosome(GO:0005766) azurophil granule(GO:0042582) |
| 0.0 | 2.2 | GO:0016605 | PML body(GO:0016605) |
| 0.0 | 0.7 | GO:0001917 | photoreceptor inner segment(GO:0001917) |
| 0.0 | 0.1 | GO:0072487 | MSL complex(GO:0072487) |
| 0.0 | 0.0 | GO:0005927 | muscle tendon junction(GO:0005927) |
| 0.0 | 0.0 | GO:0055087 | Ski complex(GO:0055087) |
| 0.0 | 0.3 | GO:0046658 | anchored component of plasma membrane(GO:0046658) |
| 0.0 | 0.4 | GO:0032580 | Golgi cisterna membrane(GO:0032580) |
| 0.0 | 0.1 | GO:0097452 | GAIT complex(GO:0097452) |
| 0.0 | 0.0 | GO:0070381 | endosome to plasma membrane transport vesicle(GO:0070381) |
| 0.0 | 0.1 | GO:0016580 | Sin3 complex(GO:0016580) |
| 0.0 | 0.0 | GO:0005896 | interleukin-6 receptor complex(GO:0005896) |
| 0.0 | 0.1 | GO:0044447 | axoneme part(GO:0044447) |
| 0.0 | 0.5 | GO:0043197 | dendritic spine(GO:0043197) neuron spine(GO:0044309) |
| 0.0 | 0.2 | GO:0034993 | microtubule organizing center attachment site(GO:0034992) LINC complex(GO:0034993) |
| 0.0 | 0.1 | GO:0009331 | glycerol-3-phosphate dehydrogenase complex(GO:0009331) |
| 0.0 | 0.7 | GO:0045095 | keratin filament(GO:0045095) |
| 0.0 | 0.1 | GO:1990316 | ATG1/ULK1 kinase complex(GO:1990316) |
| 0.0 | 0.1 | GO:0000438 | core TFIIH complex portion of holo TFIIH complex(GO:0000438) |
| 0.0 | 0.1 | GO:0097427 | microtubule bundle(GO:0097427) |
| 0.0 | 0.2 | GO:0045111 | intermediate filament cytoskeleton(GO:0045111) |
| 0.0 | 0.2 | GO:0098589 | membrane region(GO:0098589) |
| 0.0 | 0.0 | GO:0005798 | Golgi-associated vesicle(GO:0005798) |
| 0.0 | 0.4 | GO:0032040 | small-subunit processome(GO:0032040) |
| 0.0 | 0.0 | GO:0010369 | chromocenter(GO:0010369) |
| 0.0 | 0.1 | GO:0005853 | eukaryotic translation elongation factor 1 complex(GO:0005853) |
| 0.0 | 0.1 | GO:0032389 | MutLalpha complex(GO:0032389) |
| 0.0 | 0.3 | GO:0033202 | Ino80 complex(GO:0031011) DNA helicase complex(GO:0033202) |
| 0.0 | 0.2 | GO:0035102 | PRC1 complex(GO:0035102) |
| 0.0 | 0.2 | GO:0000815 | ESCRT III complex(GO:0000815) |
| 0.0 | 0.2 | GO:0005642 | annulate lamellae(GO:0005642) |
| 0.0 | 0.1 | GO:0005930 | axoneme(GO:0005930) ciliary plasm(GO:0097014) |
| 0.0 | 0.1 | GO:0008385 | IkappaB kinase complex(GO:0008385) |
| 0.0 | 0.3 | GO:0014704 | intercalated disc(GO:0014704) |
| 0.0 | 0.1 | GO:0097550 | transcriptional preinitiation complex(GO:0097550) |
| 0.0 | 0.3 | GO:0005892 | acetylcholine-gated channel complex(GO:0005892) |
| 0.0 | 0.0 | GO:0032133 | chromosome passenger complex(GO:0032133) |
| 0.0 | 0.4 | GO:0008180 | COP9 signalosome(GO:0008180) |
| 0.0 | 0.1 | GO:0032541 | cortical endoplasmic reticulum(GO:0032541) |
| 0.0 | 0.1 | GO:0005802 | trans-Golgi network(GO:0005802) |
| 0.0 | 0.0 | GO:0042589 | zymogen granule membrane(GO:0042589) |
| 0.0 | 0.1 | GO:0097546 | ciliary base(GO:0097546) |
| 0.0 | 0.1 | GO:0045334 | clathrin-coated endocytic vesicle(GO:0045334) |
| 0.0 | 0.1 | GO:0002199 | zona pellucida receptor complex(GO:0002199) |
| 0.0 | 0.1 | GO:0005664 | origin recognition complex(GO:0000808) nuclear origin of replication recognition complex(GO:0005664) |
| 0.0 | 0.0 | GO:0000444 | MIS12/MIND type complex(GO:0000444) |
| 0.0 | 0.0 | GO:0030426 | growth cone(GO:0030426) |
| 0.0 | 1.0 | GO:0031225 | anchored component of membrane(GO:0031225) |
| 0.0 | 1.1 | GO:0019898 | extrinsic component of membrane(GO:0019898) |
| 0.0 | 0.2 | GO:0030127 | COPII vesicle coat(GO:0030127) |
| 0.0 | 0.1 | GO:0008274 | gamma-tubulin large complex(GO:0000931) gamma-tubulin ring complex(GO:0008274) |
| 0.0 | 0.1 | GO:0005770 | late endosome(GO:0005770) |
| 0.0 | 0.6 | GO:0005782 | peroxisomal matrix(GO:0005782) microbody lumen(GO:0031907) |
| 0.0 | 0.4 | GO:0005775 | vacuolar lumen(GO:0005775) |
| 0.0 | 0.1 | GO:0043194 | axon initial segment(GO:0043194) |
| 0.0 | 0.1 | GO:0017102 | methionyl glutamyl tRNA synthetase complex(GO:0017102) |
Gene overrepresentation in C2:CP:REACTOME category:
| Log-likelihood per target | Total log-likelihood | Term | Description |
|---|---|---|---|
| 1.5 | 14.8 | REACTOME ENDOSOMAL VACUOLAR PATHWAY | Genes involved in Endosomal/Vacuolar pathway |
| 1.2 | 38.2 | REACTOME PD1 SIGNALING | Genes involved in PD-1 signaling |
| 0.4 | 21.5 | REACTOME IL1 SIGNALING | Genes involved in Interleukin-1 signaling |
| 0.3 | 5.0 | REACTOME COMMON PATHWAY | Genes involved in Common Pathway |
| 0.3 | 20.7 | REACTOME INTERFERON ALPHA BETA SIGNALING | Genes involved in Interferon alpha/beta signaling |
| 0.2 | 0.9 | REACTOME IL 2 SIGNALING | Genes involved in Interleukin-2 signaling |
| 0.2 | 1.2 | REACTOME TRANSFERRIN ENDOCYTOSIS AND RECYCLING | Genes involved in Transferrin endocytosis and recycling |
| 0.2 | 12.0 | REACTOME ANTIGEN ACTIVATES B CELL RECEPTOR LEADING TO GENERATION OF SECOND MESSENGERS | Genes involved in Antigen Activates B Cell Receptor Leading to Generation of Second Messengers |
| 0.2 | 5.3 | REACTOME HDL MEDIATED LIPID TRANSPORT | Genes involved in HDL-mediated lipid transport |
| 0.2 | 2.6 | REACTOME CD28 DEPENDENT VAV1 PATHWAY | Genes involved in CD28 dependent Vav1 pathway |
| 0.2 | 14.4 | REACTOME IMMUNOREGULATORY INTERACTIONS BETWEEN A LYMPHOID AND A NON LYMPHOID CELL | Genes involved in Immunoregulatory interactions between a Lymphoid and a non-Lymphoid cell |
| 0.2 | 3.6 | REACTOME FACILITATIVE NA INDEPENDENT GLUCOSE TRANSPORTERS | Genes involved in Facilitative Na+-independent glucose transporters |
| 0.2 | 2.3 | REACTOME VITAMIN B5 PANTOTHENATE METABOLISM | Genes involved in Vitamin B5 (pantothenate) metabolism |
| 0.2 | 2.1 | REACTOME ROLE OF DCC IN REGULATING APOPTOSIS | Genes involved in Role of DCC in regulating apoptosis |
| 0.2 | 0.2 | REACTOME PLATELET ADHESION TO EXPOSED COLLAGEN | Genes involved in Platelet Adhesion to exposed collagen |
| 0.2 | 4.4 | REACTOME EXTRINSIC PATHWAY FOR APOPTOSIS | Genes involved in Extrinsic Pathway for Apoptosis |
| 0.1 | 1.6 | REACTOME REGULATION OF KIT SIGNALING | Genes involved in Regulation of KIT signaling |
| 0.1 | 3.0 | REACTOME SYNTHESIS OF VERY LONG CHAIN FATTY ACYL COAS | Genes involved in Synthesis of very long-chain fatty acyl-CoAs |
| 0.1 | 2.2 | REACTOME ZINC TRANSPORTERS | Genes involved in Zinc transporters |
| 0.1 | 1.9 | REACTOME TRYPTOPHAN CATABOLISM | Genes involved in Tryptophan catabolism |
| 0.1 | 5.5 | REACTOME INTERFERON GAMMA SIGNALING | Genes involved in Interferon gamma signaling |
| 0.1 | 3.1 | REACTOME PURINE SALVAGE | Genes involved in Purine salvage |
| 0.1 | 5.0 | REACTOME GPVI MEDIATED ACTIVATION CASCADE | Genes involved in GPVI-mediated activation cascade |
| 0.1 | 2.5 | REACTOME ACTIVATION OF GENES BY ATF4 | Genes involved in Activation of Genes by ATF4 |
| 0.1 | 2.4 | REACTOME OTHER SEMAPHORIN INTERACTIONS | Genes involved in Other semaphorin interactions |
| 0.1 | 1.1 | REACTOME BETA DEFENSINS | Genes involved in Beta defensins |
| 0.1 | 2.5 | REACTOME PRE NOTCH PROCESSING IN GOLGI | Genes involved in Pre-NOTCH Processing in Golgi |
| 0.1 | 0.2 | REACTOME SHC MEDIATED SIGNALLING | Genes involved in SHC-mediated signalling |
| 0.1 | 1.0 | REACTOME REGULATION OF INSULIN SECRETION BY ACETYLCHOLINE | Genes involved in Regulation of Insulin Secretion by Acetylcholine |
| 0.1 | 1.7 | REACTOME DESTABILIZATION OF MRNA BY TRISTETRAPROLIN TTP | Genes involved in Destabilization of mRNA by Tristetraprolin (TTP) |
| 0.1 | 2.1 | REACTOME IL RECEPTOR SHC SIGNALING | Genes involved in Interleukin receptor SHC signaling |
| 0.1 | 1.6 | REACTOME PLATELET SENSITIZATION BY LDL | Genes involved in Platelet sensitization by LDL |
| 0.1 | 1.0 | REACTOME DOWNSTREAM TCR SIGNALING | Genes involved in Downstream TCR signaling |
| 0.1 | 3.2 | REACTOME GLUTATHIONE CONJUGATION | Genes involved in Glutathione conjugation |
| 0.1 | 2.1 | REACTOME ACTIVATION OF BH3 ONLY PROTEINS | Genes involved in Activation of BH3-only proteins |
| 0.1 | 1.4 | REACTOME SLBP DEPENDENT PROCESSING OF REPLICATION DEPENDENT HISTONE PRE MRNAS | Genes involved in SLBP Dependent Processing of Replication-Dependent Histone Pre-mRNAs |
| 0.1 | 3.1 | REACTOME SULFUR AMINO ACID METABOLISM | Genes involved in Sulfur amino acid metabolism |
| 0.1 | 1.7 | REACTOME TERMINATION OF O GLYCAN BIOSYNTHESIS | Genes involved in Termination of O-glycan biosynthesis |
| 0.1 | 0.9 | REACTOME PURINE CATABOLISM | Genes involved in Purine catabolism |
| 0.1 | 2.4 | REACTOME BASE EXCISION REPAIR | Genes involved in Base Excision Repair |
| 0.1 | 2.2 | REACTOME GLUCURONIDATION | Genes involved in Glucuronidation |
| 0.1 | 1.6 | REACTOME SYNTHESIS OF PE | Genes involved in Synthesis of PE |
| 0.1 | 4.3 | REACTOME METABOLISM OF VITAMINS AND COFACTORS | Genes involved in Metabolism of vitamins and cofactors |
| 0.1 | 0.2 | REACTOME PRE NOTCH EXPRESSION AND PROCESSING | Genes involved in Pre-NOTCH Expression and Processing |
| 0.1 | 0.6 | REACTOME DSCAM INTERACTIONS | Genes involved in DSCAM interactions |
| 0.1 | 3.9 | REACTOME GLYCOLYSIS | Genes involved in Glycolysis |
| 0.1 | 0.3 | REACTOME IRAK2 MEDIATED ACTIVATION OF TAK1 COMPLEX UPON TLR7 8 OR 9 STIMULATION | Genes involved in IRAK2 mediated activation of TAK1 complex upon TLR7/8 or 9 stimulation |
| 0.1 | 1.8 | REACTOME G0 AND EARLY G1 | Genes involved in G0 and Early G1 |
| 0.1 | 1.5 | REACTOME COSTIMULATION BY THE CD28 FAMILY | Genes involved in Costimulation by the CD28 family |
| 0.1 | 3.5 | REACTOME TRAFFICKING OF AMPA RECEPTORS | Genes involved in Trafficking of AMPA receptors |
| 0.1 | 1.5 | REACTOME GLYCOGEN BREAKDOWN GLYCOGENOLYSIS | Genes involved in Glycogen breakdown (glycogenolysis) |
| 0.1 | 0.5 | REACTOME TANDEM PORE DOMAIN POTASSIUM CHANNELS | Genes involved in Tandem pore domain potassium channels |
| 0.1 | 1.2 | REACTOME PURINE RIBONUCLEOSIDE MONOPHOSPHATE BIOSYNTHESIS | Genes involved in Purine ribonucleoside monophosphate biosynthesis |
| 0.1 | 0.8 | REACTOME TAK1 ACTIVATES NFKB BY PHOSPHORYLATION AND ACTIVATION OF IKKS COMPLEX | Genes involved in TAK1 activates NFkB by phosphorylation and activation of IKKs complex |
| 0.1 | 0.4 | REACTOME ACETYLCHOLINE NEUROTRANSMITTER RELEASE CYCLE | Genes involved in Acetylcholine Neurotransmitter Release Cycle |
| 0.1 | 0.1 | REACTOME NOREPINEPHRINE NEUROTRANSMITTER RELEASE CYCLE | Genes involved in Norepinephrine Neurotransmitter Release Cycle |
| 0.1 | 2.3 | REACTOME GABA SYNTHESIS RELEASE REUPTAKE AND DEGRADATION | Genes involved in GABA synthesis, release, reuptake and degradation |
| 0.1 | 0.7 | REACTOME ACTIVATION OF IRF3 IRF7 MEDIATED BY TBK1 IKK EPSILON | Genes involved in Activation of IRF3/IRF7 mediated by TBK1/IKK epsilon |
| 0.1 | 1.1 | REACTOME ABCA TRANSPORTERS IN LIPID HOMEOSTASIS | Genes involved in ABCA transporters in lipid homeostasis |
| 0.1 | 1.0 | REACTOME UNWINDING OF DNA | Genes involved in Unwinding of DNA |
| 0.1 | 0.8 | REACTOME ACYL CHAIN REMODELLING OF PG | Genes involved in Acyl chain remodelling of PG |
| 0.1 | 0.2 | REACTOME BINDING AND ENTRY OF HIV VIRION | Genes involved in Binding and entry of HIV virion |
| 0.1 | 0.5 | REACTOME GAMMA CARBOXYLATION TRANSPORT AND AMINO TERMINAL CLEAVAGE OF PROTEINS | Genes involved in Gamma-carboxylation, transport, and amino-terminal cleavage of proteins |
| 0.1 | 1.6 | REACTOME BRANCHED CHAIN AMINO ACID CATABOLISM | Genes involved in Branched-chain amino acid catabolism |
| 0.1 | 0.5 | REACTOME REGULATION OF THE FANCONI ANEMIA PATHWAY | Genes involved in Regulation of the Fanconi anemia pathway |
| 0.1 | 3.3 | REACTOME CHEMOKINE RECEPTORS BIND CHEMOKINES | Genes involved in Chemokine receptors bind chemokines |
| 0.1 | 1.2 | REACTOME ORGANIC CATION ANION ZWITTERION TRANSPORT | Genes involved in Organic cation/anion/zwitterion transport |
| 0.1 | 0.8 | REACTOME BILE SALT AND ORGANIC ANION SLC TRANSPORTERS | Genes involved in Bile salt and organic anion SLC transporters |
| 0.1 | 1.5 | REACTOME PROSTACYCLIN SIGNALLING THROUGH PROSTACYCLIN RECEPTOR | Genes involved in Prostacyclin signalling through prostacyclin receptor |
| 0.1 | 2.5 | REACTOME ION TRANSPORT BY P TYPE ATPASES | Genes involved in Ion transport by P-type ATPases |
| 0.1 | 1.4 | REACTOME CIRCADIAN REPRESSION OF EXPRESSION BY REV ERBA | Genes involved in Circadian Repression of Expression by REV-ERBA |
| 0.1 | 0.6 | REACTOME THE ACTIVATION OF ARYLSULFATASES | Genes involved in The activation of arylsulfatases |
| 0.1 | 0.7 | REACTOME ACTIVATION OF RAC | Genes involved in Activation of Rac |
| 0.0 | 0.1 | REACTOME GLUCAGON SIGNALING IN METABOLIC REGULATION | Genes involved in Glucagon signaling in metabolic regulation |
| 0.0 | 1.1 | REACTOME BMAL1 CLOCK NPAS2 ACTIVATES CIRCADIAN EXPRESSION | Genes involved in BMAL1:CLOCK/NPAS2 Activates Circadian Expression |
| 0.0 | 1.2 | REACTOME INTRINSIC PATHWAY FOR APOPTOSIS | Genes involved in Intrinsic Pathway for Apoptosis |
| 0.0 | 0.8 | REACTOME IRON UPTAKE AND TRANSPORT | Genes involved in Iron uptake and transport |
| 0.0 | 0.9 | REACTOME TRANSPORT OF ORGANIC ANIONS | Genes involved in Transport of organic anions |
| 0.0 | 0.4 | REACTOME APOBEC3G MEDIATED RESISTANCE TO HIV1 INFECTION | Genes involved in APOBEC3G mediated resistance to HIV-1 infection |
| 0.0 | 0.8 | REACTOME HIGHLY CALCIUM PERMEABLE POSTSYNAPTIC NICOTINIC ACETYLCHOLINE RECEPTORS | Genes involved in Highly calcium permeable postsynaptic nicotinic acetylcholine receptors |
| 0.0 | 0.6 | REACTOME CREB PHOSPHORYLATION THROUGH THE ACTIVATION OF CAMKII | Genes involved in CREB phosphorylation through the activation of CaMKII |
| 0.0 | 1.0 | REACTOME THE ROLE OF NEF IN HIV1 REPLICATION AND DISEASE PATHOGENESIS | Genes involved in The role of Nef in HIV-1 replication and disease pathogenesis |
| 0.0 | 0.6 | REACTOME NOD1 2 SIGNALING PATHWAY | Genes involved in NOD1/2 Signaling Pathway |
| 0.0 | 0.7 | REACTOME GAP JUNCTION ASSEMBLY | Genes involved in Gap junction assembly |
| 0.0 | 2.5 | REACTOME CYTOCHROME P450 ARRANGED BY SUBSTRATE TYPE | Genes involved in Cytochrome P450 - arranged by substrate type |
| 0.0 | 0.3 | REACTOME COMPLEMENT CASCADE | Genes involved in Complement cascade |
| 0.0 | 0.3 | REACTOME RECYCLING OF BILE ACIDS AND SALTS | Genes involved in Recycling of bile acids and salts |
| 0.0 | 2.2 | REACTOME AMINO ACID AND OLIGOPEPTIDE SLC TRANSPORTERS | Genes involved in Amino acid and oligopeptide SLC transporters |
| 0.0 | 0.5 | REACTOME FANCONI ANEMIA PATHWAY | Genes involved in Fanconi Anemia pathway |
| 0.0 | 1.2 | REACTOME GLUCOSE METABOLISM | Genes involved in Glucose metabolism |
| 0.0 | 1.3 | REACTOME EFFECTS OF PIP2 HYDROLYSIS | Genes involved in Effects of PIP2 hydrolysis |
| 0.0 | 1.1 | REACTOME SPHINGOLIPID DE NOVO BIOSYNTHESIS | Genes involved in Sphingolipid de novo biosynthesis |
| 0.0 | 0.5 | REACTOME REGULATION OF PYRUVATE DEHYDROGENASE PDH COMPLEX | Genes involved in Regulation of pyruvate dehydrogenase (PDH) complex |
| 0.0 | 0.4 | REACTOME HYALURONAN UPTAKE AND DEGRADATION | Genes involved in Hyaluronan uptake and degradation |
| 0.0 | 0.3 | REACTOME TETRAHYDROBIOPTERIN BH4 SYNTHESIS RECYCLING SALVAGE AND REGULATION | Genes involved in Tetrahydrobiopterin (BH4) synthesis, recycling, salvage and regulation |
| 0.0 | 4.4 | REACTOME SIGNALING BY RHO GTPASES | Genes involved in Signaling by Rho GTPases |
| 0.0 | 1.1 | REACTOME LATENT INFECTION OF HOMO SAPIENS WITH MYCOBACTERIUM TUBERCULOSIS | Genes involved in Latent infection of Homo sapiens with Mycobacterium tuberculosis |
| 0.0 | 0.4 | REACTOME TIE2 SIGNALING | Genes involved in Tie2 Signaling |
| 0.0 | 0.1 | REACTOME G PROTEIN ACTIVATION | Genes involved in G-protein activation |
| 0.0 | 0.8 | REACTOME RNA POL III TRANSCRIPTION INITIATION FROM TYPE 2 PROMOTER | Genes involved in RNA Polymerase III Transcription Initiation From Type 2 Promoter |
| 0.0 | 0.4 | REACTOME EGFR DOWNREGULATION | Genes involved in EGFR downregulation |
| 0.0 | 4.0 | REACTOME PEPTIDE CHAIN ELONGATION | Genes involved in Peptide chain elongation |
| 0.0 | 0.2 | REACTOME ER PHAGOSOME PATHWAY | Genes involved in ER-Phagosome pathway |
| 0.0 | 0.7 | REACTOME ACTIVATED AMPK STIMULATES FATTY ACID OXIDATION IN MUSCLE | Genes involved in Activated AMPK stimulates fatty-acid oxidation in muscle |
| 0.0 | 2.2 | REACTOME DOWNSTREAM SIGNALING EVENTS OF B CELL RECEPTOR BCR | Genes involved in Downstream Signaling Events Of B Cell Receptor (BCR) |
| 0.0 | 0.3 | REACTOME GLYCOPROTEIN HORMONES | Genes involved in Glycoprotein hormones |
| 0.0 | 1.0 | REACTOME CGMP EFFECTS | Genes involved in cGMP effects |
| 0.0 | 1.4 | REACTOME LOSS OF NLP FROM MITOTIC CENTROSOMES | Genes involved in Loss of Nlp from mitotic centrosomes |
| 0.0 | 0.3 | REACTOME P38MAPK EVENTS | Genes involved in p38MAPK events |
| 0.0 | 3.2 | REACTOME G ALPHA I SIGNALLING EVENTS | Genes involved in G alpha (i) signalling events |
| 0.0 | 0.2 | REACTOME FORMATION OF INCISION COMPLEX IN GG NER | Genes involved in Formation of incision complex in GG-NER |
| 0.0 | 0.5 | REACTOME DAG AND IP3 SIGNALING | Genes involved in DAG and IP3 signaling |
| 0.0 | 0.6 | REACTOME GABA A RECEPTOR ACTIVATION | Genes involved in GABA A receptor activation |
| 0.0 | 2.6 | REACTOME MEIOSIS | Genes involved in Meiosis |
| 0.0 | 0.3 | REACTOME INTRINSIC PATHWAY | Genes involved in Intrinsic Pathway |
| 0.0 | 0.4 | REACTOME MITOCHONDRIAL FATTY ACID BETA OXIDATION | Genes involved in Mitochondrial Fatty Acid Beta-Oxidation |
| 0.0 | 0.2 | REACTOME EARLY PHASE OF HIV LIFE CYCLE | Genes involved in Early Phase of HIV Life Cycle |
| 0.0 | 0.4 | REACTOME PROTEOLYTIC CLEAVAGE OF SNARE COMPLEX PROTEINS | Genes involved in Proteolytic cleavage of SNARE complex proteins |
| 0.0 | 0.7 | REACTOME INTERACTIONS OF VPR WITH HOST CELLULAR PROTEINS | Genes involved in Interactions of Vpr with host cellular proteins |
| 0.0 | 0.4 | REACTOME FGFR LIGAND BINDING AND ACTIVATION | Genes involved in FGFR ligand binding and activation |
| 0.0 | 0.3 | REACTOME DARPP 32 EVENTS | Genes involved in DARPP-32 events |
| 0.0 | 0.3 | REACTOME SIGNALING BY ROBO RECEPTOR | Genes involved in Signaling by Robo receptor |
| 0.0 | 0.2 | REACTOME APOPTOTIC CLEAVAGE OF CELL ADHESION PROTEINS | Genes involved in Apoptotic cleavage of cell adhesion proteins |
| 0.0 | 0.1 | REACTOME ORC1 REMOVAL FROM CHROMATIN | Genes involved in Orc1 removal from chromatin |
| 0.0 | 1.2 | REACTOME MHC CLASS II ANTIGEN PRESENTATION | Genes involved in MHC class II antigen presentation |
| 0.0 | 0.1 | REACTOME CIRCADIAN CLOCK | Genes involved in Circadian Clock |
| 0.0 | 0.2 | REACTOME INCRETIN SYNTHESIS SECRETION AND INACTIVATION | Genes involved in Incretin Synthesis, Secretion, and Inactivation |
| 0.0 | 0.3 | REACTOME APC CDC20 MEDIATED DEGRADATION OF NEK2A | Genes involved in APC-Cdc20 mediated degradation of Nek2A |
| 0.0 | 0.2 | REACTOME METABOLISM OF NON CODING RNA | Genes involved in Metabolism of non-coding RNA |
| 0.0 | 0.4 | REACTOME MITOTIC PROMETAPHASE | Genes involved in Mitotic Prometaphase |
| 0.0 | 0.2 | REACTOME REGULATION OF GENE EXPRESSION IN BETA CELLS | Genes involved in Regulation of gene expression in beta cells |
Gene overrepresentation in C2:CP category:
| Log-likelihood per target | Total log-likelihood | Term | Description |
|---|---|---|---|
| 0.4 | 22.1 | PID IL1 PATHWAY | IL1-mediated signaling events |
| 0.4 | 7.4 | PID TCR JNK PATHWAY | JNK signaling in the CD4+ TCR pathway |
| 0.3 | 0.3 | ST GRANULE CELL SURVIVAL PATHWAY | Granule Cell Survival Pathway is a specific case of more general PAC1 Receptor Pathway. |
| 0.3 | 19.0 | PID CD8 TCR PATHWAY | TCR signaling in naïve CD8+ T cells |
| 0.2 | 10.1 | PID INTEGRIN CS PATHWAY | Integrin family cell surface interactions |
| 0.2 | 18.0 | PID IL4 2PATHWAY | IL4-mediated signaling events |
| 0.2 | 4.9 | SA PROGRAMMED CELL DEATH | Programmed cell death, or apoptosis, eliminates damaged or unneeded cells. |
| 0.2 | 4.9 | PID IL27 PATHWAY | IL27-mediated signaling events |
| 0.2 | 12.0 | PID BCR 5PATHWAY | BCR signaling pathway |
| 0.2 | 13.1 | PID HNF3B PATHWAY | FOXA2 and FOXA3 transcription factor networks |
| 0.2 | 6.3 | PID IFNG PATHWAY | IFN-gamma pathway |
| 0.2 | 5.8 | ST ERK1 ERK2 MAPK PATHWAY | ERK1/ERK2 MAPK Pathway |
| 0.2 | 3.6 | PID RAS PATHWAY | Regulation of Ras family activation |
| 0.2 | 5.6 | PID IL12 2PATHWAY | IL12-mediated signaling events |
| 0.2 | 4.0 | SA FAS SIGNALING | The TNF-type receptor Fas induces apoptosis on ligand binding. |
| 0.2 | 4.3 | ST WNT CA2 CYCLIC GMP PATHWAY | Wnt/Ca2+/cyclic GMP signaling. |
| 0.1 | 9.1 | PID RAC1 PATHWAY | RAC1 signaling pathway |
| 0.1 | 5.4 | PID IL8 CXCR2 PATHWAY | IL8- and CXCR2-mediated signaling events |
| 0.1 | 1.5 | PID NFKAPPAB ATYPICAL PATHWAY | Atypical NF-kappaB pathway |
| 0.1 | 3.7 | SA MMP CYTOKINE CONNECTION | Cytokines can induce activation of matrix metalloproteinases, which degrade extracellular matrix. |
| 0.1 | 2.6 | PID CD40 PATHWAY | CD40/CD40L signaling |
| 0.1 | 0.3 | PID IL8 CXCR1 PATHWAY | IL8- and CXCR1-mediated signaling events |
| 0.1 | 0.3 | PID IL3 PATHWAY | IL3-mediated signaling events |
| 0.1 | 1.5 | ST GAQ PATHWAY | G alpha q Pathway |
| 0.1 | 0.4 | ST PAC1 RECEPTOR PATHWAY | PAC1 Receptor Pathway |
| 0.1 | 1.2 | SA PTEN PATHWAY | PTEN is a tumor suppressor that dephosphorylates the lipid messenger phosphatidylinositol triphosphate. |
| 0.1 | 4.2 | PID ATM PATHWAY | ATM pathway |
| 0.1 | 0.2 | ST INTERFERON GAMMA PATHWAY | Interferon gamma pathway. |
| 0.1 | 2.8 | PID FCER1 PATHWAY | Fc-epsilon receptor I signaling in mast cells |
| 0.1 | 3.9 | PID CDC42 REG PATHWAY | Regulation of CDC42 activity |
| 0.1 | 1.1 | SIG BCR SIGNALING PATHWAY | Members of the BCR signaling pathway |
| 0.1 | 2.7 | PID RXR VDR PATHWAY | RXR and RAR heterodimerization with other nuclear receptor |
| 0.1 | 0.3 | PID AR NONGENOMIC PATHWAY | Nongenotropic Androgen signaling |
| 0.1 | 1.3 | SIG PIP3 SIGNALING IN B LYMPHOCYTES | Genes related to PIP3 signaling in B lymphocytes |
| 0.1 | 1.5 | PID EPHRINB REV PATHWAY | Ephrin B reverse signaling |
| 0.1 | 0.2 | PID TCR RAS PATHWAY | Ras signaling in the CD4+ TCR pathway |
| 0.1 | 2.9 | PID NFAT TFPATHWAY | Calcineurin-regulated NFAT-dependent transcription in lymphocytes |
| 0.1 | 0.8 | PID INSULIN GLUCOSE PATHWAY | Insulin-mediated glucose transport |
| 0.1 | 1.1 | PID ERB GENOMIC PATHWAY | Validated nuclear estrogen receptor beta network |
| 0.1 | 0.2 | SIG CHEMOTAXIS | Genes related to chemotaxis |
| 0.0 | 0.7 | SA CASPASE CASCADE | Apoptosis is mediated by caspases, cysteine proteases arranged in a proteolytic cascade. |
| 0.0 | 0.4 | PID FAS PATHWAY | FAS (CD95) signaling pathway |
| 0.0 | 0.7 | PID PRL SIGNALING EVENTS PATHWAY | Signaling events mediated by PRL |
| 0.0 | 0.4 | PID EPHA2 FWD PATHWAY | EPHA2 forward signaling |
| 0.0 | 0.2 | PID IL5 PATHWAY | IL5-mediated signaling events |
| 0.0 | 0.8 | PID TAP63 PATHWAY | Validated transcriptional targets of TAp63 isoforms |
| 0.0 | 1.7 | PID CXCR4 PATHWAY | CXCR4-mediated signaling events |
| 0.0 | 1.0 | PID GLYPICAN 1PATHWAY | Glypican 1 network |
| 0.0 | 0.8 | PID P38 MK2 PATHWAY | p38 signaling mediated by MAPKAP kinases |
| 0.0 | 0.5 | ST P38 MAPK PATHWAY | p38 MAPK Pathway |
| 0.0 | 0.2 | SA G1 AND S PHASES | Cdk2, 4, and 6 bind cyclin D in G1, while cdk2/cyclin E promotes the G1/S transition. |
| 0.0 | 0.2 | PID S1P META PATHWAY | Sphingosine 1-phosphate (S1P) pathway |
| 0.0 | 0.2 | PID THROMBIN PAR4 PATHWAY | PAR4-mediated thrombin signaling events |
| 0.0 | 1.2 | PID HIF2PATHWAY | HIF-2-alpha transcription factor network |
| 0.0 | 0.5 | PID NFKAPPAB CANONICAL PATHWAY | Canonical NF-kappaB pathway |
| 0.0 | 0.8 | PID ERBB4 PATHWAY | ErbB4 signaling events |
| 0.0 | 0.4 | PID FRA PATHWAY | Validated transcriptional targets of AP1 family members Fra1 and Fra2 |
| 0.0 | 0.3 | PID P38 MKK3 6PATHWAY | p38 MAPK signaling pathway |
| 0.0 | 0.8 | PID PI3K PLC TRK PATHWAY | Trk receptor signaling mediated by PI3K and PLC-gamma |
| 0.0 | 0.1 | ST INTERLEUKIN 4 PATHWAY | Interleukin 4 (IL-4) Pathway |
| 0.0 | 0.0 | PID HIV NEF PATHWAY | HIV-1 Nef: Negative effector of Fas and TNF-alpha |
| 0.0 | 1.7 | PID ERA GENOMIC PATHWAY | Validated nuclear estrogen receptor alpha network |
| 0.0 | 1.3 | PID DELTA NP63 PATHWAY | Validated transcriptional targets of deltaNp63 isoforms |
| 0.0 | 0.1 | PID CONE PATHWAY | Visual signal transduction: Cones |
| 0.0 | 0.3 | PID ALK2 PATHWAY | ALK2 signaling events |
| 0.0 | 0.1 | PID WNT NONCANONICAL PATHWAY | Noncanonical Wnt signaling pathway |
| 0.0 | 0.1 | ST TYPE I INTERFERON PATHWAY | Type I Interferon (alpha/beta IFN) Pathway |
| 0.0 | 0.3 | PID ERBB1 INTERNALIZATION PATHWAY | Internalization of ErbB1 |
| 0.0 | 0.1 | SIG INSULIN RECEPTOR PATHWAY IN CARDIAC MYOCYTES | Genes related to the insulin receptor pathway |
| 0.0 | 0.1 | PID ANGIOPOIETIN RECEPTOR PATHWAY | Angiopoietin receptor Tie2-mediated signaling |
| 0.0 | 0.0 | PID S1P S1P1 PATHWAY | S1P1 pathway |
| 0.0 | 0.3 | PID FOXM1 PATHWAY | FOXM1 transcription factor network |
| 0.0 | 0.5 | PID AJDISS 2PATHWAY | Posttranslational regulation of adherens junction stability and dissassembly |
| 0.0 | 0.3 | PID BARD1 PATHWAY | BARD1 signaling events |
| 0.0 | 0.3 | SIG PIP3 SIGNALING IN CARDIAC MYOCTES | Genes related to PIP3 signaling in cardiac myocytes |
| 0.0 | 0.0 | PID PDGFRA PATHWAY | PDGFR-alpha signaling pathway |
| 0.0 | 0.2 | PID TRAIL PATHWAY | TRAIL signaling pathway |
Gene overrepresentation in biological_process category:
| Log-likelihood per target | Total log-likelihood | Term | Description |
|---|---|---|---|
| 4.7 | 18.7 | GO:0050712 | negative regulation of interleukin-1 alpha production(GO:0032690) negative regulation of interleukin-1 alpha secretion(GO:0050712) |
| 3.7 | 11.0 | GO:0000738 | DNA catabolic process, exonucleolytic(GO:0000738) |
| 2.6 | 7.7 | GO:1902955 | regulation of choline O-acetyltransferase activity(GO:1902769) positive regulation of choline O-acetyltransferase activity(GO:1902771) negative regulation of tau-protein kinase activity(GO:1902948) positive regulation of early endosome to recycling endosome transport(GO:1902955) negative regulation of aspartic-type endopeptidase activity involved in amyloid precursor protein catabolic process(GO:1902960) negative regulation of neurofibrillary tangle assembly(GO:1902997) negative regulation of aspartic-type peptidase activity(GO:1905246) |
| 1.5 | 15.3 | GO:0002480 | antigen processing and presentation of exogenous peptide antigen via MHC class I, TAP-independent(GO:0002480) |
| 1.4 | 5.7 | GO:0033277 | abortive mitotic cell cycle(GO:0033277) |
| 1.3 | 6.4 | GO:0060741 | prostate gland stromal morphogenesis(GO:0060741) |
| 1.2 | 6.1 | GO:0002925 | positive regulation of humoral immune response mediated by circulating immunoglobulin(GO:0002925) |
| 1.2 | 2.4 | GO:0032639 | TRAIL production(GO:0032639) regulation of TRAIL production(GO:0032679) positive regulation of TRAIL production(GO:0032759) |
| 1.1 | 1.1 | GO:2000566 | positive regulation of CD8-positive, alpha-beta T cell proliferation(GO:2000566) |
| 1.0 | 4.2 | GO:0060697 | positive regulation of phospholipid catabolic process(GO:0060697) |
| 1.0 | 2.1 | GO:0045994 | positive regulation of translational initiation by iron(GO:0045994) |
| 0.9 | 62.5 | GO:0006910 | phagocytosis, recognition(GO:0006910) |
| 0.8 | 2.5 | GO:0002581 | negative regulation of antigen processing and presentation of peptide or polysaccharide antigen via MHC class II(GO:0002581) |
| 0.8 | 1.7 | GO:0030101 | natural killer cell activation(GO:0030101) |
| 0.8 | 1.7 | GO:0002605 | negative regulation of dendritic cell antigen processing and presentation(GO:0002605) |
| 0.8 | 4.0 | GO:0042997 | negative regulation of Golgi to plasma membrane protein transport(GO:0042997) |
| 0.8 | 2.3 | GO:0060448 | dichotomous subdivision of terminal units involved in lung branching(GO:0060448) |
| 0.7 | 3.7 | GO:0061143 | alveolar primary septum development(GO:0061143) |
| 0.7 | 2.2 | GO:1903413 | cellular response to bile acid(GO:1903413) |
| 0.7 | 2.2 | GO:2001190 | positive regulation of T cell activation via T cell receptor contact with antigen bound to MHC molecule on antigen presenting cell(GO:2001190) |
| 0.7 | 4.3 | GO:0046940 | nucleoside monophosphate phosphorylation(GO:0046940) |
| 0.7 | 0.7 | GO:0043317 | regulation of cytotoxic T cell degranulation(GO:0043317) negative regulation of cytotoxic T cell degranulation(GO:0043318) |
| 0.7 | 2.0 | GO:0044537 | regulation of circulating fibrinogen levels(GO:0044537) |
| 0.7 | 2.7 | GO:0045065 | cytotoxic T cell differentiation(GO:0045065) |
| 0.7 | 3.4 | GO:0014738 | regulation of muscle hyperplasia(GO:0014738) |
| 0.7 | 3.3 | GO:0070842 | aggresome assembly(GO:0070842) |
| 0.6 | 2.5 | GO:2001191 | gamma-delta T cell activation involved in immune response(GO:0002290) negative regulation of interferon-beta secretion(GO:0035548) regulation of gamma-delta T cell activation involved in immune response(GO:2001191) positive regulation of gamma-delta T cell activation involved in immune response(GO:2001193) |
| 0.6 | 1.2 | GO:0006979 | response to oxidative stress(GO:0006979) |
| 0.6 | 1.8 | GO:0046102 | inosine metabolic process(GO:0046102) |
| 0.6 | 2.4 | GO:1904448 | negative regulation of gamma-aminobutyric acid secretion(GO:0014053) aspartate secretion(GO:0061528) regulation of aspartate secretion(GO:1904448) positive regulation of aspartate secretion(GO:1904450) |
| 0.6 | 1.7 | GO:0002892 | type IIa hypersensitivity(GO:0001794) regulation of type IIa hypersensitivity(GO:0001796) positive regulation of type IIa hypersensitivity(GO:0001798) type II hypersensitivity(GO:0002445) regulation of type II hypersensitivity(GO:0002892) positive regulation of type II hypersensitivity(GO:0002894) |
| 0.6 | 1.7 | GO:0085032 | modulation of signal transduction in other organism(GO:0044501) modulation by symbiont of host signal transduction pathway(GO:0052027) modulation of signal transduction in other organism involved in symbiotic interaction(GO:0052250) modulation by symbiont of host I-kappaB kinase/NF-kappaB cascade(GO:0085032) |
| 0.6 | 3.9 | GO:2000503 | positive regulation of natural killer cell chemotaxis(GO:2000503) |
| 0.5 | 7.6 | GO:1901748 | leukotriene D4 metabolic process(GO:1901748) leukotriene D4 biosynthetic process(GO:1901750) |
| 0.5 | 2.1 | GO:0042357 | thiamine diphosphate metabolic process(GO:0042357) |
| 0.5 | 2.1 | GO:0010903 | regulation of very-low-density lipoprotein particle remodeling(GO:0010901) negative regulation of very-low-density lipoprotein particle remodeling(GO:0010903) |
| 0.5 | 1.6 | GO:1902309 | negative regulation of peptidyl-serine dephosphorylation(GO:1902309) |
| 0.5 | 0.5 | GO:0036109 | alpha-linolenic acid metabolic process(GO:0036109) |
| 0.5 | 1.5 | GO:0097052 | tryptophan catabolic process to acetyl-CoA(GO:0019442) L-kynurenine metabolic process(GO:0097052) |
| 0.5 | 0.5 | GO:1902003 | regulation of beta-amyloid formation(GO:1902003) |
| 0.5 | 0.5 | GO:0035740 | CD8-positive, alpha-beta T cell proliferation(GO:0035740) regulation of CD8-positive, alpha-beta T cell proliferation(GO:2000564) |
| 0.5 | 1.5 | GO:0036118 | hyaluranon cable assembly(GO:0036118) regulation of hyaluranon cable assembly(GO:1900104) positive regulation of hyaluranon cable assembly(GO:1900106) |
| 0.5 | 2.5 | GO:0035633 | maintenance of blood-brain barrier(GO:0035633) regulation of chemokine (C-C motif) ligand 2 secretion(GO:1904207) positive regulation of chemokine (C-C motif) ligand 2 secretion(GO:1904209) |
| 0.5 | 1.9 | GO:0045085 | negative regulation of interleukin-2 biosynthetic process(GO:0045085) |
| 0.5 | 1.5 | GO:0035419 | activation of MAPK activity involved in innate immune response(GO:0035419) |
| 0.5 | 2.4 | GO:0009609 | response to symbiont(GO:0009608) response to symbiotic bacterium(GO:0009609) |
| 0.5 | 1.8 | GO:0003366 | cell-matrix adhesion involved in ameboidal cell migration(GO:0003366) |
| 0.5 | 0.9 | GO:0035408 | histone H3-T6 phosphorylation(GO:0035408) |
| 0.5 | 1.4 | GO:0072709 | cellular response to sorbitol(GO:0072709) |
| 0.4 | 2.2 | GO:0032929 | negative regulation of superoxide anion generation(GO:0032929) |
| 0.4 | 2.2 | GO:1900738 | positive regulation of phospholipase C-activating G-protein coupled receptor signaling pathway(GO:1900738) |
| 0.4 | 1.3 | GO:2000670 | positive regulation of Fc receptor mediated stimulatory signaling pathway(GO:0060369) positive regulation of dendritic cell apoptotic process(GO:2000670) |
| 0.4 | 2.6 | GO:0070560 | protein secretion by platelet(GO:0070560) |
| 0.4 | 1.3 | GO:0045976 | negative regulation of mitotic cell cycle, embryonic(GO:0045976) |
| 0.4 | 2.6 | GO:0061737 | leukotriene signaling pathway(GO:0061737) |
| 0.4 | 2.5 | GO:0034197 | acylglycerol transport(GO:0034196) triglyceride transport(GO:0034197) |
| 0.4 | 1.7 | GO:0002339 | B cell selection(GO:0002339) |
| 0.4 | 1.3 | GO:2000538 | regulation of cGMP-mediated signaling(GO:0010752) regulation of B cell chemotaxis(GO:2000537) positive regulation of B cell chemotaxis(GO:2000538) |
| 0.4 | 3.8 | GO:0045078 | positive regulation of interferon-gamma biosynthetic process(GO:0045078) |
| 0.4 | 1.2 | GO:0050902 | leukocyte adhesive activation(GO:0050902) |
| 0.4 | 1.7 | GO:0006408 | snRNA export from nucleus(GO:0006408) |
| 0.4 | 1.2 | GO:0061470 | T follicular helper cell differentiation(GO:0061470) |
| 0.4 | 2.9 | GO:0008218 | bioluminescence(GO:0008218) |
| 0.4 | 0.8 | GO:1904479 | negative regulation of intestinal absorption(GO:1904479) |
| 0.4 | 1.2 | GO:0002644 | negative regulation of tolerance induction(GO:0002644) |
| 0.4 | 2.0 | GO:2001181 | positive regulation of interleukin-10 secretion(GO:2001181) |
| 0.4 | 2.3 | GO:0009972 | cytidine catabolic process(GO:0006216) cytidine deamination(GO:0009972) cytidine metabolic process(GO:0046087) |
| 0.4 | 1.1 | GO:0045658 | regulation of neutrophil differentiation(GO:0045658) negative regulation of neutrophil differentiation(GO:0045659) |
| 0.4 | 0.7 | GO:0072679 | thymocyte migration(GO:0072679) |
| 0.4 | 1.1 | GO:1990519 | pyrimidine nucleotide transport(GO:0006864) mitochondrial pyrimidine nucleotide import(GO:1990519) |
| 0.4 | 1.4 | GO:0046452 | dihydrofolate metabolic process(GO:0046452) |
| 0.4 | 2.5 | GO:0015755 | fructose transport(GO:0015755) fructose import(GO:0032445) carbohydrate import into cell(GO:0097319) carbohydrate import across plasma membrane(GO:0098704) fructose import across plasma membrane(GO:1990539) |
| 0.4 | 2.1 | GO:0010133 | proline catabolic process to glutamate(GO:0010133) |
| 0.3 | 2.4 | GO:0038110 | interleukin-2-mediated signaling pathway(GO:0038110) |
| 0.3 | 4.8 | GO:0050862 | positive regulation of T cell receptor signaling pathway(GO:0050862) |
| 0.3 | 1.0 | GO:0001923 | B-1 B cell differentiation(GO:0001923) |
| 0.3 | 0.3 | GO:0046136 | positive regulation of vitamin metabolic process(GO:0046136) positive regulation of vitamin D biosynthetic process(GO:0060557) positive regulation of calcidiol 1-monooxygenase activity(GO:0060559) |
| 0.3 | 2.7 | GO:0006116 | NADH oxidation(GO:0006116) |
| 0.3 | 0.3 | GO:0060287 | epithelial cilium movement involved in determination of left/right asymmetry(GO:0060287) |
| 0.3 | 1.6 | GO:0045084 | positive regulation of interleukin-12 biosynthetic process(GO:0045084) |
| 0.3 | 1.0 | GO:1905154 | negative regulation of eosinophil activation(GO:1902567) negative regulation of membrane invagination(GO:1905154) |
| 0.3 | 1.9 | GO:0016554 | cytidine to uridine editing(GO:0016554) |
| 0.3 | 5.1 | GO:0002250 | adaptive immune response(GO:0002250) |
| 0.3 | 2.5 | GO:0031666 | positive regulation of lipopolysaccharide-mediated signaling pathway(GO:0031666) |
| 0.3 | 2.2 | GO:0002291 | T cell activation via T cell receptor contact with antigen bound to MHC molecule on antigen presenting cell(GO:0002291) |
| 0.3 | 1.6 | GO:0002378 | immunoglobulin biosynthetic process(GO:0002378) |
| 0.3 | 1.2 | GO:0046671 | negative regulation of cellular pH reduction(GO:0032848) CD8-positive, alpha-beta T cell lineage commitment(GO:0043375) negative regulation of retinal cell programmed cell death(GO:0046671) |
| 0.3 | 0.9 | GO:0007352 | zygotic specification of dorsal/ventral axis(GO:0007352) |
| 0.3 | 36.8 | GO:0060333 | interferon-gamma-mediated signaling pathway(GO:0060333) |
| 0.3 | 0.9 | GO:0021571 | rhombomere 5 development(GO:0021571) central nervous system segmentation(GO:0035283) brain segmentation(GO:0035284) |
| 0.3 | 0.3 | GO:0002408 | myeloid dendritic cell chemotaxis(GO:0002408) |
| 0.3 | 0.3 | GO:0006414 | translational elongation(GO:0006414) |
| 0.3 | 0.9 | GO:1903625 | negative regulation of DNA catabolic process(GO:1903625) |
| 0.3 | 1.2 | GO:0060316 | positive regulation of ryanodine-sensitive calcium-release channel activity(GO:0060316) |
| 0.3 | 16.8 | GO:0050853 | B cell receptor signaling pathway(GO:0050853) |
| 0.3 | 1.4 | GO:0030854 | positive regulation of granulocyte differentiation(GO:0030854) |
| 0.3 | 4.9 | GO:0002523 | leukocyte migration involved in inflammatory response(GO:0002523) |
| 0.3 | 0.8 | GO:0071301 | cellular response to vitamin B1(GO:0071301) response to formaldehyde(GO:1904404) |
| 0.3 | 26.6 | GO:0006958 | complement activation, classical pathway(GO:0006958) |
| 0.3 | 1.1 | GO:0006050 | mannosamine metabolic process(GO:0006050) N-acetylmannosamine metabolic process(GO:0006051) |
| 0.3 | 0.3 | GO:1900736 | regulation of phospholipase C-activating G-protein coupled receptor signaling pathway(GO:1900736) |
| 0.3 | 6.6 | GO:0050974 | detection of mechanical stimulus involved in sensory perception(GO:0050974) |
| 0.3 | 1.0 | GO:0036337 | Fas signaling pathway(GO:0036337) |
| 0.3 | 0.5 | GO:0009450 | gamma-aminobutyric acid catabolic process(GO:0009450) |
| 0.3 | 0.8 | GO:1901731 | positive regulation of platelet aggregation(GO:1901731) |
| 0.3 | 0.8 | GO:0014057 | positive regulation of acetylcholine secretion, neurotransmission(GO:0014057) |
| 0.3 | 2.5 | GO:0051791 | medium-chain fatty acid metabolic process(GO:0051791) |
| 0.2 | 1.0 | GO:0015942 | formate metabolic process(GO:0015942) |
| 0.2 | 2.0 | GO:0070995 | NADPH oxidation(GO:0070995) |
| 0.2 | 0.7 | GO:0010046 | response to mycotoxin(GO:0010046) |
| 0.2 | 1.5 | GO:2000382 | positive regulation of mesoderm development(GO:2000382) |
| 0.2 | 0.7 | GO:0015680 | intracellular copper ion transport(GO:0015680) |
| 0.2 | 0.7 | GO:0030578 | PML body organization(GO:0030578) |
| 0.2 | 3.1 | GO:0070327 | thyroid hormone transport(GO:0070327) |
| 0.2 | 1.2 | GO:0097460 | ferrous iron import into cell(GO:0097460) ferrous iron import across plasma membrane(GO:0098707) |
| 0.2 | 0.7 | GO:0019242 | methylglyoxal biosynthetic process(GO:0019242) |
| 0.2 | 0.7 | GO:1901725 | regulation of histone deacetylase activity(GO:1901725) |
| 0.2 | 1.2 | GO:0008588 | release of cytoplasmic sequestered NF-kappaB(GO:0008588) |
| 0.2 | 2.3 | GO:0071578 | zinc II ion transmembrane import(GO:0071578) |
| 0.2 | 0.7 | GO:0042494 | detection of bacterial lipoprotein(GO:0042494) detection of triacyl bacterial lipopeptide(GO:0042495) detection of bacterial lipopeptide(GO:0070340) |
| 0.2 | 0.9 | GO:0019859 | pyrimidine nucleobase catabolic process(GO:0006208) thymine catabolic process(GO:0006210) thymine metabolic process(GO:0019859) |
| 0.2 | 0.2 | GO:0032423 | regulation of mismatch repair(GO:0032423) positive regulation of mismatch repair(GO:0032425) |
| 0.2 | 4.8 | GO:0071243 | cellular response to arsenic-containing substance(GO:0071243) |
| 0.2 | 0.2 | GO:0043615 | astrocyte cell migration(GO:0043615) |
| 0.2 | 0.9 | GO:2000768 | glomerular parietal epithelial cell differentiation(GO:0072139) positive regulation of nephron tubule epithelial cell differentiation(GO:2000768) |
| 0.2 | 2.0 | GO:0045176 | apical protein localization(GO:0045176) |
| 0.2 | 0.9 | GO:0002266 | follicular dendritic cell activation(GO:0002266) |
| 0.2 | 1.3 | GO:0090646 | mitochondrial tRNA processing(GO:0090646) |
| 0.2 | 0.9 | GO:0044861 | protein transport into plasma membrane raft(GO:0044861) |
| 0.2 | 0.9 | GO:0003331 | regulation of extracellular matrix constituent secretion(GO:0003330) positive regulation of extracellular matrix constituent secretion(GO:0003331) |
| 0.2 | 0.2 | GO:0046514 | ceramide catabolic process(GO:0046514) |
| 0.2 | 0.6 | GO:1901963 | apoptotic process involved in endocardial cushion morphogenesis(GO:0003277) intermediate mesoderm development(GO:0048389) intermediate mesoderm morphogenesis(GO:0048390) intermediate mesoderm formation(GO:0048391) intermediate mesodermal cell differentiation(GO:0048392) regulation of cardiac muscle fiber development(GO:0055018) positive regulation of cardiac muscle fiber development(GO:0055020) bud dilation involved in lung branching(GO:0060503) regulation of transcription from RNA polymerase II promoter involved in kidney development(GO:0060994) BMP signaling pathway involved in ureter morphogenesis(GO:0061149) renal system segmentation(GO:0061150) BMP signaling pathway involved in renal system segmentation(GO:0061151) pulmonary artery endothelial tube morphogenesis(GO:0061155) regulation of transcription from RNA polymerase II promoter involved in mesonephros development(GO:0061216) pattern specification involved in mesonephros development(GO:0061227) BMP signaling pathway involved in nephric duct formation(GO:0071893) negative regulation of branch elongation involved in ureteric bud branching(GO:0072096) negative regulation of branch elongation involved in ureteric bud branching by BMP signaling pathway(GO:0072097) anterior/posterior pattern specification involved in kidney development(GO:0072098) anterior/posterior pattern specification involved in ureteric bud development(GO:0072099) specification of ureteric bud anterior/posterior symmetry(GO:0072100) specification of ureteric bud anterior/posterior symmetry by BMP signaling pathway(GO:0072101) ureter epithelial cell differentiation(GO:0072192) negative regulation of mesenchymal cell proliferation involved in ureter development(GO:0072200) regulation of cell proliferation involved in outflow tract morphogenesis(GO:1901963) positive regulation of cell proliferation involved in outflow tract morphogenesis(GO:1901964) cardiac jelly development(GO:1905072) regulation of metanephric S-shaped body morphogenesis(GO:2000004) negative regulation of metanephric S-shaped body morphogenesis(GO:2000005) regulation of metanephric comma-shaped body morphogenesis(GO:2000006) negative regulation of metanephric comma-shaped body morphogenesis(GO:2000007) |
| 0.2 | 0.6 | GO:0060164 | regulation of timing of neuron differentiation(GO:0060164) |
| 0.2 | 0.8 | GO:2000211 | regulation of glutamate metabolic process(GO:2000211) |
| 0.2 | 0.2 | GO:0048639 | positive regulation of growth(GO:0045927) positive regulation of developmental growth(GO:0048639) |
| 0.2 | 1.5 | GO:0033600 | negative regulation of mammary gland epithelial cell proliferation(GO:0033600) |
| 0.2 | 1.0 | GO:0048807 | female genitalia morphogenesis(GO:0048807) |
| 0.2 | 0.2 | GO:0002584 | negative regulation of antigen processing and presentation of peptide antigen(GO:0002584) |
| 0.2 | 0.4 | GO:0015701 | bicarbonate transport(GO:0015701) |
| 0.2 | 1.6 | GO:0051388 | positive regulation of neurotrophin TRK receptor signaling pathway(GO:0051388) |
| 0.2 | 1.0 | GO:1903659 | regulation of complement-dependent cytotoxicity(GO:1903659) |
| 0.2 | 1.2 | GO:0071233 | cellular response to leucine(GO:0071233) |
| 0.2 | 1.2 | GO:0031022 | nuclear migration along microfilament(GO:0031022) |
| 0.2 | 0.6 | GO:0045423 | regulation of granulocyte macrophage colony-stimulating factor biosynthetic process(GO:0045423) positive regulation of granulocyte macrophage colony-stimulating factor biosynthetic process(GO:0045425) |
| 0.2 | 1.2 | GO:0051970 | negative regulation of transmission of nerve impulse(GO:0051970) |
| 0.2 | 0.2 | GO:0007159 | leukocyte cell-cell adhesion(GO:0007159) |
| 0.2 | 0.4 | GO:0014040 | positive regulation of Schwann cell differentiation(GO:0014040) |
| 0.2 | 0.6 | GO:0035359 | negative regulation of peroxisome proliferator activated receptor signaling pathway(GO:0035359) |
| 0.2 | 0.4 | GO:0051560 | mitochondrial calcium ion homeostasis(GO:0051560) |
| 0.2 | 0.8 | GO:0070982 | L-asparagine biosynthetic process(GO:0070981) L-asparagine metabolic process(GO:0070982) |
| 0.2 | 5.6 | GO:0045730 | respiratory burst(GO:0045730) |
| 0.2 | 0.4 | GO:0006982 | response to lipid hydroperoxide(GO:0006982) |
| 0.2 | 0.8 | GO:0032252 | secretory granule localization(GO:0032252) |
| 0.2 | 0.6 | GO:0071848 | regulation of fever generation by regulation of prostaglandin secretion(GO:0071810) positive regulation of fever generation by positive regulation of prostaglandin secretion(GO:0071812) positive regulation of ERK1 and ERK2 cascade via TNFSF11-mediated signaling(GO:0071848) regulation of fever generation by prostaglandin secretion(GO:0100009) |
| 0.2 | 1.9 | GO:1903944 | regulation of hepatocyte apoptotic process(GO:1903943) negative regulation of hepatocyte apoptotic process(GO:1903944) |
| 0.2 | 0.6 | GO:0008063 | Toll signaling pathway(GO:0008063) |
| 0.2 | 0.9 | GO:0046952 | ketone body catabolic process(GO:0046952) |
| 0.2 | 1.7 | GO:0006054 | N-acetylneuraminate metabolic process(GO:0006054) |
| 0.2 | 0.5 | GO:0072535 | tumor necrosis factor (ligand) superfamily member 11 production(GO:0072535) regulation of tumor necrosis factor (ligand) superfamily member 11 production(GO:2000307) |
| 0.2 | 0.5 | GO:0043105 | regulation of GTP cyclohydrolase I activity(GO:0043095) negative regulation of GTP cyclohydrolase I activity(GO:0043105) |
| 0.2 | 1.8 | GO:0019370 | leukotriene biosynthetic process(GO:0019370) |
| 0.2 | 1.1 | GO:0007207 | phospholipase C-activating G-protein coupled acetylcholine receptor signaling pathway(GO:0007207) |
| 0.2 | 0.5 | GO:0044416 | induction by symbiont of host defense response(GO:0044416) induction of host immune response by virus(GO:0046730) active induction of host immune response by virus(GO:0046732) modulation by symbiont of host defense response(GO:0052031) induction by organism of defense response of other organism involved in symbiotic interaction(GO:0052251) modulation by organism of defense response of other organism involved in symbiotic interaction(GO:0052255) positive regulation by symbiont of host defense response(GO:0052509) positive regulation by organism of defense response of other organism involved in symbiotic interaction(GO:0052510) modulation by organism of immune response of other organism involved in symbiotic interaction(GO:0052552) modulation by symbiont of host immune response(GO:0052553) modulation by virus of host immune response(GO:0075528) |
| 0.2 | 0.2 | GO:0008355 | olfactory learning(GO:0008355) |
| 0.2 | 3.7 | GO:0050930 | induction of positive chemotaxis(GO:0050930) |
| 0.2 | 0.3 | GO:0006738 | nicotinamide riboside catabolic process(GO:0006738) nicotinamide riboside metabolic process(GO:0046495) pyridine nucleoside metabolic process(GO:0070637) pyridine nucleoside catabolic process(GO:0070638) |
| 0.2 | 1.0 | GO:0051902 | negative regulation of mitochondrial depolarization(GO:0051902) |
| 0.2 | 1.7 | GO:0042940 | D-amino acid transport(GO:0042940) |
| 0.2 | 0.2 | GO:2000705 | dense core granule biogenesis(GO:0061110) regulation of dense core granule biogenesis(GO:2000705) |
| 0.2 | 1.4 | GO:0006013 | mannose metabolic process(GO:0006013) |
| 0.2 | 0.7 | GO:0033206 | meiotic cytokinesis(GO:0033206) |
| 0.2 | 0.5 | GO:0030997 | regulation of centriole-centriole cohesion(GO:0030997) |
| 0.2 | 0.2 | GO:0034312 | diol biosynthetic process(GO:0034312) sphingosine biosynthetic process(GO:0046512) sphingoid biosynthetic process(GO:0046520) |
| 0.2 | 0.5 | GO:1904868 | positive regulation of DNA catabolic process(GO:1903626) telomerase catalytic core complex assembly(GO:1904868) regulation of telomerase catalytic core complex assembly(GO:1904882) positive regulation of telomerase catalytic core complex assembly(GO:1904884) |
| 0.2 | 1.5 | GO:0071447 | cellular response to hydroperoxide(GO:0071447) |
| 0.2 | 0.5 | GO:0006391 | transcription initiation from mitochondrial promoter(GO:0006391) |
| 0.2 | 2.7 | GO:0030388 | fructose 1,6-bisphosphate metabolic process(GO:0030388) |
| 0.2 | 1.2 | GO:0002315 | marginal zone B cell differentiation(GO:0002315) |
| 0.2 | 0.8 | GO:0061178 | regulation of insulin secretion involved in cellular response to glucose stimulus(GO:0061178) |
| 0.2 | 0.8 | GO:0010499 | proteasomal ubiquitin-independent protein catabolic process(GO:0010499) |
| 0.2 | 1.7 | GO:0010918 | positive regulation of mitochondrial membrane potential(GO:0010918) |
| 0.2 | 0.7 | GO:0051866 | general adaptation syndrome(GO:0051866) |
| 0.2 | 0.8 | GO:0030070 | insulin processing(GO:0030070) |
| 0.2 | 0.3 | GO:0033091 | positive regulation of immature T cell proliferation(GO:0033091) |
| 0.2 | 0.5 | GO:1905224 | clathrin-coated pit assembly(GO:1905224) |
| 0.2 | 0.2 | GO:0036466 | synaptic vesicle recycling via endosome(GO:0036466) |
| 0.2 | 0.2 | GO:0010952 | positive regulation of peptidase activity(GO:0010952) |
| 0.2 | 0.5 | GO:1900186 | negative regulation of clathrin-mediated endocytosis(GO:1900186) |
| 0.2 | 0.9 | GO:0043385 | mycotoxin metabolic process(GO:0043385) aflatoxin metabolic process(GO:0046222) organic heteropentacyclic compound metabolic process(GO:1901376) |
| 0.2 | 0.5 | GO:0090521 | glomerular visceral epithelial cell migration(GO:0090521) |
| 0.2 | 0.8 | GO:1902896 | terminal web assembly(GO:1902896) |
| 0.2 | 1.1 | GO:1904469 | positive regulation of tumor necrosis factor secretion(GO:1904469) |
| 0.2 | 1.2 | GO:0010528 | regulation of transposition(GO:0010528) negative regulation of transposition(GO:0010529) |
| 0.2 | 0.2 | GO:0030856 | regulation of epithelial cell differentiation(GO:0030856) |
| 0.2 | 3.3 | GO:0000185 | activation of MAPKKK activity(GO:0000185) |
| 0.1 | 1.0 | GO:0010792 | DNA double-strand break processing involved in repair via single-strand annealing(GO:0010792) |
| 0.1 | 1.0 | GO:0032713 | negative regulation of interleukin-4 production(GO:0032713) |
| 0.1 | 0.3 | GO:0016095 | polyprenol catabolic process(GO:0016095) |
| 0.1 | 0.6 | GO:0019747 | regulation of isoprenoid metabolic process(GO:0019747) |
| 0.1 | 0.4 | GO:1904744 | regulation of single-stranded telomeric DNA binding(GO:0060380) positive regulation of single-stranded telomeric DNA binding(GO:0060381) positive regulation of telomeric DNA binding(GO:1904744) |
| 0.1 | 0.3 | GO:0002578 | negative regulation of antigen processing and presentation(GO:0002578) Fc receptor mediated inhibitory signaling pathway(GO:0002774) |
| 0.1 | 0.6 | GO:2000660 | negative regulation of interleukin-1-mediated signaling pathway(GO:2000660) |
| 0.1 | 2.0 | GO:0033015 | porphyrin-containing compound catabolic process(GO:0006787) tetrapyrrole catabolic process(GO:0033015) heme catabolic process(GO:0042167) pigment catabolic process(GO:0046149) |
| 0.1 | 1.0 | GO:0036438 | maintenance of lens transparency(GO:0036438) |
| 0.1 | 0.4 | GO:0006423 | cysteinyl-tRNA aminoacylation(GO:0006423) |
| 0.1 | 0.3 | GO:1903721 | regulation of I-kappaB phosphorylation(GO:1903719) positive regulation of I-kappaB phosphorylation(GO:1903721) |
| 0.1 | 0.7 | GO:0009750 | response to fructose(GO:0009750) |
| 0.1 | 0.1 | GO:1901535 | regulation of DNA demethylation(GO:1901535) negative regulation of DNA demethylation(GO:1901536) |
| 0.1 | 1.4 | GO:0007379 | segment specification(GO:0007379) |
| 0.1 | 0.7 | GO:0030538 | embryonic genitalia morphogenesis(GO:0030538) |
| 0.1 | 0.4 | GO:0048075 | positive regulation of eye pigmentation(GO:0048075) |
| 0.1 | 0.1 | GO:0045229 | cell envelope organization(GO:0043163) external encapsulating structure organization(GO:0045229) |
| 0.1 | 0.1 | GO:0055003 | cardiac myofibril assembly(GO:0055003) |
| 0.1 | 0.4 | GO:0051710 | regulation of cytolysis in other organism(GO:0051710) |
| 0.1 | 1.2 | GO:0045723 | positive regulation of fatty acid biosynthetic process(GO:0045723) |
| 0.1 | 0.5 | GO:0032571 | response to vitamin K(GO:0032571) |
| 0.1 | 0.4 | GO:0098528 | skeletal muscle fiber differentiation(GO:0098528) regulation of skeletal muscle fiber differentiation(GO:1902809) |
| 0.1 | 0.5 | GO:1904059 | regulation of locomotor rhythm(GO:1904059) |
| 0.1 | 0.7 | GO:0071442 | positive regulation of histone H3-K14 acetylation(GO:0071442) |
| 0.1 | 1.9 | GO:0010839 | negative regulation of keratinocyte proliferation(GO:0010839) |
| 0.1 | 0.4 | GO:0003180 | aortic valve development(GO:0003176) aortic valve morphogenesis(GO:0003180) |
| 0.1 | 0.1 | GO:0099543 | retrograde trans-synaptic signaling by soluble gas(GO:0098923) trans-synaptic signaling by soluble gas(GO:0099543) |
| 0.1 | 1.3 | GO:0010917 | negative regulation of mitochondrial membrane potential(GO:0010917) |
| 0.1 | 3.0 | GO:0035338 | long-chain fatty-acyl-CoA biosynthetic process(GO:0035338) |
| 0.1 | 0.4 | GO:0045345 | positive regulation of MHC class I biosynthetic process(GO:0045345) |
| 0.1 | 0.3 | GO:0034435 | steroid esterification(GO:0034433) sterol esterification(GO:0034434) cholesterol esterification(GO:0034435) |
| 0.1 | 1.1 | GO:0032020 | ISG15-protein conjugation(GO:0032020) |
| 0.1 | 0.9 | GO:0015758 | glucose transport(GO:0015758) |
| 0.1 | 0.4 | GO:0043461 | proton-transporting ATP synthase complex assembly(GO:0043461) proton-transporting ATP synthase complex biogenesis(GO:0070272) |
| 0.1 | 0.4 | GO:0038178 | complement component C5a signaling pathway(GO:0038178) |
| 0.1 | 0.6 | GO:0031119 | tRNA pseudouridine synthesis(GO:0031119) |
| 0.1 | 0.1 | GO:0046833 | positive regulation of RNA export from nucleus(GO:0046833) |
| 0.1 | 0.5 | GO:0006668 | sphinganine-1-phosphate metabolic process(GO:0006668) |
| 0.1 | 0.3 | GO:0031999 | negative regulation of fatty acid beta-oxidation(GO:0031999) |
| 0.1 | 0.5 | GO:0018352 | protein-pyridoxal-5-phosphate linkage(GO:0018352) |
| 0.1 | 2.8 | GO:0045063 | T-helper 1 cell differentiation(GO:0045063) |
| 0.1 | 1.5 | GO:0046907 | intracellular transport(GO:0046907) |
| 0.1 | 0.6 | GO:0009233 | menaquinone metabolic process(GO:0009233) |
| 0.1 | 0.4 | GO:0014707 | branchiomeric skeletal muscle development(GO:0014707) |
| 0.1 | 0.2 | GO:0035455 | response to interferon-alpha(GO:0035455) cellular response to interferon-alpha(GO:0035457) |
| 0.1 | 0.1 | GO:0035963 | cellular response to interleukin-13(GO:0035963) |
| 0.1 | 0.2 | GO:0061056 | sclerotome development(GO:0061056) |
| 0.1 | 0.6 | GO:0002371 | dendritic cell cytokine production(GO:0002371) |
| 0.1 | 0.3 | GO:0038043 | interleukin-5-mediated signaling pathway(GO:0038043) |
| 0.1 | 0.2 | GO:0006540 | glutamate decarboxylation to succinate(GO:0006540) |
| 0.1 | 0.7 | GO:0042866 | pyruvate biosynthetic process(GO:0042866) |
| 0.1 | 0.5 | GO:0006570 | tyrosine metabolic process(GO:0006570) |
| 0.1 | 1.0 | GO:0006552 | leucine catabolic process(GO:0006552) |
| 0.1 | 0.1 | GO:0010992 | ubiquitin homeostasis(GO:0010992) |
| 0.1 | 0.8 | GO:2000491 | positive regulation of hepatic stellate cell activation(GO:2000491) |
| 0.1 | 0.5 | GO:0035425 | autocrine signaling(GO:0035425) |
| 0.1 | 0.3 | GO:0036166 | phenotypic switching(GO:0036166) regulation of phenotypic switching(GO:1900239) |
| 0.1 | 0.3 | GO:0061534 | gamma-aminobutyric acid secretion, neurotransmission(GO:0061534) |
| 0.1 | 0.5 | GO:0090245 | axis elongation involved in somitogenesis(GO:0090245) |
| 0.1 | 1.5 | GO:0033617 | mitochondrial respiratory chain complex IV assembly(GO:0033617) mitochondrial respiratory chain complex IV biogenesis(GO:0097034) |
| 0.1 | 0.8 | GO:0045007 | depurination(GO:0045007) |
| 0.1 | 0.2 | GO:1903412 | response to bile acid(GO:1903412) |
| 0.1 | 0.3 | GO:0009607 | response to biotic stimulus(GO:0009607) |
| 0.1 | 0.4 | GO:0002317 | plasma cell differentiation(GO:0002317) |
| 0.1 | 0.4 | GO:0036102 | leukotriene catabolic process(GO:0036100) leukotriene B4 catabolic process(GO:0036101) leukotriene B4 metabolic process(GO:0036102) icosanoid catabolic process(GO:1901523) fatty acid derivative catabolic process(GO:1901569) |
| 0.1 | 0.9 | GO:2000111 | positive regulation of macrophage apoptotic process(GO:2000111) |
| 0.1 | 0.4 | GO:0035900 | response to isolation stress(GO:0035900) |
| 0.1 | 0.1 | GO:0048073 | regulation of eye pigmentation(GO:0048073) |
| 0.1 | 1.2 | GO:0003374 | dynamin polymerization involved in membrane fission(GO:0003373) dynamin polymerization involved in mitochondrial fission(GO:0003374) |
| 0.1 | 0.8 | GO:0010248 | establishment or maintenance of transmembrane electrochemical gradient(GO:0010248) |
| 0.1 | 0.7 | GO:0034670 | chemotaxis to arachidonic acid(GO:0034670) response to arachidonic acid(GO:1904550) |
| 0.1 | 0.2 | GO:0016999 | antibiotic metabolic process(GO:0016999) |
| 0.1 | 0.4 | GO:0007386 | compartment pattern specification(GO:0007386) |
| 0.1 | 0.1 | GO:1902310 | positive regulation of peptidyl-serine dephosphorylation(GO:1902310) |
| 0.1 | 0.2 | GO:0061038 | uterus morphogenesis(GO:0061038) |
| 0.1 | 0.3 | GO:2000630 | interleukin-12 biosynthetic process(GO:0042090) regulation of interleukin-12 biosynthetic process(GO:0045075) positive regulation of miRNA metabolic process(GO:2000630) |
| 0.1 | 0.6 | GO:0000480 | endonucleolytic cleavage in 5'-ETS of tricistronic rRNA transcript (SSU-rRNA, 5.8S rRNA, LSU-rRNA)(GO:0000480) |
| 0.1 | 0.8 | GO:0043086 | negative regulation of catalytic activity(GO:0043086) |
| 0.1 | 0.2 | GO:0009051 | pentose-phosphate shunt, oxidative branch(GO:0009051) |
| 0.1 | 2.3 | GO:0045662 | negative regulation of myoblast differentiation(GO:0045662) |
| 0.1 | 0.5 | GO:0033567 | DNA replication, Okazaki fragment processing(GO:0033567) |
| 0.1 | 1.5 | GO:0007130 | synaptonemal complex assembly(GO:0007130) |
| 0.1 | 0.9 | GO:1904754 | positive regulation of vascular associated smooth muscle cell migration(GO:1904754) |
| 0.1 | 1.1 | GO:0006782 | protoporphyrinogen IX biosynthetic process(GO:0006782) |
| 0.1 | 0.1 | GO:0060066 | oviduct development(GO:0060066) |
| 0.1 | 0.1 | GO:0032648 | interferon-beta production(GO:0032608) regulation of interferon-beta production(GO:0032648) |
| 0.1 | 0.3 | GO:2000683 | mesodermal-endodermal cell signaling(GO:0003131) programmed DNA elimination(GO:0031049) chromosome breakage(GO:0031052) histone H2A-S139 phosphorylation(GO:0035978) regulation of cellular response to X-ray(GO:2000683) positive regulation of cellular response to X-ray(GO:2000685) |
| 0.1 | 0.6 | GO:0002803 | positive regulation of antimicrobial peptide production(GO:0002225) positive regulation of antimicrobial humoral response(GO:0002760) positive regulation of antibacterial peptide production(GO:0002803) |
| 0.1 | 0.2 | GO:1904380 | endoplasmic reticulum mannose trimming(GO:1904380) |
| 0.1 | 0.6 | GO:2000271 | positive regulation of fibroblast apoptotic process(GO:2000271) |
| 0.1 | 0.5 | GO:0046642 | negative regulation of alpha-beta T cell proliferation(GO:0046642) |
| 0.1 | 0.2 | GO:0043376 | regulation of CD8-positive, alpha-beta T cell differentiation(GO:0043376) |
| 0.1 | 0.4 | GO:0060040 | retinal bipolar neuron differentiation(GO:0060040) |
| 0.1 | 0.5 | GO:0038026 | reelin-mediated signaling pathway(GO:0038026) |
| 0.1 | 1.1 | GO:0006030 | chitin metabolic process(GO:0006030) chitin catabolic process(GO:0006032) |
| 0.1 | 0.8 | GO:0014809 | regulation of skeletal muscle contraction by regulation of release of sequestered calcium ion(GO:0014809) |
| 0.1 | 0.5 | GO:1900004 | negative regulation of serine-type endopeptidase activity(GO:1900004) negative regulation of serine-type peptidase activity(GO:1902572) |
| 0.1 | 0.3 | GO:0061107 | seminal vesicle development(GO:0061107) |
| 0.1 | 1.1 | GO:0034142 | toll-like receptor 4 signaling pathway(GO:0034142) |
| 0.1 | 0.5 | GO:0043308 | eosinophil activation involved in immune response(GO:0002278) eosinophil mediated immunity(GO:0002447) eosinophil degranulation(GO:0043308) |
| 0.1 | 1.6 | GO:0015937 | coenzyme A biosynthetic process(GO:0015937) |
| 0.1 | 0.8 | GO:0018916 | nitrobenzene metabolic process(GO:0018916) |
| 0.1 | 0.2 | GO:0034146 | toll-like receptor 5 signaling pathway(GO:0034146) |
| 0.1 | 0.3 | GO:0006528 | asparagine metabolic process(GO:0006528) |
| 0.1 | 1.7 | GO:0052695 | cellular glucuronidation(GO:0052695) |
| 0.1 | 0.4 | GO:0042407 | cristae formation(GO:0042407) |
| 0.1 | 0.4 | GO:0060136 | embryonic process involved in female pregnancy(GO:0060136) |
| 0.1 | 2.0 | GO:0097503 | sialylation(GO:0097503) |
| 0.1 | 0.3 | GO:0051106 | positive regulation of DNA ligation(GO:0051106) |
| 0.1 | 0.6 | GO:0010890 | positive regulation of sequestering of triglyceride(GO:0010890) |
| 0.1 | 0.7 | GO:0072733 | response to staurosporine(GO:0072733) cellular response to staurosporine(GO:0072734) |
| 0.1 | 0.4 | GO:0010216 | maintenance of DNA methylation(GO:0010216) |
| 0.1 | 1.4 | GO:0006559 | L-phenylalanine metabolic process(GO:0006558) L-phenylalanine catabolic process(GO:0006559) erythrose 4-phosphate/phosphoenolpyruvate family amino acid metabolic process(GO:1902221) erythrose 4-phosphate/phosphoenolpyruvate family amino acid catabolic process(GO:1902222) |
| 0.1 | 0.1 | GO:0019853 | L-ascorbic acid biosynthetic process(GO:0019853) |
| 0.1 | 0.3 | GO:1902990 | mitotic telomere maintenance via semi-conservative replication(GO:1902990) |
| 0.1 | 0.1 | GO:0033233 | regulation of protein sumoylation(GO:0033233) positive regulation of protein sumoylation(GO:0033235) |
| 0.1 | 0.6 | GO:0019418 | sulfide oxidation(GO:0019418) sulfide oxidation, using sulfide:quinone oxidoreductase(GO:0070221) |
| 0.1 | 0.4 | GO:0008089 | anterograde axonal transport(GO:0008089) axonal transport(GO:0098930) |
| 0.1 | 1.1 | GO:0042832 | defense response to protozoan(GO:0042832) |
| 0.1 | 0.2 | GO:0045875 | negative regulation of sister chromatid cohesion(GO:0045875) |
| 0.1 | 0.8 | GO:0051026 | chiasma assembly(GO:0051026) |
| 0.1 | 0.9 | GO:0015886 | heme transport(GO:0015886) |
| 0.1 | 0.2 | GO:0018242 | protein O-linked glycosylation via serine(GO:0018242) |
| 0.1 | 0.2 | GO:0034971 | histone H3-R17 methylation(GO:0034971) |
| 0.1 | 0.5 | GO:0046391 | 5-phosphoribose 1-diphosphate biosynthetic process(GO:0006015) 5-phosphoribose 1-diphosphate metabolic process(GO:0046391) |
| 0.1 | 0.2 | GO:0021891 | olfactory bulb interneuron development(GO:0021891) |
| 0.1 | 0.6 | GO:0006655 | phosphatidylglycerol biosynthetic process(GO:0006655) |
| 0.1 | 0.6 | GO:0046618 | drug export(GO:0046618) |
| 0.1 | 0.5 | GO:1902202 | regulation of hepatocyte growth factor receptor signaling pathway(GO:1902202) |
| 0.1 | 2.3 | GO:0042347 | negative regulation of NF-kappaB import into nucleus(GO:0042347) |
| 0.1 | 0.8 | GO:0031295 | T cell costimulation(GO:0031295) |
| 0.1 | 0.8 | GO:1990144 | regulation of hypoxia-induced intrinsic apoptotic signaling pathway(GO:1903297) negative regulation of hypoxia-induced intrinsic apoptotic signaling pathway(GO:1903298) intrinsic apoptotic signaling pathway in response to hypoxia(GO:1990144) |
| 0.1 | 0.4 | GO:0051547 | regulation of keratinocyte migration(GO:0051547) positive regulation of keratinocyte migration(GO:0051549) |
| 0.1 | 0.3 | GO:0032094 | response to food(GO:0032094) |
| 0.1 | 0.4 | GO:0046827 | positive regulation of protein export from nucleus(GO:0046827) |
| 0.1 | 0.6 | GO:0045647 | negative regulation of erythrocyte differentiation(GO:0045647) |
| 0.1 | 0.4 | GO:0090141 | positive regulation of mitochondrial fission(GO:0090141) |
| 0.1 | 0.4 | GO:0019405 | alditol catabolic process(GO:0019405) |
| 0.1 | 0.3 | GO:0006421 | asparaginyl-tRNA aminoacylation(GO:0006421) |
| 0.1 | 4.0 | GO:0050830 | defense response to Gram-positive bacterium(GO:0050830) |
| 0.1 | 0.4 | GO:0051835 | positive regulation of synapse structural plasticity(GO:0051835) |
| 0.1 | 0.4 | GO:0051121 | hepoxilin metabolic process(GO:0051121) hepoxilin biosynthetic process(GO:0051122) |
| 0.1 | 0.4 | GO:0006290 | pyrimidine dimer repair(GO:0006290) |
| 0.1 | 0.2 | GO:0006436 | tryptophanyl-tRNA aminoacylation(GO:0006436) |
| 0.1 | 0.3 | GO:0048382 | mesendoderm development(GO:0048382) |
| 0.1 | 0.3 | GO:1901252 | regulation of intracellular transport of viral material(GO:1901252) |
| 0.1 | 0.8 | GO:0045838 | positive regulation of membrane potential(GO:0045838) |
| 0.1 | 0.2 | GO:0036022 | limb joint morphogenesis(GO:0036022) embryonic skeletal limb joint morphogenesis(GO:0036023) |
| 0.1 | 0.1 | GO:0006295 | nucleotide-excision repair, preincision complex stabilization(GO:0006293) nucleotide-excision repair, DNA incision, 3'-to lesion(GO:0006295) nucleotide-excision repair, DNA incision, 5'-to lesion(GO:0006296) nucleotide-excision repair, DNA incision(GO:0033683) |
| 0.1 | 2.0 | GO:0015697 | quaternary ammonium group transport(GO:0015697) |
| 0.1 | 1.8 | GO:0046337 | phosphatidylethanolamine metabolic process(GO:0046337) |
| 0.1 | 0.1 | GO:0036112 | medium-chain fatty-acyl-CoA metabolic process(GO:0036112) |
| 0.1 | 0.3 | GO:0060125 | negative regulation of growth hormone secretion(GO:0060125) |
| 0.1 | 0.9 | GO:0051601 | exocyst localization(GO:0051601) |
| 0.1 | 1.6 | GO:0007064 | mitotic sister chromatid cohesion(GO:0007064) |
| 0.1 | 0.1 | GO:0060197 | cloacal septation(GO:0060197) |
| 0.1 | 0.4 | GO:0002415 | immunoglobulin transcytosis in epithelial cells mediated by polymeric immunoglobulin receptor(GO:0002415) |
| 0.1 | 0.2 | GO:0003382 | epithelial cell morphogenesis(GO:0003382) |
| 0.1 | 0.2 | GO:0051410 | detoxification of nitrogen compound(GO:0051410) |
| 0.1 | 0.5 | GO:0035469 | determination of pancreatic left/right asymmetry(GO:0035469) |
| 0.1 | 0.8 | GO:0039536 | negative regulation of RIG-I signaling pathway(GO:0039536) |
| 0.1 | 0.2 | GO:0006286 | base-excision repair, base-free sugar-phosphate removal(GO:0006286) |
| 0.1 | 0.4 | GO:1901538 | DNA methylation involved in embryo development(GO:0043045) changes to DNA methylation involved in embryo development(GO:1901538) |
| 0.1 | 0.1 | GO:2001038 | regulation of cellular response to drug(GO:2001038) |
| 0.1 | 0.4 | GO:0003338 | metanephros morphogenesis(GO:0003338) |
| 0.1 | 0.2 | GO:0070131 | positive regulation of mitochondrial translation(GO:0070131) |
| 0.1 | 0.4 | GO:0006398 | mRNA 3'-end processing by stem-loop binding and cleavage(GO:0006398) |
| 0.1 | 0.2 | GO:0002879 | positive regulation of acute inflammatory response to non-antigenic stimulus(GO:0002879) |
| 0.1 | 0.5 | GO:1903758 | regulation of transcription from RNA polymerase II promoter by histone modification(GO:1903756) negative regulation of transcription from RNA polymerase II promoter by histone modification(GO:1903758) |
| 0.1 | 0.9 | GO:0034116 | positive regulation of heterotypic cell-cell adhesion(GO:0034116) |
| 0.1 | 1.4 | GO:0006883 | cellular sodium ion homeostasis(GO:0006883) |
| 0.1 | 0.3 | GO:0043335 | protein unfolding(GO:0043335) |
| 0.1 | 0.2 | GO:0051685 | maintenance of ER location(GO:0051685) |
| 0.1 | 0.5 | GO:0032483 | regulation of Rab protein signal transduction(GO:0032483) |
| 0.1 | 0.5 | GO:0040032 | post-embryonic body morphogenesis(GO:0040032) |
| 0.1 | 0.1 | GO:1901341 | activation of store-operated calcium channel activity(GO:0032237) regulation of store-operated calcium channel activity(GO:1901339) positive regulation of store-operated calcium channel activity(GO:1901341) |
| 0.1 | 0.2 | GO:0006258 | UDP-glucose catabolic process(GO:0006258) galactose catabolic process via UDP-galactose(GO:0033499) |
| 0.1 | 0.2 | GO:1904247 | regulation of polynucleotide adenylyltransferase activity(GO:1904245) positive regulation of polynucleotide adenylyltransferase activity(GO:1904247) |
| 0.1 | 0.3 | GO:0072133 | kidney mesenchyme morphogenesis(GO:0072131) metanephric mesenchyme morphogenesis(GO:0072133) |
| 0.1 | 0.2 | GO:0046532 | regulation of photoreceptor cell differentiation(GO:0046532) |
| 0.1 | 0.5 | GO:0050732 | negative regulation of peptidyl-tyrosine phosphorylation(GO:0050732) |
| 0.1 | 0.3 | GO:2000189 | positive regulation of cholesterol homeostasis(GO:2000189) |
| 0.1 | 0.2 | GO:0070940 | dephosphorylation of RNA polymerase II C-terminal domain(GO:0070940) |
| 0.1 | 0.7 | GO:1901386 | negative regulation of voltage-gated calcium channel activity(GO:1901386) |
| 0.1 | 0.7 | GO:0018344 | protein geranylgeranylation(GO:0018344) |
| 0.1 | 0.6 | GO:0032464 | positive regulation of protein homooligomerization(GO:0032464) |
| 0.1 | 0.2 | GO:0050883 | musculoskeletal movement, spinal reflex action(GO:0050883) |
| 0.1 | 0.5 | GO:0071681 | response to indole-3-methanol(GO:0071680) cellular response to indole-3-methanol(GO:0071681) |
| 0.1 | 0.2 | GO:0010430 | fatty acid omega-oxidation(GO:0010430) |
| 0.1 | 0.2 | GO:0048539 | bone marrow development(GO:0048539) |
| 0.1 | 0.2 | GO:0019626 | short-chain fatty acid catabolic process(GO:0019626) |
| 0.1 | 0.1 | GO:1901656 | glycoside transport(GO:1901656) |
| 0.1 | 0.2 | GO:0042126 | nitrate metabolic process(GO:0042126) nitrate catabolic process(GO:0043602) nitric oxide catabolic process(GO:0046210) |
| 0.1 | 0.8 | GO:1900028 | negative regulation of ruffle assembly(GO:1900028) |
| 0.1 | 0.2 | GO:1904924 | negative regulation of mitophagy in response to mitochondrial depolarization(GO:1904924) |
| 0.1 | 0.4 | GO:1900673 | olefin metabolic process(GO:1900673) |
| 0.1 | 0.4 | GO:1902031 | regulation of NADP metabolic process(GO:1902031) |
| 0.1 | 0.2 | GO:0051969 | regulation of transmission of nerve impulse(GO:0051969) |
| 0.1 | 0.6 | GO:0005981 | regulation of glycogen catabolic process(GO:0005981) |
| 0.1 | 0.5 | GO:0000722 | telomere maintenance via recombination(GO:0000722) |
| 0.1 | 0.1 | GO:0061572 | actin filament bundle assembly(GO:0051017) actin filament bundle organization(GO:0061572) |
| 0.1 | 0.1 | GO:0060024 | rhythmic synaptic transmission(GO:0060024) |
| 0.1 | 0.3 | GO:1901162 | primary amino compound biosynthetic process(GO:1901162) |
| 0.1 | 0.2 | GO:0010862 | positive regulation of pathway-restricted SMAD protein phosphorylation(GO:0010862) |
| 0.1 | 0.1 | GO:2000400 | positive regulation of T cell differentiation in thymus(GO:0033089) positive regulation of thymocyte aggregation(GO:2000400) |
| 0.1 | 0.5 | GO:0014066 | regulation of phosphatidylinositol 3-kinase signaling(GO:0014066) |
| 0.1 | 1.7 | GO:0033540 | fatty acid beta-oxidation using acyl-CoA oxidase(GO:0033540) |
| 0.1 | 0.3 | GO:0003289 | atrial septum primum morphogenesis(GO:0003289) |
| 0.1 | 0.2 | GO:0051533 | positive regulation of NFAT protein import into nucleus(GO:0051533) |
| 0.1 | 0.3 | GO:0010867 | positive regulation of triglyceride biosynthetic process(GO:0010867) |
| 0.1 | 0.3 | GO:0045110 | intermediate filament bundle assembly(GO:0045110) |
| 0.1 | 0.2 | GO:0044346 | fibroblast apoptotic process(GO:0044346) |
| 0.1 | 0.5 | GO:0086073 | cardiac muscle cell-cardiac muscle cell adhesion(GO:0086042) bundle of His cell-Purkinje myocyte adhesion involved in cell communication(GO:0086073) |
| 0.1 | 0.2 | GO:0045578 | negative regulation of B cell differentiation(GO:0045578) |
| 0.1 | 0.1 | GO:1902473 | regulation of protein localization to synapse(GO:1902473) positive regulation of protein localization to synapse(GO:1902474) |
| 0.1 | 0.1 | GO:0035088 | establishment or maintenance of apical/basal cell polarity(GO:0035088) maintenance of apical/basal cell polarity(GO:0035090) establishment or maintenance of epithelial cell apical/basal polarity(GO:0045197) maintenance of epithelial cell apical/basal polarity(GO:0045199) establishment or maintenance of bipolar cell polarity(GO:0061245) |
| 0.1 | 0.3 | GO:0015722 | canalicular bile acid transport(GO:0015722) |
| 0.1 | 0.1 | GO:0061002 | negative regulation of dendritic spine morphogenesis(GO:0061002) |
| 0.1 | 1.9 | GO:0007158 | neuron cell-cell adhesion(GO:0007158) |
| 0.1 | 0.1 | GO:0045880 | positive regulation of smoothened signaling pathway(GO:0045880) |
| 0.1 | 0.3 | GO:0009155 | purine deoxyribonucleotide catabolic process(GO:0009155) |
| 0.1 | 0.1 | GO:0060157 | urinary bladder development(GO:0060157) |
| 0.1 | 0.2 | GO:0034976 | response to endoplasmic reticulum stress(GO:0034976) |
| 0.1 | 0.1 | GO:0031268 | pseudopodium organization(GO:0031268) |
| 0.1 | 0.6 | GO:0071361 | cellular response to ethanol(GO:0071361) |
| 0.1 | 1.4 | GO:0006298 | mismatch repair(GO:0006298) |
| 0.1 | 0.2 | GO:2000188 | regulation of cholesterol homeostasis(GO:2000188) |
| 0.1 | 0.1 | GO:0005985 | sucrose metabolic process(GO:0005985) |
| 0.1 | 0.1 | GO:0044339 | canonical Wnt signaling pathway involved in osteoblast differentiation(GO:0044339) |
| 0.1 | 6.9 | GO:0002377 | immunoglobulin production(GO:0002377) |
| 0.1 | 0.1 | GO:0006975 | DNA damage induced protein phosphorylation(GO:0006975) |
| 0.1 | 0.1 | GO:0035815 | positive regulation of renal sodium excretion(GO:0035815) |
| 0.1 | 0.1 | GO:0043087 | regulation of GTPase activity(GO:0043087) |
| 0.1 | 0.3 | GO:0080009 | mRNA methylation(GO:0080009) |
| 0.1 | 0.2 | GO:0098597 | observational learning(GO:0098597) |
| 0.1 | 1.4 | GO:0005980 | glycogen catabolic process(GO:0005980) |
| 0.1 | 0.4 | GO:0006069 | ethanol oxidation(GO:0006069) |
| 0.1 | 0.1 | GO:0050954 | sensory perception of mechanical stimulus(GO:0050954) |
| 0.1 | 0.2 | GO:0010825 | positive regulation of centrosome duplication(GO:0010825) |
| 0.1 | 1.3 | GO:0043101 | purine-containing compound salvage(GO:0043101) |
| 0.1 | 0.1 | GO:0072708 | response to sorbitol(GO:0072708) |
| 0.1 | 0.3 | GO:0033490 | cholesterol biosynthetic process via desmosterol(GO:0033489) cholesterol biosynthetic process via lathosterol(GO:0033490) |
| 0.1 | 0.2 | GO:0060010 | Sertoli cell fate commitment(GO:0060010) |
| 0.1 | 0.2 | GO:0030174 | regulation of DNA-dependent DNA replication initiation(GO:0030174) |
| 0.1 | 0.2 | GO:0030311 | poly-N-acetyllactosamine metabolic process(GO:0030309) poly-N-acetyllactosamine biosynthetic process(GO:0030311) |
| 0.1 | 0.2 | GO:0014063 | negative regulation of serotonin secretion(GO:0014063) |
| 0.1 | 0.2 | GO:0039663 | fusion of virus membrane with host plasma membrane(GO:0019064) membrane fusion involved in viral entry into host cell(GO:0039663) multi-organism membrane fusion(GO:0044800) |
| 0.1 | 0.2 | GO:0045897 | positive regulation of transcription during mitosis(GO:0045897) |
| 0.1 | 0.5 | GO:0014067 | negative regulation of phosphatidylinositol 3-kinase signaling(GO:0014067) |
| 0.1 | 0.2 | GO:0060124 | positive regulation of growth hormone secretion(GO:0060124) |
| 0.1 | 0.2 | GO:0032474 | otolith morphogenesis(GO:0032474) |
| 0.1 | 0.3 | GO:0060800 | regulation of cell differentiation involved in embryonic placenta development(GO:0060800) |
| 0.1 | 0.6 | GO:0070973 | protein localization to endoplasmic reticulum exit site(GO:0070973) |
| 0.1 | 0.5 | GO:0032688 | negative regulation of interferon-beta production(GO:0032688) |
| 0.1 | 0.3 | GO:0090080 | positive regulation of MAPKKK cascade by fibroblast growth factor receptor signaling pathway(GO:0090080) |
| 0.1 | 0.5 | GO:2000467 | positive regulation of glycogen (starch) synthase activity(GO:2000467) |
| 0.1 | 0.6 | GO:0006265 | DNA topological change(GO:0006265) |
| 0.1 | 0.5 | GO:0019346 | homoserine metabolic process(GO:0009092) transsulfuration(GO:0019346) |
| 0.1 | 0.7 | GO:0006271 | DNA strand elongation involved in DNA replication(GO:0006271) |
| 0.1 | 0.3 | GO:1902042 | negative regulation of extrinsic apoptotic signaling pathway via death domain receptors(GO:1902042) |
| 0.1 | 0.1 | GO:0009146 | purine nucleoside triphosphate catabolic process(GO:0009146) |
| 0.1 | 0.3 | GO:0002027 | regulation of heart rate(GO:0002027) |
| 0.1 | 0.3 | GO:0098719 | sodium ion import(GO:0097369) sodium ion import across plasma membrane(GO:0098719) sodium ion import into cell(GO:1990118) |
| 0.1 | 0.1 | GO:0006287 | base-excision repair, gap-filling(GO:0006287) |
| 0.1 | 0.1 | GO:0030644 | cellular chloride ion homeostasis(GO:0030644) |
| 0.1 | 0.5 | GO:0021978 | telencephalon regionalization(GO:0021978) |
| 0.1 | 0.1 | GO:0061622 | glycolytic process through glucose-1-phosphate(GO:0061622) |
| 0.1 | 0.3 | GO:0048318 | axial mesoderm development(GO:0048318) |
| 0.1 | 0.1 | GO:0010820 | regulation of T cell chemotaxis(GO:0010819) positive regulation of T cell chemotaxis(GO:0010820) |
| 0.1 | 0.1 | GO:0001574 | ganglioside biosynthetic process(GO:0001574) |
| 0.1 | 0.1 | GO:0009056 | catabolic process(GO:0009056) |
| 0.1 | 0.1 | GO:0014054 | positive regulation of gamma-aminobutyric acid secretion(GO:0014054) |
| 0.1 | 0.6 | GO:0070286 | axonemal dynein complex assembly(GO:0070286) |
| 0.1 | 0.4 | GO:0007217 | tachykinin receptor signaling pathway(GO:0007217) |
| 0.1 | 0.2 | GO:0006049 | UDP-N-acetylglucosamine catabolic process(GO:0006049) |
| 0.1 | 0.1 | GO:0071409 | cellular response to cycloheximide(GO:0071409) |
| 0.1 | 0.1 | GO:0038028 | insulin receptor signaling pathway via phosphatidylinositol 3-kinase(GO:0038028) |
| 0.1 | 0.1 | GO:1990403 | embryonic brain development(GO:1990403) |
| 0.1 | 0.8 | GO:0018345 | protein palmitoylation(GO:0018345) |
| 0.1 | 0.2 | GO:1903236 | regulation of leukocyte tethering or rolling(GO:1903236) |
| 0.1 | 0.2 | GO:0035623 | regulation of pronephros size(GO:0035565) renal glucose absorption(GO:0035623) |
| 0.1 | 0.2 | GO:0060708 | spongiotrophoblast differentiation(GO:0060708) |
| 0.1 | 0.1 | GO:0045589 | regulation of regulatory T cell differentiation(GO:0045589) |
| 0.1 | 0.1 | GO:0003284 | septum primum development(GO:0003284) |
| 0.1 | 0.1 | GO:0044828 | negative regulation by host of viral genome replication(GO:0044828) |
| 0.1 | 0.2 | GO:0045014 | carbon catabolite repression of transcription(GO:0045013) negative regulation of transcription by glucose(GO:0045014) |
| 0.1 | 0.2 | GO:0032292 | myelination in peripheral nervous system(GO:0022011) peripheral nervous system axon ensheathment(GO:0032292) |
| 0.1 | 0.1 | GO:1901654 | response to ketone(GO:1901654) |
| 0.1 | 0.3 | GO:0006620 | posttranslational protein targeting to membrane(GO:0006620) |
| 0.1 | 0.4 | GO:0010968 | regulation of microtubule nucleation(GO:0010968) |
| 0.1 | 0.1 | GO:0002031 | G-protein coupled receptor internalization(GO:0002031) |
| 0.1 | 0.1 | GO:1901074 | regulation of engulfment of apoptotic cell(GO:1901074) |
| 0.1 | 0.4 | GO:0031848 | protection from non-homologous end joining at telomere(GO:0031848) |
| 0.1 | 0.1 | GO:0070233 | negative regulation of T cell apoptotic process(GO:0070233) |
| 0.1 | 2.6 | GO:0034260 | negative regulation of GTPase activity(GO:0034260) |
| 0.1 | 0.4 | GO:0046415 | urate metabolic process(GO:0046415) |
| 0.1 | 0.4 | GO:0010623 | programmed cell death involved in cell development(GO:0010623) |
| 0.1 | 0.2 | GO:0036058 | filtration diaphragm assembly(GO:0036058) slit diaphragm assembly(GO:0036060) negative regulation of retinal ganglion cell axon guidance(GO:0090260) |
| 0.1 | 0.5 | GO:0071265 | amino acid salvage(GO:0043102) L-methionine biosynthetic process(GO:0071265) L-methionine salvage(GO:0071267) |
| 0.1 | 0.6 | GO:0006044 | N-acetylglucosamine metabolic process(GO:0006044) |
| 0.1 | 0.3 | GO:0071477 | hypotonic salinity response(GO:0042539) cellular hypotonic salinity response(GO:0071477) |
| 0.1 | 0.2 | GO:0044331 | cell-cell adhesion mediated by cadherin(GO:0044331) |
| 0.1 | 0.4 | GO:0009304 | tRNA transcription(GO:0009304) |
| 0.1 | 0.3 | GO:1900029 | positive regulation of ruffle assembly(GO:1900029) |
| 0.0 | 0.3 | GO:0043435 | response to corticotropin-releasing hormone(GO:0043435) cellular response to corticotropin-releasing hormone stimulus(GO:0071376) |
| 0.0 | 0.6 | GO:0050860 | negative regulation of T cell receptor signaling pathway(GO:0050860) |
| 0.0 | 0.2 | GO:0010585 | glutamine secretion(GO:0010585) L-glutamine import(GO:0036229) L-glutamine import into cell(GO:1903803) |
| 0.0 | 0.5 | GO:0061179 | negative regulation of insulin secretion involved in cellular response to glucose stimulus(GO:0061179) |
| 0.0 | 0.2 | GO:0009822 | alkaloid catabolic process(GO:0009822) |
| 0.0 | 0.2 | GO:0072141 | renal interstitial fibroblast development(GO:0072141) mesangial cell development(GO:0072143) glomerular mesangial cell development(GO:0072144) |
| 0.0 | 0.4 | GO:1903003 | positive regulation of protein deubiquitination(GO:1903003) |
| 0.0 | 0.2 | GO:0010536 | positive regulation of activation of Janus kinase activity(GO:0010536) |
| 0.0 | 0.2 | GO:1904417 | regulation of xenophagy(GO:1904415) positive regulation of xenophagy(GO:1904417) |
| 0.0 | 0.5 | GO:1903358 | regulation of Golgi organization(GO:1903358) |
| 0.0 | 0.3 | GO:0015712 | hexose phosphate transport(GO:0015712) glucose-6-phosphate transport(GO:0015760) |
| 0.0 | 0.2 | GO:0097680 | double-strand break repair via classical nonhomologous end joining(GO:0097680) |
| 0.0 | 0.3 | GO:0001787 | natural killer cell proliferation(GO:0001787) |
| 0.0 | 0.3 | GO:1902957 | negative regulation of mitochondrial electron transport, NADH to ubiquinone(GO:1902957) |
| 0.0 | 0.2 | GO:0035879 | plasma membrane lactate transport(GO:0035879) |
| 0.0 | 0.0 | GO:1900138 | negative regulation of icosanoid secretion(GO:0032304) negative regulation of phospholipase A2 activity(GO:1900138) |
| 0.0 | 0.2 | GO:1902231 | positive regulation of intrinsic apoptotic signaling pathway in response to DNA damage(GO:1902231) |
| 0.0 | 0.1 | GO:0002089 | lens morphogenesis in camera-type eye(GO:0002089) |
| 0.0 | 0.0 | GO:0002314 | germinal center B cell differentiation(GO:0002314) |
| 0.0 | 0.2 | GO:0070269 | pyroptosis(GO:0070269) |
| 0.0 | 0.6 | GO:0016075 | rRNA catabolic process(GO:0016075) |
| 0.0 | 0.2 | GO:0001302 | replicative cell aging(GO:0001302) |
| 0.0 | 0.3 | GO:0002819 | regulation of adaptive immune response(GO:0002819) |
| 0.0 | 0.5 | GO:0030322 | stabilization of membrane potential(GO:0030322) |
| 0.0 | 0.2 | GO:1990834 | response to odorant(GO:1990834) |
| 0.0 | 0.1 | GO:0097210 | response to gonadotropin-releasing hormone(GO:0097210) cellular response to gonadotropin-releasing hormone(GO:0097211) |
| 0.0 | 0.8 | GO:0005513 | detection of calcium ion(GO:0005513) |
| 0.0 | 0.2 | GO:0051919 | positive regulation of fibrinolysis(GO:0051919) |
| 0.0 | 0.1 | GO:0048672 | positive regulation of collateral sprouting(GO:0048672) |
| 0.0 | 0.4 | GO:0070863 | positive regulation of protein exit from endoplasmic reticulum(GO:0070863) |
| 0.0 | 0.4 | GO:0045905 | translational frameshifting(GO:0006452) positive regulation of translational termination(GO:0045905) |
| 0.0 | 0.0 | GO:0045744 | negative regulation of G-protein coupled receptor protein signaling pathway(GO:0045744) |
| 0.0 | 0.2 | GO:0070445 | oligodendrocyte progenitor proliferation(GO:0070444) regulation of oligodendrocyte progenitor proliferation(GO:0070445) |
| 0.0 | 0.5 | GO:0031915 | positive regulation of synaptic plasticity(GO:0031915) |
| 0.0 | 0.5 | GO:0060736 | prostate gland growth(GO:0060736) |
| 0.0 | 1.5 | GO:0031055 | chromatin remodeling at centromere(GO:0031055) |
| 0.0 | 0.1 | GO:1902499 | regulation of protein autoubiquitination(GO:1902498) positive regulation of protein autoubiquitination(GO:1902499) |
| 0.0 | 0.2 | GO:0097500 | receptor localization to nonmotile primary cilium(GO:0097500) |
| 0.0 | 0.1 | GO:0045899 | positive regulation of RNA polymerase II transcriptional preinitiation complex assembly(GO:0045899) |
| 0.0 | 0.1 | GO:0036343 | psychomotor behavior(GO:0036343) |
| 0.0 | 0.4 | GO:0018026 | peptidyl-lysine monomethylation(GO:0018026) |
| 0.0 | 0.1 | GO:0006352 | DNA-templated transcription, initiation(GO:0006352) |
| 0.0 | 0.2 | GO:1902730 | regulation of heparan sulfate proteoglycan biosynthetic process(GO:0010908) positive regulation of heparan sulfate proteoglycan biosynthetic process(GO:0010909) canonical Wnt signaling pathway involved in positive regulation of epithelial to mesenchymal transition(GO:0044334) positive regulation of proteoglycan biosynthetic process(GO:1902730) |
| 0.0 | 0.2 | GO:0019079 | viral genome replication(GO:0019079) |
| 0.0 | 0.4 | GO:0017187 | peptidyl-glutamic acid carboxylation(GO:0017187) protein carboxylation(GO:0018214) |
| 0.0 | 1.6 | GO:0000027 | ribosomal large subunit assembly(GO:0000027) |
| 0.0 | 2.5 | GO:0060113 | inner ear receptor cell differentiation(GO:0060113) |
| 0.0 | 0.0 | GO:0022401 | desensitization of G-protein coupled receptor protein signaling pathway(GO:0002029) negative adaptation of signaling pathway(GO:0022401) adaptation of signaling pathway(GO:0023058) |
| 0.0 | 0.1 | GO:0048511 | rhythmic process(GO:0048511) |
| 0.0 | 0.1 | GO:0002949 | tRNA threonylcarbamoyladenosine modification(GO:0002949) |
| 0.0 | 0.1 | GO:0070459 | prolactin secretion(GO:0070459) |
| 0.0 | 0.4 | GO:0060285 | cilium-dependent cell motility(GO:0060285) |
| 0.0 | 0.3 | GO:0060481 | lobar bronchus epithelium development(GO:0060481) |
| 0.0 | 0.8 | GO:0001829 | trophectodermal cell differentiation(GO:0001829) |
| 0.0 | 0.3 | GO:0033539 | fatty acid beta-oxidation using acyl-CoA dehydrogenase(GO:0033539) |
| 0.0 | 0.5 | GO:0002053 | positive regulation of mesenchymal cell proliferation(GO:0002053) |
| 0.0 | 0.2 | GO:1903826 | arginine transmembrane transport(GO:1903826) |
| 0.0 | 0.2 | GO:0033227 | dsRNA transport(GO:0033227) |
| 0.0 | 0.1 | GO:0021779 | spinal cord oligodendrocyte cell differentiation(GO:0021529) spinal cord oligodendrocyte cell fate specification(GO:0021530) oligodendrocyte cell fate specification(GO:0021778) oligodendrocyte cell fate commitment(GO:0021779) glial cell fate specification(GO:0021780) |
| 0.0 | 0.5 | GO:0006351 | transcription, DNA-templated(GO:0006351) |
| 0.0 | 0.2 | GO:0098535 | de novo centriole assembly(GO:0098535) |
| 0.0 | 0.1 | GO:0000957 | mitochondrial RNA catabolic process(GO:0000957) regulation of mitochondrial RNA catabolic process(GO:0000960) |
| 0.0 | 0.1 | GO:0072402 | response to cell cycle checkpoint signaling(GO:0072396) response to DNA integrity checkpoint signaling(GO:0072402) response to DNA damage checkpoint signaling(GO:0072423) |
| 0.0 | 0.3 | GO:0071963 | establishment or maintenance of cell polarity regulating cell shape(GO:0071963) |
| 0.0 | 0.2 | GO:0001834 | trophectodermal cell proliferation(GO:0001834) regulation of trophectodermal cell proliferation(GO:1904073) positive regulation of trophectodermal cell proliferation(GO:1904075) |
| 0.0 | 0.5 | GO:0034656 | nucleobase-containing small molecule catabolic process(GO:0034656) |
| 0.0 | 0.2 | GO:0035934 | corticosterone secretion(GO:0035934) regulation of corticosterone secretion(GO:2000852) |
| 0.0 | 0.2 | GO:0045945 | positive regulation of transcription from RNA polymerase III promoter(GO:0045945) |
| 0.0 | 0.3 | GO:2000124 | regulation of endocannabinoid signaling pathway(GO:2000124) |
| 0.0 | 0.2 | GO:0038063 | collagen-activated tyrosine kinase receptor signaling pathway(GO:0038063) |
| 0.0 | 0.1 | GO:0032286 | central nervous system myelin maintenance(GO:0032286) |
| 0.0 | 0.2 | GO:0035507 | regulation of myosin-light-chain-phosphatase activity(GO:0035507) |
| 0.0 | 0.1 | GO:0030850 | prostate gland development(GO:0030850) |
| 0.0 | 4.2 | GO:0070268 | cornification(GO:0070268) |
| 0.0 | 0.2 | GO:0009168 | purine nucleoside monophosphate biosynthetic process(GO:0009127) purine ribonucleoside monophosphate biosynthetic process(GO:0009168) |
| 0.0 | 0.0 | GO:0034427 | nuclear-transcribed mRNA catabolic process, exonucleolytic, 3'-5'(GO:0034427) |
| 0.0 | 0.1 | GO:0042796 | snRNA transcription from RNA polymerase III promoter(GO:0042796) |
| 0.0 | 0.1 | GO:0018158 | protein oxidation(GO:0018158) |
| 0.0 | 0.2 | GO:1903753 | negative regulation of p38MAPK cascade(GO:1903753) |
| 0.0 | 0.1 | GO:0045743 | positive regulation of fibroblast growth factor receptor signaling pathway(GO:0045743) |
| 0.0 | 0.3 | GO:0043402 | glucocorticoid mediated signaling pathway(GO:0043402) |
| 0.0 | 0.2 | GO:1904491 | protein localization to ciliary transition zone(GO:1904491) |
| 0.0 | 0.2 | GO:0002088 | lens development in camera-type eye(GO:0002088) |
| 0.0 | 0.4 | GO:1903799 | negative regulation of production of miRNAs involved in gene silencing by miRNA(GO:1903799) |
| 0.0 | 0.1 | GO:0006014 | D-ribose metabolic process(GO:0006014) |
| 0.0 | 0.1 | GO:0097091 | synaptic vesicle clustering(GO:0097091) |
| 0.0 | 0.2 | GO:0006003 | fructose 2,6-bisphosphate metabolic process(GO:0006003) |
| 0.0 | 0.4 | GO:0032098 | regulation of appetite(GO:0032098) |
| 0.0 | 0.1 | GO:0046660 | female sex differentiation(GO:0046660) |
| 0.0 | 2.9 | GO:1901185 | negative regulation of ERBB signaling pathway(GO:1901185) |
| 0.0 | 0.2 | GO:0032695 | negative regulation of interleukin-12 production(GO:0032695) |
| 0.0 | 0.1 | GO:1900063 | regulation of peroxisome organization(GO:1900063) |
| 0.0 | 0.1 | GO:0040016 | embryonic cleavage(GO:0040016) |
| 0.0 | 0.8 | GO:0042753 | positive regulation of circadian rhythm(GO:0042753) |
| 0.0 | 0.2 | GO:0035456 | response to interferon-beta(GO:0035456) |
| 0.0 | 0.5 | GO:0051639 | actin filament network formation(GO:0051639) |
| 0.0 | 0.0 | GO:0051238 | intracellular sequestering of iron ion(GO:0006880) sequestering of metal ion(GO:0051238) sequestering of iron ion(GO:0097577) |
| 0.0 | 0.3 | GO:0019264 | glycine biosynthetic process(GO:0006545) glycine biosynthetic process from serine(GO:0019264) |
| 0.0 | 0.5 | GO:0030277 | maintenance of gastrointestinal epithelium(GO:0030277) |
| 0.0 | 1.1 | GO:0010803 | regulation of tumor necrosis factor-mediated signaling pathway(GO:0010803) |
| 0.0 | 0.2 | GO:0032790 | ribosome disassembly(GO:0032790) |
| 0.0 | 0.6 | GO:0046676 | negative regulation of insulin secretion(GO:0046676) |
| 0.0 | 0.2 | GO:0031998 | regulation of fatty acid beta-oxidation(GO:0031998) |
| 0.0 | 0.1 | GO:0002865 | negative regulation of acute inflammatory response to antigenic stimulus(GO:0002865) |
| 0.0 | 0.1 | GO:0070475 | rRNA base methylation(GO:0070475) |
| 0.0 | 0.8 | GO:1902857 | positive regulation of nonmotile primary cilium assembly(GO:1902857) |
| 0.0 | 0.3 | GO:0008343 | adult feeding behavior(GO:0008343) |
| 0.0 | 0.1 | GO:0003404 | optic vesicle morphogenesis(GO:0003404) optic cup structural organization(GO:0003409) |
| 0.0 | 0.1 | GO:0002414 | immunoglobulin transcytosis in epithelial cells(GO:0002414) |
| 0.0 | 0.3 | GO:0006848 | pyruvate transport(GO:0006848) pyruvate transmembrane transport(GO:1901475) |
| 0.0 | 0.2 | GO:0032287 | peripheral nervous system myelin maintenance(GO:0032287) |
| 0.0 | 0.5 | GO:0006688 | glycosphingolipid biosynthetic process(GO:0006688) |
| 0.0 | 0.3 | GO:0010745 | negative regulation of macrophage derived foam cell differentiation(GO:0010745) |
| 0.0 | 0.3 | GO:0061436 | establishment of skin barrier(GO:0061436) |
| 0.0 | 0.1 | GO:0036493 | positive regulation of translation in response to endoplasmic reticulum stress(GO:0036493) |
| 0.0 | 0.1 | GO:2000821 | regulation of grooming behavior(GO:2000821) |
| 0.0 | 0.1 | GO:0072366 | positive regulation of gluconeogenesis by positive regulation of transcription from RNA polymerase II promoter(GO:0035948) regulation of cellular ketone metabolic process by positive regulation of transcription from RNA polymerase II promoter(GO:0072366) |
| 0.0 | 0.1 | GO:0030860 | regulation of polarized epithelial cell differentiation(GO:0030860) |
| 0.0 | 0.1 | GO:0019474 | L-lysine catabolic process to acetyl-CoA(GO:0019474) L-lysine catabolic process(GO:0019477) L-lysine metabolic process(GO:0046440) |
| 0.0 | 0.4 | GO:0001573 | ganglioside metabolic process(GO:0001573) |
| 0.0 | 0.1 | GO:0051490 | negative regulation of filopodium assembly(GO:0051490) |
| 0.0 | 0.3 | GO:0034374 | low-density lipoprotein particle remodeling(GO:0034374) |
| 0.0 | 0.3 | GO:0018065 | protein-cofactor linkage(GO:0018065) |
| 0.0 | 0.6 | GO:0006536 | glutamate metabolic process(GO:0006536) |
| 0.0 | 0.2 | GO:0032740 | positive regulation of interleukin-17 production(GO:0032740) |
| 0.0 | 0.2 | GO:0017196 | N-terminal peptidyl-methionine acetylation(GO:0017196) |
| 0.0 | 0.6 | GO:0046513 | ceramide biosynthetic process(GO:0046513) |
| 0.0 | 0.4 | GO:1903540 | neurotransmitter receptor transport to postsynaptic membrane(GO:0098969) establishment of protein localization to postsynaptic membrane(GO:1903540) |
| 0.0 | 0.3 | GO:0010032 | meiotic chromosome condensation(GO:0010032) |
| 0.0 | 0.1 | GO:0021520 | spinal cord motor neuron cell fate specification(GO:0021520) |
| 0.0 | 0.1 | GO:0021521 | ventral spinal cord interneuron specification(GO:0021521) cell fate specification involved in pattern specification(GO:0060573) |
| 0.0 | 0.1 | GO:0006613 | cotranslational protein targeting to membrane(GO:0006613) |
| 0.0 | 0.1 | GO:0097254 | renal tubular secretion(GO:0097254) |
| 0.0 | 0.1 | GO:0072502 | cellular phosphate ion homeostasis(GO:0030643) cellular trivalent inorganic anion homeostasis(GO:0072502) |
| 0.0 | 0.4 | GO:0042136 | neurotransmitter biosynthetic process(GO:0042136) |
| 0.0 | 0.2 | GO:1902065 | response to L-glutamate(GO:1902065) |
| 0.0 | 1.7 | GO:0046854 | phosphatidylinositol phosphorylation(GO:0046854) |
| 0.0 | 0.0 | GO:0033087 | negative regulation of immature T cell proliferation(GO:0033087) |
| 0.0 | 0.3 | GO:0007157 | heterophilic cell-cell adhesion via plasma membrane cell adhesion molecules(GO:0007157) |
| 0.0 | 0.3 | GO:0006983 | ER overload response(GO:0006983) |
| 0.0 | 0.1 | GO:0015870 | acetylcholine transport(GO:0015870) |
| 0.0 | 0.1 | GO:0046823 | negative regulation of nucleocytoplasmic transport(GO:0046823) |
| 0.0 | 0.9 | GO:0016601 | Rac protein signal transduction(GO:0016601) |
| 0.0 | 0.1 | GO:0051563 | smooth endoplasmic reticulum calcium ion homeostasis(GO:0051563) |
| 0.0 | 0.1 | GO:0002036 | regulation of L-glutamate transport(GO:0002036) |
| 0.0 | 1.4 | GO:0007218 | neuropeptide signaling pathway(GO:0007218) |
| 0.0 | 0.1 | GO:0021766 | hippocampus development(GO:0021766) |
| 0.0 | 0.1 | GO:1990418 | response to insulin-like growth factor stimulus(GO:1990418) |
| 0.0 | 0.1 | GO:0090309 | positive regulation of methylation-dependent chromatin silencing(GO:0090309) |
| 0.0 | 0.2 | GO:0003072 | regulation of blood vessel size by renin-angiotensin(GO:0002034) renal control of peripheral vascular resistance involved in regulation of systemic arterial blood pressure(GO:0003072) |
| 0.0 | 0.2 | GO:1901315 | negative regulation of histone ubiquitination(GO:0033183) histone H2A K63-linked ubiquitination(GO:0070535) negative regulation of protein K63-linked ubiquitination(GO:1900045) regulation of histone H2A K63-linked ubiquitination(GO:1901314) negative regulation of histone H2A K63-linked ubiquitination(GO:1901315) negative regulation of protein polyubiquitination(GO:1902915) |
| 0.0 | 0.1 | GO:0055090 | acylglycerol homeostasis(GO:0055090) triglyceride homeostasis(GO:0070328) |
| 0.0 | 0.0 | GO:0045053 | protein retention in Golgi apparatus(GO:0045053) |
| 0.0 | 0.1 | GO:0006297 | nucleotide-excision repair, DNA gap filling(GO:0006297) |
| 0.0 | 1.3 | GO:0038034 | signal transduction in absence of ligand(GO:0038034) extrinsic apoptotic signaling pathway in absence of ligand(GO:0097192) |
| 0.0 | 0.1 | GO:0010936 | negative regulation of macrophage cytokine production(GO:0010936) |
| 0.0 | 0.0 | GO:0090237 | regulation of arachidonic acid secretion(GO:0090237) positive regulation of arachidonic acid secretion(GO:0090238) |
| 0.0 | 0.1 | GO:0050894 | determination of affect(GO:0050894) |
| 0.0 | 0.1 | GO:0002184 | cytoplasmic translational termination(GO:0002184) |
| 0.0 | 0.1 | GO:0044205 | 'de novo' UMP biosynthetic process(GO:0044205) |
| 0.0 | 0.6 | GO:0009250 | glycogen biosynthetic process(GO:0005978) glucan biosynthetic process(GO:0009250) |
| 0.0 | 0.1 | GO:0016198 | axon choice point recognition(GO:0016198) |
| 0.0 | 0.3 | GO:0032793 | positive regulation of CREB transcription factor activity(GO:0032793) |
| 0.0 | 0.1 | GO:0048227 | plasma membrane to endosome transport(GO:0048227) |
| 0.0 | 0.2 | GO:0060397 | JAK-STAT cascade involved in growth hormone signaling pathway(GO:0060397) |
| 0.0 | 0.1 | GO:0051661 | maintenance of centrosome location(GO:0051661) |
| 0.0 | 0.1 | GO:0086065 | cell communication involved in cardiac conduction(GO:0086065) |
| 0.0 | 0.1 | GO:0060013 | righting reflex(GO:0060013) |
| 0.0 | 0.1 | GO:0038169 | somatostatin receptor signaling pathway(GO:0038169) somatostatin signaling pathway(GO:0038170) |
| 0.0 | 0.1 | GO:0070943 | neutrophil mediated cytotoxicity(GO:0070942) neutrophil mediated killing of symbiont cell(GO:0070943) neutrophil mediated killing of bacterium(GO:0070944) |
| 0.0 | 0.1 | GO:0050893 | sensory processing(GO:0050893) |
| 0.0 | 0.2 | GO:0060033 | anatomical structure regression(GO:0060033) |
| 0.0 | 0.2 | GO:2001199 | negative regulation of dendritic cell differentiation(GO:2001199) |
| 0.0 | 0.1 | GO:0000055 | ribosomal large subunit export from nucleus(GO:0000055) |
| 0.0 | 0.2 | GO:0043029 | T cell homeostasis(GO:0043029) |
| 0.0 | 0.1 | GO:0014912 | negative regulation of smooth muscle cell migration(GO:0014912) |
| 0.0 | 0.1 | GO:0016561 | protein import into peroxisome matrix, translocation(GO:0016561) |
| 0.0 | 0.3 | GO:0001510 | RNA methylation(GO:0001510) |
| 0.0 | 0.2 | GO:0060768 | epithelial cell proliferation involved in prostate gland development(GO:0060767) regulation of epithelial cell proliferation involved in prostate gland development(GO:0060768) |
| 0.0 | 0.1 | GO:0018094 | protein polyglycylation(GO:0018094) |
| 0.0 | 0.1 | GO:1990416 | cellular response to brain-derived neurotrophic factor stimulus(GO:1990416) |
| 0.0 | 0.4 | GO:0043970 | histone H3-K9 acetylation(GO:0043970) regulation of histone H3-K9 acetylation(GO:2000615) |
| 0.0 | 0.1 | GO:0043031 | negative regulation of macrophage activation(GO:0043031) |
| 0.0 | 0.0 | GO:1902224 | cellular ketone body metabolic process(GO:0046950) ketone body metabolic process(GO:1902224) |
| 0.0 | 0.2 | GO:0006268 | DNA unwinding involved in DNA replication(GO:0006268) |
| 0.0 | 1.3 | GO:0006400 | tRNA modification(GO:0006400) |
| 0.0 | 0.2 | GO:0090140 | regulation of mitochondrial fission(GO:0090140) |
| 0.0 | 1.3 | GO:0006687 | glycosphingolipid metabolic process(GO:0006687) |
| 0.0 | 0.1 | GO:0018095 | protein polyglutamylation(GO:0018095) |
| 0.0 | 0.1 | GO:0035845 | photoreceptor cell outer segment organization(GO:0035845) |
| 0.0 | 0.1 | GO:0035493 | SNARE complex assembly(GO:0035493) |
| 0.0 | 0.3 | GO:0048873 | homeostasis of number of cells within a tissue(GO:0048873) |
| 0.0 | 0.1 | GO:0019933 | cAMP-mediated signaling(GO:0019933) cyclic-nucleotide-mediated signaling(GO:0019935) |
| 0.0 | 0.1 | GO:0007256 | activation of JNKK activity(GO:0007256) |
| 0.0 | 0.2 | GO:0019885 | antigen processing and presentation of endogenous peptide antigen(GO:0002483) antigen processing and presentation of endogenous peptide antigen via MHC class I(GO:0019885) |
| 0.0 | 0.4 | GO:0032897 | negative regulation of viral transcription(GO:0032897) |
| 0.0 | 0.1 | GO:0034587 | piRNA metabolic process(GO:0034587) |
| 0.0 | 0.2 | GO:0019852 | L-ascorbic acid metabolic process(GO:0019852) |
| 0.0 | 0.4 | GO:0006743 | ubiquinone metabolic process(GO:0006743) ubiquinone biosynthetic process(GO:0006744) quinone biosynthetic process(GO:1901663) |
| 0.0 | 0.0 | GO:0098735 | positive regulation of the force of heart contraction(GO:0098735) |
| 0.0 | 0.2 | GO:0007506 | gonadal mesoderm development(GO:0007506) |
| 0.0 | 0.1 | GO:0008090 | retrograde axonal transport(GO:0008090) |
| 0.0 | 0.1 | GO:0006805 | xenobiotic metabolic process(GO:0006805) |
| 0.0 | 0.0 | GO:0002759 | regulation of antimicrobial humoral response(GO:0002759) |
| 0.0 | 0.2 | GO:0045943 | positive regulation of transcription from RNA polymerase I promoter(GO:0045943) |
| 0.0 | 0.3 | GO:0000244 | spliceosomal tri-snRNP complex assembly(GO:0000244) |
| 0.0 | 0.7 | GO:0015804 | neutral amino acid transport(GO:0015804) |
| 0.0 | 0.1 | GO:0033563 | dorsal/ventral axon guidance(GO:0033563) |
| 0.0 | 0.3 | GO:0099514 | anterograde synaptic vesicle transport(GO:0048490) synaptic vesicle cytoskeletal transport(GO:0099514) synaptic vesicle transport along microtubule(GO:0099517) |
| 0.0 | 0.0 | GO:0001701 | in utero embryonic development(GO:0001701) |
| 0.0 | 0.2 | GO:0048096 | chromatin-mediated maintenance of transcription(GO:0048096) |
| 0.0 | 0.4 | GO:0070884 | regulation of calcineurin-NFAT signaling cascade(GO:0070884) |
| 0.0 | 0.1 | GO:1905146 | lysosomal protein catabolic process(GO:1905146) |
| 0.0 | 0.1 | GO:0060074 | synapse maturation(GO:0060074) |
| 0.0 | 0.0 | GO:0042325 | regulation of phosphorylation(GO:0042325) |
| 0.0 | 0.4 | GO:0046834 | lipid phosphorylation(GO:0046834) |
| 0.0 | 0.1 | GO:0043144 | snoRNA processing(GO:0043144) |
| 0.0 | 0.1 | GO:0060670 | branching involved in labyrinthine layer morphogenesis(GO:0060670) |
| 0.0 | 3.4 | GO:0050852 | T cell receptor signaling pathway(GO:0050852) |
| 0.0 | 0.1 | GO:0006285 | base-excision repair, AP site formation(GO:0006285) |
| 0.0 | 0.1 | GO:0034472 | snRNA 3'-end processing(GO:0034472) |
| 0.0 | 0.4 | GO:2000369 | regulation of clathrin-mediated endocytosis(GO:2000369) |
| 0.0 | 0.1 | GO:0001832 | blastocyst growth(GO:0001832) |
| 0.0 | 0.1 | GO:0048631 | regulation of skeletal muscle tissue growth(GO:0048631) |
| 0.0 | 0.0 | GO:0031630 | regulation of synaptic vesicle fusion to presynaptic membrane(GO:0031630) |
| 0.0 | 0.1 | GO:0043046 | DNA methylation involved in gamete generation(GO:0043046) |
| 0.0 | 0.0 | GO:1900227 | positive regulation of NLRP3 inflammasome complex assembly(GO:1900227) |
| 0.0 | 0.2 | GO:0007351 | tripartite regional subdivision(GO:0007351) anterior/posterior axis specification, embryo(GO:0008595) |
| 0.0 | 1.0 | GO:0032481 | positive regulation of type I interferon production(GO:0032481) |
| 0.0 | 0.0 | GO:0010982 | regulation of high-density lipoprotein particle clearance(GO:0010982) |
| 0.0 | 0.1 | GO:0060363 | cranial suture morphogenesis(GO:0060363) |
| 0.0 | 0.1 | GO:0032703 | negative regulation of interleukin-2 production(GO:0032703) |
| 0.0 | 0.1 | GO:0000733 | DNA strand renaturation(GO:0000733) |
| 0.0 | 0.1 | GO:1902570 | protein localization to nucleolus(GO:1902570) |
| 0.0 | 0.1 | GO:0019530 | taurine metabolic process(GO:0019530) |
| 0.0 | 0.1 | GO:0060484 | lung-associated mesenchyme development(GO:0060484) |
| 0.0 | 0.0 | GO:0035441 | cardiac left ventricle formation(GO:0003218) cell migration involved in vasculogenesis(GO:0035441) |
| 0.0 | 0.1 | GO:0030903 | notochord development(GO:0030903) |
| 0.0 | 0.2 | GO:0046677 | response to antibiotic(GO:0046677) |
| 0.0 | 0.1 | GO:0018401 | peptidyl-proline hydroxylation to 4-hydroxy-L-proline(GO:0018401) |
| 0.0 | 0.1 | GO:0071985 | multivesicular body sorting pathway(GO:0071985) |
| 0.0 | 0.1 | GO:0010735 | positive regulation of transcription via serum response element binding(GO:0010735) |
| 0.0 | 0.7 | GO:0030212 | hyaluronan metabolic process(GO:0030212) |
| 0.0 | 0.1 | GO:0099540 | synaptic signaling via neuropeptide(GO:0099538) trans-synaptic signaling by neuropeptide(GO:0099540) trans-synaptic signaling by neuropeptide, modulating synaptic transmission(GO:0099551) |
| 0.0 | 0.1 | GO:1900112 | regulation of histone H3-K9 trimethylation(GO:1900112) |
| 0.0 | 0.3 | GO:0036314 | response to sterol(GO:0036314) |
| 0.0 | 0.2 | GO:0097320 | membrane tubulation(GO:0097320) |
| 0.0 | 0.3 | GO:0060213 | regulation of nuclear-transcribed mRNA poly(A) tail shortening(GO:0060211) positive regulation of nuclear-transcribed mRNA poly(A) tail shortening(GO:0060213) |
| 0.0 | 0.2 | GO:0031284 | positive regulation of guanylate cyclase activity(GO:0031284) |
| 0.0 | 0.1 | GO:0010587 | miRNA catabolic process(GO:0010587) |
| 0.0 | 0.1 | GO:0060168 | positive regulation of adenosine receptor signaling pathway(GO:0060168) |
| 0.0 | 0.1 | GO:0075044 | autophagy of host cells involved in interaction with symbiont(GO:0075044) autophagy involved in symbiotic interaction(GO:0075071) |
| 0.0 | 0.1 | GO:0051342 | regulation of cyclic-nucleotide phosphodiesterase activity(GO:0051342) negative regulation of cyclic-nucleotide phosphodiesterase activity(GO:0051344) |
| 0.0 | 0.3 | GO:0006735 | NADH regeneration(GO:0006735) canonical glycolysis(GO:0061621) glucose catabolic process to pyruvate(GO:0061718) |
| 0.0 | 0.2 | GO:0021694 | cerebellar Purkinje cell layer formation(GO:0021694) cerebellar Purkinje cell differentiation(GO:0021702) |
| 0.0 | 2.5 | GO:0045047 | protein targeting to ER(GO:0045047) |
| 0.0 | 0.0 | GO:0031063 | regulation of histone deacetylation(GO:0031063) |
| 0.0 | 0.0 | GO:0002384 | hepatic immune response(GO:0002384) |
| 0.0 | 0.1 | GO:0015705 | iodide transport(GO:0015705) |
| 0.0 | 0.5 | GO:0030317 | sperm motility(GO:0030317) |
| 0.0 | 0.2 | GO:0015893 | drug transport(GO:0015893) |
| 0.0 | 0.1 | GO:0006449 | regulation of translational termination(GO:0006449) |
| 0.0 | 0.1 | GO:0007204 | positive regulation of cytosolic calcium ion concentration(GO:0007204) |
| 0.0 | 0.1 | GO:0032466 | negative regulation of cytokinesis(GO:0032466) |
| 0.0 | 0.1 | GO:0032377 | regulation of intracellular lipid transport(GO:0032377) regulation of intracellular sterol transport(GO:0032380) regulation of intracellular cholesterol transport(GO:0032383) |
| 0.0 | 1.5 | GO:0090630 | activation of GTPase activity(GO:0090630) |
| 0.0 | 0.1 | GO:0031548 | regulation of brain-derived neurotrophic factor receptor signaling pathway(GO:0031548) |
| 0.0 | 0.1 | GO:1904977 | lymphatic endothelial cell migration(GO:1904977) |
| 0.0 | 0.3 | GO:1990001 | inhibition of cysteine-type endopeptidase activity involved in apoptotic process(GO:1990001) |
| 0.0 | 0.1 | GO:0033383 | geranyl diphosphate metabolic process(GO:0033383) geranyl diphosphate biosynthetic process(GO:0033384) farnesyl diphosphate biosynthetic process(GO:0045337) |
| 0.0 | 0.1 | GO:0009086 | methionine biosynthetic process(GO:0009086) |
| 0.0 | 0.1 | GO:0072282 | metanephric nephron tubule morphogenesis(GO:0072282) |
| 0.0 | 0.3 | GO:0045332 | lipid translocation(GO:0034204) phospholipid translocation(GO:0045332) |
| 0.0 | 0.3 | GO:0008356 | asymmetric cell division(GO:0008356) |
| 0.0 | 0.0 | GO:2000825 | regulation of androgen receptor activity(GO:2000823) positive regulation of androgen receptor activity(GO:2000825) |
| 0.0 | 0.1 | GO:1903070 | negative regulation of ER-associated ubiquitin-dependent protein catabolic process(GO:1903070) |
| 0.0 | 0.2 | GO:0006582 | melanin metabolic process(GO:0006582) |
| 0.0 | 0.1 | GO:0010907 | positive regulation of glucose metabolic process(GO:0010907) |
| 0.0 | 0.2 | GO:0035066 | positive regulation of histone acetylation(GO:0035066) positive regulation of peptidyl-lysine acetylation(GO:2000758) |
| 0.0 | 0.0 | GO:2001270 | cellular response to cold(GO:0070417) regulation of cysteine-type endopeptidase activity involved in execution phase of apoptosis(GO:2001270) negative regulation of cysteine-type endopeptidase activity involved in execution phase of apoptosis(GO:2001271) |
| 0.0 | 0.3 | GO:0006123 | mitochondrial electron transport, cytochrome c to oxygen(GO:0006123) |
| 0.0 | 0.1 | GO:1901838 | positive regulation of transcription of nuclear large rRNA transcript from RNA polymerase I promoter(GO:1901838) |
| 0.0 | 0.0 | GO:2000298 | regulation of Rho-dependent protein serine/threonine kinase activity(GO:2000298) |
| 0.0 | 0.1 | GO:0033689 | negative regulation of osteoblast proliferation(GO:0033689) |
| 0.0 | 0.1 | GO:0072513 | positive regulation of secondary heart field cardioblast proliferation(GO:0072513) |
| 0.0 | 0.0 | GO:0033623 | regulation of integrin activation(GO:0033623) |
| 0.0 | 0.3 | GO:0006825 | copper ion transport(GO:0006825) |
| 0.0 | 0.0 | GO:0008344 | adult locomotory behavior(GO:0008344) |
| 0.0 | 0.1 | GO:0036269 | swimming behavior(GO:0036269) |
| 0.0 | 0.0 | GO:0051697 | protein delipidation(GO:0051697) |
| 0.0 | 0.2 | GO:0033234 | negative regulation of protein sumoylation(GO:0033234) |
| 0.0 | 0.2 | GO:0070262 | peptidyl-serine dephosphorylation(GO:0070262) |
| 0.0 | 0.1 | GO:1903204 | negative regulation of oxidative stress-induced neuron death(GO:1903204) |
| 0.0 | 0.1 | GO:0031648 | protein destabilization(GO:0031648) |
| 0.0 | 0.1 | GO:0038194 | thyroid-stimulating hormone signaling pathway(GO:0038194) |
| 0.0 | 0.1 | GO:0000271 | polysaccharide biosynthetic process(GO:0000271) |
| 0.0 | 0.0 | GO:0050942 | positive regulation of pigment cell differentiation(GO:0050942) |
| 0.0 | 0.6 | GO:0009062 | fatty acid catabolic process(GO:0009062) |
| 0.0 | 0.2 | GO:0006379 | mRNA cleavage(GO:0006379) |
| 0.0 | 0.2 | GO:0007597 | blood coagulation, intrinsic pathway(GO:0007597) |
| 0.0 | 0.1 | GO:0010764 | negative regulation of fibroblast migration(GO:0010764) |
| 0.0 | 0.0 | GO:0045646 | regulation of erythrocyte differentiation(GO:0045646) |
| 0.0 | 0.1 | GO:0042417 | dopamine metabolic process(GO:0042417) |
| 0.0 | 0.1 | GO:0051056 | regulation of small GTPase mediated signal transduction(GO:0051056) |
| 0.0 | 0.0 | GO:1902908 | regulation of monophenol monooxygenase activity(GO:0032771) positive regulation of monophenol monooxygenase activity(GO:0032773) negative regulation of catagen(GO:0051796) regulation of hair cycle by canonical Wnt signaling pathway(GO:0060901) regulation of melanosome transport(GO:1902908) positive regulation of melanosome transport(GO:1902910) |
| 0.0 | 0.0 | GO:2000352 | negative regulation of endothelial cell apoptotic process(GO:2000352) |
| 0.0 | 0.6 | GO:0071347 | cellular response to interleukin-1(GO:0071347) |
| 0.0 | 0.0 | GO:0006990 | positive regulation of transcription from RNA polymerase II promoter involved in unfolded protein response(GO:0006990) |
| 0.0 | 0.0 | GO:0044208 | AMP biosynthetic process(GO:0006167) 'de novo' AMP biosynthetic process(GO:0044208) |
| 0.0 | 0.1 | GO:1900745 | positive regulation of p38MAPK cascade(GO:1900745) |
| 0.0 | 0.0 | GO:0035754 | B cell chemotaxis(GO:0035754) |
| 0.0 | 0.1 | GO:0035082 | axoneme assembly(GO:0035082) |
| 0.0 | 0.0 | GO:0000389 | mRNA 3'-splice site recognition(GO:0000389) |
| 0.0 | 0.2 | GO:0006086 | acetyl-CoA biosynthetic process from pyruvate(GO:0006086) regulation of acetyl-CoA biosynthetic process from pyruvate(GO:0010510) |
| 0.0 | 0.1 | GO:0006924 | activation-induced cell death of T cells(GO:0006924) |
| 0.0 | 0.1 | GO:0070544 | histone H3-K36 demethylation(GO:0070544) |
| 0.0 | 0.1 | GO:0036066 | protein O-linked fucosylation(GO:0036066) |
| 0.0 | 0.1 | GO:0046784 | viral mRNA export from host cell nucleus(GO:0046784) |
| 0.0 | 0.0 | GO:0046985 | positive regulation of hemoglobin biosynthetic process(GO:0046985) |
| 0.0 | 0.1 | GO:0016129 | ergosterol biosynthetic process(GO:0006696) ergosterol metabolic process(GO:0008204) phytosteroid metabolic process(GO:0016128) phytosteroid biosynthetic process(GO:0016129) |
| 0.0 | 0.1 | GO:0043950 | positive regulation of cAMP-mediated signaling(GO:0043950) |
| 0.0 | 0.0 | GO:0061428 | negative regulation of transcription from RNA polymerase II promoter in response to hypoxia(GO:0061428) |
| 0.0 | 0.2 | GO:0034389 | lipid particle organization(GO:0034389) |
| 0.0 | 0.6 | GO:0006968 | cellular defense response(GO:0006968) |
| 0.0 | 0.1 | GO:0036499 | PERK-mediated unfolded protein response(GO:0036499) |
| 0.0 | 0.2 | GO:0032438 | melanosome organization(GO:0032438) |
| 0.0 | 0.2 | GO:0006974 | cellular response to DNA damage stimulus(GO:0006974) |
| 0.0 | 0.1 | GO:0030238 | male sex determination(GO:0030238) |
| 0.0 | 0.1 | GO:0060134 | prepulse inhibition(GO:0060134) |
| 0.0 | 0.0 | GO:2000567 | memory T cell activation(GO:0035709) regulation of memory T cell activation(GO:2000567) positive regulation of memory T cell activation(GO:2000568) |
| 0.0 | 0.1 | GO:0008209 | androgen metabolic process(GO:0008209) |
| 0.0 | 0.4 | GO:1904667 | negative regulation of ubiquitin protein ligase activity(GO:1904667) |
| 0.0 | 0.1 | GO:0051131 | chaperone-mediated protein complex assembly(GO:0051131) |
| 0.0 | 0.0 | GO:2000870 | regulation of progesterone secretion(GO:2000870) |
| 0.0 | 0.1 | GO:0072643 | interferon-gamma secretion(GO:0072643) |
| 0.0 | 0.0 | GO:0042823 | pyridoxal phosphate metabolic process(GO:0042822) pyridoxal phosphate biosynthetic process(GO:0042823) |
| 0.0 | 0.0 | GO:0043248 | proteasome assembly(GO:0043248) |
| 0.0 | 0.0 | GO:0060541 | respiratory system development(GO:0060541) |
| 0.0 | 0.2 | GO:0035428 | hexose transmembrane transport(GO:0035428) glucose transmembrane transport(GO:1904659) |
| 0.0 | 0.1 | GO:0006312 | mitotic recombination(GO:0006312) |
| 0.0 | 0.0 | GO:0090362 | positive regulation of platelet-derived growth factor production(GO:0090362) |
| 0.0 | 0.1 | GO:0006516 | glycoprotein catabolic process(GO:0006516) |
| 0.0 | 0.0 | GO:0039692 | single stranded viral RNA replication via double stranded DNA intermediate(GO:0039692) |
| 0.0 | 0.0 | GO:0018125 | peptidyl-cysteine methylation(GO:0018125) |
| 0.0 | 0.0 | GO:0090230 | regulation of centromere complex assembly(GO:0090230) |
| 0.0 | 0.3 | GO:0016056 | rhodopsin mediated signaling pathway(GO:0016056) |
| 0.0 | 0.0 | GO:0006627 | protein processing involved in protein targeting to mitochondrion(GO:0006627) |