Project
ENCODE cell lines, expression (Ernst 2011)
Navigation
Downloads
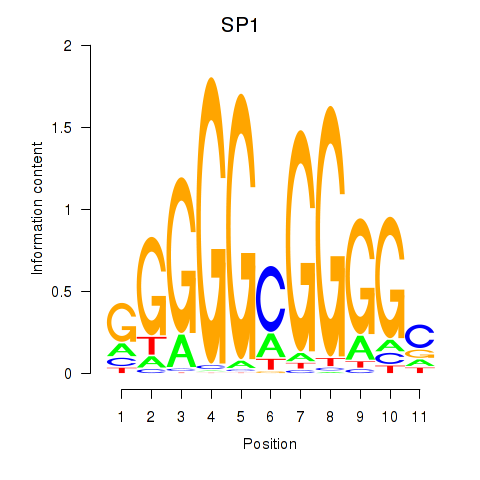
Results for SP1
Z-value: 2.08
Motif logo
Transcription factors associated with SP1
| Gene Symbol | Gene ID | Gene Info |
|---|---|---|
|
SP1
|
ENSG00000185591.5 | SP1 |
Activity-expression correlation:
| Gene | Promoter | Pearson corr. coef. | P-value | Plot |
|---|---|---|---|---|
| SP1 | hg19_v2_chr12_+_53774423_53774658 | -0.62 | 1.1e-02 | Click! |
Activity profile of SP1 motif
Sorted Z-values of SP1 motif
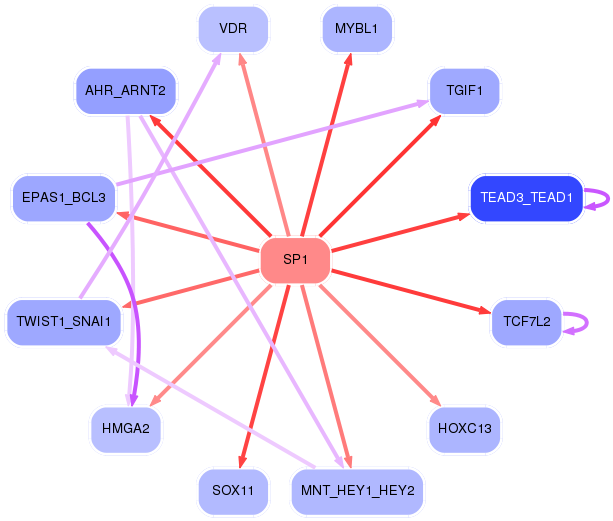
Network of associatons between targets according to the STRING database.

First level regulatory network of SP1
| Promoter | Score | Transcript | Gene | Gene Info |
|---|---|---|---|---|
| chr3_-_149688655 | 6.65 |
ENST00000461930.1 ENST00000423691.2 ENST00000490975.1 ENST00000461868.1 ENST00000452853.2 |
PFN2 |
profilin 2 |
| chr19_-_50143452 | 6.58 |
ENST00000246792.3 |
RRAS |
related RAS viral (r-ras) oncogene homolog |
| chr9_-_35691017 | 5.99 |
ENST00000378292.3 |
TPM2 |
tropomyosin 2 (beta) |
| chr10_-_126849588 | 5.80 |
ENST00000411419.2 |
CTBP2 |
C-terminal binding protein 2 |
| chr2_+_30369859 | 5.75 |
ENST00000402003.3 |
YPEL5 |
yippee-like 5 (Drosophila) |
| chr17_-_1619535 | 5.72 |
ENST00000573075.1 ENST00000574306.1 |
MIR22HG |
MIR22 host gene (non-protein coding) |
| chr19_+_41725088 | 5.57 |
ENST00000301178.4 |
AXL |
AXL receptor tyrosine kinase |
| chr17_-_1619491 | 5.38 |
ENST00000570416.1 ENST00000575626.1 ENST00000610106.1 ENST00000608198.1 ENST00000609442.1 ENST00000334146.3 ENST00000576489.1 ENST00000608245.1 ENST00000609398.1 ENST00000608913.1 ENST00000574016.1 ENST00000571091.1 ENST00000573127.1 ENST00000609990.1 ENST00000576749.1 |
MIR22HG |
MIR22 host gene (non-protein coding) |
| chr2_+_30369807 | 5.04 |
ENST00000379520.3 ENST00000379519.3 ENST00000261353.4 |
YPEL5 |
yippee-like 5 (Drosophila) |
| chr3_-_149688502 | 5.00 |
ENST00000481767.1 ENST00000475518.1 |
PFN2 |
profilin 2 |
| chr5_+_52776228 | 4.57 |
ENST00000256759.3 |
FST |
follistatin |
| chr3_+_135684515 | 4.56 |
ENST00000264977.3 ENST00000490467.1 |
PPP2R3A |
protein phosphatase 2, regulatory subunit B'', alpha |
| chr4_-_157892498 | 4.52 |
ENST00000502773.1 |
PDGFC |
platelet derived growth factor C |
| chr2_-_161350305 | 4.31 |
ENST00000348849.3 |
RBMS1 |
RNA binding motif, single stranded interacting protein 1 |
| chr1_-_225840747 | 4.30 |
ENST00000366843.2 ENST00000366844.3 |
ENAH |
enabled homolog (Drosophila) |
| chrX_-_34675391 | 4.18 |
ENST00000275954.3 |
TMEM47 |
transmembrane protein 47 |
| chr2_-_224903995 | 4.16 |
ENST00000409304.1 ENST00000454956.1 ENST00000258405.4 |
SERPINE2 |
serpin peptidase inhibitor, clade E (nexin, plasminogen activator inhibitor type 1), member 2 |
| chrX_-_106243451 | 4.11 |
ENST00000355610.4 ENST00000535534.1 |
MORC4 |
MORC family CW-type zinc finger 4 |
| chr11_-_2160180 | 4.08 |
ENST00000381406.4 |
IGF2 |
insulin-like growth factor 2 (somatomedin A) |
| chr11_+_65686802 | 4.07 |
ENST00000376991.2 |
DRAP1 |
DR1-associated protein 1 (negative cofactor 2 alpha) |
| chr7_+_130131907 | 4.05 |
ENST00000223215.4 ENST00000437945.1 |
MEST |
mesoderm specific transcript |
| chrX_+_54834791 | 4.03 |
ENST00000218439.4 ENST00000375058.1 ENST00000375060.1 |
MAGED2 |
melanoma antigen family D, 2 |
| chr4_-_57976544 | 3.97 |
ENST00000295666.4 ENST00000537922.1 |
IGFBP7 |
insulin-like growth factor binding protein 7 |
| chr2_+_241375069 | 3.97 |
ENST00000264039.2 |
GPC1 |
glypican 1 |
| chr13_-_110438914 | 3.97 |
ENST00000375856.3 |
IRS2 |
insulin receptor substrate 2 |
| chr8_+_26371763 | 3.96 |
ENST00000521913.1 |
DPYSL2 |
dihydropyrimidinase-like 2 |
| chr5_-_16936340 | 3.95 |
ENST00000507288.1 ENST00000513610.1 |
MYO10 |
myosin X |
| chr2_+_235860616 | 3.91 |
ENST00000392011.2 |
SH3BP4 |
SH3-domain binding protein 4 |
| chr3_-_32022733 | 3.89 |
ENST00000438237.2 ENST00000396556.2 |
OSBPL10 |
oxysterol binding protein-like 10 |
| chrX_+_135229559 | 3.89 |
ENST00000394155.2 |
FHL1 |
four and a half LIM domains 1 |
| chr2_-_110371720 | 3.87 |
ENST00000356688.4 |
SEPT10 |
septin 10 |
| chr11_+_65686952 | 3.84 |
ENST00000527119.1 |
DRAP1 |
DR1-associated protein 1 (negative cofactor 2 alpha) |
| chr20_-_17662705 | 3.84 |
ENST00000455029.2 |
RRBP1 |
ribosome binding protein 1 |
| chrX_+_135229600 | 3.83 |
ENST00000370690.3 |
FHL1 |
four and a half LIM domains 1 |
| chr5_+_52776449 | 3.80 |
ENST00000396947.3 |
FST |
follistatin |
| chr1_+_114522049 | 3.78 |
ENST00000369551.1 ENST00000320334.4 |
OLFML3 |
olfactomedin-like 3 |
| chr3_+_110790590 | 3.65 |
ENST00000485303.1 |
PVRL3 |
poliovirus receptor-related 3 |
| chr11_-_115375107 | 3.65 |
ENST00000545380.1 ENST00000452722.3 ENST00000537058.1 ENST00000536727.1 ENST00000542447.2 ENST00000331581.6 |
CADM1 |
cell adhesion molecule 1 |
| chr12_+_49212514 | 3.64 |
ENST00000301050.2 ENST00000548279.1 ENST00000547230.1 |
CACNB3 |
calcium channel, voltage-dependent, beta 3 subunit |
| chr12_-_106641728 | 3.64 |
ENST00000378026.4 |
CKAP4 |
cytoskeleton-associated protein 4 |
| chr14_-_69446034 | 3.62 |
ENST00000193403.6 |
ACTN1 |
actinin, alpha 1 |
| chr4_-_177713788 | 3.61 |
ENST00000280193.2 |
VEGFC |
vascular endothelial growth factor C |
| chr1_-_68299130 | 3.60 |
ENST00000370982.3 |
GNG12 |
guanine nucleotide binding protein (G protein), gamma 12 |
| chr17_-_3571934 | 3.59 |
ENST00000225525.3 |
TAX1BP3 |
Tax1 (human T-cell leukemia virus type I) binding protein 3 |
| chr6_+_83073952 | 3.57 |
ENST00000543496.1 |
TPBG |
trophoblast glycoprotein |
| chr18_+_3449821 | 3.55 |
ENST00000407501.2 ENST00000405385.3 ENST00000546979.1 |
TGIF1 |
TGFB-induced factor homeobox 1 |
| chr20_+_56884752 | 3.47 |
ENST00000244040.3 |
RAB22A |
RAB22A, member RAS oncogene family |
| chr3_-_149688896 | 3.44 |
ENST00000239940.7 |
PFN2 |
profilin 2 |
| chr7_+_17338239 | 3.42 |
ENST00000242057.4 |
AHR |
aryl hydrocarbon receptor |
| chr2_-_161349909 | 3.42 |
ENST00000392753.3 |
RBMS1 |
RNA binding motif, single stranded interacting protein 1 |
| chr1_-_20812690 | 3.40 |
ENST00000375078.3 |
CAMK2N1 |
calcium/calmodulin-dependent protein kinase II inhibitor 1 |
| chr2_+_36582857 | 3.40 |
ENST00000280527.2 |
CRIM1 |
cysteine rich transmembrane BMP regulator 1 (chordin-like) |
| chr16_-_65155979 | 3.39 |
ENST00000562325.1 ENST00000268603.4 |
CDH11 |
cadherin 11, type 2, OB-cadherin (osteoblast) |
| chr17_-_66453562 | 3.37 |
ENST00000262139.5 ENST00000546360.1 |
WIPI1 |
WD repeat domain, phosphoinositide interacting 1 |
| chr10_+_114709999 | 3.36 |
ENST00000355995.4 ENST00000545257.1 ENST00000543371.1 ENST00000536810.1 ENST00000355717.4 ENST00000538897.1 ENST00000534894.1 |
TCF7L2 |
transcription factor 7-like 2 (T-cell specific, HMG-box) |
| chr6_-_167040731 | 3.35 |
ENST00000265678.4 |
RPS6KA2 |
ribosomal protein S6 kinase, 90kDa, polypeptide 2 |
| chr11_-_111783595 | 3.33 |
ENST00000528628.1 |
CRYAB |
crystallin, alpha B |
| chr14_-_69445968 | 3.32 |
ENST00000438964.2 |
ACTN1 |
actinin, alpha 1 |
| chr6_-_128841503 | 3.30 |
ENST00000368215.3 ENST00000532331.1 ENST00000368213.5 ENST00000368207.3 ENST00000525459.1 ENST00000368210.3 ENST00000368226.4 ENST00000368227.3 |
PTPRK |
protein tyrosine phosphatase, receptor type, K |
| chr9_+_133320301 | 3.29 |
ENST00000352480.5 |
ASS1 |
argininosuccinate synthase 1 |
| chr2_+_46926326 | 3.29 |
ENST00000394861.2 |
SOCS5 |
suppressor of cytokine signaling 5 |
| chr11_+_12696102 | 3.26 |
ENST00000527636.1 ENST00000527376.1 |
TEAD1 |
TEA domain family member 1 (SV40 transcriptional enhancer factor) |
| chr17_+_48133459 | 3.25 |
ENST00000320031.8 |
ITGA3 |
integrin, alpha 3 (antigen CD49C, alpha 3 subunit of VLA-3 receptor) |
| chr8_-_67525473 | 3.24 |
ENST00000522677.3 |
MYBL1 |
v-myb avian myeloblastosis viral oncogene homolog-like 1 |
| chr20_-_17662878 | 3.21 |
ENST00000377813.1 ENST00000377807.2 ENST00000360807.4 ENST00000398782.2 |
RRBP1 |
ribosome binding protein 1 |
| chr3_-_124606074 | 3.19 |
ENST00000296181.4 |
ITGB5 |
integrin, beta 5 |
| chr22_+_33197683 | 3.19 |
ENST00000266085.6 |
TIMP3 |
TIMP metallopeptidase inhibitor 3 |
| chr2_-_227664474 | 3.19 |
ENST00000305123.5 |
IRS1 |
insulin receptor substrate 1 |
| chr2_+_5832799 | 3.17 |
ENST00000322002.3 |
SOX11 |
SRY (sex determining region Y)-box 11 |
| chr2_+_173292390 | 3.13 |
ENST00000442250.1 ENST00000458358.1 ENST00000409080.1 |
ITGA6 |
integrin, alpha 6 |
| chr9_+_36036430 | 3.11 |
ENST00000377966.3 |
RECK |
reversion-inducing-cysteine-rich protein with kazal motifs |
| chr2_+_24272543 | 3.11 |
ENST00000380991.4 |
FKBP1B |
FK506 binding protein 1B, 12.6 kDa |
| chr11_+_65686728 | 3.11 |
ENST00000312515.2 ENST00000525501.1 |
DRAP1 |
DR1-associated protein 1 (negative cofactor 2 alpha) |
| chr7_+_65670186 | 3.10 |
ENST00000304842.5 ENST00000442120.1 |
TPST1 |
tyrosylprotein sulfotransferase 1 |
| chr2_-_235405679 | 3.07 |
ENST00000390645.2 |
ARL4C |
ADP-ribosylation factor-like 4C |
| chrX_+_135229731 | 3.04 |
ENST00000420362.1 |
FHL1 |
four and a half LIM domains 1 |
| chr9_+_133320339 | 3.03 |
ENST00000372394.1 ENST00000372393.3 ENST00000422569.1 |
ASS1 |
argininosuccinate synthase 1 |
| chr2_+_173292301 | 3.01 |
ENST00000264106.6 ENST00000375221.2 ENST00000343713.4 |
ITGA6 |
integrin, alpha 6 |
| chrX_-_128657457 | 3.01 |
ENST00000371121.3 ENST00000371123.1 ENST00000371122.4 |
SMARCA1 |
SWI/SNF related, matrix associated, actin dependent regulator of chromatin, subfamily a, member 1 |
| chr19_+_54694119 | 3.00 |
ENST00000456872.1 ENST00000302937.4 ENST00000429671.2 |
TSEN34 |
TSEN34 tRNA splicing endonuclease subunit |
| chr18_+_3449695 | 2.95 |
ENST00000343820.5 |
TGIF1 |
TGFB-induced factor homeobox 1 |
| chrX_+_54835493 | 2.93 |
ENST00000396224.1 |
MAGED2 |
melanoma antigen family D, 2 |
| chr3_-_45267760 | 2.92 |
ENST00000503771.1 |
TMEM158 |
transmembrane protein 158 (gene/pseudogene) |
| chr12_+_6309517 | 2.90 |
ENST00000382519.4 ENST00000009180.4 |
CD9 |
CD9 molecule |
| chr10_+_13142075 | 2.88 |
ENST00000378757.2 ENST00000430081.1 ENST00000378752.3 ENST00000378748.3 |
OPTN |
optineurin |
| chr3_-_120170052 | 2.87 |
ENST00000295633.3 |
FSTL1 |
follistatin-like 1 |
| chr3_-_114866084 | 2.86 |
ENST00000357258.3 |
ZBTB20 |
zinc finger and BTB domain containing 20 |
| chr4_-_102268484 | 2.86 |
ENST00000394853.4 |
PPP3CA |
protein phosphatase 3, catalytic subunit, alpha isozyme |
| chr11_-_65686496 | 2.85 |
ENST00000449692.3 |
C11orf68 |
chromosome 11 open reading frame 68 |
| chr9_-_35689900 | 2.84 |
ENST00000378300.5 ENST00000329305.2 ENST00000360958.2 |
TPM2 |
tropomyosin 2 (beta) |
| chr14_-_69445793 | 2.80 |
ENST00000538545.2 ENST00000394419.4 |
ACTN1 |
actinin, alpha 1 |
| chr4_+_88928777 | 2.77 |
ENST00000237596.2 |
PKD2 |
polycystic kidney disease 2 (autosomal dominant) |
| chr10_-_81205373 | 2.77 |
ENST00000372336.3 |
ZCCHC24 |
zinc finger, CCHC domain containing 24 |
| chr2_-_110371664 | 2.77 |
ENST00000545389.1 ENST00000423520.1 |
SEPT10 |
septin 10 |
| chr2_-_158732340 | 2.76 |
ENST00000539637.1 ENST00000413751.1 ENST00000434821.1 ENST00000424669.1 |
ACVR1 |
activin A receptor, type I |
| chr6_-_33285505 | 2.75 |
ENST00000431845.2 |
ZBTB22 |
zinc finger and BTB domain containing 22 |
| chr8_+_38854418 | 2.75 |
ENST00000481513.1 ENST00000487273.2 |
ADAM9 |
ADAM metallopeptidase domain 9 |
| chr2_+_173292280 | 2.75 |
ENST00000264107.7 |
ITGA6 |
integrin, alpha 6 |
| chr8_+_94929168 | 2.74 |
ENST00000518107.1 ENST00000396200.3 |
PDP1 |
pyruvate dehyrogenase phosphatase catalytic subunit 1 |
| chr21_+_42539701 | 2.73 |
ENST00000330333.6 ENST00000328735.6 ENST00000347667.5 |
BACE2 |
beta-site APP-cleaving enzyme 2 |
| chr4_-_102268628 | 2.73 |
ENST00000323055.6 ENST00000512215.1 ENST00000394854.3 |
PPP3CA |
protein phosphatase 3, catalytic subunit, alpha isozyme |
| chr4_+_169753156 | 2.71 |
ENST00000393726.3 ENST00000507735.1 |
PALLD |
palladin, cytoskeletal associated protein |
| chr1_+_169075554 | 2.71 |
ENST00000367815.4 |
ATP1B1 |
ATPase, Na+/K+ transporting, beta 1 polypeptide |
| chr17_-_42277203 | 2.71 |
ENST00000587097.1 |
ATXN7L3 |
ataxin 7-like 3 |
| chr13_+_73632897 | 2.69 |
ENST00000377687.4 |
KLF5 |
Kruppel-like factor 5 (intestinal) |
| chr14_-_30396802 | 2.67 |
ENST00000415220.2 |
PRKD1 |
protein kinase D1 |
| chr2_+_20646824 | 2.67 |
ENST00000272233.4 |
RHOB |
ras homolog family member B |
| chr3_-_52002403 | 2.66 |
ENST00000490063.1 ENST00000468324.1 ENST00000497653.1 ENST00000484633.1 |
PCBP4 |
poly(rC) binding protein 4 |
| chr15_-_59041768 | 2.65 |
ENST00000402627.1 ENST00000396140.2 ENST00000559053.1 ENST00000561288.1 |
ADAM10 |
ADAM metallopeptidase domain 10 |
| chr16_-_65155833 | 2.65 |
ENST00000566827.1 ENST00000394156.3 ENST00000562998.1 |
CDH11 |
cadherin 11, type 2, OB-cadherin (osteoblast) |
| chr11_+_69455855 | 2.64 |
ENST00000227507.2 ENST00000536559.1 |
CCND1 |
cyclin D1 |
| chr14_+_21538429 | 2.64 |
ENST00000298694.4 ENST00000555038.1 |
ARHGEF40 |
Rho guanine nucleotide exchange factor (GEF) 40 |
| chr4_-_39529049 | 2.64 |
ENST00000501493.2 ENST00000509391.1 ENST00000507089.1 |
UGDH |
UDP-glucose 6-dehydrogenase |
| chr14_-_53417732 | 2.63 |
ENST00000399304.3 ENST00000395631.2 ENST00000341590.3 ENST00000343279.4 |
FERMT2 |
fermitin family member 2 |
| chr4_-_39529180 | 2.63 |
ENST00000515021.1 ENST00000510490.1 ENST00000316423.6 |
UGDH |
UDP-glucose 6-dehydrogenase |
| chr2_+_24272576 | 2.62 |
ENST00000380986.4 ENST00000452109.1 |
FKBP1B |
FK506 binding protein 1B, 12.6 kDa |
| chr8_+_94929110 | 2.62 |
ENST00000520728.1 |
PDP1 |
pyruvate dehyrogenase phosphatase catalytic subunit 1 |
| chr2_-_216300784 | 2.62 |
ENST00000421182.1 ENST00000432072.2 ENST00000323926.6 ENST00000336916.4 ENST00000357867.4 ENST00000359671.1 ENST00000346544.3 ENST00000345488.5 ENST00000357009.2 ENST00000446046.1 ENST00000356005.4 ENST00000443816.1 ENST00000426059.1 ENST00000354785.4 |
FN1 |
fibronectin 1 |
| chr17_-_1389228 | 2.62 |
ENST00000438665.2 |
MYO1C |
myosin IC |
| chr16_+_56691838 | 2.61 |
ENST00000394501.2 |
MT1F |
metallothionein 1F |
| chr9_+_131314859 | 2.61 |
ENST00000358161.5 ENST00000372731.4 ENST00000372739.3 |
SPTAN1 |
spectrin, alpha, non-erythrocytic 1 |
| chr11_+_12695944 | 2.59 |
ENST00000361905.4 |
TEAD1 |
TEA domain family member 1 (SV40 transcriptional enhancer factor) |
| chr2_-_110371777 | 2.58 |
ENST00000397712.2 |
SEPT10 |
septin 10 |
| chr8_+_94929077 | 2.58 |
ENST00000297598.4 ENST00000520614.1 |
PDP1 |
pyruvate dehyrogenase phosphatase catalytic subunit 1 |
| chr21_+_35014783 | 2.55 |
ENST00000381291.4 ENST00000381285.4 ENST00000399367.3 ENST00000399352.1 ENST00000399355.2 ENST00000399349.1 |
ITSN1 |
intersectin 1 (SH3 domain protein) |
| chr9_-_35115836 | 2.53 |
ENST00000378566.1 ENST00000378554.2 ENST00000322813.5 |
FAM214B |
family with sequence similarity 214, member B |
| chr4_+_38869410 | 2.52 |
ENST00000358869.2 |
FAM114A1 |
family with sequence similarity 114, member A1 |
| chr2_+_187454749 | 2.52 |
ENST00000261023.3 ENST00000374907.3 |
ITGAV |
integrin, alpha V |
| chr10_-_17659357 | 2.50 |
ENST00000326961.6 ENST00000361271.3 |
PTPLA |
protein tyrosine phosphatase-like (proline instead of catalytic arginine), member A |
| chr11_+_117070037 | 2.50 |
ENST00000392951.4 ENST00000525531.1 ENST00000278968.6 |
TAGLN |
transgelin |
| chrX_-_51812268 | 2.50 |
ENST00000486010.1 ENST00000497164.1 ENST00000360134.6 ENST00000485287.1 ENST00000335504.5 ENST00000431659.1 |
MAGED4B |
melanoma antigen family D, 4B |
| chr10_-_126849068 | 2.49 |
ENST00000494626.2 ENST00000337195.5 |
CTBP2 |
C-terminal binding protein 2 |
| chr21_-_28217721 | 2.48 |
ENST00000284984.3 |
ADAMTS1 |
ADAM metallopeptidase with thrombospondin type 1 motif, 1 |
| chr21_-_28338732 | 2.48 |
ENST00000284987.5 |
ADAMTS5 |
ADAM metallopeptidase with thrombospondin type 1 motif, 5 |
| chr10_+_13142225 | 2.48 |
ENST00000378747.3 |
OPTN |
optineurin |
| chr4_+_6271558 | 2.47 |
ENST00000503569.1 ENST00000226760.1 |
WFS1 |
Wolfram syndrome 1 (wolframin) |
| chrX_-_37706815 | 2.45 |
ENST00000378578.4 |
DYNLT3 |
dynein, light chain, Tctex-type 3 |
| chr8_-_62627057 | 2.44 |
ENST00000519234.1 ENST00000379449.6 ENST00000379454.4 ENST00000518068.1 ENST00000517856.1 ENST00000356457.5 |
ASPH |
aspartate beta-hydroxylase |
| chr2_+_242255297 | 2.44 |
ENST00000401990.1 ENST00000407971.1 ENST00000436795.1 ENST00000411484.1 ENST00000434955.1 ENST00000402092.2 ENST00000441533.1 ENST00000443492.1 ENST00000437066.1 ENST00000429791.1 |
SEPT2 |
septin 2 |
| chr5_-_57756087 | 2.43 |
ENST00000274289.3 |
PLK2 |
polo-like kinase 2 |
| chr2_+_46524537 | 2.43 |
ENST00000263734.3 |
EPAS1 |
endothelial PAS domain protein 1 |
| chr3_+_105085734 | 2.43 |
ENST00000306107.5 |
ALCAM |
activated leukocyte cell adhesion molecule |
| chr9_+_139873264 | 2.42 |
ENST00000446677.1 |
PTGDS |
prostaglandin D2 synthase 21kDa (brain) |
| chr15_-_30114622 | 2.42 |
ENST00000495972.2 ENST00000346128.6 |
TJP1 |
tight junction protein 1 |
| chr19_-_36523709 | 2.42 |
ENST00000592017.1 ENST00000360535.4 |
CLIP3 |
CAP-GLY domain containing linker protein 3 |
| chr5_+_135364584 | 2.40 |
ENST00000442011.2 ENST00000305126.8 |
TGFBI |
transforming growth factor, beta-induced, 68kDa |
| chr16_+_3068393 | 2.38 |
ENST00000573001.1 |
TNFRSF12A |
tumor necrosis factor receptor superfamily, member 12A |
| chrX_-_140271249 | 2.38 |
ENST00000370526.2 |
LDOC1 |
leucine zipper, down-regulated in cancer 1 |
| chr3_-_48130707 | 2.37 |
ENST00000360240.6 ENST00000383737.4 |
MAP4 |
microtubule-associated protein 4 |
| chr22_+_38142235 | 2.35 |
ENST00000407319.2 ENST00000403663.2 ENST00000428075.1 |
TRIOBP |
TRIO and F-actin binding protein |
| chr12_+_110718921 | 2.34 |
ENST00000308664.6 |
ATP2A2 |
ATPase, Ca++ transporting, cardiac muscle, slow twitch 2 |
| chr17_-_48943706 | 2.34 |
ENST00000499247.2 |
TOB1 |
transducer of ERBB2, 1 |
| chr18_+_33877654 | 2.34 |
ENST00000257209.4 ENST00000445677.1 ENST00000590592.1 ENST00000359247.4 |
FHOD3 |
formin homology 2 domain containing 3 |
| chr11_-_65686586 | 2.34 |
ENST00000438576.2 |
C11orf68 |
chromosome 11 open reading frame 68 |
| chr2_-_37899323 | 2.34 |
ENST00000295324.3 ENST00000457889.1 |
CDC42EP3 |
CDC42 effector protein (Rho GTPase binding) 3 |
| chr2_-_56150910 | 2.33 |
ENST00000424836.2 ENST00000438672.1 ENST00000440439.1 ENST00000429909.1 ENST00000424207.1 ENST00000452337.1 ENST00000355426.3 ENST00000439193.1 ENST00000421664.1 |
EFEMP1 |
EGF containing fibulin-like extracellular matrix protein 1 |
| chr16_+_56691911 | 2.33 |
ENST00000568475.1 |
MT1F |
metallothionein 1F |
| chr15_+_63340647 | 2.32 |
ENST00000404484.4 |
TPM1 |
tropomyosin 1 (alpha) |
| chr10_+_76586348 | 2.32 |
ENST00000372724.1 ENST00000287239.4 ENST00000372714.1 |
KAT6B |
K(lysine) acetyltransferase 6B |
| chr22_-_50746027 | 2.31 |
ENST00000425954.1 ENST00000449103.1 |
PLXNB2 |
plexin B2 |
| chr7_-_19157248 | 2.31 |
ENST00000242261.5 |
TWIST1 |
twist family bHLH transcription factor 1 |
| chr10_+_124221036 | 2.29 |
ENST00000368984.3 |
HTRA1 |
HtrA serine peptidase 1 |
| chr17_+_60704762 | 2.29 |
ENST00000303375.5 |
MRC2 |
mannose receptor, C type 2 |
| chr22_+_38071615 | 2.29 |
ENST00000215909.5 |
LGALS1 |
lectin, galactoside-binding, soluble, 1 |
| chr5_-_172756506 | 2.28 |
ENST00000265087.4 |
STC2 |
stanniocalcin 2 |
| chr14_+_21538517 | 2.28 |
ENST00000298693.3 |
ARHGEF40 |
Rho guanine nucleotide exchange factor (GEF) 40 |
| chr7_+_94023873 | 2.28 |
ENST00000297268.6 |
COL1A2 |
collagen, type I, alpha 2 |
| chr11_-_12030629 | 2.27 |
ENST00000396505.2 |
DKK3 |
dickkopf WNT signaling pathway inhibitor 3 |
| chr6_-_110500905 | 2.27 |
ENST00000392587.2 |
WASF1 |
WAS protein family, member 1 |
| chr5_+_148521381 | 2.24 |
ENST00000504238.1 |
ABLIM3 |
actin binding LIM protein family, member 3 |
| chr2_+_62933001 | 2.24 |
ENST00000263991.5 ENST00000354487.3 |
EHBP1 |
EH domain binding protein 1 |
| chr8_+_26435359 | 2.24 |
ENST00000311151.5 |
DPYSL2 |
dihydropyrimidinase-like 2 |
| chr4_-_99579733 | 2.23 |
ENST00000305798.3 |
TSPAN5 |
tetraspanin 5 |
| chr3_+_49507559 | 2.22 |
ENST00000421560.1 ENST00000308775.2 ENST00000545947.1 ENST00000541308.1 ENST00000539901.1 ENST00000538711.1 ENST00000418588.1 |
DAG1 |
dystroglycan 1 (dystrophin-associated glycoprotein 1) |
| chr22_+_31477296 | 2.21 |
ENST00000426927.1 ENST00000440425.1 ENST00000358743.1 ENST00000347557.2 ENST00000333137.7 |
SMTN |
smoothelin |
| chr20_-_43977055 | 2.21 |
ENST00000372733.3 ENST00000537976.1 |
SDC4 |
syndecan 4 |
| chr2_-_161264385 | 2.21 |
ENST00000409972.1 |
RBMS1 |
RNA binding motif, single stranded interacting protein 1 |
| chr17_-_78009647 | 2.19 |
ENST00000310924.2 |
TBC1D16 |
TBC1 domain family, member 16 |
| chr7_+_79764104 | 2.19 |
ENST00000351004.3 |
GNAI1 |
guanine nucleotide binding protein (G protein), alpha inhibiting activity polypeptide 1 |
| chr5_-_176924562 | 2.18 |
ENST00000359895.2 ENST00000355572.2 ENST00000355841.2 ENST00000393551.1 ENST00000505074.1 ENST00000356618.4 ENST00000393546.4 |
PDLIM7 |
PDZ and LIM domain 7 (enigma) |
| chr1_+_211432775 | 2.18 |
ENST00000419091.2 |
RCOR3 |
REST corepressor 3 |
| chr3_-_123603137 | 2.17 |
ENST00000360304.3 ENST00000359169.1 ENST00000346322.5 ENST00000360772.3 |
MYLK |
myosin light chain kinase |
| chr17_-_7307358 | 2.15 |
ENST00000576017.1 ENST00000302422.3 ENST00000535512.1 |
TMEM256 TMEM256-PLSCR3 |
transmembrane protein 256 TMEM256-PLSCR3 readthrough (NMD candidate) |
| chr5_+_40679584 | 2.15 |
ENST00000302472.3 |
PTGER4 |
prostaglandin E receptor 4 (subtype EP4) |
| chr1_-_52456352 | 2.15 |
ENST00000371655.3 |
RAB3B |
RAB3B, member RAS oncogene family |
| chr11_-_111783919 | 2.14 |
ENST00000531198.1 ENST00000533879.1 |
CRYAB |
crystallin, alpha B |
| chr22_-_36784035 | 2.12 |
ENST00000216181.5 |
MYH9 |
myosin, heavy chain 9, non-muscle |
| chr11_+_832804 | 2.12 |
ENST00000397420.3 ENST00000525718.1 |
CD151 |
CD151 molecule (Raph blood group) |
| chr5_+_82767487 | 2.12 |
ENST00000343200.5 ENST00000342785.4 |
VCAN |
versican |
| chr19_+_41284121 | 2.11 |
ENST00000594800.1 ENST00000357052.2 ENST00000602173.1 |
RAB4B |
RAB4B, member RAS oncogene family |
| chr11_+_129939811 | 2.11 |
ENST00000345598.5 ENST00000338167.5 |
APLP2 |
amyloid beta (A4) precursor-like protein 2 |
| chr7_+_100770328 | 2.10 |
ENST00000223095.4 ENST00000445463.2 |
SERPINE1 |
serpin peptidase inhibitor, clade E (nexin, plasminogen activator inhibitor type 1), member 1 |
| chr8_+_26240414 | 2.10 |
ENST00000380629.2 |
BNIP3L |
BCL2/adenovirus E1B 19kDa interacting protein 3-like |
| chr1_+_160175201 | 2.10 |
ENST00000368076.1 |
PEA15 |
phosphoprotein enriched in astrocytes 15 |
| chr1_-_151965048 | 2.09 |
ENST00000368809.1 |
S100A10 |
S100 calcium binding protein A10 |
| chr19_+_8478154 | 2.09 |
ENST00000381035.4 ENST00000595142.1 ENST00000601724.1 ENST00000393944.1 ENST00000215555.2 ENST00000601283.1 ENST00000595213.1 |
MARCH2 |
membrane-associated ring finger (C3HC4) 2, E3 ubiquitin protein ligase |
| chrX_-_51239425 | 2.09 |
ENST00000375992.3 |
NUDT11 |
nudix (nucleoside diphosphate linked moiety X)-type motif 11 |
| chr11_-_65640198 | 2.09 |
ENST00000528176.1 |
EFEMP2 |
EGF containing fibulin-like extracellular matrix protein 2 |
| chr7_+_116165038 | 2.09 |
ENST00000393470.1 |
CAV1 |
caveolin 1, caveolae protein, 22kDa |
| chr14_-_74960030 | 2.09 |
ENST00000553490.1 ENST00000557510.1 |
NPC2 |
Niemann-Pick disease, type C2 |
Gene Ontology Analysis
Gene overrepresentation in C2:CP:REACTOME category:
| Log-likelihood per target | Total log-likelihood | Term | Description |
|---|---|---|---|
| 0.7 | 12.4 | REACTOME VEGF LIGAND RECEPTOR INTERACTIONS | Genes involved in VEGF ligand-receptor interactions |
| 0.6 | 8.9 | REACTOME CRMPS IN SEMA3A SIGNALING | Genes involved in CRMPs in Sema3A signaling |
| 0.6 | 19.3 | REACTOME ADHERENS JUNCTIONS INTERACTIONS | Genes involved in Adherens junctions interactions |
| 0.6 | 21.9 | REACTOME A TETRASACCHARIDE LINKER SEQUENCE IS REQUIRED FOR GAG SYNTHESIS | Genes involved in A tetrasaccharide linker sequence is required for GAG synthesis |
| 0.6 | 16.0 | REACTOME CELL EXTRACELLULAR MATRIX INTERACTIONS | Genes involved in Cell-extracellular matrix interactions |
| 0.6 | 35.1 | REACTOME SMOOTH MUSCLE CONTRACTION | Genes involved in Smooth Muscle Contraction |
| 0.6 | 8.4 | REACTOME SEMA3A PLEXIN REPULSION SIGNALING BY INHIBITING INTEGRIN ADHESION | Genes involved in SEMA3A-Plexin repulsion signaling by inhibiting Integrin adhesion |
| 0.5 | 23.8 | REACTOME SIGNALING BY ROBO RECEPTOR | Genes involved in Signaling by Robo receptor |
| 0.5 | 10.6 | REACTOME SIGNAL ATTENUATION | Genes involved in Signal attenuation |
| 0.5 | 0.9 | REACTOME ACYL CHAIN REMODELLING OF PS | Genes involved in Acyl chain remodelling of PS |
| 0.5 | 13.6 | REACTOME SIGNALING BY NODAL | Genes involved in Signaling by NODAL |
| 0.4 | 11.7 | REACTOME REGULATION OF INSULIN LIKE GROWTH FACTOR IGF ACTIVITY BY INSULIN LIKE GROWTH FACTOR BINDING PROTEINS IGFBPS | Genes involved in Regulation of Insulin-like Growth Factor (IGF) Activity by Insulin-like Growth Factor Binding Proteins (IGFBPs) |
| 0.4 | 7.0 | REACTOME REGULATION OF PYRUVATE DEHYDROGENASE PDH COMPLEX | Genes involved in Regulation of pyruvate dehydrogenase (PDH) complex |
| 0.4 | 13.4 | REACTOME CASPASE MEDIATED CLEAVAGE OF CYTOSKELETAL PROTEINS | Genes involved in Caspase-mediated cleavage of cytoskeletal proteins |
| 0.3 | 4.8 | REACTOME G BETA GAMMA SIGNALLING THROUGH PI3KGAMMA | Genes involved in G beta:gamma signalling through PI3Kgamma |
| 0.3 | 1.0 | REACTOME ACTIVATION OF CHAPERONE GENES BY ATF6 ALPHA | Genes involved in Activation of Chaperone Genes by ATF6-alpha |
| 0.3 | 10.8 | REACTOME INHIBITION OF INSULIN SECRETION BY ADRENALINE NORADRENALINE | Genes involved in Inhibition of Insulin Secretion by Adrenaline/Noradrenaline |
| 0.3 | 12.7 | REACTOME BASIGIN INTERACTIONS | Genes involved in Basigin interactions |
| 0.3 | 19.9 | REACTOME COLLAGEN FORMATION | Genes involved in Collagen formation |
| 0.3 | 4.3 | REACTOME SIGNALING BY NOTCH3 | Genes involved in Signaling by NOTCH3 |
| 0.3 | 1.4 | REACTOME IRAK2 MEDIATED ACTIVATION OF TAK1 COMPLEX UPON TLR7 8 OR 9 STIMULATION | Genes involved in IRAK2 mediated activation of TAK1 complex upon TLR7/8 or 9 stimulation |
| 0.3 | 5.2 | REACTOME DOWNREGULATION OF ERBB2 ERBB3 SIGNALING | Genes involved in Downregulation of ERBB2:ERBB3 signaling |
| 0.3 | 5.8 | REACTOME DCC MEDIATED ATTRACTIVE SIGNALING | Genes involved in DCC mediated attractive signaling |
| 0.3 | 7.2 | REACTOME SIGNALING BY HIPPO | Genes involved in Signaling by Hippo |
| 0.3 | 2.8 | REACTOME PURINE CATABOLISM | Genes involved in Purine catabolism |
| 0.3 | 2.5 | REACTOME MEMBRANE BINDING AND TARGETTING OF GAG PROTEINS | Genes involved in Membrane binding and targetting of GAG proteins |
| 0.2 | 0.7 | REACTOME FGFR4 LIGAND BINDING AND ACTIVATION | Genes involved in FGFR4 ligand binding and activation |
| 0.2 | 4.9 | REACTOME PRE NOTCH TRANSCRIPTION AND TRANSLATION | Genes involved in Pre-NOTCH Transcription and Translation |
| 0.2 | 6.2 | REACTOME GLUCURONIDATION | Genes involved in Glucuronidation |
| 0.2 | 4.8 | REACTOME PRE NOTCH PROCESSING IN GOLGI | Genes involved in Pre-NOTCH Processing in Golgi |
| 0.2 | 8.0 | REACTOME SIGNALING BY BMP | Genes involved in Signaling by BMP |
| 0.2 | 7.0 | REACTOME YAP1 AND WWTR1 TAZ STIMULATED GENE EXPRESSION | Genes involved in YAP1- and WWTR1 (TAZ)-stimulated gene expression |
| 0.2 | 1.5 | REACTOME NRIF SIGNALS CELL DEATH FROM THE NUCLEUS | Genes involved in NRIF signals cell death from the nucleus |
| 0.2 | 2.2 | REACTOME PROSTANOID LIGAND RECEPTORS | Genes involved in Prostanoid ligand receptors |
| 0.2 | 3.0 | REACTOME SIGNALING BY ACTIVATED POINT MUTANTS OF FGFR1 | Genes involved in Signaling by activated point mutants of FGFR1 |
| 0.2 | 0.2 | REACTOME RECEPTOR LIGAND BINDING INITIATES THE SECOND PROTEOLYTIC CLEAVAGE OF NOTCH RECEPTOR | Genes involved in Receptor-ligand binding initiates the second proteolytic cleavage of Notch receptor |
| 0.2 | 3.9 | REACTOME SYNTHESIS OF VERY LONG CHAIN FATTY ACYL COAS | Genes involved in Synthesis of very long-chain fatty acyl-CoAs |
| 0.2 | 2.0 | REACTOME REGULATION OF INSULIN SECRETION BY ACETYLCHOLINE | Genes involved in Regulation of Insulin Secretion by Acetylcholine |
| 0.2 | 3.7 | REACTOME GLYCOGEN BREAKDOWN GLYCOGENOLYSIS | Genes involved in Glycogen breakdown (glycogenolysis) |
| 0.2 | 5.8 | REACTOME ANTIGEN PRESENTATION FOLDING ASSEMBLY AND PEPTIDE LOADING OF CLASS I MHC | Genes involved in Antigen Presentation: Folding, assembly and peptide loading of class I MHC |
| 0.2 | 3.5 | REACTOME OXYGEN DEPENDENT PROLINE HYDROXYLATION OF HYPOXIA INDUCIBLE FACTOR ALPHA | Genes involved in Oxygen-dependent Proline Hydroxylation of Hypoxia-inducible Factor Alpha |
| 0.2 | 1.5 | REACTOME PYRIMIDINE CATABOLISM | Genes involved in Pyrimidine catabolism |
| 0.2 | 4.1 | REACTOME POST CHAPERONIN TUBULIN FOLDING PATHWAY | Genes involved in Post-chaperonin tubulin folding pathway |
| 0.2 | 2.9 | REACTOME GAP JUNCTION DEGRADATION | Genes involved in Gap junction degradation |
| 0.2 | 2.5 | REACTOME SYNTHESIS OF SUBSTRATES IN N GLYCAN BIOSYTHESIS | Genes involved in Synthesis of substrates in N-glycan biosythesis |
| 0.1 | 1.0 | REACTOME IL 6 SIGNALING | Genes involved in Interleukin-6 signaling |
| 0.1 | 4.1 | REACTOME PROTEOLYTIC CLEAVAGE OF SNARE COMPLEX PROTEINS | Genes involved in Proteolytic cleavage of SNARE complex proteins |
| 0.1 | 3.8 | REACTOME HORMONE SENSITIVE LIPASE HSL MEDIATED TRIACYLGLYCEROL HYDROLYSIS | Genes involved in Hormone-sensitive lipase (HSL)-mediated triacylglycerol hydrolysis |
| 0.1 | 1.5 | REACTOME JNK C JUN KINASES PHOSPHORYLATION AND ACTIVATION MEDIATED BY ACTIVATED HUMAN TAK1 | Genes involved in JNK (c-Jun kinases) phosphorylation and activation mediated by activated human TAK1 |
| 0.1 | 16.7 | REACTOME RESPONSE TO ELEVATED PLATELET CYTOSOLIC CA2 | Genes involved in Response to elevated platelet cytosolic Ca2+ |
| 0.1 | 3.2 | REACTOME CHONDROITIN SULFATE DERMATAN SULFATE METABOLISM | Genes involved in Chondroitin sulfate/dermatan sulfate metabolism |
| 0.1 | 5.0 | REACTOME SIGNAL TRANSDUCTION BY L1 | Genes involved in Signal transduction by L1 |
| 0.1 | 0.3 | REACTOME DOPAMINE NEUROTRANSMITTER RELEASE CYCLE | Genes involved in Dopamine Neurotransmitter Release Cycle |
| 0.1 | 3.9 | REACTOME NETRIN1 SIGNALING | Genes involved in Netrin-1 signaling |
| 0.1 | 5.0 | REACTOME DARPP 32 EVENTS | Genes involved in DARPP-32 events |
| 0.1 | 1.5 | REACTOME GLUTAMATE NEUROTRANSMITTER RELEASE CYCLE | Genes involved in Glutamate Neurotransmitter Release Cycle |
| 0.1 | 0.2 | REACTOME TRANSFERRIN ENDOCYTOSIS AND RECYCLING | Genes involved in Transferrin endocytosis and recycling |
| 0.1 | 1.7 | REACTOME TRAFFICKING AND PROCESSING OF ENDOSOMAL TLR | Genes involved in Trafficking and processing of endosomal TLR |
| 0.1 | 1.6 | REACTOME NOREPINEPHRINE NEUROTRANSMITTER RELEASE CYCLE | Genes involved in Norepinephrine Neurotransmitter Release Cycle |
| 0.1 | 1.8 | REACTOME SYNTHESIS SECRETION AND DEACYLATION OF GHRELIN | Genes involved in Synthesis, Secretion, and Deacylation of Ghrelin |
| 0.1 | 3.6 | REACTOME SPHINGOLIPID DE NOVO BIOSYNTHESIS | Genes involved in Sphingolipid de novo biosynthesis |
| 0.1 | 2.5 | REACTOME ADVANCED GLYCOSYLATION ENDPRODUCT RECEPTOR SIGNALING | Genes involved in Advanced glycosylation endproduct receptor signaling |
| 0.1 | 5.1 | REACTOME CELL JUNCTION ORGANIZATION | Genes involved in Cell junction organization |
| 0.1 | 8.2 | REACTOME P75 NTR RECEPTOR MEDIATED SIGNALLING | Genes involved in p75 NTR receptor-mediated signalling |
| 0.1 | 0.7 | REACTOME ERKS ARE INACTIVATED | Genes involved in ERKs are inactivated |
| 0.1 | 2.8 | REACTOME CYTOSOLIC SULFONATION OF SMALL MOLECULES | Genes involved in Cytosolic sulfonation of small molecules |
| 0.1 | 2.0 | REACTOME MTORC1 MEDIATED SIGNALLING | Genes involved in mTORC1-mediated signalling |
| 0.1 | 1.3 | REACTOME HYALURONAN UPTAKE AND DEGRADATION | Genes involved in Hyaluronan uptake and degradation |
| 0.1 | 0.5 | REACTOME TRAF6 MEDIATED INDUCTION OF TAK1 COMPLEX | Genes involved in TRAF6 mediated induction of TAK1 complex |
| 0.1 | 1.5 | REACTOME ENDOSOMAL SORTING COMPLEX REQUIRED FOR TRANSPORT ESCRT | Genes involved in Endosomal Sorting Complex Required For Transport (ESCRT) |
| 0.1 | 0.9 | REACTOME ADENYLATE CYCLASE ACTIVATING PATHWAY | Genes involved in Adenylate cyclase activating pathway |
| 0.1 | 0.9 | REACTOME THE ACTIVATION OF ARYLSULFATASES | Genes involved in The activation of arylsulfatases |
| 0.1 | 4.6 | REACTOME ACTIVATION OF CHAPERONE GENES BY XBP1S | Genes involved in Activation of Chaperone Genes by XBP1(S) |
| 0.1 | 1.0 | REACTOME GAMMA CARBOXYLATION TRANSPORT AND AMINO TERMINAL CLEAVAGE OF PROTEINS | Genes involved in Gamma-carboxylation, transport, and amino-terminal cleavage of proteins |
| 0.1 | 1.6 | REACTOME ORGANIC CATION ANION ZWITTERION TRANSPORT | Genes involved in Organic cation/anion/zwitterion transport |
| 0.1 | 0.7 | REACTOME ACTIVATION OF THE AP1 FAMILY OF TRANSCRIPTION FACTORS | Genes involved in Activation of the AP-1 family of transcription factors |
| 0.1 | 2.2 | REACTOME POST TRANSLATIONAL MODIFICATION SYNTHESIS OF GPI ANCHORED PROTEINS | Genes involved in Post-translational modification: synthesis of GPI-anchored proteins |
| 0.1 | 0.8 | REACTOME OPSINS | Genes involved in Opsins |
| 0.1 | 1.5 | REACTOME FACILITATIVE NA INDEPENDENT GLUCOSE TRANSPORTERS | Genes involved in Facilitative Na+-independent glucose transporters |
| 0.1 | 2.8 | REACTOME CGMP EFFECTS | Genes involved in cGMP effects |
| 0.1 | 0.2 | REACTOME HYALURONAN METABOLISM | Genes involved in Hyaluronan metabolism |
| 0.1 | 1.3 | REACTOME ABCA TRANSPORTERS IN LIPID HOMEOSTASIS | Genes involved in ABCA transporters in lipid homeostasis |
| 0.1 | 0.3 | REACTOME HS GAG DEGRADATION | Genes involved in HS-GAG degradation |
| 0.1 | 1.9 | REACTOME SPHINGOLIPID METABOLISM | Genes involved in Sphingolipid metabolism |
| 0.1 | 0.6 | REACTOME IL 7 SIGNALING | Genes involved in Interleukin-7 signaling |
| 0.1 | 0.7 | REACTOME RORA ACTIVATES CIRCADIAN EXPRESSION | Genes involved in RORA Activates Circadian Expression |
| 0.1 | 4.7 | REACTOME AMYLOIDS | Genes involved in Amyloids |
| 0.1 | 3.7 | REACTOME TRANSCRIPTIONAL REGULATION OF WHITE ADIPOCYTE DIFFERENTIATION | Genes involved in Transcriptional Regulation of White Adipocyte Differentiation |
| 0.1 | 0.4 | REACTOME ABACAVIR TRANSPORT AND METABOLISM | Genes involved in Abacavir transport and metabolism |
| 0.1 | 1.7 | REACTOME SEMA4D IN SEMAPHORIN SIGNALING | Genes involved in Sema4D in semaphorin signaling |
| 0.1 | 1.1 | REACTOME FORMATION OF FIBRIN CLOT CLOTTING CASCADE | Genes involved in Formation of Fibrin Clot (Clotting Cascade) |
| 0.1 | 1.7 | REACTOME EXTRACELLULAR MATRIX ORGANIZATION | Genes involved in Extracellular matrix organization |
| 0.1 | 1.0 | REACTOME REGULATION OF RHEB GTPASE ACTIVITY BY AMPK | Genes involved in Regulation of Rheb GTPase activity by AMPK |
| 0.1 | 0.9 | REACTOME SIGNAL REGULATORY PROTEIN SIRP FAMILY INTERACTIONS | Genes involved in Signal regulatory protein (SIRP) family interactions |
| 0.1 | 1.3 | REACTOME EXTRINSIC PATHWAY FOR APOPTOSIS | Genes involved in Extrinsic Pathway for Apoptosis |
| 0.0 | 0.0 | REACTOME INFLUENZA LIFE CYCLE | Genes involved in Influenza Life Cycle |
| 0.0 | 0.4 | REACTOME ENERGY DEPENDENT REGULATION OF MTOR BY LKB1 AMPK | Genes involved in Energy dependent regulation of mTOR by LKB1-AMPK |
| 0.0 | 0.6 | REACTOME KERATAN SULFATE DEGRADATION | Genes involved in Keratan sulfate degradation |
| 0.0 | 3.0 | REACTOME L1CAM INTERACTIONS | Genes involved in L1CAM interactions |
| 0.0 | 0.5 | REACTOME TGF BETA RECEPTOR SIGNALING IN EMT EPITHELIAL TO MESENCHYMAL TRANSITION | Genes involved in TGF-beta receptor signaling in EMT (epithelial to mesenchymal transition) |
| 0.0 | 0.6 | REACTOME G ALPHA1213 SIGNALLING EVENTS | Genes involved in G alpha (12/13) signalling events |
| 0.0 | 0.6 | REACTOME TRAFFICKING OF GLUR2 CONTAINING AMPA RECEPTORS | Genes involved in Trafficking of GluR2-containing AMPA receptors |
| 0.0 | 0.6 | REACTOME GAP JUNCTION ASSEMBLY | Genes involved in Gap junction assembly |
| 0.0 | 0.8 | REACTOME BMAL1 CLOCK NPAS2 ACTIVATES CIRCADIAN EXPRESSION | Genes involved in BMAL1:CLOCK/NPAS2 Activates Circadian Expression |
| 0.0 | 0.5 | REACTOME NITRIC OXIDE STIMULATES GUANYLATE CYCLASE | Genes involved in Nitric oxide stimulates guanylate cyclase |
| 0.0 | 0.4 | REACTOME SYNTHESIS SECRETION AND INACTIVATION OF GIP | Genes involved in Synthesis, Secretion, and Inactivation of Glucose-dependent Insulinotropic Polypeptide (GIP) |
| 0.0 | 2.6 | REACTOME LOSS OF NLP FROM MITOTIC CENTROSOMES | Genes involved in Loss of Nlp from mitotic centrosomes |
| 0.0 | 0.0 | REACTOME BOTULINUM NEUROTOXICITY | Genes involved in Botulinum neurotoxicity |
| 0.0 | 0.6 | REACTOME ACYL CHAIN REMODELLING OF PI | Genes involved in Acyl chain remodelling of PI |
| 0.0 | 0.6 | REACTOME INITIAL TRIGGERING OF COMPLEMENT | Genes involved in Initial triggering of complement |
| 0.0 | 0.6 | REACTOME TRANSPORT OF ORGANIC ANIONS | Genes involved in Transport of organic anions |
| 0.0 | 0.4 | REACTOME SYNTHESIS OF PIPS AT THE EARLY ENDOSOME MEMBRANE | Genes involved in Synthesis of PIPs at the early endosome membrane |
| 0.0 | 0.0 | REACTOME ARMS MEDIATED ACTIVATION | Genes involved in ARMS-mediated activation |
| 0.0 | 0.1 | REACTOME FORMATION OF TRANSCRIPTION COUPLED NER TC NER REPAIR COMPLEX | Genes involved in Formation of transcription-coupled NER (TC-NER) repair complex |
| 0.0 | 0.8 | REACTOME DOWNSTREAM TCR SIGNALING | Genes involved in Downstream TCR signaling |
| 0.0 | 0.8 | REACTOME PEROXISOMAL LIPID METABOLISM | Genes involved in Peroxisomal lipid metabolism |
| 0.0 | 0.4 | REACTOME XENOBIOTICS | Genes involved in Xenobiotics |
| 0.0 | 0.4 | REACTOME REGULATION OF COMPLEMENT CASCADE | Genes involved in Regulation of Complement cascade |
| 0.0 | 0.2 | REACTOME PROLACTIN RECEPTOR SIGNALING | Genes involved in Prolactin receptor signaling |
| 0.0 | 0.3 | REACTOME G PROTEIN ACTIVATION | Genes involved in G-protein activation |
| 0.0 | 0.2 | REACTOME CALNEXIN CALRETICULIN CYCLE | Genes involved in Calnexin/calreticulin cycle |
| 0.0 | 0.5 | REACTOME INSULIN RECEPTOR RECYCLING | Genes involved in Insulin receptor recycling |
| 0.0 | 0.2 | REACTOME BIOSYNTHESIS OF THE N GLYCAN PRECURSOR DOLICHOL LIPID LINKED OLIGOSACCHARIDE LLO AND TRANSFER TO A NASCENT PROTEIN | Genes involved in Biosynthesis of the N-glycan precursor (dolichol lipid-linked oligosaccharide, LLO) and transfer to a nascent protein |
| 0.0 | 0.2 | REACTOME BILE SALT AND ORGANIC ANION SLC TRANSPORTERS | Genes involved in Bile salt and organic anion SLC transporters |
| 0.0 | 0.5 | REACTOME STEROID HORMONES | Genes involved in Steroid hormones |
| 0.0 | 0.1 | REACTOME NEPHRIN INTERACTIONS | Genes involved in Nephrin interactions |
| 0.0 | 0.1 | REACTOME REGULATION OF HYPOXIA INDUCIBLE FACTOR HIF BY OXYGEN | Genes involved in Regulation of Hypoxia-inducible Factor (HIF) by Oxygen |
| 0.0 | 0.4 | REACTOME BRANCHED CHAIN AMINO ACID CATABOLISM | Genes involved in Branched-chain amino acid catabolism |
| 0.0 | 0.1 | REACTOME PTM GAMMA CARBOXYLATION HYPUSINE FORMATION AND ARYLSULFATASE ACTIVATION | Genes involved in PTM: gamma carboxylation, hypusine formation and arylsulfatase activation |
| 0.0 | 0.4 | REACTOME FORMATION OF INCISION COMPLEX IN GG NER | Genes involved in Formation of incision complex in GG-NER |
| 0.0 | 0.1 | REACTOME CD28 DEPENDENT VAV1 PATHWAY | Genes involved in CD28 dependent Vav1 pathway |
| 0.0 | 0.2 | REACTOME APOPTOSIS INDUCED DNA FRAGMENTATION | Genes involved in Apoptosis induced DNA fragmentation |
| 0.0 | 0.2 | REACTOME RECRUITMENT OF NUMA TO MITOTIC CENTROSOMES | Genes involved in Recruitment of NuMA to mitotic centrosomes |
| 0.0 | 0.1 | REACTOME INFLUENZA VIRAL RNA TRANSCRIPTION AND REPLICATION | Genes involved in Influenza Viral RNA Transcription and Replication |
| 0.0 | 0.1 | REACTOME NEF MEDIATED DOWNREGULATION OF MHC CLASS I COMPLEX CELL SURFACE EXPRESSION | Genes involved in Nef mediated downregulation of MHC class I complex cell surface expression |
| 0.0 | 1.8 | REACTOME PEPTIDE LIGAND BINDING RECEPTORS | Genes involved in Peptide ligand-binding receptors |
Gene overrepresentation in C2:CP:REACTOME category:
| Log-likelihood per target | Total log-likelihood | Term | Description |
|---|---|---|---|
| 0.5 | 18.5 | REACTOME ENOS ACTIVATION AND REGULATION | Genes involved in eNOS activation and regulation |
| 0.3 | 6.1 | REACTOME VEGF LIGAND RECEPTOR INTERACTIONS | Genes involved in VEGF ligand-receptor interactions |
| 0.3 | 5.5 | REACTOME HYALURONAN UPTAKE AND DEGRADATION | Genes involved in Hyaluronan uptake and degradation |
| 0.3 | 0.9 | REACTOME HYALURONAN METABOLISM | Genes involved in Hyaluronan metabolism |
| 0.2 | 12.3 | REACTOME SIGNALING BY ROBO RECEPTOR | Genes involved in Signaling by Robo receptor |
| 0.2 | 7.7 | REACTOME ADHERENS JUNCTIONS INTERACTIONS | Genes involved in Adherens junctions interactions |
| 0.2 | 3.6 | REACTOME THE NLRP3 INFLAMMASOME | Genes involved in The NLRP3 inflammasome |
| 0.2 | 5.2 | REACTOME CONVERSION FROM APC C CDC20 TO APC C CDH1 IN LATE ANAPHASE | Genes involved in Conversion from APC/C:Cdc20 to APC/C:Cdh1 in late anaphase |
| 0.2 | 3.6 | REACTOME REGULATION OF RHEB GTPASE ACTIVITY BY AMPK | Genes involved in Regulation of Rheb GTPase activity by AMPK |
| 0.2 | 2.4 | REACTOME REVERSIBLE HYDRATION OF CARBON DIOXIDE | Genes involved in Reversible Hydration of Carbon Dioxide |
| 0.2 | 1.6 | REACTOME SYNTHESIS OF PIPS AT THE LATE ENDOSOME MEMBRANE | Genes involved in Synthesis of PIPs at the late endosome membrane |
| 0.2 | 4.4 | REACTOME SIGNALING BY HIPPO | Genes involved in Signaling by Hippo |
| 0.1 | 0.5 | REACTOME BINDING AND ENTRY OF HIV VIRION | Genes involved in Binding and entry of HIV virion |
| 0.1 | 1.5 | REACTOME AKT PHOSPHORYLATES TARGETS IN THE CYTOSOL | Genes involved in AKT phosphorylates targets in the cytosol |
| 0.1 | 6.0 | REACTOME SMOOTH MUSCLE CONTRACTION | Genes involved in Smooth Muscle Contraction |
| 0.1 | 3.9 | REACTOME BASIGIN INTERACTIONS | Genes involved in Basigin interactions |
| 0.1 | 3.7 | REACTOME SIGNALING BY BMP | Genes involved in Signaling by BMP |
| 0.1 | 0.1 | REACTOME PROSTACYCLIN SIGNALLING THROUGH PROSTACYCLIN RECEPTOR | Genes involved in Prostacyclin signalling through prostacyclin receptor |
| 0.1 | 0.8 | REACTOME REGULATION OF THE FANCONI ANEMIA PATHWAY | Genes involved in Regulation of the Fanconi anemia pathway |
| 0.1 | 1.9 | REACTOME DOWNREGULATION OF ERBB2 ERBB3 SIGNALING | Genes involved in Downregulation of ERBB2:ERBB3 signaling |
| 0.1 | 2.6 | REACTOME SEMA4D INDUCED CELL MIGRATION AND GROWTH CONE COLLAPSE | Genes involved in Sema4D induced cell migration and growth-cone collapse |
| 0.1 | 0.8 | REACTOME CDC6 ASSOCIATION WITH THE ORC ORIGIN COMPLEX | Genes involved in CDC6 association with the ORC:origin complex |
| 0.1 | 1.1 | REACTOME ACYL CHAIN REMODELLING OF PG | Genes involved in Acyl chain remodelling of PG |
| 0.1 | 1.6 | REACTOME PRE NOTCH TRANSCRIPTION AND TRANSLATION | Genes involved in Pre-NOTCH Transcription and Translation |
| 0.1 | 2.1 | REACTOME CASPASE MEDIATED CLEAVAGE OF CYTOSKELETAL PROTEINS | Genes involved in Caspase-mediated cleavage of cytoskeletal proteins |
| 0.1 | 2.1 | REACTOME POST TRANSLATIONAL MODIFICATION SYNTHESIS OF GPI ANCHORED PROTEINS | Genes involved in Post-translational modification: synthesis of GPI-anchored proteins |
| 0.1 | 3.1 | REACTOME NETRIN1 SIGNALING | Genes involved in Netrin-1 signaling |
| 0.1 | 2.2 | REACTOME FORMATION OF FIBRIN CLOT CLOTTING CASCADE | Genes involved in Formation of Fibrin Clot (Clotting Cascade) |
| 0.1 | 1.2 | REACTOME CHYLOMICRON MEDIATED LIPID TRANSPORT | Genes involved in Chylomicron-mediated lipid transport |
| 0.1 | 1.8 | REACTOME EFFECTS OF PIP2 HYDROLYSIS | Genes involved in Effects of PIP2 hydrolysis |
| 0.1 | 3.6 | REACTOME METABOLISM OF VITAMINS AND COFACTORS | Genes involved in Metabolism of vitamins and cofactors |
| 0.0 | 6.8 | REACTOME SIGNALING BY RHO GTPASES | Genes involved in Signaling by Rho GTPases |
| 0.0 | 0.9 | REACTOME THROMBIN SIGNALLING THROUGH PROTEINASE ACTIVATED RECEPTORS PARS | Genes involved in Thrombin signalling through proteinase activated receptors (PARs) |
| 0.0 | 1.2 | REACTOME ANTIGEN PRESENTATION FOLDING ASSEMBLY AND PEPTIDE LOADING OF CLASS I MHC | Genes involved in Antigen Presentation: Folding, assembly and peptide loading of class I MHC |
| 0.0 | 0.8 | REACTOME IL 6 SIGNALING | Genes involved in Interleukin-6 signaling |
| 0.0 | 1.4 | REACTOME CHOLESTEROL BIOSYNTHESIS | Genes involved in Cholesterol biosynthesis |
| 0.0 | 3.6 | REACTOME INTERFERON ALPHA BETA SIGNALING | Genes involved in Interferon alpha/beta signaling |
| 0.0 | 2.1 | REACTOME BMAL1 CLOCK NPAS2 ACTIVATES CIRCADIAN EXPRESSION | Genes involved in BMAL1:CLOCK/NPAS2 Activates Circadian Expression |
| 0.0 | 1.3 | REACTOME ACTIVATION OF GENES BY ATF4 | Genes involved in Activation of Genes by ATF4 |
| 0.0 | 0.9 | REACTOME GLUTAMATE NEUROTRANSMITTER RELEASE CYCLE | Genes involved in Glutamate Neurotransmitter Release Cycle |
| 0.0 | 0.8 | REACTOME SYNTHESIS OF VERY LONG CHAIN FATTY ACYL COAS | Genes involved in Synthesis of very long-chain fatty acyl-CoAs |
| 0.0 | 0.4 | REACTOME COPI MEDIATED TRANSPORT | Genes involved in COPI Mediated Transport |
| 0.0 | 0.9 | REACTOME AMINO ACID SYNTHESIS AND INTERCONVERSION TRANSAMINATION | Genes involved in Amino acid synthesis and interconversion (transamination) |
| 0.0 | 2.1 | REACTOME NCAM1 INTERACTIONS | Genes involved in NCAM1 interactions |
| 0.0 | 1.3 | REACTOME TGF BETA RECEPTOR SIGNALING ACTIVATES SMADS | Genes involved in TGF-beta receptor signaling activates SMADs |
| 0.0 | 0.7 | REACTOME NONSENSE MEDIATED DECAY ENHANCED BY THE EXON JUNCTION COMPLEX | Genes involved in Nonsense Mediated Decay Enhanced by the Exon Junction Complex |
| 0.0 | 1.0 | REACTOME INSULIN RECEPTOR RECYCLING | Genes involved in Insulin receptor recycling |
| 0.0 | 0.1 | REACTOME PLATELET AGGREGATION PLUG FORMATION | Genes involved in Platelet Aggregation (Plug Formation) |
| 0.0 | 0.3 | REACTOME CREATION OF C4 AND C2 ACTIVATORS | Genes involved in Creation of C4 and C2 activators |
| 0.0 | 0.6 | REACTOME RETROGRADE NEUROTROPHIN SIGNALLING | Genes involved in Retrograde neurotrophin signalling |
| 0.0 | 0.8 | REACTOME DEGRADATION OF THE EXTRACELLULAR MATRIX | Genes involved in Degradation of the extracellular matrix |
| 0.0 | 0.2 | REACTOME PRE NOTCH PROCESSING IN GOLGI | Genes involved in Pre-NOTCH Processing in Golgi |
| 0.0 | 1.2 | REACTOME NITRIC OXIDE STIMULATES GUANYLATE CYCLASE | Genes involved in Nitric oxide stimulates guanylate cyclase |
| 0.0 | 2.7 | REACTOME CLASS B 2 SECRETIN FAMILY RECEPTORS | Genes involved in Class B/2 (Secretin family receptors) |
| 0.0 | 0.6 | REACTOME MYOGENESIS | Genes involved in Myogenesis |
| 0.0 | 1.8 | REACTOME INTEGRIN CELL SURFACE INTERACTIONS | Genes involved in Integrin cell surface interactions |
| 0.0 | 1.2 | REACTOME ACTIVATION OF CHAPERONE GENES BY XBP1S | Genes involved in Activation of Chaperone Genes by XBP1(S) |
| 0.0 | 0.3 | REACTOME CYCLIN A B1 ASSOCIATED EVENTS DURING G2 M TRANSITION | Genes involved in Cyclin A/B1 associated events during G2/M transition |
| 0.0 | 0.8 | REACTOME NOTCH1 INTRACELLULAR DOMAIN REGULATES TRANSCRIPTION | Genes involved in NOTCH1 Intracellular Domain Regulates Transcription |
| 0.0 | 1.5 | REACTOME PPARA ACTIVATES GENE EXPRESSION | Genes involved in PPARA Activates Gene Expression |
| 0.0 | 0.3 | REACTOME TERMINATION OF O GLYCAN BIOSYNTHESIS | Genes involved in Termination of O-glycan biosynthesis |
| 0.0 | 0.2 | REACTOME KERATAN SULFATE DEGRADATION | Genes involved in Keratan sulfate degradation |
| 0.0 | 0.2 | REACTOME ALPHA LINOLENIC ACID ALA METABOLISM | Genes involved in alpha-linolenic acid (ALA) metabolism |
| 0.0 | 0.7 | REACTOME CELL JUNCTION ORGANIZATION | Genes involved in Cell junction organization |
Gene overrepresentation in C2:CP category:
| Log-likelihood per target | Total log-likelihood | Term | Description |
|---|---|---|---|
| 0.7 | 1.3 | PID S1P S1P2 PATHWAY | S1P2 pathway |
| 0.5 | 15.5 | PID WNT CANONICAL PATHWAY | Canonical Wnt signaling pathway |
| 0.4 | 10.2 | PID INTEGRIN4 PATHWAY | Alpha6 beta4 integrin-ligand interactions |
| 0.2 | 11.4 | SIG REGULATION OF THE ACTIN CYTOSKELETON BY RHO GTPASES | Genes related to regulation of the actin cytoskeleton |
| 0.2 | 12.5 | PID RAC1 REG PATHWAY | Regulation of RAC1 activity |
| 0.2 | 2.5 | SA G2 AND M PHASES | Cdc25 activates the cdc2/cyclin B complex to induce the G2/M transition. |
| 0.2 | 3.2 | PID VEGF VEGFR PATHWAY | VEGF and VEGFR signaling network |
| 0.2 | 2.5 | PID ECADHERIN KERATINOCYTE PATHWAY | E-cadherin signaling in keratinocytes |
| 0.2 | 7.3 | PID AVB3 OPN PATHWAY | Osteopontin-mediated events |
| 0.2 | 5.2 | ST WNT BETA CATENIN PATHWAY | Wnt/beta-catenin Pathway |
| 0.2 | 1.8 | PID S1P S1P4 PATHWAY | S1P4 pathway |
| 0.1 | 8.0 | PID GLYPICAN 1PATHWAY | Glypican 1 network |
| 0.1 | 9.3 | PID FRA PATHWAY | Validated transcriptional targets of AP1 family members Fra1 and Fra2 |
| 0.1 | 7.4 | PID A6B1 A6B4 INTEGRIN PATHWAY | a6b1 and a6b4 Integrin signaling |
| 0.1 | 3.2 | PID WNT SIGNALING PATHWAY | Wnt signaling network |
| 0.1 | 0.7 | PID INTEGRIN3 PATHWAY | Beta3 integrin cell surface interactions |
| 0.1 | 7.3 | PID INTEGRIN1 PATHWAY | Beta1 integrin cell surface interactions |
| 0.1 | 4.5 | NABA PROTEOGLYCANS | Genes encoding proteoglycans |
| 0.1 | 3.3 | PID ALPHA SYNUCLEIN PATHWAY | Alpha-synuclein signaling |
| 0.1 | 2.3 | PID NETRIN PATHWAY | Netrin-mediated signaling events |
| 0.1 | 0.8 | ST PAC1 RECEPTOR PATHWAY | PAC1 Receptor Pathway |
| 0.1 | 1.7 | ST GA12 PATHWAY | G alpha 12 Pathway |
| 0.1 | 1.1 | PID ERBB NETWORK PATHWAY | ErbB receptor signaling network |
| 0.1 | 1.4 | PID PRL SIGNALING EVENTS PATHWAY | Signaling events mediated by PRL |
| 0.1 | 0.8 | SA REG CASCADE OF CYCLIN EXPR | Expression of cyclins regulates progression through the cell cycle by activating cyclin-dependent kinases. |
| 0.1 | 3.4 | PID AJDISS 2PATHWAY | Posttranslational regulation of adherens junction stability and dissassembly |
| 0.1 | 4.2 | PID DELTA NP63 PATHWAY | Validated transcriptional targets of deltaNp63 isoforms |
| 0.1 | 1.8 | PID HDAC CLASSIII PATHWAY | Signaling events mediated by HDAC Class III |
| 0.0 | 1.0 | PID ERBB1 INTERNALIZATION PATHWAY | Internalization of ErbB1 |
| 0.0 | 0.9 | PID NCADHERIN PATHWAY | N-cadherin signaling events |
| 0.0 | 0.8 | PID ARF 3PATHWAY | Arf1 pathway |
| 0.0 | 1.1 | PID BARD1 PATHWAY | BARD1 signaling events |
| 0.0 | 0.6 | PID CDC42 REG PATHWAY | Regulation of CDC42 activity |
| 0.0 | 0.5 | PID DNA PK PATHWAY | DNA-PK pathway in nonhomologous end joining |
| 0.0 | 0.2 | PID AR NONGENOMIC PATHWAY | Nongenotropic Androgen signaling |
| 0.0 | 0.5 | PID ERB GENOMIC PATHWAY | Validated nuclear estrogen receptor beta network |
| 0.0 | 0.8 | PID INSULIN PATHWAY | Insulin Pathway |
| 0.0 | 0.6 | PID HDAC CLASSII PATHWAY | Signaling events mediated by HDAC Class II |
| 0.0 | 1.0 | PID ILK PATHWAY | Integrin-linked kinase signaling |
| 0.0 | 1.0 | PID LKB1 PATHWAY | LKB1 signaling events |
| 0.0 | 0.1 | PID P38 GAMMA DELTA PATHWAY | Signaling mediated by p38-gamma and p38-delta |
| 0.0 | 0.5 | PID PS1 PATHWAY | Presenilin action in Notch and Wnt signaling |
| 0.0 | 0.8 | PID PLK1 PATHWAY | PLK1 signaling events |
| 0.0 | 0.1 | PID RETINOIC ACID PATHWAY | Retinoic acid receptors-mediated signaling |
| 0.0 | 0.2 | PID BETA CATENIN DEG PATHWAY | Degradation of beta catenin |
| 0.0 | 0.6 | PID NFAT TFPATHWAY | Calcineurin-regulated NFAT-dependent transcription in lymphocytes |
| 0.0 | 0.5 | PID PI3KCI PATHWAY | Class I PI3K signaling events |
| 0.0 | 2.2 | NABA ECM AFFILIATED | Genes encoding proteins affiliated structurally or functionally to extracellular matrix proteins |
| 0.0 | 0.9 | PID BETA CATENIN NUC PATHWAY | Regulation of nuclear beta catenin signaling and target gene transcription |
| 0.0 | 1.0 | PID AP1 PATHWAY | AP-1 transcription factor network |
| 0.0 | 0.1 | PID IFNG PATHWAY | IFN-gamma pathway |
| 0.0 | 0.2 | PID NEPHRIN NEPH1 PATHWAY | Nephrin/Neph1 signaling in the kidney podocyte |
Gene overrepresentation in cellular_component category:
| Log-likelihood per target | Total log-likelihood | Term | Description |
|---|---|---|---|
| 0.7 | 5.1 | GO:0035692 | macrophage migration inhibitory factor receptor complex(GO:0035692) |
| 0.2 | 2.5 | GO:0035985 | senescence-associated heterochromatin focus(GO:0035985) |
| 0.2 | 0.8 | GO:1990423 | RZZ complex(GO:1990423) |
| 0.2 | 0.7 | GO:0097454 | Schwann cell microvillus(GO:0097454) |
| 0.1 | 1.6 | GO:0042612 | MHC class I protein complex(GO:0042612) |
| 0.1 | 1.8 | GO:0008385 | IkappaB kinase complex(GO:0008385) |
| 0.1 | 2.2 | GO:0031362 | anchored component of external side of plasma membrane(GO:0031362) |
| 0.1 | 2.0 | GO:0005916 | fascia adherens(GO:0005916) |
| 0.1 | 0.8 | GO:0070545 | PeBoW complex(GO:0070545) |
| 0.1 | 0.6 | GO:0033503 | HULC complex(GO:0033503) |
| 0.1 | 0.7 | GO:0072557 | IPAF inflammasome complex(GO:0072557) |
| 0.1 | 0.9 | GO:0016012 | sarcoglycan complex(GO:0016012) |
| 0.1 | 0.5 | GO:0048787 | presynaptic active zone membrane(GO:0048787) |
| 0.1 | 0.7 | GO:1990111 | spermatoproteasome complex(GO:1990111) |
| 0.1 | 0.7 | GO:0030688 | preribosome, small subunit precursor(GO:0030688) |
| 0.1 | 0.9 | GO:0001739 | sex chromatin(GO:0001739) |
| 0.1 | 0.5 | GO:0061617 | MICOS complex(GO:0061617) |
| 0.1 | 0.5 | GO:0005658 | alpha DNA polymerase:primase complex(GO:0005658) |
| 0.1 | 0.6 | GO:0032010 | phagolysosome(GO:0032010) alveolar lamellar body(GO:0097208) |
| 0.1 | 1.1 | GO:0005662 | DNA replication factor A complex(GO:0005662) |
| 0.1 | 0.8 | GO:0030008 | TRAPP complex(GO:0030008) |
| 0.1 | 0.5 | GO:0097449 | astrocyte projection(GO:0097449) |
| 0.1 | 0.4 | GO:0005742 | mitochondrial outer membrane translocase complex(GO:0005742) |
| 0.1 | 1.2 | GO:0042613 | MHC class II protein complex(GO:0042613) |
| 0.1 | 0.4 | GO:0005787 | signal peptidase complex(GO:0005787) |
| 0.1 | 0.3 | GO:0034274 | Atg12-Atg5-Atg16 complex(GO:0034274) |
| 0.1 | 0.9 | GO:0097431 | mitotic spindle pole(GO:0097431) |
| 0.1 | 0.2 | GO:0045257 | mitochondrial respiratory chain complex II, succinate dehydrogenase complex (ubiquinone)(GO:0005749) succinate dehydrogenase complex (ubiquinone)(GO:0045257) respiratory chain complex II(GO:0045273) succinate dehydrogenase complex(GO:0045281) fumarate reductase complex(GO:0045283) |
| 0.1 | 2.9 | GO:0002102 | podosome(GO:0002102) |
| 0.1 | 0.3 | GO:0030891 | VCB complex(GO:0030891) |
| 0.0 | 0.2 | GO:0034388 | Pwp2p-containing subcomplex of 90S preribosome(GO:0034388) |
| 0.0 | 1.3 | GO:0005838 | proteasome regulatory particle(GO:0005838) |
| 0.0 | 0.2 | GO:0009331 | glycerol-3-phosphate dehydrogenase complex(GO:0009331) |
| 0.0 | 1.2 | GO:0031092 | platelet alpha granule membrane(GO:0031092) |
| 0.0 | 0.3 | GO:0034715 | pICln-Sm protein complex(GO:0034715) |
| 0.0 | 1.1 | GO:0016327 | apicolateral plasma membrane(GO:0016327) |
| 0.0 | 0.1 | GO:0005889 | hydrogen:potassium-exchanging ATPase complex(GO:0005889) |
| 0.0 | 1.9 | GO:0045171 | intercellular bridge(GO:0045171) |
| 0.0 | 0.4 | GO:0097136 | Bcl-2 family protein complex(GO:0097136) |
| 0.0 | 0.3 | GO:0045261 | proton-transporting ATP synthase complex, catalytic core F(1)(GO:0045261) |
| 0.0 | 0.9 | GO:0005680 | anaphase-promoting complex(GO:0005680) |
| 0.0 | 3.2 | GO:0031093 | platelet alpha granule lumen(GO:0031093) |
| 0.0 | 0.5 | GO:0034362 | low-density lipoprotein particle(GO:0034362) |
| 0.0 | 0.2 | GO:0000172 | ribonuclease MRP complex(GO:0000172) |
| 0.0 | 0.2 | GO:0097209 | epidermal lamellar body(GO:0097209) |
| 0.0 | 0.8 | GO:0005868 | cytoplasmic dynein complex(GO:0005868) |
| 0.0 | 0.3 | GO:0097025 | MPP7-DLG1-LIN7 complex(GO:0097025) |
| 0.0 | 0.8 | GO:0031258 | lamellipodium membrane(GO:0031258) |
| 0.0 | 0.3 | GO:0005751 | mitochondrial respiratory chain complex IV(GO:0005751) |
| 0.0 | 0.6 | GO:0071682 | endocytic vesicle lumen(GO:0071682) |
| 0.0 | 1.4 | GO:0005881 | cytoplasmic microtubule(GO:0005881) |
| 0.0 | 2.0 | GO:0016459 | myosin complex(GO:0016459) |
| 0.0 | 0.7 | GO:0043189 | NuA4 histone acetyltransferase complex(GO:0035267) H4/H2A histone acetyltransferase complex(GO:0043189) H4 histone acetyltransferase complex(GO:1902562) |
| 0.0 | 0.8 | GO:0000315 | organellar large ribosomal subunit(GO:0000315) mitochondrial large ribosomal subunit(GO:0005762) |
| 0.0 | 0.3 | GO:0046658 | anchored component of plasma membrane(GO:0046658) |
| 0.0 | 0.3 | GO:0036038 | MKS complex(GO:0036038) |
| 0.0 | 0.2 | GO:1990909 | Wnt signalosome(GO:1990909) |
| 0.0 | 1.0 | GO:0005782 | peroxisomal matrix(GO:0005782) microbody lumen(GO:0031907) |
| 0.0 | 0.2 | GO:0016593 | Cdc73/Paf1 complex(GO:0016593) |
| 0.0 | 0.4 | GO:0005852 | eukaryotic translation initiation factor 3 complex(GO:0005852) |
| 0.0 | 0.1 | GO:0000408 | EKC/KEOPS complex(GO:0000408) |
| 0.0 | 0.1 | GO:0030870 | Mre11 complex(GO:0030870) |
| 0.0 | 0.2 | GO:0000346 | transcription export complex(GO:0000346) |
| 0.0 | 0.0 | GO:0033185 | dolichol-phosphate-mannose synthase complex(GO:0033185) |
| 0.0 | 0.2 | GO:0032433 | filopodium tip(GO:0032433) |
| 0.0 | 0.2 | GO:0033202 | Ino80 complex(GO:0031011) DNA helicase complex(GO:0033202) |
| 0.0 | 0.3 | GO:0097228 | sperm principal piece(GO:0097228) |
| 0.0 | 1.9 | GO:0001650 | fibrillar center(GO:0001650) |
| 0.0 | 0.0 | GO:0034455 | t-UTP complex(GO:0034455) |
| 0.0 | 0.3 | GO:0001527 | microfibril(GO:0001527) fibril(GO:0043205) |
| 0.0 | 1.3 | GO:0005913 | cell-cell adherens junction(GO:0005913) |
| 0.0 | 0.2 | GO:0005890 | sodium:potassium-exchanging ATPase complex(GO:0005890) |
| 0.0 | 1.3 | GO:0022625 | cytosolic large ribosomal subunit(GO:0022625) |
| 0.0 | 4.2 | GO:0000790 | nuclear chromatin(GO:0000790) |
| 0.0 | 0.8 | GO:0022627 | cytosolic small ribosomal subunit(GO:0022627) |
| 0.0 | 0.4 | GO:0000922 | spindle pole(GO:0000922) |
| 0.0 | 0.1 | GO:0033270 | paranode region of axon(GO:0033270) |
| 0.0 | 0.1 | GO:0000124 | SAGA complex(GO:0000124) |
| 0.0 | 3.5 | GO:0045121 | membrane raft(GO:0045121) |
| 0.0 | 1.1 | GO:0032587 | ruffle membrane(GO:0032587) |
Gene overrepresentation in biological_process category:
| Log-likelihood per target | Total log-likelihood | Term | Description |
|---|---|---|---|
| 2.4 | 7.2 | GO:1905205 | positive regulation of connective tissue replacement(GO:1905205) |
| 1.9 | 5.6 | GO:0051088 | PMA-inducible membrane protein ectodomain proteolysis(GO:0051088) |
| 1.7 | 5.0 | GO:0000379 | tRNA-type intron splice site recognition and cleavage(GO:0000379) |
| 1.5 | 10.7 | GO:0070294 | renal sodium ion absorption(GO:0070294) |
| 1.5 | 6.0 | GO:0019747 | regulation of isoprenoid metabolic process(GO:0019747) |
| 1.5 | 12.0 | GO:0032926 | negative regulation of activin receptor signaling pathway(GO:0032926) |
| 1.4 | 11.3 | GO:0003065 | positive regulation of heart rate by epinephrine(GO:0003065) |
| 1.4 | 8.4 | GO:0048549 | positive regulation of pinocytosis(GO:0048549) |
| 1.3 | 4.0 | GO:1901350 | cell-cell signaling involved in cell-cell junction organization(GO:1901350) |
| 1.3 | 4.0 | GO:1900085 | negative regulation of peptidyl-tyrosine autophosphorylation(GO:1900085) negative regulation of inward rectifier potassium channel activity(GO:1903609) |
| 1.3 | 6.5 | GO:0030047 | actin modification(GO:0030047) |
| 1.3 | 15.4 | GO:1900028 | negative regulation of ruffle assembly(GO:1900028) |
| 1.3 | 8.9 | GO:0010757 | negative regulation of plasminogen activation(GO:0010757) |
| 1.3 | 3.8 | GO:0036484 | trunk segmentation(GO:0035290) trunk neural crest cell migration(GO:0036484) ventral trunk neural crest cell migration(GO:0036486) |
| 1.2 | 7.1 | GO:0061441 | renal artery morphogenesis(GO:0061441) |
| 1.1 | 1.1 | GO:0072197 | ureter urothelium development(GO:0072190) ureter morphogenesis(GO:0072197) |
| 1.1 | 4.3 | GO:0019859 | pyrimidine nucleobase catabolic process(GO:0006208) thymine catabolic process(GO:0006210) thymine metabolic process(GO:0019859) |
| 1.1 | 3.2 | GO:0048627 | myoblast development(GO:0048627) |
| 1.0 | 8.4 | GO:0006931 | substrate-dependent cell migration, cell attachment to substrate(GO:0006931) |
| 1.0 | 7.3 | GO:0070836 | caveola assembly(GO:0070836) |
| 1.0 | 6.2 | GO:0006065 | UDP-glucuronate biosynthetic process(GO:0006065) |
| 1.0 | 2.1 | GO:0021825 | cerebral cortex tangential migration using cell-cell interactions(GO:0021823) substrate-dependent cerebral cortex tangential migration(GO:0021825) postnatal olfactory bulb interneuron migration(GO:0021827) chemorepulsion involved in postnatal olfactory bulb interneuron migration(GO:0021836) regulation of negative chemotaxis(GO:0050923) |
| 1.0 | 3.1 | GO:0061386 | closure of optic fissure(GO:0061386) |
| 1.0 | 6.1 | GO:0044334 | regulation of heparan sulfate proteoglycan biosynthetic process(GO:0010908) positive regulation of heparan sulfate proteoglycan biosynthetic process(GO:0010909) canonical Wnt signaling pathway involved in positive regulation of epithelial to mesenchymal transition(GO:0044334) positive regulation of proteoglycan biosynthetic process(GO:1902730) |
| 1.0 | 10.1 | GO:0032000 | positive regulation of fatty acid beta-oxidation(GO:0032000) |
| 1.0 | 3.0 | GO:0070563 | negative regulation of vitamin D receptor signaling pathway(GO:0070563) |
| 1.0 | 8.6 | GO:0048386 | positive regulation of retinoic acid receptor signaling pathway(GO:0048386) |
| 0.9 | 2.8 | GO:0001923 | B-1 B cell differentiation(GO:0001923) |
| 0.9 | 3.7 | GO:0060671 | epithelial cell differentiation involved in embryonic placenta development(GO:0060671) epithelial cell morphogenesis involved in placental branching(GO:0060672) |
| 0.9 | 0.9 | GO:0003415 | chondrocyte hypertrophy(GO:0003415) |
| 0.9 | 9.3 | GO:1904417 | regulation of xenophagy(GO:1904415) positive regulation of xenophagy(GO:1904417) |
| 0.9 | 5.6 | GO:1900748 | positive regulation of vascular endothelial growth factor signaling pathway(GO:1900748) |
| 0.9 | 4.6 | GO:0030200 | heparan sulfate proteoglycan catabolic process(GO:0030200) |
| 0.9 | 3.7 | GO:1901490 | regulation of lymphangiogenesis(GO:1901490) |
| 0.9 | 3.6 | GO:0042271 | susceptibility to natural killer cell mediated cytotoxicity(GO:0042271) |
| 0.9 | 2.7 | GO:1900158 | negative regulation of bone mineralization involved in bone maturation(GO:1900158) |
| 0.9 | 2.7 | GO:0060057 | apoptotic process involved in mammary gland involution(GO:0060057) positive regulation of apoptotic process involved in mammary gland involution(GO:0060058) positive regulation of apoptotic process involved in morphogenesis(GO:1902339) regulation of mammary gland involution(GO:1903519) positive regulation of mammary gland involution(GO:1903521) positive regulation of apoptotic process involved in development(GO:1904747) |
| 0.9 | 0.9 | GO:1902954 | regulation of early endosome to recycling endosome transport(GO:1902954) |
| 0.9 | 1.8 | GO:0001765 | membrane raft assembly(GO:0001765) |
| 0.9 | 2.7 | GO:0042264 | peptidyl-aspartic acid hydroxylation(GO:0042264) |
| 0.9 | 2.7 | GO:1904933 | regulation of cell proliferation in midbrain(GO:1904933) |
| 0.9 | 7.0 | GO:1901727 | positive regulation of histone deacetylase activity(GO:1901727) |
| 0.9 | 2.6 | GO:0006478 | peptidyl-tyrosine sulfation(GO:0006478) |
| 0.9 | 7.7 | GO:0038028 | insulin receptor signaling pathway via phosphatidylinositol 3-kinase(GO:0038028) |
| 0.8 | 0.8 | GO:2001045 | negative regulation of integrin-mediated signaling pathway(GO:2001045) |
| 0.8 | 7.5 | GO:0071787 | endoplasmic reticulum tubular network assembly(GO:0071787) |
| 0.8 | 2.5 | GO:1905167 | positive regulation of lysosomal protein catabolic process(GO:1905167) |
| 0.8 | 16.6 | GO:0000052 | citrulline metabolic process(GO:0000052) |
| 0.8 | 2.5 | GO:0031630 | regulation of synaptic vesicle fusion to presynaptic membrane(GO:0031630) |
| 0.8 | 8.2 | GO:0021957 | corticospinal tract morphogenesis(GO:0021957) |
| 0.8 | 4.0 | GO:0010710 | regulation of collagen catabolic process(GO:0010710) |
| 0.8 | 3.2 | GO:0071492 | cellular response to UV-A(GO:0071492) |
| 0.8 | 2.4 | GO:0018008 | N-terminal peptidyl-glycine N-myristoylation(GO:0018008) peptidyl-glycine modification(GO:0018201) |
| 0.8 | 0.8 | GO:0070873 | regulation of glycogen metabolic process(GO:0070873) |
| 0.8 | 12.5 | GO:0051639 | actin filament network formation(GO:0051639) |
| 0.8 | 7.8 | GO:2000601 | positive regulation of Arp2/3 complex-mediated actin nucleation(GO:2000601) |
| 0.8 | 2.3 | GO:1904530 | negative regulation of actin filament binding(GO:1904530) negative regulation of actin binding(GO:1904617) |
| 0.8 | 22.4 | GO:0031581 | hemidesmosome assembly(GO:0031581) |
| 0.8 | 3.9 | GO:0051414 | response to cortisol(GO:0051414) |
| 0.8 | 6.9 | GO:1904684 | negative regulation of metalloendopeptidase activity(GO:1904684) |
| 0.8 | 2.3 | GO:0007037 | vacuolar phosphate transport(GO:0007037) positive regulation of mitotic cell cycle DNA replication(GO:1903465) positive regulation of parathyroid hormone secretion(GO:2000830) |
| 0.8 | 2.3 | GO:0002317 | plasma cell differentiation(GO:0002317) |
| 0.8 | 0.8 | GO:0031146 | SCF-dependent proteasomal ubiquitin-dependent protein catabolic process(GO:0031146) |
| 0.7 | 3.0 | GO:1990262 | regulation of anti-Mullerian hormone signaling pathway(GO:1902612) negative regulation of anti-Mullerian hormone signaling pathway(GO:1902613) anti-Mullerian hormone signaling pathway(GO:1990262) |
| 0.7 | 1.5 | GO:2000097 | regulation of smooth muscle cell-matrix adhesion(GO:2000097) |
| 0.7 | 2.2 | GO:1903553 | positive regulation of extracellular exosome assembly(GO:1903553) |
| 0.7 | 4.4 | GO:0045629 | negative regulation of T-helper 2 cell differentiation(GO:0045629) |
| 0.7 | 8.8 | GO:0022417 | protein maturation by protein folding(GO:0022417) |
| 0.7 | 1.5 | GO:0071072 | negative regulation of phospholipid biosynthetic process(GO:0071072) |
| 0.7 | 2.9 | GO:0044861 | protein transport into plasma membrane raft(GO:0044861) |
| 0.7 | 2.2 | GO:1903233 | regulation of calcium ion-dependent exocytosis of neurotransmitter(GO:1903233) |
| 0.7 | 2.1 | GO:2000417 | negative regulation of eosinophil migration(GO:2000417) |
| 0.7 | 3.6 | GO:0048842 | positive regulation of axon extension involved in axon guidance(GO:0048842) |
| 0.7 | 2.1 | GO:0071409 | cellular response to cycloheximide(GO:0071409) |
| 0.7 | 5.0 | GO:0038027 | apolipoprotein A-I-mediated signaling pathway(GO:0038027) |
| 0.7 | 2.1 | GO:1902910 | regulation of monophenol monooxygenase activity(GO:0032771) positive regulation of monophenol monooxygenase activity(GO:0032773) negative regulation of catagen(GO:0051796) regulation of hair cycle by canonical Wnt signaling pathway(GO:0060901) positive regulation of melanosome transport(GO:1902910) |
| 0.7 | 2.8 | GO:0070141 | response to UV-A(GO:0070141) |
| 0.7 | 4.1 | GO:0051012 | microtubule sliding(GO:0051012) |
| 0.7 | 3.5 | GO:0035989 | tendon development(GO:0035989) |
| 0.7 | 5.5 | GO:0030579 | ubiquitin-dependent SMAD protein catabolic process(GO:0030579) |
| 0.7 | 3.4 | GO:0010273 | detoxification of copper ion(GO:0010273) stress response to copper ion(GO:1990169) |
| 0.7 | 4.1 | GO:0090131 | mesenchyme migration(GO:0090131) |
| 0.7 | 2.0 | GO:0060398 | regulation of growth hormone receptor signaling pathway(GO:0060398) |
| 0.7 | 3.4 | GO:1905049 | negative regulation of metallopeptidase activity(GO:1905049) |
| 0.7 | 2.7 | GO:0000103 | sulfate assimilation(GO:0000103) |
| 0.7 | 2.0 | GO:2000521 | negative regulation of immunological synapse formation(GO:2000521) |
| 0.6 | 3.2 | GO:0016476 | regulation of embryonic cell shape(GO:0016476) |
| 0.6 | 3.9 | GO:1900756 | protein processing in phagocytic vesicle(GO:1900756) regulation of protein processing in phagocytic vesicle(GO:1903921) positive regulation of protein processing in phagocytic vesicle(GO:1903923) |
| 0.6 | 7.1 | GO:0001886 | endothelial cell morphogenesis(GO:0001886) |
| 0.6 | 0.6 | GO:1905154 | negative regulation of membrane invagination(GO:1905154) |
| 0.6 | 0.6 | GO:0007412 | axon target recognition(GO:0007412) |
| 0.6 | 1.8 | GO:0061428 | negative regulation of transcription from RNA polymerase II promoter in response to hypoxia(GO:0061428) |
| 0.6 | 6.0 | GO:0036155 | acylglycerol acyl-chain remodeling(GO:0036155) |
| 0.6 | 1.2 | GO:0086021 | SA node cell to atrial cardiac muscle cell communication by electrical coupling(GO:0086021) AV node cell to bundle of His cell communication by electrical coupling(GO:0086053) |
| 0.6 | 1.8 | GO:0048203 | vesicle targeting, trans-Golgi to endosome(GO:0048203) |
| 0.6 | 3.0 | GO:0001957 | intramembranous ossification(GO:0001957) direct ossification(GO:0036072) |
| 0.6 | 0.6 | GO:0035376 | sterol import(GO:0035376) cholesterol import(GO:0070508) |
| 0.6 | 1.2 | GO:0097106 | postsynaptic density organization(GO:0097106) postsynaptic density assembly(GO:0097107) gephyrin clustering involved in postsynaptic density assembly(GO:0097116) |
| 0.6 | 1.2 | GO:0060355 | positive regulation of cell adhesion molecule production(GO:0060355) |
| 0.6 | 2.9 | GO:0009609 | response to symbiont(GO:0009608) response to symbiotic bacterium(GO:0009609) |
| 0.6 | 1.8 | GO:0030327 | prenylated protein catabolic process(GO:0030327) |
| 0.6 | 5.1 | GO:0032287 | peripheral nervous system myelin maintenance(GO:0032287) |
| 0.6 | 0.6 | GO:0016246 | RNA interference(GO:0016246) |
| 0.6 | 4.5 | GO:0048050 | post-embryonic eye morphogenesis(GO:0048050) |
| 0.6 | 2.8 | GO:1990164 | histone H2A phosphorylation(GO:1990164) |
| 0.6 | 2.3 | GO:0060434 | bronchus morphogenesis(GO:0060434) |
| 0.6 | 3.3 | GO:0010724 | regulation of definitive erythrocyte differentiation(GO:0010724) |
| 0.6 | 2.8 | GO:0048625 | myoblast fate commitment(GO:0048625) |
| 0.6 | 2.8 | GO:0018125 | peptidyl-cysteine methylation(GO:0018125) |
| 0.5 | 1.6 | GO:0003149 | membranous septum morphogenesis(GO:0003149) |
| 0.5 | 1.1 | GO:1903978 | regulation of microglial cell activation(GO:1903978) |
| 0.5 | 2.1 | GO:0021564 | vagus nerve development(GO:0021564) |
| 0.5 | 0.5 | GO:0010159 | specification of organ position(GO:0010159) |
| 0.5 | 1.1 | GO:0051541 | elastin metabolic process(GO:0051541) |
| 0.5 | 2.6 | GO:0010643 | cell communication by chemical coupling(GO:0010643) |
| 0.5 | 2.1 | GO:0071306 | cellular response to vitamin E(GO:0071306) negative regulation of pancreatic stellate cell proliferation(GO:2000230) |
| 0.5 | 2.1 | GO:0060282 | positive regulation of oocyte development(GO:0060282) |
| 0.5 | 5.7 | GO:0010839 | negative regulation of keratinocyte proliferation(GO:0010839) |
| 0.5 | 1.5 | GO:1990108 | protein linear deubiquitination(GO:1990108) |
| 0.5 | 2.0 | GO:0048861 | leukemia inhibitory factor signaling pathway(GO:0048861) |
| 0.5 | 3.0 | GO:0042985 | negative regulation of amyloid precursor protein biosynthetic process(GO:0042985) |
| 0.5 | 2.0 | GO:1990834 | response to odorant(GO:1990834) |
| 0.5 | 2.0 | GO:0042412 | taurine biosynthetic process(GO:0042412) |
| 0.5 | 7.4 | GO:2000009 | negative regulation of protein localization to cell surface(GO:2000009) |
| 0.5 | 1.5 | GO:2001245 | regulation of phosphatidylcholine biosynthetic process(GO:2001245) |
| 0.5 | 1.9 | GO:1903778 | protein localization to vacuolar membrane(GO:1903778) |
| 0.5 | 1.4 | GO:0045210 | FasL biosynthetic process(GO:0045210) |
| 0.5 | 2.9 | GO:0055059 | asymmetric neuroblast division(GO:0055059) |
| 0.5 | 0.5 | GO:0070384 | Harderian gland development(GO:0070384) |
| 0.5 | 0.5 | GO:1904378 | maintenance of unfolded protein(GO:0036506) maintenance of unfolded protein involved in ERAD pathway(GO:1904378) |
| 0.5 | 2.3 | GO:2000671 | regulation of motor neuron apoptotic process(GO:2000671) |
| 0.5 | 1.8 | GO:0021812 | neuronal-glial interaction involved in cerebral cortex radial glia guided migration(GO:0021812) |
| 0.5 | 1.8 | GO:1904565 | response to 1-oleoyl-sn-glycerol 3-phosphate(GO:1904565) cellular response to 1-oleoyl-sn-glycerol 3-phosphate(GO:1904566) |
| 0.5 | 0.5 | GO:0032912 | negative regulation of transforming growth factor beta2 production(GO:0032912) |
| 0.5 | 1.8 | GO:1904046 | negative regulation of vascular endothelial growth factor production(GO:1904046) |
| 0.5 | 3.2 | GO:1905146 | lysosomal protein catabolic process(GO:1905146) |
| 0.4 | 0.4 | GO:0048319 | axial mesoderm morphogenesis(GO:0048319) |
| 0.4 | 7.2 | GO:0035970 | peptidyl-threonine dephosphorylation(GO:0035970) |
| 0.4 | 2.2 | GO:0043589 | skin morphogenesis(GO:0043589) |
| 0.4 | 1.3 | GO:0002541 | activation of plasma proteins involved in acute inflammatory response(GO:0002541) |
| 0.4 | 1.3 | GO:0043311 | positive regulation of eosinophil degranulation(GO:0043311) positive regulation of eosinophil activation(GO:1902568) |
| 0.4 | 3.1 | GO:0021840 | directional guidance of interneurons involved in migration from the subpallium to the cortex(GO:0021840) chemorepulsion involved in interneuron migration from the subpallium to the cortex(GO:0021842) |
| 0.4 | 3.5 | GO:0006013 | mannose metabolic process(GO:0006013) |
| 0.4 | 6.1 | GO:1904776 | regulation of protein localization to cell cortex(GO:1904776) positive regulation of protein localization to cell cortex(GO:1904778) |
| 0.4 | 0.9 | GO:1903336 | negative regulation of vacuolar transport(GO:1903336) |
| 0.4 | 1.3 | GO:0031291 | Ran protein signal transduction(GO:0031291) |
| 0.4 | 2.6 | GO:0035694 | mitochondrial protein catabolic process(GO:0035694) |
| 0.4 | 0.4 | GO:1904954 | canonical Wnt signaling pathway involved in midbrain dopaminergic neuron differentiation(GO:1904954) |
| 0.4 | 2.5 | GO:1904352 | positive regulation of protein catabolic process in the vacuole(GO:1904352) |
| 0.4 | 1.7 | GO:0071877 | regulation of adrenergic receptor signaling pathway(GO:0071877) |
| 0.4 | 0.4 | GO:0048294 | negative regulation of isotype switching to IgE isotypes(GO:0048294) |
| 0.4 | 10.9 | GO:0071294 | cellular response to zinc ion(GO:0071294) |
| 0.4 | 5.0 | GO:0009629 | response to gravity(GO:0009629) |
| 0.4 | 1.2 | GO:1901859 | negative regulation of mitochondrial DNA replication(GO:0090298) negative regulation of mitochondrial DNA metabolic process(GO:1901859) |
| 0.4 | 3.7 | GO:1902284 | axon extension involved in axon guidance(GO:0048846) neuron projection extension involved in neuron projection guidance(GO:1902284) |
| 0.4 | 0.4 | GO:0035973 | aggrephagy(GO:0035973) |
| 0.4 | 0.4 | GO:0034333 | adherens junction assembly(GO:0034333) |
| 0.4 | 3.2 | GO:0060510 | Type II pneumocyte differentiation(GO:0060510) |
| 0.4 | 1.6 | GO:0009956 | radial pattern formation(GO:0009956) |
| 0.4 | 3.9 | GO:2000427 | positive regulation of apoptotic cell clearance(GO:2000427) |
| 0.4 | 0.8 | GO:0051125 | regulation of actin nucleation(GO:0051125) |
| 0.4 | 1.2 | GO:0033341 | regulation of collagen binding(GO:0033341) |
| 0.4 | 2.0 | GO:0033088 | negative regulation of immature T cell proliferation in thymus(GO:0033088) |
| 0.4 | 1.9 | GO:0060449 | bud elongation involved in lung branching(GO:0060449) |
| 0.4 | 3.1 | GO:0008090 | retrograde axonal transport(GO:0008090) |
| 0.4 | 3.1 | GO:2001135 | regulation of endocytic recycling(GO:2001135) |
| 0.4 | 3.1 | GO:0031087 | deadenylation-independent decapping of nuclear-transcribed mRNA(GO:0031087) |
| 0.4 | 1.5 | GO:0061304 | retinal blood vessel morphogenesis(GO:0061304) |
| 0.4 | 5.0 | GO:0090084 | negative regulation of inclusion body assembly(GO:0090084) |
| 0.4 | 9.5 | GO:0030208 | dermatan sulfate biosynthetic process(GO:0030208) |
| 0.4 | 1.9 | GO:0008065 | establishment of blood-nerve barrier(GO:0008065) |
| 0.4 | 3.8 | GO:0034465 | response to carbon monoxide(GO:0034465) |
| 0.4 | 0.8 | GO:0002408 | myeloid dendritic cell chemotaxis(GO:0002408) |
| 0.4 | 0.4 | GO:0060445 | branching involved in salivary gland morphogenesis(GO:0060445) |
| 0.4 | 3.8 | GO:0060137 | maternal process involved in parturition(GO:0060137) |
| 0.4 | 1.5 | GO:0046836 | glycolipid transport(GO:0046836) |
| 0.4 | 1.1 | GO:0014876 | response to injury involved in regulation of muscle adaptation(GO:0014876) |
| 0.4 | 1.5 | GO:0072180 | mesonephric duct morphogenesis(GO:0072180) |
| 0.4 | 0.4 | GO:0051106 | positive regulation of DNA ligation(GO:0051106) |
| 0.4 | 1.5 | GO:0072103 | glomerulus vasculature morphogenesis(GO:0072103) glomerular capillary formation(GO:0072104) |
| 0.4 | 1.1 | GO:1901873 | regulation of post-translational protein modification(GO:1901873) |
| 0.4 | 1.5 | GO:0016333 | morphogenesis of follicular epithelium(GO:0016333) establishment or maintenance of polarity of follicular epithelium(GO:0016334) establishment of planar polarity of follicular epithelium(GO:0042247) |
| 0.4 | 1.8 | GO:0018230 | peptidyl-L-cysteine S-palmitoylation(GO:0018230) peptidyl-S-diacylglycerol-L-cysteine biosynthetic process from peptidyl-cysteine(GO:0018231) |
| 0.4 | 1.5 | GO:0048749 | compound eye development(GO:0048749) |
| 0.4 | 0.7 | GO:0061739 | protein lipidation involved in autophagosome assembly(GO:0061739) |
| 0.4 | 2.2 | GO:0060414 | aorta smooth muscle tissue morphogenesis(GO:0060414) |
| 0.4 | 1.4 | GO:0015910 | peroxisomal long-chain fatty acid import(GO:0015910) |
| 0.4 | 2.5 | GO:0035583 | sequestering of TGFbeta in extracellular matrix(GO:0035583) |
| 0.4 | 2.5 | GO:0030043 | actin filament fragmentation(GO:0030043) |
| 0.4 | 0.4 | GO:1904379 | protein localization to cytosolic proteasome complex(GO:1904327) protein localization to cytosolic proteasome complex involved in ERAD pathway(GO:1904379) |
| 0.4 | 1.1 | GO:0060666 | dichotomous subdivision of terminal units involved in salivary gland branching(GO:0060666) |
| 0.4 | 6.3 | GO:0007021 | tubulin complex assembly(GO:0007021) |
| 0.4 | 1.8 | GO:1902902 | negative regulation of autophagosome assembly(GO:1902902) |
| 0.4 | 1.1 | GO:1903542 | negative regulation of exosomal secretion(GO:1903542) |
| 0.3 | 0.7 | GO:0051014 | actin filament severing(GO:0051014) |
| 0.3 | 3.1 | GO:0060591 | chondroblast differentiation(GO:0060591) |
| 0.3 | 1.7 | GO:0035105 | sterol regulatory element binding protein import into nucleus(GO:0035105) |
| 0.3 | 2.1 | GO:0018095 | protein polyglutamylation(GO:0018095) |
| 0.3 | 1.0 | GO:0060373 | regulation of ventricular cardiac muscle cell membrane depolarization(GO:0060373) |
| 0.3 | 3.8 | GO:0048251 | elastic fiber assembly(GO:0048251) |
| 0.3 | 0.7 | GO:0061030 | epithelial cell differentiation involved in mammary gland alveolus development(GO:0061030) |
| 0.3 | 4.5 | GO:0035826 | rubidium ion transport(GO:0035826) regulation of rubidium ion transport(GO:2000680) |
| 0.3 | 1.0 | GO:0060846 | arterial endothelial cell fate commitment(GO:0060844) blood vessel endothelial cell fate commitment(GO:0060846) endothelial cell fate specification(GO:0060847) blood vessel lumenization(GO:0072554) blood vessel endothelial cell fate specification(GO:0097101) positive regulation of ephrin receptor signaling pathway(GO:1901189) positive regulation of canonical Wnt signaling pathway involved in cardiac muscle cell fate commitment(GO:1901297) positive regulation of canonical Wnt signaling pathway involved in heart development(GO:1905068) |
| 0.3 | 2.7 | GO:0031642 | negative regulation of myelination(GO:0031642) |
| 0.3 | 1.0 | GO:0051138 | positive regulation of NK T cell differentiation(GO:0051138) |
| 0.3 | 0.7 | GO:0048170 | positive regulation of long-term neuronal synaptic plasticity(GO:0048170) |
| 0.3 | 0.7 | GO:0050428 | purine ribonucleoside bisphosphate biosynthetic process(GO:0034036) 3'-phosphoadenosine 5'-phosphosulfate biosynthetic process(GO:0050428) |
| 0.3 | 0.7 | GO:0006145 | purine nucleobase catabolic process(GO:0006145) |
| 0.3 | 1.0 | GO:1902463 | protein localization to cell leading edge(GO:1902463) |
| 0.3 | 1.0 | GO:0038195 | urokinase plasminogen activator signaling pathway(GO:0038195) |
| 0.3 | 0.3 | GO:1901187 | regulation of ephrin receptor signaling pathway(GO:1901187) |
| 0.3 | 1.0 | GO:0006072 | glycerol-3-phosphate metabolic process(GO:0006072) |
| 0.3 | 0.7 | GO:2000015 | regulation of determination of dorsal identity(GO:2000015) |
| 0.3 | 1.3 | GO:0032972 | diaphragm contraction(GO:0002086) regulation of muscle filament sliding speed(GO:0032972) |
| 0.3 | 1.3 | GO:1902766 | skeletal muscle satellite cell migration(GO:1902766) |
| 0.3 | 1.9 | GO:1904431 | positive regulation of t-circle formation(GO:1904431) |
| 0.3 | 5.1 | GO:0007171 | activation of transmembrane receptor protein tyrosine kinase activity(GO:0007171) |
| 0.3 | 0.6 | GO:0060978 | angiogenesis involved in coronary vascular morphogenesis(GO:0060978) |
| 0.3 | 1.6 | GO:0060136 | embryonic process involved in female pregnancy(GO:0060136) |
| 0.3 | 1.0 | GO:0071529 | cementum mineralization(GO:0071529) |
| 0.3 | 0.6 | GO:0097084 | vascular smooth muscle cell development(GO:0097084) |
| 0.3 | 1.9 | GO:0034436 | glycoprotein transport(GO:0034436) |
| 0.3 | 1.9 | GO:0001915 | negative regulation of T cell mediated cytotoxicity(GO:0001915) |
| 0.3 | 1.3 | GO:0007185 | transmembrane receptor protein tyrosine phosphatase signaling pathway(GO:0007185) |
| 0.3 | 1.3 | GO:1903911 | positive regulation of receptor clustering(GO:1903911) |
| 0.3 | 0.6 | GO:0035385 | Roundabout signaling pathway(GO:0035385) |
| 0.3 | 5.0 | GO:0046697 | decidualization(GO:0046697) |
| 0.3 | 3.1 | GO:0090292 | nuclear matrix anchoring at nuclear membrane(GO:0090292) |
| 0.3 | 0.3 | GO:0006907 | pinocytosis(GO:0006907) |
| 0.3 | 0.9 | GO:0006982 | response to lipid hydroperoxide(GO:0006982) |
| 0.3 | 0.3 | GO:1900223 | positive regulation of beta-amyloid clearance(GO:1900223) |
| 0.3 | 1.8 | GO:0055005 | ventricular cardiac myofibril assembly(GO:0055005) |
| 0.3 | 4.2 | GO:0030913 | paranodal junction assembly(GO:0030913) |
| 0.3 | 2.1 | GO:0046549 | retinal cone cell differentiation(GO:0042670) retinal cone cell development(GO:0046549) |
| 0.3 | 0.9 | GO:1903224 | regulation of endodermal cell differentiation(GO:1903224) |
| 0.3 | 0.6 | GO:0023021 | termination of signal transduction(GO:0023021) |
| 0.3 | 0.3 | GO:0060599 | lateral sprouting involved in mammary gland duct morphogenesis(GO:0060599) |
| 0.3 | 0.9 | GO:0050760 | negative regulation of thymidylate synthase biosynthetic process(GO:0050760) |
| 0.3 | 0.3 | GO:0021555 | midbrain-hindbrain boundary morphogenesis(GO:0021555) |
| 0.3 | 1.5 | GO:0060592 | mammary gland formation(GO:0060592) |
| 0.3 | 2.7 | GO:0060391 | positive regulation of SMAD protein import into nucleus(GO:0060391) |
| 0.3 | 0.3 | GO:0071284 | cellular response to lead ion(GO:0071284) |
| 0.3 | 0.9 | GO:0019254 | carnitine metabolic process, CoA-linked(GO:0019254) |
| 0.3 | 0.6 | GO:0032792 | negative regulation of CREB transcription factor activity(GO:0032792) |
| 0.3 | 0.9 | GO:0071883 | activation of MAPK activity by adrenergic receptor signaling pathway(GO:0071883) |
| 0.3 | 2.1 | GO:0035878 | nail development(GO:0035878) |
| 0.3 | 0.3 | GO:0007113 | endomitotic cell cycle(GO:0007113) |
| 0.3 | 1.2 | GO:0048200 | COPI-coated vesicle budding(GO:0035964) Golgi transport vesicle coating(GO:0048200) COPI coating of Golgi vesicle(GO:0048205) |
| 0.3 | 1.8 | GO:0001692 | histamine metabolic process(GO:0001692) |
| 0.3 | 3.2 | GO:0030050 | vesicle transport along actin filament(GO:0030050) |
| 0.3 | 0.9 | GO:0045875 | negative regulation of sister chromatid cohesion(GO:0045875) |
| 0.3 | 1.2 | GO:0045792 | negative regulation of cell size(GO:0045792) |
| 0.3 | 0.9 | GO:0038031 | non-canonical Wnt signaling pathway via JNK cascade(GO:0038031) |
| 0.3 | 0.3 | GO:0070213 | protein auto-ADP-ribosylation(GO:0070213) |
| 0.3 | 0.3 | GO:0050968 | detection of chemical stimulus involved in sensory perception of pain(GO:0050968) |
| 0.3 | 1.1 | GO:0002011 | morphogenesis of an epithelial sheet(GO:0002011) |
| 0.3 | 0.9 | GO:0036353 | histone H2A-K119 monoubiquitination(GO:0036353) |
| 0.3 | 1.4 | GO:0097168 | mesenchymal stem cell proliferation(GO:0097168) |
| 0.3 | 2.8 | GO:0051764 | actin crosslink formation(GO:0051764) |
| 0.3 | 1.4 | GO:0036149 | phosphatidylinositol acyl-chain remodeling(GO:0036149) |
| 0.3 | 1.1 | GO:1900025 | negative regulation of substrate adhesion-dependent cell spreading(GO:1900025) |
| 0.3 | 0.6 | GO:0050859 | negative regulation of B cell receptor signaling pathway(GO:0050859) |
| 0.3 | 0.3 | GO:2000777 | positive regulation of proteasomal ubiquitin-dependent protein catabolic process involved in cellular response to hypoxia(GO:2000777) |
| 0.3 | 0.3 | GO:0032914 | positive regulation of transforming growth factor beta1 production(GO:0032914) |
| 0.3 | 0.8 | GO:0090045 | positive regulation of deacetylase activity(GO:0090045) |
| 0.3 | 1.1 | GO:0035026 | leading edge cell differentiation(GO:0035026) |
| 0.3 | 2.5 | GO:0031274 | positive regulation of pseudopodium assembly(GO:0031274) |
| 0.3 | 1.4 | GO:1904674 | positive regulation of somatic stem cell population maintenance(GO:1904674) |
| 0.3 | 0.8 | GO:0071494 | cellular response to UV-C(GO:0071494) |
| 0.3 | 1.1 | GO:0090204 | protein localization to nuclear pore(GO:0090204) |
| 0.3 | 0.6 | GO:1905007 | positive regulation of epithelial to mesenchymal transition involved in endocardial cushion formation(GO:1905007) |
| 0.3 | 1.7 | GO:0032328 | alanine transport(GO:0032328) |
| 0.3 | 0.8 | GO:0032707 | negative regulation of interleukin-23 production(GO:0032707) |
| 0.3 | 3.8 | GO:0090136 | epithelial cell-cell adhesion(GO:0090136) |
| 0.3 | 0.8 | GO:0019417 | sulfur oxidation(GO:0019417) |
| 0.3 | 1.1 | GO:0006049 | UDP-N-acetylglucosamine catabolic process(GO:0006049) |
| 0.3 | 0.3 | GO:0071873 | response to norepinephrine(GO:0071873) cellular response to norepinephrine stimulus(GO:0071874) |
| 0.3 | 6.4 | GO:0060325 | face morphogenesis(GO:0060325) |
| 0.3 | 1.1 | GO:1902722 | negative regulation of gamma-aminobutyric acid secretion(GO:0014053) aspartate secretion(GO:0061528) positive regulation of prolactin secretion(GO:1902722) regulation of aspartate secretion(GO:1904448) positive regulation of aspartate secretion(GO:1904450) |
| 0.3 | 1.1 | GO:1904753 | mycotoxin catabolic process(GO:0043387) aflatoxin catabolic process(GO:0046223) organic heteropentacyclic compound catabolic process(GO:1901377) regulation of glutathione biosynthetic process(GO:1903786) positive regulation of glutathione biosynthetic process(GO:1903788) negative regulation of vascular associated smooth muscle cell migration(GO:1904753) |
| 0.3 | 2.4 | GO:2000675 | negative regulation of type B pancreatic cell apoptotic process(GO:2000675) |
| 0.3 | 1.0 | GO:0019046 | release from viral latency(GO:0019046) |
| 0.3 | 1.0 | GO:1900454 | positive regulation of long term synaptic depression(GO:1900454) |
| 0.3 | 3.3 | GO:0061577 | calcium ion transmembrane transport via high voltage-gated calcium channel(GO:0061577) |
| 0.3 | 1.0 | GO:0035879 | plasma membrane lactate transport(GO:0035879) |
| 0.3 | 0.3 | GO:0043651 | linoleic acid metabolic process(GO:0043651) |
| 0.3 | 0.8 | GO:0006990 | positive regulation of transcription from RNA polymerase II promoter involved in unfolded protein response(GO:0006990) |
| 0.3 | 2.5 | GO:0042249 | establishment of planar polarity of embryonic epithelium(GO:0042249) |
| 0.3 | 1.5 | GO:1904262 | negative regulation of TORC1 signaling(GO:1904262) |
| 0.3 | 0.3 | GO:0048011 | neurotrophin TRK receptor signaling pathway(GO:0048011) |
| 0.3 | 1.3 | GO:2000466 | negative regulation of glycogen (starch) synthase activity(GO:2000466) |
| 0.2 | 0.7 | GO:0000412 | histone peptidyl-prolyl isomerization(GO:0000412) |
| 0.2 | 1.5 | GO:0010571 | positive regulation of nuclear cell cycle DNA replication(GO:0010571) |
| 0.2 | 1.2 | GO:0021979 | hypothalamus cell differentiation(GO:0021979) |
| 0.2 | 1.0 | GO:0042796 | snRNA transcription from RNA polymerase III promoter(GO:0042796) |
| 0.2 | 1.7 | GO:0045048 | protein insertion into ER membrane(GO:0045048) |
| 0.2 | 0.7 | GO:0061743 | motor learning(GO:0061743) |
| 0.2 | 2.2 | GO:0010561 | negative regulation of glycoprotein biosynthetic process(GO:0010561) |
| 0.2 | 1.7 | GO:0042426 | choline catabolic process(GO:0042426) |
| 0.2 | 0.2 | GO:0060385 | axonogenesis involved in innervation(GO:0060385) |
| 0.2 | 2.4 | GO:0060033 | anatomical structure regression(GO:0060033) |
| 0.2 | 0.2 | GO:0034427 | nuclear-transcribed mRNA catabolic process, exonucleolytic, 3'-5'(GO:0034427) |
| 0.2 | 0.5 | GO:0046946 | hydroxylysine metabolic process(GO:0046946) hydroxylysine biosynthetic process(GO:0046947) |
| 0.2 | 4.5 | GO:0003334 | keratinocyte development(GO:0003334) |
| 0.2 | 0.9 | GO:0007220 | Notch receptor processing(GO:0007220) |
| 0.2 | 0.9 | GO:0097049 | motor neuron apoptotic process(GO:0097049) |
| 0.2 | 3.1 | GO:0060576 | intestinal epithelial cell development(GO:0060576) |
| 0.2 | 1.2 | GO:0090043 | regulation of tubulin deacetylation(GO:0090043) |
| 0.2 | 3.8 | GO:0043562 | cellular response to nitrogen starvation(GO:0006995) cellular response to nitrogen levels(GO:0043562) |
| 0.2 | 3.5 | GO:0060213 | regulation of nuclear-transcribed mRNA poly(A) tail shortening(GO:0060211) positive regulation of nuclear-transcribed mRNA poly(A) tail shortening(GO:0060213) |
| 0.2 | 1.2 | GO:0015891 | iron chelate transport(GO:0015688) siderophore transport(GO:0015891) |
| 0.2 | 1.4 | GO:0021622 | oculomotor nerve morphogenesis(GO:0021622) oculomotor nerve formation(GO:0021623) |
| 0.2 | 1.6 | GO:0032510 | endosome to lysosome transport via multivesicular body sorting pathway(GO:0032510) |
| 0.2 | 0.7 | GO:0048599 | oocyte development(GO:0048599) |
| 0.2 | 11.6 | GO:1901016 | regulation of potassium ion transmembrane transporter activity(GO:1901016) |
| 0.2 | 1.9 | GO:0097500 | receptor localization to nonmotile primary cilium(GO:0097500) |
| 0.2 | 0.5 | GO:1900133 | regulation of renin secretion into blood stream(GO:1900133) |
| 0.2 | 0.9 | GO:1903593 | regulation of histamine secretion by mast cell(GO:1903593) |
| 0.2 | 1.4 | GO:0038172 | interleukin-33-mediated signaling pathway(GO:0038172) |
| 0.2 | 3.0 | GO:0030206 | chondroitin sulfate biosynthetic process(GO:0030206) |
| 0.2 | 0.2 | GO:0038162 | erythropoietin-mediated signaling pathway(GO:0038162) |
| 0.2 | 0.7 | GO:0017186 | peptidyl-pyroglutamic acid biosynthetic process, using glutaminyl-peptide cyclotransferase(GO:0017186) |
| 0.2 | 2.5 | GO:0045176 | apical protein localization(GO:0045176) |
| 0.2 | 1.1 | GO:0019323 | pentose catabolic process(GO:0019323) |
| 0.2 | 2.2 | GO:0001778 | plasma membrane repair(GO:0001778) |
| 0.2 | 3.1 | GO:2000050 | regulation of non-canonical Wnt signaling pathway(GO:2000050) |
| 0.2 | 0.7 | GO:1902938 | regulation of intracellular calcium activated chloride channel activity(GO:1902938) |
| 0.2 | 0.2 | GO:0060363 | cranial suture morphogenesis(GO:0060363) |
| 0.2 | 0.7 | GO:0038060 | nitric oxide-cGMP-mediated signaling pathway(GO:0038060) |
| 0.2 | 0.9 | GO:0003056 | regulation of vascular smooth muscle contraction(GO:0003056) |
| 0.2 | 0.4 | GO:0030886 | negative regulation of myeloid dendritic cell activation(GO:0030886) |
| 0.2 | 0.7 | GO:0099525 | presynaptic dense core granule exocytosis(GO:0099525) |
| 0.2 | 0.9 | GO:0060266 | negative regulation of respiratory burst involved in inflammatory response(GO:0060266) |
| 0.2 | 3.5 | GO:0033234 | negative regulation of protein sumoylation(GO:0033234) |
| 0.2 | 1.1 | GO:0042713 | sperm ejaculation(GO:0042713) |
| 0.2 | 2.0 | GO:0036066 | protein O-linked fucosylation(GO:0036066) |
| 0.2 | 1.5 | GO:0010867 | positive regulation of triglyceride biosynthetic process(GO:0010867) |
| 0.2 | 0.9 | GO:0007044 | cell-substrate junction assembly(GO:0007044) |
| 0.2 | 0.7 | GO:0070874 | negative regulation of glycogen biosynthetic process(GO:0045719) negative regulation of glycogen metabolic process(GO:0070874) |
| 0.2 | 0.6 | GO:0033159 | negative regulation of protein import into nucleus, translocation(GO:0033159) |
| 0.2 | 0.2 | GO:0098917 | retrograde trans-synaptic signaling(GO:0098917) |
| 0.2 | 0.2 | GO:0071681 | response to indole-3-methanol(GO:0071680) cellular response to indole-3-methanol(GO:0071681) |
| 0.2 | 2.4 | GO:0010603 | regulation of cytoplasmic mRNA processing body assembly(GO:0010603) |
| 0.2 | 1.5 | GO:0006537 | glutamate biosynthetic process(GO:0006537) |
| 0.2 | 5.4 | GO:0044458 | motile cilium assembly(GO:0044458) |
| 0.2 | 1.7 | GO:0046618 | drug export(GO:0046618) |
| 0.2 | 3.4 | GO:0031033 | myosin filament organization(GO:0031033) |
| 0.2 | 1.3 | GO:0003433 | chondrocyte development involved in endochondral bone morphogenesis(GO:0003433) |
| 0.2 | 0.2 | GO:0019276 | UDP-N-acetylgalactosamine metabolic process(GO:0019276) |
| 0.2 | 1.3 | GO:0002087 | regulation of respiratory gaseous exchange by neurological system process(GO:0002087) |
| 0.2 | 1.5 | GO:0060575 | intestinal epithelial cell differentiation(GO:0060575) |
| 0.2 | 0.6 | GO:0097503 | sialylation(GO:0097503) |
| 0.2 | 0.4 | GO:0033634 | positive regulation of cell-cell adhesion mediated by integrin(GO:0033634) |
| 0.2 | 1.5 | GO:0046604 | positive regulation of mitotic centrosome separation(GO:0046604) |
| 0.2 | 0.6 | GO:0022038 | corpus callosum development(GO:0022038) |
| 0.2 | 0.4 | GO:0048611 | ectodermal digestive tract development(GO:0007439) embryonic ectodermal digestive tract development(GO:0048611) |
| 0.2 | 1.5 | GO:0006655 | phosphatidylglycerol biosynthetic process(GO:0006655) |
| 0.2 | 1.7 | GO:0006621 | protein retention in ER lumen(GO:0006621) |
| 0.2 | 0.4 | GO:0051798 | positive regulation of hair follicle development(GO:0051798) |
| 0.2 | 0.8 | GO:0042986 | positive regulation of amyloid precursor protein biosynthetic process(GO:0042986) |
| 0.2 | 0.6 | GO:0032474 | otolith morphogenesis(GO:0032474) otolith development(GO:0048840) |
| 0.2 | 1.6 | GO:0042761 | fatty acid elongation(GO:0030497) very long-chain fatty acid biosynthetic process(GO:0042761) |
| 0.2 | 0.2 | GO:1905244 | regulation of modification of synaptic structure(GO:1905244) |
| 0.2 | 0.4 | GO:0035507 | regulation of myosin-light-chain-phosphatase activity(GO:0035507) |
| 0.2 | 1.2 | GO:0002760 | positive regulation of antimicrobial peptide production(GO:0002225) positive regulation of antimicrobial humoral response(GO:0002760) positive regulation of antibacterial peptide production(GO:0002803) |
| 0.2 | 0.8 | GO:0070459 | prolactin secretion(GO:0070459) |
| 0.2 | 1.0 | GO:0048711 | positive regulation of astrocyte differentiation(GO:0048711) |
| 0.2 | 4.0 | GO:0042730 | fibrinolysis(GO:0042730) |
| 0.2 | 2.2 | GO:0001542 | ovulation from ovarian follicle(GO:0001542) |
| 0.2 | 1.4 | GO:0008218 | bioluminescence(GO:0008218) |
| 0.2 | 1.0 | GO:1903361 | protein localization to basolateral plasma membrane(GO:1903361) |
| 0.2 | 0.2 | GO:0046066 | dGDP metabolic process(GO:0046066) |
| 0.2 | 0.4 | GO:0001712 | ectodermal cell fate commitment(GO:0001712) |
| 0.2 | 0.2 | GO:0061038 | uterus morphogenesis(GO:0061038) |
| 0.2 | 11.8 | GO:0030574 | collagen catabolic process(GO:0030574) |
| 0.2 | 0.8 | GO:2000480 | negative regulation of cAMP-dependent protein kinase activity(GO:2000480) |
| 0.2 | 0.6 | GO:0097498 | endothelial tube lumen extension(GO:0097498) |
| 0.2 | 1.5 | GO:0035986 | senescence-associated heterochromatin focus assembly(GO:0035986) |
| 0.2 | 0.8 | GO:2000535 | regulation of entry of bacterium into host cell(GO:2000535) |
| 0.2 | 4.0 | GO:0036150 | phosphatidylserine acyl-chain remodeling(GO:0036150) |
| 0.2 | 0.6 | GO:1901842 | negative regulation of high voltage-gated calcium channel activity(GO:1901842) |
| 0.2 | 0.6 | GO:0061470 | T follicular helper cell differentiation(GO:0061470) |
| 0.2 | 0.6 | GO:0090206 | negative regulation of cholesterol biosynthetic process(GO:0045541) negative regulation of cholesterol metabolic process(GO:0090206) |
| 0.2 | 1.9 | GO:0046325 | negative regulation of glucose import(GO:0046325) |
| 0.2 | 0.8 | GO:0048102 | autophagic cell death(GO:0048102) |
| 0.2 | 1.1 | GO:0033578 | protein glycosylation in Golgi(GO:0033578) |
| 0.2 | 0.8 | GO:0060600 | dichotomous subdivision of an epithelial terminal unit(GO:0060600) |
| 0.2 | 0.4 | GO:0030513 | positive regulation of BMP signaling pathway(GO:0030513) |
| 0.2 | 0.4 | GO:0036518 | chemorepulsion of dopaminergic neuron axon(GO:0036518) chemorepulsion of axon(GO:0061643) |
| 0.2 | 3.7 | GO:0071711 | basement membrane organization(GO:0071711) |
| 0.2 | 2.8 | GO:0031643 | positive regulation of myelination(GO:0031643) |
| 0.2 | 1.1 | GO:0042536 | negative regulation of tumor necrosis factor biosynthetic process(GO:0042536) |
| 0.2 | 0.4 | GO:0007340 | acrosome reaction(GO:0007340) |
| 0.2 | 0.5 | GO:0018103 | protein C-linked glycosylation(GO:0018103) peptidyl-tryptophan modification(GO:0018211) protein C-linked glycosylation via tryptophan(GO:0018317) protein C-linked glycosylation via 2'-alpha-mannosyl-L-tryptophan(GO:0018406) |
| 0.2 | 0.9 | GO:1901660 | calcium ion export(GO:1901660) |
| 0.2 | 0.2 | GO:0000289 | nuclear-transcribed mRNA poly(A) tail shortening(GO:0000289) |
| 0.2 | 0.7 | GO:0030035 | microspike assembly(GO:0030035) |
| 0.2 | 2.7 | GO:0019371 | cyclooxygenase pathway(GO:0019371) |
| 0.2 | 0.4 | GO:0061551 | trigeminal ganglion development(GO:0061551) |
| 0.2 | 2.8 | GO:0097062 | dendritic spine maintenance(GO:0097062) |
| 0.2 | 0.2 | GO:1900060 | negative regulation of sphingolipid biosynthetic process(GO:0090155) negative regulation of ceramide biosynthetic process(GO:1900060) |
| 0.2 | 1.6 | GO:0071468 | cellular response to acidic pH(GO:0071468) |
| 0.2 | 2.3 | GO:0019511 | peptidyl-proline hydroxylation(GO:0019511) |
| 0.2 | 1.1 | GO:0060244 | negative regulation of cell proliferation involved in contact inhibition(GO:0060244) |
| 0.2 | 0.3 | GO:0032900 | regulation of neurotrophin production(GO:0032899) negative regulation of neurotrophin production(GO:0032900) |
| 0.2 | 0.5 | GO:0021855 | hypothalamus cell migration(GO:0021855) |
| 0.2 | 0.3 | GO:0036369 | transcription factor catabolic process(GO:0036369) |
| 0.2 | 2.1 | GO:0007252 | I-kappaB phosphorylation(GO:0007252) |
| 0.2 | 0.2 | GO:0036216 | response to stem cell factor(GO:0036215) cellular response to stem cell factor stimulus(GO:0036216) Kit signaling pathway(GO:0038109) |
| 0.2 | 0.5 | GO:0001172 | transcription, RNA-templated(GO:0001172) |
| 0.2 | 0.7 | GO:0007520 | myoblast fusion(GO:0007520) |
| 0.2 | 0.5 | GO:0071139 | resolution of recombination intermediates(GO:0071139) resolution of mitotic recombination intermediates(GO:0071140) |
| 0.2 | 0.3 | GO:1990737 | response to manganese-induced endoplasmic reticulum stress(GO:1990737) |
| 0.2 | 1.5 | GO:2000507 | positive regulation of energy homeostasis(GO:2000507) |
| 0.2 | 0.7 | GO:0048286 | lung alveolus development(GO:0048286) |
| 0.2 | 0.7 | GO:0036337 | Fas signaling pathway(GO:0036337) regulation of Fas signaling pathway(GO:1902044) |
| 0.2 | 1.4 | GO:0097039 | protein linear polyubiquitination(GO:0097039) |
| 0.2 | 0.5 | GO:0032641 | lymphotoxin A production(GO:0032641) lymphotoxin A biosynthetic process(GO:0042109) |
| 0.2 | 0.7 | GO:0033484 | nitric oxide homeostasis(GO:0033484) |
| 0.2 | 0.8 | GO:1901909 | diadenosine polyphosphate catabolic process(GO:0015961) diphosphoinositol polyphosphate metabolic process(GO:0071543) diadenosine pentaphosphate metabolic process(GO:1901906) diadenosine pentaphosphate catabolic process(GO:1901907) diadenosine hexaphosphate metabolic process(GO:1901908) diadenosine hexaphosphate catabolic process(GO:1901909) adenosine 5'-(hexahydrogen pentaphosphate) metabolic process(GO:1901910) adenosine 5'-(hexahydrogen pentaphosphate) catabolic process(GO:1901911) |
| 0.2 | 1.0 | GO:1900193 | regulation of oocyte maturation(GO:1900193) |
| 0.2 | 1.7 | GO:0071550 | death-inducing signaling complex assembly(GO:0071550) |
| 0.2 | 0.7 | GO:0002296 | T-helper 1 cell lineage commitment(GO:0002296) |
| 0.2 | 0.5 | GO:1901079 | positive regulation of relaxation of muscle(GO:1901079) positive regulation of relaxation of cardiac muscle(GO:1901899) regulation of calcium ion import into sarcoplasmic reticulum(GO:1902080) negative regulation of calcium ion import into sarcoplasmic reticulum(GO:1902081) |
| 0.2 | 0.7 | GO:2000620 | positive regulation of histone H4-K16 acetylation(GO:2000620) |
| 0.2 | 1.5 | GO:0014010 | Schwann cell proliferation(GO:0014010) |
| 0.2 | 2.1 | GO:0016102 | retinoic acid biosynthetic process(GO:0002138) diterpenoid biosynthetic process(GO:0016102) |
| 0.2 | 0.3 | GO:0042659 | regulation of cell fate specification(GO:0042659) |
| 0.2 | 0.2 | GO:0038165 | oncostatin-M-mediated signaling pathway(GO:0038165) |
| 0.2 | 1.1 | GO:0072734 | response to staurosporine(GO:0072733) cellular response to staurosporine(GO:0072734) |
| 0.2 | 0.3 | GO:0060971 | embryonic heart tube left/right pattern formation(GO:0060971) |
| 0.2 | 0.8 | GO:0038110 | interleukin-2-mediated signaling pathway(GO:0038110) |
| 0.2 | 0.5 | GO:0046341 | CDP-diacylglycerol metabolic process(GO:0046341) |
| 0.2 | 0.3 | GO:1900425 | negative regulation of defense response to bacterium(GO:1900425) |
| 0.2 | 3.9 | GO:0032007 | negative regulation of TOR signaling(GO:0032007) |
| 0.2 | 0.2 | GO:0010644 | cell communication by electrical coupling(GO:0010644) |
| 0.2 | 1.0 | GO:0060042 | retina morphogenesis in camera-type eye(GO:0060042) |
| 0.2 | 0.5 | GO:0072385 | minus-end-directed organelle transport along microtubule(GO:0072385) |
| 0.2 | 0.5 | GO:1904058 | positive regulation of sensory perception of pain(GO:1904058) |
| 0.2 | 0.6 | GO:0060762 | regulation of branching involved in mammary gland duct morphogenesis(GO:0060762) |
| 0.2 | 0.9 | GO:0001878 | response to yeast(GO:0001878) |
| 0.2 | 6.0 | GO:0008333 | endosome to lysosome transport(GO:0008333) |
| 0.2 | 0.5 | GO:0086100 | endothelin receptor signaling pathway(GO:0086100) |
| 0.2 | 0.3 | GO:0005988 | lactose metabolic process(GO:0005988) lactose biosynthetic process(GO:0005989) |
| 0.2 | 1.9 | GO:0060644 | mammary gland epithelial cell differentiation(GO:0060644) |
| 0.2 | 0.6 | GO:0010269 | response to selenium ion(GO:0010269) |
| 0.2 | 0.2 | GO:0036006 | response to macrophage colony-stimulating factor(GO:0036005) cellular response to macrophage colony-stimulating factor stimulus(GO:0036006) |
| 0.2 | 1.1 | GO:0002414 | immunoglobulin transcytosis in epithelial cells(GO:0002414) |
| 0.2 | 0.5 | GO:0033078 | extrathymic T cell differentiation(GO:0033078) extrathymic T cell selection(GO:0045062) |
| 0.2 | 0.6 | GO:0031017 | exocrine pancreas development(GO:0031017) |
| 0.2 | 0.9 | GO:1990416 | cellular response to brain-derived neurotrophic factor stimulus(GO:1990416) |
| 0.2 | 0.3 | GO:0072717 | cellular response to actinomycin D(GO:0072717) |
| 0.2 | 2.0 | GO:0061000 | negative regulation of dendritic spine development(GO:0061000) |
| 0.2 | 0.3 | GO:0006258 | UDP-glucose catabolic process(GO:0006258) |
| 0.2 | 0.8 | GO:0060390 | regulation of SMAD protein import into nucleus(GO:0060390) |
| 0.1 | 0.6 | GO:0042335 | cuticle development(GO:0042335) |
| 0.1 | 0.1 | GO:0048312 | intracellular distribution of mitochondria(GO:0048312) |
| 0.1 | 1.0 | GO:0035897 | proteolysis in other organism(GO:0035897) |
| 0.1 | 0.1 | GO:0006679 | glucosylceramide biosynthetic process(GO:0006679) |
| 0.1 | 1.3 | GO:0090315 | negative regulation of protein targeting to membrane(GO:0090315) |
| 0.1 | 1.0 | GO:1904354 | negative regulation of telomere capping(GO:1904354) |
| 0.1 | 0.6 | GO:0060995 | cell-cell signaling involved in kidney development(GO:0060995) Wnt signaling pathway involved in kidney development(GO:0061289) canonical Wnt signaling pathway involved in metanephric kidney development(GO:0061290) cell-cell signaling involved in metanephros development(GO:0072204) |
| 0.1 | 0.4 | GO:1901165 | positive regulation of trophoblast cell migration(GO:1901165) |
| 0.1 | 0.3 | GO:0019255 | glucose 1-phosphate metabolic process(GO:0019255) |
| 0.1 | 0.7 | GO:0060356 | leucine import(GO:0060356) |
| 0.1 | 0.1 | GO:1902309 | negative regulation of peptidyl-serine dephosphorylation(GO:1902309) |
| 0.1 | 0.9 | GO:0051412 | response to corticosterone(GO:0051412) |
| 0.1 | 1.5 | GO:0050703 | interleukin-1 alpha secretion(GO:0050703) |
| 0.1 | 0.9 | GO:0010040 | response to iron(II) ion(GO:0010040) |
| 0.1 | 0.4 | GO:0040034 | regulation of development, heterochronic(GO:0040034) regulation of timing of cell differentiation(GO:0048505) |
| 0.1 | 0.3 | GO:0044065 | regulation of respiratory system process(GO:0044065) |
| 0.1 | 0.4 | GO:0006422 | aspartyl-tRNA aminoacylation(GO:0006422) |
| 0.1 | 1.0 | GO:0030199 | collagen fibril organization(GO:0030199) |
| 0.1 | 0.6 | GO:0072675 | multinuclear osteoclast differentiation(GO:0072674) osteoclast fusion(GO:0072675) |
| 0.1 | 0.7 | GO:0033133 | positive regulation of glucokinase activity(GO:0033133) positive regulation of hexokinase activity(GO:1903301) |
| 0.1 | 0.6 | GO:0090076 | relaxation of skeletal muscle(GO:0090076) |
| 0.1 | 0.3 | GO:0010635 | regulation of mitochondrial fusion(GO:0010635) |
| 0.1 | 0.4 | GO:0016255 | attachment of GPI anchor to protein(GO:0016255) |
| 0.1 | 1.1 | GO:0007042 | lysosomal lumen acidification(GO:0007042) |
| 0.1 | 3.5 | GO:0007176 | regulation of epidermal growth factor-activated receptor activity(GO:0007176) |
| 0.1 | 0.4 | GO:0072369 | regulation of lipid transport by positive regulation of transcription from RNA polymerase II promoter(GO:0072369) |
| 0.1 | 2.6 | GO:0048009 | insulin-like growth factor receptor signaling pathway(GO:0048009) |
| 0.1 | 0.3 | GO:0097056 | seryl-tRNA aminoacylation(GO:0006434) selenocysteinyl-tRNA(Sec) biosynthetic process(GO:0097056) |
| 0.1 | 8.7 | GO:0051965 | positive regulation of synapse assembly(GO:0051965) |
| 0.1 | 0.7 | GO:0071467 | cellular response to pH(GO:0071467) |
| 0.1 | 1.0 | GO:0034770 | histone H4-K20 methylation(GO:0034770) |
| 0.1 | 1.2 | GO:0010811 | positive regulation of cell-substrate adhesion(GO:0010811) |
| 0.1 | 0.1 | GO:0006382 | adenosine to inosine editing(GO:0006382) |
| 0.1 | 0.3 | GO:0060040 | retinal bipolar neuron differentiation(GO:0060040) |
| 0.1 | 1.4 | GO:0022011 | myelination in peripheral nervous system(GO:0022011) peripheral nervous system axon ensheathment(GO:0032292) |
| 0.1 | 1.4 | GO:0010990 | regulation of SMAD protein complex assembly(GO:0010990) negative regulation of SMAD protein complex assembly(GO:0010991) |
| 0.1 | 1.1 | GO:1901998 | toxin transport(GO:1901998) |
| 0.1 | 0.4 | GO:0046294 | formaldehyde catabolic process(GO:0046294) |
| 0.1 | 0.5 | GO:0010815 | bradykinin catabolic process(GO:0010815) |
| 0.1 | 1.5 | GO:1903557 | positive regulation of tumor necrosis factor superfamily cytokine production(GO:1903557) |
| 0.1 | 0.5 | GO:0014052 | regulation of gamma-aminobutyric acid secretion(GO:0014052) |
| 0.1 | 3.3 | GO:0070884 | regulation of calcineurin-NFAT signaling cascade(GO:0070884) |
| 0.1 | 0.9 | GO:0070857 | regulation of bile acid biosynthetic process(GO:0070857) |
| 0.1 | 0.1 | GO:0015803 | branched-chain amino acid transport(GO:0015803) leucine transport(GO:0015820) |
| 0.1 | 0.4 | GO:1903028 | positive regulation of opsonization(GO:1903028) |
| 0.1 | 0.7 | GO:0014819 | regulation of skeletal muscle contraction(GO:0014819) |
| 0.1 | 0.7 | GO:1904754 | positive regulation of vascular associated smooth muscle cell migration(GO:1904754) |
| 0.1 | 0.1 | GO:0060023 | soft palate development(GO:0060023) |
| 0.1 | 0.9 | GO:2000582 | positive regulation of microtubule motor activity(GO:2000576) regulation of ATP-dependent microtubule motor activity, plus-end-directed(GO:2000580) positive regulation of ATP-dependent microtubule motor activity, plus-end-directed(GO:2000582) |
| 0.1 | 1.1 | GO:1900623 | regulation of monocyte aggregation(GO:1900623) positive regulation of monocyte aggregation(GO:1900625) |
| 0.1 | 1.0 | GO:0097320 | membrane tubulation(GO:0097320) |
| 0.1 | 0.7 | GO:0032528 | microvillus organization(GO:0032528) |
| 0.1 | 1.3 | GO:0016242 | negative regulation of macroautophagy(GO:0016242) |
| 0.1 | 0.4 | GO:0090286 | cytoskeletal anchoring at nuclear membrane(GO:0090286) |
| 0.1 | 0.1 | GO:0060037 | pharyngeal system development(GO:0060037) |
| 0.1 | 1.0 | GO:0002480 | antigen processing and presentation of exogenous peptide antigen via MHC class I, TAP-independent(GO:0002480) |
| 0.1 | 0.4 | GO:0075071 | autophagy of host cells involved in interaction with symbiont(GO:0075044) autophagy involved in symbiotic interaction(GO:0075071) |
| 0.1 | 0.4 | GO:0060352 | cell adhesion molecule production(GO:0060352) |
| 0.1 | 0.3 | GO:1901671 | regulation of superoxide dismutase activity(GO:1901668) positive regulation of superoxide dismutase activity(GO:1901671) positive regulation of removal of superoxide radicals(GO:1904833) |
| 0.1 | 1.8 | GO:0006895 | Golgi to endosome transport(GO:0006895) |
| 0.1 | 2.2 | GO:0042340 | keratan sulfate catabolic process(GO:0042340) |
| 0.1 | 1.1 | GO:0030252 | growth hormone secretion(GO:0030252) |
| 0.1 | 0.4 | GO:0090107 | regulation of high-density lipoprotein particle assembly(GO:0090107) |
| 0.1 | 0.1 | GO:0003383 | apical constriction(GO:0003383) |
| 0.1 | 0.5 | GO:0045872 | positive regulation of rhodopsin gene expression(GO:0045872) |
| 0.1 | 2.0 | GO:0030214 | hyaluronan catabolic process(GO:0030214) |
| 0.1 | 0.5 | GO:0044375 | regulation of peroxisome size(GO:0044375) |
| 0.1 | 0.1 | GO:0051928 | positive regulation of calcium ion transport(GO:0051928) |
| 0.1 | 0.4 | GO:0019072 | viral genome packaging(GO:0019072) viral RNA genome packaging(GO:0019074) |
| 0.1 | 0.9 | GO:0015014 | heparan sulfate proteoglycan biosynthetic process, polysaccharide chain biosynthetic process(GO:0015014) |
| 0.1 | 3.9 | GO:0035329 | hippo signaling(GO:0035329) |
| 0.1 | 1.0 | GO:0007567 | parturition(GO:0007567) |
| 0.1 | 2.7 | GO:0009301 | snRNA transcription(GO:0009301) snRNA transcription from RNA polymerase II promoter(GO:0042795) |
| 0.1 | 0.6 | GO:0007217 | tachykinin receptor signaling pathway(GO:0007217) |
| 0.1 | 0.4 | GO:0090362 | positive regulation of platelet-derived growth factor production(GO:0090362) |
| 0.1 | 0.1 | GO:0033140 | negative regulation of peptidyl-serine phosphorylation of STAT protein(GO:0033140) |
| 0.1 | 0.2 | GO:0051547 | regulation of keratinocyte migration(GO:0051547) |
| 0.1 | 0.6 | GO:0000389 | mRNA 3'-splice site recognition(GO:0000389) |
| 0.1 | 0.8 | GO:0001967 | suckling behavior(GO:0001967) |
| 0.1 | 0.8 | GO:0071071 | regulation of phospholipid biosynthetic process(GO:0071071) |
| 0.1 | 0.4 | GO:0030997 | regulation of centriole-centriole cohesion(GO:0030997) |
| 0.1 | 0.4 | GO:1990086 | lens fiber cell apoptotic process(GO:1990086) |
| 0.1 | 0.5 | GO:0048266 | behavioral response to pain(GO:0048266) |
| 0.1 | 0.5 | GO:0048745 | smooth muscle tissue development(GO:0048745) |
| 0.1 | 0.1 | GO:0035524 | proline transmembrane transport(GO:0035524) |
| 0.1 | 0.8 | GO:0044829 | positive regulation by host of viral genome replication(GO:0044829) |
| 0.1 | 0.5 | GO:0006051 | mannosamine metabolic process(GO:0006050) N-acetylmannosamine metabolic process(GO:0006051) |
| 0.1 | 0.2 | GO:1990504 | dense core granule exocytosis(GO:1990504) |
| 0.1 | 1.5 | GO:0009226 | nucleotide-sugar biosynthetic process(GO:0009226) |
| 0.1 | 0.1 | GO:0060689 | cell differentiation involved in salivary gland development(GO:0060689) |
| 0.1 | 0.9 | GO:0015825 | L-serine transport(GO:0015825) |
| 0.1 | 0.1 | GO:0021590 | cerebellum maturation(GO:0021590) cerebellar Purkinje cell layer maturation(GO:0021691) cerebellar cortex maturation(GO:0021699) |
| 0.1 | 0.8 | GO:0002431 | Fc receptor mediated stimulatory signaling pathway(GO:0002431) |
| 0.1 | 0.1 | GO:1902004 | positive regulation of beta-amyloid formation(GO:1902004) |
| 0.1 | 0.2 | GO:0060214 | endocardium formation(GO:0060214) |
| 0.1 | 0.6 | GO:1902268 | negative regulation of polyamine transmembrane transport(GO:1902268) |
| 0.1 | 1.1 | GO:0043568 | positive regulation of insulin-like growth factor receptor signaling pathway(GO:0043568) |
| 0.1 | 0.6 | GO:1903243 | negative regulation of cardiac muscle adaptation(GO:0010616) negative regulation of cardiac muscle hypertrophy in response to stress(GO:1903243) |
| 0.1 | 0.6 | GO:0043276 | anoikis(GO:0043276) |
| 0.1 | 0.7 | GO:0097094 | craniofacial suture morphogenesis(GO:0097094) |
| 0.1 | 1.1 | GO:0032026 | response to magnesium ion(GO:0032026) |
| 0.1 | 0.1 | GO:0072138 | mesenchymal cell proliferation involved in ureteric bud development(GO:0072138) |
| 0.1 | 0.2 | GO:0001842 | neural fold formation(GO:0001842) |
| 0.1 | 0.1 | GO:2001179 | regulation of interleukin-10 secretion(GO:2001179) |
| 0.1 | 0.2 | GO:0034755 | ferrous iron transport(GO:0015684) iron ion transmembrane transport(GO:0034755) ferrous iron transmembrane transport(GO:1903874) |
| 0.1 | 0.3 | GO:0046548 | retinal rod cell development(GO:0046548) |
| 0.1 | 4.5 | GO:0007190 | activation of adenylate cyclase activity(GO:0007190) |
| 0.1 | 7.4 | GO:0046323 | glucose import(GO:0046323) |
| 0.1 | 0.4 | GO:0001574 | ganglioside biosynthetic process(GO:0001574) |
| 0.1 | 0.3 | GO:0030031 | cell projection assembly(GO:0030031) |
| 0.1 | 0.9 | GO:1903020 | positive regulation of glycoprotein metabolic process(GO:1903020) |
| 0.1 | 0.3 | GO:0010761 | fibroblast migration(GO:0010761) |
| 0.1 | 0.3 | GO:0018126 | protein hydroxylation(GO:0018126) |
| 0.1 | 1.0 | GO:0030728 | ovulation(GO:0030728) |
| 0.1 | 1.9 | GO:0090110 | cargo loading into COPII-coated vesicle(GO:0090110) |
| 0.1 | 0.9 | GO:0023041 | neuronal signal transduction(GO:0023041) |
| 0.1 | 0.2 | GO:1904180 | negative regulation of membrane depolarization(GO:1904180) |
| 0.1 | 0.7 | GO:0036119 | response to platelet-derived growth factor(GO:0036119) cellular response to platelet-derived growth factor stimulus(GO:0036120) |
| 0.1 | 0.1 | GO:1902019 | negative regulation of appetite by leptin-mediated signaling pathway(GO:0038108) regulation of cilium movement involved in cell motility(GO:0060295) regulation of cilium beat frequency involved in ciliary motility(GO:0060296) regulation of cilium-dependent cell motility(GO:1902019) |
| 0.1 | 0.3 | GO:0000290 | deadenylation-dependent decapping of nuclear-transcribed mRNA(GO:0000290) |
| 0.1 | 0.7 | GO:0097577 | intracellular sequestering of iron ion(GO:0006880) sequestering of iron ion(GO:0097577) |
| 0.1 | 1.7 | GO:0000338 | protein deneddylation(GO:0000338) |
| 0.1 | 0.3 | GO:0042701 | progesterone secretion(GO:0042701) regulation of progesterone secretion(GO:2000870) |
| 0.1 | 0.2 | GO:0014816 | skeletal muscle satellite cell differentiation(GO:0014816) |
| 0.1 | 0.4 | GO:0019530 | taurine metabolic process(GO:0019530) |
| 0.1 | 0.7 | GO:0033353 | S-adenosylmethionine cycle(GO:0033353) |
| 0.1 | 0.1 | GO:0090403 | oxidative stress-induced premature senescence(GO:0090403) |
| 0.1 | 1.0 | GO:1901620 | regulation of smoothened signaling pathway involved in dorsal/ventral neural tube patterning(GO:1901620) negative regulation of smoothened signaling pathway involved in dorsal/ventral neural tube patterning(GO:1901621) |
| 0.1 | 0.3 | GO:0032594 | protein transport within lipid bilayer(GO:0032594) protein transport into membrane raft(GO:0032596) |
| 0.1 | 1.7 | GO:0070207 | protein homotrimerization(GO:0070207) |
| 0.1 | 0.5 | GO:1901386 | negative regulation of voltage-gated calcium channel activity(GO:1901386) |
| 0.1 | 0.8 | GO:0048752 | semicircular canal morphogenesis(GO:0048752) |
| 0.1 | 0.8 | GO:0015871 | choline transport(GO:0015871) |
| 0.1 | 0.4 | GO:0071763 | nuclear membrane organization(GO:0071763) |
| 0.1 | 0.3 | GO:0019626 | short-chain fatty acid catabolic process(GO:0019626) |
| 0.1 | 0.3 | GO:0098968 | neurotransmitter receptor transport postsynaptic membrane to endosome(GO:0098968) |
| 0.1 | 0.2 | GO:0048227 | plasma membrane to endosome transport(GO:0048227) |
| 0.1 | 0.5 | GO:0018243 | protein O-linked glycosylation via threonine(GO:0018243) |
| 0.1 | 0.2 | GO:0060157 | urinary bladder development(GO:0060157) |
| 0.1 | 1.9 | GO:0033622 | integrin activation(GO:0033622) |
| 0.1 | 0.7 | GO:0003215 | cardiac right ventricle morphogenesis(GO:0003215) |
| 0.1 | 0.5 | GO:0045723 | positive regulation of fatty acid biosynthetic process(GO:0045723) |
| 0.1 | 0.3 | GO:0043012 | regulation of fusion of sperm to egg plasma membrane(GO:0043012) |
| 0.1 | 0.1 | GO:1903347 | negative regulation of bicellular tight junction assembly(GO:1903347) |
| 0.1 | 1.1 | GO:0046007 | negative regulation of activated T cell proliferation(GO:0046007) |
| 0.1 | 0.4 | GO:0060004 | reflex(GO:0060004) |
| 0.1 | 0.2 | GO:0036508 | protein demannosylation(GO:0036507) protein alpha-1,2-demannosylation(GO:0036508) |
| 0.1 | 0.8 | GO:0035360 | positive regulation of peroxisome proliferator activated receptor signaling pathway(GO:0035360) |
| 0.1 | 0.4 | GO:0006556 | S-adenosylmethionine biosynthetic process(GO:0006556) |
| 0.1 | 0.1 | GO:0003175 | tricuspid valve development(GO:0003175) tricuspid valve morphogenesis(GO:0003186) |
| 0.1 | 0.4 | GO:0050818 | regulation of coagulation(GO:0050818) |
| 0.1 | 1.0 | GO:0051601 | exocyst localization(GO:0051601) |
| 0.1 | 0.6 | GO:0015677 | copper ion import(GO:0015677) |
| 0.1 | 0.2 | GO:0035871 | protein K11-linked deubiquitination(GO:0035871) |
| 0.1 | 0.4 | GO:0034058 | endosomal vesicle fusion(GO:0034058) |
| 0.1 | 2.8 | GO:0045103 | intermediate filament-based process(GO:0045103) |
| 0.1 | 0.5 | GO:0030207 | chondroitin sulfate catabolic process(GO:0030207) |
| 0.1 | 0.5 | GO:0090074 | negative regulation of protein homodimerization activity(GO:0090074) |
| 0.1 | 1.4 | GO:0042420 | dopamine catabolic process(GO:0042420) |
| 0.1 | 0.8 | GO:1900112 | regulation of histone H3-K9 trimethylation(GO:1900112) |
| 0.1 | 0.6 | GO:0014850 | response to muscle activity(GO:0014850) |
| 0.1 | 0.7 | GO:0003351 | epithelial cilium movement(GO:0003351) |
| 0.1 | 0.5 | GO:0046391 | 5-phosphoribose 1-diphosphate biosynthetic process(GO:0006015) 5-phosphoribose 1-diphosphate metabolic process(GO:0046391) |
| 0.1 | 0.5 | GO:1901662 | phylloquinone metabolic process(GO:0042374) phylloquinone catabolic process(GO:0042376) quinone catabolic process(GO:1901662) |
| 0.1 | 1.4 | GO:0044804 | nucleophagy(GO:0044804) |
| 0.1 | 0.4 | GO:0021523 | somatic motor neuron differentiation(GO:0021523) |
| 0.1 | 0.2 | GO:0050916 | sensory perception of sweet taste(GO:0050916) |
| 0.1 | 0.2 | GO:0035994 | response to muscle stretch(GO:0035994) |
| 0.1 | 0.8 | GO:1900273 | positive regulation of long-term synaptic potentiation(GO:1900273) |
| 0.1 | 0.3 | GO:0010755 | regulation of plasminogen activation(GO:0010755) |
| 0.1 | 0.2 | GO:0003095 | pressure natriuresis(GO:0003095) |
| 0.1 | 0.2 | GO:0034088 | maintenance of sister chromatid cohesion(GO:0034086) maintenance of mitotic sister chromatid cohesion(GO:0034088) |
| 0.1 | 1.5 | GO:0032467 | positive regulation of cytokinesis(GO:0032467) |
| 0.1 | 1.1 | GO:0018214 | peptidyl-glutamic acid carboxylation(GO:0017187) protein carboxylation(GO:0018214) |
| 0.1 | 0.1 | GO:0043578 | nuclear matrix organization(GO:0043578) |
| 0.1 | 0.3 | GO:0046900 | tetrahydrofolylpolyglutamate metabolic process(GO:0046900) |
| 0.1 | 1.1 | GO:0007213 | G-protein coupled acetylcholine receptor signaling pathway(GO:0007213) |
| 0.1 | 0.6 | GO:0007183 | SMAD protein complex assembly(GO:0007183) |
| 0.1 | 0.3 | GO:0070966 | nuclear-transcribed mRNA catabolic process, no-go decay(GO:0070966) |
| 0.1 | 0.3 | GO:0048243 | norepinephrine secretion(GO:0048243) |
| 0.1 | 0.4 | GO:2000849 | glucocorticoid secretion(GO:0035933) regulation of glucocorticoid secretion(GO:2000849) |
| 0.1 | 0.3 | GO:0097091 | synaptic vesicle clustering(GO:0097091) |
| 0.1 | 0.3 | GO:0033564 | anterior/posterior axon guidance(GO:0033564) |
| 0.1 | 2.2 | GO:0031529 | ruffle organization(GO:0031529) |
| 0.1 | 0.3 | GO:0099566 | regulation of postsynaptic cytosolic calcium ion concentration(GO:0099566) |
| 0.1 | 0.3 | GO:0021814 | cell motility involved in cerebral cortex radial glia guided migration(GO:0021814) |
| 0.1 | 1.4 | GO:0051457 | maintenance of protein location in nucleus(GO:0051457) |
| 0.1 | 0.7 | GO:0019388 | galactose catabolic process(GO:0019388) |
| 0.1 | 0.3 | GO:0090063 | positive regulation of microtubule nucleation(GO:0090063) |
| 0.1 | 0.1 | GO:0007016 | cytoskeletal anchoring at plasma membrane(GO:0007016) |
| 0.1 | 0.3 | GO:0046498 | S-adenosylhomocysteine metabolic process(GO:0046498) |
| 0.1 | 0.7 | GO:0006465 | signal peptide processing(GO:0006465) |
| 0.1 | 0.4 | GO:0035418 | protein localization to synapse(GO:0035418) |
| 0.1 | 0.4 | GO:2000074 | regulation of type B pancreatic cell development(GO:2000074) |
| 0.1 | 0.4 | GO:1904970 | brush border assembly(GO:1904970) |
| 0.1 | 0.8 | GO:0034975 | protein folding in endoplasmic reticulum(GO:0034975) |
| 0.1 | 0.1 | GO:1903895 | negative regulation of IRE1-mediated unfolded protein response(GO:1903895) |
| 0.1 | 0.9 | GO:0001514 | selenocysteine incorporation(GO:0001514) translational readthrough(GO:0006451) |
| 0.1 | 2.5 | GO:0016486 | peptide hormone processing(GO:0016486) |
| 0.1 | 1.7 | GO:0035987 | endodermal cell differentiation(GO:0035987) |
| 0.1 | 2.4 | GO:0043171 | peptide catabolic process(GO:0043171) |
| 0.1 | 1.0 | GO:0051491 | positive regulation of filopodium assembly(GO:0051491) |
| 0.1 | 4.3 | GO:0022617 | extracellular matrix disassembly(GO:0022617) |
| 0.1 | 0.2 | GO:0035720 | intraciliary anterograde transport(GO:0035720) |
| 0.1 | 5.6 | GO:1902017 | regulation of cilium assembly(GO:1902017) |
| 0.1 | 0.4 | GO:0016127 | cholesterol catabolic process(GO:0006707) sterol catabolic process(GO:0016127) |
| 0.1 | 0.6 | GO:0048642 | negative regulation of skeletal muscle tissue development(GO:0048642) |
| 0.1 | 0.1 | GO:0032506 | cytokinetic process(GO:0032506) |
| 0.1 | 0.8 | GO:0071850 | mitotic cell cycle arrest(GO:0071850) |
| 0.1 | 0.2 | GO:0086097 | phospholipase C-activating angiotensin-activated signaling pathway(GO:0086097) |
| 0.1 | 0.3 | GO:0036500 | ATF6-mediated unfolded protein response(GO:0036500) |
| 0.1 | 0.5 | GO:0032060 | bleb assembly(GO:0032060) |
| 0.1 | 0.9 | GO:0019852 | L-ascorbic acid metabolic process(GO:0019852) |
| 0.1 | 0.2 | GO:0036445 | neuronal stem cell division(GO:0036445) neuroblast division(GO:0055057) |
| 0.1 | 1.0 | GO:0051489 | regulation of filopodium assembly(GO:0051489) |
| 0.1 | 0.1 | GO:0000212 | meiotic spindle organization(GO:0000212) oocyte maturation(GO:0001556) spindle assembly involved in female meiosis(GO:0007056) spindle assembly involved in meiosis(GO:0090306) |
| 0.1 | 0.8 | GO:0090168 | Golgi reassembly(GO:0090168) |
| 0.1 | 0.1 | GO:0051835 | positive regulation of synapse structural plasticity(GO:0051835) |
| 0.1 | 0.1 | GO:0008616 | queuosine biosynthetic process(GO:0008616) queuosine metabolic process(GO:0046116) |
| 0.1 | 0.7 | GO:0035810 | positive regulation of urine volume(GO:0035810) |
| 0.1 | 0.1 | GO:0043321 | regulation of natural killer cell degranulation(GO:0043321) positive regulation of natural killer cell degranulation(GO:0043323) |
| 0.1 | 0.2 | GO:0045162 | clustering of voltage-gated sodium channels(GO:0045162) |
| 0.1 | 3.3 | GO:0030032 | lamellipodium assembly(GO:0030032) |
| 0.1 | 0.4 | GO:0010499 | proteasomal ubiquitin-independent protein catabolic process(GO:0010499) |
| 0.1 | 1.7 | GO:0030834 | regulation of actin filament depolymerization(GO:0030834) |
| 0.1 | 0.6 | GO:0060856 | establishment of blood-brain barrier(GO:0060856) |
| 0.1 | 1.3 | GO:0006509 | membrane protein ectodomain proteolysis(GO:0006509) |
| 0.1 | 0.3 | GO:0097205 | renal filtration(GO:0097205) |
| 0.1 | 1.8 | GO:0007405 | neuroblast proliferation(GO:0007405) |
| 0.1 | 0.1 | GO:0002281 | macrophage activation involved in immune response(GO:0002281) |
| 0.1 | 0.2 | GO:0010286 | heat acclimation(GO:0010286) cellular heat acclimation(GO:0070370) |
| 0.1 | 0.2 | GO:0006011 | UDP-glucose metabolic process(GO:0006011) UDP-glucosylation(GO:0097359) |
| 0.1 | 0.1 | GO:0045494 | photoreceptor cell maintenance(GO:0045494) |
| 0.1 | 0.8 | GO:0097201 | negative regulation of transcription from RNA polymerase II promoter in response to stress(GO:0097201) |
| 0.1 | 0.2 | GO:0048213 | Golgi vesicle prefusion complex stabilization(GO:0048213) |
| 0.1 | 0.7 | GO:0071709 | membrane assembly(GO:0071709) |
| 0.1 | 0.2 | GO:0044782 | cilium organization(GO:0044782) |
| 0.1 | 0.1 | GO:1902075 | cellular response to salt(GO:1902075) |
| 0.1 | 0.1 | GO:0010044 | response to aluminum ion(GO:0010044) |
| 0.1 | 1.4 | GO:0097120 | receptor localization to synapse(GO:0097120) |
| 0.1 | 0.3 | GO:0035090 | maintenance of apical/basal cell polarity(GO:0035090) maintenance of epithelial cell apical/basal polarity(GO:0045199) |
| 0.1 | 0.2 | GO:0007172 | signal complex assembly(GO:0007172) |
| 0.1 | 0.3 | GO:0060907 | positive regulation of macrophage cytokine production(GO:0060907) |
| 0.1 | 0.2 | GO:0035606 | peptidyl-cysteine S-trans-nitrosylation(GO:0035606) |
| 0.1 | 0.2 | GO:0060122 | inner ear receptor stereocilium organization(GO:0060122) |
| 0.1 | 0.1 | GO:0035523 | protein K29-linked deubiquitination(GO:0035523) protein K33-linked deubiquitination(GO:1990168) |
| 0.1 | 0.3 | GO:0071442 | positive regulation of histone H3-K14 acetylation(GO:0071442) |
| 0.1 | 0.2 | GO:0061626 | pharyngeal arch artery morphogenesis(GO:0061626) |
| 0.1 | 0.4 | GO:0042574 | retinal metabolic process(GO:0042574) |
| 0.1 | 0.2 | GO:0009153 | purine deoxyribonucleotide biosynthetic process(GO:0009153) |
| 0.1 | 0.6 | GO:0032515 | negative regulation of phosphoprotein phosphatase activity(GO:0032515) |
| 0.1 | 0.1 | GO:0021819 | layer formation in cerebral cortex(GO:0021819) |
| 0.1 | 1.0 | GO:0061512 | protein localization to cilium(GO:0061512) |
| 0.1 | 0.1 | GO:0014051 | gamma-aminobutyric acid secretion(GO:0014051) |
| 0.1 | 0.2 | GO:0070940 | dephosphorylation of RNA polymerase II C-terminal domain(GO:0070940) |
| 0.1 | 0.1 | GO:1901074 | regulation of engulfment of apoptotic cell(GO:1901074) |
| 0.1 | 0.2 | GO:0044501 | modulation of signal transduction in other organism(GO:0044501) modulation by symbiont of host signal transduction pathway(GO:0052027) modulation of signal transduction in other organism involved in symbiotic interaction(GO:0052250) modulation by symbiont of host I-kappaB kinase/NF-kappaB cascade(GO:0085032) |
| 0.1 | 0.3 | GO:0034128 | negative regulation of MyD88-independent toll-like receptor signaling pathway(GO:0034128) |
| 0.1 | 0.3 | GO:0097296 | activation of cysteine-type endopeptidase activity involved in apoptotic signaling pathway(GO:0097296) |
| 0.1 | 0.2 | GO:1904729 | regulation of intestinal cholesterol absorption(GO:0030300) regulation of intestinal lipid absorption(GO:1904729) |
| 0.1 | 0.1 | GO:0035634 | response to stilbenoid(GO:0035634) |
| 0.1 | 0.1 | GO:0032383 | regulation of intracellular lipid transport(GO:0032377) regulation of intracellular sterol transport(GO:0032380) regulation of intracellular cholesterol transport(GO:0032383) |
| 0.1 | 0.4 | GO:0070527 | platelet aggregation(GO:0070527) |
| 0.1 | 0.4 | GO:0007000 | nucleolus organization(GO:0007000) |
| 0.1 | 3.6 | GO:0030049 | muscle filament sliding(GO:0030049) actin-myosin filament sliding(GO:0033275) |
| 0.1 | 0.6 | GO:0016576 | histone dephosphorylation(GO:0016576) |
| 0.1 | 0.1 | GO:0071422 | succinate transport(GO:0015744) succinate transmembrane transport(GO:0071422) |
| 0.1 | 0.1 | GO:0006449 | regulation of translational termination(GO:0006449) |
| 0.1 | 0.2 | GO:0070272 | proton-transporting ATP synthase complex assembly(GO:0043461) proton-transporting ATP synthase complex biogenesis(GO:0070272) |
| 0.1 | 0.4 | GO:0038007 | netrin-activated signaling pathway(GO:0038007) |
| 0.1 | 0.5 | GO:1902412 | regulation of mitotic cytokinesis(GO:1902412) |
| 0.1 | 0.2 | GO:0007288 | sperm axoneme assembly(GO:0007288) |
| 0.1 | 0.2 | GO:0048820 | hair follicle maturation(GO:0048820) |
| 0.1 | 0.2 | GO:0051482 | positive regulation of cytosolic calcium ion concentration involved in phospholipase C-activating G-protein coupled signaling pathway(GO:0051482) |
| 0.1 | 0.4 | GO:0060628 | regulation of ER to Golgi vesicle-mediated transport(GO:0060628) |
| 0.1 | 1.0 | GO:0001941 | postsynaptic membrane organization(GO:0001941) |
| 0.1 | 1.1 | GO:0032456 | endocytic recycling(GO:0032456) |
| 0.1 | 0.2 | GO:0043407 | negative regulation of MAP kinase activity(GO:0043407) |
| 0.1 | 1.0 | GO:0090190 | positive regulation of branching involved in ureteric bud morphogenesis(GO:0090190) |
| 0.1 | 0.1 | GO:0021539 | subthalamus development(GO:0021539) |
| 0.1 | 0.1 | GO:0017062 | respiratory chain complex III assembly(GO:0017062) mitochondrial respiratory chain complex III assembly(GO:0034551) mitochondrial respiratory chain complex III biogenesis(GO:0097033) |
| 0.1 | 2.9 | GO:0007229 | integrin-mediated signaling pathway(GO:0007229) |
| 0.1 | 0.8 | GO:0099517 | anterograde synaptic vesicle transport(GO:0048490) synaptic vesicle cytoskeletal transport(GO:0099514) synaptic vesicle transport along microtubule(GO:0099517) |
| 0.1 | 0.1 | GO:0010668 | ectodermal cell differentiation(GO:0010668) |
| 0.1 | 1.0 | GO:0042572 | retinol metabolic process(GO:0042572) |
| 0.1 | 0.2 | GO:0061088 | regulation of sequestering of zinc ion(GO:0061088) |
| 0.1 | 1.2 | GO:0001578 | microtubule bundle formation(GO:0001578) |
| 0.1 | 0.3 | GO:0036158 | outer dynein arm assembly(GO:0036158) |
| 0.1 | 0.2 | GO:0010457 | centriole-centriole cohesion(GO:0010457) |
| 0.1 | 0.1 | GO:0090290 | positive regulation of osteoclast proliferation(GO:0090290) |
| 0.1 | 0.1 | GO:0030432 | peristalsis(GO:0030432) |
| 0.1 | 0.2 | GO:2000035 | regulation of stem cell division(GO:2000035) |
| 0.1 | 0.3 | GO:0034405 | response to fluid shear stress(GO:0034405) |
| 0.1 | 0.2 | GO:1902746 | regulation of lens fiber cell differentiation(GO:1902746) |
| 0.1 | 0.6 | GO:0044253 | positive regulation of collagen metabolic process(GO:0010714) positive regulation of collagen biosynthetic process(GO:0032967) positive regulation of multicellular organismal metabolic process(GO:0044253) |
| 0.1 | 0.9 | GO:0051281 | positive regulation of release of sequestered calcium ion into cytosol(GO:0051281) |
| 0.1 | 0.3 | GO:0060075 | regulation of resting membrane potential(GO:0060075) |
| 0.1 | 0.2 | GO:0032815 | negative regulation of natural killer cell activation(GO:0032815) |
| 0.1 | 0.2 | GO:0043983 | histone H4-K12 acetylation(GO:0043983) |
| 0.1 | 0.7 | GO:1901897 | regulation of relaxation of cardiac muscle(GO:1901897) |
| 0.1 | 0.2 | GO:0010735 | positive regulation of transcription via serum response element binding(GO:0010735) |
| 0.1 | 0.2 | GO:0048675 | axon extension(GO:0048675) |
| 0.1 | 0.2 | GO:2000273 | positive regulation of receptor activity(GO:2000273) |
| 0.1 | 0.1 | GO:0051957 | positive regulation of amino acid transport(GO:0051957) |
| 0.1 | 0.9 | GO:0019934 | cGMP-mediated signaling(GO:0019934) |
| 0.1 | 2.6 | GO:0030516 | regulation of axon extension(GO:0030516) |
| 0.1 | 0.1 | GO:2000562 | negative regulation of CD4-positive, alpha-beta T cell proliferation(GO:2000562) |
| 0.1 | 0.1 | GO:0050917 | sensory perception of umami taste(GO:0050917) |
| 0.1 | 0.1 | GO:0033025 | mast cell homeostasis(GO:0033023) mast cell apoptotic process(GO:0033024) regulation of mast cell apoptotic process(GO:0033025) |
| 0.1 | 0.4 | GO:0071569 | protein ufmylation(GO:0071569) |
| 0.1 | 1.2 | GO:0007041 | lysosomal transport(GO:0007041) |
| 0.1 | 0.2 | GO:0060011 | Sertoli cell proliferation(GO:0060011) |
| 0.1 | 0.3 | GO:2000158 | positive regulation of ubiquitin-specific protease activity(GO:2000158) |
| 0.1 | 0.4 | GO:0071545 | inositol phosphate catabolic process(GO:0071545) |
| 0.0 | 2.1 | GO:0070979 | protein K11-linked ubiquitination(GO:0070979) |
| 0.0 | 0.2 | GO:1903276 | regulation of sodium ion export(GO:1903273) positive regulation of sodium ion export(GO:1903275) regulation of sodium ion export from cell(GO:1903276) positive regulation of sodium ion export from cell(GO:1903278) |
| 0.0 | 0.2 | GO:0071476 | hypotonic response(GO:0006971) hypotonic salinity response(GO:0042539) cellular hypotonic response(GO:0071476) cellular hypotonic salinity response(GO:0071477) |
| 0.0 | 0.7 | GO:1901385 | regulation of voltage-gated calcium channel activity(GO:1901385) |
| 0.0 | 0.0 | GO:2000381 | negative regulation of mesoderm development(GO:2000381) |
| 0.0 | 0.2 | GO:0051155 | positive regulation of striated muscle cell differentiation(GO:0051155) |
| 0.0 | 0.1 | GO:0051533 | positive regulation of NFAT protein import into nucleus(GO:0051533) |
| 0.0 | 0.3 | GO:0032468 | Golgi calcium ion homeostasis(GO:0032468) |
| 0.0 | 0.3 | GO:0070221 | sulfide oxidation(GO:0019418) sulfide oxidation, using sulfide:quinone oxidoreductase(GO:0070221) |
| 0.0 | 0.3 | GO:0060746 | maternal behavior(GO:0042711) parental behavior(GO:0060746) |
| 0.0 | 0.5 | GO:0034204 | lipid translocation(GO:0034204) phospholipid translocation(GO:0045332) |
| 0.0 | 0.2 | GO:0099638 | neurotransmitter receptor transport, endosome to postsynaptic membrane(GO:0098887) endosome to plasma membrane protein transport(GO:0099638) neurotransmitter receptor transport, endosome to plasma membrane(GO:0099639) |
| 0.0 | 0.6 | GO:0050482 | arachidonic acid secretion(GO:0050482) arachidonate transport(GO:1903963) |
| 0.0 | 0.1 | GO:0034380 | high-density lipoprotein particle assembly(GO:0034380) |
| 0.0 | 0.3 | GO:0000132 | establishment of mitotic spindle orientation(GO:0000132) |
| 0.0 | 1.0 | GO:0007216 | G-protein coupled glutamate receptor signaling pathway(GO:0007216) |
| 0.0 | 0.3 | GO:0006693 | prostanoid metabolic process(GO:0006692) prostaglandin metabolic process(GO:0006693) |
| 0.0 | 0.1 | GO:0045575 | basophil activation involved in immune response(GO:0002276) basophil activation(GO:0045575) |
| 0.0 | 0.0 | GO:0044828 | negative regulation by host of viral genome replication(GO:0044828) |
| 0.0 | 0.3 | GO:0019372 | lipoxygenase pathway(GO:0019372) |
| 0.0 | 0.3 | GO:0051642 | centrosome localization(GO:0051642) |
| 0.0 | 0.2 | GO:0045161 | neuronal ion channel clustering(GO:0045161) |
| 0.0 | 0.2 | GO:0015812 | gamma-aminobutyric acid transport(GO:0015812) |
| 0.0 | 1.0 | GO:0000301 | retrograde transport, vesicle recycling within Golgi(GO:0000301) |
| 0.0 | 0.2 | GO:0061217 | regulation of mesonephros development(GO:0061217) |
| 0.0 | 0.5 | GO:0006032 | chitin metabolic process(GO:0006030) chitin catabolic process(GO:0006032) |
| 0.0 | 0.4 | GO:0043162 | ubiquitin-dependent protein catabolic process via the multivesicular body sorting pathway(GO:0043162) |
| 0.0 | 0.4 | GO:0051386 | regulation of neurotrophin TRK receptor signaling pathway(GO:0051386) |
| 0.0 | 0.1 | GO:0042727 | flavin-containing compound biosynthetic process(GO:0042727) |
| 0.0 | 0.5 | GO:0009313 | oligosaccharide catabolic process(GO:0009313) |
| 0.0 | 0.0 | GO:1900102 | negative regulation of endoplasmic reticulum unfolded protein response(GO:1900102) |
| 0.0 | 0.4 | GO:0035860 | glial cell-derived neurotrophic factor receptor signaling pathway(GO:0035860) |
| 0.0 | 2.1 | GO:0048208 | vesicle coating(GO:0006901) vesicle targeting, rough ER to cis-Golgi(GO:0048207) COPII vesicle coating(GO:0048208) |
| 0.0 | 0.1 | GO:0045647 | negative regulation of erythrocyte differentiation(GO:0045647) |
| 0.0 | 0.1 | GO:0060452 | positive regulation of cardiac muscle contraction(GO:0060452) |
| 0.0 | 0.1 | GO:0006524 | alanine metabolic process(GO:0006522) alanine catabolic process(GO:0006524) pyruvate family amino acid metabolic process(GO:0009078) pyruvate family amino acid catabolic process(GO:0009080) |
| 0.0 | 0.9 | GO:0016254 | preassembly of GPI anchor in ER membrane(GO:0016254) |
| 0.0 | 0.3 | GO:0034587 | piRNA metabolic process(GO:0034587) |
| 0.0 | 0.3 | GO:0036111 | very long-chain fatty-acyl-CoA metabolic process(GO:0036111) |
| 0.0 | 0.1 | GO:1900227 | positive regulation of NLRP3 inflammasome complex assembly(GO:1900227) |
| 0.0 | 0.3 | GO:0034394 | protein localization to cell surface(GO:0034394) |
| 0.0 | 0.1 | GO:0014887 | muscle hypertrophy in response to stress(GO:0003299) cardiac muscle adaptation(GO:0014887) cardiac muscle hypertrophy in response to stress(GO:0014898) |
| 0.0 | 0.2 | GO:0002667 | lymphocyte anergy(GO:0002249) regulation of T cell anergy(GO:0002667) T cell anergy(GO:0002870) regulation of lymphocyte anergy(GO:0002911) |
| 0.0 | 1.5 | GO:0007032 | endosome organization(GO:0007032) |
| 0.0 | 0.8 | GO:0046597 | negative regulation of viral entry into host cell(GO:0046597) |
| 0.0 | 0.4 | GO:0018026 | peptidyl-lysine monomethylation(GO:0018026) |
| 0.0 | 0.5 | GO:0034384 | high-density lipoprotein particle clearance(GO:0034384) |
| 0.0 | 0.2 | GO:0048280 | vesicle fusion with Golgi apparatus(GO:0048280) |
| 0.0 | 0.2 | GO:0060965 | negative regulation of gene silencing by miRNA(GO:0060965) |
| 0.0 | 0.1 | GO:0061107 | seminal vesicle development(GO:0061107) |
| 0.0 | 0.3 | GO:0002098 | tRNA wobble uridine modification(GO:0002098) |
| 0.0 | 0.1 | GO:2000846 | corticosteroid hormone secretion(GO:0035930) regulation of corticosteroid hormone secretion(GO:2000846) |
| 0.0 | 0.2 | GO:0070544 | histone H3-K36 demethylation(GO:0070544) |
| 0.0 | 5.3 | GO:0007266 | Rho protein signal transduction(GO:0007266) |
| 0.0 | 0.1 | GO:0072248 | metanephric glomerular epithelium development(GO:0072244) metanephric glomerular visceral epithelial cell differentiation(GO:0072248) metanephric glomerular visceral epithelial cell development(GO:0072249) metanephric glomerular epithelial cell differentiation(GO:0072312) metanephric glomerular epithelial cell development(GO:0072313) |
| 0.0 | 0.6 | GO:0018298 | protein-chromophore linkage(GO:0018298) |
| 0.0 | 0.5 | GO:0042461 | photoreceptor cell development(GO:0042461) |
| 0.0 | 0.2 | GO:0098792 | xenophagy(GO:0098792) |
| 0.0 | 0.2 | GO:0017182 | peptidyl-diphthamide metabolic process(GO:0017182) peptidyl-diphthamide biosynthetic process from peptidyl-histidine(GO:0017183) peptidyl-histidine modification(GO:0018202) |
| 0.0 | 0.1 | GO:0010936 | negative regulation of macrophage cytokine production(GO:0010936) |
| 0.0 | 0.1 | GO:1902235 | regulation of endoplasmic reticulum stress-induced intrinsic apoptotic signaling pathway(GO:1902235) |
| 0.0 | 0.7 | GO:0050427 | purine ribonucleoside bisphosphate metabolic process(GO:0034035) 3'-phosphoadenosine 5'-phosphosulfate metabolic process(GO:0050427) |
| 0.0 | 0.1 | GO:0003016 | respiratory system process(GO:0003016) |
| 0.0 | 0.2 | GO:0098828 | positive regulation of inhibitory postsynaptic potential(GO:0097151) modulation of inhibitory postsynaptic potential(GO:0098828) |
| 0.0 | 0.1 | GO:0098935 | dendritic transport(GO:0098935) anterograde dendritic transport(GO:0098937) |
| 0.0 | 0.1 | GO:0019287 | isopentenyl diphosphate biosynthetic process, mevalonate pathway(GO:0019287) |
| 0.0 | 0.1 | GO:0007023 | post-chaperonin tubulin folding pathway(GO:0007023) |
| 0.0 | 0.8 | GO:0035036 | sperm-egg recognition(GO:0035036) |
| 0.0 | 0.2 | GO:0006777 | Mo-molybdopterin cofactor biosynthetic process(GO:0006777) Mo-molybdopterin cofactor metabolic process(GO:0019720) |
| 0.0 | 0.4 | GO:0071625 | vocalization behavior(GO:0071625) |
| 0.0 | 0.0 | GO:0045918 | negative regulation of cytolysis(GO:0045918) |
| 0.0 | 0.1 | GO:0060073 | micturition(GO:0060073) |
| 0.0 | 0.1 | GO:0002254 | kinin cascade(GO:0002254) plasma kallikrein-kinin cascade(GO:0002353) |
| 0.0 | 0.2 | GO:0046475 | glycerophospholipid catabolic process(GO:0046475) |
| 0.0 | 0.1 | GO:0043586 | tongue development(GO:0043586) |
| 0.0 | 0.0 | GO:0044026 | DNA hypermethylation(GO:0044026) |
| 0.0 | 0.3 | GO:0038203 | TORC2 signaling(GO:0038203) |
| 0.0 | 0.0 | GO:0071557 | histone H3-K27 demethylation(GO:0071557) |
| 0.0 | 0.3 | GO:0019432 | triglyceride biosynthetic process(GO:0019432) |
| 0.0 | 0.8 | GO:0045600 | positive regulation of fat cell differentiation(GO:0045600) |
| 0.0 | 0.1 | GO:0000393 | spliceosomal conformational changes to generate catalytic conformation(GO:0000393) |
| 0.0 | 0.1 | GO:0036159 | inner dynein arm assembly(GO:0036159) |
| 0.0 | 0.2 | GO:0071285 | cellular response to lithium ion(GO:0071285) |
| 0.0 | 0.1 | GO:0043653 | mitochondrial fragmentation involved in apoptotic process(GO:0043653) |
| 0.0 | 0.3 | GO:0019068 | virion assembly(GO:0019068) |
| 0.0 | 0.2 | GO:0045905 | translational frameshifting(GO:0006452) positive regulation of translational termination(GO:0045905) |
| 0.0 | 0.3 | GO:0000715 | nucleotide-excision repair, DNA damage recognition(GO:0000715) |
| 0.0 | 0.1 | GO:0031666 | positive regulation of lipopolysaccharide-mediated signaling pathway(GO:0031666) |
| 0.0 | 0.0 | GO:0043652 | engulfment of apoptotic cell(GO:0043652) |
| 0.0 | 0.6 | GO:1901687 | glutathione derivative metabolic process(GO:1901685) glutathione derivative biosynthetic process(GO:1901687) |
| 0.0 | 1.0 | GO:0061053 | somite development(GO:0061053) |
| 0.0 | 0.4 | GO:0034332 | adherens junction organization(GO:0034332) |
| 0.0 | 0.6 | GO:0071377 | cellular response to glucagon stimulus(GO:0071377) |
| 0.0 | 0.2 | GO:0002933 | lipid hydroxylation(GO:0002933) |
| 0.0 | 0.5 | GO:0006458 | 'de novo' protein folding(GO:0006458) |
| 0.0 | 0.2 | GO:0051415 | interphase microtubule nucleation by interphase microtubule organizing center(GO:0051415) microtubule nucleation by microtubule organizing center(GO:0051418) |
| 0.0 | 0.1 | GO:1904430 | negative regulation of t-circle formation(GO:1904430) |
| 0.0 | 0.1 | GO:0060294 | cilium movement involved in cell motility(GO:0060294) |
| 0.0 | 0.1 | GO:1902916 | positive regulation of protein polyubiquitination(GO:1902916) |
| 0.0 | 0.1 | GO:0021983 | pituitary gland development(GO:0021983) |
| 0.0 | 0.1 | GO:2000270 | negative regulation of fibroblast apoptotic process(GO:2000270) |
| 0.0 | 0.1 | GO:0045836 | positive regulation of meiotic nuclear division(GO:0045836) |
| 0.0 | 0.1 | GO:0035915 | pore formation in membrane of other organism(GO:0035915) |
| 0.0 | 0.1 | GO:0006026 | aminoglycan catabolic process(GO:0006026) |
| 0.0 | 0.3 | GO:0032196 | transposition(GO:0032196) |
| 0.0 | 0.1 | GO:0072402 | response to cell cycle checkpoint signaling(GO:0072396) response to DNA integrity checkpoint signaling(GO:0072402) response to DNA damage checkpoint signaling(GO:0072423) |
| 0.0 | 0.2 | GO:0060117 | auditory receptor cell development(GO:0060117) |
| 0.0 | 0.2 | GO:0070995 | NADPH oxidation(GO:0070995) |
| 0.0 | 0.0 | GO:2000049 | positive regulation of cell-cell adhesion mediated by cadherin(GO:2000049) |
| 0.0 | 0.0 | GO:1904781 | positive regulation of protein localization to centrosome(GO:1904781) |
| 0.0 | 0.0 | GO:0090149 | mitochondrial membrane fission(GO:0090149) |
| 0.0 | 0.3 | GO:0009268 | response to pH(GO:0009268) |
| 0.0 | 0.3 | GO:0071470 | cellular response to osmotic stress(GO:0071470) |
| 0.0 | 0.0 | GO:0021797 | forebrain anterior/posterior pattern specification(GO:0021797) |
| 0.0 | 0.1 | GO:0043402 | glucocorticoid mediated signaling pathway(GO:0043402) |
| 0.0 | 0.4 | GO:0042149 | cellular response to glucose starvation(GO:0042149) |
| 0.0 | 0.2 | GO:0003091 | renal water homeostasis(GO:0003091) |
| 0.0 | 0.2 | GO:0046133 | pyrimidine ribonucleoside catabolic process(GO:0046133) |
| 0.0 | 0.2 | GO:0060008 | Sertoli cell differentiation(GO:0060008) |
| 0.0 | 0.1 | GO:1903070 | negative regulation of ER-associated ubiquitin-dependent protein catabolic process(GO:1903070) |
| 0.0 | 0.1 | GO:2000660 | negative regulation of interleukin-1-mediated signaling pathway(GO:2000660) |
| 0.0 | 0.0 | GO:0000294 | nuclear-transcribed mRNA catabolic process, endonucleolytic cleavage-dependent decay(GO:0000294) |
| 0.0 | 0.1 | GO:0051905 | pigment granule localization(GO:0051875) pigment granule transport(GO:0051904) establishment of pigment granule localization(GO:0051905) |
| 0.0 | 0.1 | GO:0048698 | collateral sprouting in absence of injury(GO:0048669) regulation of collateral sprouting in absence of injury(GO:0048696) negative regulation of collateral sprouting in absence of injury(GO:0048698) |
| 0.0 | 0.1 | GO:0071839 | apoptotic process in bone marrow(GO:0071839) |
| 0.0 | 0.1 | GO:0060219 | camera-type eye photoreceptor cell differentiation(GO:0060219) |
| 0.0 | 0.2 | GO:0034312 | diol biosynthetic process(GO:0034312) sphingosine biosynthetic process(GO:0046512) sphingoid biosynthetic process(GO:0046520) |
| 0.0 | 0.1 | GO:2000510 | positive regulation of dendritic cell chemotaxis(GO:2000510) |
| 0.0 | 0.1 | GO:0070131 | positive regulation of mitochondrial translation(GO:0070131) |
| 0.0 | 0.3 | GO:0032780 | negative regulation of ATPase activity(GO:0032780) |
| 0.0 | 0.1 | GO:0043619 | regulation of transcription from RNA polymerase II promoter in response to oxidative stress(GO:0043619) |
| 0.0 | 0.1 | GO:0040016 | embryonic cleavage(GO:0040016) |
| 0.0 | 0.8 | GO:0043252 | sodium-independent organic anion transport(GO:0043252) |
| 0.0 | 0.1 | GO:1903385 | regulation of homophilic cell adhesion(GO:1903385) |
| 0.0 | 0.1 | GO:0099590 | neurotransmitter receptor internalization(GO:0099590) |
| 0.0 | 0.1 | GO:0006617 | SRP-dependent cotranslational protein targeting to membrane, signal sequence recognition(GO:0006617) |
| 0.0 | 0.3 | GO:0002089 | lens morphogenesis in camera-type eye(GO:0002089) |
| 0.0 | 0.1 | GO:0043950 | positive regulation of cAMP-mediated signaling(GO:0043950) |
| 0.0 | 0.1 | GO:0006780 | uroporphyrinogen III biosynthetic process(GO:0006780) uroporphyrinogen III metabolic process(GO:0046502) |
| 0.0 | 0.1 | GO:0032100 | positive regulation of response to food(GO:0032097) positive regulation of appetite(GO:0032100) |
| 0.0 | 0.1 | GO:0046085 | adenosine metabolic process(GO:0046085) |
| 0.0 | 0.1 | GO:0061072 | iris morphogenesis(GO:0061072) |
| 0.0 | 0.6 | GO:0050909 | sensory perception of taste(GO:0050909) |
| 0.0 | 0.0 | GO:2000543 | positive regulation of gastrulation(GO:2000543) |
| 0.0 | 0.4 | GO:0006957 | complement activation, alternative pathway(GO:0006957) |
| 0.0 | 0.1 | GO:0001766 | membrane raft polarization(GO:0001766) membrane raft distribution(GO:0031580) |
| 0.0 | 0.2 | GO:0042573 | retinoic acid metabolic process(GO:0042573) |
| 0.0 | 0.2 | GO:0048245 | eosinophil chemotaxis(GO:0048245) |
| 0.0 | 0.2 | GO:0045662 | negative regulation of myoblast differentiation(GO:0045662) |
| 0.0 | 0.1 | GO:0051725 | protein de-ADP-ribosylation(GO:0051725) |
| 0.0 | 0.1 | GO:0045591 | positive regulation of regulatory T cell differentiation(GO:0045591) |
| 0.0 | 0.1 | GO:0036444 | calcium ion transmembrane import into mitochondrion(GO:0036444) |
| 0.0 | 0.0 | GO:0042369 | vitamin D catabolic process(GO:0042369) |
| 0.0 | 0.0 | GO:0007039 | protein catabolic process in the vacuole(GO:0007039) |
| 0.0 | 0.2 | GO:0052695 | cellular glucuronidation(GO:0052695) |
| 0.0 | 0.0 | GO:0045116 | protein neddylation(GO:0045116) |
| 0.0 | 0.1 | GO:0070212 | protein poly-ADP-ribosylation(GO:0070212) |
| 0.0 | 0.1 | GO:0035434 | copper ion transmembrane transport(GO:0035434) |
| 0.0 | 0.1 | GO:0097435 | fibril organization(GO:0097435) |
| 0.0 | 0.0 | GO:0002778 | antimicrobial peptide production(GO:0002775) antibacterial peptide production(GO:0002778) |
| 0.0 | 0.1 | GO:1903514 | release of sequestered calcium ion into cytosol by sarcoplasmic reticulum(GO:0014808) calcium ion transport from endoplasmic reticulum to cytosol(GO:1903514) |
| 0.0 | 0.0 | GO:0001893 | maternal placenta development(GO:0001893) |
| 0.0 | 0.1 | GO:0060602 | branch elongation of an epithelium(GO:0060602) |
| 0.0 | 0.0 | GO:0070837 | dehydroascorbic acid transport(GO:0070837) |
| 0.0 | 0.2 | GO:0060444 | branching involved in mammary gland duct morphogenesis(GO:0060444) |
| 0.0 | 0.1 | GO:0045821 | positive regulation of glycolytic process(GO:0045821) positive regulation of cofactor metabolic process(GO:0051194) positive regulation of coenzyme metabolic process(GO:0051197) |
| 0.0 | 0.0 | GO:0016559 | peroxisome fission(GO:0016559) |
| 0.0 | 0.1 | GO:0014909 | smooth muscle cell migration(GO:0014909) |
| 0.0 | 0.0 | GO:0042634 | regulation of hair cycle(GO:0042634) |
| 0.0 | 0.0 | GO:0043988 | histone H3-S28 phosphorylation(GO:0043988) |
| 0.0 | 0.1 | GO:0071394 | cellular response to testosterone stimulus(GO:0071394) |
| 0.0 | 0.2 | GO:0006636 | unsaturated fatty acid biosynthetic process(GO:0006636) |
| 0.0 | 0.0 | GO:0002384 | hepatic immune response(GO:0002384) |
| 0.0 | 0.1 | GO:0032148 | activation of protein kinase B activity(GO:0032148) |
| 0.0 | 0.0 | GO:0038180 | nerve growth factor signaling pathway(GO:0038180) |
| 0.0 | 0.0 | GO:0030242 | pexophagy(GO:0030242) |
| 0.0 | 0.1 | GO:0044557 | relaxation of smooth muscle(GO:0044557) relaxation of vascular smooth muscle(GO:0060087) |
| 0.0 | 0.1 | GO:0048278 | vesicle docking(GO:0048278) |
| 0.0 | 0.0 | GO:0035136 | forelimb morphogenesis(GO:0035136) |
| 0.0 | 0.0 | GO:0010726 | positive regulation of hydrogen peroxide metabolic process(GO:0010726) |
| 0.0 | 0.0 | GO:0052803 | histidine metabolic process(GO:0006547) imidazole-containing compound metabolic process(GO:0052803) |
| 0.0 | 0.1 | GO:0070475 | rRNA base methylation(GO:0070475) |
| 0.0 | 0.1 | GO:0035873 | lactate transport(GO:0015727) lactate transmembrane transport(GO:0035873) |
| 0.0 | 0.3 | GO:0050690 | regulation of defense response to virus by virus(GO:0050690) |
| 0.0 | 0.0 | GO:1903012 | positive regulation of bone development(GO:1903012) positive regulation of osteoclast development(GO:2001206) |
| 0.0 | 0.1 | GO:0018344 | protein geranylgeranylation(GO:0018344) |
| 0.0 | 0.1 | GO:0030277 | maintenance of gastrointestinal epithelium(GO:0030277) |
| 0.0 | 0.2 | GO:0007622 | rhythmic behavior(GO:0007622) |
| 0.0 | 0.0 | GO:0001951 | intestinal D-glucose absorption(GO:0001951) |
| 0.0 | 0.0 | GO:0032497 | detection of lipopolysaccharide(GO:0032497) |
| 0.0 | 0.0 | GO:0007320 | insemination(GO:0007320) |
| 0.0 | 0.0 | GO:1900738 | regulation of phospholipase C-activating G-protein coupled receptor signaling pathway(GO:1900736) positive regulation of phospholipase C-activating G-protein coupled receptor signaling pathway(GO:1900738) |
| 0.0 | 0.2 | GO:0000002 | mitochondrial genome maintenance(GO:0000002) |
| 0.0 | 0.1 | GO:0032785 | negative regulation of DNA-templated transcription, elongation(GO:0032785) negative regulation of transcription elongation from RNA polymerase II promoter(GO:0034244) |
| 0.0 | 0.1 | GO:0006703 | estrogen biosynthetic process(GO:0006703) |
| 0.0 | 0.0 | GO:0071380 | cellular response to prostaglandin E stimulus(GO:0071380) |
Gene overrepresentation in cellular_component category:
| Log-likelihood per target | Total log-likelihood | Term | Description |
|---|---|---|---|
| 1.9 | 5.7 | GO:0034676 | integrin alpha6-beta4 complex(GO:0034676) |
| 1.1 | 15.5 | GO:0034098 | VCP-NPL4-UFD1 AAA ATPase complex(GO:0034098) |
| 1.1 | 4.2 | GO:0043260 | laminin-11 complex(GO:0043260) |
| 0.9 | 2.8 | GO:0005588 | collagen type V trimer(GO:0005588) |
| 0.8 | 2.5 | GO:0034667 | integrin alpha3-beta1 complex(GO:0034667) |
| 0.8 | 3.2 | GO:0070695 | FHF complex(GO:0070695) |
| 0.7 | 2.2 | GO:0070557 | PCNA-p21 complex(GO:0070557) |
| 0.7 | 4.6 | GO:0035692 | macrophage migration inhibitory factor receptor complex(GO:0035692) |
| 0.6 | 6.9 | GO:0005614 | interstitial matrix(GO:0005614) |
| 0.5 | 4.1 | GO:1990761 | growth cone lamellipodium(GO:1990761) growth cone filopodium(GO:1990812) |
| 0.4 | 2.9 | GO:0035976 | AP1 complex(GO:0035976) |
| 0.3 | 4.4 | GO:0033643 | host cell part(GO:0033643) |
| 0.3 | 0.7 | GO:0001533 | cornified envelope(GO:0001533) |
| 0.3 | 1.6 | GO:1990425 | ryanodine receptor complex(GO:1990425) |
| 0.3 | 3.1 | GO:0097443 | sorting endosome(GO:0097443) |
| 0.3 | 5.5 | GO:0005862 | muscle thin filament tropomyosin(GO:0005862) |
| 0.3 | 2.0 | GO:0098554 | cytoplasmic side of endoplasmic reticulum membrane(GO:0098554) |
| 0.3 | 4.2 | GO:0005916 | fascia adherens(GO:0005916) |
| 0.3 | 0.8 | GO:0016222 | procollagen-proline 4-dioxygenase complex(GO:0016222) |
| 0.2 | 7.7 | GO:0031092 | platelet alpha granule membrane(GO:0031092) |
| 0.2 | 1.7 | GO:0071438 | invadopodium membrane(GO:0071438) |
| 0.2 | 2.1 | GO:0005915 | zonula adherens(GO:0005915) |
| 0.2 | 0.8 | GO:0005896 | interleukin-6 receptor complex(GO:0005896) |
| 0.2 | 0.6 | GO:0002081 | outer acrosomal membrane(GO:0002081) |
| 0.2 | 0.8 | GO:0031166 | integral component of vacuolar membrane(GO:0031166) |
| 0.2 | 0.8 | GO:0031211 | serine C-palmitoyltransferase complex(GO:0017059) endoplasmic reticulum palmitoyltransferase complex(GO:0031211) |
| 0.2 | 0.9 | GO:0097513 | myosin II filament(GO:0097513) |
| 0.2 | 2.9 | GO:0032433 | filopodium tip(GO:0032433) |
| 0.2 | 3.6 | GO:0031588 | nucleotide-activated protein kinase complex(GO:0031588) |
| 0.2 | 2.6 | GO:0017146 | NMDA selective glutamate receptor complex(GO:0017146) |
| 0.2 | 5.2 | GO:0005680 | anaphase-promoting complex(GO:0005680) |
| 0.2 | 0.5 | GO:0005607 | laminin-2 complex(GO:0005607) |
| 0.2 | 0.8 | GO:0097149 | centralspindlin complex(GO:0097149) |
| 0.2 | 3.5 | GO:0001527 | microfibril(GO:0001527) fibril(GO:0043205) |
| 0.2 | 0.8 | GO:0071986 | Ragulator complex(GO:0071986) |
| 0.1 | 0.9 | GO:0000138 | Golgi trans cisterna(GO:0000138) |
| 0.1 | 7.5 | GO:0002102 | podosome(GO:0002102) |
| 0.1 | 1.4 | GO:0016011 | dystroglycan complex(GO:0016011) |
| 0.1 | 4.4 | GO:0042101 | T cell receptor complex(GO:0042101) |
| 0.1 | 0.4 | GO:0042765 | GPI-anchor transamidase complex(GO:0042765) |
| 0.1 | 1.6 | GO:0005833 | hemoglobin complex(GO:0005833) |
| 0.1 | 9.4 | GO:0043195 | terminal bouton(GO:0043195) |
| 0.1 | 1.3 | GO:0031209 | SCAR complex(GO:0031209) |
| 0.1 | 1.1 | GO:0009925 | basal plasma membrane(GO:0009925) |
| 0.1 | 1.8 | GO:0030056 | hemidesmosome(GO:0030056) |
| 0.1 | 2.3 | GO:0031233 | intrinsic component of external side of plasma membrane(GO:0031233) |
| 0.1 | 0.3 | GO:0044609 | DBIRD complex(GO:0044609) |
| 0.1 | 0.6 | GO:0097442 | CA3 pyramidal cell dendrite(GO:0097442) |
| 0.1 | 2.2 | GO:0031143 | pseudopodium(GO:0031143) |
| 0.1 | 0.3 | GO:0043196 | varicosity(GO:0043196) |
| 0.1 | 0.6 | GO:0070852 | cell body fiber(GO:0070852) |
| 0.1 | 2.1 | GO:0008074 | guanylate cyclase complex, soluble(GO:0008074) |
| 0.1 | 0.1 | GO:0005826 | actomyosin contractile ring(GO:0005826) |
| 0.1 | 0.6 | GO:0035749 | myelin sheath adaxonal region(GO:0035749) |
| 0.1 | 0.5 | GO:0016342 | catenin complex(GO:0016342) |
| 0.1 | 1.7 | GO:0030127 | COPII vesicle coat(GO:0030127) |
| 0.1 | 0.4 | GO:0002193 | MAML1-RBP-Jkappa- ICN1 complex(GO:0002193) |
| 0.1 | 0.3 | GO:0005602 | complement component C1 complex(GO:0005602) |
| 0.1 | 0.3 | GO:0000333 | telomerase catalytic core complex(GO:0000333) |
| 0.1 | 6.2 | GO:0005913 | cell-cell adherens junction(GO:0005913) |
| 0.1 | 1.1 | GO:0016010 | dystrophin-associated glycoprotein complex(GO:0016010) glycoprotein complex(GO:0090665) |
| 0.1 | 1.8 | GO:0016327 | apicolateral plasma membrane(GO:0016327) |
| 0.1 | 0.4 | GO:0097227 | sperm annulus(GO:0097227) |
| 0.1 | 4.0 | GO:0097610 | cleavage furrow(GO:0032154) cell surface furrow(GO:0097610) |
| 0.1 | 0.3 | GO:0008537 | proteasome activator complex(GO:0008537) |
| 0.1 | 0.6 | GO:0097197 | tetraspanin-enriched microdomain(GO:0097197) |
| 0.1 | 4.6 | GO:0042734 | presynaptic membrane(GO:0042734) |
| 0.1 | 7.7 | GO:0043204 | perikaryon(GO:0043204) |
| 0.1 | 6.6 | GO:0005796 | Golgi lumen(GO:0005796) |
| 0.0 | 1.2 | GO:0031430 | M band(GO:0031430) |
| 0.0 | 0.5 | GO:0030478 | actin cap(GO:0030478) |
| 0.0 | 1.7 | GO:0005859 | muscle myosin complex(GO:0005859) |
| 0.0 | 0.5 | GO:0033391 | chromatoid body(GO:0033391) |
| 0.0 | 0.4 | GO:0030126 | COPI vesicle coat(GO:0030126) |
| 0.0 | 6.4 | GO:0055037 | recycling endosome(GO:0055037) |
| 0.0 | 0.6 | GO:0030496 | midbody(GO:0030496) |
| 0.0 | 0.5 | GO:0005869 | dynactin complex(GO:0005869) |
| 0.0 | 0.2 | GO:0098552 | side of membrane(GO:0098552) |
| 0.0 | 1.4 | GO:0012507 | ER to Golgi transport vesicle membrane(GO:0012507) |
| 0.0 | 0.2 | GO:0043194 | axon initial segment(GO:0043194) |
| 0.0 | 0.2 | GO:0097209 | epidermal lamellar body(GO:0097209) |
| 0.0 | 0.1 | GO:0030663 | COPI-coated vesicle membrane(GO:0030663) |
| 0.0 | 0.5 | GO:0045009 | melanosome membrane(GO:0033162) chitosome(GO:0045009) |
| 0.0 | 2.4 | GO:0035580 | specific granule lumen(GO:0035580) |
| 0.0 | 2.0 | GO:0035577 | azurophil granule membrane(GO:0035577) |
| 0.0 | 0.7 | GO:0005861 | troponin complex(GO:0005861) |
| 0.0 | 0.7 | GO:0030673 | axolemma(GO:0030673) |
| 0.0 | 0.2 | GO:0042719 | mitochondrial intermembrane space protein transporter complex(GO:0042719) |
| 0.0 | 0.4 | GO:0000124 | SAGA complex(GO:0000124) |
| 0.0 | 1.2 | GO:0005834 | heterotrimeric G-protein complex(GO:0005834) |
| 0.0 | 0.3 | GO:0001673 | nuclear nucleosome(GO:0000788) male germ cell nucleus(GO:0001673) |
| 0.0 | 1.3 | GO:0000307 | cyclin-dependent protein kinase holoenzyme complex(GO:0000307) |
| 0.0 | 1.1 | GO:0005604 | basement membrane(GO:0005604) |
| 0.0 | 1.1 | GO:0030864 | cortical actin cytoskeleton(GO:0030864) |
| 0.0 | 2.2 | GO:0032587 | ruffle membrane(GO:0032587) |
| 0.0 | 1.3 | GO:0005811 | lipid particle(GO:0005811) |
| 0.0 | 0.2 | GO:0072546 | ER membrane protein complex(GO:0072546) |
| 0.0 | 0.4 | GO:0071013 | catalytic step 2 spliceosome(GO:0071013) |
| 0.0 | 0.6 | GO:0044322 | endoplasmic reticulum quality control compartment(GO:0044322) |
| 0.0 | 0.4 | GO:0019897 | extrinsic component of plasma membrane(GO:0019897) |
| 0.0 | 2.5 | GO:0005802 | trans-Golgi network(GO:0005802) |
| 0.0 | 0.6 | GO:0030669 | clathrin-coated endocytic vesicle membrane(GO:0030669) |
| 0.0 | 0.3 | GO:0034451 | centriolar satellite(GO:0034451) |
| 0.0 | 4.9 | GO:0005788 | endoplasmic reticulum lumen(GO:0005788) |
| 0.0 | 0.1 | GO:0008282 | ATP-sensitive potassium channel complex(GO:0008282) |
| 0.0 | 0.2 | GO:0033116 | endoplasmic reticulum-Golgi intermediate compartment membrane(GO:0033116) |
| 0.0 | 0.1 | GO:0033269 | internode region of axon(GO:0033269) |
| 0.0 | 0.6 | GO:0031256 | leading edge membrane(GO:0031256) |
| 0.0 | 0.2 | GO:0044295 | axonal growth cone(GO:0044295) |
| 0.0 | 0.4 | GO:0031307 | integral component of mitochondrial outer membrane(GO:0031307) |
| 0.0 | 0.4 | GO:0000421 | autophagosome membrane(GO:0000421) |
| 0.0 | 0.3 | GO:0000930 | gamma-tubulin complex(GO:0000930) |
| 0.0 | 0.2 | GO:0031235 | intrinsic component of the cytoplasmic side of the plasma membrane(GO:0031235) |
| 0.0 | 5.6 | GO:0030055 | cell-substrate junction(GO:0030055) |
| 0.0 | 0.3 | GO:0051233 | spindle midzone(GO:0051233) |
| 0.0 | 0.1 | GO:0036038 | MKS complex(GO:0036038) |
| 0.0 | 0.0 | GO:0098839 | postsynaptic density membrane(GO:0098839) |
| 0.0 | 0.5 | GO:0060170 | ciliary membrane(GO:0060170) |
Gene overrepresentation in molecular_function category:
| Log-likelihood per target | Total log-likelihood | Term | Description |
|---|---|---|---|
| 1.4 | 4.3 | GO:0047757 | chondroitin-glucuronate 5-epimerase activity(GO:0047757) |
| 0.4 | 2.0 | GO:0086075 | gap junction channel activity involved in cardiac conduction electrical coupling(GO:0086075) |
| 0.3 | 1.0 | GO:0004618 | phosphoglycerate kinase activity(GO:0004618) |
| 0.3 | 1.0 | GO:0032089 | NACHT domain binding(GO:0032089) |
| 0.3 | 1.6 | GO:0046979 | TAP2 binding(GO:0046979) |
| 0.3 | 0.8 | GO:0001665 | alpha-N-acetylgalactosaminide alpha-2,6-sialyltransferase activity(GO:0001665) |
| 0.2 | 1.2 | GO:0060961 | phospholipase D inhibitor activity(GO:0060961) |
| 0.2 | 1.2 | GO:0004771 | sterol esterase activity(GO:0004771) |
| 0.2 | 0.2 | GO:0016846 | carbon-sulfur lyase activity(GO:0016846) |
| 0.2 | 0.7 | GO:0004031 | aldehyde oxidase activity(GO:0004031) |
| 0.2 | 5.4 | GO:0005540 | hyaluronic acid binding(GO:0005540) |
| 0.1 | 1.0 | GO:0000268 | peroxisome targeting sequence binding(GO:0000268) |
| 0.1 | 3.4 | GO:0051371 | muscle alpha-actinin binding(GO:0051371) |
| 0.1 | 2.5 | GO:0004861 | cyclin-dependent protein serine/threonine kinase inhibitor activity(GO:0004861) |
| 0.1 | 0.6 | GO:0015319 | sodium:inorganic phosphate symporter activity(GO:0015319) |
| 0.1 | 1.8 | GO:0001087 | transcription factor activity, sequence-specific DNA binding, RNA polymerase recruiting(GO:0001011) transcription factor activity, TFIIB-class binding(GO:0001087) |
| 0.1 | 0.4 | GO:0004781 | adenylylsulfate kinase activity(GO:0004020) sulfate adenylyltransferase activity(GO:0004779) sulfate adenylyltransferase (ATP) activity(GO:0004781) |
| 0.1 | 5.8 | GO:0003785 | actin monomer binding(GO:0003785) |
| 0.1 | 1.2 | GO:0000774 | adenyl-nucleotide exchange factor activity(GO:0000774) |
| 0.1 | 0.4 | GO:0005137 | interleukin-5 receptor binding(GO:0005137) |
| 0.1 | 1.1 | GO:0036042 | long-chain fatty acyl-CoA binding(GO:0036042) |
| 0.1 | 3.9 | GO:0005520 | insulin-like growth factor binding(GO:0005520) |
| 0.1 | 0.3 | GO:0030158 | protein xylosyltransferase activity(GO:0030158) |
| 0.1 | 0.5 | GO:0047134 | protein-disulfide reductase activity(GO:0047134) |
| 0.1 | 0.9 | GO:0046976 | histone methyltransferase activity (H3-K27 specific)(GO:0046976) |
| 0.1 | 0.4 | GO:0004060 | arylamine N-acetyltransferase activity(GO:0004060) |
| 0.1 | 0.4 | GO:0008900 | hydrogen:potassium-exchanging ATPase activity(GO:0008900) |
| 0.1 | 2.1 | GO:0042813 | Wnt-activated receptor activity(GO:0042813) |
| 0.1 | 1.2 | GO:0032395 | MHC class II receptor activity(GO:0032395) |
| 0.1 | 0.3 | GO:0004082 | bisphosphoglycerate mutase activity(GO:0004082) phosphoglycerate mutase activity(GO:0004619) 2,3-bisphosphoglycerate-dependent phosphoglycerate mutase activity(GO:0046538) |
| 0.1 | 0.9 | GO:0046870 | cadmium ion binding(GO:0046870) |
| 0.1 | 0.7 | GO:0015217 | adenine nucleotide transmembrane transporter activity(GO:0000295) purine ribonucleotide transmembrane transporter activity(GO:0005346) ATP transmembrane transporter activity(GO:0005347) purine nucleotide transmembrane transporter activity(GO:0015216) ADP transmembrane transporter activity(GO:0015217) |
| 0.1 | 1.0 | GO:0043047 | single-stranded telomeric DNA binding(GO:0043047) |
| 0.1 | 1.1 | GO:0030215 | semaphorin receptor binding(GO:0030215) |
| 0.1 | 0.5 | GO:0010859 | calcium-dependent cysteine-type endopeptidase inhibitor activity(GO:0010859) |
| 0.1 | 0.7 | GO:0004032 | alditol:NADP+ 1-oxidoreductase activity(GO:0004032) |
| 0.1 | 0.5 | GO:0008269 | JAK pathway signal transduction adaptor activity(GO:0008269) |
| 0.1 | 0.7 | GO:0089720 | caspase binding(GO:0089720) |
| 0.1 | 1.1 | GO:0004653 | polypeptide N-acetylgalactosaminyltransferase activity(GO:0004653) |
| 0.1 | 0.4 | GO:0015266 | protein channel activity(GO:0015266) |
| 0.1 | 0.3 | GO:0016971 | flavin-linked sulfhydryl oxidase activity(GO:0016971) thiol oxidase activity(GO:0016972) |
| 0.1 | 0.7 | GO:0005000 | vasopressin receptor activity(GO:0005000) |
| 0.1 | 1.0 | GO:0004028 | 3-chloroallyl aldehyde dehydrogenase activity(GO:0004028) |
| 0.1 | 0.3 | GO:0061628 | H3K27me3 modified histone binding(GO:0061628) |
| 0.1 | 0.2 | GO:0005169 | neurotrophin TRKB receptor binding(GO:0005169) |
| 0.1 | 0.2 | GO:0098625 | methylselenol reductase activity(GO:0098625) methylseleninic acid reductase activity(GO:0098626) |
| 0.1 | 0.5 | GO:0003847 | 1-alkyl-2-acetylglycerophosphocholine esterase activity(GO:0003847) |
| 0.1 | 0.3 | GO:0005412 | glucose:sodium symporter activity(GO:0005412) |
| 0.1 | 0.2 | GO:0004376 | glycolipid mannosyltransferase activity(GO:0004376) |
| 0.1 | 0.7 | GO:0050700 | CARD domain binding(GO:0050700) |
| 0.1 | 0.2 | GO:0052590 | sn-glycerol-3-phosphate:ubiquinone oxidoreductase activity(GO:0052590) sn-glycerol-3-phosphate:ubiquinone-8 oxidoreductase activity(GO:0052591) |
| 0.1 | 0.3 | GO:0019776 | Atg8 ligase activity(GO:0019776) |
| 0.1 | 1.3 | GO:0030898 | actin-dependent ATPase activity(GO:0030898) |
| 0.1 | 0.7 | GO:0097371 | MDM2/MDM4 family protein binding(GO:0097371) |
| 0.1 | 0.2 | GO:0000104 | succinate dehydrogenase activity(GO:0000104) |
| 0.1 | 0.5 | GO:0051425 | PTB domain binding(GO:0051425) |
| 0.1 | 1.9 | GO:0001848 | complement binding(GO:0001848) |
| 0.1 | 0.4 | GO:0032552 | deoxyribonucleotide binding(GO:0032552) |
| 0.1 | 0.6 | GO:0035251 | UDP-glucosyltransferase activity(GO:0035251) |
| 0.0 | 1.1 | GO:0000339 | RNA cap binding(GO:0000339) |
| 0.0 | 0.3 | GO:0043532 | angiostatin binding(GO:0043532) |
| 0.0 | 0.2 | GO:0034040 | lipid-transporting ATPase activity(GO:0034040) |
| 0.0 | 0.2 | GO:0030515 | snoRNA binding(GO:0030515) |
| 0.0 | 0.5 | GO:0047035 | testosterone dehydrogenase (NAD+) activity(GO:0047035) |
| 0.0 | 0.4 | GO:0051864 | histone demethylase activity (H3-K36 specific)(GO:0051864) |
| 0.0 | 0.1 | GO:0016433 | rRNA (adenine-N6,N6-)-dimethyltransferase activity(GO:0000179) rRNA (adenine) methyltransferase activity(GO:0016433) |
| 0.0 | 0.8 | GO:0045505 | dynein intermediate chain binding(GO:0045505) |
| 0.0 | 0.2 | GO:0047288 | monosialoganglioside sialyltransferase activity(GO:0047288) |
| 0.0 | 0.2 | GO:0016882 | cyclo-ligase activity(GO:0016882) |
| 0.0 | 0.2 | GO:0030614 | oxidoreductase activity, acting on phosphorus or arsenic in donors(GO:0030613) oxidoreductase activity, acting on phosphorus or arsenic in donors, disulfide as acceptor(GO:0030614) |
| 0.0 | 0.3 | GO:0005353 | fructose transmembrane transporter activity(GO:0005353) |
| 0.0 | 0.4 | GO:0051434 | BH3 domain binding(GO:0051434) |
| 0.0 | 0.2 | GO:0017159 | pantetheine hydrolase activity(GO:0017159) |
| 0.0 | 0.3 | GO:0046703 | natural killer cell lectin-like receptor binding(GO:0046703) |
| 0.0 | 0.2 | GO:0004994 | somatostatin receptor activity(GO:0004994) |
| 0.0 | 0.1 | GO:0015265 | urea channel activity(GO:0015265) |
| 0.0 | 0.7 | GO:0035497 | cAMP response element binding(GO:0035497) |
| 0.0 | 0.9 | GO:0032266 | phosphatidylinositol-3-phosphate binding(GO:0032266) |
| 0.0 | 1.1 | GO:0004709 | MAP kinase kinase kinase activity(GO:0004709) |
| 0.0 | 0.3 | GO:0031433 | telethonin binding(GO:0031433) |
| 0.0 | 0.2 | GO:0010858 | calcium-dependent protein kinase regulator activity(GO:0010858) |
| 0.0 | 0.3 | GO:0005094 | Rho GDP-dissociation inhibitor activity(GO:0005094) |
| 0.0 | 2.9 | GO:0003725 | double-stranded RNA binding(GO:0003725) |
| 0.0 | 0.1 | GO:0047977 | hepoxilin-epoxide hydrolase activity(GO:0047977) |
| 0.0 | 0.3 | GO:0015143 | urate transmembrane transporter activity(GO:0015143) salt transmembrane transporter activity(GO:1901702) |
| 0.0 | 0.2 | GO:0071532 | ankyrin repeat binding(GO:0071532) |
| 0.0 | 0.1 | GO:0035500 | MH2 domain binding(GO:0035500) |
| 0.0 | 0.3 | GO:0036402 | proteasome-activating ATPase activity(GO:0036402) |
| 0.0 | 0.8 | GO:0003950 | NAD+ ADP-ribosyltransferase activity(GO:0003950) |
| 0.0 | 0.9 | GO:0004003 | ATP-dependent DNA helicase activity(GO:0004003) |
| 0.0 | 2.7 | GO:0051219 | phosphoprotein binding(GO:0051219) |
| 0.0 | 0.6 | GO:0098641 | cadherin binding involved in cell-cell adhesion(GO:0098641) |
| 0.0 | 0.3 | GO:0008140 | cAMP response element binding protein binding(GO:0008140) |
| 0.0 | 0.1 | GO:0042132 | fructose 1,6-bisphosphate 1-phosphatase activity(GO:0042132) |
| 0.0 | 0.4 | GO:0051537 | 2 iron, 2 sulfur cluster binding(GO:0051537) |
| 0.0 | 0.1 | GO:0031716 | calcitonin receptor binding(GO:0031716) |
| 0.0 | 0.9 | GO:0061631 | ubiquitin conjugating enzyme activity(GO:0061631) |
| 0.0 | 0.4 | GO:0003678 | DNA helicase activity(GO:0003678) |
| 0.0 | 0.3 | GO:0004887 | thyroid hormone receptor activity(GO:0004887) |
| 0.0 | 1.1 | GO:0017112 | Rab guanyl-nucleotide exchange factor activity(GO:0017112) |
| 0.0 | 0.2 | GO:0030911 | TPR domain binding(GO:0030911) |
| 0.0 | 0.5 | GO:0004697 | protein kinase C activity(GO:0004697) |
| 0.0 | 0.5 | GO:0005086 | ARF guanyl-nucleotide exchange factor activity(GO:0005086) |
| 0.0 | 0.1 | GO:0010698 | acetyltransferase activator activity(GO:0010698) |
| 0.0 | 0.1 | GO:0004095 | carnitine O-palmitoyltransferase activity(GO:0004095) |
| 0.0 | 0.2 | GO:0017160 | Ral GTPase binding(GO:0017160) |
| 0.0 | 0.1 | GO:0008502 | melatonin receptor activity(GO:0008502) |
| 0.0 | 0.5 | GO:0003887 | DNA-directed DNA polymerase activity(GO:0003887) |
| 0.0 | 0.0 | GO:0004582 | dolichyl-phosphate beta-D-mannosyltransferase activity(GO:0004582) |
| 0.0 | 0.4 | GO:0043395 | heparan sulfate proteoglycan binding(GO:0043395) |
| 0.0 | 0.5 | GO:0001106 | RNA polymerase II transcription corepressor activity(GO:0001106) |
| 0.0 | 0.4 | GO:0016922 | ligand-dependent nuclear receptor binding(GO:0016922) |
| 0.0 | 1.5 | GO:0008013 | beta-catenin binding(GO:0008013) |
| 0.0 | 0.1 | GO:0070742 | C2H2 zinc finger domain binding(GO:0070742) |
| 0.0 | 0.1 | GO:0048156 | tau protein binding(GO:0048156) |
| 0.0 | 0.2 | GO:0004526 | ribonuclease P activity(GO:0004526) |
| 0.0 | 2.6 | GO:0061630 | ubiquitin protein ligase activity(GO:0061630) |
| 0.0 | 0.3 | GO:0004708 | MAP kinase kinase activity(GO:0004708) |
| 0.0 | 0.2 | GO:0071837 | HMG box domain binding(GO:0071837) |
| 0.0 | 1.3 | GO:0004222 | metalloendopeptidase activity(GO:0004222) |
| 0.0 | 0.1 | GO:0001075 | transcription factor activity, RNA polymerase II core promoter sequence-specific binding involved in preinitiation complex assembly(GO:0001075) |
| 0.0 | 0.4 | GO:0031369 | translation initiation factor binding(GO:0031369) |
| 0.0 | 0.3 | GO:0016769 | transferase activity, transferring nitrogenous groups(GO:0016769) |
| 0.0 | 0.0 | GO:0070180 | large ribosomal subunit rRNA binding(GO:0070180) |
| 0.0 | 1.3 | GO:0003705 | transcription factor activity, RNA polymerase II distal enhancer sequence-specific binding(GO:0003705) |
| 0.0 | 0.1 | GO:0004029 | aldehyde dehydrogenase (NAD) activity(GO:0004029) |
Gene overrepresentation in cellular_component category:
| Log-likelihood per target | Total log-likelihood | Term | Description |
|---|---|---|---|
| 3.0 | 8.9 | GO:0034676 | integrin alpha6-beta4 complex(GO:0034676) |
| 1.9 | 5.6 | GO:0034667 | integrin alpha3-beta1 complex(GO:0034667) |
| 1.6 | 6.5 | GO:0045160 | myosin I complex(GO:0045160) |
| 1.5 | 7.5 | GO:0071148 | TEAD-1-YAP complex(GO:0071148) |
| 1.2 | 23.0 | GO:0005862 | muscle thin filament tropomyosin(GO:0005862) |
| 1.2 | 4.7 | GO:0000214 | tRNA-intron endonuclease complex(GO:0000214) |
| 1.1 | 4.3 | GO:0043259 | laminin-10 complex(GO:0043259) |
| 1.0 | 6.1 | GO:0070369 | beta-catenin-TCF7L2 complex(GO:0070369) |
| 0.9 | 12.0 | GO:0005916 | fascia adherens(GO:0005916) |
| 0.9 | 8.2 | GO:0005955 | calcineurin complex(GO:0005955) |
| 0.9 | 3.6 | GO:0097224 | sperm connecting piece(GO:0097224) |
| 0.9 | 11.5 | GO:0097470 | ribbon synapse(GO:0097470) |
| 0.8 | 2.5 | GO:0034685 | integrin alphav-beta6 complex(GO:0034685) |
| 0.8 | 3.9 | GO:0032449 | CBM complex(GO:0032449) |
| 0.8 | 3.1 | GO:0070695 | FHF complex(GO:0070695) |
| 0.8 | 7.7 | GO:0016011 | dystroglycan complex(GO:0016011) |
| 0.7 | 2.1 | GO:0005826 | actomyosin contractile ring(GO:0005826) |
| 0.7 | 2.8 | GO:0031166 | integral component of vacuolar membrane(GO:0031166) |
| 0.7 | 4.2 | GO:0031232 | extrinsic component of external side of plasma membrane(GO:0031232) |
| 0.7 | 0.7 | GO:0030905 | retromer, tubulation complex(GO:0030905) |
| 0.7 | 2.0 | GO:0060053 | neurofilament cytoskeleton(GO:0060053) |
| 0.7 | 1.3 | GO:1990584 | cardiac Troponin complex(GO:1990584) |
| 0.7 | 3.3 | GO:0005899 | insulin receptor complex(GO:0005899) |
| 0.6 | 8.8 | GO:0005589 | collagen type VI trimer(GO:0005589) collagen beaded filament(GO:0098647) |
| 0.6 | 2.5 | GO:0005797 | Golgi medial cisterna(GO:0005797) |
| 0.6 | 2.4 | GO:0034751 | aryl hydrocarbon receptor complex(GO:0034751) |
| 0.6 | 2.9 | GO:0042643 | actomyosin, actin portion(GO:0042643) |
| 0.6 | 0.6 | GO:0098592 | cytoplasmic side of apical plasma membrane(GO:0098592) |
| 0.5 | 1.6 | GO:0071595 | Nem1-Spo7 phosphatase complex(GO:0071595) |
| 0.5 | 5.2 | GO:0071953 | elastic fiber(GO:0071953) |
| 0.5 | 5.2 | GO:0097413 | Lewy body(GO:0097413) |
| 0.5 | 1.6 | GO:0005588 | collagen type V trimer(GO:0005588) |
| 0.5 | 3.1 | GO:0070435 | Shc-EGFR complex(GO:0070435) |
| 0.5 | 2.0 | GO:0005896 | interleukin-6 receptor complex(GO:0005896) |
| 0.5 | 2.5 | GO:0036128 | CatSper complex(GO:0036128) |
| 0.5 | 8.8 | GO:0030056 | hemidesmosome(GO:0030056) |
| 0.5 | 0.5 | GO:0097454 | Schwann cell microvillus(GO:0097454) |
| 0.5 | 9.1 | GO:0071782 | endoplasmic reticulum tubular network(GO:0071782) |
| 0.5 | 6.8 | GO:0033643 | host cell part(GO:0033643) |
| 0.4 | 0.4 | GO:0016528 | sarcoplasm(GO:0016528) |
| 0.4 | 2.2 | GO:0048787 | presynaptic active zone membrane(GO:0048787) |
| 0.4 | 2.6 | GO:0030991 | intraciliary transport particle A(GO:0030991) |
| 0.4 | 5.1 | GO:0005577 | fibrinogen complex(GO:0005577) |
| 0.4 | 4.7 | GO:0097443 | sorting endosome(GO:0097443) |
| 0.4 | 6.4 | GO:0097512 | cardiac myofibril(GO:0097512) |
| 0.4 | 3.7 | GO:0097487 | multivesicular body, internal vesicle(GO:0097487) |
| 0.4 | 5.8 | GO:0031209 | SCAR complex(GO:0031209) |
| 0.4 | 2.1 | GO:0000836 | Hrd1p ubiquitin ligase complex(GO:0000836) |
| 0.4 | 1.6 | GO:0035749 | myelin sheath adaxonal region(GO:0035749) |
| 0.4 | 0.8 | GO:0034274 | Atg12-Atg5-Atg16 complex(GO:0034274) |
| 0.4 | 1.5 | GO:0032311 | angiogenin-PRI complex(GO:0032311) |
| 0.4 | 13.8 | GO:0000421 | autophagosome membrane(GO:0000421) |
| 0.4 | 1.1 | GO:0097058 | CRLF-CLCF1 complex(GO:0097058) |
| 0.4 | 0.4 | GO:0035859 | Seh1-associated complex(GO:0035859) GATOR2 complex(GO:0061700) |
| 0.4 | 3.0 | GO:0032593 | insulin-responsive compartment(GO:0032593) |
| 0.4 | 5.1 | GO:0097227 | sperm annulus(GO:0097227) |
| 0.4 | 0.4 | GO:1990124 | messenger ribonucleoprotein complex(GO:1990124) |
| 0.4 | 3.5 | GO:0045180 | basal cortex(GO:0045180) |
| 0.4 | 2.5 | GO:0036021 | endolysosome lumen(GO:0036021) |
| 0.4 | 1.4 | GO:0030427 | site of polarized growth(GO:0030427) |
| 0.3 | 2.8 | GO:0035976 | AP1 complex(GO:0035976) |
| 0.3 | 1.7 | GO:0071797 | LUBAC complex(GO:0071797) |
| 0.3 | 3.1 | GO:0098642 | network-forming collagen trimer(GO:0098642) collagen network(GO:0098645) |
| 0.3 | 3.0 | GO:0034464 | BBSome(GO:0034464) |
| 0.3 | 0.3 | GO:0090498 | extrinsic component of Golgi membrane(GO:0090498) |
| 0.3 | 1.3 | GO:0030485 | smooth muscle contractile fiber(GO:0030485) |
| 0.3 | 4.7 | GO:0008091 | spectrin(GO:0008091) |
| 0.3 | 1.7 | GO:0031501 | mannosyltransferase complex(GO:0031501) |
| 0.3 | 1.0 | GO:0071062 | alphav-beta3 integrin-vitronectin complex(GO:0071062) |
| 0.3 | 3.0 | GO:0005583 | fibrillar collagen trimer(GO:0005583) banded collagen fibril(GO:0098643) |
| 0.3 | 2.6 | GO:0000235 | astral microtubule(GO:0000235) aster(GO:0005818) |
| 0.3 | 1.3 | GO:0042567 | insulin-like growth factor ternary complex(GO:0042567) |
| 0.3 | 6.5 | GO:0043220 | Schmidt-Lanterman incisure(GO:0043220) |
| 0.3 | 1.0 | GO:0065010 | extracellular membrane-bounded organelle(GO:0065010) |
| 0.3 | 1.6 | GO:1990761 | growth cone lamellipodium(GO:1990761) |
| 0.3 | 9.7 | GO:0031092 | platelet alpha granule membrane(GO:0031092) |
| 0.3 | 28.0 | GO:0005604 | basement membrane(GO:0005604) |
| 0.3 | 6.7 | GO:0031233 | intrinsic component of external side of plasma membrane(GO:0031233) |
| 0.3 | 2.3 | GO:0097425 | smooth endoplasmic reticulum membrane(GO:0030868) smooth endoplasmic reticulum part(GO:0097425) |
| 0.3 | 1.2 | GO:0000015 | phosphopyruvate hydratase complex(GO:0000015) |
| 0.3 | 5.5 | GO:0042599 | lamellar body(GO:0042599) |
| 0.3 | 3.1 | GO:0035985 | senescence-associated heterochromatin focus(GO:0035985) |
| 0.3 | 1.7 | GO:0014802 | terminal cisterna(GO:0014802) |
| 0.3 | 0.3 | GO:0000806 | Y chromosome(GO:0000806) |
| 0.3 | 29.4 | GO:0031093 | platelet alpha granule lumen(GO:0031093) |
| 0.3 | 2.7 | GO:0097197 | tetraspanin-enriched microdomain(GO:0097197) |
| 0.3 | 1.3 | GO:0010370 | perinucleolar chromocenter(GO:0010370) |
| 0.3 | 1.9 | GO:0070522 | ERCC4-ERCC1 complex(GO:0070522) |
| 0.3 | 2.1 | GO:0044449 | contractile fiber part(GO:0044449) |
| 0.3 | 1.1 | GO:0032144 | 4-aminobutyrate transaminase complex(GO:0032144) |
| 0.3 | 2.4 | GO:0034993 | microtubule organizing center attachment site(GO:0034992) LINC complex(GO:0034993) |
| 0.3 | 7.1 | GO:0002080 | acrosomal membrane(GO:0002080) |
| 0.3 | 1.3 | GO:0005947 | mitochondrial alpha-ketoglutarate dehydrogenase complex(GO:0005947) |
| 0.3 | 1.0 | GO:0000333 | telomerase catalytic core complex(GO:0000333) |
| 0.3 | 0.8 | GO:0005879 | axonemal microtubule(GO:0005879) |
| 0.3 | 2.8 | GO:0033018 | sarcoplasmic reticulum lumen(GO:0033018) |
| 0.2 | 2.2 | GO:0016461 | unconventional myosin complex(GO:0016461) |
| 0.2 | 1.7 | GO:0005614 | interstitial matrix(GO:0005614) |
| 0.2 | 1.5 | GO:0098560 | cytoplasmic side of late endosome membrane(GO:0098560) |
| 0.2 | 2.6 | GO:0032421 | stereocilium bundle(GO:0032421) |
| 0.2 | 2.6 | GO:0035686 | sperm fibrous sheath(GO:0035686) |
| 0.2 | 15.5 | GO:1904724 | tertiary granule lumen(GO:1904724) |
| 0.2 | 28.9 | GO:0043202 | lysosomal lumen(GO:0043202) |
| 0.2 | 6.5 | GO:0005921 | gap junction(GO:0005921) |
| 0.2 | 0.2 | GO:1990075 | periciliary membrane compartment(GO:1990075) |
| 0.2 | 1.4 | GO:0070381 | endosome to plasma membrane transport vesicle(GO:0070381) |
| 0.2 | 0.9 | GO:1990246 | uniplex complex(GO:1990246) |
| 0.2 | 2.0 | GO:0044233 | ER-mitochondrion membrane contact site(GO:0044233) |
| 0.2 | 0.7 | GO:0016938 | kinesin I complex(GO:0016938) |
| 0.2 | 1.1 | GO:1990393 | 3M complex(GO:1990393) |
| 0.2 | 20.1 | GO:0032432 | actin filament bundle(GO:0032432) |
| 0.2 | 0.2 | GO:0022624 | proteasome activator complex(GO:0008537) proteasome accessory complex(GO:0022624) |
| 0.2 | 0.8 | GO:0044308 | axonal spine(GO:0044308) |
| 0.2 | 0.2 | GO:0098837 | postsynaptic recycling endosome(GO:0098837) |
| 0.2 | 0.6 | GO:0016600 | flotillin complex(GO:0016600) |
| 0.2 | 2.4 | GO:0034045 | pre-autophagosomal structure membrane(GO:0034045) |
| 0.2 | 5.6 | GO:0045211 | postsynaptic membrane(GO:0045211) |
| 0.2 | 2.6 | GO:1990454 | L-type voltage-gated calcium channel complex(GO:1990454) |
| 0.2 | 1.2 | GO:0035692 | macrophage migration inhibitory factor receptor complex(GO:0035692) |
| 0.2 | 0.4 | GO:0048237 | rough endoplasmic reticulum lumen(GO:0048237) |
| 0.2 | 2.5 | GO:0008385 | IkappaB kinase complex(GO:0008385) |
| 0.2 | 0.8 | GO:0033596 | TSC1-TSC2 complex(GO:0033596) |
| 0.2 | 0.6 | GO:0045323 | interleukin-1 receptor complex(GO:0045323) |
| 0.2 | 0.2 | GO:0005863 | striated muscle myosin thick filament(GO:0005863) |
| 0.2 | 0.8 | GO:0032584 | growth cone membrane(GO:0032584) |
| 0.2 | 18.5 | GO:0030175 | filopodium(GO:0030175) |
| 0.2 | 0.8 | GO:0044294 | dendritic growth cone(GO:0044294) |
| 0.2 | 0.6 | GO:0072563 | endothelial microparticle(GO:0072563) |
| 0.2 | 0.6 | GO:1990909 | Wnt signalosome(GO:1990909) |
| 0.2 | 0.2 | GO:1903349 | omegasome membrane(GO:1903349) |
| 0.2 | 12.7 | GO:0055038 | recycling endosome membrane(GO:0055038) |
| 0.2 | 0.4 | GO:0044326 | dendritic spine neck(GO:0044326) |
| 0.2 | 1.2 | GO:0005915 | zonula adherens(GO:0005915) |
| 0.2 | 1.0 | GO:1990130 | Iml1 complex(GO:1990130) |
| 0.2 | 0.5 | GO:0043218 | compact myelin(GO:0043218) |
| 0.2 | 1.9 | GO:0070765 | gamma-secretase complex(GO:0070765) |
| 0.2 | 44.7 | GO:0005788 | endoplasmic reticulum lumen(GO:0005788) |
| 0.2 | 0.5 | GO:0031143 | pseudopodium(GO:0031143) |
| 0.2 | 1.0 | GO:0000145 | exocyst(GO:0000145) |
| 0.2 | 3.2 | GO:0005640 | nuclear outer membrane(GO:0005640) |
| 0.2 | 0.8 | GO:0031430 | M band(GO:0031430) |
| 0.2 | 1.8 | GO:0030123 | AP-3 adaptor complex(GO:0030123) |
| 0.2 | 1.5 | GO:0005790 | smooth endoplasmic reticulum(GO:0005790) |
| 0.2 | 8.0 | GO:0001772 | immunological synapse(GO:0001772) |
| 0.2 | 1.0 | GO:0097025 | MPP7-DLG1-LIN7 complex(GO:0097025) |
| 0.2 | 0.3 | GO:0005967 | mitochondrial pyruvate dehydrogenase complex(GO:0005967) |
| 0.2 | 0.5 | GO:0070032 | synaptobrevin 2-SNAP-25-syntaxin-1a-complexin I complex(GO:0070032) |
| 0.2 | 0.2 | GO:0030289 | protein phosphatase 4 complex(GO:0030289) |
| 0.2 | 1.5 | GO:0070776 | H3 histone acetyltransferase complex(GO:0070775) MOZ/MORF histone acetyltransferase complex(GO:0070776) |
| 0.2 | 0.6 | GO:0070022 | transforming growth factor beta receptor homodimeric complex(GO:0070022) |
| 0.2 | 0.8 | GO:0030131 | clathrin adaptor complex(GO:0030131) |
| 0.2 | 2.5 | GO:0090665 | dystrophin-associated glycoprotein complex(GO:0016010) glycoprotein complex(GO:0090665) |
| 0.2 | 0.3 | GO:0070110 | ciliary neurotrophic factor receptor complex(GO:0070110) |
| 0.1 | 0.9 | GO:0033270 | paranode region of axon(GO:0033270) |
| 0.1 | 6.3 | GO:0002102 | podosome(GO:0002102) |
| 0.1 | 0.9 | GO:0043083 | synaptic cleft(GO:0043083) |
| 0.1 | 0.4 | GO:0045254 | pyruvate dehydrogenase complex(GO:0045254) |
| 0.1 | 1.4 | GO:0042641 | actomyosin(GO:0042641) |
| 0.1 | 0.7 | GO:0031045 | dense core granule(GO:0031045) |
| 0.1 | 0.4 | GO:0042765 | GPI-anchor transamidase complex(GO:0042765) |
| 0.1 | 2.3 | GO:0030014 | CCR4-NOT complex(GO:0030014) |
| 0.1 | 64.9 | GO:0005925 | focal adhesion(GO:0005925) |
| 0.1 | 6.1 | GO:0030864 | cortical actin cytoskeleton(GO:0030864) |
| 0.1 | 13.5 | GO:0030018 | Z disc(GO:0030018) |
| 0.1 | 3.4 | GO:0030673 | axolemma(GO:0030673) |
| 0.1 | 3.8 | GO:0005868 | cytoplasmic dynein complex(GO:0005868) |
| 0.1 | 1.4 | GO:0060077 | inhibitory synapse(GO:0060077) |
| 0.1 | 0.1 | GO:0030662 | coated vesicle membrane(GO:0030662) |
| 0.1 | 0.6 | GO:0070847 | core mediator complex(GO:0070847) |
| 0.1 | 1.7 | GO:0005869 | dynactin complex(GO:0005869) |
| 0.1 | 0.4 | GO:0048269 | methionine adenosyltransferase complex(GO:0048269) |
| 0.1 | 1.1 | GO:0060293 | P granule(GO:0043186) pole plasm(GO:0045495) germ plasm(GO:0060293) |
| 0.1 | 1.0 | GO:0072546 | ER membrane protein complex(GO:0072546) |
| 0.1 | 0.4 | GO:0035189 | Rb-E2F complex(GO:0035189) |
| 0.1 | 0.5 | GO:0034673 | inhibin-betaglycan-ActRII complex(GO:0034673) |
| 0.1 | 8.0 | GO:0043195 | terminal bouton(GO:0043195) |
| 0.1 | 0.2 | GO:0005889 | hydrogen:potassium-exchanging ATPase complex(GO:0005889) |
| 0.1 | 1.7 | GO:0099738 | cell cortex region(GO:0099738) |
| 0.1 | 2.8 | GO:0008180 | COP9 signalosome(GO:0008180) |
| 0.1 | 1.0 | GO:0033391 | chromatoid body(GO:0033391) |
| 0.1 | 0.4 | GO:1990745 | EARP complex(GO:1990745) |
| 0.1 | 0.3 | GO:0034272 | phosphatidylinositol 3-kinase complex, class III, type I(GO:0034271) phosphatidylinositol 3-kinase complex, class III, type II(GO:0034272) |
| 0.1 | 0.3 | GO:0070937 | CRD-mediated mRNA stability complex(GO:0070937) |
| 0.1 | 0.8 | GO:0030132 | clathrin coat of coated pit(GO:0030132) |
| 0.1 | 0.2 | GO:0031091 | platelet alpha granule(GO:0031091) |
| 0.1 | 0.2 | GO:0017119 | Golgi transport complex(GO:0017119) |
| 0.1 | 0.1 | GO:1902636 | kinociliary basal body(GO:1902636) |
| 0.1 | 2.1 | GO:0016281 | eukaryotic translation initiation factor 4F complex(GO:0016281) |
| 0.1 | 0.4 | GO:0030891 | VCB complex(GO:0030891) |
| 0.1 | 0.4 | GO:0033263 | CORVET complex(GO:0033263) |
| 0.1 | 2.8 | GO:0055037 | recycling endosome(GO:0055037) |
| 0.1 | 5.3 | GO:0097014 | axoneme(GO:0005930) ciliary plasm(GO:0097014) |
| 0.1 | 0.8 | GO:0071144 | SMAD2-SMAD3 protein complex(GO:0071144) |
| 0.1 | 0.7 | GO:0005956 | protein kinase CK2 complex(GO:0005956) |
| 0.1 | 0.2 | GO:0044354 | pinosome(GO:0044352) macropinosome(GO:0044354) |
| 0.1 | 1.4 | GO:0030663 | COPI-coated vesicle membrane(GO:0030663) |
| 0.1 | 3.3 | GO:0000159 | protein phosphatase type 2A complex(GO:0000159) |
| 0.1 | 0.3 | GO:0034750 | Scrib-APC-beta-catenin complex(GO:0034750) |
| 0.1 | 0.1 | GO:0000153 | cytoplasmic ubiquitin ligase complex(GO:0000153) |
| 0.1 | 0.1 | GO:0034365 | discoidal high-density lipoprotein particle(GO:0034365) |
| 0.1 | 16.2 | GO:0005578 | proteinaceous extracellular matrix(GO:0005578) |
| 0.1 | 0.3 | GO:0035032 | phosphatidylinositol 3-kinase complex, class III(GO:0035032) |
| 0.1 | 0.3 | GO:0000308 | cytoplasmic cyclin-dependent protein kinase holoenzyme complex(GO:0000308) |
| 0.1 | 2.1 | GO:0008074 | guanylate cyclase complex, soluble(GO:0008074) |
| 0.1 | 0.6 | GO:0005787 | signal peptidase complex(GO:0005787) |
| 0.1 | 3.4 | GO:0031256 | leading edge membrane(GO:0031256) |
| 0.1 | 1.4 | GO:0098562 | cytoplasmic side of membrane(GO:0098562) |
| 0.1 | 5.4 | GO:0042383 | sarcolemma(GO:0042383) |
| 0.1 | 0.9 | GO:0008250 | oligosaccharyltransferase complex(GO:0008250) |
| 0.1 | 1.8 | GO:0070971 | endoplasmic reticulum exit site(GO:0070971) |
| 0.1 | 0.2 | GO:0071439 | clathrin complex(GO:0071439) |
| 0.1 | 0.7 | GO:0061574 | ASAP complex(GO:0061574) |
| 0.1 | 0.5 | GO:0071203 | WASH complex(GO:0071203) |
| 0.1 | 0.4 | GO:0070852 | cell body fiber(GO:0070852) |
| 0.1 | 0.5 | GO:1902560 | GMP reductase complex(GO:1902560) |
| 0.1 | 2.3 | GO:0045178 | basal part of cell(GO:0045178) |
| 0.1 | 1.3 | GO:0030016 | myofibril(GO:0030016) |
| 0.1 | 0.2 | GO:0005801 | cis-Golgi network(GO:0005801) |
| 0.1 | 0.7 | GO:0031089 | platelet dense granule lumen(GO:0031089) |
| 0.1 | 0.5 | GO:0001518 | voltage-gated sodium channel complex(GO:0001518) |
| 0.1 | 0.5 | GO:0005672 | transcription factor TFIIA complex(GO:0005672) |
| 0.1 | 0.3 | GO:0002177 | manchette(GO:0002177) |
| 0.1 | 8.0 | GO:0001726 | ruffle(GO:0001726) |
| 0.1 | 0.9 | GO:0097431 | mitotic spindle pole(GO:0097431) |
| 0.1 | 3.8 | GO:0005901 | caveola(GO:0005901) |
| 0.1 | 5.0 | GO:0030027 | lamellipodium(GO:0030027) |
| 0.1 | 4.0 | GO:0005912 | adherens junction(GO:0005912) |
| 0.1 | 0.2 | GO:0005953 | CAAX-protein geranylgeranyltransferase complex(GO:0005953) |
| 0.1 | 1.8 | GO:0097546 | ciliary base(GO:0097546) |
| 0.1 | 1.1 | GO:0097225 | sperm midpiece(GO:0097225) |
| 0.1 | 0.6 | GO:0005638 | lamin filament(GO:0005638) |
| 0.1 | 1.1 | GO:0008305 | integrin complex(GO:0008305) |
| 0.1 | 0.1 | GO:0002139 | stereocilia coupling link(GO:0002139) |
| 0.1 | 0.4 | GO:0000275 | mitochondrial proton-transporting ATP synthase complex, catalytic core F(1)(GO:0000275) proton-transporting ATP synthase complex, catalytic core F(1)(GO:0045261) |
| 0.1 | 0.2 | GO:0042788 | polysomal ribosome(GO:0042788) |
| 0.1 | 0.9 | GO:1903293 | protein serine/threonine phosphatase complex(GO:0008287) phosphatase complex(GO:1903293) |
| 0.1 | 0.5 | GO:0016580 | Sin3 complex(GO:0016580) |
| 0.1 | 0.8 | GO:0009897 | external side of plasma membrane(GO:0009897) |
| 0.1 | 0.3 | GO:0031510 | SUMO activating enzyme complex(GO:0031510) |
| 0.1 | 0.5 | GO:0071204 | histone pre-mRNA 3'end processing complex(GO:0071204) |
| 0.1 | 0.5 | GO:0034706 | sodium channel complex(GO:0034706) |
| 0.1 | 0.2 | GO:1990131 | EGO complex(GO:0034448) Gtr1-Gtr2 GTPase complex(GO:1990131) |
| 0.1 | 0.1 | GO:0044305 | calyx of Held(GO:0044305) |
| 0.1 | 0.2 | GO:0098845 | postsynaptic endosome(GO:0098845) |
| 0.1 | 3.2 | GO:0034358 | plasma lipoprotein particle(GO:0034358) lipoprotein particle(GO:1990777) |
| 0.1 | 1.7 | GO:0043198 | dendritic shaft(GO:0043198) |
| 0.1 | 0.3 | GO:0032009 | early phagosome(GO:0032009) |
| 0.1 | 0.3 | GO:0002193 | MAML1-RBP-Jkappa- ICN1 complex(GO:0002193) |
| 0.1 | 0.4 | GO:0000813 | ESCRT I complex(GO:0000813) |
| 0.1 | 0.3 | GO:0032045 | guanyl-nucleotide exchange factor complex(GO:0032045) |
| 0.1 | 2.1 | GO:0030173 | integral component of Golgi membrane(GO:0030173) |
| 0.1 | 0.5 | GO:0044300 | cerebellar mossy fiber(GO:0044300) |
| 0.1 | 0.2 | GO:0005944 | phosphatidylinositol 3-kinase complex, class IB(GO:0005944) |
| 0.1 | 0.7 | GO:0046658 | anchored component of plasma membrane(GO:0046658) |
| 0.1 | 1.5 | GO:0045334 | clathrin-coated endocytic vesicle(GO:0045334) |
| 0.1 | 0.2 | GO:0019008 | molybdopterin synthase complex(GO:0019008) |
| 0.1 | 5.9 | GO:0031012 | extracellular matrix(GO:0031012) |
| 0.1 | 2.8 | GO:0033116 | endoplasmic reticulum-Golgi intermediate compartment membrane(GO:0033116) |
| 0.1 | 0.5 | GO:0000815 | ESCRT III complex(GO:0000815) |
| 0.1 | 0.6 | GO:0097136 | Bcl-2 family protein complex(GO:0097136) |
| 0.1 | 0.7 | GO:0035102 | PRC1 complex(GO:0035102) |
| 0.1 | 0.7 | GO:0036038 | MKS complex(GO:0036038) |
| 0.0 | 0.3 | GO:0005785 | signal recognition particle receptor complex(GO:0005785) |
| 0.0 | 0.6 | GO:0030660 | Golgi-associated vesicle membrane(GO:0030660) |
| 0.0 | 4.1 | GO:0031985 | Golgi cisterna(GO:0031985) |
| 0.0 | 0.1 | GO:0043034 | costamere(GO:0043034) |
| 0.0 | 0.2 | GO:1990031 | pinceau fiber(GO:1990031) |
| 0.0 | 0.2 | GO:0031302 | intrinsic component of endosome membrane(GO:0031302) |
| 0.0 | 0.3 | GO:0033269 | internode region of axon(GO:0033269) |
| 0.0 | 0.0 | GO:0002945 | cyclin K-CDK13 complex(GO:0002945) |
| 0.0 | 1.0 | GO:0005581 | collagen trimer(GO:0005581) |
| 0.0 | 0.0 | GO:0036398 | TCR signalosome(GO:0036398) |
| 0.0 | 0.3 | GO:0031464 | Cul4A-RING E3 ubiquitin ligase complex(GO:0031464) |
| 0.0 | 0.7 | GO:0000124 | SAGA complex(GO:0000124) |
| 0.0 | 0.3 | GO:0016589 | NURF complex(GO:0016589) |
| 0.0 | 0.0 | GO:0048475 | membrane coat(GO:0030117) coated membrane(GO:0048475) |
| 0.0 | 0.3 | GO:0005854 | nascent polypeptide-associated complex(GO:0005854) |
| 0.0 | 0.1 | GO:0030137 | COPI-coated vesicle(GO:0030137) |
| 0.0 | 1.5 | GO:0005884 | actin filament(GO:0005884) |
| 0.0 | 0.2 | GO:0001940 | male pronucleus(GO:0001940) |
| 0.0 | 1.5 | GO:0005902 | microvillus(GO:0005902) |
| 0.0 | 0.1 | GO:0030119 | AP-type membrane coat adaptor complex(GO:0030119) |
| 0.0 | 0.7 | GO:1904115 | axon cytoplasm(GO:1904115) |
| 0.0 | 0.5 | GO:0005811 | lipid particle(GO:0005811) |
| 0.0 | 0.2 | GO:0008275 | gamma-tubulin small complex(GO:0008275) |
| 0.0 | 0.1 | GO:0072687 | meiotic spindle(GO:0072687) |
| 0.0 | 3.3 | GO:0005802 | trans-Golgi network(GO:0005802) |
| 0.0 | 0.7 | GO:0031984 | organelle subcompartment(GO:0031984) Golgi subcompartment(GO:0098791) |
| 0.0 | 0.2 | GO:0030133 | transport vesicle(GO:0030133) |
| 0.0 | 0.3 | GO:0030877 | beta-catenin destruction complex(GO:0030877) |
| 0.0 | 1.0 | GO:0005685 | U1 snRNP(GO:0005685) |
| 0.0 | 0.1 | GO:0043541 | UDP-N-acetylglucosamine transferase complex(GO:0043541) |
| 0.0 | 0.1 | GO:0070195 | growth hormone receptor complex(GO:0070195) |
| 0.0 | 0.0 | GO:0045298 | tubulin complex(GO:0045298) |
| 0.0 | 0.4 | GO:0036019 | endolysosome(GO:0036019) |
| 0.0 | 0.2 | GO:0043190 | ATP-binding cassette (ABC) transporter complex(GO:0043190) |
| 0.0 | 1.7 | GO:0101003 | ficolin-1-rich granule membrane(GO:0101003) |
| 0.0 | 1.6 | GO:0035578 | azurophil granule lumen(GO:0035578) |
| 0.0 | 0.5 | GO:0031201 | SNARE complex(GO:0031201) |
| 0.0 | 0.6 | GO:0031307 | integral component of mitochondrial outer membrane(GO:0031307) |
| 0.0 | 32.7 | GO:0005783 | endoplasmic reticulum(GO:0005783) |
| 0.0 | 2.3 | GO:0005814 | centriole(GO:0005814) |
| 0.0 | 2.9 | GO:0030496 | midbody(GO:0030496) |
| 0.0 | 0.6 | GO:0005923 | bicellular tight junction(GO:0005923) occluding junction(GO:0070160) |
| 0.0 | 1.6 | GO:0001750 | photoreceptor outer segment(GO:0001750) |
| 0.0 | 0.1 | GO:0016935 | glycine-gated chloride channel complex(GO:0016935) |
| 0.0 | 0.4 | GO:0016323 | basolateral plasma membrane(GO:0016323) |
| 0.0 | 0.7 | GO:0005796 | Golgi lumen(GO:0005796) |
| 0.0 | 0.1 | GO:0005852 | eukaryotic translation initiation factor 3 complex(GO:0005852) |
| 0.0 | 0.2 | GO:0005771 | multivesicular body(GO:0005771) |
| 0.0 | 0.2 | GO:0000439 | core TFIIH complex(GO:0000439) |
| 0.0 | 0.7 | GO:0005905 | clathrin-coated pit(GO:0005905) |
| 0.0 | 0.1 | GO:0031251 | PAN complex(GO:0031251) |
| 0.0 | 0.1 | GO:0000120 | RNA polymerase I transcription factor complex(GO:0000120) |
| 0.0 | 1.8 | GO:0005768 | endosome(GO:0005768) |
| 0.0 | 0.1 | GO:0031467 | Cul7-RING ubiquitin ligase complex(GO:0031467) |
| 0.0 | 0.1 | GO:0048786 | presynaptic active zone(GO:0048786) |
| 0.0 | 0.5 | GO:0009986 | cell surface(GO:0009986) |
| 0.0 | 0.2 | GO:0031588 | nucleotide-activated protein kinase complex(GO:0031588) |
| 0.0 | 0.0 | GO:0042584 | chromaffin granule membrane(GO:0042584) |
| 0.0 | 0.1 | GO:0031465 | Cul4B-RING E3 ubiquitin ligase complex(GO:0031465) |
| 0.0 | 0.0 | GO:0035579 | specific granule membrane(GO:0035579) |
| 0.0 | 0.3 | GO:0045121 | membrane raft(GO:0045121) |
| 0.0 | 0.0 | GO:0031515 | tRNA (m1A) methyltransferase complex(GO:0031515) |
| 0.0 | 0.2 | GO:0000974 | Prp19 complex(GO:0000974) |
| 0.0 | 0.0 | GO:0044423 | virion(GO:0019012) virion part(GO:0044423) |
| 0.0 | 0.0 | GO:0031526 | brush border membrane(GO:0031526) |
| 0.0 | 0.1 | GO:0005968 | Rab-protein geranylgeranyltransferase complex(GO:0005968) |
| 0.0 | 0.1 | GO:0071141 | SMAD protein complex(GO:0071141) |
| 0.0 | 0.2 | GO:0043073 | germ cell nucleus(GO:0043073) |
| 0.0 | 2.2 | GO:0010008 | endosome membrane(GO:0010008) |
| 0.0 | 0.1 | GO:0000795 | synaptonemal complex(GO:0000795) |
Gene overrepresentation in C2:CP category:
| Log-likelihood per target | Total log-likelihood | Term | Description |
|---|---|---|---|
| 0.2 | 5.1 | SA MMP CYTOKINE CONNECTION | Cytokines can induce activation of matrix metalloproteinases, which degrade extracellular matrix. |
| 0.1 | 2.5 | SA REG CASCADE OF CYCLIN EXPR | Expression of cyclins regulates progression through the cell cycle by activating cyclin-dependent kinases. |
| 0.1 | 1.4 | PID TCR JNK PATHWAY | JNK signaling in the CD4+ TCR pathway |
| 0.0 | 0.8 | SA G1 AND S PHASES | Cdk2, 4, and 6 bind cyclin D in G1, while cdk2/cyclin E promotes the G1/S transition. |
| 0.0 | 1.4 | PID WNT SIGNALING PATHWAY | Wnt signaling network |
| 0.0 | 2.3 | PID FRA PATHWAY | Validated transcriptional targets of AP1 family members Fra1 and Fra2 |
| 0.0 | 0.8 | PID INSULIN GLUCOSE PATHWAY | Insulin-mediated glucose transport |
| 0.0 | 3.4 | PID BETA CATENIN NUC PATHWAY | Regulation of nuclear beta catenin signaling and target gene transcription |
| 0.0 | 1.1 | PID HIF2PATHWAY | HIF-2-alpha transcription factor network |
| 0.0 | 0.7 | ST G ALPHA S PATHWAY | G alpha s Pathway |
| 0.0 | 1.2 | PID ALPHA SYNUCLEIN PATHWAY | Alpha-synuclein signaling |
| 0.0 | 4.3 | NABA ECM GLYCOPROTEINS | Genes encoding structural ECM glycoproteins |
| 0.0 | 0.4 | PID IL5 PATHWAY | IL5-mediated signaling events |
| 0.0 | 0.3 | PID HIF1A PATHWAY | Hypoxic and oxygen homeostasis regulation of HIF-1-alpha |
| 0.0 | 0.9 | PID FANCONI PATHWAY | Fanconi anemia pathway |
| 0.0 | 0.5 | PID IGF1 PATHWAY | IGF1 pathway |
| 0.0 | 0.5 | PID LIS1 PATHWAY | Lissencephaly gene (LIS1) in neuronal migration and development |
| 0.0 | 0.5 | PID P38 MKK3 6PATHWAY | p38 MAPK signaling pathway |
| 0.0 | 1.4 | PID CASPASE PATHWAY | Caspase cascade in apoptosis |
| 0.0 | 0.8 | PID P53 REGULATION PATHWAY | p53 pathway |
| 0.0 | 0.8 | PID RHOA REG PATHWAY | Regulation of RhoA activity |
Gene overrepresentation in C2:CP category:
| Log-likelihood per target | Total log-likelihood | Term | Description |
|---|---|---|---|
| 0.8 | 2.4 | NABA BASEMENT MEMBRANES | Genes encoding structural components of basement membranes |
| 0.6 | 12.9 | PID INTEGRIN4 PATHWAY | Alpha6 beta4 integrin-ligand interactions |
| 0.5 | 16.4 | PID INTEGRIN5 PATHWAY | Beta5 beta6 beta7 and beta8 integrin cell surface interactions |
| 0.4 | 25.5 | PID INTEGRIN1 PATHWAY | Beta1 integrin cell surface interactions |
| 0.4 | 8.2 | PID VEGF VEGFR PATHWAY | VEGF and VEGFR signaling network |
| 0.4 | 22.1 | PID SYNDECAN 4 PATHWAY | Syndecan-4-mediated signaling events |
| 0.4 | 23.5 | SIG REGULATION OF THE ACTIN CYTOSKELETON BY RHO GTPASES | Genes related to regulation of the actin cytoskeleton |
| 0.4 | 11.8 | PID S1P S1P2 PATHWAY | S1P2 pathway |
| 0.3 | 2.5 | PID ALK2 PATHWAY | ALK2 signaling events |
| 0.3 | 4.5 | PID NECTIN PATHWAY | Nectin adhesion pathway |
| 0.3 | 2.7 | ST IL 13 PATHWAY | Interleukin 13 (IL-13) Pathway |
| 0.2 | 1.5 | PID WNT CANONICAL PATHWAY | Canonical Wnt signaling pathway |
| 0.2 | 10.2 | ST WNT BETA CATENIN PATHWAY | Wnt/beta-catenin Pathway |
| 0.2 | 2.2 | PID EPHRINB REV PATHWAY | Ephrin B reverse signaling |
| 0.2 | 7.6 | PID EPHB FWD PATHWAY | EPHB forward signaling |
| 0.2 | 0.2 | ST JAK STAT PATHWAY | Jak-STAT Pathway |
| 0.2 | 3.4 | PID PDGFRA PATHWAY | PDGFR-alpha signaling pathway |
| 0.2 | 6.3 | PID ERBB NETWORK PATHWAY | ErbB receptor signaling network |
| 0.2 | 4.6 | PID ECADHERIN NASCENT AJ PATHWAY | E-cadherin signaling in the nascent adherens junction |
| 0.2 | 2.3 | PID INTEGRIN3 PATHWAY | Beta3 integrin cell surface interactions |
| 0.2 | 9.6 | PID IGF1 PATHWAY | IGF1 pathway |
| 0.2 | 12.1 | PID ECADHERIN STABILIZATION PATHWAY | Stabilization and expansion of the E-cadherin adherens junction |
| 0.2 | 4.4 | PID TOLL ENDOGENOUS PATHWAY | Endogenous TLR signaling |
| 0.2 | 48.7 | NABA ECM REGULATORS | Genes encoding enzymes and their regulators involved in the remodeling of the extracellular matrix |
| 0.2 | 36.7 | NABA ECM GLYCOPROTEINS | Genes encoding structural ECM glycoproteins |
| 0.2 | 1.7 | ST PAC1 RECEPTOR PATHWAY | PAC1 Receptor Pathway |
| 0.2 | 7.0 | PID WNT NONCANONICAL PATHWAY | Noncanonical Wnt signaling pathway |
| 0.2 | 5.3 | PID NETRIN PATHWAY | Netrin-mediated signaling events |
| 0.2 | 15.4 | PID P75 NTR PATHWAY | p75(NTR)-mediated signaling |
| 0.2 | 4.5 | PID SYNDECAN 2 PATHWAY | Syndecan-2-mediated signaling events |
| 0.2 | 7.8 | PID AJDISS 2PATHWAY | Posttranslational regulation of adherens junction stability and dissassembly |
| 0.2 | 4.4 | PID A6B1 A6B4 INTEGRIN PATHWAY | a6b1 and a6b4 Integrin signaling |
| 0.2 | 12.0 | PID DELTA NP63 PATHWAY | Validated transcriptional targets of deltaNp63 isoforms |
| 0.2 | 3.5 | PID GLYPICAN 1PATHWAY | Glypican 1 network |
| 0.1 | 1.5 | ST STAT3 PATHWAY | STAT3 Pathway |
| 0.1 | 1.4 | PID TCR CALCIUM PATHWAY | Calcium signaling in the CD4+ TCR pathway |
| 0.1 | 7.9 | PID BMP PATHWAY | BMP receptor signaling |
| 0.1 | 5.0 | PID ARF6 TRAFFICKING PATHWAY | Arf6 trafficking events |
| 0.1 | 0.5 | PID RANBP2 PATHWAY | Sumoylation by RanBP2 regulates transcriptional repression |
| 0.1 | 1.3 | PID ALK1 PATHWAY | ALK1 signaling events |
| 0.1 | 3.9 | PID NFKAPPAB CANONICAL PATHWAY | Canonical NF-kappaB pathway |
| 0.1 | 4.5 | PID HIF2PATHWAY | HIF-2-alpha transcription factor network |
| 0.1 | 3.2 | PID NCADHERIN PATHWAY | N-cadherin signaling events |
| 0.1 | 2.8 | PID ARF 3PATHWAY | Arf1 pathway |
| 0.1 | 1.3 | ST GRANULE CELL SURVIVAL PATHWAY | Granule Cell Survival Pathway is a specific case of more general PAC1 Receptor Pathway. |
| 0.1 | 0.6 | ST TYPE I INTERFERON PATHWAY | Type I Interferon (alpha/beta IFN) Pathway |
| 0.1 | 4.7 | PID IL12 STAT4 PATHWAY | IL12 signaling mediated by STAT4 |
| 0.1 | 1.8 | PID LPA4 PATHWAY | LPA4-mediated signaling events |
| 0.1 | 1.2 | PID HIF1A PATHWAY | Hypoxic and oxygen homeostasis regulation of HIF-1-alpha |
| 0.1 | 0.4 | PID MAPK TRK PATHWAY | Trk receptor signaling mediated by the MAPK pathway |
| 0.1 | 1.2 | PID ERBB2 ERBB3 PATHWAY | ErbB2/ErbB3 signaling events |
| 0.1 | 1.8 | PID RET PATHWAY | Signaling events regulated by Ret tyrosine kinase |
| 0.1 | 0.1 | PID PI3KCI AKT PATHWAY | Class I PI3K signaling events mediated by Akt |
| 0.1 | 1.4 | PID UPA UPAR PATHWAY | Urokinase-type plasminogen activator (uPA) and uPAR-mediated signaling |
| 0.1 | 0.9 | PID MET PATHWAY | Signaling events mediated by Hepatocyte Growth Factor Receptor (c-Met) |
| 0.1 | 13.3 | NABA ECM AFFILIATED | Genes encoding proteins affiliated structurally or functionally to extracellular matrix proteins |
| 0.1 | 1.6 | PID ERBB1 INTERNALIZATION PATHWAY | Internalization of ErbB1 |
| 0.1 | 1.3 | PID CDC42 REG PATHWAY | Regulation of CDC42 activity |
| 0.1 | 1.4 | NABA COLLAGENS | Genes encoding collagen proteins |
| 0.1 | 1.0 | ST INTERLEUKIN 4 PATHWAY | Interleukin 4 (IL-4) Pathway |
| 0.1 | 0.5 | PID AR NONGENOMIC PATHWAY | Nongenotropic Androgen signaling |
| 0.1 | 1.3 | PID INSULIN PATHWAY | Insulin Pathway |
| 0.1 | 1.9 | PID RAC1 REG PATHWAY | Regulation of RAC1 activity |
| 0.1 | 1.1 | PID LYSOPHOSPHOLIPID PATHWAY | LPA receptor mediated events |
| 0.1 | 0.9 | PID SMAD2 3PATHWAY | Regulation of cytoplasmic and nuclear SMAD2/3 signaling |
| 0.1 | 1.6 | PID IL1 PATHWAY | IL1-mediated signaling events |
| 0.1 | 0.5 | SA G1 AND S PHASES | Cdk2, 4, and 6 bind cyclin D in G1, while cdk2/cyclin E promotes the G1/S transition. |
| 0.1 | 0.2 | SA PTEN PATHWAY | PTEN is a tumor suppressor that dephosphorylates the lipid messenger phosphatidylinositol triphosphate. |
| 0.1 | 3.3 | PID IL4 2PATHWAY | IL4-mediated signaling events |
| 0.1 | 1.4 | PID SHP2 PATHWAY | SHP2 signaling |
| 0.1 | 2.8 | PID CDC42 PATHWAY | CDC42 signaling events |
| 0.1 | 1.1 | ST G ALPHA I PATHWAY | G alpha i Pathway |
| 0.1 | 0.9 | PID AVB3 OPN PATHWAY | Osteopontin-mediated events |
| 0.1 | 3.3 | PID HIF1 TFPATHWAY | HIF-1-alpha transcription factor network |
| 0.1 | 1.1 | ST INTEGRIN SIGNALING PATHWAY | Integrin Signaling Pathway |
| 0.1 | 2.3 | WNT SIGNALING | Genes related to Wnt-mediated signal transduction |
| 0.1 | 1.2 | PID CONE PATHWAY | Visual signal transduction: Cones |
| 0.0 | 0.7 | PID CIRCADIAN PATHWAY | Circadian rhythm pathway |
| 0.0 | 1.1 | ST WNT CA2 CYCLIC GMP PATHWAY | Wnt/Ca2+/cyclic GMP signaling. |
| 0.0 | 2.3 | NABA PROTEOGLYCANS | Genes encoding proteoglycans |
| 0.0 | 1.7 | PID NFAT TFPATHWAY | Calcineurin-regulated NFAT-dependent transcription in lymphocytes |
| 0.0 | 0.8 | PID WNT SIGNALING PATHWAY | Wnt signaling network |
| 0.0 | 0.6 | PID P38 ALPHA BETA PATHWAY | Regulation of p38-alpha and p38-beta |
| 0.0 | 1.0 | SIG PIP3 SIGNALING IN CARDIAC MYOCTES | Genes related to PIP3 signaling in cardiac myocytes |
| 0.0 | 2.9 | PID RHOA REG PATHWAY | Regulation of RhoA activity |
| 0.0 | 9.1 | NABA MATRISOME | Ensemble of genes encoding extracellular matrix and extracellular matrix-associated proteins |
| 0.0 | 0.2 | SA REG CASCADE OF CYCLIN EXPR | Expression of cyclins regulates progression through the cell cycle by activating cyclin-dependent kinases. |
| 0.0 | 0.4 | PID PI3K PLC TRK PATHWAY | Trk receptor signaling mediated by PI3K and PLC-gamma |
| 0.0 | 0.3 | PID RHOA PATHWAY | RhoA signaling pathway |
| 0.0 | 0.3 | PID BETA CATENIN DEG PATHWAY | Degradation of beta catenin |
| 0.0 | 0.7 | PID ALPHA SYNUCLEIN PATHWAY | Alpha-synuclein signaling |
| 0.0 | 0.3 | PID FAK PATHWAY | Signaling events mediated by focal adhesion kinase |
| 0.0 | 0.5 | PID HDAC CLASSIII PATHWAY | Signaling events mediated by HDAC Class III |
| 0.0 | 0.2 | PID IL6 7 PATHWAY | IL6-mediated signaling events |
| 0.0 | 0.1 | PID NEPHRIN NEPH1 PATHWAY | Nephrin/Neph1 signaling in the kidney podocyte |
| 0.0 | 0.1 | ST G ALPHA S PATHWAY | G alpha s Pathway |
| 0.0 | 0.6 | PID AP1 PATHWAY | AP-1 transcription factor network |
Gene overrepresentation in molecular_function category:
| Log-likelihood per target | Total log-likelihood | Term | Description |
|---|---|---|---|
| 2.8 | 2.8 | GO:0048763 | calcium-induced calcium release activity(GO:0048763) |
| 2.1 | 6.2 | GO:0004157 | dihydropyrimidinase activity(GO:0004157) |
| 1.7 | 8.5 | GO:0016403 | dimethylargininase activity(GO:0016403) |
| 1.7 | 5.0 | GO:0000213 | tRNA-intron endonuclease activity(GO:0000213) |
| 1.5 | 9.0 | GO:0004741 | [pyruvate dehydrogenase (lipoamide)] phosphatase activity(GO:0004741) |
| 1.3 | 4.0 | GO:0070320 | inward rectifier potassium channel inhibitor activity(GO:0070320) |
| 1.2 | 8.7 | GO:0030267 | hydroxypyruvate reductase activity(GO:0016618) glyoxylate reductase (NADP) activity(GO:0030267) |
| 1.1 | 5.3 | GO:0005219 | ryanodine-sensitive calcium-release channel activity(GO:0005219) |
| 1.1 | 2.1 | GO:0035373 | chondroitin sulfate proteoglycan binding(GO:0035373) |
| 0.9 | 34.1 | GO:0043236 | laminin binding(GO:0043236) |
| 0.9 | 1.9 | GO:0097001 | ceramide binding(GO:0097001) |
| 0.9 | 2.6 | GO:0008476 | protein-tyrosine sulfotransferase activity(GO:0008476) |
| 0.8 | 2.5 | GO:0004779 | adenylylsulfate kinase activity(GO:0004020) sulfate adenylyltransferase activity(GO:0004779) sulfate adenylyltransferase (ATP) activity(GO:0004781) |
| 0.8 | 8.8 | GO:0048407 | platelet-derived growth factor binding(GO:0048407) |
| 0.8 | 2.4 | GO:0004379 | glycylpeptide N-tetradecanoyltransferase activity(GO:0004379) myristoyltransferase activity(GO:0019107) |
| 0.8 | 3.1 | GO:0004874 | aryl hydrocarbon receptor activity(GO:0004874) |
| 0.7 | 5.9 | GO:0045159 | myosin II binding(GO:0045159) |
| 0.7 | 7.3 | GO:0033192 | calmodulin-dependent protein phosphatase activity(GO:0033192) |
| 0.7 | 12.2 | GO:0048185 | activin binding(GO:0048185) |
| 0.7 | 3.3 | GO:0005006 | epidermal growth factor-activated receptor activity(GO:0005006) |
| 0.7 | 2.0 | GO:0086062 | voltage-gated sodium channel activity involved in Purkinje myocyte action potential(GO:0086062) |
| 0.6 | 2.6 | GO:0030226 | apolipoprotein receptor activity(GO:0030226) |
| 0.6 | 1.9 | GO:0004924 | oncostatin-M receptor activity(GO:0004924) |
| 0.6 | 2.5 | GO:0048408 | epidermal growth factor binding(GO:0048408) |
| 0.6 | 0.6 | GO:0034186 | apolipoprotein A-I binding(GO:0034186) |
| 0.6 | 4.3 | GO:0038085 | vascular endothelial growth factor binding(GO:0038085) |
| 0.6 | 2.5 | GO:0008184 | glycogen phosphorylase activity(GO:0008184) |
| 0.6 | 2.4 | GO:0004667 | prostaglandin-D synthase activity(GO:0004667) |
| 0.6 | 10.0 | GO:0001968 | fibronectin binding(GO:0001968) |
| 0.6 | 1.8 | GO:0032093 | SAM domain binding(GO:0032093) |
| 0.6 | 1.7 | GO:0030984 | kininogen binding(GO:0030984) |
| 0.6 | 1.7 | GO:0036487 | nitric-oxide synthase inhibitor activity(GO:0036487) |
| 0.6 | 2.8 | GO:0019798 | procollagen-proline 4-dioxygenase activity(GO:0004656) procollagen-proline dioxygenase activity(GO:0019798) |
| 0.6 | 22.0 | GO:0003785 | actin monomer binding(GO:0003785) |
| 0.5 | 12.2 | GO:0030898 | actin-dependent ATPase activity(GO:0030898) |
| 0.5 | 1.6 | GO:0035501 | MH1 domain binding(GO:0035501) |
| 0.5 | 2.7 | GO:0052833 | inositol monophosphate 1-phosphatase activity(GO:0008934) inositol monophosphate 3-phosphatase activity(GO:0052832) inositol monophosphate 4-phosphatase activity(GO:0052833) inositol monophosphate phosphatase activity(GO:0052834) |
| 0.5 | 5.3 | GO:0042731 | PH domain binding(GO:0042731) |
| 0.5 | 3.6 | GO:0060072 | large conductance calcium-activated potassium channel activity(GO:0060072) |
| 0.5 | 5.1 | GO:0005172 | vascular endothelial growth factor receptor binding(GO:0005172) |
| 0.5 | 2.5 | GO:0086075 | gap junction channel activity involved in cardiac conduction electrical coupling(GO:0086075) |
| 0.5 | 1.5 | GO:0070984 | SET domain binding(GO:0070984) |
| 0.5 | 2.0 | GO:0004782 | sulfinoalanine decarboxylase activity(GO:0004782) |
| 0.5 | 0.5 | GO:0004103 | choline kinase activity(GO:0004103) |
| 0.5 | 7.7 | GO:0032036 | myosin heavy chain binding(GO:0032036) |
| 0.5 | 40.5 | GO:0008307 | structural constituent of muscle(GO:0008307) |
| 0.5 | 1.4 | GO:0004605 | phosphatidate cytidylyltransferase activity(GO:0004605) |
| 0.5 | 0.9 | GO:0070097 | delta-catenin binding(GO:0070097) |
| 0.5 | 10.6 | GO:0017166 | vinculin binding(GO:0017166) |
| 0.4 | 0.4 | GO:0017002 | activin-activated receptor activity(GO:0017002) |
| 0.4 | 2.6 | GO:0051021 | GDP-dissociation inhibitor binding(GO:0051021) Rho GDP-dissociation inhibitor binding(GO:0051022) |
| 0.4 | 14.4 | GO:0050840 | extracellular matrix binding(GO:0050840) |
| 0.4 | 0.4 | GO:0032427 | GBD domain binding(GO:0032427) |
| 0.4 | 2.2 | GO:0004687 | myosin light chain kinase activity(GO:0004687) |
| 0.4 | 9.0 | GO:0001134 | transcription factor activity, transcription factor recruiting(GO:0001134) |
| 0.4 | 1.3 | GO:0030350 | iron-responsive element binding(GO:0030350) |
| 0.4 | 3.0 | GO:0035614 | snRNA stem-loop binding(GO:0035614) |
| 0.4 | 0.9 | GO:0044323 | retinoic acid-responsive element binding(GO:0044323) |
| 0.4 | 1.7 | GO:0004376 | glycolipid mannosyltransferase activity(GO:0004376) |
| 0.4 | 3.3 | GO:0048495 | Roundabout binding(GO:0048495) |
| 0.4 | 6.6 | GO:0045499 | chemorepellent activity(GO:0045499) |
| 0.4 | 1.6 | GO:0038181 | bile acid receptor activity(GO:0038181) |
| 0.4 | 4.0 | GO:0035727 | lysophosphatidic acid binding(GO:0035727) |
| 0.4 | 8.8 | GO:0008191 | metalloendopeptidase inhibitor activity(GO:0008191) |
| 0.4 | 2.4 | GO:0004614 | phosphoglucomutase activity(GO:0004614) |
| 0.4 | 1.6 | GO:0050262 | ribosylnicotinamide kinase activity(GO:0050262) ribosylnicotinate kinase activity(GO:0061769) |
| 0.4 | 0.4 | GO:0031432 | titin binding(GO:0031432) RNA polymerase II sequence-specific DNA binding transcription factor binding(GO:0061629) |
| 0.4 | 1.9 | GO:0008046 | axon guidance receptor activity(GO:0008046) |
| 0.4 | 10.4 | GO:0005520 | insulin-like growth factor binding(GO:0005520) |
| 0.4 | 2.3 | GO:0003998 | acylphosphatase activity(GO:0003998) |
| 0.4 | 1.1 | GO:0008475 | procollagen-lysine 5-dioxygenase activity(GO:0008475) procollagen glucosyltransferase activity(GO:0033823) |
| 0.4 | 1.5 | GO:0034437 | glycoprotein transporter activity(GO:0034437) |
| 0.4 | 0.4 | GO:0061752 | telomeric repeat-containing RNA binding(GO:0061752) |
| 0.4 | 1.1 | GO:0005127 | ciliary neurotrophic factor receptor binding(GO:0005127) |
| 0.4 | 1.5 | GO:0017089 | glycolipid transporter activity(GO:0017089) |
| 0.4 | 1.5 | GO:0008112 | nicotinamide N-methyltransferase activity(GO:0008112) pyridine N-methyltransferase activity(GO:0030760) |
| 0.4 | 1.5 | GO:0060422 | peptidyl-dipeptidase inhibitor activity(GO:0060422) |
| 0.4 | 2.2 | GO:0010859 | calcium-dependent cysteine-type endopeptidase inhibitor activity(GO:0010859) |
| 0.4 | 1.8 | GO:0043120 | tumor necrosis factor binding(GO:0043120) |
| 0.4 | 1.1 | GO:0030158 | protein xylosyltransferase activity(GO:0030158) |
| 0.4 | 2.5 | GO:0016670 | oxidoreductase activity, acting on a sulfur group of donors, oxygen as acceptor(GO:0016670) |
| 0.4 | 3.6 | GO:0097493 | structural molecule activity conferring elasticity(GO:0097493) |
| 0.3 | 3.5 | GO:0051371 | muscle alpha-actinin binding(GO:0051371) |
| 0.3 | 2.1 | GO:0008597 | calcium-dependent protein serine/threonine phosphatase regulator activity(GO:0008597) |
| 0.3 | 6.2 | GO:0045295 | gamma-catenin binding(GO:0045295) |
| 0.3 | 1.4 | GO:0004743 | pyruvate kinase activity(GO:0004743) |
| 0.3 | 3.7 | GO:0017154 | semaphorin receptor activity(GO:0017154) |
| 0.3 | 1.0 | GO:0003983 | UTP:glucose-1-phosphate uridylyltransferase activity(GO:0003983) UTP-monosaccharide-1-phosphate uridylyltransferase activity(GO:0051748) |
| 0.3 | 4.3 | GO:0047372 | acylglycerol lipase activity(GO:0047372) |
| 0.3 | 1.7 | GO:0015307 | drug:proton antiporter activity(GO:0015307) |
| 0.3 | 0.3 | GO:0000900 | translation repressor activity, nucleic acid binding(GO:0000900) |
| 0.3 | 1.0 | GO:0030377 | urokinase plasminogen activator receptor activity(GO:0030377) |
| 0.3 | 1.0 | GO:0050510 | N-acetylgalactosaminyl-proteoglycan 3-beta-glucuronosyltransferase activity(GO:0050510) |
| 0.3 | 9.2 | GO:0070064 | proline-rich region binding(GO:0070064) |
| 0.3 | 1.6 | GO:0004359 | glutaminase activity(GO:0004359) |
| 0.3 | 0.9 | GO:0034739 | histone deacetylase activity (H4-K16 specific)(GO:0034739) |
| 0.3 | 9.5 | GO:0005212 | structural constituent of eye lens(GO:0005212) |
| 0.3 | 0.9 | GO:0004677 | DNA-dependent protein kinase activity(GO:0004677) |
| 0.3 | 3.4 | GO:0046870 | cadmium ion binding(GO:0046870) |
| 0.3 | 1.5 | GO:0070411 | I-SMAD binding(GO:0070411) |
| 0.3 | 1.8 | GO:0050656 | 3'-phosphoadenosine 5'-phosphosulfate binding(GO:0050656) |
| 0.3 | 2.3 | GO:0004957 | prostaglandin E receptor activity(GO:0004957) |
| 0.3 | 0.3 | GO:0071253 | connexin binding(GO:0071253) |
| 0.3 | 1.2 | GO:0030169 | low-density lipoprotein particle binding(GO:0030169) |
| 0.3 | 0.3 | GO:0097603 | temperature-gated ion channel activity(GO:0097603) |
| 0.3 | 1.4 | GO:0050436 | microfibril binding(GO:0050436) |
| 0.3 | 1.1 | GO:0004348 | glucosylceramidase activity(GO:0004348) |
| 0.3 | 5.6 | GO:0070530 | K63-linked polyubiquitin binding(GO:0070530) |
| 0.3 | 0.8 | GO:0102007 | lactonohydrolase activity(GO:0046573) acyl-L-homoserine-lactone lactonohydrolase activity(GO:0102007) |
| 0.3 | 5.4 | GO:0031005 | filamin binding(GO:0031005) |
| 0.3 | 1.1 | GO:0047288 | monosialoganglioside sialyltransferase activity(GO:0047288) |
| 0.3 | 1.9 | GO:0005324 | long-chain fatty acid transporter activity(GO:0005324) |
| 0.3 | 1.1 | GO:0003827 | alpha-1,3-mannosylglycoprotein 2-beta-N-acetylglucosaminyltransferase activity(GO:0003827) |
| 0.3 | 1.1 | GO:0008431 | vitamin E binding(GO:0008431) |
| 0.3 | 1.9 | GO:1990599 | 3' overhang single-stranded DNA endodeoxyribonuclease activity(GO:1990599) |
| 0.3 | 0.3 | GO:0017098 | sulfonylurea receptor binding(GO:0017098) |
| 0.3 | 2.1 | GO:0004955 | prostaglandin receptor activity(GO:0004955) |
| 0.3 | 1.1 | GO:0003867 | 4-aminobutyrate transaminase activity(GO:0003867) succinate-semialdehyde dehydrogenase binding(GO:0032145) (S)-3-amino-2-methylpropionate transaminase activity(GO:0047298) |
| 0.3 | 2.1 | GO:0005497 | androgen binding(GO:0005497) |
| 0.3 | 1.1 | GO:0005105 | type 1 fibroblast growth factor receptor binding(GO:0005105) |
| 0.3 | 4.0 | GO:0005402 | sugar:proton symporter activity(GO:0005351) cation:sugar symporter activity(GO:0005402) |
| 0.3 | 21.1 | GO:0005201 | extracellular matrix structural constituent(GO:0005201) |
| 0.3 | 0.8 | GO:0004345 | glucose-6-phosphate dehydrogenase activity(GO:0004345) |
| 0.3 | 0.8 | GO:0042799 | histone methyltransferase activity (H4-K20 specific)(GO:0042799) |
| 0.3 | 0.8 | GO:0019166 | trans-2-enoyl-CoA reductase (NADPH) activity(GO:0019166) |
| 0.3 | 4.1 | GO:0017049 | GTP-Rho binding(GO:0017049) |
| 0.3 | 1.3 | GO:0004064 | arylesterase activity(GO:0004064) |
| 0.3 | 12.8 | GO:0005158 | insulin receptor binding(GO:0005158) |
| 0.2 | 0.7 | GO:0008430 | selenium binding(GO:0008430) |
| 0.2 | 0.2 | GO:0005499 | vitamin D binding(GO:0005499) |
| 0.2 | 2.5 | GO:0004791 | thioredoxin-disulfide reductase activity(GO:0004791) |
| 0.2 | 2.9 | GO:0008429 | phosphatidylethanolamine binding(GO:0008429) |
| 0.2 | 13.0 | GO:0005518 | collagen binding(GO:0005518) |
| 0.2 | 1.5 | GO:0036312 | phosphatidylinositol 3-kinase regulatory subunit binding(GO:0036312) |
| 0.2 | 1.9 | GO:0034235 | GPI anchor binding(GO:0034235) |
| 0.2 | 0.7 | GO:0004723 | calcium-dependent protein serine/threonine phosphatase activity(GO:0004723) |
| 0.2 | 0.2 | GO:0055077 | gap junction hemi-channel activity(GO:0055077) |
| 0.2 | 1.4 | GO:1904929 | coreceptor activity involved in Wnt signaling pathway, planar cell polarity pathway(GO:1904929) |
| 0.2 | 0.7 | GO:0005150 | interleukin-1, Type I receptor binding(GO:0005150) |
| 0.2 | 0.9 | GO:0031694 | alpha-2A adrenergic receptor binding(GO:0031694) |
| 0.2 | 1.4 | GO:0002114 | interleukin-33 receptor activity(GO:0002114) |
| 0.2 | 22.7 | GO:0004867 | serine-type endopeptidase inhibitor activity(GO:0004867) |
| 0.2 | 0.7 | GO:0016603 | glutaminyl-peptide cyclotransferase activity(GO:0016603) |
| 0.2 | 10.1 | GO:0015485 | cholesterol binding(GO:0015485) |
| 0.2 | 1.3 | GO:0004800 | thyroxine 5'-deiodinase activity(GO:0004800) |
| 0.2 | 2.4 | GO:0004415 | hyalurononglucosaminidase activity(GO:0004415) |
| 0.2 | 0.7 | GO:0035033 | histone deacetylase regulator activity(GO:0035033) |
| 0.2 | 0.7 | GO:0047757 | chondroitin-glucuronate 5-epimerase activity(GO:0047757) |
| 0.2 | 3.5 | GO:0008179 | adenylate cyclase binding(GO:0008179) |
| 0.2 | 2.4 | GO:0043008 | ATP-dependent protein binding(GO:0043008) |
| 0.2 | 6.0 | GO:0032266 | phosphatidylinositol-3-phosphate binding(GO:0032266) |
| 0.2 | 0.6 | GO:0003845 | 11-beta-hydroxysteroid dehydrogenase [NAD(P)] activity(GO:0003845) |
| 0.2 | 3.4 | GO:0016641 | oxidoreductase activity, acting on the CH-NH2 group of donors, oxygen as acceptor(GO:0016641) |
| 0.2 | 0.9 | GO:0050509 | N-acetylglucosaminyl-proteoglycan 4-beta-glucuronosyltransferase activity(GO:0050509) |
| 0.2 | 4.9 | GO:0070410 | co-SMAD binding(GO:0070410) |
| 0.2 | 6.1 | GO:0043015 | gamma-tubulin binding(GO:0043015) |
| 0.2 | 0.6 | GO:0008798 | beta-aspartyl-peptidase activity(GO:0008798) |
| 0.2 | 0.6 | GO:0032422 | purine-rich negative regulatory element binding(GO:0032422) |
| 0.2 | 0.8 | GO:0004466 | long-chain-acyl-CoA dehydrogenase activity(GO:0004466) |
| 0.2 | 0.2 | GO:0032810 | sterol response element binding(GO:0032810) |
| 0.2 | 1.2 | GO:0016868 | intramolecular transferase activity, phosphotransferases(GO:0016868) |
| 0.2 | 0.6 | GO:0003863 | alpha-ketoacid dehydrogenase activity(GO:0003826) 3-methyl-2-oxobutanoate dehydrogenase (2-methylpropanoyl-transferring) activity(GO:0003863) |
| 0.2 | 0.6 | GO:0032184 | SUMO polymer binding(GO:0032184) |
| 0.2 | 0.2 | GO:0001002 | polymerase III regulatory region sequence-specific DNA binding(GO:0000992) RNA polymerase III type 1 promoter sequence-specific DNA binding(GO:0001002) RNA polymerase III type 2 promoter sequence-specific DNA binding(GO:0001003) |
| 0.2 | 2.4 | GO:0031821 | G-protein coupled serotonin receptor binding(GO:0031821) |
| 0.2 | 0.8 | GO:0003726 | double-stranded RNA adenosine deaminase activity(GO:0003726) |
| 0.2 | 1.0 | GO:0097016 | L27 domain binding(GO:0097016) |
| 0.2 | 2.4 | GO:0042301 | phosphate ion binding(GO:0042301) |
| 0.2 | 1.8 | GO:0004985 | opioid receptor activity(GO:0004985) |
| 0.2 | 0.8 | GO:0004461 | lactose synthase activity(GO:0004461) |
| 0.2 | 1.6 | GO:0070181 | small ribosomal subunit rRNA binding(GO:0070181) |
| 0.2 | 2.1 | GO:0032050 | clathrin heavy chain binding(GO:0032050) |
| 0.2 | 6.2 | GO:0070412 | R-SMAD binding(GO:0070412) |
| 0.2 | 1.9 | GO:0032027 | myosin light chain binding(GO:0032027) |
| 0.2 | 3.0 | GO:0033549 | MAP kinase phosphatase activity(GO:0033549) |
| 0.2 | 2.4 | GO:0019841 | retinol binding(GO:0019841) |
| 0.2 | 1.9 | GO:0005007 | fibroblast growth factor-activated receptor activity(GO:0005007) |
| 0.2 | 0.4 | GO:0047760 | butyrate-CoA ligase activity(GO:0047760) |
| 0.2 | 3.9 | GO:0008484 | sulfuric ester hydrolase activity(GO:0008484) |
| 0.2 | 1.1 | GO:0019776 | Atg8 ligase activity(GO:0019776) |
| 0.2 | 2.0 | GO:0001042 | RNA polymerase I core binding(GO:0001042) |
| 0.2 | 1.1 | GO:0010858 | calcium-dependent protein kinase regulator activity(GO:0010858) |
| 0.2 | 1.1 | GO:0042975 | peroxisome proliferator activated receptor binding(GO:0042975) |
| 0.2 | 1.8 | GO:0005161 | platelet-derived growth factor receptor binding(GO:0005161) |
| 0.2 | 4.5 | GO:0005092 | GDP-dissociation inhibitor activity(GO:0005092) |
| 0.2 | 2.1 | GO:0070679 | inositol 1,4,5 trisphosphate binding(GO:0070679) |
| 0.2 | 0.5 | GO:0052894 | norspermine:oxygen oxidoreductase activity(GO:0052894) N1-acetylspermine:oxygen oxidoreductase (N1-acetylspermidine-forming) activity(GO:0052895) |
| 0.2 | 0.7 | GO:0047391 | alkylglycerophosphoethanolamine phosphodiesterase activity(GO:0047391) |
| 0.2 | 1.4 | GO:0034452 | dynactin binding(GO:0034452) |
| 0.2 | 0.5 | GO:0003968 | RNA-directed RNA polymerase activity(GO:0003968) |
| 0.2 | 0.7 | GO:0016230 | sphingomyelin phosphodiesterase activator activity(GO:0016230) |
| 0.2 | 2.2 | GO:0048487 | beta-tubulin binding(GO:0048487) |
| 0.2 | 2.7 | GO:0004185 | serine-type carboxypeptidase activity(GO:0004185) |
| 0.2 | 0.8 | GO:0052841 | endopolyphosphatase activity(GO:0000298) diphosphoinositol-polyphosphate diphosphatase activity(GO:0008486) bis(5'-adenosyl)-hexaphosphatase activity(GO:0034431) bis(5'-adenosyl)-pentaphosphatase activity(GO:0034432) inositol diphosphate tetrakisphosphate diphosphatase activity(GO:0052840) inositol bisdiphosphate tetrakisphosphate diphosphatase activity(GO:0052841) inositol diphosphate pentakisphosphate diphosphatase activity(GO:0052842) inositol-1-diphosphate-2,3,4,5,6-pentakisphosphate diphosphatase activity(GO:0052843) inositol-3-diphosphate-1,2,4,5,6-pentakisphosphate diphosphatase activity(GO:0052844) inositol-5-diphosphate-1,2,3,4,6-pentakisphosphate diphosphatase activity(GO:0052845) inositol-1,5-bisdiphosphate-2,3,4,6-tetrakisphosphate 1-diphosphatase activity(GO:0052846) inositol-1,5-bisdiphosphate-2,3,4,6-tetrakisphosphate 5-diphosphatase activity(GO:0052847) inositol-3,5-bisdiphosphate-2,3,4,6-tetrakisphosphate 5-diphosphatase activity(GO:0052848) |
| 0.2 | 1.7 | GO:0004697 | protein kinase C activity(GO:0004697) |
| 0.2 | 1.2 | GO:0031681 | G-protein beta-subunit binding(GO:0031681) |
| 0.2 | 3.3 | GO:0045504 | dynein heavy chain binding(GO:0045504) |
| 0.2 | 0.5 | GO:0000253 | 3-keto sterol reductase activity(GO:0000253) |
| 0.2 | 0.7 | GO:0004031 | aldehyde oxidase activity(GO:0004031) |
| 0.2 | 5.4 | GO:0030742 | GTP-dependent protein binding(GO:0030742) |
| 0.2 | 3.3 | GO:0050811 | GABA receptor binding(GO:0050811) |
| 0.2 | 0.5 | GO:0050309 | glucose-6-phosphatase activity(GO:0004346) sugar-terminal-phosphatase activity(GO:0050309) |
| 0.2 | 0.8 | GO:0032795 | heterotrimeric G-protein binding(GO:0032795) |
| 0.2 | 1.6 | GO:0008428 | ribonuclease inhibitor activity(GO:0008428) |
| 0.2 | 0.5 | GO:0003881 | CDP-diacylglycerol-inositol 3-phosphatidyltransferase activity(GO:0003881) |
| 0.2 | 1.8 | GO:0003996 | acyl-CoA ligase activity(GO:0003996) |
| 0.2 | 0.3 | GO:0050211 | procollagen galactosyltransferase activity(GO:0050211) |
| 0.2 | 0.2 | GO:1903763 | gap junction channel activity involved in cell communication by electrical coupling(GO:1903763) |
| 0.2 | 0.6 | GO:0047708 | biotinidase activity(GO:0047708) |
| 0.2 | 0.5 | GO:0004962 | endothelin receptor activity(GO:0004962) |
| 0.2 | 6.7 | GO:0005154 | epidermal growth factor receptor binding(GO:0005154) |
| 0.2 | 1.4 | GO:0000146 | microfilament motor activity(GO:0000146) |
| 0.2 | 0.5 | GO:0045127 | N-acetylglucosamine kinase activity(GO:0045127) |
| 0.2 | 0.3 | GO:0004897 | ciliary neurotrophic factor receptor activity(GO:0004897) |
| 0.2 | 0.9 | GO:0051011 | microtubule minus-end binding(GO:0051011) |
| 0.2 | 0.3 | GO:0004886 | 9-cis retinoic acid receptor activity(GO:0004886) |
| 0.2 | 0.9 | GO:0016941 | natriuretic peptide receptor activity(GO:0016941) |
| 0.2 | 2.0 | GO:0042043 | neurexin family protein binding(GO:0042043) |
| 0.2 | 0.8 | GO:0070740 | tubulin-glutamic acid ligase activity(GO:0070740) |
| 0.2 | 1.5 | GO:0031013 | troponin I binding(GO:0031013) |
| 0.2 | 2.1 | GO:0043522 | leucine zipper domain binding(GO:0043522) |
| 0.1 | 0.7 | GO:0047237 | glucuronylgalactosylproteoglycan 4-beta-N-acetylgalactosaminyltransferase activity(GO:0047237) |
| 0.1 | 0.6 | GO:0043812 | phosphatidylinositol-4-phosphate phosphatase activity(GO:0043812) |
| 0.1 | 0.7 | GO:0047184 | 1-acylglycerophosphocholine O-acyltransferase activity(GO:0047184) |
| 0.1 | 3.4 | GO:0030676 | Rac guanyl-nucleotide exchange factor activity(GO:0030676) |
| 0.1 | 0.6 | GO:0008336 | gamma-butyrobetaine dioxygenase activity(GO:0008336) |
| 0.1 | 1.9 | GO:0005547 | phosphatidylinositol-3,4,5-trisphosphate binding(GO:0005547) |
| 0.1 | 0.4 | GO:0004828 | serine-tRNA ligase activity(GO:0004828) |
| 0.1 | 0.4 | GO:0017018 | myosin phosphatase activity(GO:0017018) |
| 0.1 | 1.1 | GO:0016413 | O-acetyltransferase activity(GO:0016413) |
| 0.1 | 1.3 | GO:0030976 | thiamine pyrophosphate binding(GO:0030976) |
| 0.1 | 1.7 | GO:0043295 | glutathione binding(GO:0043295) |
| 0.1 | 2.1 | GO:0017134 | fibroblast growth factor binding(GO:0017134) |
| 0.1 | 0.6 | GO:1903135 | cupric ion binding(GO:1903135) |
| 0.1 | 0.6 | GO:0038132 | neuregulin binding(GO:0038132) |
| 0.1 | 0.6 | GO:0035497 | cAMP response element binding(GO:0035497) |
| 0.1 | 0.4 | GO:0005046 | KDEL sequence binding(GO:0005046) |
| 0.1 | 2.3 | GO:0044548 | S100 protein binding(GO:0044548) |
| 0.1 | 0.4 | GO:0030060 | L-malate dehydrogenase activity(GO:0030060) |
| 0.1 | 2.6 | GO:0070001 | aspartic-type endopeptidase activity(GO:0004190) aspartic-type peptidase activity(GO:0070001) |
| 0.1 | 1.0 | GO:0001849 | complement component C1q binding(GO:0001849) |
| 0.1 | 1.4 | GO:0016312 | inositol bisphosphate phosphatase activity(GO:0016312) |
| 0.1 | 0.5 | GO:0035473 | lipase binding(GO:0035473) |
| 0.1 | 0.1 | GO:0003923 | GPI-anchor transamidase activity(GO:0003923) |
| 0.1 | 0.8 | GO:0102337 | fatty acid elongase activity(GO:0009922) 3-oxo-arachidoyl-CoA synthase activity(GO:0102336) 3-oxo-cerotoyl-CoA synthase activity(GO:0102337) 3-oxo-lignoceronyl-CoA synthase activity(GO:0102338) |
| 0.1 | 0.5 | GO:0050693 | LBD domain binding(GO:0050693) |
| 0.1 | 0.9 | GO:0004035 | alkaline phosphatase activity(GO:0004035) |
| 0.1 | 1.9 | GO:0015280 | ligand-gated sodium channel activity(GO:0015280) |
| 0.1 | 0.4 | GO:0010997 | anaphase-promoting complex binding(GO:0010997) |
| 0.1 | 0.8 | GO:0034711 | inhibin binding(GO:0034711) |
| 0.1 | 0.9 | GO:0036122 | BMP binding(GO:0036122) |
| 0.1 | 0.8 | GO:0039552 | RIG-I binding(GO:0039552) |
| 0.1 | 0.5 | GO:0008889 | glycerophosphodiester phosphodiesterase activity(GO:0008889) |
| 0.1 | 2.6 | GO:0008331 | high voltage-gated calcium channel activity(GO:0008331) |
| 0.1 | 0.3 | GO:0031852 | mu-type opioid receptor binding(GO:0031852) |
| 0.1 | 9.0 | GO:0005089 | Rho guanyl-nucleotide exchange factor activity(GO:0005089) |
| 0.1 | 2.1 | GO:0043422 | protein kinase B binding(GO:0043422) |
| 0.1 | 2.2 | GO:0048018 | receptor agonist activity(GO:0048018) |
| 0.1 | 13.0 | GO:0005178 | integrin binding(GO:0005178) |
| 0.1 | 3.4 | GO:0047555 | 3',5'-cyclic-GMP phosphodiesterase activity(GO:0047555) |
| 0.1 | 1.1 | GO:0035877 | death effector domain binding(GO:0035877) |
| 0.1 | 1.2 | GO:0019215 | intermediate filament binding(GO:0019215) |
| 0.1 | 0.5 | GO:0050220 | prostaglandin-E synthase activity(GO:0050220) |
| 0.1 | 4.1 | GO:0001671 | ATPase activator activity(GO:0001671) |
| 0.1 | 0.7 | GO:1990829 | C-rich single-stranded DNA binding(GO:1990829) |
| 0.1 | 0.6 | GO:0004668 | protein-arginine deiminase activity(GO:0004668) |
| 0.1 | 0.4 | GO:0003829 | beta-1,3-galactosyl-O-glycosyl-glycoprotein beta-1,6-N-acetylglucosaminyltransferase activity(GO:0003829) |
| 0.1 | 1.8 | GO:0005229 | intracellular calcium activated chloride channel activity(GO:0005229) |
| 0.1 | 0.5 | GO:0004427 | inorganic diphosphatase activity(GO:0004427) |
| 0.1 | 1.1 | GO:0015129 | lactate transmembrane transporter activity(GO:0015129) |
| 0.1 | 2.6 | GO:0005521 | lamin binding(GO:0005521) |
| 0.1 | 1.7 | GO:0050750 | low-density lipoprotein particle receptor binding(GO:0050750) |
| 0.1 | 0.7 | GO:0016802 | adenosylhomocysteinase activity(GO:0004013) trialkylsulfonium hydrolase activity(GO:0016802) |
| 0.1 | 0.4 | GO:0010698 | acetyltransferase activator activity(GO:0010698) |
| 0.1 | 0.5 | GO:0004468 | lysine N-acetyltransferase activity, acting on acetyl phosphate as donor(GO:0004468) |
| 0.1 | 0.5 | GO:0019770 | IgG receptor activity(GO:0019770) |
| 0.1 | 0.8 | GO:1990459 | transferrin receptor binding(GO:1990459) |
| 0.1 | 1.4 | GO:0004128 | cytochrome-b5 reductase activity, acting on NAD(P)H(GO:0004128) |
| 0.1 | 1.5 | GO:0035256 | G-protein coupled glutamate receptor binding(GO:0035256) |
| 0.1 | 0.7 | GO:0098632 | protein binding involved in cell-cell adhesion(GO:0098632) |
| 0.1 | 0.6 | GO:0008073 | ornithine decarboxylase inhibitor activity(GO:0008073) |
| 0.1 | 0.6 | GO:0038051 | glucocorticoid receptor activity(GO:0004883) glucocorticoid-activated RNA polymerase II transcription factor binding transcription factor activity(GO:0038051) |
| 0.1 | 0.1 | GO:0052650 | NADP-retinol dehydrogenase activity(GO:0052650) |
| 0.1 | 1.4 | GO:0005522 | profilin binding(GO:0005522) |
| 0.1 | 0.7 | GO:0008158 | hedgehog receptor activity(GO:0008158) |
| 0.1 | 1.0 | GO:0016724 | ferroxidase activity(GO:0004322) oxidoreductase activity, oxidizing metal ions, oxygen as acceptor(GO:0016724) |
| 0.1 | 0.2 | GO:0015093 | ferrous iron transmembrane transporter activity(GO:0015093) |
| 0.1 | 2.2 | GO:0042813 | Wnt-activated receptor activity(GO:0042813) |
| 0.1 | 0.4 | GO:1990381 | ubiquitin-specific protease binding(GO:1990381) |
| 0.1 | 0.2 | GO:0071532 | ankyrin repeat binding(GO:0071532) |
| 0.1 | 0.5 | GO:0004906 | interferon-gamma receptor activity(GO:0004906) |
| 0.1 | 2.9 | GO:0043014 | alpha-tubulin binding(GO:0043014) |
| 0.1 | 0.1 | GO:0030957 | Tat protein binding(GO:0030957) |
| 0.1 | 2.4 | GO:0017081 | chloride channel regulator activity(GO:0017081) |
| 0.1 | 1.0 | GO:0036041 | long-chain fatty acid binding(GO:0036041) |
| 0.1 | 0.2 | GO:0070815 | peptidyl-lysine 5-dioxygenase activity(GO:0070815) |
| 0.1 | 0.6 | GO:0047499 | calcium-independent phospholipase A2 activity(GO:0047499) |
| 0.1 | 0.2 | GO:0050501 | hyaluronan synthase activity(GO:0050501) |
| 0.1 | 14.3 | GO:0044325 | ion channel binding(GO:0044325) |
| 0.1 | 6.3 | GO:0017048 | Rho GTPase binding(GO:0017048) |
| 0.1 | 0.5 | GO:0047374 | methylumbelliferyl-acetate deacetylase activity(GO:0047374) |
| 0.1 | 2.2 | GO:0070006 | metalloaminopeptidase activity(GO:0070006) |
| 0.1 | 0.2 | GO:0019828 | aspartic-type endopeptidase inhibitor activity(GO:0019828) |
| 0.1 | 0.4 | GO:0005138 | interleukin-6 receptor binding(GO:0005138) |
| 0.1 | 2.0 | GO:0004383 | guanylate cyclase activity(GO:0004383) |
| 0.1 | 0.4 | GO:0047718 | 17-alpha,20-alpha-dihydroxypregn-4-en-3-one dehydrogenase activity(GO:0047006) indanol dehydrogenase activity(GO:0047718) |
| 0.1 | 0.4 | GO:0050473 | arachidonate 15-lipoxygenase activity(GO:0050473) |
| 0.1 | 0.6 | GO:0004634 | phosphopyruvate hydratase activity(GO:0004634) |
| 0.1 | 1.1 | GO:0035251 | UDP-glucosyltransferase activity(GO:0035251) |
| 0.1 | 0.2 | GO:0034648 | histone demethylase activity (H3-dimethyl-K4 specific)(GO:0034648) |
| 0.1 | 1.2 | GO:0034237 | protein kinase A regulatory subunit binding(GO:0034237) |
| 0.1 | 1.0 | GO:0004579 | oligosaccharyl transferase activity(GO:0004576) dolichyl-diphosphooligosaccharide-protein glycotransferase activity(GO:0004579) |
| 0.1 | 0.6 | GO:0008467 | [heparan sulfate]-glucosamine 3-sulfotransferase 1 activity(GO:0008467) |
| 0.1 | 1.2 | GO:0008432 | JUN kinase binding(GO:0008432) |
| 0.1 | 1.7 | GO:0102391 | decanoate--CoA ligase activity(GO:0102391) |
| 0.1 | 0.2 | GO:0004611 | phosphoenolpyruvate carboxykinase activity(GO:0004611) phosphoenolpyruvate carboxykinase (GTP) activity(GO:0004613) |
| 0.1 | 8.1 | GO:0004222 | metalloendopeptidase activity(GO:0004222) |
| 0.1 | 0.3 | GO:0004887 | thyroid hormone receptor activity(GO:0004887) |
| 0.1 | 1.7 | GO:0004861 | cyclin-dependent protein serine/threonine kinase inhibitor activity(GO:0004861) |
| 0.1 | 0.4 | GO:0052851 | cupric reductase activity(GO:0008823) ferric-chelate reductase (NADPH) activity(GO:0052851) |
| 0.1 | 2.5 | GO:0004602 | glutathione peroxidase activity(GO:0004602) |
| 0.1 | 1.4 | GO:0045236 | CXCR chemokine receptor binding(GO:0045236) |
| 0.1 | 34.5 | GO:0045296 | cadherin binding(GO:0045296) |
| 0.1 | 2.1 | GO:0004029 | aldehyde dehydrogenase (NAD) activity(GO:0004029) |
| 0.1 | 0.8 | GO:0000150 | recombinase activity(GO:0000150) |
| 0.1 | 0.4 | GO:0019855 | calcium channel inhibitor activity(GO:0019855) |
| 0.1 | 1.2 | GO:0008157 | protein phosphatase 1 binding(GO:0008157) |
| 0.1 | 0.5 | GO:0016715 | oxidoreductase activity, acting on paired donors, with incorporation or reduction of molecular oxygen, reduced ascorbate as one donor, and incorporation of one atom of oxygen(GO:0016715) |
| 0.1 | 1.6 | GO:0017022 | myosin binding(GO:0017022) |
| 0.1 | 3.3 | GO:0001540 | beta-amyloid binding(GO:0001540) |
| 0.1 | 0.5 | GO:0019531 | oxalate transmembrane transporter activity(GO:0019531) |
| 0.1 | 0.4 | GO:0004815 | aspartate-tRNA ligase activity(GO:0004815) |
| 0.1 | 23.4 | GO:0003779 | actin binding(GO:0003779) |
| 0.1 | 0.7 | GO:0015349 | thyroid hormone transmembrane transporter activity(GO:0015349) |
| 0.1 | 2.3 | GO:0005031 | tumor necrosis factor-activated receptor activity(GO:0005031) death receptor activity(GO:0005035) |
| 0.1 | 0.3 | GO:0004803 | transposase activity(GO:0004803) |
| 0.1 | 0.3 | GO:0008195 | phosphatidate phosphatase activity(GO:0008195) |
| 0.1 | 0.4 | GO:0045134 | uridine-diphosphatase activity(GO:0045134) |
| 0.1 | 0.3 | GO:0004913 | interleukin-4 receptor activity(GO:0004913) |
| 0.1 | 2.3 | GO:0046933 | proton-transporting ATP synthase activity, rotational mechanism(GO:0046933) |
| 0.1 | 0.5 | GO:0005545 | 1-phosphatidylinositol binding(GO:0005545) |
| 0.1 | 0.2 | GO:0015193 | L-proline transmembrane transporter activity(GO:0015193) |
| 0.1 | 0.7 | GO:0003836 | beta-galactoside (CMP) alpha-2,3-sialyltransferase activity(GO:0003836) |
| 0.1 | 1.0 | GO:0097109 | neuroligin family protein binding(GO:0097109) |
| 0.1 | 0.7 | GO:0004111 | creatine kinase activity(GO:0004111) |
| 0.1 | 0.9 | GO:0005041 | low-density lipoprotein receptor activity(GO:0005041) |
| 0.1 | 2.7 | GO:0005484 | SNAP receptor activity(GO:0005484) |
| 0.1 | 2.0 | GO:0016805 | dipeptidase activity(GO:0016805) |
| 0.1 | 1.2 | GO:0050431 | transforming growth factor beta binding(GO:0050431) |
| 0.1 | 0.2 | GO:0042296 | ISG15 transferase activity(GO:0042296) |
| 0.1 | 0.6 | GO:0032794 | GTPase activating protein binding(GO:0032794) |
| 0.1 | 0.5 | GO:0003920 | GMP reductase activity(GO:0003920) oxidoreductase activity, acting on NAD(P)H, nitrogenous group as acceptor(GO:0016657) |
| 0.1 | 1.4 | GO:0004112 | cyclic-nucleotide phosphodiesterase activity(GO:0004112) |
| 0.1 | 0.6 | GO:0042056 | chemoattractant activity(GO:0042056) |
| 0.1 | 4.9 | GO:0019003 | GDP binding(GO:0019003) |
| 0.1 | 0.8 | GO:0008020 | G-protein coupled photoreceptor activity(GO:0008020) |
| 0.1 | 0.2 | GO:0008534 | oxidized purine nucleobase lesion DNA N-glycosylase activity(GO:0008534) |
| 0.1 | 0.3 | GO:0017040 | ceramidase activity(GO:0017040) |
| 0.1 | 0.2 | GO:0003680 | AT DNA binding(GO:0003680) |
| 0.1 | 0.5 | GO:0046790 | virion binding(GO:0046790) |
| 0.1 | 0.3 | GO:0061628 | H3K27me3 modified histone binding(GO:0061628) |
| 0.1 | 0.2 | GO:0031711 | angiotensin type I receptor activity(GO:0001596) bradykinin receptor binding(GO:0031711) |
| 0.1 | 0.3 | GO:0005375 | copper ion transmembrane transporter activity(GO:0005375) |
| 0.1 | 0.6 | GO:0019200 | carbohydrate kinase activity(GO:0019200) |
| 0.1 | 1.1 | GO:0051959 | dynein light intermediate chain binding(GO:0051959) |
| 0.1 | 0.2 | GO:0047223 | beta-1,3-galactosyl-O-glycosyl-glycoprotein beta-1,3-N-acetylglucosaminyltransferase activity(GO:0047223) |
| 0.1 | 0.2 | GO:0046921 | glycoprotein 6-alpha-L-fucosyltransferase activity(GO:0008424) alpha-(1->6)-fucosyltransferase activity(GO:0046921) |
| 0.1 | 0.9 | GO:0022889 | L-serine transmembrane transporter activity(GO:0015194) serine transmembrane transporter activity(GO:0022889) |
| 0.1 | 0.1 | GO:0035374 | chondroitin sulfate binding(GO:0035374) |
| 0.1 | 0.4 | GO:0008821 | crossover junction endodeoxyribonuclease activity(GO:0008821) |
| 0.1 | 0.4 | GO:0004331 | 6-phosphofructo-2-kinase activity(GO:0003873) fructose-2,6-bisphosphate 2-phosphatase activity(GO:0004331) |
| 0.1 | 0.2 | GO:0003945 | N-acetyllactosamine synthase activity(GO:0003945) |
| 0.1 | 0.1 | GO:0035651 | AP-3 adaptor complex binding(GO:0035651) |
| 0.1 | 0.1 | GO:0005544 | calcium-dependent phospholipid binding(GO:0005544) |
| 0.1 | 0.1 | GO:0001007 | transcription factor activity, core RNA polymerase III binding(GO:0000995) transcription factor activity, RNA polymerase III transcription factor binding(GO:0001007) |
| 0.1 | 0.2 | GO:0071209 | U7 snRNA binding(GO:0071209) |
| 0.1 | 0.3 | GO:0034185 | apolipoprotein binding(GO:0034185) |
| 0.1 | 0.7 | GO:0004075 | biotin carboxylase activity(GO:0004075) |
| 0.1 | 0.1 | GO:0004515 | nicotinate-nucleotide adenylyltransferase activity(GO:0004515) |
| 0.1 | 1.3 | GO:0015923 | mannosidase activity(GO:0015923) |
| 0.1 | 0.3 | GO:0044388 | small protein activating enzyme binding(GO:0044388) |
| 0.1 | 0.3 | GO:0070576 | vitamin D 24-hydroxylase activity(GO:0070576) |
| 0.1 | 1.0 | GO:0016864 | protein disulfide isomerase activity(GO:0003756) intramolecular oxidoreductase activity, transposing S-S bonds(GO:0016864) |
| 0.1 | 0.9 | GO:0004745 | retinol dehydrogenase activity(GO:0004745) |
| 0.1 | 0.9 | GO:0005247 | voltage-gated chloride channel activity(GO:0005247) |
| 0.1 | 0.5 | GO:0043274 | phospholipase binding(GO:0043274) |
| 0.1 | 0.3 | GO:1904264 | ubiquitin protein ligase activity involved in ERAD pathway(GO:1904264) |
| 0.1 | 0.3 | GO:0016405 | CoA-ligase activity(GO:0016405) |
| 0.1 | 1.2 | GO:0003950 | NAD+ ADP-ribosyltransferase activity(GO:0003950) |
| 0.1 | 0.4 | GO:0000182 | rDNA binding(GO:0000182) |
| 0.1 | 5.9 | GO:0003730 | mRNA 3'-UTR binding(GO:0003730) |
| 0.1 | 0.3 | GO:0031420 | alkali metal ion binding(GO:0031420) |
| 0.1 | 0.6 | GO:0043395 | heparan sulfate proteoglycan binding(GO:0043395) |
| 0.1 | 0.6 | GO:0004726 | non-membrane spanning protein tyrosine phosphatase activity(GO:0004726) |
| 0.1 | 0.4 | GO:0051033 | nucleic acid transmembrane transporter activity(GO:0051032) RNA transmembrane transporter activity(GO:0051033) |
| 0.1 | 0.5 | GO:0004873 | asialoglycoprotein receptor activity(GO:0004873) |
| 0.1 | 0.6 | GO:0015035 | protein disulfide oxidoreductase activity(GO:0015035) |
| 0.1 | 0.5 | GO:0051864 | histone demethylase activity (H3-K36 specific)(GO:0051864) |
| 0.1 | 0.2 | GO:0033300 | dehydroascorbic acid transporter activity(GO:0033300) |
| 0.1 | 0.1 | GO:0005137 | interleukin-5 receptor binding(GO:0005137) |
| 0.1 | 0.7 | GO:0030306 | ADP-ribosylation factor binding(GO:0030306) |
| 0.1 | 0.5 | GO:0008093 | cytoskeletal adaptor activity(GO:0008093) |
| 0.1 | 0.2 | GO:0004045 | aminoacyl-tRNA hydrolase activity(GO:0004045) |
| 0.1 | 0.2 | GO:0015252 | hydrogen ion channel activity(GO:0015252) |
| 0.1 | 0.4 | GO:0019788 | NEDD8 transferase activity(GO:0019788) |
| 0.1 | 0.2 | GO:0018685 | alkane 1-monooxygenase activity(GO:0018685) |
| 0.1 | 0.1 | GO:0004457 | lactate dehydrogenase activity(GO:0004457) L-lactate dehydrogenase activity(GO:0004459) |
| 0.1 | 0.4 | GO:0016167 | glial cell-derived neurotrophic factor receptor activity(GO:0016167) |
| 0.1 | 0.2 | GO:0008900 | hydrogen:potassium-exchanging ATPase activity(GO:0008900) |
| 0.1 | 1.0 | GO:0016620 | oxidoreductase activity, acting on the aldehyde or oxo group of donors, NAD or NADP as acceptor(GO:0016620) |
| 0.1 | 0.3 | GO:0032190 | acrosin binding(GO:0032190) |
| 0.1 | 0.4 | GO:0043495 | protein anchor(GO:0043495) |
| 0.1 | 1.6 | GO:0043621 | protein self-association(GO:0043621) |
| 0.1 | 0.2 | GO:0009881 | photoreceptor activity(GO:0009881) |
| 0.1 | 0.3 | GO:0070728 | leucine binding(GO:0070728) |
| 0.1 | 1.9 | GO:0046332 | SMAD binding(GO:0046332) |
| 0.1 | 0.4 | GO:0032051 | clathrin light chain binding(GO:0032051) |
| 0.1 | 0.3 | GO:0004991 | parathyroid hormone receptor activity(GO:0004991) |
| 0.1 | 0.5 | GO:0016755 | transferase activity, transferring amino-acyl groups(GO:0016755) |
| 0.1 | 0.1 | GO:0019956 | chemokine binding(GO:0019956) |
| 0.1 | 0.3 | GO:0035800 | deubiquitinase activator activity(GO:0035800) |
| 0.1 | 1.1 | GO:0005528 | macrolide binding(GO:0005527) FK506 binding(GO:0005528) |
| 0.1 | 2.3 | GO:0015459 | potassium channel regulator activity(GO:0015459) |
| 0.0 | 1.2 | GO:0048306 | calcium-dependent protein binding(GO:0048306) |
| 0.0 | 0.2 | GO:0061714 | folic acid receptor activity(GO:0061714) |
| 0.0 | 0.1 | GO:0004530 | deoxyribonuclease I activity(GO:0004530) |
| 0.0 | 2.5 | GO:0032947 | protein complex scaffold(GO:0032947) |
| 0.0 | 0.1 | GO:0035673 | oligopeptide transmembrane transporter activity(GO:0035673) |
| 0.0 | 0.2 | GO:0017060 | 3-galactosyl-N-acetylglucosaminide 4-alpha-L-fucosyltransferase activity(GO:0017060) |
| 0.0 | 2.9 | GO:0030165 | PDZ domain binding(GO:0030165) |
| 0.0 | 0.3 | GO:0070182 | DNA polymerase binding(GO:0070182) |
| 0.0 | 1.3 | GO:0051879 | Hsp90 protein binding(GO:0051879) |
| 0.0 | 0.1 | GO:0030296 | protein tyrosine kinase activator activity(GO:0030296) |
| 0.0 | 0.2 | GO:0047057 | oxidoreductase activity, acting on the CH-OH group of donors, disulfide as acceptor(GO:0016900) vitamin-K-epoxide reductase (warfarin-sensitive) activity(GO:0047057) |
| 0.0 | 0.3 | GO:0008454 | alpha-1,3-mannosylglycoprotein 4-beta-N-acetylglucosaminyltransferase activity(GO:0008454) |
| 0.0 | 0.2 | GO:0070180 | large ribosomal subunit rRNA binding(GO:0070180) |
| 0.0 | 0.2 | GO:0004995 | tachykinin receptor activity(GO:0004995) |
| 0.0 | 0.8 | GO:0017080 | sodium channel regulator activity(GO:0017080) |
| 0.0 | 1.5 | GO:0016709 | oxidoreductase activity, acting on paired donors, with incorporation or reduction of molecular oxygen, NAD(P)H as one donor, and incorporation of one atom of oxygen(GO:0016709) |
| 0.0 | 0.3 | GO:0044594 | 3alpha,7alpha,12alpha-trihydroxy-5beta-cholest-24-enoyl-CoA hydratase activity(GO:0033989) 17-beta-hydroxysteroid dehydrogenase (NAD+) activity(GO:0044594) |
| 0.0 | 0.1 | GO:0019912 | cyclin-dependent protein kinase activating kinase activity(GO:0019912) |
| 0.0 | 0.8 | GO:0005546 | phosphatidylinositol-4,5-bisphosphate binding(GO:0005546) |
| 0.0 | 0.3 | GO:1990405 | protein antigen binding(GO:1990405) |
| 0.0 | 0.2 | GO:0050294 | steroid sulfotransferase activity(GO:0050294) |
| 0.0 | 0.0 | GO:0001083 | transcription factor activity, RNA polymerase II basal transcription factor binding(GO:0001083) |
| 0.0 | 0.2 | GO:0003960 | NADPH:quinone reductase activity(GO:0003960) |
| 0.0 | 0.5 | GO:0097371 | MDM2/MDM4 family protein binding(GO:0097371) |
| 0.0 | 0.5 | GO:0005537 | mannose binding(GO:0005537) |
| 0.0 | 0.3 | GO:0019784 | NEDD8-specific protease activity(GO:0019784) |
| 0.0 | 0.4 | GO:0043426 | MRF binding(GO:0043426) |
| 0.0 | 0.2 | GO:0005332 | gamma-aminobutyric acid:sodium symporter activity(GO:0005332) gamma-aminobutyric acid transmembrane transporter activity(GO:0015185) |
| 0.0 | 0.1 | GO:0071987 | WD40-repeat domain binding(GO:0071987) |
| 0.0 | 0.2 | GO:0052740 | 1-acyl-2-lysophosphatidylserine acylhydrolase activity(GO:0052740) |
| 0.0 | 0.0 | GO:0004716 | receptor signaling protein tyrosine kinase activity(GO:0004716) |
| 0.0 | 1.1 | GO:0005507 | copper ion binding(GO:0005507) |
| 0.0 | 0.5 | GO:0070330 | aromatase activity(GO:0070330) |
| 0.0 | 0.2 | GO:0008417 | fucosyltransferase activity(GO:0008417) |
| 0.0 | 0.2 | GO:0050780 | dopamine receptor binding(GO:0050780) |
| 0.0 | 0.1 | GO:0052796 | exo-alpha-(2->3)-sialidase activity(GO:0052794) exo-alpha-(2->6)-sialidase activity(GO:0052795) exo-alpha-(2->8)-sialidase activity(GO:0052796) |
| 0.0 | 0.1 | GO:0030366 | molybdopterin synthase activity(GO:0030366) |
| 0.0 | 0.2 | GO:0004692 | cGMP-dependent protein kinase activity(GO:0004692) |
| 0.0 | 0.1 | GO:0047631 | ADP-ribose diphosphatase activity(GO:0047631) |
| 0.0 | 0.5 | GO:0030276 | clathrin binding(GO:0030276) |
| 0.0 | 0.2 | GO:0001104 | RNA polymerase II transcription cofactor activity(GO:0001104) |
| 0.0 | 0.1 | GO:0004308 | exo-alpha-sialidase activity(GO:0004308) alpha-sialidase activity(GO:0016997) |
| 0.0 | 0.1 | GO:0043891 | glyceraldehyde-3-phosphate dehydrogenase (NAD+) (phosphorylating) activity(GO:0004365) glyceraldehyde-3-phosphate dehydrogenase (NAD(P)+) (phosphorylating) activity(GO:0043891) |
| 0.0 | 1.1 | GO:0017137 | Rab GTPase binding(GO:0017137) |
| 0.0 | 0.7 | GO:0004435 | phosphatidylinositol phospholipase C activity(GO:0004435) |
| 0.0 | 0.4 | GO:0032395 | MHC class II receptor activity(GO:0032395) |
| 0.0 | 0.2 | GO:0008172 | S-methyltransferase activity(GO:0008172) |
| 0.0 | 0.7 | GO:0005501 | retinoid binding(GO:0005501) |
| 0.0 | 0.1 | GO:0051377 | mannose-ethanolamine phosphotransferase activity(GO:0051377) |
| 0.0 | 0.2 | GO:0004473 | malic enzyme activity(GO:0004470) malate dehydrogenase (decarboxylating) (NAD+) activity(GO:0004471) malate dehydrogenase (decarboxylating) (NADP+) activity(GO:0004473) oxaloacetate decarboxylase activity(GO:0008948) |
| 0.0 | 0.4 | GO:0017091 | AU-rich element binding(GO:0017091) |
| 0.0 | 0.3 | GO:0046875 | ephrin receptor binding(GO:0046875) |
| 0.0 | 0.5 | GO:0031683 | G-protein beta/gamma-subunit complex binding(GO:0031683) |
| 0.0 | 0.3 | GO:0015929 | hexosaminidase activity(GO:0015929) |
| 0.0 | 0.1 | GO:0090554 | phosphatidylcholine-translocating ATPase activity(GO:0090554) |
| 0.0 | 0.2 | GO:0003828 | alpha-N-acetylneuraminate alpha-2,8-sialyltransferase activity(GO:0003828) |
| 0.0 | 0.1 | GO:0035671 | 3-oxo-5-alpha-steroid 4-dehydrogenase activity(GO:0003865) steroid dehydrogenase activity, acting on the CH-CH group of donors(GO:0033765) enone reductase activity(GO:0035671) cholestenone 5-alpha-reductase activity(GO:0047751) |
| 0.0 | 0.1 | GO:0017153 | sodium:dicarboxylate symporter activity(GO:0017153) |
| 0.0 | 0.0 | GO:0004488 | methenyltetrahydrofolate cyclohydrolase activity(GO:0004477) methylenetetrahydrofolate dehydrogenase (NAD+) activity(GO:0004487) methylenetetrahydrofolate dehydrogenase (NADP+) activity(GO:0004488) |
| 0.0 | 0.6 | GO:0004708 | MAP kinase kinase activity(GO:0004708) |
| 0.0 | 0.2 | GO:0046703 | natural killer cell lectin-like receptor binding(GO:0046703) |
| 0.0 | 12.2 | GO:0005509 | calcium ion binding(GO:0005509) |
| 0.0 | 0.4 | GO:0005104 | fibroblast growth factor receptor binding(GO:0005104) |
| 0.0 | 0.2 | GO:0016861 | intramolecular oxidoreductase activity, interconverting aldoses and ketoses(GO:0016861) |
| 0.0 | 0.3 | GO:0008236 | serine-type peptidase activity(GO:0008236) |
| 0.0 | 0.2 | GO:0004767 | sphingomyelin phosphodiesterase activity(GO:0004767) |
| 0.0 | 0.1 | GO:0016422 | mRNA (2'-O-methyladenosine-N6-)-methyltransferase activity(GO:0016422) |
| 0.0 | 0.4 | GO:0000339 | RNA cap binding(GO:0000339) |
| 0.0 | 0.1 | GO:0017151 | DEAD/H-box RNA helicase binding(GO:0017151) |
| 0.0 | 0.5 | GO:0004364 | glutathione transferase activity(GO:0004364) |
| 0.0 | 0.1 | GO:0030151 | molybdenum ion binding(GO:0030151) |
| 0.0 | 0.0 | GO:0004711 | ribosomal protein S6 kinase activity(GO:0004711) |
| 0.0 | 0.1 | GO:0008502 | melatonin receptor activity(GO:0008502) |
| 0.0 | 0.1 | GO:0004839 | ubiquitin activating enzyme activity(GO:0004839) |
| 0.0 | 0.7 | GO:0051287 | NAD binding(GO:0051287) |
| 0.0 | 0.0 | GO:0036033 | mediator complex binding(GO:0036033) |
| 0.0 | 0.3 | GO:0003924 | GTPase activity(GO:0003924) |
| 0.0 | 0.2 | GO:0004679 | AMP-activated protein kinase activity(GO:0004679) |
| 0.0 | 0.1 | GO:0070290 | N-acylphosphatidylethanolamine-specific phospholipase D activity(GO:0070290) |
| 0.0 | 0.4 | GO:0019905 | syntaxin binding(GO:0019905) |
| 0.0 | 0.3 | GO:0016702 | oxidoreductase activity, acting on single donors with incorporation of molecular oxygen, incorporation of two atoms of oxygen(GO:0016702) |
| 0.0 | 4.0 | GO:0005096 | GTPase activator activity(GO:0005096) |
| 0.0 | 0.0 | GO:0016429 | tRNA (adenine) methyltransferase activity(GO:0016426) tRNA (adenine-N1-)-methyltransferase activity(GO:0016429) |
| 0.0 | 0.1 | GO:0019534 | toxin transporter activity(GO:0019534) |
| 0.0 | 1.7 | GO:0003705 | transcription factor activity, RNA polymerase II distal enhancer sequence-specific binding(GO:0003705) |
| 0.0 | 0.1 | GO:0008569 | ATP-dependent microtubule motor activity, minus-end-directed(GO:0008569) |
| 0.0 | 0.0 | GO:0035613 | RNA stem-loop binding(GO:0035613) |
| 0.0 | 0.3 | GO:0008510 | sodium:bicarbonate symporter activity(GO:0008510) |
| 0.0 | 0.0 | GO:0002046 | opsin binding(GO:0002046) |
| 0.0 | 0.3 | GO:0030374 | ligand-dependent nuclear receptor transcription coactivator activity(GO:0030374) |
| 0.0 | 0.3 | GO:0042605 | peptide antigen binding(GO:0042605) |
| 0.0 | 0.1 | GO:1990226 | histone methyltransferase binding(GO:1990226) |
| 0.0 | 0.0 | GO:0016434 | rRNA (cytosine) methyltransferase activity(GO:0016434) |
| 0.0 | 0.1 | GO:0005225 | volume-sensitive anion channel activity(GO:0005225) |
| 0.0 | 0.0 | GO:0034584 | piRNA binding(GO:0034584) |
| 0.0 | 0.1 | GO:0008440 | inositol-1,4,5-trisphosphate 3-kinase activity(GO:0008440) |
| 0.0 | 0.1 | GO:0008607 | phosphorylase kinase regulator activity(GO:0008607) |
Gene overrepresentation in biological_process category:
| Log-likelihood per target | Total log-likelihood | Term | Description |
|---|---|---|---|
| 0.9 | 6.1 | GO:2000483 | negative regulation of interleukin-8 secretion(GO:2000483) |
| 0.7 | 2.0 | GO:0010652 | regulation of cell communication by chemical coupling(GO:0010645) positive regulation of cell communication by chemical coupling(GO:0010652) |
| 0.6 | 5.1 | GO:1900625 | regulation of monocyte aggregation(GO:1900623) positive regulation of monocyte aggregation(GO:1900625) |
| 0.6 | 2.2 | GO:0001971 | negative regulation of activation of membrane attack complex(GO:0001971) |
| 0.6 | 3.9 | GO:0051414 | response to cortisol(GO:0051414) |
| 0.5 | 1.5 | GO:0070563 | negative regulation of vitamin D receptor signaling pathway(GO:0070563) |
| 0.4 | 2.6 | GO:1902957 | negative regulation of mitochondrial electron transport, NADH to ubiquinone(GO:1902957) |
| 0.4 | 3.0 | GO:0032596 | protein transport within lipid bilayer(GO:0032594) protein transport into membrane raft(GO:0032596) |
| 0.4 | 1.4 | GO:0018242 | protein O-linked glycosylation via serine(GO:0018242) |
| 0.3 | 1.0 | GO:1901503 | ether lipid biosynthetic process(GO:0008611) glycerol ether biosynthetic process(GO:0046504) ether biosynthetic process(GO:1901503) |
| 0.3 | 0.9 | GO:1990502 | dense core granule maturation(GO:1990502) |
| 0.3 | 1.1 | GO:1900533 | medium-chain fatty-acyl-CoA catabolic process(GO:0036114) long-chain fatty-acyl-CoA catabolic process(GO:0036116) palmitic acid metabolic process(GO:1900533) palmitic acid biosynthetic process(GO:1900535) |
| 0.3 | 1.1 | GO:0035880 | embryonic nail plate morphogenesis(GO:0035880) |
| 0.2 | 0.7 | GO:0006145 | purine nucleobase catabolic process(GO:0006145) |
| 0.2 | 1.2 | GO:0001957 | intramembranous ossification(GO:0001957) direct ossification(GO:0036072) |
| 0.2 | 0.7 | GO:0006059 | hexitol metabolic process(GO:0006059) |
| 0.2 | 2.5 | GO:0035986 | senescence-associated heterochromatin focus assembly(GO:0035986) |
| 0.2 | 0.6 | GO:0034124 | regulation of MyD88-dependent toll-like receptor signaling pathway(GO:0034124) |
| 0.2 | 2.7 | GO:0035372 | protein localization to microtubule(GO:0035372) |
| 0.2 | 0.8 | GO:0034344 | type III interferon production(GO:0034343) regulation of type III interferon production(GO:0034344) |
| 0.2 | 0.7 | GO:0007499 | ectoderm and mesoderm interaction(GO:0007499) |
| 0.2 | 1.1 | GO:0003350 | pulmonary myocardium development(GO:0003350) |
| 0.2 | 1.1 | GO:0036016 | response to interleukin-3(GO:0036015) cellular response to interleukin-3(GO:0036016) |
| 0.2 | 0.7 | GO:0039534 | negative regulation of MDA-5 signaling pathway(GO:0039534) |
| 0.2 | 0.5 | GO:1905154 | negative regulation of membrane invagination(GO:1905154) |
| 0.2 | 1.6 | GO:0002480 | antigen processing and presentation of exogenous peptide antigen via MHC class I, TAP-independent(GO:0002480) |
| 0.2 | 0.7 | GO:0010701 | positive regulation of norepinephrine secretion(GO:0010701) |
| 0.2 | 3.9 | GO:0030208 | dermatan sulfate biosynthetic process(GO:0030208) |
| 0.2 | 0.6 | GO:0048698 | negative regulation of collateral sprouting in absence of injury(GO:0048698) |
| 0.2 | 0.8 | GO:2000769 | regulation of unidimensional cell growth(GO:0051510) negative regulation of unidimensional cell growth(GO:0051511) establishment of cell polarity regulating cell shape(GO:0071964) regulation of establishment or maintenance of cell polarity regulating cell shape(GO:2000769) positive regulation of establishment or maintenance of cell polarity regulating cell shape(GO:2000771) regulation of establishment of cell polarity regulating cell shape(GO:2000782) positive regulation of establishment of cell polarity regulating cell shape(GO:2000784) regulation of barbed-end actin filament capping(GO:2000812) positive regulation of barbed-end actin filament capping(GO:2000814) |
| 0.2 | 1.2 | GO:1903750 | negative regulation of establishment of protein localization to mitochondrion(GO:1903748) regulation of intrinsic apoptotic signaling pathway in response to hydrogen peroxide(GO:1903750) negative regulation of intrinsic apoptotic signaling pathway in response to hydrogen peroxide(GO:1903751) |
| 0.1 | 0.6 | GO:0043323 | regulation of natural killer cell degranulation(GO:0043321) positive regulation of natural killer cell degranulation(GO:0043323) |
| 0.1 | 3.4 | GO:0003334 | keratinocyte development(GO:0003334) |
| 0.1 | 0.7 | GO:0006990 | positive regulation of transcription from RNA polymerase II promoter involved in unfolded protein response(GO:0006990) |
| 0.1 | 0.3 | GO:0039689 | negative stranded viral RNA replication(GO:0039689) multi-organism biosynthetic process(GO:0044034) |
| 0.1 | 0.5 | GO:0006710 | androgen catabolic process(GO:0006710) |
| 0.1 | 0.3 | GO:0044314 | protein K27-linked ubiquitination(GO:0044314) |
| 0.1 | 1.0 | GO:0048386 | positive regulation of retinoic acid receptor signaling pathway(GO:0048386) |
| 0.1 | 0.9 | GO:0061087 | positive regulation of histone H3-K27 methylation(GO:0061087) |
| 0.1 | 0.5 | GO:0071874 | cellular response to norepinephrine stimulus(GO:0071874) |
| 0.1 | 0.3 | GO:0019287 | isopentenyl diphosphate biosynthetic process, mevalonate pathway(GO:0019287) |
| 0.1 | 0.4 | GO:0006391 | transcription initiation from mitochondrial promoter(GO:0006391) |
| 0.1 | 0.3 | GO:0072709 | cellular response to sorbitol(GO:0072709) |
| 0.1 | 0.4 | GO:0000103 | sulfate assimilation(GO:0000103) |
| 0.1 | 0.9 | GO:0045329 | carnitine biosynthetic process(GO:0045329) |
| 0.1 | 0.4 | GO:0036518 | chemorepulsion of dopaminergic neuron axon(GO:0036518) chemorepulsion of axon(GO:0061643) |
| 0.1 | 0.3 | GO:0060370 | susceptibility to T cell mediated cytotoxicity(GO:0060370) |
| 0.1 | 0.2 | GO:0038163 | thrombopoietin-mediated signaling pathway(GO:0038163) |
| 0.1 | 0.9 | GO:0097084 | vascular smooth muscle cell development(GO:0097084) |
| 0.1 | 0.3 | GO:0043456 | regulation of pentose-phosphate shunt(GO:0043456) |
| 0.1 | 0.5 | GO:0034441 | plasma lipoprotein particle oxidation(GO:0034441) |
| 0.1 | 0.3 | GO:0002503 | peptide antigen assembly with MHC class II protein complex(GO:0002503) |
| 0.1 | 0.7 | GO:0015866 | ADP transport(GO:0015866) |
| 0.1 | 0.2 | GO:0006578 | amino-acid betaine biosynthetic process(GO:0006578) |
| 0.1 | 1.6 | GO:0001829 | trophectodermal cell differentiation(GO:0001829) |
| 0.1 | 0.5 | GO:1902035 | positive regulation of hematopoietic stem cell proliferation(GO:1902035) |
| 0.1 | 0.2 | GO:0006121 | mitochondrial electron transport, succinate to ubiquinone(GO:0006121) |
| 0.1 | 0.4 | GO:0009149 | pyrimidine nucleoside triphosphate catabolic process(GO:0009149) pyrimidine deoxyribonucleoside triphosphate catabolic process(GO:0009213) |
| 0.1 | 1.5 | GO:0003215 | cardiac right ventricle morphogenesis(GO:0003215) |
| 0.1 | 0.4 | GO:1903553 | positive regulation of extracellular exosome assembly(GO:1903553) |
| 0.1 | 0.4 | GO:0060136 | embryonic process involved in female pregnancy(GO:0060136) |
| 0.1 | 0.4 | GO:1903378 | positive regulation of oxidative stress-induced neuron intrinsic apoptotic signaling pathway(GO:1903378) |
| 0.1 | 0.8 | GO:0035721 | intraciliary retrograde transport(GO:0035721) |
| 0.1 | 1.2 | GO:2000009 | negative regulation of protein localization to cell surface(GO:2000009) |
| 0.1 | 0.5 | GO:1901727 | protein kinase D signaling(GO:0089700) positive regulation of histone deacetylase activity(GO:1901727) |
| 0.1 | 0.5 | GO:0046826 | negative regulation of protein export from nucleus(GO:0046826) |
| 0.1 | 0.5 | GO:0031584 | activation of phospholipase D activity(GO:0031584) |
| 0.1 | 0.2 | GO:0031548 | regulation of brain-derived neurotrophic factor receptor signaling pathway(GO:0031548) |
| 0.1 | 0.4 | GO:0097428 | protein maturation by iron-sulfur cluster transfer(GO:0097428) |
| 0.1 | 0.4 | GO:0018212 | peptidyl-tyrosine phosphorylation(GO:0018108) peptidyl-tyrosine modification(GO:0018212) |
| 0.1 | 0.5 | GO:0010918 | positive regulation of mitochondrial membrane potential(GO:0010918) |
| 0.1 | 0.7 | GO:0032808 | lacrimal gland development(GO:0032808) |
| 0.1 | 1.1 | GO:0002726 | positive regulation of T cell cytokine production(GO:0002726) I-kappaB phosphorylation(GO:0007252) |
| 0.1 | 0.6 | GO:0044341 | sodium-dependent phosphate transport(GO:0044341) |
| 0.1 | 0.2 | GO:0007525 | somatic muscle development(GO:0007525) |
| 0.1 | 0.6 | GO:0045040 | protein import into mitochondrial outer membrane(GO:0045040) |
| 0.1 | 0.3 | GO:1903026 | negative regulation of RNA polymerase II regulatory region sequence-specific DNA binding(GO:1903026) |
| 0.1 | 0.2 | GO:0032815 | negative regulation of natural killer cell activation(GO:0032815) |
| 0.1 | 0.2 | GO:0019605 | benzoate metabolic process(GO:0018874) butyrate metabolic process(GO:0019605) |
| 0.1 | 0.2 | GO:0042264 | peptidyl-aspartic acid hydroxylation(GO:0042264) |
| 0.1 | 0.6 | GO:0015074 | DNA integration(GO:0015074) |
| 0.1 | 0.4 | GO:1900113 | negative regulation of histone H3-K9 trimethylation(GO:1900113) |
| 0.1 | 0.2 | GO:0036166 | phenotypic switching(GO:0036166) regulation of phenotypic switching(GO:1900239) |
| 0.0 | 0.2 | GO:0060356 | leucine import(GO:0060356) |
| 0.0 | 0.2 | GO:0035627 | ceramide transport(GO:0035627) |
| 0.0 | 0.2 | GO:0006127 | glycerophosphate shuttle(GO:0006127) |
| 0.0 | 0.3 | GO:0021523 | somatic motor neuron differentiation(GO:0021523) |
| 0.0 | 0.3 | GO:0071896 | protein localization to adherens junction(GO:0071896) |
| 0.0 | 0.1 | GO:0060613 | fat pad development(GO:0060613) |
| 0.0 | 0.6 | GO:1904903 | ESCRT complex disassembly(GO:1904896) ESCRT III complex disassembly(GO:1904903) |
| 0.0 | 0.9 | GO:0009312 | oligosaccharide biosynthetic process(GO:0009312) |
| 0.0 | 0.2 | GO:0001927 | exocyst assembly(GO:0001927) |
| 0.0 | 0.6 | GO:0007507 | heart development(GO:0007507) |
| 0.0 | 0.3 | GO:0015755 | fructose transport(GO:0015755) fructose import(GO:0032445) carbohydrate import into cell(GO:0097319) carbohydrate import across plasma membrane(GO:0098704) fructose import across plasma membrane(GO:1990539) |
| 0.0 | 0.2 | GO:0038170 | somatostatin receptor signaling pathway(GO:0038169) somatostatin signaling pathway(GO:0038170) |
| 0.0 | 0.3 | GO:0001951 | intestinal D-glucose absorption(GO:0001951) |
| 0.0 | 1.1 | GO:0006295 | nucleotide-excision repair, preincision complex stabilization(GO:0006293) nucleotide-excision repair, DNA incision, 3'-to lesion(GO:0006295) |
| 0.0 | 0.2 | GO:1902573 | positive regulation of serine-type endopeptidase activity(GO:1900005) positive regulation of serine-type peptidase activity(GO:1902573) |
| 0.0 | 0.5 | GO:2000675 | negative regulation of type B pancreatic cell apoptotic process(GO:2000675) |
| 0.0 | 0.2 | GO:0005984 | disaccharide metabolic process(GO:0005984) |
| 0.0 | 0.6 | GO:1903504 | regulation of mitotic cell cycle spindle assembly checkpoint(GO:0090266) regulation of mitotic spindle checkpoint(GO:1903504) |
| 0.0 | 0.7 | GO:1904646 | cellular response to beta-amyloid(GO:1904646) |
| 0.0 | 1.2 | GO:0048873 | homeostasis of number of cells within a tissue(GO:0048873) |
| 0.0 | 0.0 | GO:0018307 | enzyme active site formation(GO:0018307) |
| 0.0 | 0.1 | GO:0001983 | regulation of systemic arterial blood pressure by carotid sinus baroreceptor feedback(GO:0001978) baroreceptor response to increased systemic arterial blood pressure(GO:0001983) |
| 0.0 | 0.3 | GO:0015747 | urate transport(GO:0015747) |
| 0.0 | 1.3 | GO:0030262 | apoptotic nuclear changes(GO:0030262) |
| 0.0 | 0.3 | GO:2000049 | positive regulation of cell-cell adhesion mediated by cadherin(GO:2000049) |
| 0.0 | 0.1 | GO:0071918 | urea transmembrane transport(GO:0071918) |
| 0.0 | 0.2 | GO:0072733 | response to staurosporine(GO:0072733) cellular response to staurosporine(GO:0072734) |
| 0.0 | 0.1 | GO:0031860 | telomeric 3' overhang formation(GO:0031860) |
| 0.0 | 0.3 | GO:0034501 | protein localization to kinetochore(GO:0034501) |
| 0.0 | 0.1 | GO:2001301 | cellular response to interleukin-13(GO:0035963) lipoxin biosynthetic process(GO:2001301) lipoxin A4 metabolic process(GO:2001302) lipoxin A4 biosynthetic process(GO:2001303) |
| 0.0 | 0.6 | GO:0070886 | positive regulation of calcineurin-NFAT signaling cascade(GO:0070886) |
| 0.0 | 0.1 | GO:0043983 | histone H4-K12 acetylation(GO:0043983) |
| 0.0 | 0.3 | GO:0043374 | CD8-positive, alpha-beta T cell differentiation(GO:0043374) |
| 0.0 | 0.6 | GO:0032780 | negative regulation of ATPase activity(GO:0032780) |
| 0.0 | 0.3 | GO:0046007 | negative regulation of activated T cell proliferation(GO:0046007) |
| 0.0 | 0.6 | GO:0000002 | mitochondrial genome maintenance(GO:0000002) |
| 0.0 | 0.3 | GO:0006600 | creatine metabolic process(GO:0006600) |
| 0.0 | 0.7 | GO:0043968 | histone H2A acetylation(GO:0043968) |
| 0.0 | 0.1 | GO:0060743 | epithelial cell maturation involved in prostate gland development(GO:0060743) |
| 0.0 | 0.7 | GO:0000470 | maturation of LSU-rRNA(GO:0000470) |
| 0.0 | 1.0 | GO:0033119 | negative regulation of RNA splicing(GO:0033119) |
| 0.0 | 0.2 | GO:0016098 | monoterpenoid metabolic process(GO:0016098) |
| 0.0 | 0.6 | GO:0033522 | histone H2A ubiquitination(GO:0033522) |
| 0.0 | 0.8 | GO:0042407 | cristae formation(GO:0042407) |
| 0.0 | 0.2 | GO:0046654 | tetrahydrofolate biosynthetic process(GO:0046654) |
| 0.0 | 0.2 | GO:0001887 | selenium compound metabolic process(GO:0001887) |
| 0.0 | 1.0 | GO:0061615 | NADH regeneration(GO:0006735) glycolytic process through fructose-6-phosphate(GO:0061615) glycolytic process through glucose-6-phosphate(GO:0061620) canonical glycolysis(GO:0061621) glucose catabolic process to pyruvate(GO:0061718) |
| 0.0 | 0.0 | GO:1902626 | assembly of large subunit precursor of preribosome(GO:1902626) |
| 0.0 | 0.4 | GO:0006123 | mitochondrial electron transport, cytochrome c to oxygen(GO:0006123) |
| 0.0 | 0.1 | GO:1903564 | regulation of protein localization to cilium(GO:1903564) |
| 0.0 | 0.2 | GO:0051096 | positive regulation of helicase activity(GO:0051096) |
| 0.0 | 0.3 | GO:0000462 | maturation of SSU-rRNA from tricistronic rRNA transcript (SSU-rRNA, 5.8S rRNA, LSU-rRNA)(GO:0000462) |
| 0.0 | 0.3 | GO:0043248 | proteasome assembly(GO:0043248) |
| 0.0 | 0.4 | GO:0006465 | signal peptide processing(GO:0006465) |
| 0.0 | 0.2 | GO:0015939 | pantothenate metabolic process(GO:0015939) |
| 0.0 | 0.1 | GO:0040016 | embryonic cleavage(GO:0040016) |
| 0.0 | 0.1 | GO:0010735 | positive regulation of transcription via serum response element binding(GO:0010735) |
| 0.0 | 0.3 | GO:0040015 | negative regulation of multicellular organism growth(GO:0040015) |
| 0.0 | 0.1 | GO:0097646 | calcitonin family receptor signaling pathway(GO:0097646) amylin receptor signaling pathway(GO:0097647) |
| 0.0 | 0.1 | GO:0090166 | Golgi disassembly(GO:0090166) |
| 0.0 | 0.2 | GO:2001140 | regulation of phospholipid transport(GO:2001138) positive regulation of phospholipid transport(GO:2001140) |
| 0.0 | 0.3 | GO:0090315 | negative regulation of protein targeting to membrane(GO:0090315) |
| 0.0 | 0.1 | GO:0042262 | DNA protection(GO:0042262) |
| 0.0 | 1.0 | GO:0032508 | DNA duplex unwinding(GO:0032508) |
| 0.0 | 0.1 | GO:2001015 | negative regulation of skeletal muscle cell differentiation(GO:2001015) |
| 0.0 | 0.1 | GO:0043951 | negative regulation of cAMP-mediated signaling(GO:0043951) |
| 0.0 | 0.1 | GO:0014067 | negative regulation of phosphatidylinositol 3-kinase signaling(GO:0014067) |
| 0.0 | 0.2 | GO:0002227 | innate immune response in mucosa(GO:0002227) |
| 0.0 | 0.1 | GO:0008627 | intrinsic apoptotic signaling pathway in response to osmotic stress(GO:0008627) |
| 0.0 | 0.3 | GO:0043921 | modulation by host of viral transcription(GO:0043921) modulation by host of symbiont transcription(GO:0052472) |
| 0.0 | 0.0 | GO:0001969 | activation of membrane attack complex(GO:0001905) regulation of activation of membrane attack complex(GO:0001969) |
| 0.0 | 0.3 | GO:0016242 | negative regulation of macroautophagy(GO:0016242) |
| 0.0 | 0.2 | GO:0030889 | negative regulation of B cell proliferation(GO:0030889) |
| 0.0 | 0.3 | GO:0061418 | regulation of transcription from RNA polymerase II promoter in response to hypoxia(GO:0061418) |
| 0.0 | 0.2 | GO:0001682 | tRNA 5'-leader removal(GO:0001682) |
| 0.0 | 0.1 | GO:0070127 | tRNA aminoacylation for mitochondrial protein translation(GO:0070127) |
| 0.0 | 0.7 | GO:0045071 | negative regulation of viral genome replication(GO:0045071) |
Gene overrepresentation in C2:CP:REACTOME category:
| Log-likelihood per target | Total log-likelihood | Term | Description |
|---|---|---|---|
| 0.3 | 5.1 | REACTOME HYALURONAN UPTAKE AND DEGRADATION | Genes involved in Hyaluronan uptake and degradation |
| 0.2 | 1.6 | REACTOME ENDOSOMAL VACUOLAR PATHWAY | Genes involved in Endosomal/Vacuolar pathway |
| 0.1 | 2.0 | REACTOME GAP JUNCTION ASSEMBLY | Genes involved in Gap junction assembly |
| 0.1 | 1.1 | REACTOME IRAK2 MEDIATED ACTIVATION OF TAK1 COMPLEX UPON TLR7 8 OR 9 STIMULATION | Genes involved in IRAK2 mediated activation of TAK1 complex upon TLR7/8 or 9 stimulation |
| 0.1 | 1.1 | REACTOME REMOVAL OF THE FLAP INTERMEDIATE FROM THE C STRAND | Genes involved in Removal of the Flap Intermediate from the C-strand |
| 0.1 | 1.4 | REACTOME TRAF3 DEPENDENT IRF ACTIVATION PATHWAY | Genes involved in TRAF3-dependent IRF activation pathway |
| 0.1 | 0.5 | REACTOME PROCESSIVE SYNTHESIS ON THE LAGGING STRAND | Genes involved in Processive synthesis on the lagging strand |
| 0.1 | 3.1 | REACTOME CHONDROITIN SULFATE DERMATAN SULFATE METABOLISM | Genes involved in Chondroitin sulfate/dermatan sulfate metabolism |
| 0.1 | 0.9 | REACTOME SYNTHESIS SECRETION AND DEACYLATION OF GHRELIN | Genes involved in Synthesis, Secretion, and Deacylation of Ghrelin |
| 0.0 | 6.5 | REACTOME RESPONSE TO ELEVATED PLATELET CYTOSOLIC CA2 | Genes involved in Response to elevated platelet cytosolic Ca2+ |
| 0.0 | 2.5 | REACTOME G1 PHASE | Genes involved in G1 Phase |
| 0.0 | 0.9 | REACTOME TRANSLOCATION OF ZAP 70 TO IMMUNOLOGICAL SYNAPSE | Genes involved in Translocation of ZAP-70 to Immunological synapse |
| 0.0 | 1.2 | REACTOME DEGRADATION OF THE EXTRACELLULAR MATRIX | Genes involved in Degradation of the extracellular matrix |
| 0.0 | 0.3 | REACTOME JNK C JUN KINASES PHOSPHORYLATION AND ACTIVATION MEDIATED BY ACTIVATED HUMAN TAK1 | Genes involved in JNK (c-Jun kinases) phosphorylation and activation mediated by activated human TAK1 |
| 0.0 | 1.7 | REACTOME MYOGENESIS | Genes involved in Myogenesis |
| 0.0 | 1.0 | REACTOME GLYCOLYSIS | Genes involved in Glycolysis |
| 0.0 | 0.6 | REACTOME ENDOSOMAL SORTING COMPLEX REQUIRED FOR TRANSPORT ESCRT | Genes involved in Endosomal Sorting Complex Required For Transport (ESCRT) |
| 0.0 | 1.1 | REACTOME O LINKED GLYCOSYLATION OF MUCINS | Genes involved in O-linked glycosylation of mucins |
| 0.0 | 0.7 | REACTOME SYNTHESIS AND INTERCONVERSION OF NUCLEOTIDE DI AND TRIPHOSPHATES | Genes involved in Synthesis and interconversion of nucleotide di- and triphosphates |
| 0.0 | 0.2 | REACTOME DIGESTION OF DIETARY CARBOHYDRATE | Genes involved in Digestion of dietary carbohydrate |
| 0.0 | 0.7 | REACTOME NOD1 2 SIGNALING PATHWAY | Genes involved in NOD1/2 Signaling Pathway |
| 0.0 | 0.7 | REACTOME STEROID HORMONES | Genes involved in Steroid hormones |
| 0.0 | 1.3 | REACTOME FORMATION OF THE TERNARY COMPLEX AND SUBSEQUENTLY THE 43S COMPLEX | Genes involved in Formation of the ternary complex, and subsequently, the 43S complex |
| 0.0 | 0.3 | REACTOME NEGATIVE REGULATORS OF RIG I MDA5 SIGNALING | Genes involved in Negative regulators of RIG-I/MDA5 signaling |
| 0.0 | 0.5 | REACTOME GROWTH HORMONE RECEPTOR SIGNALING | Genes involved in Growth hormone receptor signaling |
| 0.0 | 0.5 | REACTOME SPHINGOLIPID DE NOVO BIOSYNTHESIS | Genes involved in Sphingolipid de novo biosynthesis |
| 0.0 | 0.4 | REACTOME CYTOSOLIC SULFONATION OF SMALL MOLECULES | Genes involved in Cytosolic sulfonation of small molecules |
| 0.0 | 0.3 | REACTOME FACILITATIVE NA INDEPENDENT GLUCOSE TRANSPORTERS | Genes involved in Facilitative Na+-independent glucose transporters |
| 0.0 | 0.9 | REACTOME INTERFERON GAMMA SIGNALING | Genes involved in Interferon gamma signaling |
| 0.0 | 1.4 | REACTOME PEPTIDE CHAIN ELONGATION | Genes involved in Peptide chain elongation |
| 0.0 | 0.3 | REACTOME REGULATION OF COMPLEMENT CASCADE | Genes involved in Regulation of Complement cascade |
| 0.0 | 0.3 | REACTOME ORGANIC CATION ANION ZWITTERION TRANSPORT | Genes involved in Organic cation/anion/zwitterion transport |
| 0.0 | 0.3 | REACTOME FORMATION OF ATP BY CHEMIOSMOTIC COUPLING | Genes involved in Formation of ATP by chemiosmotic coupling |
| 0.0 | 0.4 | REACTOME REGULATION OF HYPOXIA INDUCIBLE FACTOR HIF BY OXYGEN | Genes involved in Regulation of Hypoxia-inducible Factor (HIF) by Oxygen |
| 0.0 | 0.3 | REACTOME ADHERENS JUNCTIONS INTERACTIONS | Genes involved in Adherens junctions interactions |
| 0.0 | 0.2 | REACTOME ABCA TRANSPORTERS IN LIPID HOMEOSTASIS | Genes involved in ABCA transporters in lipid homeostasis |
Gene overrepresentation in molecular_function category:
| Log-likelihood per target | Total log-likelihood | Term | Description |
|---|---|---|---|
| 5.2 | 15.5 | GO:0070320 | inward rectifier potassium channel inhibitor activity(GO:0070320) |
| 2.6 | 10.5 | GO:0004598 | peptidylglycine monooxygenase activity(GO:0004504) peptidylamidoglycolate lyase activity(GO:0004598) |
| 2.1 | 4.2 | GO:0086083 | cell adhesive protein binding involved in bundle of His cell-Purkinje myocyte communication(GO:0086083) |
| 1.6 | 4.7 | GO:0005171 | hepatocyte growth factor receptor binding(GO:0005171) |
| 1.5 | 5.9 | GO:0017089 | glycolipid transporter activity(GO:0017089) |
| 1.2 | 6.2 | GO:0016403 | dimethylargininase activity(GO:0016403) |
| 0.8 | 2.5 | GO:0045127 | N-acetylglucosamine kinase activity(GO:0045127) |
| 0.7 | 2.2 | GO:0019912 | cyclin-dependent protein kinase activating kinase activity(GO:0019912) |
| 0.7 | 2.1 | GO:0016603 | glutaminyl-peptide cyclotransferase activity(GO:0016603) |
| 0.6 | 1.7 | GO:0030377 | urokinase plasminogen activator receptor activity(GO:0030377) |
| 0.5 | 4.8 | GO:0032036 | myosin heavy chain binding(GO:0032036) |
| 0.5 | 2.0 | GO:0048763 | HLH domain binding(GO:0043398) calcium-induced calcium release activity(GO:0048763) |
| 0.4 | 1.3 | GO:0031727 | CCR2 chemokine receptor binding(GO:0031727) |
| 0.4 | 1.6 | GO:0043812 | phosphatidylinositol-4-phosphate phosphatase activity(GO:0043812) |
| 0.4 | 5.1 | GO:0038132 | neuregulin binding(GO:0038132) |
| 0.3 | 3.1 | GO:0038085 | vascular endothelial growth factor binding(GO:0038085) |
| 0.3 | 1.4 | GO:0008336 | gamma-butyrobetaine dioxygenase activity(GO:0008336) |
| 0.3 | 2.7 | GO:0004465 | lipoprotein lipase activity(GO:0004465) |
| 0.3 | 7.3 | GO:0051371 | muscle alpha-actinin binding(GO:0051371) |
| 0.3 | 3.3 | GO:0008607 | phosphorylase kinase regulator activity(GO:0008607) |
| 0.3 | 3.2 | GO:0051425 | PTB domain binding(GO:0051425) |
| 0.3 | 1.9 | GO:0015057 | thrombin receptor activity(GO:0015057) |
| 0.3 | 1.6 | GO:0052840 | endopolyphosphatase activity(GO:0000298) diphosphoinositol-polyphosphate diphosphatase activity(GO:0008486) bis(5'-adenosyl)-hexaphosphatase activity(GO:0034431) bis(5'-adenosyl)-pentaphosphatase activity(GO:0034432) inositol diphosphate tetrakisphosphate diphosphatase activity(GO:0052840) inositol bisdiphosphate tetrakisphosphate diphosphatase activity(GO:0052841) inositol diphosphate pentakisphosphate diphosphatase activity(GO:0052842) inositol-1-diphosphate-2,3,4,5,6-pentakisphosphate diphosphatase activity(GO:0052843) inositol-3-diphosphate-1,2,4,5,6-pentakisphosphate diphosphatase activity(GO:0052844) inositol-5-diphosphate-1,2,3,4,6-pentakisphosphate diphosphatase activity(GO:0052845) inositol-1,5-bisdiphosphate-2,3,4,6-tetrakisphosphate 1-diphosphatase activity(GO:0052846) inositol-1,5-bisdiphosphate-2,3,4,6-tetrakisphosphate 5-diphosphatase activity(GO:0052847) inositol-3,5-bisdiphosphate-2,3,4,6-tetrakisphosphate 5-diphosphatase activity(GO:0052848) |
| 0.3 | 0.9 | GO:0050501 | hyaluronan synthase activity(GO:0050501) |
| 0.3 | 2.5 | GO:0060002 | plus-end directed microfilament motor activity(GO:0060002) |
| 0.3 | 2.6 | GO:0005176 | ErbB-2 class receptor binding(GO:0005176) |
| 0.3 | 1.3 | GO:0030548 | acetylcholine receptor regulator activity(GO:0030548) neurotransmitter receptor regulator activity(GO:0099602) |
| 0.2 | 1.9 | GO:0030023 | extracellular matrix constituent conferring elasticity(GO:0030023) |
| 0.2 | 0.5 | GO:0016715 | oxidoreductase activity, acting on paired donors, with incorporation or reduction of molecular oxygen, reduced ascorbate as one donor, and incorporation of one atom of oxygen(GO:0016715) |
| 0.2 | 0.7 | GO:0061752 | telomeric repeat-containing RNA binding(GO:0061752) |
| 0.2 | 0.7 | GO:0004962 | endothelin receptor activity(GO:0004962) |
| 0.2 | 0.9 | GO:0033906 | protein tyrosine kinase inhibitor activity(GO:0030292) hyaluronoglucuronidase activity(GO:0033906) |
| 0.2 | 0.9 | GO:0017134 | fibroblast growth factor binding(GO:0017134) |
| 0.2 | 0.6 | GO:0004802 | transketolase activity(GO:0004802) |
| 0.2 | 0.6 | GO:0070984 | SET domain binding(GO:0070984) |
| 0.2 | 0.4 | GO:0004515 | nicotinate-nucleotide adenylyltransferase activity(GO:0004515) |
| 0.2 | 1.1 | GO:0016941 | natriuretic peptide receptor activity(GO:0016941) |
| 0.2 | 0.6 | GO:0042799 | histone methyltransferase activity (H4-K20 specific)(GO:0042799) |
| 0.2 | 1.1 | GO:0043237 | laminin-1 binding(GO:0043237) |
| 0.2 | 1.8 | GO:0045545 | syndecan binding(GO:0045545) |
| 0.2 | 14.8 | GO:0008307 | structural constituent of muscle(GO:0008307) |
| 0.2 | 8.1 | GO:0003785 | actin monomer binding(GO:0003785) |
| 0.2 | 0.7 | GO:0047708 | biotinidase activity(GO:0047708) |
| 0.2 | 2.5 | GO:0005161 | platelet-derived growth factor receptor binding(GO:0005161) |
| 0.2 | 1.2 | GO:0016670 | oxidoreductase activity, acting on a sulfur group of donors, oxygen as acceptor(GO:0016670) |
| 0.2 | 4.5 | GO:0043236 | laminin binding(GO:0043236) |
| 0.2 | 1.0 | GO:0008948 | malate dehydrogenase (decarboxylating) (NAD+) activity(GO:0004471) malate dehydrogenase (decarboxylating) (NADP+) activity(GO:0004473) oxaloacetate decarboxylase activity(GO:0008948) |
| 0.2 | 7.5 | GO:0046875 | ephrin receptor binding(GO:0046875) |
| 0.2 | 0.8 | GO:0019798 | procollagen-proline 4-dioxygenase activity(GO:0004656) procollagen-proline dioxygenase activity(GO:0019798) |
| 0.2 | 0.9 | GO:0008310 | single-stranded DNA 3'-5' exodeoxyribonuclease activity(GO:0008310) |
| 0.1 | 4.1 | GO:0005540 | hyaluronic acid binding(GO:0005540) |
| 0.1 | 0.9 | GO:0102337 | fatty acid elongase activity(GO:0009922) 3-oxo-arachidoyl-CoA synthase activity(GO:0102336) 3-oxo-cerotoyl-CoA synthase activity(GO:0102337) 3-oxo-lignoceronyl-CoA synthase activity(GO:0102338) |
| 0.1 | 2.4 | GO:0004089 | carbonate dehydratase activity(GO:0004089) |
| 0.1 | 0.8 | GO:0042577 | lipid phosphatase activity(GO:0042577) |
| 0.1 | 0.7 | GO:0016300 | tRNA (uracil) methyltransferase activity(GO:0016300) |
| 0.1 | 1.5 | GO:0047760 | butyrate-CoA ligase activity(GO:0047760) |
| 0.1 | 0.5 | GO:0050262 | ribosylnicotinamide kinase activity(GO:0050262) ribosylnicotinate kinase activity(GO:0061769) |
| 0.1 | 0.8 | GO:1903135 | cupric ion binding(GO:1903135) |
| 0.1 | 0.9 | GO:0043426 | MRF binding(GO:0043426) |
| 0.1 | 1.6 | GO:0004128 | cytochrome-b5 reductase activity, acting on NAD(P)H(GO:0004128) |
| 0.1 | 0.4 | GO:0003923 | GPI-anchor transamidase activity(GO:0003923) |
| 0.1 | 2.5 | GO:0048018 | receptor agonist activity(GO:0048018) |
| 0.1 | 0.6 | GO:0005294 | neutral L-amino acid secondary active transmembrane transporter activity(GO:0005294) |
| 0.1 | 0.6 | GO:0003690 | double-stranded DNA binding(GO:0003690) |
| 0.1 | 2.2 | GO:0017049 | GTP-Rho binding(GO:0017049) |
| 0.1 | 0.4 | GO:0000900 | translation repressor activity, nucleic acid binding(GO:0000900) |
| 0.1 | 1.2 | GO:0047498 | calcium-dependent phospholipase A2 activity(GO:0047498) |
| 0.1 | 2.7 | GO:0042813 | Wnt-activated receptor activity(GO:0042813) |
| 0.1 | 0.3 | GO:0004345 | glucose-6-phosphate dehydrogenase activity(GO:0004345) |
| 0.1 | 1.6 | GO:0019855 | calcium channel inhibitor activity(GO:0019855) type I transforming growth factor beta receptor binding(GO:0034713) |
| 0.1 | 1.0 | GO:0004028 | 3-chloroallyl aldehyde dehydrogenase activity(GO:0004028) |
| 0.1 | 0.4 | GO:0008431 | vitamin E binding(GO:0008431) |
| 0.1 | 2.3 | GO:0098641 | cadherin binding involved in cell-cell adhesion(GO:0098641) |
| 0.1 | 2.2 | GO:0043325 | phosphatidylinositol-3,4-bisphosphate binding(GO:0043325) |
| 0.1 | 1.8 | GO:0004143 | diacylglycerol kinase activity(GO:0004143) |
| 0.1 | 0.9 | GO:0036310 | annealing helicase activity(GO:0036310) |
| 0.1 | 1.4 | GO:0016918 | retinal binding(GO:0016918) |
| 0.1 | 0.4 | GO:0031694 | alpha-2A adrenergic receptor binding(GO:0031694) |
| 0.1 | 0.8 | GO:0005138 | interleukin-6 receptor binding(GO:0005138) |
| 0.1 | 3.0 | GO:0004709 | MAP kinase kinase kinase activity(GO:0004709) |
| 0.1 | 0.3 | GO:0003968 | RNA-directed RNA polymerase activity(GO:0003968) |
| 0.1 | 0.2 | GO:0032427 | GBD domain binding(GO:0032427) |
| 0.1 | 0.9 | GO:0005314 | high-affinity glutamate transmembrane transporter activity(GO:0005314) |
| 0.1 | 3.7 | GO:0061650 | ubiquitin conjugating enzyme activity(GO:0061631) ubiquitin-like protein conjugating enzyme activity(GO:0061650) |
| 0.1 | 1.3 | GO:0017166 | vinculin binding(GO:0017166) |
| 0.1 | 0.4 | GO:0070740 | tubulin-glutamic acid ligase activity(GO:0070740) |
| 0.1 | 0.4 | GO:0004995 | tachykinin receptor activity(GO:0004995) |
| 0.1 | 0.8 | GO:0016290 | palmitoyl-CoA hydrolase activity(GO:0016290) |
| 0.1 | 0.7 | GO:0032190 | acrosin binding(GO:0032190) |
| 0.1 | 1.1 | GO:0016864 | protein disulfide isomerase activity(GO:0003756) intramolecular oxidoreductase activity, transposing S-S bonds(GO:0016864) |
| 0.1 | 0.6 | GO:0015216 | adenine nucleotide transmembrane transporter activity(GO:0000295) purine ribonucleotide transmembrane transporter activity(GO:0005346) ATP transmembrane transporter activity(GO:0005347) purine nucleotide transmembrane transporter activity(GO:0015216) ADP transmembrane transporter activity(GO:0015217) |
| 0.1 | 1.0 | GO:0008140 | cAMP response element binding protein binding(GO:0008140) |
| 0.1 | 0.5 | GO:0046965 | retinoid X receptor binding(GO:0046965) |
| 0.1 | 1.0 | GO:0004185 | serine-type carboxypeptidase activity(GO:0004185) |
| 0.1 | 0.1 | GO:0004938 | alpha2-adrenergic receptor activity(GO:0004938) |
| 0.1 | 1.7 | GO:0070064 | proline-rich region binding(GO:0070064) |
| 0.1 | 0.3 | GO:0004301 | epoxide hydrolase activity(GO:0004301) |
| 0.1 | 0.4 | GO:0004800 | thyroxine 5'-deiodinase activity(GO:0004800) |
| 0.1 | 0.2 | GO:0035033 | histone deacetylase regulator activity(GO:0035033) |
| 0.1 | 2.7 | GO:0070412 | R-SMAD binding(GO:0070412) |
| 0.1 | 0.8 | GO:0031078 | histone deacetylase activity (H3-K14 specific)(GO:0031078) NAD-dependent histone deacetylase activity (H3-K14 specific)(GO:0032041) |
| 0.1 | 0.8 | GO:0015250 | water channel activity(GO:0015250) |
| 0.1 | 1.6 | GO:0004129 | cytochrome-c oxidase activity(GO:0004129) heme-copper terminal oxidase activity(GO:0015002) oxidoreductase activity, acting on a heme group of donors(GO:0016675) oxidoreductase activity, acting on a heme group of donors, oxygen as acceptor(GO:0016676) |
| 0.1 | 7.9 | GO:0008201 | heparin binding(GO:0008201) |
| 0.1 | 0.3 | GO:0004771 | sterol esterase activity(GO:0004771) |
| 0.1 | 0.6 | GO:0005112 | Notch binding(GO:0005112) |
| 0.1 | 1.8 | GO:0031683 | G-protein beta/gamma-subunit complex binding(GO:0031683) |
| 0.1 | 0.2 | GO:0086080 | protein binding involved in heterotypic cell-cell adhesion(GO:0086080) |
| 0.1 | 0.1 | GO:0017098 | sulfonylurea receptor binding(GO:0017098) |
| 0.1 | 7.5 | GO:0005178 | integrin binding(GO:0005178) |
| 0.1 | 0.3 | GO:0008420 | CTD phosphatase activity(GO:0008420) |
| 0.0 | 0.3 | GO:0061133 | endopeptidase activator activity(GO:0061133) |
| 0.0 | 0.2 | GO:0033829 | O-fucosylpeptide 3-beta-N-acetylglucosaminyltransferase activity(GO:0033829) |
| 0.0 | 2.3 | GO:0016709 | oxidoreductase activity, acting on paired donors, with incorporation or reduction of molecular oxygen, NAD(P)H as one donor, and incorporation of one atom of oxygen(GO:0016709) |
| 0.0 | 1.3 | GO:0070566 | adenylyltransferase activity(GO:0070566) |
| 0.0 | 0.1 | GO:0016803 | ether hydrolase activity(GO:0016803) hepoxilin-epoxide hydrolase activity(GO:0047977) |
| 0.0 | 0.2 | GO:0017060 | 3-galactosyl-N-acetylglucosaminide 4-alpha-L-fucosyltransferase activity(GO:0017060) |
| 0.0 | 0.8 | GO:0030898 | actin-dependent ATPase activity(GO:0030898) |
| 0.0 | 1.0 | GO:0004383 | guanylate cyclase activity(GO:0004383) |
| 0.0 | 1.0 | GO:0050840 | extracellular matrix binding(GO:0050840) |
| 0.0 | 2.7 | GO:0048365 | Rac GTPase binding(GO:0048365) |
| 0.0 | 0.3 | GO:0016167 | glial cell-derived neurotrophic factor receptor activity(GO:0016167) |
| 0.0 | 0.5 | GO:0000150 | recombinase activity(GO:0000150) |
| 0.0 | 0.1 | GO:1902122 | chenodeoxycholic acid binding(GO:1902122) |
| 0.0 | 0.5 | GO:0035240 | dopamine binding(GO:0035240) |
| 0.0 | 0.5 | GO:0051117 | ATPase binding(GO:0051117) |
| 0.0 | 0.2 | GO:0005113 | patched binding(GO:0005113) |
| 0.0 | 0.2 | GO:0030899 | calcium-dependent ATPase activity(GO:0030899) |
| 0.0 | 0.7 | GO:0008432 | JUN kinase binding(GO:0008432) |
| 0.0 | 1.8 | GO:0008138 | protein tyrosine/serine/threonine phosphatase activity(GO:0008138) |
| 0.0 | 0.1 | GO:0008523 | sodium-dependent multivitamin transmembrane transporter activity(GO:0008523) |
| 0.0 | 0.2 | GO:0004047 | aminomethyltransferase activity(GO:0004047) |
| 0.0 | 0.3 | GO:0070181 | small ribosomal subunit rRNA binding(GO:0070181) 5.8S rRNA binding(GO:1990932) |
| 0.0 | 0.8 | GO:0008191 | metalloendopeptidase inhibitor activity(GO:0008191) |
| 0.0 | 0.6 | GO:0002162 | dystroglycan binding(GO:0002162) |
| 0.0 | 0.5 | GO:0031386 | protein tag(GO:0031386) |
| 0.0 | 0.6 | GO:0070628 | proteasome binding(GO:0070628) |
| 0.0 | 1.6 | GO:0005544 | calcium-dependent phospholipid binding(GO:0005544) |
| 0.0 | 0.7 | GO:0004622 | lysophospholipase activity(GO:0004622) |
| 0.0 | 2.4 | GO:0046332 | SMAD binding(GO:0046332) |
| 0.0 | 0.1 | GO:0005046 | KDEL sequence binding(GO:0005046) |
| 0.0 | 0.1 | GO:0005457 | GDP-fucose transmembrane transporter activity(GO:0005457) purine nucleotide-sugar transmembrane transporter activity(GO:0036080) |
| 0.0 | 0.2 | GO:0004994 | somatostatin receptor activity(GO:0004994) |
| 0.0 | 0.4 | GO:0015194 | L-serine transmembrane transporter activity(GO:0015194) serine transmembrane transporter activity(GO:0022889) |
| 0.0 | 0.3 | GO:0047372 | acylglycerol lipase activity(GO:0047372) |
| 0.0 | 0.1 | GO:0003881 | CDP-diacylglycerol-inositol 3-phosphatidyltransferase activity(GO:0003881) |
| 0.0 | 0.1 | GO:0000253 | 3-keto sterol reductase activity(GO:0000253) |
| 0.0 | 0.2 | GO:0042289 | MHC class II protein binding(GO:0042289) |
| 0.0 | 0.6 | GO:0000030 | mannosyltransferase activity(GO:0000030) |
| 0.0 | 1.4 | GO:0003705 | transcription factor activity, RNA polymerase II distal enhancer sequence-specific binding(GO:0003705) |
| 0.0 | 0.6 | GO:0050811 | GABA receptor binding(GO:0050811) |
| 0.0 | 0.8 | GO:0047555 | 3',5'-cyclic-GMP phosphodiesterase activity(GO:0047555) |
| 0.0 | 0.1 | GO:0016015 | morphogen activity(GO:0016015) |
| 0.0 | 0.5 | GO:0045295 | gamma-catenin binding(GO:0045295) |
| 0.0 | 0.1 | GO:0097603 | temperature-gated ion channel activity(GO:0097603) |
| 0.0 | 0.2 | GO:0044594 | 3alpha,7alpha,12alpha-trihydroxy-5beta-cholest-24-enoyl-CoA hydratase activity(GO:0033989) 17-beta-hydroxysteroid dehydrogenase (NAD+) activity(GO:0044594) |
| 0.0 | 0.2 | GO:0005497 | androgen binding(GO:0005497) |
| 0.0 | 0.1 | GO:0042132 | fructose 1,6-bisphosphate 1-phosphatase activity(GO:0042132) |
| 0.0 | 2.2 | GO:0004867 | serine-type endopeptidase inhibitor activity(GO:0004867) |
| 0.0 | 2.8 | GO:0002020 | protease binding(GO:0002020) |
| 0.0 | 0.1 | GO:0005225 | volume-sensitive anion channel activity(GO:0005225) |
| 0.0 | 0.6 | GO:0030165 | PDZ domain binding(GO:0030165) |
| 0.0 | 0.1 | GO:0008158 | hedgehog receptor activity(GO:0008158) |
| 0.0 | 0.1 | GO:0008073 | ornithine decarboxylase inhibitor activity(GO:0008073) |
| 0.0 | 0.4 | GO:0045505 | dynein intermediate chain binding(GO:0045505) |
| 0.0 | 0.1 | GO:0016934 | extracellular-glycine-gated ion channel activity(GO:0016933) extracellular-glycine-gated chloride channel activity(GO:0016934) |
| 0.0 | 0.6 | GO:0046933 | proton-transporting ATP synthase activity, rotational mechanism(GO:0046933) |
| 0.0 | 0.4 | GO:0032266 | phosphatidylinositol-3-phosphate binding(GO:0032266) |
| 0.0 | 2.3 | GO:0019888 | protein phosphatase regulator activity(GO:0019888) |
| 0.0 | 0.3 | GO:0043522 | leucine zipper domain binding(GO:0043522) |
| 0.0 | 0.3 | GO:0017034 | Rap guanyl-nucleotide exchange factor activity(GO:0017034) |
| 0.0 | 0.1 | GO:0051575 | 5'-deoxyribose-5-phosphate lyase activity(GO:0051575) |
| 0.0 | 0.3 | GO:0008349 | MAP kinase kinase kinase kinase activity(GO:0008349) |
| 0.0 | 1.2 | GO:0048306 | calcium-dependent protein binding(GO:0048306) |
| 0.0 | 0.4 | GO:0004190 | aspartic-type endopeptidase activity(GO:0004190) aspartic-type peptidase activity(GO:0070001) |
| 0.0 | 0.1 | GO:0045294 | alpha-catenin binding(GO:0045294) |
| 0.0 | 0.2 | GO:0000182 | rDNA binding(GO:0000182) |
| 0.0 | 0.4 | GO:0005247 | voltage-gated chloride channel activity(GO:0005247) |
| 0.0 | 0.3 | GO:0003950 | NAD+ ADP-ribosyltransferase activity(GO:0003950) |
| 0.0 | 0.3 | GO:0004861 | cyclin-dependent protein serine/threonine kinase inhibitor activity(GO:0004861) |
| 0.0 | 0.4 | GO:0043015 | gamma-tubulin binding(GO:0043015) |
| 0.0 | 0.9 | GO:0019003 | GDP binding(GO:0019003) |
| 0.0 | 0.2 | GO:0070273 | phosphatidylinositol-4-phosphate binding(GO:0070273) |
| 0.0 | 0.7 | GO:0042162 | telomeric DNA binding(GO:0042162) |
| 0.0 | 0.8 | GO:0030971 | receptor tyrosine kinase binding(GO:0030971) |
| 0.0 | 0.0 | GO:0047322 | [hydroxymethylglutaryl-CoA reductase (NADPH)] kinase activity(GO:0047322) [acetyl-CoA carboxylase] kinase activity(GO:0050405) |
| 0.0 | 0.1 | GO:0051393 | alpha-actinin binding(GO:0051393) |
| 0.0 | 0.2 | GO:0097371 | MDM2/MDM4 family protein binding(GO:0097371) |
| 0.0 | 0.2 | GO:0004806 | triglyceride lipase activity(GO:0004806) |
| 0.0 | 0.1 | GO:0035064 | methylated histone binding(GO:0035064) |
| 0.0 | 3.4 | GO:0004252 | serine-type endopeptidase activity(GO:0004252) |
| 0.0 | 0.8 | GO:0017022 | myosin binding(GO:0017022) |
| 0.0 | 0.3 | GO:0017081 | chloride channel regulator activity(GO:0017081) |
| 0.0 | 0.1 | GO:0005520 | insulin-like growth factor binding(GO:0005520) |
| 0.0 | 0.1 | GO:0015277 | kainate selective glutamate receptor activity(GO:0015277) |
| 0.0 | 1.7 | GO:0051082 | unfolded protein binding(GO:0051082) |
| 0.0 | 0.1 | GO:0070679 | inositol 1,4,5 trisphosphate binding(GO:0070679) |
| 0.0 | 0.3 | GO:0070182 | DNA polymerase binding(GO:0070182) |
| 0.0 | 0.1 | GO:0019763 | immunoglobulin receptor activity(GO:0019763) |
| 0.0 | 0.1 | GO:0004111 | creatine kinase activity(GO:0004111) |
| 0.0 | 0.2 | GO:0050321 | tau-protein kinase activity(GO:0050321) |
| 0.0 | 0.5 | GO:0004364 | glutathione transferase activity(GO:0004364) |
| 0.0 | 0.1 | GO:0008097 | 5S rRNA binding(GO:0008097) |
Gene overrepresentation in biological_process category:
| Log-likelihood per target | Total log-likelihood | Term | Description |
|---|---|---|---|
| 5.2 | 15.5 | GO:1900085 | negative regulation of peptidyl-tyrosine autophosphorylation(GO:1900085) negative regulation of inward rectifier potassium channel activity(GO:1903609) |
| 2.6 | 10.5 | GO:0001519 | peptide amidation(GO:0001519) protein amidation(GO:0018032) peptide modification(GO:0031179) |
| 1.3 | 5.2 | GO:0060671 | epithelial cell differentiation involved in embryonic placenta development(GO:0060671) epithelial cell morphogenesis involved in placental branching(GO:0060672) |
| 1.3 | 5.1 | GO:0003104 | positive regulation of glomerular filtration(GO:0003104) |
| 1.2 | 4.9 | GO:0021564 | vagus nerve development(GO:0021564) |
| 1.1 | 3.3 | GO:1902910 | regulation of monophenol monooxygenase activity(GO:0032771) positive regulation of monophenol monooxygenase activity(GO:0032773) negative regulation of catagen(GO:0051796) regulation of hair cycle by canonical Wnt signaling pathway(GO:0060901) positive regulation of melanosome transport(GO:1902910) |
| 1.1 | 1.1 | GO:2001020 | regulation of response to DNA damage stimulus(GO:2001020) |
| 0.9 | 10.9 | GO:1900028 | negative regulation of ruffle assembly(GO:1900028) |
| 0.9 | 4.5 | GO:0071874 | cellular response to norepinephrine stimulus(GO:0071874) |
| 0.9 | 5.2 | GO:0061441 | renal artery morphogenesis(GO:0061441) |
| 0.8 | 5.9 | GO:0046836 | glycolipid transport(GO:0046836) |
| 0.8 | 4.9 | GO:2000669 | positive regulation of pinocytosis(GO:0048549) negative regulation of dendritic cell apoptotic process(GO:2000669) |
| 0.8 | 4.0 | GO:2000542 | negative regulation of gastrulation(GO:2000542) |
| 0.7 | 7.8 | GO:0009414 | response to water deprivation(GO:0009414) |
| 0.7 | 2.8 | GO:0070358 | actin polymerization-dependent cell motility(GO:0070358) |
| 0.7 | 2.1 | GO:0017186 | peptidyl-pyroglutamic acid biosynthetic process, using glutaminyl-peptide cyclotransferase(GO:0017186) |
| 0.7 | 2.7 | GO:0010982 | regulation of high-density lipoprotein particle clearance(GO:0010982) positive regulation of lipoprotein particle clearance(GO:0010986) |
| 0.7 | 4.7 | GO:1902202 | regulation of hepatocyte growth factor receptor signaling pathway(GO:1902202) |
| 0.7 | 5.2 | GO:1900625 | regulation of monocyte aggregation(GO:1900623) positive regulation of monocyte aggregation(GO:1900625) |
| 0.6 | 2.5 | GO:0006051 | mannosamine metabolic process(GO:0006050) N-acetylmannosamine metabolic process(GO:0006051) |
| 0.6 | 4.4 | GO:0071896 | protein localization to adherens junction(GO:0071896) |
| 0.6 | 1.8 | GO:0060447 | bud outgrowth involved in lung branching(GO:0060447) |
| 0.5 | 2.7 | GO:0030167 | proteoglycan catabolic process(GO:0030167) heparan sulfate proteoglycan catabolic process(GO:0030200) |
| 0.5 | 7.6 | GO:0035878 | nail development(GO:0035878) |
| 0.5 | 2.6 | GO:0055011 | atrial cardiac muscle cell differentiation(GO:0055011) atrial cardiac muscle cell development(GO:0055014) |
| 0.5 | 15.2 | GO:0008045 | motor neuron axon guidance(GO:0008045) |
| 0.5 | 0.5 | GO:1902908 | regulation of melanosome transport(GO:1902908) |
| 0.5 | 3.0 | GO:0010724 | regulation of definitive erythrocyte differentiation(GO:0010724) |
| 0.5 | 1.4 | GO:0002541 | activation of plasma proteins involved in acute inflammatory response(GO:0002541) |
| 0.5 | 1.4 | GO:0048627 | myoblast development(GO:0048627) |
| 0.5 | 0.5 | GO:0010157 | response to chlorate(GO:0010157) |
| 0.5 | 3.7 | GO:0010994 | regulation of ubiquitin homeostasis(GO:0010993) free ubiquitin chain polymerization(GO:0010994) positive regulation of exit from mitosis(GO:0031536) |
| 0.5 | 5.1 | GO:0033327 | Leydig cell differentiation(GO:0033327) |
| 0.5 | 2.8 | GO:0007296 | vitellogenesis(GO:0007296) |
| 0.4 | 1.3 | GO:1901624 | negative regulation of lymphocyte chemotaxis(GO:1901624) |
| 0.4 | 2.2 | GO:0072244 | metanephric glomerular epithelium development(GO:0072244) metanephric glomerular visceral epithelial cell differentiation(GO:0072248) metanephric glomerular visceral epithelial cell development(GO:0072249) metanephric glomerular epithelial cell differentiation(GO:0072312) metanephric glomerular epithelial cell development(GO:0072313) |
| 0.4 | 0.9 | GO:0019087 | transformation of host cell by virus(GO:0019087) |
| 0.4 | 2.2 | GO:0060574 | intestinal epithelial cell maturation(GO:0060574) |
| 0.4 | 1.7 | GO:0038195 | urokinase plasminogen activator signaling pathway(GO:0038195) |
| 0.4 | 2.4 | GO:0055064 | chloride ion homeostasis(GO:0055064) |
| 0.4 | 2.0 | GO:0035582 | sequestering of BMP in extracellular matrix(GO:0035582) |
| 0.4 | 0.4 | GO:2000777 | positive regulation of proteasomal ubiquitin-dependent protein catabolic process involved in cellular response to hypoxia(GO:2000777) |
| 0.4 | 6.2 | GO:0006527 | arginine catabolic process(GO:0006527) |
| 0.4 | 1.2 | GO:0030327 | prenylated protein catabolic process(GO:0030327) |
| 0.4 | 2.6 | GO:0021840 | directional guidance of interneurons involved in migration from the subpallium to the cortex(GO:0021840) chemorepulsion involved in interneuron migration from the subpallium to the cortex(GO:0021842) |
| 0.3 | 2.7 | GO:0001661 | conditioned taste aversion(GO:0001661) |
| 0.3 | 1.0 | GO:1902630 | regulation of membrane hyperpolarization(GO:1902630) |
| 0.3 | 1.9 | GO:1902766 | skeletal muscle satellite cell migration(GO:1902766) |
| 0.3 | 1.6 | GO:1901908 | diadenosine polyphosphate catabolic process(GO:0015961) diphosphoinositol polyphosphate metabolic process(GO:0071543) diadenosine pentaphosphate metabolic process(GO:1901906) diadenosine pentaphosphate catabolic process(GO:1901907) diadenosine hexaphosphate metabolic process(GO:1901908) diadenosine hexaphosphate catabolic process(GO:1901909) adenosine 5'-(hexahydrogen pentaphosphate) metabolic process(GO:1901910) adenosine 5'-(hexahydrogen pentaphosphate) catabolic process(GO:1901911) |
| 0.3 | 1.5 | GO:0042695 | thelarche(GO:0042695) mammary gland branching involved in thelarche(GO:0060744) |
| 0.3 | 0.9 | GO:0006566 | threonine metabolic process(GO:0006566) |
| 0.3 | 0.9 | GO:0021678 | fourth ventricle development(GO:0021592) third ventricle development(GO:0021678) |
| 0.3 | 2.0 | GO:0032594 | protein transport within lipid bilayer(GO:0032594) protein transport into membrane raft(GO:0032596) |
| 0.3 | 0.8 | GO:2001045 | negative regulation of integrin-mediated signaling pathway(GO:2001045) |
| 0.3 | 1.1 | GO:0060385 | axonogenesis involved in innervation(GO:0060385) |
| 0.3 | 1.1 | GO:0006663 | platelet activating factor biosynthetic process(GO:0006663) |
| 0.3 | 0.8 | GO:0002384 | hepatic immune response(GO:0002384) |
| 0.3 | 0.8 | GO:1905166 | negative regulation of protein catabolic process in the vacuole(GO:1904351) negative regulation of lysosomal protein catabolic process(GO:1905166) |
| 0.3 | 1.0 | GO:1900194 | negative regulation of oocyte maturation(GO:1900194) |
| 0.3 | 0.8 | GO:0090155 | negative regulation of sphingolipid biosynthetic process(GO:0090155) negative regulation of ceramide biosynthetic process(GO:1900060) |
| 0.3 | 5.9 | GO:0003334 | keratinocyte development(GO:0003334) |
| 0.2 | 0.5 | GO:2000402 | negative regulation of lymphocyte migration(GO:2000402) |
| 0.2 | 3.7 | GO:0019852 | L-ascorbic acid metabolic process(GO:0019852) |
| 0.2 | 0.7 | GO:1901350 | cell-cell signaling involved in cell-cell junction organization(GO:1901350) |
| 0.2 | 1.6 | GO:0048050 | post-embryonic eye morphogenesis(GO:0048050) |
| 0.2 | 3.8 | GO:0070831 | basement membrane assembly(GO:0070831) |
| 0.2 | 0.7 | GO:0044501 | modulation of signal transduction in other organism(GO:0044501) modulation by symbiont of host signal transduction pathway(GO:0052027) modulation of signal transduction in other organism involved in symbiotic interaction(GO:0052250) modulation by symbiont of host I-kappaB kinase/NF-kappaB cascade(GO:0085032) |
| 0.2 | 2.2 | GO:0031274 | positive regulation of pseudopodium assembly(GO:0031274) |
| 0.2 | 0.7 | GO:0007497 | posterior midgut development(GO:0007497) endothelin receptor signaling pathway(GO:0086100) |
| 0.2 | 2.3 | GO:0030050 | vesicle transport along actin filament(GO:0030050) |
| 0.2 | 1.3 | GO:0034201 | response to oleic acid(GO:0034201) |
| 0.2 | 0.8 | GO:2001151 | regulation of renal water transport(GO:2001151) positive regulation of renal water transport(GO:2001153) |
| 0.2 | 0.2 | GO:0033087 | regulation of immature T cell proliferation in thymus(GO:0033084) negative regulation of immature T cell proliferation(GO:0033087) negative regulation of immature T cell proliferation in thymus(GO:0033088) |
| 0.2 | 1.0 | GO:2000504 | positive regulation of blood vessel remodeling(GO:2000504) |
| 0.2 | 1.0 | GO:0002415 | immunoglobulin transcytosis in epithelial cells mediated by polymeric immunoglobulin receptor(GO:0002415) |
| 0.2 | 1.6 | GO:0031642 | negative regulation of myelination(GO:0031642) |
| 0.2 | 0.6 | GO:2000360 | positive regulation of female gonad development(GO:2000196) negative regulation of binding of sperm to zona pellucida(GO:2000360) |
| 0.2 | 4.1 | GO:0032780 | negative regulation of ATPase activity(GO:0032780) |
| 0.2 | 1.0 | GO:0071350 | interleukin-15-mediated signaling pathway(GO:0035723) cellular response to interleukin-15(GO:0071350) |
| 0.2 | 1.9 | GO:1990416 | cellular response to brain-derived neurotrophic factor stimulus(GO:1990416) |
| 0.2 | 1.1 | GO:0006366 | transcription from RNA polymerase II promoter(GO:0006366) |
| 0.2 | 0.6 | GO:1904328 | regulation of myofibroblast contraction(GO:1904328) myofibroblast contraction(GO:1990764) |
| 0.2 | 0.7 | GO:0007525 | somatic muscle development(GO:0007525) |
| 0.2 | 3.7 | GO:0006853 | carnitine shuttle(GO:0006853) |
| 0.2 | 0.9 | GO:0048478 | replication fork protection(GO:0048478) |
| 0.2 | 1.0 | GO:0060282 | positive regulation of oocyte development(GO:0060282) |
| 0.2 | 0.7 | GO:1903935 | response to sodium arsenite(GO:1903935) cellular response to sodium arsenite(GO:1903936) |
| 0.2 | 0.5 | GO:1990535 | negative regulation of NAD(P)H oxidase activity(GO:0033861) neuron projection maintenance(GO:1990535) |
| 0.2 | 1.0 | GO:0030043 | actin filament fragmentation(GO:0030043) |
| 0.2 | 1.3 | GO:1901552 | positive regulation of endothelial cell development(GO:1901552) positive regulation of establishment of endothelial barrier(GO:1903142) |
| 0.2 | 3.2 | GO:0060644 | mammary gland epithelial cell differentiation(GO:0060644) |
| 0.2 | 1.4 | GO:0048672 | positive regulation of collateral sprouting(GO:0048672) |
| 0.2 | 0.8 | GO:1990086 | lens fiber cell apoptotic process(GO:1990086) |
| 0.2 | 2.9 | GO:0007171 | activation of transmembrane receptor protein tyrosine kinase activity(GO:0007171) |
| 0.2 | 0.9 | GO:0052565 | response to defense-related nitric oxide production by other organism involved in symbiotic interaction(GO:0052551) response to defense-related host nitric oxide production(GO:0052565) |
| 0.2 | 0.5 | GO:1905066 | arterial endothelial cell fate commitment(GO:0060844) blood vessel endothelial cell fate commitment(GO:0060846) endothelial cell fate specification(GO:0060847) canonical Wnt signaling pathway involved in cardiac muscle cell fate commitment(GO:0061317) blood vessel lumenization(GO:0072554) blood vessel endothelial cell fate specification(GO:0097101) positive regulation of ephrin receptor signaling pathway(GO:1901189) regulation of canonical Wnt signaling pathway involved in cardiac muscle cell fate commitment(GO:1901295) positive regulation of canonical Wnt signaling pathway involved in cardiac muscle cell fate commitment(GO:1901297) regulation of canonical Wnt signaling pathway involved in heart development(GO:1905066) positive regulation of canonical Wnt signaling pathway involved in heart development(GO:1905068) |
| 0.1 | 0.6 | GO:0042271 | susceptibility to natural killer cell mediated cytotoxicity(GO:0042271) |
| 0.1 | 0.9 | GO:0034625 | fatty acid elongation, saturated fatty acid(GO:0019367) fatty acid elongation, unsaturated fatty acid(GO:0019368) fatty acid elongation, monounsaturated fatty acid(GO:0034625) fatty acid elongation, polyunsaturated fatty acid(GO:0034626) |
| 0.1 | 1.6 | GO:0060315 | negative regulation of ryanodine-sensitive calcium-release channel activity(GO:0060315) |
| 0.1 | 1.4 | GO:0045329 | carnitine biosynthetic process(GO:0045329) |
| 0.1 | 0.4 | GO:2000035 | regulation of stem cell division(GO:2000035) |
| 0.1 | 0.8 | GO:0021622 | oculomotor nerve morphogenesis(GO:0021622) oculomotor nerve formation(GO:0021623) |
| 0.1 | 0.8 | GO:2000348 | regulation of CD40 signaling pathway(GO:2000348) |
| 0.1 | 1.8 | GO:0031953 | negative regulation of protein autophosphorylation(GO:0031953) |
| 0.1 | 0.3 | GO:0014898 | muscle hypertrophy in response to stress(GO:0003299) cardiac muscle adaptation(GO:0014887) cardiac muscle hypertrophy in response to stress(GO:0014898) |
| 0.1 | 0.1 | GO:0071878 | negative regulation of adrenergic receptor signaling pathway(GO:0071878) |
| 0.1 | 0.4 | GO:1901491 | negative regulation of lymphangiogenesis(GO:1901491) |
| 0.1 | 0.4 | GO:0030241 | skeletal muscle myosin thick filament assembly(GO:0030241) |
| 0.1 | 0.4 | GO:1903028 | positive regulation of opsonization(GO:1903028) |
| 0.1 | 2.5 | GO:0097062 | dendritic spine maintenance(GO:0097062) |
| 0.1 | 0.3 | GO:0009051 | pentose-phosphate shunt, oxidative branch(GO:0009051) |
| 0.1 | 0.3 | GO:0098917 | retrograde trans-synaptic signaling(GO:0098917) |
| 0.1 | 0.3 | GO:0070563 | negative regulation of vitamin D receptor signaling pathway(GO:0070563) |
| 0.1 | 1.0 | GO:0072592 | oxygen metabolic process(GO:0072592) |
| 0.1 | 2.1 | GO:0031581 | hemidesmosome assembly(GO:0031581) |
| 0.1 | 0.8 | GO:0051988 | regulation of attachment of spindle microtubules to kinetochore(GO:0051988) |
| 0.1 | 1.7 | GO:0010457 | centriole-centriole cohesion(GO:0010457) |
| 0.1 | 1.5 | GO:0048742 | regulation of skeletal muscle fiber development(GO:0048742) |
| 0.1 | 0.5 | GO:0010637 | negative regulation of mitochondrial fusion(GO:0010637) |
| 0.1 | 0.8 | GO:1901164 | negative regulation of trophoblast cell migration(GO:1901164) |
| 0.1 | 1.0 | GO:0046185 | aldehyde catabolic process(GO:0046185) |
| 0.1 | 0.4 | GO:0035106 | operant conditioning(GO:0035106) |
| 0.1 | 0.4 | GO:0016255 | attachment of GPI anchor to protein(GO:0016255) |
| 0.1 | 0.7 | GO:1904352 | positive regulation of protein catabolic process in the vacuole(GO:1904352) |
| 0.1 | 0.8 | GO:0018401 | peptidyl-proline hydroxylation to 4-hydroxy-L-proline(GO:0018401) |
| 0.1 | 0.9 | GO:0051918 | negative regulation of fibrinolysis(GO:0051918) |
| 0.1 | 0.4 | GO:2000857 | positive regulation of mineralocorticoid secretion(GO:2000857) positive regulation of aldosterone secretion(GO:2000860) |
| 0.1 | 0.6 | GO:0006772 | thiamine metabolic process(GO:0006772) |
| 0.1 | 0.9 | GO:0001886 | endothelial cell morphogenesis(GO:0001886) |
| 0.1 | 1.1 | GO:0070863 | positive regulation of protein exit from endoplasmic reticulum(GO:0070863) |
| 0.1 | 0.6 | GO:0045602 | negative regulation of endothelial cell differentiation(GO:0045602) |
| 0.1 | 3.4 | GO:0045022 | early endosome to late endosome transport(GO:0045022) |
| 0.1 | 0.3 | GO:1900368 | transcription, RNA-templated(GO:0001172) regulation of RNA interference(GO:1900368) negative regulation of RNA interference(GO:1900369) positive regulation of protein localization to nucleolus(GO:1904751) |
| 0.1 | 0.3 | GO:0070940 | dephosphorylation of RNA polymerase II C-terminal domain(GO:0070940) |
| 0.1 | 0.6 | GO:0021903 | rostrocaudal neural tube patterning(GO:0021903) positive regulation of transforming growth factor beta1 production(GO:0032914) |
| 0.1 | 2.3 | GO:0035635 | entry of bacterium into host cell(GO:0035635) |
| 0.1 | 0.5 | GO:0051414 | response to cortisol(GO:0051414) |
| 0.1 | 2.0 | GO:0042753 | positive regulation of circadian rhythm(GO:0042753) |
| 0.1 | 0.6 | GO:0000414 | regulation of histone H3-K36 methylation(GO:0000414) |
| 0.1 | 0.6 | GO:0032287 | peripheral nervous system myelin maintenance(GO:0032287) |
| 0.1 | 1.8 | GO:0046339 | diacylglycerol metabolic process(GO:0046339) |
| 0.1 | 1.6 | GO:0089711 | L-glutamate transmembrane transport(GO:0089711) |
| 0.1 | 0.2 | GO:0043388 | positive regulation of DNA binding(GO:0043388) |
| 0.1 | 0.6 | GO:0046627 | negative regulation of insulin receptor signaling pathway(GO:0046627) |
| 0.1 | 0.7 | GO:0002098 | tRNA wobble uridine modification(GO:0002098) |
| 0.1 | 0.4 | GO:0003298 | physiological muscle hypertrophy(GO:0003298) physiological cardiac muscle hypertrophy(GO:0003301) cell growth involved in cardiac muscle cell development(GO:0061049) |
| 0.1 | 0.7 | GO:0038007 | netrin-activated signaling pathway(GO:0038007) |
| 0.1 | 0.1 | GO:2000729 | positive regulation of mesenchymal cell proliferation involved in ureter development(GO:2000729) |
| 0.1 | 0.4 | GO:0030382 | sperm mitochondrion organization(GO:0030382) |
| 0.1 | 0.2 | GO:0060448 | dichotomous subdivision of terminal units involved in lung branching(GO:0060448) |
| 0.1 | 0.4 | GO:0072385 | minus-end-directed organelle transport along microtubule(GO:0072385) |
| 0.1 | 1.0 | GO:2000353 | positive regulation of endothelial cell apoptotic process(GO:2000353) |
| 0.1 | 0.6 | GO:0051503 | ADP transport(GO:0015866) ATP transport(GO:0015867) adenine nucleotide transport(GO:0051503) |
| 0.1 | 0.2 | GO:0018874 | benzoate metabolic process(GO:0018874) butyrate metabolic process(GO:0019605) |
| 0.1 | 3.1 | GO:0035329 | hippo signaling(GO:0035329) |
| 0.1 | 0.5 | GO:0075525 | viral translational termination-reinitiation(GO:0075525) |
| 0.1 | 0.7 | GO:0006621 | protein retention in ER lumen(GO:0006621) |
| 0.1 | 0.1 | GO:2000354 | regulation of ovarian follicle development(GO:2000354) |
| 0.1 | 0.3 | GO:0042986 | positive regulation of amyloid precursor protein biosynthetic process(GO:0042986) |
| 0.1 | 0.4 | GO:0018095 | protein polyglutamylation(GO:0018095) |
| 0.1 | 0.2 | GO:0097021 | lymphocyte migration into lymphoid organs(GO:0097021) |
| 0.1 | 0.3 | GO:0044240 | multicellular organism lipid catabolic process(GO:0044240) |
| 0.1 | 1.3 | GO:0010591 | regulation of lamellipodium assembly(GO:0010591) |
| 0.1 | 0.6 | GO:0010571 | positive regulation of nuclear cell cycle DNA replication(GO:0010571) |
| 0.1 | 0.1 | GO:0060467 | negative regulation of fertilization(GO:0060467) |
| 0.1 | 0.6 | GO:0006451 | selenocysteine incorporation(GO:0001514) translational readthrough(GO:0006451) |
| 0.1 | 0.1 | GO:0035283 | central nervous system segmentation(GO:0035283) brain segmentation(GO:0035284) |
| 0.1 | 0.2 | GO:0031064 | negative regulation of histone deacetylation(GO:0031064) |
| 0.1 | 1.3 | GO:1905144 | acetylcholine receptor signaling pathway(GO:0095500) postsynaptic signal transduction(GO:0098926) signal transduction involved in cellular response to ammonium ion(GO:1903831) response to acetylcholine(GO:1905144) cellular response to acetylcholine(GO:1905145) |
| 0.1 | 0.5 | GO:0051823 | regulation of synapse structural plasticity(GO:0051823) |
| 0.1 | 1.2 | GO:0090110 | cargo loading into COPII-coated vesicle(GO:0090110) |
| 0.1 | 0.3 | GO:0007144 | female meiosis I(GO:0007144) |
| 0.1 | 0.9 | GO:0043562 | cellular response to nitrogen starvation(GO:0006995) cellular response to nitrogen levels(GO:0043562) |
| 0.1 | 2.7 | GO:0051489 | regulation of filopodium assembly(GO:0051489) |
| 0.1 | 0.2 | GO:0010286 | heat acclimation(GO:0010286) cellular heat acclimation(GO:0070370) |
| 0.1 | 0.4 | GO:0009597 | detection of virus(GO:0009597) |
| 0.1 | 1.8 | GO:0010762 | regulation of fibroblast migration(GO:0010762) |
| 0.1 | 3.7 | GO:0000186 | activation of MAPKK activity(GO:0000186) |
| 0.1 | 2.1 | GO:0031529 | ruffle organization(GO:0031529) |
| 0.1 | 2.0 | GO:0045745 | positive regulation of G-protein coupled receptor protein signaling pathway(GO:0045745) |
| 0.1 | 0.3 | GO:0010728 | regulation of hydrogen peroxide biosynthetic process(GO:0010728) |
| 0.1 | 0.2 | GO:0003430 | growth plate cartilage chondrocyte growth(GO:0003430) growth plate cartilage chondrocyte development(GO:0003431) |
| 0.1 | 0.5 | GO:0007042 | lysosomal lumen acidification(GO:0007042) |
| 0.1 | 1.5 | GO:0008038 | neuron recognition(GO:0008038) |
| 0.1 | 0.8 | GO:0006751 | glutathione catabolic process(GO:0006751) |
| 0.1 | 0.9 | GO:0048642 | negative regulation of skeletal muscle tissue development(GO:0048642) |
| 0.1 | 0.3 | GO:1903358 | regulation of Golgi organization(GO:1903358) |
| 0.1 | 0.6 | GO:0045161 | neuronal ion channel clustering(GO:0045161) |
| 0.1 | 0.2 | GO:0050928 | negative regulation of positive chemotaxis(GO:0050928) |
| 0.1 | 0.6 | GO:0090084 | negative regulation of inclusion body assembly(GO:0090084) |
| 0.0 | 0.1 | GO:0002232 | leukocyte chemotaxis involved in inflammatory response(GO:0002232) cell surface pattern recognition receptor signaling pathway(GO:0002752) |
| 0.0 | 0.3 | GO:0010039 | response to iron ion(GO:0010039) |
| 0.0 | 0.1 | GO:2001303 | cellular response to interleukin-13(GO:0035963) lipoxin biosynthetic process(GO:2001301) lipoxin A4 metabolic process(GO:2001302) lipoxin A4 biosynthetic process(GO:2001303) |
| 0.0 | 0.9 | GO:0006744 | ubiquinone biosynthetic process(GO:0006744) quinone biosynthetic process(GO:1901663) |
| 0.0 | 0.3 | GO:0007341 | penetration of zona pellucida(GO:0007341) spermatogenesis, exchange of chromosomal proteins(GO:0035093) |
| 0.0 | 1.8 | GO:0070979 | protein K11-linked ubiquitination(GO:0070979) |
| 0.0 | 0.7 | GO:0060009 | Sertoli cell development(GO:0060009) |
| 0.0 | 0.5 | GO:1901078 | negative regulation of relaxation of muscle(GO:1901078) negative regulation of relaxation of cardiac muscle(GO:1901898) |
| 0.0 | 0.4 | GO:0006531 | aspartate metabolic process(GO:0006531) |
| 0.0 | 0.1 | GO:2000213 | nitrogen catabolite regulation of transcription from RNA polymerase II promoter(GO:0001079) nitrogen catabolite activation of transcription from RNA polymerase II promoter(GO:0001080) regulation of nitrogen utilization(GO:0006808) nitrogen utilization(GO:0019740) regulation of urea metabolic process(GO:0034255) intracellular bile acid receptor signaling pathway(GO:0038185) interleukin-17 secretion(GO:0072615) nitrogen catabolite regulation of transcription(GO:0090293) nitrogen catabolite activation of transcription(GO:0090294) regulation of nitrogen cycle metabolic process(GO:1903314) positive regulation of glutamate metabolic process(GO:2000213) regulation of ammonia assimilation cycle(GO:2001248) positive regulation of ammonia assimilation cycle(GO:2001250) |
| 0.0 | 0.3 | GO:0034088 | maintenance of sister chromatid cohesion(GO:0034086) maintenance of mitotic sister chromatid cohesion(GO:0034088) |
| 0.0 | 1.8 | GO:0016486 | peptide hormone processing(GO:0016486) |
| 0.0 | 0.8 | GO:0035455 | response to interferon-alpha(GO:0035455) |
| 0.0 | 0.3 | GO:0043653 | mitochondrial fragmentation involved in apoptotic process(GO:0043653) |
| 0.0 | 0.9 | GO:0006895 | Golgi to endosome transport(GO:0006895) |
| 0.0 | 0.3 | GO:0035860 | glial cell-derived neurotrophic factor receptor signaling pathway(GO:0035860) |
| 0.0 | 0.5 | GO:0051639 | actin filament network formation(GO:0051639) |
| 0.0 | 0.2 | GO:0031914 | negative regulation of synaptic plasticity(GO:0031914) |
| 0.0 | 0.4 | GO:0001731 | formation of translation preinitiation complex(GO:0001731) |
| 0.0 | 0.1 | GO:0010193 | response to ozone(GO:0010193) |
| 0.0 | 0.1 | GO:1901594 | detection of temperature stimulus involved in thermoception(GO:0050960) response to capsazepine(GO:1901594) |
| 0.0 | 2.6 | GO:0097031 | NADH dehydrogenase complex assembly(GO:0010257) mitochondrial respiratory chain complex I assembly(GO:0032981) mitochondrial respiratory chain complex I biogenesis(GO:0097031) |
| 0.0 | 0.2 | GO:0048194 | Golgi vesicle budding(GO:0048194) |
| 0.0 | 0.1 | GO:0045918 | negative regulation of cytolysis(GO:0045918) |
| 0.0 | 0.2 | GO:0048280 | vesicle fusion with Golgi apparatus(GO:0048280) |
| 0.0 | 0.9 | GO:0000729 | DNA double-strand break processing(GO:0000729) |
| 0.0 | 0.1 | GO:0015783 | GDP-fucose transport(GO:0015783) purine nucleotide-sugar transport(GO:0036079) |
| 0.0 | 0.2 | GO:0038169 | somatostatin receptor signaling pathway(GO:0038169) somatostatin signaling pathway(GO:0038170) |
| 0.0 | 0.1 | GO:0019074 | viral genome packaging(GO:0019072) viral RNA genome packaging(GO:0019074) |
| 0.0 | 0.2 | GO:0019464 | glycine catabolic process(GO:0006546) glycine decarboxylation via glycine cleavage system(GO:0019464) |
| 0.0 | 0.2 | GO:2000110 | regulation of MyD88-dependent toll-like receptor signaling pathway(GO:0034124) negative regulation of macrophage apoptotic process(GO:2000110) |
| 0.0 | 0.8 | GO:0046475 | glycerophospholipid catabolic process(GO:0046475) |
| 0.0 | 0.2 | GO:0032784 | regulation of DNA-templated transcription, elongation(GO:0032784) |
| 0.0 | 0.1 | GO:0002913 | positive regulation of T cell anergy(GO:0002669) positive regulation of lymphocyte anergy(GO:0002913) |
| 0.0 | 0.3 | GO:0019370 | leukotriene biosynthetic process(GO:0019370) |
| 0.0 | 0.2 | GO:0045039 | protein import into mitochondrial inner membrane(GO:0045039) |
| 0.0 | 0.1 | GO:0035928 | rRNA import into mitochondrion(GO:0035928) |
| 0.0 | 1.2 | GO:0006636 | unsaturated fatty acid biosynthetic process(GO:0006636) |
| 0.0 | 0.1 | GO:0038189 | neuropilin signaling pathway(GO:0038189) VEGF-activated neuropilin signaling pathway(GO:0038190) positive regulation of retinal ganglion cell axon guidance(GO:1902336) |
| 0.0 | 0.1 | GO:1902004 | regulation of beta-amyloid formation(GO:1902003) positive regulation of beta-amyloid formation(GO:1902004) |
| 0.0 | 0.1 | GO:0051409 | response to nitrosative stress(GO:0051409) |
| 0.0 | 0.3 | GO:0051865 | protein autoubiquitination(GO:0051865) |
| 0.0 | 0.3 | GO:0036159 | inner dynein arm assembly(GO:0036159) |
| 0.0 | 0.1 | GO:0048496 | maintenance of organ identity(GO:0048496) |
| 0.0 | 0.1 | GO:0001694 | histamine biosynthetic process(GO:0001694) |
| 0.0 | 0.5 | GO:0016446 | somatic diversification of immune receptors via somatic mutation(GO:0002566) somatic hypermutation of immunoglobulin genes(GO:0016446) |
| 0.0 | 0.7 | GO:0048511 | rhythmic process(GO:0048511) |
| 0.0 | 0.1 | GO:0005986 | sucrose biosynthetic process(GO:0005986) |
| 0.0 | 0.4 | GO:0097352 | autophagosome maturation(GO:0097352) |
| 0.0 | 0.3 | GO:0070986 | left/right axis specification(GO:0070986) |
| 0.0 | 0.2 | GO:0009642 | response to light intensity(GO:0009642) |
| 0.0 | 0.4 | GO:0030854 | positive regulation of granulocyte differentiation(GO:0030854) |
| 0.0 | 0.5 | GO:0045662 | negative regulation of myoblast differentiation(GO:0045662) |
| 0.0 | 0.6 | GO:0097502 | mannosylation(GO:0097502) |
| 0.0 | 0.1 | GO:0003025 | regulation of systemic arterial blood pressure by baroreceptor feedback(GO:0003025) |
| 0.0 | 1.6 | GO:0030049 | muscle filament sliding(GO:0030049) actin-myosin filament sliding(GO:0033275) |
| 0.0 | 0.2 | GO:0055088 | lipid homeostasis(GO:0055088) |
| 0.0 | 0.4 | GO:1901998 | toxin transport(GO:1901998) |
| 0.0 | 0.1 | GO:1902268 | negative regulation of polyamine transmembrane transport(GO:1902268) |
| 0.0 | 0.1 | GO:0010735 | positive regulation of transcription via serum response element binding(GO:0010735) |
| 0.0 | 0.9 | GO:0031102 | neuron projection regeneration(GO:0031102) |
| 0.0 | 0.3 | GO:0035826 | rubidium ion transport(GO:0035826) regulation of rubidium ion transport(GO:2000680) |
| 0.0 | 0.1 | GO:1900186 | negative regulation of clathrin-mediated endocytosis(GO:1900186) |
| 0.0 | 0.3 | GO:0003416 | endochondral bone growth(GO:0003416) |
| 0.0 | 0.4 | GO:0045947 | negative regulation of translational initiation(GO:0045947) |
| 0.0 | 0.2 | GO:0034975 | protein folding in endoplasmic reticulum(GO:0034975) |
| 0.0 | 0.3 | GO:0000185 | activation of MAPKKK activity(GO:0000185) |
| 0.0 | 0.9 | GO:0032330 | regulation of chondrocyte differentiation(GO:0032330) |
| 0.0 | 0.2 | GO:0060670 | branching involved in labyrinthine layer morphogenesis(GO:0060670) |
| 0.0 | 0.4 | GO:0001580 | detection of chemical stimulus involved in sensory perception of bitter taste(GO:0001580) |
| 0.0 | 0.1 | GO:0050885 | neuromuscular process controlling balance(GO:0050885) |
| 0.0 | 0.1 | GO:0097107 | postsynaptic density organization(GO:0097106) postsynaptic density assembly(GO:0097107) gephyrin clustering involved in postsynaptic density assembly(GO:0097116) |
| 0.0 | 8.2 | GO:0043687 | post-translational protein modification(GO:0043687) |
| 0.0 | 0.3 | GO:0006833 | water transport(GO:0006833) |
| 0.0 | 0.1 | GO:0032074 | negative regulation of nuclease activity(GO:0032074) |
| 0.0 | 0.3 | GO:0035116 | embryonic hindlimb morphogenesis(GO:0035116) |
| 0.0 | 0.3 | GO:0042136 | neurotransmitter biosynthetic process(GO:0042136) |
| 0.0 | 0.4 | GO:0006884 | cell volume homeostasis(GO:0006884) |
| 0.0 | 0.2 | GO:0002315 | marginal zone B cell differentiation(GO:0002315) |
| 0.0 | 0.3 | GO:0045599 | negative regulation of fat cell differentiation(GO:0045599) |
| 0.0 | 0.2 | GO:2000052 | positive regulation of non-canonical Wnt signaling pathway(GO:2000052) |
| 0.0 | 0.1 | GO:0019896 | axonal transport of mitochondrion(GO:0019896) |
| 0.0 | 0.1 | GO:0032425 | regulation of mismatch repair(GO:0032423) positive regulation of mismatch repair(GO:0032425) |
| 0.0 | 0.7 | GO:0007517 | muscle organ development(GO:0007517) |
| 0.0 | 0.3 | GO:0030208 | dermatan sulfate biosynthetic process(GO:0030208) |
| 0.0 | 1.1 | GO:0031338 | regulation of vesicle fusion(GO:0031338) |
| 0.0 | 0.1 | GO:0009312 | oligosaccharide biosynthetic process(GO:0009312) |
| 0.0 | 0.2 | GO:0060044 | negative regulation of cardiac muscle cell proliferation(GO:0060044) |
| 0.0 | 0.1 | GO:0070884 | regulation of calcineurin-NFAT signaling cascade(GO:0070884) |
| 0.0 | 0.1 | GO:0051897 | positive regulation of protein kinase B signaling(GO:0051897) |
| 0.0 | 0.4 | GO:0006517 | protein deglycosylation(GO:0006517) |
| 0.0 | 0.3 | GO:0090200 | positive regulation of release of cytochrome c from mitochondria(GO:0090200) |
| 0.0 | 0.6 | GO:0000381 | regulation of alternative mRNA splicing, via spliceosome(GO:0000381) |
| 0.0 | 0.1 | GO:0048266 | behavioral response to pain(GO:0048266) |
| 0.0 | 0.0 | GO:1904530 | regulation of actin filament binding(GO:1904529) negative regulation of actin filament binding(GO:1904530) regulation of actin binding(GO:1904616) negative regulation of actin binding(GO:1904617) |
| 0.0 | 0.1 | GO:0060012 | synaptic transmission, glycinergic(GO:0060012) |
| 0.0 | 0.6 | GO:0010501 | RNA secondary structure unwinding(GO:0010501) |
| 0.0 | 0.4 | GO:0051496 | positive regulation of stress fiber assembly(GO:0051496) |
| 0.0 | 0.9 | GO:0006695 | cholesterol biosynthetic process(GO:0006695) |
| 0.0 | 0.1 | GO:0014051 | gamma-aminobutyric acid secretion(GO:0014051) |
| 0.0 | 0.1 | GO:0033033 | negative regulation of myeloid cell apoptotic process(GO:0033033) |
| 0.0 | 0.1 | GO:0043950 | positive regulation of cAMP-mediated signaling(GO:0043950) |
| 0.0 | 0.4 | GO:0032463 | negative regulation of protein homooligomerization(GO:0032463) |
| 0.0 | 0.3 | GO:0048536 | spleen development(GO:0048536) |
| 0.0 | 0.2 | GO:0006977 | DNA damage response, signal transduction by p53 class mediator resulting in cell cycle arrest(GO:0006977) signal transduction involved in mitotic cell cycle checkpoint(GO:0072413) signal transduction involved in mitotic G1 DNA damage checkpoint(GO:0072431) intracellular signal transduction involved in G1 DNA damage checkpoint(GO:1902400) signal transduction involved in mitotic DNA damage checkpoint(GO:1902402) signal transduction involved in mitotic DNA integrity checkpoint(GO:1902403) |
| 0.0 | 0.2 | GO:0042340 | keratan sulfate catabolic process(GO:0042340) |
| 0.0 | 0.1 | GO:0070536 | protein K63-linked deubiquitination(GO:0070536) |
| 0.0 | 0.1 | GO:0033234 | negative regulation of protein sumoylation(GO:0033234) |
| 0.0 | 0.2 | GO:0006986 | response to unfolded protein(GO:0006986) |
| 0.0 | 0.3 | GO:0033119 | negative regulation of RNA splicing(GO:0033119) |
| 0.0 | 0.1 | GO:0008298 | intracellular mRNA localization(GO:0008298) |