Project
ENCODE cell lines, expression (Ernst 2011)
Navigation
Downloads
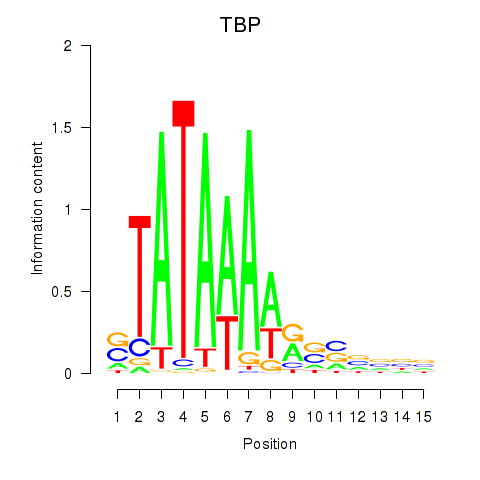
Results for TBP
Z-value: 2.61
Motif logo
Transcription factors associated with TBP
| Gene Symbol | Gene ID | Gene Info |
|---|---|---|
|
TBP
|
ENSG00000112592.8 | TBP |
Activity-expression correlation:
| Gene | Promoter | Pearson corr. coef. | P-value | Plot |
|---|---|---|---|---|
| TBP | hg19_v2_chr6_+_170863421_170863484 | -0.32 | 2.3e-01 | Click! |
Activity profile of TBP motif
Sorted Z-values of TBP motif
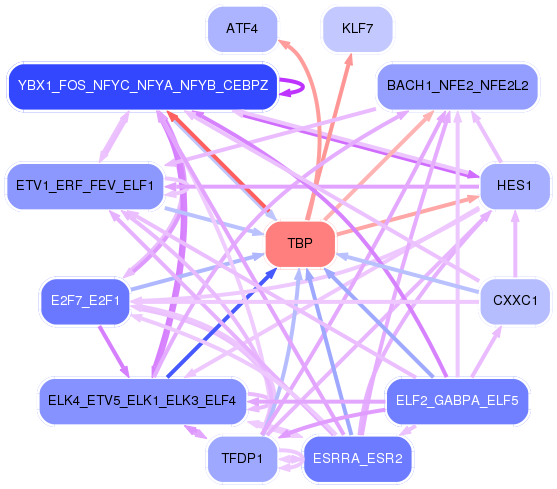
Network of associatons between targets according to the STRING database.

First level regulatory network of TBP
| Promoter | Score | Transcript | Gene | Gene Info |
|---|---|---|---|---|
| chr16_+_56685796 | 10.23 |
ENST00000334346.2 ENST00000562399.1 |
MT1B |
metallothionein 1B |
| chr12_-_52845910 | 9.98 |
ENST00000252252.3 |
KRT6B |
keratin 6B |
| chr12_-_52867569 | 8.35 |
ENST00000252250.6 |
KRT6C |
keratin 6C |
| chr10_+_54074033 | 7.40 |
ENST00000373970.3 |
DKK1 |
dickkopf WNT signaling pathway inhibitor 1 |
| chr17_-_39780819 | 7.30 |
ENST00000311208.8 |
KRT17 |
keratin 17 |
| chr1_+_153003671 | 7.00 |
ENST00000307098.4 |
SPRR1B |
small proline-rich protein 1B |
| chr1_-_59043166 | 6.54 |
ENST00000371225.2 |
TACSTD2 |
tumor-associated calcium signal transducer 2 |
| chr1_-_153538011 | 6.36 |
ENST00000368707.4 |
S100A2 |
S100 calcium binding protein A2 |
| chr1_-_153363452 | 6.02 |
ENST00000368732.1 ENST00000368733.3 |
S100A8 |
S100 calcium binding protein A8 |
| chr17_-_39674668 | 5.98 |
ENST00000393981.3 |
KRT15 |
keratin 15 |
| chr3_+_122044084 | 5.91 |
ENST00000264474.3 ENST00000479204.1 |
CSTA |
cystatin A (stefin A) |
| chr12_-_53012343 | 5.87 |
ENST00000305748.3 |
KRT73 |
keratin 73 |
| chr16_+_56659687 | 5.78 |
ENST00000568293.1 ENST00000330439.6 |
MT1E |
metallothionein 1E |
| chr21_-_28217721 | 5.66 |
ENST00000284984.3 |
ADAMTS1 |
ADAM metallopeptidase with thrombospondin type 1 motif, 1 |
| chr1_+_153330322 | 5.48 |
ENST00000368738.3 |
S100A9 |
S100 calcium binding protein A9 |
| chr15_-_63674034 | 5.47 |
ENST00000344366.3 ENST00000422263.2 |
CA12 |
carbonic anhydrase XII |
| chr20_-_43883197 | 5.29 |
ENST00000338380.2 |
SLPI |
secretory leukocyte peptidase inhibitor |
| chr3_-_111314230 | 4.97 |
ENST00000317012.4 |
ZBED2 |
zinc finger, BED-type containing 2 |
| chr11_-_2950642 | 4.95 |
ENST00000314222.4 |
PHLDA2 |
pleckstrin homology-like domain, family A, member 2 |
| chr15_-_63674218 | 4.92 |
ENST00000178638.3 |
CA12 |
carbonic anhydrase XII |
| chr2_-_151344172 | 4.66 |
ENST00000375734.2 ENST00000263895.4 ENST00000454202.1 |
RND3 |
Rho family GTPase 3 |
| chr1_-_209825674 | 4.62 |
ENST00000367030.3 ENST00000356082.4 |
LAMB3 |
laminin, beta 3 |
| chr16_+_56703737 | 4.31 |
ENST00000569155.1 |
MT1H |
metallothionein 1H |
| chr12_+_6309517 | 4.30 |
ENST00000382519.4 ENST00000009180.4 |
CD9 |
CD9 molecule |
| chr16_+_56703703 | 4.18 |
ENST00000332374.4 |
MT1H |
metallothionein 1H |
| chr3_+_62304712 | 4.12 |
ENST00000494481.1 |
C3orf14 |
chromosome 3 open reading frame 14 |
| chr5_-_57756087 | 4.08 |
ENST00000274289.3 |
PLK2 |
polo-like kinase 2 |
| chr3_+_62304648 | 3.90 |
ENST00000462069.1 ENST00000232519.5 ENST00000465142.1 |
C3orf14 |
chromosome 3 open reading frame 14 |
| chr1_-_95007193 | 3.86 |
ENST00000370207.4 ENST00000334047.7 |
F3 |
coagulation factor III (thromboplastin, tissue factor) |
| chr16_+_56691606 | 3.67 |
ENST00000334350.6 |
MT1F |
metallothionein 1F |
| chr1_+_152881014 | 3.33 |
ENST00000368764.3 ENST00000392667.2 |
IVL |
involucrin |
| chr4_+_169842707 | 3.19 |
ENST00000503290.1 |
PALLD |
palladin, cytoskeletal associated protein |
| chr4_+_74735102 | 3.11 |
ENST00000395761.3 |
CXCL1 |
chemokine (C-X-C motif) ligand 1 (melanoma growth stimulating activity, alpha) |
| chr16_-_56701933 | 2.95 |
ENST00000568675.1 ENST00000569500.1 ENST00000444837.2 ENST00000379811.3 |
MT1G |
metallothionein 1G |
| chr3_+_190333097 | 2.91 |
ENST00000412080.1 |
IL1RAP |
interleukin 1 receptor accessory protein |
| chr2_-_106054952 | 2.83 |
ENST00000336660.5 ENST00000393352.3 ENST00000607522.1 |
FHL2 |
four and a half LIM domains 2 |
| chr6_-_134495992 | 2.79 |
ENST00000475719.2 ENST00000367857.5 ENST00000237305.7 |
SGK1 |
serum/glucocorticoid regulated kinase 1 |
| chr14_+_75745477 | 2.69 |
ENST00000303562.4 ENST00000554617.1 ENST00000554212.1 ENST00000535987.1 ENST00000555242.1 |
FOS |
FBJ murine osteosarcoma viral oncogene homolog |
| chr16_+_56691911 | 2.61 |
ENST00000568475.1 |
MT1F |
metallothionein 1F |
| chr16_+_56598961 | 2.56 |
ENST00000219162.3 |
MT4 |
metallothionein 4 |
| chr17_-_74707037 | 2.47 |
ENST00000355797.3 ENST00000375036.2 ENST00000449428.2 |
MXRA7 |
matrix-remodelling associated 7 |
| chr10_-_126716459 | 2.42 |
ENST00000309035.6 |
CTBP2 |
C-terminal binding protein 2 |
| chr11_+_62623621 | 2.40 |
ENST00000535296.1 |
SLC3A2 |
solute carrier family 3 (amino acid transporter heavy chain), member 2 |
| chr8_-_23261589 | 2.40 |
ENST00000524168.1 ENST00000523833.2 ENST00000519243.1 ENST00000389131.3 |
LOXL2 |
lysyl oxidase-like 2 |
| chr11_+_18287721 | 2.37 |
ENST00000356524.4 |
SAA1 |
serum amyloid A1 |
| chr1_+_86046433 | 2.33 |
ENST00000451137.2 |
CYR61 |
cysteine-rich, angiogenic inducer, 61 |
| chr19_-_50143452 | 2.30 |
ENST00000246792.3 |
RRAS |
related RAS viral (r-ras) oncogene homolog |
| chr6_+_31783291 | 2.28 |
ENST00000375651.5 ENST00000608703.1 ENST00000458062.2 |
HSPA1A |
heat shock 70kDa protein 1A |
| chr19_-_45982076 | 2.27 |
ENST00000423698.2 |
ERCC1 |
excision repair cross-complementing rodent repair deficiency, complementation group 1 (includes overlapping antisense sequence) |
| chr11_+_18287801 | 2.23 |
ENST00000532858.1 ENST00000405158.2 |
SAA1 |
serum amyloid A1 |
| chr3_+_142342228 | 2.05 |
ENST00000337777.3 |
PLS1 |
plastin 1 |
| chr12_-_52685312 | 1.99 |
ENST00000327741.5 |
KRT81 |
keratin 81 |
| chr14_+_65007177 | 1.97 |
ENST00000247207.6 |
HSPA2 |
heat shock 70kDa protein 2 |
| chr3_+_101546827 | 1.97 |
ENST00000461724.1 ENST00000483180.1 ENST00000394054.2 |
NFKBIZ |
nuclear factor of kappa light polypeptide gene enhancer in B-cells inhibitor, zeta |
| chr1_-_43424500 | 1.95 |
ENST00000415851.2 ENST00000426263.3 ENST00000372500.3 |
SLC2A1 |
solute carrier family 2 (facilitated glucose transporter), member 1 |
| chr12_-_53074182 | 1.93 |
ENST00000252244.3 |
KRT1 |
keratin 1 |
| chr17_-_39553844 | 1.88 |
ENST00000251645.2 |
KRT31 |
keratin 31 |
| chr10_+_5135981 | 1.88 |
ENST00000380554.3 |
AKR1C3 |
aldo-keto reductase family 1, member C3 |
| chr1_-_152297679 | 1.82 |
ENST00000368799.1 |
FLG |
filaggrin |
| chr19_-_6720686 | 1.82 |
ENST00000245907.6 |
C3 |
complement component 3 |
| chr11_-_18270182 | 1.80 |
ENST00000528349.1 ENST00000526900.1 ENST00000529528.1 ENST00000414546.2 ENST00000256733.4 |
SAA2 |
serum amyloid A2 |
| chr11_-_102651343 | 1.79 |
ENST00000279441.4 ENST00000539681.1 |
MMP10 |
matrix metallopeptidase 10 (stromelysin 2) |
| chr1_-_153044083 | 1.74 |
ENST00000341611.2 |
SPRR2B |
small proline-rich protein 2B |
| chr18_-_61329118 | 1.71 |
ENST00000332821.8 ENST00000283752.5 |
SERPINB3 |
serpin peptidase inhibitor, clade B (ovalbumin), member 3 |
| chr11_+_62623512 | 1.66 |
ENST00000377892.1 |
SLC3A2 |
solute carrier family 3 (amino acid transporter heavy chain), member 2 |
| chr11_+_62623544 | 1.65 |
ENST00000377890.2 ENST00000377891.2 ENST00000377889.2 |
SLC3A2 |
solute carrier family 3 (amino acid transporter heavy chain), member 2 |
| chr1_-_153013588 | 1.65 |
ENST00000360379.3 |
SPRR2D |
small proline-rich protein 2D |
| chr20_+_30193083 | 1.64 |
ENST00000376112.3 ENST00000376105.3 |
ID1 |
inhibitor of DNA binding 1, dominant negative helix-loop-helix protein |
| chr9_-_33447584 | 1.64 |
ENST00000297991.4 |
AQP3 |
aquaporin 3 (Gill blood group) |
| chr12_+_4385230 | 1.64 |
ENST00000536537.1 |
CCND2 |
cyclin D2 |
| chr4_-_169239921 | 1.59 |
ENST00000514995.1 ENST00000393743.3 |
DDX60 |
DEAD (Asp-Glu-Ala-Asp) box polypeptide 60 |
| chr1_-_182360498 | 1.57 |
ENST00000417584.2 |
GLUL |
glutamate-ammonia ligase |
| chr9_+_130911723 | 1.56 |
ENST00000277480.2 ENST00000373013.2 ENST00000540948.1 |
LCN2 |
lipocalin 2 |
| chr5_-_16742330 | 1.53 |
ENST00000505695.1 ENST00000427430.2 |
MYO10 |
myosin X |
| chr9_+_124088860 | 1.52 |
ENST00000373806.1 |
GSN |
gelsolin |
| chr1_-_182360918 | 1.52 |
ENST00000339526.4 |
GLUL |
glutamate-ammonia ligase |
| chr9_+_130911770 | 1.51 |
ENST00000372998.1 |
LCN2 |
lipocalin 2 |
| chr1_-_182361327 | 1.49 |
ENST00000331872.6 ENST00000311223.5 |
GLUL |
glutamate-ammonia ligase |
| chr1_-_153518270 | 1.37 |
ENST00000354332.4 ENST00000368716.4 |
S100A4 |
S100 calcium binding protein A4 |
| chr7_-_41742697 | 1.35 |
ENST00000242208.4 |
INHBA |
inhibin, beta A |
| chr2_-_208030647 | 1.33 |
ENST00000309446.6 |
KLF7 |
Kruppel-like factor 7 (ubiquitous) |
| chr19_-_14628645 | 1.32 |
ENST00000598235.1 |
DNAJB1 |
DnaJ (Hsp40) homolog, subfamily B, member 1 |
| chr10_+_17271266 | 1.31 |
ENST00000224237.5 |
VIM |
vimentin |
| chr12_+_1738363 | 1.31 |
ENST00000397196.2 |
WNT5B |
wingless-type MMTV integration site family, member 5B |
| chr4_-_74904398 | 1.30 |
ENST00000296026.4 |
CXCL3 |
chemokine (C-X-C motif) ligand 3 |
| chr1_-_27481401 | 1.28 |
ENST00000263980.3 |
SLC9A1 |
solute carrier family 9, subfamily A (NHE1, cation proton antiporter 1), member 1 |
| chr5_-_42811986 | 1.28 |
ENST00000511224.1 ENST00000507920.1 ENST00000510965.1 |
SEPP1 |
selenoprotein P, plasma, 1 |
| chr5_-_42812143 | 1.28 |
ENST00000514985.1 |
SEPP1 |
selenoprotein P, plasma, 1 |
| chr14_-_102706934 | 1.24 |
ENST00000523231.1 ENST00000524370.1 ENST00000517966.1 |
MOK |
MOK protein kinase |
| chr17_-_39538550 | 1.22 |
ENST00000394001.1 |
KRT34 |
keratin 34 |
| chr11_-_61735103 | 1.22 |
ENST00000529191.1 ENST00000529631.1 ENST00000530019.1 ENST00000529548.1 ENST00000273550.7 |
FTH1 |
ferritin, heavy polypeptide 1 |
| chr11_-_33774944 | 1.21 |
ENST00000532057.1 ENST00000531080.1 |
FBXO3 |
F-box protein 3 |
| chr5_-_74162605 | 1.21 |
ENST00000389156.4 ENST00000510496.1 ENST00000380515.3 |
FAM169A |
family with sequence similarity 169, member A |
| chr4_-_57547454 | 1.19 |
ENST00000556376.2 |
HOPX |
HOP homeobox |
| chr22_+_39916558 | 1.15 |
ENST00000337304.2 ENST00000396680.1 |
ATF4 |
activating transcription factor 4 |
| chr6_+_26124373 | 1.14 |
ENST00000377791.2 ENST00000602637.1 |
HIST1H2AC |
histone cluster 1, H2ac |
| chr3_-_99595037 | 1.13 |
ENST00000383694.2 |
FILIP1L |
filamin A interacting protein 1-like |
| chr17_+_39411636 | 1.12 |
ENST00000394008.1 |
KRTAP9-9 |
keratin associated protein 9-9 |
| chrX_-_133792480 | 1.12 |
ENST00000359237.4 |
PLAC1 |
placenta-specific 1 |
| chr17_+_79008940 | 1.09 |
ENST00000392411.3 ENST00000575989.1 ENST00000321280.7 ENST00000428708.2 ENST00000575712.1 ENST00000575245.1 ENST00000435091.3 ENST00000321300.6 |
BAIAP2 |
BAI1-associated protein 2 |
| chr6_-_52860171 | 1.08 |
ENST00000370963.4 |
GSTA4 |
glutathione S-transferase alpha 4 |
| chr8_-_18744528 | 1.08 |
ENST00000523619.1 |
PSD3 |
pleckstrin and Sec7 domain containing 3 |
| chr4_-_57547870 | 1.05 |
ENST00000381260.3 ENST00000420433.1 ENST00000554144.1 ENST00000557328.1 |
HOPX |
HOP homeobox |
| chr6_-_33239612 | 1.02 |
ENST00000482399.1 ENST00000445902.2 |
VPS52 |
vacuolar protein sorting 52 homolog (S. cerevisiae) |
| chr6_+_27114861 | 0.99 |
ENST00000377459.1 |
HIST1H2AH |
histone cluster 1, H2ah |
| chr3_+_193853927 | 0.95 |
ENST00000232424.3 |
HES1 |
hes family bHLH transcription factor 1 |
| chr7_-_30066233 | 0.93 |
ENST00000222803.5 |
FKBP14 |
FK506 binding protein 14, 22 kDa |
| chr5_+_66254698 | 0.91 |
ENST00000405643.1 ENST00000407621.1 ENST00000432426.1 |
MAST4 |
microtubule associated serine/threonine kinase family member 4 |
| chr3_-_126327398 | 0.89 |
ENST00000383572.2 |
TXNRD3NB |
thioredoxin reductase 3 neighbor |
| chr19_-_53636125 | 0.87 |
ENST00000601493.1 ENST00000599261.1 ENST00000597503.1 ENST00000500065.4 ENST00000243643.4 ENST00000594011.1 ENST00000455735.2 ENST00000595193.1 ENST00000448501.1 ENST00000421033.1 ENST00000440291.1 ENST00000595813.1 ENST00000600574.1 ENST00000596051.1 ENST00000601110.1 |
ZNF415 |
zinc finger protein 415 |
| chr3_-_99594948 | 0.84 |
ENST00000471562.1 ENST00000495625.2 |
FILIP1L |
filamin A interacting protein 1-like |
| chr6_+_111195973 | 0.84 |
ENST00000368885.3 ENST00000368882.3 ENST00000451850.2 ENST00000368877.5 |
AMD1 |
adenosylmethionine decarboxylase 1 |
| chr5_+_140739537 | 0.83 |
ENST00000522605.1 |
PCDHGB2 |
protocadherin gamma subfamily B, 2 |
| chr19_+_13049413 | 0.82 |
ENST00000316448.5 ENST00000588454.1 |
CALR |
calreticulin |
| chr18_+_21719018 | 0.82 |
ENST00000585037.1 ENST00000415309.2 ENST00000399481.2 ENST00000577705.1 ENST00000327201.6 |
CABYR |
calcium binding tyrosine-(Y)-phosphorylation regulated |
| chr10_+_91152303 | 0.82 |
ENST00000371804.3 |
IFIT1 |
interferon-induced protein with tetratricopeptide repeats 1 |
| chr7_+_115862858 | 0.81 |
ENST00000393481.2 |
TES |
testis derived transcript (3 LIM domains) |
| chr12_+_130646999 | 0.81 |
ENST00000539839.1 ENST00000229030.4 |
FZD10 |
frizzled family receptor 10 |
| chr12_-_125399573 | 0.81 |
ENST00000339647.5 |
UBC |
ubiquitin C |
| chr19_+_1026566 | 0.81 |
ENST00000348419.3 ENST00000565096.2 ENST00000562958.2 ENST00000562075.2 ENST00000607102.1 |
CNN2 |
calponin 2 |
| chrX_+_37208521 | 0.78 |
ENST00000378628.4 |
PRRG1 |
proline rich Gla (G-carboxyglutamic acid) 1 |
| chr19_+_1026298 | 0.76 |
ENST00000263097.4 |
CNN2 |
calponin 2 |
| chr16_+_71392616 | 0.76 |
ENST00000349553.5 ENST00000302628.4 ENST00000562305.1 |
CALB2 |
calbindin 2 |
| chr2_-_43453734 | 0.75 |
ENST00000282388.3 |
ZFP36L2 |
ZFP36 ring finger protein-like 2 |
| chr9_+_140135665 | 0.72 |
ENST00000340384.4 |
TUBB4B |
tubulin, beta 4B class IVb |
| chr14_-_107211459 | 0.72 |
ENST00000390636.2 |
IGHV3-73 |
immunoglobulin heavy variable 3-73 |
| chr16_+_82068830 | 0.72 |
ENST00000199936.4 |
HSD17B2 |
hydroxysteroid (17-beta) dehydrogenase 2 |
| chr13_+_45694583 | 0.72 |
ENST00000340473.6 |
GTF2F2 |
general transcription factor IIF, polypeptide 2, 30kDa |
| chr18_+_21718924 | 0.69 |
ENST00000399496.3 |
CABYR |
calcium binding tyrosine-(Y)-phosphorylation regulated |
| chr22_+_32340481 | 0.69 |
ENST00000397492.1 |
YWHAH |
tyrosine 3-monooxygenase/tryptophan 5-monooxygenase activation protein, eta |
| chr8_-_59412717 | 0.68 |
ENST00000301645.3 |
CYP7A1 |
cytochrome P450, family 7, subfamily A, polypeptide 1 |
| chr15_-_72523454 | 0.67 |
ENST00000565154.1 ENST00000565184.1 ENST00000389093.3 ENST00000449901.2 ENST00000335181.5 ENST00000319622.6 |
PKM |
pyruvate kinase, muscle |
| chr19_-_6767516 | 0.66 |
ENST00000245908.6 |
SH2D3A |
SH2 domain containing 3A |
| chr1_-_156675368 | 0.66 |
ENST00000368222.3 |
CRABP2 |
cellular retinoic acid binding protein 2 |
| chrX_-_62974941 | 0.62 |
ENST00000374872.1 ENST00000253401.6 ENST00000374870.4 |
ARHGEF9 |
Cdc42 guanine nucleotide exchange factor (GEF) 9 |
| chr2_-_178128528 | 0.61 |
ENST00000397063.4 ENST00000421929.1 |
NFE2L2 |
nuclear factor, erythroid 2-like 2 |
| chr20_-_39928705 | 0.61 |
ENST00000436099.2 ENST00000309060.3 ENST00000373261.1 ENST00000436440.2 ENST00000540170.1 ENST00000557816.1 ENST00000560361.1 |
ZHX3 |
zinc fingers and homeoboxes 3 |
| chr6_+_112375462 | 0.60 |
ENST00000361714.1 |
WISP3 |
WNT1 inducible signaling pathway protein 3 |
| chr9_+_21409146 | 0.60 |
ENST00000380205.1 |
IFNA8 |
interferon, alpha 8 |
| chr20_+_18488528 | 0.60 |
ENST00000377465.1 |
SEC23B |
Sec23 homolog B (S. cerevisiae) |
| chr7_+_100273736 | 0.59 |
ENST00000412215.1 ENST00000393924.1 |
GNB2 |
guanine nucleotide binding protein (G protein), beta polypeptide 2 |
| chr1_+_149822620 | 0.58 |
ENST00000369159.2 |
HIST2H2AA4 |
histone cluster 2, H2aa4 |
| chr7_+_75931861 | 0.58 |
ENST00000248553.6 |
HSPB1 |
heat shock 27kDa protein 1 |
| chr3_-_197025447 | 0.57 |
ENST00000346964.2 ENST00000357674.4 ENST00000314062.3 ENST00000448528.2 ENST00000419553.1 |
DLG1 |
discs, large homolog 1 (Drosophila) |
| chr13_+_43597269 | 0.55 |
ENST00000379221.2 |
DNAJC15 |
DnaJ (Hsp40) homolog, subfamily C, member 15 |
| chr10_-_69455873 | 0.55 |
ENST00000433211.2 |
CTNNA3 |
catenin (cadherin-associated protein), alpha 3 |
| chr17_-_34345002 | 0.54 |
ENST00000293280.2 |
CCL23 |
chemokine (C-C motif) ligand 23 |
| chr11_-_118966167 | 0.54 |
ENST00000530167.1 |
H2AFX |
H2A histone family, member X |
| chr17_-_73775839 | 0.54 |
ENST00000592643.1 ENST00000591890.1 ENST00000587171.1 ENST00000254810.4 ENST00000589599.1 |
H3F3B |
H3 histone, family 3B (H3.3B) |
| chr1_+_206223941 | 0.54 |
ENST00000367126.4 |
AVPR1B |
arginine vasopressin receptor 1B |
| chr4_+_26585538 | 0.54 |
ENST00000264866.4 |
TBC1D19 |
TBC1 domain family, member 19 |
| chr18_+_34124507 | 0.54 |
ENST00000591635.1 |
FHOD3 |
formin homology 2 domain containing 3 |
| chr22_+_32340447 | 0.53 |
ENST00000248975.5 |
YWHAH |
tyrosine 3-monooxygenase/tryptophan 5-monooxygenase activation protein, eta |
| chr11_+_133938820 | 0.52 |
ENST00000299106.4 ENST00000529443.2 |
JAM3 |
junctional adhesion molecule 3 |
| chr21_-_43786634 | 0.51 |
ENST00000291527.2 |
TFF1 |
trefoil factor 1 |
| chr13_+_53602894 | 0.51 |
ENST00000219022.2 |
OLFM4 |
olfactomedin 4 |
| chr10_-_79397479 | 0.51 |
ENST00000404771.3 |
KCNMA1 |
potassium large conductance calcium-activated channel, subfamily M, alpha member 1 |
| chr1_-_33168336 | 0.51 |
ENST00000373484.3 |
SYNC |
syncoilin, intermediate filament protein |
| chr16_+_89989687 | 0.50 |
ENST00000315491.7 ENST00000555576.1 ENST00000554336.1 ENST00000553967.1 |
TUBB3 |
Tubulin beta-3 chain |
| chr9_+_108320392 | 0.50 |
ENST00000602661.1 ENST00000223528.2 ENST00000448551.2 ENST00000540160.1 |
FKTN |
fukutin |
| chr6_-_26124138 | 0.50 |
ENST00000314332.5 ENST00000396984.1 |
HIST1H2BC |
histone cluster 1, H2bc |
| chr8_-_6735451 | 0.50 |
ENST00000297439.3 |
DEFB1 |
defensin, beta 1 |
| chrX_-_7895755 | 0.50 |
ENST00000444736.1 ENST00000537427.1 ENST00000442940.1 |
PNPLA4 |
patatin-like phospholipase domain containing 4 |
| chr1_-_45987526 | 0.49 |
ENST00000372079.1 ENST00000262746.1 ENST00000447184.1 ENST00000319248.8 |
PRDX1 |
peroxiredoxin 1 |
| chr20_+_31823792 | 0.49 |
ENST00000375413.4 ENST00000354297.4 ENST00000375422.2 |
BPIFA1 |
BPI fold containing family A, member 1 |
| chr1_+_202830876 | 0.49 |
ENST00000456105.2 |
RP11-480I12.7 |
RP11-480I12.7 |
| chr12_+_11081828 | 0.49 |
ENST00000381847.3 ENST00000396400.3 |
PRH2 |
proline-rich protein HaeIII subfamily 2 |
| chr9_-_130639997 | 0.47 |
ENST00000373176.1 |
AK1 |
adenylate kinase 1 |
| chr5_-_158757895 | 0.47 |
ENST00000231228.2 |
IL12B |
interleukin 12B (natural killer cell stimulatory factor 2, cytotoxic lymphocyte maturation factor 2, p40) |
| chr1_-_207226313 | 0.46 |
ENST00000367084.1 |
YOD1 |
YOD1 deubiquitinase |
| chrX_-_7895479 | 0.46 |
ENST00000381042.4 |
PNPLA4 |
patatin-like phospholipase domain containing 4 |
| chr12_+_124155652 | 0.45 |
ENST00000426174.2 ENST00000303372.5 |
TCTN2 |
tectonic family member 2 |
| chr6_+_136172820 | 0.44 |
ENST00000308191.6 |
PDE7B |
phosphodiesterase 7B |
| chr1_-_149814478 | 0.44 |
ENST00000369161.3 |
HIST2H2AA3 |
histone cluster 2, H2aa3 |
| chr20_+_2276639 | 0.44 |
ENST00000381458.5 |
TGM3 |
transglutaminase 3 |
| chr6_+_31802364 | 0.44 |
ENST00000375640.3 ENST00000375641.2 |
C6orf48 |
chromosome 6 open reading frame 48 |
| chr11_-_61734599 | 0.44 |
ENST00000532601.1 |
FTH1 |
ferritin, heavy polypeptide 1 |
| chr12_-_118796910 | 0.44 |
ENST00000541186.1 ENST00000539872.1 |
TAOK3 |
TAO kinase 3 |
| chr6_-_33239712 | 0.43 |
ENST00000436044.2 |
VPS52 |
vacuolar protein sorting 52 homolog (S. cerevisiae) |
| chr20_-_39928756 | 0.43 |
ENST00000432768.2 |
ZHX3 |
zinc fingers and homeoboxes 3 |
| chr14_+_56127989 | 0.42 |
ENST00000555573.1 |
KTN1 |
kinectin 1 (kinesin receptor) |
| chr6_-_136847610 | 0.42 |
ENST00000454590.1 ENST00000432797.2 |
MAP7 |
microtubule-associated protein 7 |
| chr11_-_14380664 | 0.41 |
ENST00000545643.1 ENST00000256196.4 |
RRAS2 |
related RAS viral (r-ras) oncogene homolog 2 |
| chr19_-_55866104 | 0.41 |
ENST00000326529.4 |
COX6B2 |
cytochrome c oxidase subunit VIb polypeptide 2 (testis) |
| chr11_-_47400062 | 0.41 |
ENST00000533030.1 |
SPI1 |
spleen focus forming virus (SFFV) proviral integration oncogene |
| chr10_+_32856764 | 0.40 |
ENST00000375030.2 ENST00000375028.3 |
C10orf68 |
Homo sapiens coiled-coil domain containing 7 (CCDC7), transcript variant 5, mRNA. |
| chr6_-_26033796 | 0.39 |
ENST00000259791.2 |
HIST1H2AB |
histone cluster 1, H2ab |
| chr6_+_33239787 | 0.39 |
ENST00000439602.2 ENST00000474973.1 |
RPS18 |
ribosomal protein S18 |
| chr19_-_47164386 | 0.39 |
ENST00000391916.2 ENST00000410105.2 |
DACT3 |
dishevelled-binding antagonist of beta-catenin 3 |
| chr8_+_86351056 | 0.38 |
ENST00000285381.2 |
CA3 |
carbonic anhydrase III, muscle specific |
| chr6_+_43543942 | 0.38 |
ENST00000372226.1 ENST00000443535.1 |
POLH |
polymerase (DNA directed), eta |
| chr1_-_35658736 | 0.37 |
ENST00000357214.5 |
SFPQ |
splicing factor proline/glutamine-rich |
| chr11_-_61735029 | 0.37 |
ENST00000526640.1 |
FTH1 |
ferritin, heavy polypeptide 1 |
| chr1_-_54355430 | 0.36 |
ENST00000371399.1 ENST00000072644.1 ENST00000412288.1 |
YIPF1 |
Yip1 domain family, member 1 |
| chr6_-_133035185 | 0.36 |
ENST00000367928.4 |
VNN1 |
vanin 1 |
| chr2_-_182545603 | 0.36 |
ENST00000295108.3 |
NEUROD1 |
neuronal differentiation 1 |
| chr2_+_113763031 | 0.35 |
ENST00000259211.6 |
IL36A |
interleukin 36, alpha |
| chr1_+_224301787 | 0.35 |
ENST00000366862.5 ENST00000424254.2 |
FBXO28 |
F-box protein 28 |
| chr6_+_46761118 | 0.34 |
ENST00000230588.4 |
MEP1A |
meprin A, alpha (PABA peptide hydrolase) |
| chr15_+_81071684 | 0.34 |
ENST00000220244.3 ENST00000394685.3 ENST00000356249.5 |
KIAA1199 |
KIAA1199 |
Gene Ontology Analysis
Gene overrepresentation in cellular_component category:
| Log-likelihood per target | Total log-likelihood | Term | Description |
|---|---|---|---|
| 0.6 | 28.2 | GO:0045095 | keratin filament(GO:0045095) |
| 0.6 | 4.6 | GO:0005610 | laminin-5 complex(GO:0005610) |
| 0.4 | 1.3 | GO:0043512 | inhibin complex(GO:0043511) inhibin A complex(GO:0043512) |
| 0.4 | 20.9 | GO:0001533 | cornified envelope(GO:0001533) |
| 0.4 | 2.0 | GO:0036128 | CatSper complex(GO:0036128) |
| 0.4 | 1.5 | GO:1990745 | EARP complex(GO:1990745) |
| 0.3 | 2.1 | GO:1990357 | terminal web(GO:1990357) |
| 0.3 | 2.7 | GO:0035976 | AP1 complex(GO:0035976) |
| 0.3 | 2.3 | GO:0070522 | nucleotide-excision repair factor 1 complex(GO:0000110) ERCC4-ERCC1 complex(GO:0070522) |
| 0.3 | 2.0 | GO:0001939 | female pronucleus(GO:0001939) |
| 0.3 | 1.6 | GO:0097129 | cyclin D2-CDK4 complex(GO:0097129) |
| 0.3 | 1.1 | GO:0070288 | intracellular ferritin complex(GO:0008043) ferritin complex(GO:0070288) |
| 0.3 | 4.8 | GO:0097386 | glial cell projection(GO:0097386) |
| 0.2 | 0.7 | GO:0005674 | transcription factor TFIIF complex(GO:0005674) |
| 0.2 | 16.8 | GO:0005882 | intermediate filament(GO:0005882) |
| 0.2 | 1.2 | GO:1990037 | Lewy body core(GO:1990037) |
| 0.2 | 2.4 | GO:0097470 | ribbon synapse(GO:0097470) |
| 0.2 | 3.9 | GO:0031233 | intrinsic component of external side of plasma membrane(GO:0031233) |
| 0.2 | 6.6 | GO:0009925 | basal plasma membrane(GO:0009925) |
| 0.2 | 4.4 | GO:0071682 | endocytic vesicle lumen(GO:0071682) |
| 0.2 | 12.8 | GO:0035580 | specific granule lumen(GO:0035580) |
| 0.1 | 7.6 | GO:0045111 | intermediate filament cytoskeleton(GO:0045111) |
| 0.1 | 4.3 | GO:0031092 | platelet alpha granule membrane(GO:0031092) |
| 0.1 | 1.5 | GO:0035686 | sperm fibrous sheath(GO:0035686) |
| 0.1 | 0.3 | GO:0005588 | collagen type V trimer(GO:0005588) |
| 0.1 | 1.5 | GO:0030478 | actin cap(GO:0030478) |
| 0.1 | 7.6 | GO:0005604 | basement membrane(GO:0005604) |
| 0.1 | 0.5 | GO:0030057 | desmosome(GO:0030057) paranodal junction(GO:0033010) |
| 0.1 | 3.2 | GO:0002102 | podosome(GO:0002102) |
| 0.1 | 0.5 | GO:0005916 | fascia adherens(GO:0005916) |
| 0.1 | 1.5 | GO:0031527 | filopodium membrane(GO:0031527) |
| 0.0 | 1.3 | GO:0090533 | cation-transporting ATPase complex(GO:0090533) |
| 0.0 | 2.5 | GO:0031430 | M band(GO:0031430) |
| 0.0 | 0.4 | GO:0042382 | paraspeckles(GO:0042382) |
| 0.0 | 0.3 | GO:0043196 | varicosity(GO:0043196) |
| 0.0 | 5.6 | GO:0042470 | melanosome(GO:0042470) pigment granule(GO:0048770) |
| 0.0 | 6.7 | GO:0031901 | early endosome membrane(GO:0031901) |
| 0.0 | 33.1 | GO:0048471 | perinuclear region of cytoplasm(GO:0048471) |
| 0.0 | 1.2 | GO:0034364 | high-density lipoprotein particle(GO:0034364) |
| 0.0 | 0.5 | GO:0001673 | male germ cell nucleus(GO:0001673) |
| 0.0 | 0.5 | GO:0036038 | MKS complex(GO:0036038) |
| 0.0 | 1.2 | GO:0097546 | ciliary base(GO:0097546) |
| 0.0 | 0.3 | GO:1904724 | tertiary granule lumen(GO:1904724) |
| 0.0 | 0.2 | GO:0043020 | NADPH oxidase complex(GO:0043020) |
| 0.0 | 0.4 | GO:0097225 | sperm midpiece(GO:0097225) |
| 0.0 | 0.9 | GO:0001650 | fibrillar center(GO:0001650) |
| 0.0 | 0.3 | GO:0097136 | Bcl-2 family protein complex(GO:0097136) |
| 0.0 | 1.2 | GO:0005637 | nuclear inner membrane(GO:0005637) |
| 0.0 | 5.5 | GO:0005788 | endoplasmic reticulum lumen(GO:0005788) |
| 0.0 | 0.5 | GO:0005921 | gap junction(GO:0005921) |
| 0.0 | 0.2 | GO:0098563 | integral component of synaptic vesicle membrane(GO:0030285) intrinsic component of synaptic vesicle membrane(GO:0098563) |
| 0.0 | 0.1 | GO:0034098 | VCP-NPL4-UFD1 AAA ATPase complex(GO:0034098) |
| 0.0 | 0.4 | GO:0014704 | intercalated disc(GO:0014704) |
| 0.0 | 0.7 | GO:0005791 | rough endoplasmic reticulum(GO:0005791) |
| 0.0 | 0.1 | GO:0005853 | eukaryotic translation elongation factor 1 complex(GO:0005853) |
| 0.0 | 0.3 | GO:0000786 | nucleosome(GO:0000786) |
| 0.0 | 6.7 | GO:0005925 | focal adhesion(GO:0005925) |
| 0.0 | 1.1 | GO:0005814 | centriole(GO:0005814) |
| 0.0 | 0.5 | GO:0005865 | striated muscle thin filament(GO:0005865) |
| 0.0 | 0.5 | GO:0005801 | cis-Golgi network(GO:0005801) |
| 0.0 | 0.5 | GO:0005901 | caveola(GO:0005901) |
Gene overrepresentation in C2:CP category:
| Log-likelihood per target | Total log-likelihood | Term | Description |
|---|---|---|---|
| 0.5 | 16.1 | PID TOLL ENDOGENOUS PATHWAY | Endogenous TLR signaling |
| 0.3 | 8.2 | PID WNT SIGNALING PATHWAY | Wnt signaling network |
| 0.2 | 4.6 | PID INTEGRIN4 PATHWAY | Alpha6 beta4 integrin-ligand interactions |
| 0.1 | 2.7 | PID TCR RAS PATHWAY | Ras signaling in the CD4+ TCR pathway |
| 0.1 | 3.1 | PID FRA PATHWAY | Validated transcriptional targets of AP1 family members Fra1 and Fra2 |
| 0.1 | 5.5 | PID A6B1 A6B4 INTEGRIN PATHWAY | a6b1 and a6b4 Integrin signaling |
| 0.1 | 6.4 | PID TAP63 PATHWAY | Validated transcriptional targets of TAp63 isoforms |
| 0.1 | 1.8 | PID ERB GENOMIC PATHWAY | Validated nuclear estrogen receptor beta network |
| 0.1 | 3.0 | PID ALK1 PATHWAY | ALK1 signaling events |
| 0.1 | 2.2 | PID INTEGRIN5 PATHWAY | Beta5 beta6 beta7 and beta8 integrin cell surface interactions |
| 0.1 | 2.2 | PID HDAC CLASSIII PATHWAY | Signaling events mediated by HDAC Class III |
| 0.1 | 15.4 | NABA ECM REGULATORS | Genes encoding enzymes and their regulators involved in the remodeling of the extracellular matrix |
| 0.1 | 4.4 | PID NFAT TFPATHWAY | Calcineurin-regulated NFAT-dependent transcription in lymphocytes |
| 0.1 | 2.8 | PID IL23 PATHWAY | IL23-mediated signaling events |
| 0.1 | 5.3 | WNT SIGNALING | Genes related to Wnt-mediated signal transduction |
| 0.1 | 2.8 | PID FOXO PATHWAY | FoxO family signaling |
| 0.1 | 1.5 | PID AVB3 OPN PATHWAY | Osteopontin-mediated events |
| 0.1 | 1.5 | PID NETRIN PATHWAY | Netrin-mediated signaling events |
| 0.1 | 2.0 | PID HIF2PATHWAY | HIF-2-alpha transcription factor network |
| 0.0 | 1.9 | PID IL1 PATHWAY | IL1-mediated signaling events |
| 0.0 | 2.3 | PID EPHB FWD PATHWAY | EPHB forward signaling |
| 0.0 | 0.4 | PID P38 MKK3 6PATHWAY | p38 MAPK signaling pathway |
| 0.0 | 0.3 | ST TYPE I INTERFERON PATHWAY | Type I Interferon (alpha/beta IFN) Pathway |
| 0.0 | 1.7 | PID ECADHERIN STABILIZATION PATHWAY | Stabilization and expansion of the E-cadherin adherens junction |
| 0.0 | 1.4 | PID RHOA PATHWAY | RhoA signaling pathway |
| 0.0 | 0.3 | SA G1 AND S PHASES | Cdk2, 4, and 6 bind cyclin D in G1, while cdk2/cyclin E promotes the G1/S transition. |
| 0.0 | 0.5 | PID ECADHERIN NASCENT AJ PATHWAY | E-cadherin signaling in the nascent adherens junction |
| 0.0 | 1.3 | PID RAC1 PATHWAY | RAC1 signaling pathway |
| 0.0 | 1.1 | PID HES HEY PATHWAY | Notch-mediated HES/HEY network |
| 0.0 | 0.2 | PID SYNDECAN 1 PATHWAY | Syndecan-1-mediated signaling events |
| 0.0 | 1.6 | PID REG GR PATHWAY | Glucocorticoid receptor regulatory network |
| 0.0 | 0.6 | PID P38 MK2 PATHWAY | p38 signaling mediated by MAPKAP kinases |
| 0.0 | 0.7 | PID CD8 TCR DOWNSTREAM PATHWAY | Downstream signaling in naïve CD8+ T cells |
| 0.0 | 1.3 | PID CASPASE PATHWAY | Caspase cascade in apoptosis |
| 0.0 | 0.5 | PID INTEGRIN2 PATHWAY | Beta2 integrin cell surface interactions |
| 0.0 | 0.6 | PID CDC42 REG PATHWAY | Regulation of CDC42 activity |
| 0.0 | 1.2 | PID MYC REPRESS PATHWAY | Validated targets of C-MYC transcriptional repression |
| 0.0 | 0.5 | ST B CELL ANTIGEN RECEPTOR | B Cell Antigen Receptor |
| 0.0 | 0.2 | ST GAQ PATHWAY | G alpha q Pathway |
Gene overrepresentation in biological_process category:
| Log-likelihood per target | Total log-likelihood | Term | Description |
|---|---|---|---|
| 2.5 | 7.4 | GO:0009996 | negative regulation of Wnt signaling pathway involved in heart development(GO:0003308) negative regulation of cell fate specification(GO:0009996) Wnt signaling pathway involved in somitogenesis(GO:0090244) |
| 1.8 | 5.3 | GO:0035606 | peptidyl-cysteine S-trans-nitrosylation(GO:0035606) |
| 1.7 | 10.4 | GO:0055064 | chloride ion homeostasis(GO:0055064) |
| 1.3 | 3.9 | GO:0002541 | activation of plasma proteins involved in acute inflammatory response(GO:0002541) |
| 1.2 | 33.7 | GO:0071294 | cellular response to zinc ion(GO:0071294) |
| 1.1 | 4.6 | GO:0006542 | glutamine biosynthetic process(GO:0006542) |
| 1.1 | 5.7 | GO:0060356 | leucine import(GO:0060356) |
| 1.1 | 3.3 | GO:0018153 | isopeptide cross-linking via N6-(L-isoglutamyl)-L-lysine(GO:0018153) isopeptide cross-linking(GO:0018262) |
| 1.0 | 6.0 | GO:0032119 | sequestering of zinc ion(GO:0032119) |
| 0.9 | 0.9 | GO:0045168 | cell-cell signaling involved in cell fate commitment(GO:0045168) |
| 0.8 | 6.5 | GO:0090191 | negative regulation of branching involved in ureteric bud morphogenesis(GO:0090191) |
| 0.7 | 2.0 | GO:0005988 | lactose metabolic process(GO:0005988) lactose biosynthetic process(GO:0005989) |
| 0.6 | 1.9 | GO:0016095 | polyprenol catabolic process(GO:0016095) |
| 0.6 | 3.1 | GO:0015688 | iron chelate transport(GO:0015688) siderophore transport(GO:0015891) |
| 0.6 | 1.8 | GO:0001798 | positive regulation of type IIa hypersensitivity(GO:0001798) positive regulation of type II hypersensitivity(GO:0002894) |
| 0.6 | 2.3 | GO:0070426 | positive regulation of nucleotide-binding oligomerization domain containing signaling pathway(GO:0070426) positive regulation of nucleotide-binding oligomerization domain containing 2 signaling pathway(GO:0070434) |
| 0.6 | 2.8 | GO:0055011 | atrial cardiac muscle cell differentiation(GO:0055011) atrial cardiac muscle cell development(GO:0055014) |
| 0.5 | 0.5 | GO:0086073 | cardiac muscle cell-cardiac muscle cell adhesion(GO:0086042) bundle of His cell-Purkinje myocyte adhesion involved in cell communication(GO:0086073) |
| 0.5 | 1.6 | GO:0010621 | negative regulation of transcription by transcription factor localization(GO:0010621) |
| 0.5 | 62.0 | GO:0070268 | cornification(GO:0070268) |
| 0.5 | 2.9 | GO:0038172 | interleukin-33-mediated signaling pathway(GO:0038172) |
| 0.5 | 1.5 | GO:0007439 | ectodermal digestive tract development(GO:0007439) embryonic ectodermal digestive tract development(GO:0048611) |
| 0.5 | 2.3 | GO:0003278 | apoptotic process involved in heart morphogenesis(GO:0003278) |
| 0.4 | 1.3 | GO:0060279 | negative regulation of B cell differentiation(GO:0045578) regulation of ovulation(GO:0060278) positive regulation of ovulation(GO:0060279) |
| 0.4 | 0.4 | GO:0043163 | cell envelope organization(GO:0043163) external encapsulating structure organization(GO:0045229) |
| 0.4 | 1.3 | GO:0086092 | regulation of the force of heart contraction by cardiac conduction(GO:0086092) |
| 0.4 | 1.7 | GO:0035425 | autocrine signaling(GO:0035425) |
| 0.4 | 2.1 | GO:1902896 | terminal web assembly(GO:1902896) |
| 0.4 | 0.8 | GO:0051097 | negative regulation of helicase activity(GO:0051097) |
| 0.4 | 5.7 | GO:0001542 | ovulation from ovarian follicle(GO:0001542) |
| 0.4 | 2.8 | GO:0070294 | renal sodium ion absorption(GO:0070294) |
| 0.4 | 1.6 | GO:1900245 | positive regulation of MDA-5 signaling pathway(GO:1900245) |
| 0.4 | 4.4 | GO:0009414 | response to water deprivation(GO:0009414) |
| 0.4 | 1.2 | GO:0061394 | regulation of transcription from RNA polymerase II promoter in response to arsenic-containing substance(GO:0061394) response to manganese-induced endoplasmic reticulum stress(GO:1990737) |
| 0.4 | 6.1 | GO:0060712 | spongiotrophoblast layer development(GO:0060712) |
| 0.4 | 2.3 | GO:0000720 | pyrimidine dimer repair by nucleotide-excision repair(GO:0000720) positive regulation of t-circle formation(GO:1904431) |
| 0.3 | 2.7 | GO:0001661 | conditioned taste aversion(GO:0001661) |
| 0.3 | 1.6 | GO:0070295 | renal water absorption(GO:0070295) |
| 0.3 | 1.5 | GO:0044858 | plasma membrane raft distribution(GO:0044855) plasma membrane raft localization(GO:0044856) plasma membrane raft polarization(GO:0044858) regulation of plasma membrane raft polarization(GO:1903906) |
| 0.3 | 0.8 | GO:0006597 | spermine biosynthetic process(GO:0006597) |
| 0.3 | 2.4 | GO:0048386 | positive regulation of retinoic acid receptor signaling pathway(GO:0048386) |
| 0.3 | 0.3 | GO:0060259 | positive regulation of behavior(GO:0048520) regulation of feeding behavior(GO:0060259) positive regulation of feeding behavior(GO:2000253) |
| 0.2 | 3.3 | GO:0090084 | negative regulation of inclusion body assembly(GO:0090084) |
| 0.2 | 1.1 | GO:1905232 | cellular response to L-glutamate(GO:1905232) |
| 0.2 | 3.0 | GO:0061000 | negative regulation of dendritic spine development(GO:0061000) |
| 0.2 | 0.4 | GO:1900155 | regulation of bone trabecula formation(GO:1900154) negative regulation of bone trabecula formation(GO:1900155) |
| 0.2 | 2.6 | GO:0070307 | lens fiber cell development(GO:0070307) |
| 0.2 | 4.6 | GO:0031581 | hemidesmosome assembly(GO:0031581) |
| 0.2 | 0.5 | GO:0060474 | positive regulation of sperm motility involved in capacitation(GO:0060474) |
| 0.2 | 0.8 | GO:2000510 | positive regulation of dendritic cell chemotaxis(GO:2000510) |
| 0.2 | 0.5 | GO:1990168 | protein K33-linked deubiquitination(GO:1990168) |
| 0.2 | 0.3 | GO:2000542 | negative regulation of gastrulation(GO:2000542) |
| 0.2 | 0.6 | GO:1903788 | mycotoxin catabolic process(GO:0043387) aflatoxin catabolic process(GO:0046223) organic heteropentacyclic compound catabolic process(GO:1901377) regulation of glutathione biosynthetic process(GO:1903786) positive regulation of glutathione biosynthetic process(GO:1903788) |
| 0.2 | 3.2 | GO:0003334 | keratinocyte development(GO:0003334) |
| 0.2 | 1.1 | GO:0006880 | intracellular sequestering of iron ion(GO:0006880) sequestering of iron ion(GO:0097577) |
| 0.1 | 0.6 | GO:0099640 | axo-dendritic protein transport(GO:0099640) |
| 0.1 | 4.1 | GO:0090023 | positive regulation of neutrophil chemotaxis(GO:0090023) |
| 0.1 | 0.3 | GO:0036466 | synaptic vesicle recycling via endosome(GO:0036466) |
| 0.1 | 0.8 | GO:0038031 | non-canonical Wnt signaling pathway via JNK cascade(GO:0038031) |
| 0.1 | 4.5 | GO:0050716 | positive regulation of interleukin-1 secretion(GO:0050716) |
| 0.1 | 0.5 | GO:0042710 | biofilm formation(GO:0042710) single-species biofilm formation(GO:0044010) single-species biofilm formation in or on host organism(GO:0044407) regulation of single-species biofilm formation(GO:1900190) negative regulation of single-species biofilm formation(GO:1900191) regulation of single-species biofilm formation in or on host organism(GO:1900228) negative regulation of single-species biofilm formation in or on host organism(GO:1900229) |
| 0.1 | 0.7 | GO:1904627 | response to phorbol 13-acetate 12-myristate(GO:1904627) cellular response to phorbol 13-acetate 12-myristate(GO:1904628) |
| 0.1 | 0.4 | GO:0060729 | intestinal epithelial structure maintenance(GO:0060729) |
| 0.1 | 0.5 | GO:0070384 | Harderian gland development(GO:0070384) |
| 0.1 | 0.5 | GO:0051142 | regulation of NK T cell proliferation(GO:0051140) positive regulation of NK T cell proliferation(GO:0051142) |
| 0.1 | 4.8 | GO:0019731 | antibacterial humoral response(GO:0019731) |
| 0.1 | 0.7 | GO:0042866 | pyruvate biosynthetic process(GO:0042866) |
| 0.1 | 0.5 | GO:0001992 | regulation of systemic arterial blood pressure by vasopressin(GO:0001992) |
| 0.1 | 1.2 | GO:0050774 | negative regulation of dendrite morphogenesis(GO:0050774) |
| 0.1 | 0.3 | GO:0051461 | positive regulation of corticotropin secretion(GO:0051461) |
| 0.1 | 0.3 | GO:2000969 | positive regulation of alpha-amino-3-hydroxy-5-methyl-4-isoxazole propionate selective glutamate receptor activity(GO:2000969) |
| 0.1 | 0.3 | GO:0002725 | negative regulation of T cell cytokine production(GO:0002725) |
| 0.1 | 2.2 | GO:0001829 | trophectodermal cell differentiation(GO:0001829) |
| 0.1 | 0.4 | GO:0046878 | positive regulation of saliva secretion(GO:0046878) |
| 0.1 | 0.6 | GO:1902957 | negative regulation of mitochondrial electron transport, NADH to ubiquinone(GO:1902957) |
| 0.1 | 0.7 | GO:0070857 | regulation of bile acid biosynthetic process(GO:0070857) |
| 0.1 | 0.5 | GO:0045103 | intermediate filament-based process(GO:0045103) |
| 0.1 | 1.5 | GO:0003351 | epithelial cilium movement(GO:0003351) |
| 0.1 | 0.2 | GO:0045471 | response to ethanol(GO:0045471) |
| 0.1 | 0.2 | GO:2000857 | positive regulation of mineralocorticoid secretion(GO:2000857) positive regulation of aldosterone secretion(GO:2000860) |
| 0.1 | 0.5 | GO:1903760 | regulation of voltage-gated potassium channel activity involved in ventricular cardiac muscle cell action potential repolarization(GO:1903760) |
| 0.1 | 0.2 | GO:1904438 | antigen processing and presentation of peptide antigen via MHC class Ib(GO:0002428) positive regulation of iron ion transport(GO:0034758) positive regulation of iron ion transmembrane transport(GO:0034761) regulation of iron ion import(GO:1900390) regulation of ferrous iron import into cell(GO:1903989) positive regulation of ferrous iron import into cell(GO:1903991) regulation of ferrous iron binding(GO:1904432) positive regulation of ferrous iron binding(GO:1904434) regulation of transferrin receptor binding(GO:1904435) positive regulation of transferrin receptor binding(GO:1904437) regulation of ferrous iron import across plasma membrane(GO:1904438) positive regulation of ferrous iron import across plasma membrane(GO:1904440) |
| 0.1 | 0.5 | GO:2000389 | regulation of neutrophil extravasation(GO:2000389) |
| 0.1 | 0.3 | GO:2000503 | positive regulation of natural killer cell chemotaxis(GO:2000503) |
| 0.1 | 2.4 | GO:0032332 | positive regulation of chondrocyte differentiation(GO:0032332) |
| 0.1 | 0.4 | GO:0033089 | positive regulation of T cell differentiation in thymus(GO:0033089) positive regulation of thymocyte aggregation(GO:2000400) |
| 0.1 | 0.2 | GO:0006566 | threonine metabolic process(GO:0006566) |
| 0.1 | 0.7 | GO:0048672 | positive regulation of collateral sprouting(GO:0048672) |
| 0.1 | 0.2 | GO:2000705 | dense core granule biogenesis(GO:0061110) positive regulation of relaxation of cardiac muscle(GO:1901899) regulation of dense core granule biogenesis(GO:2000705) |
| 0.1 | 2.1 | GO:0060325 | face morphogenesis(GO:0060325) |
| 0.1 | 0.4 | GO:0071494 | cellular response to UV-C(GO:0071494) |
| 0.1 | 0.2 | GO:0045112 | integrin biosynthetic process(GO:0045112) regulation of integrin biosynthetic process(GO:0045113) positive regulation of integrin biosynthetic process(GO:0045726) |
| 0.1 | 0.2 | GO:0070213 | protein auto-ADP-ribosylation(GO:0070213) |
| 0.1 | 0.3 | GO:0039663 | fusion of virus membrane with host plasma membrane(GO:0019064) membrane fusion involved in viral entry into host cell(GO:0039663) multi-organism membrane fusion(GO:0044800) |
| 0.1 | 0.2 | GO:0051037 | histone displacement(GO:0001207) regulation of transcription involved in meiotic cell cycle(GO:0051037) positive regulation of transcription involved in meiotic cell cycle(GO:0051039) |
| 0.1 | 0.5 | GO:0090022 | myeloid progenitor cell differentiation(GO:0002318) regulation of neutrophil chemotaxis(GO:0090022) |
| 0.1 | 0.2 | GO:0014016 | neuroblast differentiation(GO:0014016) |
| 0.1 | 0.2 | GO:0044027 | hypermethylation of CpG island(GO:0044027) |
| 0.1 | 1.1 | GO:0032012 | regulation of ARF protein signal transduction(GO:0032012) |
| 0.1 | 0.7 | GO:0006703 | estrogen biosynthetic process(GO:0006703) |
| 0.1 | 0.7 | GO:0032968 | positive regulation of transcription elongation from RNA polymerase II promoter(GO:0032968) |
| 0.1 | 0.5 | GO:0060083 | smooth muscle contraction involved in micturition(GO:0060083) |
| 0.0 | 1.6 | GO:0007616 | long-term memory(GO:0007616) |
| 0.0 | 0.3 | GO:0033133 | fructose 2,6-bisphosphate metabolic process(GO:0006003) positive regulation of glucokinase activity(GO:0033133) positive regulation of hexokinase activity(GO:1903301) |
| 0.0 | 0.3 | GO:1903378 | positive regulation of oxidative stress-induced neuron intrinsic apoptotic signaling pathway(GO:1903378) |
| 0.0 | 0.3 | GO:0051384 | response to glucocorticoid(GO:0051384) |
| 0.0 | 0.7 | GO:0033141 | positive regulation of peptidyl-serine phosphorylation of STAT protein(GO:0033141) |
| 0.0 | 0.5 | GO:0035269 | protein O-linked mannosylation(GO:0035269) |
| 0.0 | 0.1 | GO:0002881 | negative regulation of chronic inflammatory response to non-antigenic stimulus(GO:0002881) |
| 0.0 | 0.4 | GO:0032755 | positive regulation of interleukin-6 production(GO:0032755) |
| 0.0 | 0.4 | GO:0035414 | negative regulation of catenin import into nucleus(GO:0035414) |
| 0.0 | 0.5 | GO:0051639 | actin filament network formation(GO:0051639) |
| 0.0 | 0.3 | GO:0035457 | cellular response to interferon-alpha(GO:0035457) |
| 0.0 | 1.2 | GO:1901685 | glutathione derivative metabolic process(GO:1901685) glutathione derivative biosynthetic process(GO:1901687) |
| 0.0 | 0.1 | GO:0032627 | interleukin-23 production(GO:0032627) regulation of interleukin-23 production(GO:0032667) positive regulation of interleukin-23 production(GO:0032747) |
| 0.0 | 0.4 | GO:0042754 | negative regulation of circadian rhythm(GO:0042754) |
| 0.0 | 0.2 | GO:0036414 | protein citrullination(GO:0018101) histone citrullination(GO:0036414) |
| 0.0 | 0.1 | GO:0060437 | lung growth(GO:0060437) |
| 0.0 | 0.3 | GO:0014067 | negative regulation of phosphatidylinositol 3-kinase signaling(GO:0014067) |
| 0.0 | 0.3 | GO:0043031 | negative regulation of macrophage activation(GO:0043031) |
| 0.0 | 1.5 | GO:0051489 | regulation of filopodium assembly(GO:0051489) |
| 0.0 | 5.4 | GO:0043542 | endothelial cell migration(GO:0043542) |
| 0.0 | 0.1 | GO:0015670 | carbon dioxide transport(GO:0015670) |
| 0.0 | 0.1 | GO:0007468 | regulation of rhodopsin gene expression(GO:0007468) |
| 0.0 | 0.2 | GO:0046689 | response to mercury ion(GO:0046689) |
| 0.0 | 0.2 | GO:0042905 | 9-cis-retinoic acid biosynthetic process(GO:0042904) 9-cis-retinoic acid metabolic process(GO:0042905) |
| 0.0 | 0.1 | GO:0032097 | positive regulation of response to food(GO:0032097) positive regulation of appetite(GO:0032100) |
| 0.0 | 0.6 | GO:0008285 | negative regulation of cell proliferation(GO:0008285) |
| 0.0 | 1.6 | GO:0006342 | chromatin silencing(GO:0006342) |
| 0.0 | 0.4 | GO:0032897 | negative regulation of viral transcription(GO:0032897) |
| 0.0 | 0.7 | GO:0032091 | negative regulation of protein binding(GO:0032091) |
| 0.0 | 0.1 | GO:0010735 | positive regulation of transcription via serum response element binding(GO:0010735) |
| 0.0 | 0.4 | GO:0007095 | mitotic G2 DNA damage checkpoint(GO:0007095) |
| 0.0 | 0.1 | GO:0039536 | negative regulation of RIG-I signaling pathway(GO:0039536) |
| 0.0 | 0.7 | GO:0000413 | protein peptidyl-prolyl isomerization(GO:0000413) |
| 0.0 | 0.1 | GO:0097647 | calcitonin family receptor signaling pathway(GO:0097646) amylin receptor signaling pathway(GO:0097647) |
| 0.0 | 0.1 | GO:0006600 | creatine metabolic process(GO:0006600) |
| 0.0 | 0.9 | GO:0030574 | collagen catabolic process(GO:0030574) |
| 0.0 | 0.3 | GO:0015813 | L-glutamate transport(GO:0015813) |
| 0.0 | 0.3 | GO:0035162 | embryonic hemopoiesis(GO:0035162) |
| 0.0 | 0.7 | GO:0030101 | natural killer cell activation(GO:0030101) |
| 0.0 | 0.0 | GO:0036022 | limb joint morphogenesis(GO:0036022) embryonic skeletal limb joint morphogenesis(GO:0036023) |
| 0.0 | 0.1 | GO:0015812 | gamma-aminobutyric acid transport(GO:0015812) |
Gene overrepresentation in molecular_function category:
| Log-likelihood per target | Total log-likelihood | Term | Description |
|---|---|---|---|
| 3.8 | 11.5 | GO:0035662 | Toll-like receptor 4 binding(GO:0035662) |
| 1.5 | 7.3 | GO:0042289 | MHC class II protein binding(GO:0042289) |
| 1.1 | 4.6 | GO:0016880 | glutamate-ammonia ligase activity(GO:0004356) ammonia ligase activity(GO:0016211) acid-ammonia (or amide) ligase activity(GO:0016880) |
| 0.7 | 7.4 | GO:0039706 | co-receptor binding(GO:0039706) |
| 0.7 | 2.0 | GO:0033300 | dehydroascorbic acid transporter activity(GO:0033300) |
| 0.6 | 10.8 | GO:0004089 | carbonate dehydratase activity(GO:0004089) |
| 0.6 | 5.7 | GO:0005432 | calcium:sodium antiporter activity(GO:0005432) |
| 0.5 | 2.9 | GO:0002114 | interleukin-33 receptor activity(GO:0002114) |
| 0.5 | 1.9 | GO:0047718 | enone reductase activity(GO:0035671) androsterone dehydrogenase activity(GO:0047023) indanol dehydrogenase activity(GO:0047718) |
| 0.4 | 1.3 | GO:0070699 | type II activin receptor binding(GO:0070699) |
| 0.4 | 1.6 | GO:0015254 | glycerol channel activity(GO:0015254) |
| 0.4 | 0.7 | GO:0047006 | 17-alpha,20-alpha-dihydroxypregn-4-en-3-one dehydrogenase activity(GO:0047006) |
| 0.3 | 2.4 | GO:0016618 | hydroxypyruvate reductase activity(GO:0016618) glyoxylate reductase (NADP) activity(GO:0030267) |
| 0.3 | 2.3 | GO:1990599 | 3' overhang single-stranded DNA endodeoxyribonuclease activity(GO:1990599) |
| 0.3 | 4.6 | GO:0045236 | CXCR chemokine receptor binding(GO:0045236) |
| 0.3 | 3.3 | GO:0043008 | ATP-dependent protein binding(GO:0043008) |
| 0.3 | 1.9 | GO:0070492 | oligosaccharide binding(GO:0070492) |
| 0.3 | 3.6 | GO:0030280 | structural constituent of epidermis(GO:0030280) |
| 0.2 | 2.0 | GO:0016724 | ferroxidase activity(GO:0004322) oxidoreductase activity, oxidizing metal ions, oxygen as acceptor(GO:0016724) |
| 0.2 | 1.3 | GO:1990254 | keratin filament binding(GO:1990254) |
| 0.2 | 2.3 | GO:0055131 | C3HC4-type RING finger domain binding(GO:0055131) |
| 0.2 | 1.0 | GO:0031726 | CCR1 chemokine receptor binding(GO:0031726) |
| 0.2 | 0.6 | GO:0008426 | protein kinase C inhibitor activity(GO:0008426) |
| 0.2 | 1.5 | GO:0060002 | plus-end directed microfilament motor activity(GO:0060002) |
| 0.2 | 0.7 | GO:0004743 | pyruvate kinase activity(GO:0004743) |
| 0.2 | 0.5 | GO:0031731 | CCR6 chemokine receptor binding(GO:0031731) |
| 0.2 | 0.5 | GO:1904455 | ubiquitin-specific protease activity involved in negative regulation of ERAD pathway(GO:1904455) |
| 0.1 | 1.3 | GO:0015386 | sodium:proton antiporter activity(GO:0015385) potassium:proton antiporter activity(GO:0015386) |
| 0.1 | 5.0 | GO:0042056 | chemoattractant activity(GO:0042056) |
| 0.1 | 1.5 | GO:0045159 | myosin II binding(GO:0045159) |
| 0.1 | 1.4 | GO:0050786 | RAGE receptor binding(GO:0050786) |
| 0.1 | 2.8 | GO:0051371 | muscle alpha-actinin binding(GO:0051371) |
| 0.1 | 2.8 | GO:0017081 | chloride channel regulator activity(GO:0017081) |
| 0.1 | 18.9 | GO:0005200 | structural constituent of cytoskeleton(GO:0005200) |
| 0.1 | 0.3 | GO:0035033 | histone deacetylase regulator activity(GO:0035033) |
| 0.1 | 0.3 | GO:0010861 | thyroid hormone receptor activator activity(GO:0010861) thyroid hormone receptor coactivator activity(GO:0030375) |
| 0.1 | 13.4 | GO:0002020 | protease binding(GO:0002020) |
| 0.1 | 0.5 | GO:0086083 | cell adhesive protein binding involved in bundle of His cell-Purkinje myocyte communication(GO:0086083) |
| 0.1 | 1.6 | GO:0070628 | proteasome binding(GO:0070628) |
| 0.1 | 1.1 | GO:0008093 | cytoskeletal adaptor activity(GO:0008093) |
| 0.1 | 0.4 | GO:0070097 | delta-catenin binding(GO:0070097) |
| 0.1 | 2.7 | GO:0005520 | insulin-like growth factor binding(GO:0005520) |
| 0.1 | 0.2 | GO:0004022 | alcohol dehydrogenase (NAD) activity(GO:0004022) |
| 0.1 | 1.0 | GO:0005132 | type I interferon receptor binding(GO:0005132) |
| 0.1 | 0.5 | GO:0060072 | large conductance calcium-activated potassium channel activity(GO:0060072) |
| 0.1 | 0.4 | GO:0017159 | pantetheine hydrolase activity(GO:0017159) |
| 0.1 | 1.2 | GO:0043522 | leucine zipper domain binding(GO:0043522) |
| 0.1 | 0.4 | GO:0003810 | protein-glutamine gamma-glutamyltransferase activity(GO:0003810) |
| 0.1 | 6.9 | GO:0004222 | metalloendopeptidase activity(GO:0004222) |
| 0.1 | 0.5 | GO:0005000 | vasopressin receptor activity(GO:0005000) |
| 0.1 | 3.5 | GO:0001102 | RNA polymerase II activating transcription factor binding(GO:0001102) |
| 0.1 | 0.5 | GO:0005143 | interleukin-12 receptor binding(GO:0005143) |
| 0.1 | 0.2 | GO:0008508 | bile acid:sodium symporter activity(GO:0008508) |
| 0.1 | 0.3 | GO:0004995 | tachykinin receptor activity(GO:0004995) |
| 0.1 | 0.8 | GO:0035259 | glucocorticoid receptor binding(GO:0035259) |
| 0.0 | 0.5 | GO:0097016 | L27 domain binding(GO:0097016) |
| 0.0 | 4.0 | GO:0004867 | serine-type endopeptidase inhibitor activity(GO:0004867) |
| 0.0 | 0.8 | GO:0042813 | Wnt-activated receptor activity(GO:0042813) |
| 0.0 | 0.7 | GO:0016918 | retinal binding(GO:0016918) |
| 0.0 | 0.3 | GO:0004331 | 6-phosphofructo-2-kinase activity(GO:0003873) fructose-2,6-bisphosphate 2-phosphatase activity(GO:0004331) |
| 0.0 | 0.7 | GO:0035925 | mRNA 3'-UTR AU-rich region binding(GO:0035925) |
| 0.0 | 3.2 | GO:0050681 | androgen receptor binding(GO:0050681) |
| 0.0 | 1.3 | GO:0005109 | frizzled binding(GO:0005109) |
| 0.0 | 10.3 | GO:0030674 | protein binding, bridging(GO:0030674) |
| 0.0 | 0.5 | GO:0004017 | adenylate kinase activity(GO:0004017) |
| 0.0 | 0.2 | GO:0030060 | L-malate dehydrogenase activity(GO:0030060) |
| 0.0 | 0.2 | GO:0003990 | acetylcholinesterase activity(GO:0003990) |
| 0.0 | 0.1 | GO:0016495 | C-X3-C chemokine receptor activity(GO:0016495) |
| 0.0 | 1.1 | GO:0005086 | ARF guanyl-nucleotide exchange factor activity(GO:0005086) |
| 0.0 | 1.3 | GO:0001671 | ATPase activator activity(GO:0001671) |
| 0.0 | 0.3 | GO:0051434 | BH3 domain binding(GO:0051434) |
| 0.0 | 0.1 | GO:0034191 | apolipoprotein A-I receptor binding(GO:0034191) |
| 0.0 | 0.2 | GO:0004032 | alditol:NADP+ 1-oxidoreductase activity(GO:0004032) |
| 0.0 | 0.6 | GO:0005149 | interleukin-1 receptor binding(GO:0005149) |
| 0.0 | 28.3 | GO:0008270 | zinc ion binding(GO:0008270) |
| 0.0 | 0.2 | GO:0004668 | protein-arginine deiminase activity(GO:0004668) |
| 0.0 | 0.3 | GO:0051400 | BH domain binding(GO:0051400) |
| 0.0 | 2.3 | GO:0019003 | GDP binding(GO:0019003) |
| 0.0 | 0.2 | GO:0035374 | chondroitin sulfate binding(GO:0035374) |
| 0.0 | 0.2 | GO:0015252 | hydrogen ion channel activity(GO:0015252) |
| 0.0 | 0.2 | GO:0051525 | NFAT protein binding(GO:0051525) |
| 0.0 | 18.3 | GO:0005198 | structural molecule activity(GO:0005198) |
| 0.0 | 1.2 | GO:0004364 | glutathione transferase activity(GO:0004364) |
| 0.0 | 0.1 | GO:0008597 | calcium-dependent protein serine/threonine phosphatase regulator activity(GO:0008597) |
| 0.0 | 0.1 | GO:0015185 | gamma-aminobutyric acid:sodium symporter activity(GO:0005332) gamma-aminobutyric acid transmembrane transporter activity(GO:0015185) |
| 0.0 | 1.7 | GO:0004866 | endopeptidase inhibitor activity(GO:0004866) |
| 0.0 | 1.1 | GO:0016859 | cis-trans isomerase activity(GO:0016859) |
| 0.0 | 1.2 | GO:0004693 | cyclin-dependent protein serine/threonine kinase activity(GO:0004693) |
| 0.0 | 0.7 | GO:0008395 | steroid hydroxylase activity(GO:0008395) |
| 0.0 | 0.6 | GO:0004806 | triglyceride lipase activity(GO:0004806) |
| 0.0 | 0.1 | GO:0004461 | lactose synthase activity(GO:0004461) |
| 0.0 | 4.9 | GO:0003924 | GTPase activity(GO:0003924) |
| 0.0 | 0.3 | GO:0052629 | phosphatidylinositol-3,5-bisphosphate 3-phosphatase activity(GO:0052629) |
| 0.0 | 1.6 | GO:0003725 | double-stranded RNA binding(GO:0003725) |
| 0.0 | 1.5 | GO:0019905 | syntaxin binding(GO:0019905) |
| 0.0 | 2.0 | GO:0005178 | integrin binding(GO:0005178) |
| 0.0 | 0.2 | GO:0031957 | very long-chain fatty acid-CoA ligase activity(GO:0031957) |
| 0.0 | 0.5 | GO:0042826 | histone deacetylase binding(GO:0042826) |
| 0.0 | 0.1 | GO:0004111 | creatine kinase activity(GO:0004111) |
| 0.0 | 0.4 | GO:0003887 | DNA-directed DNA polymerase activity(GO:0003887) |
| 0.0 | 0.4 | GO:0004709 | MAP kinase kinase kinase activity(GO:0004709) |
| 0.0 | 1.5 | GO:0017124 | SH3 domain binding(GO:0017124) |
| 0.0 | 0.9 | GO:0051087 | chaperone binding(GO:0051087) |
| 0.0 | 0.4 | GO:0019894 | kinesin binding(GO:0019894) |
| 0.0 | 0.1 | GO:0055056 | D-glucose transmembrane transporter activity(GO:0055056) |
| 0.0 | 0.3 | GO:0070577 | lysine-acetylated histone binding(GO:0070577) |
Gene overrepresentation in C2:CP:REACTOME category:
| Log-likelihood per target | Total log-likelihood | Term | Description |
|---|---|---|---|
| 0.7 | 10.8 | REACTOME REVERSIBLE HYDRATION OF CARBON DIOXIDE | Genes involved in Reversible Hydration of Carbon Dioxide |
| 0.2 | 4.5 | REACTOME AMINO ACID SYNTHESIS AND INTERCONVERSION TRANSAMINATION | Genes involved in Amino acid synthesis and interconversion (transamination) |
| 0.2 | 4.6 | REACTOME RIP MEDIATED NFKB ACTIVATION VIA DAI | Genes involved in RIP-mediated NFkB activation via DAI |
| 0.1 | 2.0 | REACTOME ACTIVATION OF CHAPERONE GENES BY ATF6 ALPHA | Genes involved in Activation of Chaperone Genes by ATF6-alpha |
| 0.1 | 5.7 | REACTOME AMINO ACID TRANSPORT ACROSS THE PLASMA MEMBRANE | Genes involved in Amino acid transport across the plasma membrane |
| 0.1 | 2.7 | REACTOME ACTIVATION OF THE AP1 FAMILY OF TRANSCRIPTION FACTORS | Genes involved in Activation of the AP-1 family of transcription factors |
| 0.1 | 2.3 | REACTOME SEMA3A PLEXIN REPULSION SIGNALING BY INHIBITING INTEGRIN ADHESION | Genes involved in SEMA3A-Plexin repulsion signaling by inhibiting Integrin adhesion |
| 0.1 | 1.5 | REACTOME PASSIVE TRANSPORT BY AQUAPORINS | Genes involved in Passive Transport by Aquaporins |
| 0.1 | 4.0 | REACTOME FORMATION OF FIBRIN CLOT CLOTTING CASCADE | Genes involved in Formation of Fibrin Clot (Clotting Cascade) |
| 0.1 | 1.3 | REACTOME GLYCOPROTEIN HORMONES | Genes involved in Glycoprotein hormones |
| 0.1 | 1.8 | REACTOME INITIAL TRIGGERING OF COMPLEMENT | Genes involved in Initial triggering of complement |
| 0.1 | 2.8 | REACTOME CASPASE MEDIATED CLEAVAGE OF CYTOSKELETAL PROTEINS | Genes involved in Caspase-mediated cleavage of cytoskeletal proteins |
| 0.1 | 2.3 | REACTOME FORMATION OF INCISION COMPLEX IN GG NER | Genes involved in Formation of incision complex in GG-NER |
| 0.1 | 1.3 | REACTOME HYALURONAN UPTAKE AND DEGRADATION | Genes involved in Hyaluronan uptake and degradation |
| 0.1 | 0.3 | REACTOME BINDING AND ENTRY OF HIV VIRION | Genes involved in Binding and entry of HIV virion |
| 0.0 | 0.5 | REACTOME BETA DEFENSINS | Genes involved in Beta defensins |
| 0.0 | 2.6 | REACTOME CHEMOKINE RECEPTORS BIND CHEMOKINES | Genes involved in Chemokine receptors bind chemokines |
| 0.0 | 4.7 | REACTOME CELL JUNCTION ORGANIZATION | Genes involved in Cell junction organization |
| 0.0 | 1.9 | REACTOME IL1 SIGNALING | Genes involved in Interleukin-1 signaling |
| 0.0 | 1.2 | REACTOME GLUTATHIONE CONJUGATION | Genes involved in Glutathione conjugation |
| 0.0 | 0.8 | REACTOME METABOLISM OF POLYAMINES | Genes involved in Metabolism of polyamines |
| 0.0 | 1.4 | REACTOME REGULATION OF BETA CELL DEVELOPMENT | Genes involved in Regulation of beta-cell development |
| 0.0 | 0.7 | REACTOME SYNTHESIS OF BILE ACIDS AND BILE SALTS VIA 7ALPHA HYDROXYCHOLESTEROL | Genes involved in Synthesis of bile acids and bile salts via 7alpha-hydroxycholesterol |
| 0.0 | 1.0 | REACTOME REGULATION OF IFNA SIGNALING | Genes involved in Regulation of IFNA signaling |
| 0.0 | 3.9 | REACTOME RESPONSE TO ELEVATED PLATELET CYTOSOLIC CA2 | Genes involved in Response to elevated platelet cytosolic Ca2+ |
| 0.0 | 0.5 | REACTOME IONOTROPIC ACTIVITY OF KAINATE RECEPTORS | Genes involved in Ionotropic activity of Kainate Receptors |
| 0.0 | 0.6 | REACTOME G BETA GAMMA SIGNALLING THROUGH PLC BETA | Genes involved in G beta:gamma signalling through PLC beta |
| 0.0 | 1.5 | REACTOME NETRIN1 SIGNALING | Genes involved in Netrin-1 signaling |
| 0.0 | 0.5 | REACTOME FACILITATIVE NA INDEPENDENT GLUCOSE TRANSPORTERS | Genes involved in Facilitative Na+-independent glucose transporters |
| 0.0 | 0.2 | REACTOME ENDOSOMAL VACUOLAR PATHWAY | Genes involved in Endosomal/Vacuolar pathway |
| 0.0 | 0.5 | REACTOME CYCLIN A B1 ASSOCIATED EVENTS DURING G2 M TRANSITION | Genes involved in Cyclin A/B1 associated events during G2/M transition |
| 0.0 | 0.6 | REACTOME GABA A RECEPTOR ACTIVATION | Genes involved in GABA A receptor activation |
| 0.0 | 0.4 | REACTOME VIRAL MESSENGER RNA SYNTHESIS | Genes involved in Viral Messenger RNA Synthesis |
| 0.0 | 2.0 | REACTOME PPARA ACTIVATES GENE EXPRESSION | Genes involved in PPARA Activates Gene Expression |
| 0.0 | 0.5 | REACTOME SYNTHESIS AND INTERCONVERSION OF NUCLEOTIDE DI AND TRIPHOSPHATES | Genes involved in Synthesis and interconversion of nucleotide di- and triphosphates |
| 0.0 | 0.1 | REACTOME RECYCLING OF BILE ACIDS AND SALTS | Genes involved in Recycling of bile acids and salts |
| 0.0 | 0.4 | REACTOME DEGRADATION OF THE EXTRACELLULAR MATRIX | Genes involved in Degradation of the extracellular matrix |
| 0.0 | 1.1 | REACTOME GOLGI ASSOCIATED VESICLE BIOGENESIS | Genes involved in Golgi Associated Vesicle Biogenesis |
| 0.0 | 0.9 | REACTOME ACTIVATION OF CHAPERONE GENES BY XBP1S | Genes involved in Activation of Chaperone Genes by XBP1(S) |