Project
ENCODE cell lines, expression (Ernst 2011)
Navigation
Downloads
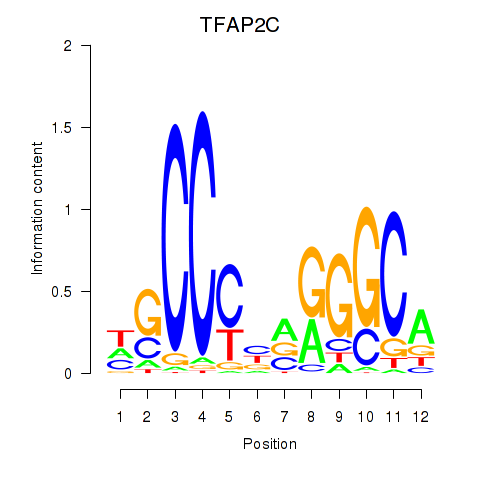
Results for TFAP2C
Z-value: 1.60
Motif logo
Transcription factors associated with TFAP2C
| Gene Symbol | Gene ID | Gene Info |
|---|---|---|
|
TFAP2C
|
ENSG00000087510.5 | TFAP2C |
Activity-expression correlation:
| Gene | Promoter | Pearson corr. coef. | P-value | Plot |
|---|---|---|---|---|
| TFAP2C | hg19_v2_chr20_+_55204351_55204377 | 0.82 | 1.0e-04 | Click! |
Activity profile of TFAP2C motif
Sorted Z-values of TFAP2C motif
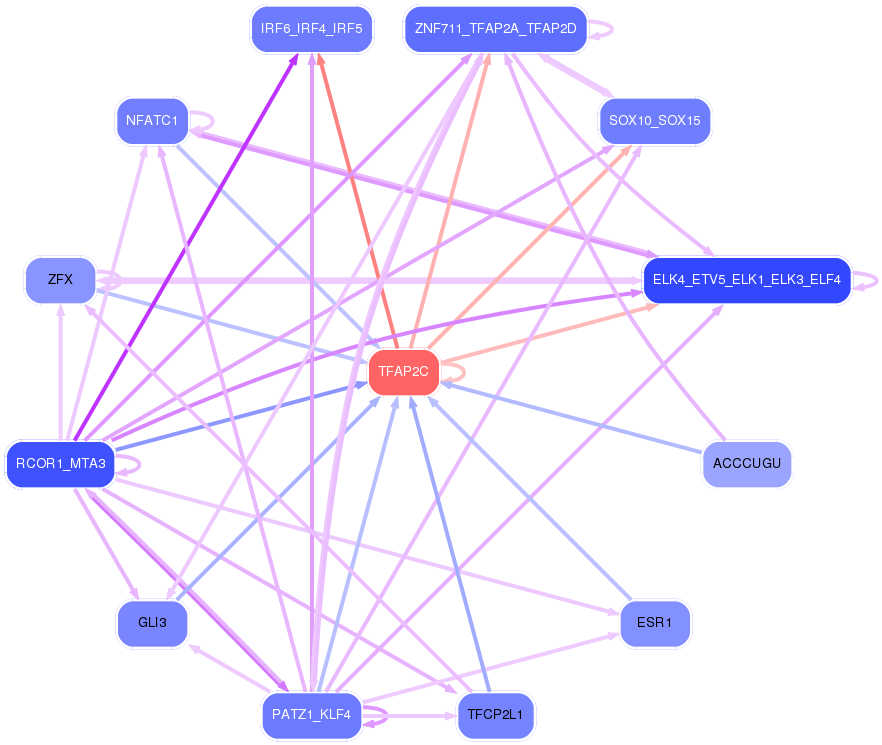
Network of associatons between targets according to the STRING database.

First level regulatory network of TFAP2C
| Promoter | Score | Transcript | Gene | Gene Info |
|---|---|---|---|---|
| chr19_-_39264072 | 3.92 |
ENST00000599035.1 ENST00000378626.4 |
LGALS7 |
lectin, galactoside-binding, soluble, 7 |
| chr19_+_39279838 | 3.76 |
ENST00000314980.4 |
LGALS7B |
lectin, galactoside-binding, soluble, 7B |
| chr12_-_28123206 | 2.99 |
ENST00000542963.1 ENST00000535992.1 |
PTHLH |
parathyroid hormone-like hormone |
| chr1_-_209979375 | 2.74 |
ENST00000367021.3 |
IRF6 |
interferon regulatory factor 6 |
| chr10_-_126849068 | 2.59 |
ENST00000494626.2 ENST00000337195.5 |
CTBP2 |
C-terminal binding protein 2 |
| chr18_+_21269404 | 2.51 |
ENST00000313654.9 |
LAMA3 |
laminin, alpha 3 |
| chr12_-_52887034 | 2.45 |
ENST00000330722.6 |
KRT6A |
keratin 6A |
| chr18_-_28622774 | 2.34 |
ENST00000434452.1 |
DSC3 |
desmocollin 3 |
| chr16_+_22825475 | 2.27 |
ENST00000261374.3 |
HS3ST2 |
heparan sulfate (glucosamine) 3-O-sulfotransferase 2 |
| chr10_+_124221036 | 2.26 |
ENST00000368984.3 |
HTRA1 |
HtrA serine peptidase 1 |
| chr19_-_51522955 | 2.14 |
ENST00000358789.3 |
KLK10 |
kallikrein-related peptidase 10 |
| chr14_-_67859422 | 2.09 |
ENST00000556532.1 |
PLEK2 |
pleckstrin 2 |
| chr15_+_101420028 | 2.09 |
ENST00000557963.1 ENST00000346623.6 |
ALDH1A3 |
aldehyde dehydrogenase 1 family, member A3 |
| chr12_+_6309517 | 2.00 |
ENST00000382519.4 ENST00000009180.4 |
CD9 |
CD9 molecule |
| chr10_+_88728189 | 2.00 |
ENST00000416348.1 |
ADIRF |
adipogenesis regulatory factor |
| chr12_+_6308881 | 1.99 |
ENST00000382518.1 ENST00000536586.1 |
CD9 |
CD9 molecule |
| chr18_-_28622699 | 1.94 |
ENST00000360428.4 |
DSC3 |
desmocollin 3 |
| chr10_-_126849588 | 1.89 |
ENST00000411419.2 |
CTBP2 |
C-terminal binding protein 2 |
| chr7_+_100464760 | 1.88 |
ENST00000200457.4 |
TRIP6 |
thyroid hormone receptor interactor 6 |
| chr1_-_209824643 | 1.84 |
ENST00000391911.1 ENST00000415782.1 |
LAMB3 |
laminin, beta 3 |
| chr2_-_235405168 | 1.72 |
ENST00000339728.3 |
ARL4C |
ADP-ribosylation factor-like 4C |
| chr11_+_35160709 | 1.72 |
ENST00000415148.2 ENST00000433354.2 ENST00000449691.2 ENST00000437706.2 ENST00000360158.4 ENST00000428726.2 ENST00000526669.2 ENST00000433892.2 ENST00000278386.6 ENST00000434472.2 ENST00000352818.4 ENST00000442151.2 |
CD44 |
CD44 molecule (Indian blood group) |
| chr19_+_35607166 | 1.67 |
ENST00000604255.1 ENST00000346446.5 ENST00000344013.6 ENST00000603449.1 ENST00000406988.1 ENST00000605550.1 ENST00000604804.1 ENST00000605552.1 |
FXYD3 |
FXYD domain containing ion transport regulator 3 |
| chr16_+_68679193 | 1.64 |
ENST00000581171.1 |
CDH3 |
cadherin 3, type 1, P-cadherin (placental) |
| chr9_+_115913222 | 1.62 |
ENST00000259392.3 |
SLC31A2 |
solute carrier family 31 (copper transporter), member 2 |
| chr22_-_37640277 | 1.59 |
ENST00000401529.3 ENST00000249071.6 |
RAC2 |
ras-related C3 botulinum toxin substrate 2 (rho family, small GTP binding protein Rac2) |
| chr20_-_56284816 | 1.57 |
ENST00000395819.3 ENST00000341744.3 |
PMEPA1 |
prostate transmembrane protein, androgen induced 1 |
| chr7_-_111846435 | 1.51 |
ENST00000437633.1 ENST00000428084.1 |
DOCK4 |
dedicator of cytokinesis 4 |
| chr8_+_54793454 | 1.49 |
ENST00000276500.4 |
RGS20 |
regulator of G-protein signaling 20 |
| chr17_-_39769005 | 1.49 |
ENST00000301653.4 ENST00000593067.1 |
KRT16 |
keratin 16 |
| chr19_+_8429031 | 1.49 |
ENST00000301455.2 ENST00000541807.1 ENST00000393962.2 |
ANGPTL4 |
angiopoietin-like 4 |
| chr19_-_45908292 | 1.46 |
ENST00000360957.5 ENST00000592134.1 |
PPP1R13L |
protein phosphatase 1, regulatory subunit 13 like |
| chr3_+_122044084 | 1.46 |
ENST00000264474.3 ENST00000479204.1 |
CSTA |
cystatin A (stefin A) |
| chr4_+_85504075 | 1.46 |
ENST00000295887.5 |
CDS1 |
CDP-diacylglycerol synthase (phosphatidate cytidylyltransferase) 1 |
| chr10_+_75670862 | 1.41 |
ENST00000446342.1 ENST00000372764.3 ENST00000372762.4 |
PLAU |
plasminogen activator, urokinase |
| chr10_+_47746929 | 1.40 |
ENST00000340243.6 ENST00000374277.5 ENST00000449464.2 ENST00000538825.1 ENST00000335083.5 |
ANXA8L2 AL603965.1 |
annexin A8-like 2 Protein LOC100996760 |
| chr1_+_44401479 | 1.40 |
ENST00000438616.3 |
ARTN |
artemin |
| chr7_+_116165038 | 1.39 |
ENST00000393470.1 |
CAV1 |
caveolin 1, caveolae protein, 22kDa |
| chr19_-_43969796 | 1.38 |
ENST00000244333.3 |
LYPD3 |
LY6/PLAUR domain containing 3 |
| chr17_-_39928106 | 1.37 |
ENST00000540235.1 |
JUP |
junction plakoglobin |
| chr15_-_83953466 | 1.35 |
ENST00000345382.2 |
BNC1 |
basonuclin 1 |
| chr11_-_6341844 | 1.34 |
ENST00000303927.3 |
PRKCDBP |
protein kinase C, delta binding protein |
| chr15_+_41136586 | 1.32 |
ENST00000431806.1 |
SPINT1 |
serine peptidase inhibitor, Kunitz type 1 |
| chr19_-_51487071 | 1.32 |
ENST00000391807.1 ENST00000593904.1 |
KLK7 |
kallikrein-related peptidase 7 |
| chr11_-_6341724 | 1.30 |
ENST00000530979.1 |
PRKCDBP |
protein kinase C, delta binding protein |
| chr17_+_15848231 | 1.30 |
ENST00000304222.2 |
ADORA2B |
adenosine A2b receptor |
| chr7_+_16793160 | 1.29 |
ENST00000262067.4 |
TSPAN13 |
tetraspanin 13 |
| chr4_+_4388805 | 1.28 |
ENST00000504171.1 |
NSG1 |
Homo sapiens neuron specific gene family member 1 (NSG1), transcript variant 3, mRNA. |
| chr1_-_153363452 | 1.28 |
ENST00000368732.1 ENST00000368733.3 |
S100A8 |
S100 calcium binding protein A8 |
| chr14_-_105635090 | 1.28 |
ENST00000331782.3 ENST00000347004.2 |
JAG2 |
jagged 2 |
| chr15_+_92396920 | 1.27 |
ENST00000318445.6 |
SLCO3A1 |
solute carrier organic anion transporter family, member 3A1 |
| chr2_-_235405679 | 1.27 |
ENST00000390645.2 |
ARL4C |
ADP-ribosylation factor-like 4C |
| chr5_+_52285144 | 1.24 |
ENST00000296585.5 |
ITGA2 |
integrin, alpha 2 (CD49B, alpha 2 subunit of VLA-2 receptor) |
| chr1_+_19970797 | 1.24 |
ENST00000548815.1 |
NBL1 |
neuroblastoma 1, DAN family BMP antagonist |
| chr4_+_89299994 | 1.24 |
ENST00000264346.7 |
HERC6 |
HECT and RLD domain containing E3 ubiquitin protein ligase family member 6 |
| chr8_+_54793425 | 1.23 |
ENST00000522225.1 |
RGS20 |
regulator of G-protein signaling 20 |
| chr4_+_89299885 | 1.23 |
ENST00000380265.5 ENST00000273960.3 |
HERC6 |
HECT and RLD domain containing E3 ubiquitin protein ligase family member 6 |
| chr22_-_37915247 | 1.23 |
ENST00000251973.5 |
CARD10 |
caspase recruitment domain family, member 10 |
| chr16_-_11680791 | 1.22 |
ENST00000571976.1 ENST00000413364.2 |
LITAF |
lipopolysaccharide-induced TNF factor |
| chr19_-_51487282 | 1.21 |
ENST00000595820.1 ENST00000597707.1 ENST00000336317.4 |
KLK7 |
kallikrein-related peptidase 7 |
| chr17_-_39677971 | 1.21 |
ENST00000393976.2 |
KRT15 |
keratin 15 |
| chr9_-_112083229 | 1.20 |
ENST00000374566.3 ENST00000374557.4 |
EPB41L4B |
erythrocyte membrane protein band 4.1 like 4B |
| chr20_-_10654639 | 1.20 |
ENST00000254958.5 |
JAG1 |
jagged 1 |
| chr14_+_73704201 | 1.19 |
ENST00000340738.5 ENST00000427855.1 ENST00000381166.3 |
PAPLN |
papilin, proteoglycan-like sulfated glycoprotein |
| chr19_+_35645817 | 1.18 |
ENST00000423817.3 |
FXYD5 |
FXYD domain containing ion transport regulator 5 |
| chr3_-_185542817 | 1.18 |
ENST00000382199.2 |
IGF2BP2 |
insulin-like growth factor 2 mRNA binding protein 2 |
| chr11_-_87908600 | 1.17 |
ENST00000531138.1 ENST00000526372.1 ENST00000243662.6 |
RAB38 |
RAB38, member RAS oncogene family |
| chr1_-_151965048 | 1.15 |
ENST00000368809.1 |
S100A10 |
S100 calcium binding protein A10 |
| chr18_-_28681950 | 1.15 |
ENST00000251081.6 |
DSC2 |
desmocollin 2 |
| chr8_+_94929077 | 1.14 |
ENST00000297598.4 ENST00000520614.1 |
PDP1 |
pyruvate dehyrogenase phosphatase catalytic subunit 1 |
| chr11_+_67071050 | 1.12 |
ENST00000376757.5 |
SSH3 |
slingshot protein phosphatase 3 |
| chr3_-_185542761 | 1.11 |
ENST00000457616.2 ENST00000346192.3 |
IGF2BP2 |
insulin-like growth factor 2 mRNA binding protein 2 |
| chr19_+_38755042 | 1.09 |
ENST00000301244.7 |
SPINT2 |
serine peptidase inhibitor, Kunitz type, 2 |
| chr8_-_110703819 | 1.07 |
ENST00000532779.1 ENST00000534578.1 |
SYBU |
syntabulin (syntaxin-interacting) |
| chr5_-_57756087 | 1.06 |
ENST00000274289.3 |
PLK2 |
polo-like kinase 2 |
| chr1_-_68299130 | 1.05 |
ENST00000370982.3 |
GNG12 |
guanine nucleotide binding protein (G protein), gamma 12 |
| chr1_-_95007193 | 1.05 |
ENST00000370207.4 ENST00000334047.7 |
F3 |
coagulation factor III (thromboplastin, tissue factor) |
| chr19_-_51456198 | 1.04 |
ENST00000594846.1 |
KLK5 |
kallikrein-related peptidase 5 |
| chr11_+_67070919 | 1.04 |
ENST00000308127.4 ENST00000308298.7 |
SSH3 |
slingshot protein phosphatase 3 |
| chr12_+_53491220 | 1.04 |
ENST00000548547.1 ENST00000301464.3 |
IGFBP6 |
insulin-like growth factor binding protein 6 |
| chr19_-_51456321 | 1.03 |
ENST00000391809.2 |
KLK5 |
kallikrein-related peptidase 5 |
| chr19_-_51512804 | 1.02 |
ENST00000594211.1 ENST00000376832.4 |
KLK9 |
kallikrein-related peptidase 9 |
| chr5_+_76114758 | 1.02 |
ENST00000514165.1 ENST00000296677.4 |
F2RL1 |
coagulation factor II (thrombin) receptor-like 1 |
| chr22_-_37915535 | 1.01 |
ENST00000403299.1 |
CARD10 |
caspase recruitment domain family, member 10 |
| chr19_-_51456344 | 1.00 |
ENST00000336334.3 ENST00000593428.1 |
KLK5 |
kallikrein-related peptidase 5 |
| chr2_+_64681219 | 1.00 |
ENST00000238875.5 |
LGALSL |
lectin, galactoside-binding-like |
| chr11_-_2950642 | 1.00 |
ENST00000314222.4 |
PHLDA2 |
pleckstrin homology-like domain, family A, member 2 |
| chr18_+_29077990 | 0.99 |
ENST00000261590.8 |
DSG2 |
desmoglein 2 |
| chr6_-_10419871 | 0.99 |
ENST00000319516.4 |
TFAP2A |
transcription factor AP-2 alpha (activating enhancer binding protein 2 alpha) |
| chr10_-_126694575 | 0.99 |
ENST00000334808.6 |
CTBP2 |
C-terminal binding protein 2 |
| chr3_-_49941042 | 0.98 |
ENST00000344206.4 ENST00000296474.3 |
MST1R |
macrophage stimulating 1 receptor (c-met-related tyrosine kinase) |
| chr17_-_7493390 | 0.97 |
ENST00000538513.2 ENST00000570788.1 ENST00000250055.2 |
SOX15 |
SRY (sex determining region Y)-box 15 |
| chr3_-_48632593 | 0.97 |
ENST00000454817.1 ENST00000328333.8 |
COL7A1 |
collagen, type VII, alpha 1 |
| chr14_+_20937538 | 0.97 |
ENST00000361505.5 ENST00000553591.1 |
PNP |
purine nucleoside phosphorylase |
| chr20_-_56285595 | 0.96 |
ENST00000395816.3 ENST00000347215.4 |
PMEPA1 |
prostate transmembrane protein, androgen induced 1 |
| chr2_+_64681103 | 0.96 |
ENST00000464281.1 |
LGALSL |
lectin, galactoside-binding-like |
| chr4_+_30721968 | 0.96 |
ENST00000361762.2 |
PCDH7 |
protocadherin 7 |
| chr8_+_94929110 | 0.96 |
ENST00000520728.1 |
PDP1 |
pyruvate dehyrogenase phosphatase catalytic subunit 1 |
| chr10_+_54074033 | 0.95 |
ENST00000373970.3 |
DKK1 |
dickkopf WNT signaling pathway inhibitor 1 |
| chr17_+_48609903 | 0.95 |
ENST00000268933.3 |
EPN3 |
epsin 3 |
| chr8_+_86376081 | 0.95 |
ENST00000285379.5 |
CA2 |
carbonic anhydrase II |
| chr14_-_74960030 | 0.95 |
ENST00000553490.1 ENST00000557510.1 |
NPC2 |
Niemann-Pick disease, type C2 |
| chr10_+_17271266 | 0.95 |
ENST00000224237.5 |
VIM |
vimentin |
| chr16_-_68269971 | 0.93 |
ENST00000565858.1 |
ESRP2 |
epithelial splicing regulatory protein 2 |
| chr8_-_110704014 | 0.92 |
ENST00000529190.1 ENST00000422135.1 ENST00000419099.1 |
SYBU |
syntabulin (syntaxin-interacting) |
| chr5_-_168727786 | 0.92 |
ENST00000332966.8 |
SLIT3 |
slit homolog 3 (Drosophila) |
| chr13_+_110959598 | 0.92 |
ENST00000360467.5 |
COL4A2 |
collagen, type IV, alpha 2 |
| chr8_+_32405728 | 0.91 |
ENST00000523079.1 ENST00000338921.4 ENST00000356819.4 ENST00000287845.5 ENST00000341377.5 |
NRG1 |
neuregulin 1 |
| chr16_-_11681316 | 0.89 |
ENST00000571688.1 |
LITAF |
lipopolysaccharide-induced TNF factor |
| chr4_-_56502426 | 0.89 |
ENST00000505262.1 ENST00000507338.1 |
NMU |
neuromedin U |
| chr17_-_74582191 | 0.89 |
ENST00000225276.5 |
ST6GALNAC2 |
ST6 (alpha-N-acetyl-neuraminyl-2,3-beta-galactosyl-1,3)-N-acetylgalactosaminide alpha-2,6-sialyltransferase 2 |
| chr2_-_224903995 | 0.88 |
ENST00000409304.1 ENST00000454956.1 ENST00000258405.4 |
SERPINE2 |
serpin peptidase inhibitor, clade E (nexin, plasminogen activator inhibitor type 1), member 2 |
| chr1_+_19970657 | 0.87 |
ENST00000375136.3 |
NBL1 |
neuroblastoma 1, DAN family BMP antagonist |
| chr22_-_37640456 | 0.86 |
ENST00000405484.1 ENST00000441619.1 ENST00000406508.1 |
RAC2 |
ras-related C3 botulinum toxin substrate 2 (rho family, small GTP binding protein Rac2) |
| chr2_-_1748214 | 0.86 |
ENST00000433670.1 ENST00000425171.1 ENST00000252804.4 |
PXDN |
peroxidasin homolog (Drosophila) |
| chr12_-_51785182 | 0.86 |
ENST00000356317.3 ENST00000603188.1 ENST00000604847.1 ENST00000604506.1 |
GALNT6 |
UDP-N-acetyl-alpha-D-galactosamine:polypeptide N-acetylgalactosaminyltransferase 6 (GalNAc-T6) |
| chr20_+_6748311 | 0.86 |
ENST00000378827.4 |
BMP2 |
bone morphogenetic protein 2 |
| chr13_-_107187462 | 0.85 |
ENST00000245323.4 |
EFNB2 |
ephrin-B2 |
| chr10_+_105726862 | 0.85 |
ENST00000335753.4 ENST00000369755.3 |
SLK |
STE20-like kinase |
| chr11_-_118134997 | 0.85 |
ENST00000278937.2 |
MPZL2 |
myelin protein zero-like 2 |
| chr16_-_4588469 | 0.85 |
ENST00000588381.1 ENST00000563332.2 |
CDIP1 |
cell death-inducing p53 target 1 |
| chr2_+_234601512 | 0.83 |
ENST00000305139.6 |
UGT1A6 |
UDP glucuronosyltransferase 1 family, polypeptide A6 |
| chr16_-_4987065 | 0.83 |
ENST00000590782.2 ENST00000345988.2 |
PPL |
periplakin |
| chr4_-_56502451 | 0.83 |
ENST00000511469.1 ENST00000264218.3 |
NMU |
neuromedin U |
| chr6_-_136871957 | 0.83 |
ENST00000354570.3 |
MAP7 |
microtubule-associated protein 7 |
| chr17_+_73717516 | 0.82 |
ENST00000200181.3 ENST00000339591.3 |
ITGB4 |
integrin, beta 4 |
| chr1_+_155100342 | 0.82 |
ENST00000368406.2 |
EFNA1 |
ephrin-A1 |
| chr19_+_35645618 | 0.81 |
ENST00000392218.2 ENST00000543307.1 ENST00000392219.2 ENST00000541435.2 ENST00000590686.1 ENST00000342879.3 ENST00000588699.1 |
FXYD5 |
FXYD domain containing ion transport regulator 5 |
| chr3_-_69062764 | 0.79 |
ENST00000295571.5 |
EOGT |
EGF domain-specific O-linked N-acetylglucosamine (GlcNAc) transferase |
| chr2_+_64681641 | 0.78 |
ENST00000409537.2 |
LGALSL |
lectin, galactoside-binding-like |
| chr16_+_56642489 | 0.77 |
ENST00000561491.1 |
MT2A |
metallothionein 2A |
| chr5_+_72921983 | 0.77 |
ENST00000296794.6 ENST00000545377.1 ENST00000513042.2 ENST00000287898.5 ENST00000509848.1 |
ARHGEF28 |
Rho guanine nucleotide exchange factor (GEF) 28 |
| chr1_-_152009460 | 0.76 |
ENST00000271638.2 |
S100A11 |
S100 calcium binding protein A11 |
| chr3_-_127541679 | 0.76 |
ENST00000265052.5 |
MGLL |
monoglyceride lipase |
| chr1_+_152956549 | 0.75 |
ENST00000307122.2 |
SPRR1A |
small proline-rich protein 1A |
| chr1_-_11714700 | 0.75 |
ENST00000354287.4 |
FBXO2 |
F-box protein 2 |
| chr6_+_30851840 | 0.74 |
ENST00000511510.1 ENST00000376569.3 ENST00000376575.3 ENST00000376570.4 ENST00000446312.1 ENST00000504927.1 |
DDR1 |
discoidin domain receptor tyrosine kinase 1 |
| chr16_-_11681023 | 0.73 |
ENST00000570904.1 ENST00000574701.1 |
LITAF |
lipopolysaccharide-induced TNF factor |
| chr5_-_175843569 | 0.73 |
ENST00000310418.4 ENST00000345807.2 |
CLTB |
clathrin, light chain B |
| chr12_+_27485889 | 0.72 |
ENST00000311001.5 ENST00000261178.5 ENST00000266503.5 |
ARNTL2 |
aryl hydrocarbon receptor nuclear translocator-like 2 |
| chr11_+_20385231 | 0.72 |
ENST00000530266.1 ENST00000421577.2 ENST00000443524.2 ENST00000419348.2 |
HTATIP2 |
HIV-1 Tat interactive protein 2, 30kDa |
| chr1_-_94703118 | 0.72 |
ENST00000260526.6 ENST00000370217.3 |
ARHGAP29 |
Rho GTPase activating protein 29 |
| chr19_+_41725088 | 0.72 |
ENST00000301178.4 |
AXL |
AXL receptor tyrosine kinase |
| chr8_-_145013711 | 0.71 |
ENST00000345136.3 |
PLEC |
plectin |
| chr17_+_7942335 | 0.71 |
ENST00000380183.4 ENST00000572022.1 ENST00000380173.2 |
ALOX15B |
arachidonate 15-lipoxygenase, type B |
| chr7_+_155090271 | 0.69 |
ENST00000476756.1 |
INSIG1 |
insulin induced gene 1 |
| chr2_+_234668894 | 0.68 |
ENST00000305208.5 ENST00000608383.1 ENST00000360418.3 |
UGT1A8 UGT1A1 |
UDP glucuronosyltransferase 1 family, polypeptide A1 UDP glucuronosyltransferase 1 family, polypeptide A8 |
| chr12_+_29302119 | 0.68 |
ENST00000536681.3 |
FAR2 |
fatty acyl CoA reductase 2 |
| chr6_+_125474992 | 0.68 |
ENST00000528193.1 |
TPD52L1 |
tumor protein D52-like 1 |
| chr17_+_74381343 | 0.68 |
ENST00000392496.3 |
SPHK1 |
sphingosine kinase 1 |
| chr11_-_79151695 | 0.68 |
ENST00000278550.7 |
TENM4 |
teneurin transmembrane protein 4 |
| chr12_+_57984965 | 0.68 |
ENST00000540759.2 ENST00000551772.1 ENST00000550465.1 ENST00000354947.5 |
PIP4K2C |
phosphatidylinositol-5-phosphate 4-kinase, type II, gamma |
| chr19_+_751122 | 0.68 |
ENST00000215582.6 |
MISP |
mitotic spindle positioning |
| chr20_-_18038521 | 0.67 |
ENST00000278780.6 |
OVOL2 |
ovo-like zinc finger 2 |
| chr3_+_50192537 | 0.67 |
ENST00000002829.3 |
SEMA3F |
sema domain, immunoglobulin domain (Ig), short basic domain, secreted, (semaphorin) 3F |
| chr3_-_69435428 | 0.67 |
ENST00000542259.1 |
FRMD4B |
FERM domain containing 4B |
| chr2_-_85637459 | 0.67 |
ENST00000409921.1 |
CAPG |
capping protein (actin filament), gelsolin-like |
| chr4_-_57522673 | 0.67 |
ENST00000381255.3 ENST00000317745.7 ENST00000555760.2 ENST00000556614.2 |
HOPX |
HOP homeobox |
| chr22_+_43547937 | 0.66 |
ENST00000329563.4 |
TSPO |
translocator protein (18kDa) |
| chr6_-_105627735 | 0.66 |
ENST00000254765.3 |
POPDC3 |
popeye domain containing 3 |
| chr3_+_50192499 | 0.66 |
ENST00000413852.1 |
SEMA3F |
sema domain, immunoglobulin domain (Ig), short basic domain, secreted, (semaphorin) 3F |
| chr12_+_19282643 | 0.66 |
ENST00000317589.4 ENST00000355397.3 ENST00000359180.3 ENST00000309364.4 ENST00000540972.1 ENST00000429027.2 |
PLEKHA5 |
pleckstrin homology domain containing, family A member 5 |
| chr14_-_74959994 | 0.66 |
ENST00000238633.2 ENST00000434013.2 |
NPC2 |
Niemann-Pick disease, type C2 |
| chr13_-_110959478 | 0.66 |
ENST00000543140.1 ENST00000375820.4 |
COL4A1 |
collagen, type IV, alpha 1 |
| chr15_+_45422131 | 0.66 |
ENST00000321429.4 |
DUOX1 |
dual oxidase 1 |
| chr10_+_6186847 | 0.66 |
ENST00000536985.1 ENST00000379789.4 |
PFKFB3 |
6-phosphofructo-2-kinase/fructose-2,6-biphosphatase 3 |
| chr12_+_19282713 | 0.65 |
ENST00000299275.6 ENST00000539256.1 ENST00000538714.1 |
PLEKHA5 |
pleckstrin homology domain containing, family A member 5 |
| chr6_+_33589161 | 0.65 |
ENST00000605930.1 |
ITPR3 |
inositol 1,4,5-trisphosphate receptor, type 3 |
| chr1_-_226111929 | 0.65 |
ENST00000343818.6 ENST00000432920.2 |
PYCR2 RP4-559A3.7 |
pyrroline-5-carboxylate reductase family, member 2 Uncharacterized protein |
| chr1_-_117210290 | 0.65 |
ENST00000369483.1 ENST00000369486.3 |
IGSF3 |
immunoglobulin superfamily, member 3 |
| chr12_+_96588143 | 0.65 |
ENST00000228741.3 ENST00000547249.1 |
ELK3 |
ELK3, ETS-domain protein (SRF accessory protein 2) |
| chr20_+_25228669 | 0.65 |
ENST00000216962.4 |
PYGB |
phosphorylase, glycogen; brain |
| chr4_-_57522598 | 0.64 |
ENST00000553379.2 |
HOPX |
HOP homeobox |
| chr14_-_69445968 | 0.64 |
ENST00000438964.2 |
ACTN1 |
actinin, alpha 1 |
| chr15_+_45422178 | 0.64 |
ENST00000389037.3 ENST00000558322.1 |
DUOX1 |
dual oxidase 1 |
| chr19_-_51523275 | 0.63 |
ENST00000309958.3 |
KLK10 |
kallikrein-related peptidase 10 |
| chr3_-_69435224 | 0.63 |
ENST00000398540.3 |
FRMD4B |
FERM domain containing 4B |
| chr19_-_51529849 | 0.63 |
ENST00000600362.1 ENST00000453757.3 ENST00000601671.1 |
KLK11 |
kallikrein-related peptidase 11 |
| chr6_-_56507586 | 0.63 |
ENST00000439203.1 ENST00000518935.1 ENST00000446842.2 ENST00000370765.6 ENST00000244364.6 |
DST |
dystonin |
| chr1_-_94374946 | 0.62 |
ENST00000370238.3 |
GCLM |
glutamate-cysteine ligase, modifier subunit |
| chr1_+_99127265 | 0.62 |
ENST00000306121.3 |
SNX7 |
sorting nexin 7 |
| chr10_+_124134201 | 0.62 |
ENST00000368990.3 ENST00000368988.1 ENST00000368989.2 ENST00000463663.2 |
PLEKHA1 |
pleckstrin homology domain containing, family A (phosphoinositide binding specific) member 1 |
| chr6_-_128841503 | 0.61 |
ENST00000368215.3 ENST00000532331.1 ENST00000368213.5 ENST00000368207.3 ENST00000525459.1 ENST00000368210.3 ENST00000368226.4 ENST00000368227.3 |
PTPRK |
protein tyrosine phosphatase, receptor type, K |
| chr14_-_74959978 | 0.61 |
ENST00000541064.1 |
NPC2 |
Niemann-Pick disease, type C2 |
| chr17_+_74372662 | 0.61 |
ENST00000591651.1 ENST00000545180.1 |
SPHK1 |
sphingosine kinase 1 |
| chr10_-_33625154 | 0.61 |
ENST00000265371.4 |
NRP1 |
neuropilin 1 |
| chr3_+_57994127 | 0.61 |
ENST00000490882.1 ENST00000295956.4 ENST00000358537.3 ENST00000429972.2 ENST00000348383.5 ENST00000357272.4 |
FLNB |
filamin B, beta |
| chr9_+_139553306 | 0.60 |
ENST00000371699.1 |
EGFL7 |
EGF-like-domain, multiple 7 |
| chr19_+_45281118 | 0.59 |
ENST00000270279.3 ENST00000341505.4 |
CBLC |
Cbl proto-oncogene C, E3 ubiquitin protein ligase |
| chr8_+_11666649 | 0.59 |
ENST00000528643.1 ENST00000525777.1 |
FDFT1 |
farnesyl-diphosphate farnesyltransferase 1 |
| chr1_+_2407754 | 0.58 |
ENST00000419816.2 ENST00000378486.3 ENST00000378488.3 ENST00000288766.5 |
PLCH2 |
phospholipase C, eta 2 |
| chr6_+_106959718 | 0.58 |
ENST00000369066.3 |
AIM1 |
absent in melanoma 1 |
| chr21_-_36260980 | 0.58 |
ENST00000344691.4 ENST00000358356.5 |
RUNX1 |
runt-related transcription factor 1 |
| chr6_+_125474795 | 0.58 |
ENST00000304877.13 ENST00000534000.1 ENST00000368402.5 ENST00000368388.2 |
TPD52L1 |
tumor protein D52-like 1 |
| chr3_-_12800751 | 0.58 |
ENST00000435218.2 ENST00000435575.1 |
TMEM40 |
transmembrane protein 40 |
| chr1_-_153599732 | 0.58 |
ENST00000392623.1 |
S100A13 |
S100 calcium binding protein A13 |
| chr11_+_66025167 | 0.58 |
ENST00000394067.2 ENST00000316924.5 ENST00000421552.1 ENST00000394078.1 |
KLC2 |
kinesin light chain 2 |
| chr11_+_72929319 | 0.58 |
ENST00000393597.2 ENST00000311131.2 |
P2RY2 |
purinergic receptor P2Y, G-protein coupled, 2 |
| chr6_+_30850697 | 0.57 |
ENST00000509639.1 ENST00000412274.2 ENST00000507901.1 ENST00000507046.1 ENST00000437124.2 ENST00000454612.2 ENST00000396342.2 |
DDR1 |
discoidin domain receptor tyrosine kinase 1 |
| chrX_+_153237740 | 0.57 |
ENST00000369982.4 |
TMEM187 |
transmembrane protein 187 |
Gene Ontology Analysis
Gene overrepresentation in molecular_function category:
| Log-likelihood per target | Total log-likelihood | Term | Description |
|---|---|---|---|
| 0.8 | 5.5 | GO:0016618 | hydroxypyruvate reductase activity(GO:0016618) glyoxylate reductase (NADP) activity(GO:0030267) |
| 0.5 | 2.1 | GO:0035651 | AP-3 adaptor complex binding(GO:0035651) |
| 0.5 | 3.1 | GO:0038064 | collagen receptor activity(GO:0038064) |
| 0.5 | 1.5 | GO:0004605 | phosphatidate cytidylyltransferase activity(GO:0004605) |
| 0.5 | 4.3 | GO:0086083 | cell adhesive protein binding involved in bundle of His cell-Purkinje myocyte communication(GO:0086083) |
| 0.5 | 1.4 | GO:0070320 | inward rectifier potassium channel inhibitor activity(GO:0070320) |
| 0.4 | 1.3 | GO:0035662 | Toll-like receptor 4 binding(GO:0035662) |
| 0.4 | 2.4 | GO:0008467 | [heparan sulfate]-glucosamine 3-sulfotransferase 1 activity(GO:0008467) |
| 0.4 | 1.5 | GO:0002060 | purine nucleobase binding(GO:0002060) |
| 0.3 | 2.1 | GO:0004741 | [pyruvate dehydrogenase (lipoamide)] phosphatase activity(GO:0004741) |
| 0.3 | 0.6 | GO:0008184 | glycogen phosphorylase activity(GO:0008184) |
| 0.3 | 2.2 | GO:0016015 | morphogen activity(GO:0016015) |
| 0.3 | 1.8 | GO:0017050 | sphinganine kinase activity(GO:0008481) D-erythro-sphingosine kinase activity(GO:0017050) |
| 0.3 | 0.9 | GO:0001665 | alpha-N-acetylgalactosaminide alpha-2,6-sialyltransferase activity(GO:0001665) |
| 0.3 | 0.8 | GO:0016262 | protein N-acetylglucosaminyltransferase activity(GO:0016262) |
| 0.3 | 2.5 | GO:0070324 | thyroid hormone binding(GO:0070324) |
| 0.2 | 0.7 | GO:0080019 | fatty-acyl-CoA reductase (alcohol-forming) activity(GO:0080019) |
| 0.2 | 1.4 | GO:1990254 | keratin filament binding(GO:1990254) |
| 0.2 | 1.4 | GO:0043236 | laminin binding(GO:0043236) |
| 0.2 | 0.6 | GO:0032422 | purine-rich negative regulatory element binding(GO:0032422) |
| 0.2 | 1.9 | GO:0048495 | Roundabout binding(GO:0048495) |
| 0.2 | 3.2 | GO:0045499 | chemorepellent activity(GO:0045499) |
| 0.2 | 0.6 | GO:0047273 | galactosylgalactosylglucosylceramide beta-D-acetylgalactosaminyltransferase activity(GO:0047273) |
| 0.2 | 0.6 | GO:0016309 | 1-phosphatidylinositol-5-phosphate 4-kinase activity(GO:0016309) |
| 0.2 | 1.1 | GO:0003873 | 6-phosphofructo-2-kinase activity(GO:0003873) fructose-2,6-bisphosphate 2-phosphatase activity(GO:0004331) |
| 0.2 | 0.7 | GO:0050473 | arachidonate 15-lipoxygenase activity(GO:0050473) |
| 0.2 | 1.2 | GO:0001609 | G-protein coupled adenosine receptor activity(GO:0001609) |
| 0.2 | 0.9 | GO:0005152 | interleukin-1 receptor antagonist activity(GO:0005152) |
| 0.2 | 0.5 | GO:0016899 | oxidoreductase activity, acting on the CH-OH group of donors, oxygen as acceptor(GO:0016899) |
| 0.2 | 0.7 | GO:0000822 | inositol hexakisphosphate binding(GO:0000822) |
| 0.2 | 1.5 | GO:0032051 | clathrin light chain binding(GO:0032051) |
| 0.2 | 0.6 | GO:0004735 | pyrroline-5-carboxylate reductase activity(GO:0004735) |
| 0.2 | 0.8 | GO:0046870 | cadmium ion binding(GO:0046870) |
| 0.2 | 0.8 | GO:0030023 | extracellular matrix constituent conferring elasticity(GO:0030023) |
| 0.2 | 1.8 | GO:0039706 | co-receptor binding(GO:0039706) |
| 0.2 | 1.0 | GO:0015057 | thrombin receptor activity(GO:0015057) |
| 0.1 | 0.4 | GO:0030158 | protein xylosyltransferase activity(GO:0030158) |
| 0.1 | 0.6 | GO:0004310 | farnesyl-diphosphate farnesyltransferase activity(GO:0004310) squalene synthase activity(GO:0051996) |
| 0.1 | 0.4 | GO:0042799 | histone methyltransferase activity (H4-K20 specific)(GO:0042799) |
| 0.1 | 3.0 | GO:0043325 | phosphatidylinositol-3,4-bisphosphate binding(GO:0043325) |
| 0.1 | 2.3 | GO:0005149 | interleukin-1 receptor binding(GO:0005149) |
| 0.1 | 1.4 | GO:0010314 | phosphatidylinositol-5-phosphate binding(GO:0010314) |
| 0.1 | 0.8 | GO:0070492 | oligosaccharide binding(GO:0070492) |
| 0.1 | 0.4 | GO:0003858 | 3-hydroxybutyrate dehydrogenase activity(GO:0003858) |
| 0.1 | 0.4 | GO:0008426 | protein kinase C inhibitor activity(GO:0008426) |
| 0.1 | 0.8 | GO:0019776 | Atg8 ligase activity(GO:0019776) |
| 0.1 | 0.7 | GO:0046979 | TAP2 binding(GO:0046979) |
| 0.1 | 0.6 | GO:0046912 | transferase activity, transferring acyl groups, acyl groups converted into alkyl on transfer(GO:0046912) |
| 0.1 | 0.5 | GO:0050509 | N-acetylglucosaminyl-proteoglycan 4-beta-glucuronosyltransferase activity(GO:0050509) |
| 0.1 | 0.4 | GO:0032093 | SAM domain binding(GO:0032093) |
| 0.1 | 2.5 | GO:0005112 | Notch binding(GO:0005112) |
| 0.1 | 1.0 | GO:0004064 | arylesterase activity(GO:0004064) |
| 0.1 | 1.2 | GO:0005375 | copper ion transmembrane transporter activity(GO:0005375) |
| 0.1 | 0.3 | GO:0070404 | NADH binding(GO:0070404) |
| 0.1 | 5.2 | GO:0050699 | WW domain binding(GO:0050699) |
| 0.1 | 4.1 | GO:0005520 | insulin-like growth factor binding(GO:0005520) |
| 0.1 | 0.8 | GO:1990599 | 3' overhang single-stranded DNA endodeoxyribonuclease activity(GO:1990599) |
| 0.1 | 1.5 | GO:0034713 | type I transforming growth factor beta receptor binding(GO:0034713) |
| 0.1 | 0.5 | GO:0004161 | dimethylallyltranstransferase activity(GO:0004161) geranyltranstransferase activity(GO:0004337) |
| 0.1 | 1.0 | GO:0035256 | G-protein coupled glutamate receptor binding(GO:0035256) |
| 0.1 | 0.7 | GO:0047134 | protein-disulfide reductase activity(GO:0047134) |
| 0.1 | 0.4 | GO:0015319 | sodium:inorganic phosphate symporter activity(GO:0015319) |
| 0.1 | 0.4 | GO:0005105 | type 1 fibroblast growth factor receptor binding(GO:0005105) |
| 0.1 | 0.3 | GO:0004802 | transketolase activity(GO:0004802) |
| 0.1 | 0.2 | GO:0034452 | dynactin binding(GO:0034452) |
| 0.1 | 0.4 | GO:0098639 | collagen binding involved in cell-matrix adhesion(GO:0098639) |
| 0.1 | 0.3 | GO:0004821 | histidine-tRNA ligase activity(GO:0004821) |
| 0.1 | 0.6 | GO:0045569 | TRAIL binding(GO:0045569) |
| 0.1 | 0.3 | GO:0055077 | gap junction hemi-channel activity(GO:0055077) |
| 0.1 | 1.2 | GO:0047372 | acylglycerol lipase activity(GO:0047372) |
| 0.1 | 0.4 | GO:0019828 | aspartic-type endopeptidase inhibitor activity(GO:0019828) |
| 0.1 | 1.0 | GO:0042301 | phosphate ion binding(GO:0042301) |
| 0.1 | 0.4 | GO:0015307 | drug:proton antiporter activity(GO:0015307) |
| 0.1 | 0.7 | GO:0015216 | adenine nucleotide transmembrane transporter activity(GO:0000295) purine ribonucleotide transmembrane transporter activity(GO:0005346) ATP transmembrane transporter activity(GO:0005347) purine nucleotide transmembrane transporter activity(GO:0015216) ADP transmembrane transporter activity(GO:0015217) |
| 0.1 | 1.3 | GO:0016174 | NAD(P)H oxidase activity(GO:0016174) |
| 0.1 | 0.7 | GO:0005497 | androgen binding(GO:0005497) |
| 0.1 | 0.2 | GO:0010698 | acetyltransferase activator activity(GO:0010698) |
| 0.1 | 0.1 | GO:0051185 | coenzyme transporter activity(GO:0051185) |
| 0.1 | 0.8 | GO:0036042 | long-chain fatty acyl-CoA binding(GO:0036042) |
| 0.1 | 0.6 | GO:0030229 | very-low-density lipoprotein particle receptor activity(GO:0030229) |
| 0.1 | 0.2 | GO:0004392 | heme oxygenase (decyclizing) activity(GO:0004392) |
| 0.1 | 2.2 | GO:0030159 | receptor signaling complex scaffold activity(GO:0030159) |
| 0.1 | 0.9 | GO:0043008 | ATP-dependent protein binding(GO:0043008) |
| 0.1 | 0.1 | GO:0047184 | 1-acylglycerophosphocholine O-acyltransferase activity(GO:0047184) |
| 0.1 | 0.5 | GO:0003960 | NADPH:quinone reductase activity(GO:0003960) |
| 0.1 | 1.7 | GO:0071855 | neuropeptide receptor binding(GO:0071855) |
| 0.1 | 2.2 | GO:0051428 | peptide hormone receptor binding(GO:0051428) |
| 0.1 | 2.5 | GO:0043014 | alpha-tubulin binding(GO:0043014) |
| 0.1 | 0.2 | GO:0004666 | prostaglandin-endoperoxide synthase activity(GO:0004666) |
| 0.1 | 0.4 | GO:0048018 | receptor agonist activity(GO:0048018) |
| 0.1 | 0.3 | GO:0022865 | transmembrane electron transfer carrier(GO:0022865) |
| 0.1 | 0.8 | GO:0008093 | cytoskeletal adaptor activity(GO:0008093) |
| 0.1 | 0.5 | GO:0004340 | glucokinase activity(GO:0004340) hexokinase activity(GO:0004396) fructokinase activity(GO:0008865) mannokinase activity(GO:0019158) |
| 0.1 | 1.2 | GO:0001608 | G-protein coupled nucleotide receptor activity(GO:0001608) G-protein coupled purinergic nucleotide receptor activity(GO:0045028) |
| 0.1 | 3.4 | GO:0019894 | kinesin binding(GO:0019894) |
| 0.1 | 0.7 | GO:0005451 | monovalent cation:proton antiporter activity(GO:0005451) sodium:proton antiporter activity(GO:0015385) potassium:proton antiporter activity(GO:0015386) |
| 0.1 | 0.2 | GO:0047325 | inositol tetrakisphosphate 1-kinase activity(GO:0047325) inositol tetrakisphosphate kinase activity(GO:0051765) inositol-1,3,4-trisphosphate 6-kinase activity(GO:0052725) inositol-1,3,4-trisphosphate 5-kinase activity(GO:0052726) inositol-1,3,4,5,6-pentakisphosphate 1-phosphatase activity(GO:0052825) inositol-1,3,4,6-tetrakisphosphate 6-phosphatase activity(GO:0052830) inositol-1,3,4,6-tetrakisphosphate 1-phosphatase activity(GO:0052831) inositol-3,4,6-trisphosphate 1-kinase activity(GO:0052835) |
| 0.1 | 0.5 | GO:0016842 | amidine-lyase activity(GO:0016842) |
| 0.1 | 0.2 | GO:0016215 | stearoyl-CoA 9-desaturase activity(GO:0004768) acyl-CoA desaturase activity(GO:0016215) |
| 0.1 | 0.9 | GO:0032036 | myosin heavy chain binding(GO:0032036) |
| 0.1 | 1.1 | GO:0050786 | RAGE receptor binding(GO:0050786) |
| 0.1 | 0.4 | GO:0035374 | chondroitin sulfate binding(GO:0035374) |
| 0.1 | 0.2 | GO:0015315 | hexose phosphate transmembrane transporter activity(GO:0015119) organophosphate:inorganic phosphate antiporter activity(GO:0015315) hexose-phosphate:inorganic phosphate antiporter activity(GO:0015526) glucose 6-phosphate:inorganic phosphate antiporter activity(GO:0061513) |
| 0.1 | 0.6 | GO:0045294 | alpha-catenin binding(GO:0045294) |
| 0.1 | 0.2 | GO:0070915 | lysophosphatidic acid receptor activity(GO:0070915) |
| 0.1 | 0.5 | GO:0038085 | vascular endothelial growth factor binding(GO:0038085) |
| 0.1 | 1.2 | GO:0044548 | S100 protein binding(GO:0044548) |
| 0.1 | 0.8 | GO:0030280 | structural constituent of epidermis(GO:0030280) |
| 0.1 | 0.4 | GO:0004351 | glutamate decarboxylase activity(GO:0004351) |
| 0.1 | 0.7 | GO:0017034 | Rap guanyl-nucleotide exchange factor activity(GO:0017034) |
| 0.1 | 0.6 | GO:0046972 | histone acetyltransferase activity (H4-K5 specific)(GO:0043995) histone acetyltransferase activity (H4-K8 specific)(GO:0043996) histone acetyltransferase activity (H4-K16 specific)(GO:0046972) |
| 0.1 | 0.4 | GO:0008379 | thioredoxin peroxidase activity(GO:0008379) |
| 0.1 | 0.7 | GO:0004653 | polypeptide N-acetylgalactosaminyltransferase activity(GO:0004653) |
| 0.1 | 5.7 | GO:0004867 | serine-type endopeptidase inhibitor activity(GO:0004867) |
| 0.1 | 1.6 | GO:0005540 | hyaluronic acid binding(GO:0005540) |
| 0.1 | 1.3 | GO:0017166 | vinculin binding(GO:0017166) |
| 0.1 | 0.2 | GO:0042731 | PH domain binding(GO:0042731) |
| 0.1 | 0.5 | GO:0015280 | ligand-gated sodium channel activity(GO:0015280) |
| 0.1 | 0.6 | GO:0019911 | structural constituent of myelin sheath(GO:0019911) |
| 0.1 | 2.8 | GO:0017080 | sodium channel regulator activity(GO:0017080) |
| 0.1 | 0.2 | GO:0004074 | biliverdin reductase activity(GO:0004074) |
| 0.1 | 0.3 | GO:0016286 | small conductance calcium-activated potassium channel activity(GO:0016286) |
| 0.1 | 0.4 | GO:0043184 | vascular endothelial growth factor receptor 2 binding(GO:0043184) |
| 0.1 | 0.4 | GO:0035614 | snRNA stem-loop binding(GO:0035614) |
| 0.0 | 1.4 | GO:0030506 | ankyrin binding(GO:0030506) |
| 0.0 | 0.3 | GO:0023025 | MHC class Ib protein complex binding(GO:0023025) MHC class Ib protein binding, via antigen binding groove(GO:0023030) |
| 0.0 | 0.2 | GO:0033829 | O-fucosylpeptide 3-beta-N-acetylglucosaminyltransferase activity(GO:0033829) |
| 0.0 | 0.1 | GO:0080130 | L-phenylalanine aminotransferase activity(GO:0070546) L-phenylalanine:2-oxoglutarate aminotransferase activity(GO:0080130) |
| 0.0 | 0.2 | GO:0016499 | orexin receptor activity(GO:0016499) |
| 0.0 | 1.2 | GO:0031489 | myosin V binding(GO:0031489) |
| 0.0 | 0.1 | GO:0004939 | beta-adrenergic receptor activity(GO:0004939) |
| 0.0 | 0.4 | GO:0005025 | transforming growth factor beta receptor activity, type I(GO:0005025) |
| 0.0 | 0.3 | GO:0008553 | hydrogen-exporting ATPase activity, phosphorylative mechanism(GO:0008553) |
| 0.0 | 0.3 | GO:0031826 | type 2A serotonin receptor binding(GO:0031826) |
| 0.0 | 0.1 | GO:0031871 | proteinase activated receptor binding(GO:0031871) |
| 0.0 | 0.4 | GO:0030274 | LIM domain binding(GO:0030274) |
| 0.0 | 0.4 | GO:0050544 | icosanoid binding(GO:0050542) arachidonic acid binding(GO:0050544) fatty acid derivative binding(GO:1901567) |
| 0.0 | 0.1 | GO:0004045 | aminoacyl-tRNA hydrolase activity(GO:0004045) |
| 0.0 | 0.4 | GO:0032050 | clathrin heavy chain binding(GO:0032050) |
| 0.0 | 0.4 | GO:0004969 | histamine receptor activity(GO:0004969) |
| 0.0 | 0.2 | GO:0052833 | inositol monophosphate 1-phosphatase activity(GO:0008934) inositol monophosphate 3-phosphatase activity(GO:0052832) inositol monophosphate 4-phosphatase activity(GO:0052833) inositol monophosphate phosphatase activity(GO:0052834) |
| 0.0 | 0.4 | GO:0004415 | hyalurononglucosaminidase activity(GO:0004415) |
| 0.0 | 0.7 | GO:0008179 | adenylate cyclase binding(GO:0008179) |
| 0.0 | 0.2 | GO:0003827 | alpha-1,3-mannosylglycoprotein 2-beta-N-acetylglucosaminyltransferase activity(GO:0003827) |
| 0.0 | 0.2 | GO:0047288 | monosialoganglioside sialyltransferase activity(GO:0047288) |
| 0.0 | 0.3 | GO:0004652 | polynucleotide adenylyltransferase activity(GO:0004652) |
| 0.0 | 1.4 | GO:0015020 | glucuronosyltransferase activity(GO:0015020) |
| 0.0 | 0.1 | GO:0016672 | oxidoreductase activity, acting on a sulfur group of donors, quinone or similar compound as acceptor(GO:0016672) glutathione dehydrogenase (ascorbate) activity(GO:0045174) methylarsonate reductase activity(GO:0050610) |
| 0.0 | 0.1 | GO:0070326 | very-low-density lipoprotein particle receptor binding(GO:0070326) |
| 0.0 | 1.5 | GO:0048027 | mRNA 5'-UTR binding(GO:0048027) |
| 0.0 | 0.2 | GO:0070576 | vitamin D 24-hydroxylase activity(GO:0070576) |
| 0.0 | 0.4 | GO:0016861 | intramolecular oxidoreductase activity, interconverting aldoses and ketoses(GO:0016861) |
| 0.0 | 0.1 | GO:0030297 | transmembrane receptor protein tyrosine kinase activator activity(GO:0030297) |
| 0.0 | 0.2 | GO:0003700 | nucleic acid binding transcription factor activity(GO:0001071) transcription factor activity, sequence-specific DNA binding(GO:0003700) |
| 0.0 | 5.7 | GO:0005200 | structural constituent of cytoskeleton(GO:0005200) |
| 0.0 | 0.1 | GO:0004103 | choline kinase activity(GO:0004103) |
| 0.0 | 0.0 | GO:0001640 | adenylate cyclase inhibiting G-protein coupled glutamate receptor activity(GO:0001640) G-protein coupled glutamate receptor activity(GO:0098988) |
| 0.0 | 10.9 | GO:0004252 | serine-type endopeptidase activity(GO:0004252) |
| 0.0 | 0.2 | GO:0008046 | axon guidance receptor activity(GO:0008046) |
| 0.0 | 0.2 | GO:0003938 | IMP dehydrogenase activity(GO:0003938) |
| 0.0 | 0.0 | GO:0048408 | epidermal growth factor binding(GO:0048408) |
| 0.0 | 0.6 | GO:0017017 | MAP kinase tyrosine/serine/threonine phosphatase activity(GO:0017017) |
| 0.0 | 0.0 | GO:0050145 | nucleoside phosphate kinase activity(GO:0050145) |
| 0.0 | 0.1 | GO:0000155 | phosphorelay sensor kinase activity(GO:0000155) |
| 0.0 | 0.7 | GO:0031683 | G-protein beta/gamma-subunit complex binding(GO:0031683) |
| 0.0 | 0.1 | GO:0009975 | adenylate cyclase activity(GO:0004016) guanylate cyclase activity(GO:0004383) cyclase activity(GO:0009975) phosphorus-oxygen lyase activity(GO:0016849) |
| 0.0 | 0.2 | GO:0016206 | catechol O-methyltransferase activity(GO:0016206) |
| 0.0 | 0.3 | GO:0009008 | DNA-methyltransferase activity(GO:0009008) |
| 0.0 | 0.1 | GO:0004139 | deoxyribose-phosphate aldolase activity(GO:0004139) |
| 0.0 | 0.2 | GO:0008079 | translation release factor activity(GO:0003747) translation termination factor activity(GO:0008079) |
| 0.0 | 0.1 | GO:0004582 | dolichyl-phosphate beta-D-mannosyltransferase activity(GO:0004582) |
| 0.0 | 0.0 | GO:0070742 | C2H2 zinc finger domain binding(GO:0070742) |
| 0.0 | 0.1 | GO:0004814 | arginine-tRNA ligase activity(GO:0004814) |
| 0.0 | 0.5 | GO:0019707 | protein-cysteine S-palmitoyltransferase activity(GO:0019706) protein-cysteine S-acyltransferase activity(GO:0019707) |
| 0.0 | 0.1 | GO:0003829 | beta-1,3-galactosyl-O-glycosyl-glycoprotein beta-1,6-N-acetylglucosaminyltransferase activity(GO:0003829) |
| 0.0 | 0.2 | GO:0102337 | fatty acid elongase activity(GO:0009922) 3-oxo-arachidoyl-CoA synthase activity(GO:0102336) 3-oxo-cerotoyl-CoA synthase activity(GO:0102337) 3-oxo-lignoceronyl-CoA synthase activity(GO:0102338) |
| 0.0 | 0.0 | GO:0047977 | hepoxilin-epoxide hydrolase activity(GO:0047977) |
| 0.0 | 0.1 | GO:0003746 | translation elongation factor activity(GO:0003746) |
| 0.0 | 0.5 | GO:0050431 | transforming growth factor beta binding(GO:0050431) |
| 0.0 | 1.2 | GO:0003785 | actin monomer binding(GO:0003785) |
| 0.0 | 0.2 | GO:0016909 | JUN kinase activity(GO:0004705) SAP kinase activity(GO:0016909) |
| 0.0 | 0.1 | GO:0008192 | RNA guanylyltransferase activity(GO:0008192) |
| 0.0 | 0.2 | GO:0001875 | lipopolysaccharide receptor activity(GO:0001875) |
| 0.0 | 0.9 | GO:0071889 | 14-3-3 protein binding(GO:0071889) |
| 0.0 | 0.1 | GO:0004461 | lactose synthase activity(GO:0004461) |
| 0.0 | 0.5 | GO:0045505 | dynein intermediate chain binding(GO:0045505) |
| 0.0 | 0.4 | GO:0017070 | U6 snRNA binding(GO:0017070) |
| 0.0 | 0.1 | GO:0017018 | myosin phosphatase activity(GO:0017018) |
| 0.0 | 0.3 | GO:0004571 | mannosyl-oligosaccharide 1,2-alpha-mannosidase activity(GO:0004571) |
| 0.0 | 0.3 | GO:0005007 | fibroblast growth factor-activated receptor activity(GO:0005007) |
| 0.0 | 1.5 | GO:0051879 | Hsp90 protein binding(GO:0051879) |
| 0.0 | 0.3 | GO:0055131 | C3HC4-type RING finger domain binding(GO:0055131) |
| 0.0 | 0.2 | GO:0019103 | pyrimidine nucleotide binding(GO:0019103) |
| 0.0 | 4.3 | GO:0005178 | integrin binding(GO:0005178) |
| 0.0 | 1.2 | GO:0046875 | ephrin receptor binding(GO:0046875) |
| 0.0 | 0.5 | GO:0017134 | fibroblast growth factor binding(GO:0017134) |
| 0.0 | 0.1 | GO:0004095 | carnitine O-palmitoyltransferase activity(GO:0004095) |
| 0.0 | 0.6 | GO:0097602 | cullin family protein binding(GO:0097602) |
| 0.0 | 0.2 | GO:0047144 | 2-acylglycerol-3-phosphate O-acyltransferase activity(GO:0047144) |
| 0.0 | 0.3 | GO:0004322 | ferroxidase activity(GO:0004322) oxidoreductase activity, oxidizing metal ions, oxygen as acceptor(GO:0016724) |
| 0.0 | 0.7 | GO:0070182 | DNA polymerase binding(GO:0070182) |
| 0.0 | 0.7 | GO:0001965 | G-protein alpha-subunit binding(GO:0001965) |
| 0.0 | 0.1 | GO:0030348 | syntaxin-3 binding(GO:0030348) |
| 0.0 | 0.1 | GO:1990190 | peptide-glutamate-N-acetyltransferase activity(GO:1990190) |
| 0.0 | 0.2 | GO:0061575 | cyclin-dependent protein serine/threonine kinase activator activity(GO:0061575) |
| 0.0 | 0.1 | GO:0019763 | immunoglobulin receptor activity(GO:0019763) |
| 0.0 | 0.8 | GO:0008138 | protein tyrosine/serine/threonine phosphatase activity(GO:0008138) |
| 0.0 | 1.0 | GO:0015347 | sodium-independent organic anion transmembrane transporter activity(GO:0015347) |
| 0.0 | 0.4 | GO:0045295 | gamma-catenin binding(GO:0045295) |
| 0.0 | 0.1 | GO:0005113 | patched binding(GO:0005113) |
| 0.0 | 0.2 | GO:0004565 | beta-galactosidase activity(GO:0004565) |
| 0.0 | 0.1 | GO:0000995 | transcription factor activity, core RNA polymerase III binding(GO:0000995) |
| 0.0 | 0.4 | GO:0005003 | ephrin receptor activity(GO:0005003) |
| 0.0 | 0.1 | GO:0004137 | deoxycytidine kinase activity(GO:0004137) thymidine kinase activity(GO:0004797) |
| 0.0 | 0.1 | GO:0004591 | oxoglutarate dehydrogenase (succinyl-transferring) activity(GO:0004591) |
| 0.0 | 0.2 | GO:1990446 | U1 snRNP binding(GO:1990446) |
| 0.0 | 0.3 | GO:0047760 | butyrate-CoA ligase activity(GO:0047760) |
| 0.0 | 0.1 | GO:0016748 | succinyltransferase activity(GO:0016748) |
| 0.0 | 0.1 | GO:0047844 | deoxycytidine deaminase activity(GO:0047844) |
| 0.0 | 1.0 | GO:0004714 | transmembrane receptor protein tyrosine kinase activity(GO:0004714) |
| 0.0 | 0.1 | GO:0061663 | NEDD8 ligase activity(GO:0061663) |
| 0.0 | 1.1 | GO:0015485 | cholesterol binding(GO:0015485) |
| 0.0 | 0.1 | GO:0004630 | phospholipase D activity(GO:0004630) N-acylphosphatidylethanolamine-specific phospholipase D activity(GO:0070290) |
| 0.0 | 0.2 | GO:0046935 | 1-phosphatidylinositol-3-kinase regulator activity(GO:0046935) |
| 0.0 | 0.2 | GO:0000268 | peroxisome targeting sequence binding(GO:0000268) |
| 0.0 | 0.5 | GO:0016881 | acid-amino acid ligase activity(GO:0016881) |
| 0.0 | 0.2 | GO:0050733 | RS domain binding(GO:0050733) |
| 0.0 | 0.6 | GO:0004435 | phosphatidylinositol phospholipase C activity(GO:0004435) |
| 0.0 | 0.7 | GO:0001671 | ATPase activator activity(GO:0001671) |
| 0.0 | 0.0 | GO:0001091 | RNA polymerase II basal transcription factor binding(GO:0001091) |
| 0.0 | 0.2 | GO:0071933 | Arp2/3 complex binding(GO:0071933) |
| 0.0 | 0.0 | GO:0098519 | nucleotide phosphatase activity, acting on free nucleotides(GO:0098519) |
| 0.0 | 1.0 | GO:0005164 | tumor necrosis factor receptor binding(GO:0005164) |
| 0.0 | 0.1 | GO:0003976 | UDP-N-acetylglucosamine-lysosomal-enzyme N-acetylglucosaminephosphotransferase activity(GO:0003976) |
| 0.0 | 0.3 | GO:0015095 | magnesium ion transmembrane transporter activity(GO:0015095) |
| 0.0 | 0.4 | GO:0051400 | BH domain binding(GO:0051400) |
| 0.0 | 0.1 | GO:0045134 | uridine-diphosphatase activity(GO:0045134) |
| 0.0 | 1.0 | GO:0030971 | receptor tyrosine kinase binding(GO:0030971) |
| 0.0 | 0.1 | GO:0004703 | G-protein coupled receptor kinase activity(GO:0004703) |
| 0.0 | 0.8 | GO:0036002 | pre-mRNA binding(GO:0036002) |
| 0.0 | 0.0 | GO:0004488 | methenyltetrahydrofolate cyclohydrolase activity(GO:0004477) methylenetetrahydrofolate dehydrogenase (NAD+) activity(GO:0004487) methylenetetrahydrofolate dehydrogenase (NADP+) activity(GO:0004488) |
| 0.0 | 0.3 | GO:0017160 | Ral GTPase binding(GO:0017160) |
| 0.0 | 0.3 | GO:0004526 | ribonuclease P activity(GO:0004526) |
| 0.0 | 0.9 | GO:0005246 | calcium channel regulator activity(GO:0005246) |
| 0.0 | 0.4 | GO:0061650 | ubiquitin conjugating enzyme activity(GO:0061631) ubiquitin-like protein conjugating enzyme activity(GO:0061650) |
| 0.0 | 0.1 | GO:0043398 | HLH domain binding(GO:0043398) |
| 0.0 | 0.1 | GO:0031433 | telethonin binding(GO:0031433) |
| 0.0 | 0.3 | GO:0042043 | neurexin family protein binding(GO:0042043) |
| 0.0 | 0.1 | GO:0003954 | NADH dehydrogenase activity(GO:0003954) |
| 0.0 | 0.3 | GO:0001618 | virus receptor activity(GO:0001618) |
| 0.0 | 0.1 | GO:0061628 | H3K27me3 modified histone binding(GO:0061628) |
| 0.0 | 0.2 | GO:0015266 | protein channel activity(GO:0015266) |
| 0.0 | 0.1 | GO:0015252 | hydrogen ion channel activity(GO:0015252) |
| 0.0 | 0.1 | GO:0004427 | inorganic diphosphatase activity(GO:0004427) |
| 0.0 | 0.1 | GO:0000213 | tRNA-intron endonuclease activity(GO:0000213) |
| 0.0 | 0.4 | GO:0008327 | methyl-CpG binding(GO:0008327) |
| 0.0 | 0.3 | GO:0004691 | cAMP-dependent protein kinase activity(GO:0004691) |
| 0.0 | 0.1 | GO:0004169 | dolichyl-phosphate-mannose-protein mannosyltransferase activity(GO:0004169) |
| 0.0 | 0.0 | GO:0005432 | calcium:sodium antiporter activity(GO:0005432) |
| 0.0 | 1.0 | GO:0004869 | cysteine-type endopeptidase inhibitor activity(GO:0004869) |
| 0.0 | 0.3 | GO:0001054 | RNA polymerase I activity(GO:0001054) |
| 0.0 | 0.2 | GO:0032407 | MutSalpha complex binding(GO:0032407) |
| 0.0 | 0.1 | GO:0004704 | NF-kappaB-inducing kinase activity(GO:0004704) |
| 0.0 | 0.1 | GO:0047820 | D-glutamate cyclase activity(GO:0047820) |
| 0.0 | 0.0 | GO:0071209 | U7 snRNA binding(GO:0071209) |
| 0.0 | 0.3 | GO:0005251 | delayed rectifier potassium channel activity(GO:0005251) |
| 0.0 | 0.1 | GO:1904493 | Ac-Asp-Glu binding(GO:1904492) tetrahydrofolyl-poly(glutamate) polymer binding(GO:1904493) |
| 0.0 | 0.1 | GO:0050656 | 3'-phosphoadenosine 5'-phosphosulfate binding(GO:0050656) |
| 0.0 | 0.3 | GO:1902936 | phosphatidylinositol bisphosphate binding(GO:1902936) |
| 0.0 | 0.0 | GO:0005330 | dopamine:sodium symporter activity(GO:0005330) |
| 0.0 | 0.3 | GO:0019200 | carbohydrate kinase activity(GO:0019200) |
| 0.0 | 0.2 | GO:0019841 | retinol binding(GO:0019841) |
| 0.0 | 0.1 | GO:0004645 | phosphorylase activity(GO:0004645) |
| 0.0 | 0.8 | GO:0032947 | protein complex scaffold(GO:0032947) |
| 0.0 | 0.1 | GO:0004104 | cholinesterase activity(GO:0004104) |
| 0.0 | 0.1 | GO:0010997 | anaphase-promoting complex binding(GO:0010997) |
| 0.0 | 3.0 | GO:0061630 | ubiquitin protein ligase activity(GO:0061630) |
| 0.0 | 0.2 | GO:0017049 | GTP-Rho binding(GO:0017049) |
| 0.0 | 0.2 | GO:0030169 | low-density lipoprotein particle binding(GO:0030169) |
| 0.0 | 0.2 | GO:0097153 | cysteine-type endopeptidase activity involved in apoptotic process(GO:0097153) cysteine-type endopeptidase activity involved in execution phase of apoptosis(GO:0097200) |
| 0.0 | 0.0 | GO:0017129 | triglyceride binding(GO:0017129) |
| 0.0 | 0.1 | GO:0045159 | myosin II binding(GO:0045159) |
| 0.0 | 0.3 | GO:0045504 | dynein heavy chain binding(GO:0045504) |
| 0.0 | 0.1 | GO:0047391 | alkylglycerophosphoethanolamine phosphodiesterase activity(GO:0047391) |
| 0.0 | 0.0 | GO:0000405 | bubble DNA binding(GO:0000405) |
| 0.0 | 0.1 | GO:0043023 | ribosomal large subunit binding(GO:0043023) |
| 0.0 | 0.0 | GO:0016833 | oxo-acid-lyase activity(GO:0016833) |
| 0.0 | 0.1 | GO:0043141 | ATP-dependent 5'-3' DNA helicase activity(GO:0043141) |
| 0.0 | 0.1 | GO:0003917 | DNA topoisomerase type I activity(GO:0003917) |
| 0.0 | 0.0 | GO:0005222 | intracellular cAMP activated cation channel activity(GO:0005222) |
| 0.0 | 0.3 | GO:0016702 | oxidoreductase activity, acting on single donors with incorporation of molecular oxygen, incorporation of two atoms of oxygen(GO:0016702) |
| 0.0 | 0.1 | GO:0086007 | voltage-gated calcium channel activity involved in cardiac muscle cell action potential(GO:0086007) |
| 0.0 | 0.0 | GO:0008376 | acetylgalactosaminyltransferase activity(GO:0008376) |
| 0.0 | 0.1 | GO:0004800 | thyroxine 5'-deiodinase activity(GO:0004800) |
| 0.0 | 0.1 | GO:0005547 | phosphatidylinositol-3,4,5-trisphosphate binding(GO:0005547) |
| 0.0 | 0.2 | GO:0005095 | GTPase inhibitor activity(GO:0005095) |
| 0.0 | 0.0 | GO:0016907 | G-protein coupled acetylcholine receptor activity(GO:0016907) |
| 0.0 | 0.2 | GO:0003906 | DNA-(apurinic or apyrimidinic site) lyase activity(GO:0003906) |
| 0.0 | 0.0 | GO:0003826 | alpha-ketoacid dehydrogenase activity(GO:0003826) 3-methyl-2-oxobutanoate dehydrogenase (2-methylpropanoyl-transferring) activity(GO:0003863) |
| 0.0 | 0.3 | GO:0005035 | tumor necrosis factor-activated receptor activity(GO:0005031) death receptor activity(GO:0005035) |
| 0.0 | 0.0 | GO:0019959 | interleukin-8 binding(GO:0019959) |
| 0.0 | 0.1 | GO:0035240 | dopamine binding(GO:0035240) |
| 0.0 | 0.0 | GO:0015254 | glycerol channel activity(GO:0015254) |
| 0.0 | 0.1 | GO:0004128 | cytochrome-b5 reductase activity, acting on NAD(P)H(GO:0004128) |
| 0.0 | 2.4 | GO:0030246 | carbohydrate binding(GO:0030246) |
| 0.0 | 0.0 | GO:0004740 | pyruvate dehydrogenase (acetyl-transferring) kinase activity(GO:0004740) |
| 0.0 | 0.4 | GO:0051059 | NF-kappaB binding(GO:0051059) |
| 0.0 | 0.0 | GO:0034584 | piRNA binding(GO:0034584) |
| 0.0 | 0.2 | GO:0004806 | triglyceride lipase activity(GO:0004806) |
| 0.0 | 0.1 | GO:0016312 | inositol bisphosphate phosphatase activity(GO:0016312) |
| 0.0 | 0.0 | GO:0052591 | sn-glycerol-3-phosphate:ubiquinone oxidoreductase activity(GO:0052590) sn-glycerol-3-phosphate:ubiquinone-8 oxidoreductase activity(GO:0052591) |
| 0.0 | 0.0 | GO:0000179 | rRNA (adenine-N6,N6-)-dimethyltransferase activity(GO:0000179) |
Gene overrepresentation in biological_process category:
| Log-likelihood per target | Total log-likelihood | Term | Description |
|---|---|---|---|
| 0.9 | 5.6 | GO:0002225 | positive regulation of antimicrobial peptide production(GO:0002225) positive regulation of antimicrobial humoral response(GO:0002760) positive regulation of antibacterial peptide production(GO:0002803) |
| 0.8 | 2.4 | GO:0051710 | regulation of cytolysis in other organism(GO:0051710) |
| 0.7 | 2.1 | GO:0038098 | sequestering of BMP from receptor via BMP binding(GO:0038098) |
| 0.7 | 2.1 | GO:0060166 | olfactory pit development(GO:0060166) |
| 0.7 | 2.0 | GO:0046586 | regulation of calcium-dependent cell-cell adhesion(GO:0046586) |
| 0.6 | 5.5 | GO:0048386 | positive regulation of retinoic acid receptor signaling pathway(GO:0048386) |
| 0.6 | 1.8 | GO:2000097 | regulation of smooth muscle cell-matrix adhesion(GO:2000097) |
| 0.6 | 1.8 | GO:0003308 | negative regulation of Wnt signaling pathway involved in heart development(GO:0003308) |
| 0.6 | 1.8 | GO:0046521 | sphingoid catabolic process(GO:0046521) |
| 0.6 | 2.2 | GO:0019747 | regulation of isoprenoid metabolic process(GO:0019747) |
| 0.5 | 1.6 | GO:0051796 | regulation of monophenol monooxygenase activity(GO:0032771) positive regulation of monophenol monooxygenase activity(GO:0032773) negative regulation of catagen(GO:0051796) regulation of hair cycle by canonical Wnt signaling pathway(GO:0060901) positive regulation of melanosome transport(GO:1902910) |
| 0.5 | 4.3 | GO:0086073 | cardiac muscle cell-cardiac muscle cell adhesion(GO:0086042) bundle of His cell-Purkinje myocyte adhesion involved in cell communication(GO:0086073) |
| 0.5 | 1.4 | GO:1903609 | negative regulation of peptidyl-tyrosine autophosphorylation(GO:1900085) negative regulation of inward rectifier potassium channel activity(GO:1903609) |
| 0.4 | 1.7 | GO:0014028 | notochord formation(GO:0014028) |
| 0.4 | 1.2 | GO:0033341 | regulation of collagen binding(GO:0033341) |
| 0.4 | 2.1 | GO:0060718 | chorionic trophoblast cell differentiation(GO:0060718) |
| 0.4 | 1.6 | GO:0060672 | epithelial cell differentiation involved in embryonic placenta development(GO:0060671) epithelial cell morphogenesis involved in placental branching(GO:0060672) |
| 0.4 | 2.0 | GO:0045906 | negative regulation of vasoconstriction(GO:0045906) |
| 0.4 | 1.2 | GO:0061073 | ciliary body morphogenesis(GO:0061073) |
| 0.4 | 1.9 | GO:0008588 | release of cytoplasmic sequestered NF-kappaB(GO:0008588) |
| 0.3 | 1.0 | GO:0002541 | activation of plasma proteins involved in acute inflammatory response(GO:0002541) |
| 0.3 | 1.0 | GO:0043311 | positive regulation of eosinophil degranulation(GO:0043311) positive regulation of eosinophil activation(GO:1902568) |
| 0.3 | 0.7 | GO:0060214 | endocardium formation(GO:0060214) |
| 0.3 | 2.0 | GO:0072719 | cellular response to cisplatin(GO:0072719) |
| 0.3 | 1.0 | GO:1901301 | regulation of cargo loading into COPII-coated vesicle(GO:1901301) |
| 0.3 | 1.0 | GO:0070318 | myoblast development(GO:0048627) positive regulation of G0 to G1 transition(GO:0070318) |
| 0.3 | 1.3 | GO:0042335 | cuticle development(GO:0042335) |
| 0.3 | 1.3 | GO:0002545 | chronic inflammatory response to non-antigenic stimulus(GO:0002545) regulation of chronic inflammatory response to non-antigenic stimulus(GO:0002880) |
| 0.3 | 1.0 | GO:0046495 | nicotinamide riboside catabolic process(GO:0006738) nicotinamide riboside metabolic process(GO:0046495) pyridine nucleoside metabolic process(GO:0070637) pyridine nucleoside catabolic process(GO:0070638) |
| 0.3 | 3.5 | GO:0009414 | response to water deprivation(GO:0009414) |
| 0.3 | 1.9 | GO:0061302 | smooth muscle cell-matrix adhesion(GO:0061302) |
| 0.3 | 1.2 | GO:0061364 | apoptotic process involved in luteolysis(GO:0061364) |
| 0.3 | 0.9 | GO:0042938 | dipeptide transport(GO:0042938) |
| 0.3 | 1.4 | GO:0061146 | Peyer's patch morphogenesis(GO:0061146) lymphocyte migration into lymphoid organs(GO:0097021) |
| 0.3 | 0.3 | GO:0072240 | DCT cell differentiation(GO:0072069) metanephric DCT cell differentiation(GO:0072240) |
| 0.3 | 1.1 | GO:0010796 | regulation of multivesicular body size(GO:0010796) |
| 0.3 | 0.5 | GO:0009886 | post-embryonic morphogenesis(GO:0009886) post-embryonic eye morphogenesis(GO:0048050) post-embryonic organ morphogenesis(GO:0048563) post-embryonic organ development(GO:0048569) |
| 0.3 | 0.8 | GO:0042350 | GDP-L-fucose biosynthetic process(GO:0042350) 'de novo' GDP-L-fucose biosynthetic process(GO:0042351) |
| 0.2 | 0.2 | GO:0042491 | auditory receptor cell differentiation(GO:0042491) |
| 0.2 | 1.0 | GO:0003409 | optic cup structural organization(GO:0003409) |
| 0.2 | 7.1 | GO:0031581 | hemidesmosome assembly(GO:0031581) |
| 0.2 | 1.9 | GO:0036486 | trunk segmentation(GO:0035290) trunk neural crest cell migration(GO:0036484) ventral trunk neural crest cell migration(GO:0036486) |
| 0.2 | 2.6 | GO:0060753 | regulation of mast cell chemotaxis(GO:0060753) |
| 0.2 | 1.4 | GO:0051549 | positive regulation of keratinocyte migration(GO:0051549) |
| 0.2 | 1.6 | GO:1903232 | melanosome assembly(GO:1903232) |
| 0.2 | 0.2 | GO:0009996 | negative regulation of cell fate specification(GO:0009996) |
| 0.2 | 0.7 | GO:0039689 | negative stranded viral RNA replication(GO:0039689) multi-organism biosynthetic process(GO:0044034) |
| 0.2 | 0.9 | GO:0061290 | cell-cell signaling involved in kidney development(GO:0060995) Wnt signaling pathway involved in kidney development(GO:0061289) canonical Wnt signaling pathway involved in metanephric kidney development(GO:0061290) cell-cell signaling involved in metanephros development(GO:0072204) |
| 0.2 | 0.7 | GO:0010166 | wax biosynthetic process(GO:0010025) wax metabolic process(GO:0010166) |
| 0.2 | 0.7 | GO:0032289 | central nervous system myelin formation(GO:0032289) |
| 0.2 | 1.8 | GO:1900623 | regulation of monocyte aggregation(GO:1900623) positive regulation of monocyte aggregation(GO:1900625) |
| 0.2 | 1.5 | GO:0006655 | phosphatidylglycerol biosynthetic process(GO:0006655) |
| 0.2 | 0.7 | GO:0050916 | sensory perception of sweet taste(GO:0050916) |
| 0.2 | 0.6 | GO:0032808 | lacrimal gland development(GO:0032808) |
| 0.2 | 1.7 | GO:2000252 | negative regulation of feeding behavior(GO:2000252) |
| 0.2 | 0.6 | GO:0060595 | fibroblast growth factor receptor signaling pathway involved in negative regulation of apoptotic process in bone marrow(GO:0035602) fibroblast growth factor receptor signaling pathway involved in hemopoiesis(GO:0035603) fibroblast growth factor receptor signaling pathway involved in positive regulation of cell proliferation in bone marrow(GO:0035604) fibroblast growth factor receptor signaling pathway involved in mammary gland specification(GO:0060595) mammary gland bud formation(GO:0060615) branch elongation involved in salivary gland morphogenesis(GO:0060667) mesenchymal cell differentiation involved in lung development(GO:0060915) |
| 0.2 | 1.4 | GO:0021840 | directional guidance of interneurons involved in migration from the subpallium to the cortex(GO:0021840) chemorepulsion involved in interneuron migration from the subpallium to the cortex(GO:0021842) |
| 0.2 | 1.2 | GO:0048549 | positive regulation of pinocytosis(GO:0048549) |
| 0.2 | 2.3 | GO:0010991 | negative regulation of SMAD protein complex assembly(GO:0010991) |
| 0.2 | 0.8 | GO:0010273 | detoxification of copper ion(GO:0010273) stress response to copper ion(GO:1990169) |
| 0.2 | 0.2 | GO:0036109 | alpha-linolenic acid metabolic process(GO:0036109) linoleic acid metabolic process(GO:0043651) |
| 0.2 | 0.6 | GO:0072076 | nephrogenic mesenchyme development(GO:0072076) |
| 0.2 | 1.1 | GO:0006003 | fructose 2,6-bisphosphate metabolic process(GO:0006003) |
| 0.2 | 1.3 | GO:0021683 | cerebellar granular layer morphogenesis(GO:0021683) |
| 0.2 | 0.9 | GO:0007161 | calcium-independent cell-matrix adhesion(GO:0007161) |
| 0.2 | 1.4 | GO:0030579 | ubiquitin-dependent SMAD protein catabolic process(GO:0030579) |
| 0.2 | 1.6 | GO:0038063 | collagen-activated tyrosine kinase receptor signaling pathway(GO:0038063) collagen-activated signaling pathway(GO:0038065) |
| 0.2 | 1.2 | GO:0032119 | sequestering of zinc ion(GO:0032119) |
| 0.2 | 0.5 | GO:0048597 | B cell negative selection(GO:0002352) post-embryonic camera-type eye morphogenesis(GO:0048597) |
| 0.2 | 0.2 | GO:0097501 | stress response to metal ion(GO:0097501) |
| 0.2 | 0.5 | GO:0042450 | arginine biosynthetic process via ornithine(GO:0042450) |
| 0.2 | 0.7 | GO:0030822 | positive regulation of cyclic nucleotide catabolic process(GO:0030807) positive regulation of cAMP catabolic process(GO:0030822) positive regulation of purine nucleotide catabolic process(GO:0033123) |
| 0.2 | 1.2 | GO:2000124 | regulation of endocannabinoid signaling pathway(GO:2000124) |
| 0.2 | 0.5 | GO:0090611 | ubiquitin-independent protein catabolic process via the multivesicular body sorting pathway(GO:0090611) |
| 0.2 | 0.5 | GO:1905167 | positive regulation of lysosomal protein catabolic process(GO:1905167) |
| 0.2 | 0.7 | GO:0036072 | intramembranous ossification(GO:0001957) direct ossification(GO:0036072) |
| 0.2 | 1.3 | GO:0042492 | gamma-delta T cell differentiation(GO:0042492) |
| 0.2 | 0.2 | GO:0032912 | negative regulation of transforming growth factor beta2 production(GO:0032912) |
| 0.2 | 1.4 | GO:0051546 | keratinocyte migration(GO:0051546) |
| 0.2 | 0.5 | GO:0002276 | basophil activation involved in immune response(GO:0002276) |
| 0.2 | 0.6 | GO:1902460 | regulation of mesenchymal stem cell proliferation(GO:1902460) positive regulation of mesenchymal stem cell proliferation(GO:1902462) |
| 0.2 | 1.5 | GO:0072656 | maintenance of protein location in mitochondrion(GO:0072656) |
| 0.1 | 0.3 | GO:0002159 | desmosome assembly(GO:0002159) |
| 0.1 | 0.4 | GO:0086092 | regulation of the force of heart contraction by cardiac conduction(GO:0086092) |
| 0.1 | 0.4 | GO:1903691 | positive regulation of wound healing, spreading of epidermal cells(GO:1903691) |
| 0.1 | 1.2 | GO:0098887 | neurotransmitter receptor transport, endosome to postsynaptic membrane(GO:0098887) |
| 0.1 | 0.4 | GO:1900224 | positive regulation of nodal signaling pathway involved in determination of lateral mesoderm left/right asymmetry(GO:1900224) |
| 0.1 | 0.4 | GO:0045210 | FasL biosynthetic process(GO:0045210) |
| 0.1 | 0.1 | GO:0010157 | response to chlorate(GO:0010157) |
| 0.1 | 1.5 | GO:0060020 | Bergmann glial cell differentiation(GO:0060020) |
| 0.1 | 0.6 | GO:0036116 | medium-chain fatty-acyl-CoA catabolic process(GO:0036114) long-chain fatty-acyl-CoA catabolic process(GO:0036116) palmitic acid metabolic process(GO:1900533) palmitic acid biosynthetic process(GO:1900535) |
| 0.1 | 0.5 | GO:1902044 | regulation of Fas signaling pathway(GO:1902044) |
| 0.1 | 0.7 | GO:0070980 | biphenyl catabolic process(GO:0070980) |
| 0.1 | 0.4 | GO:0035284 | rhombomere 5 development(GO:0021571) central nervous system segmentation(GO:0035283) brain segmentation(GO:0035284) |
| 0.1 | 1.7 | GO:0035970 | peptidyl-threonine dephosphorylation(GO:0035970) |
| 0.1 | 0.8 | GO:0022614 | membrane to membrane docking(GO:0022614) |
| 0.1 | 1.2 | GO:0035434 | copper ion transmembrane transport(GO:0035434) |
| 0.1 | 0.8 | GO:0000720 | pyrimidine dimer repair by nucleotide-excision repair(GO:0000720) positive regulation of t-circle formation(GO:1904431) |
| 0.1 | 0.6 | GO:0000389 | mRNA 3'-splice site recognition(GO:0000389) |
| 0.1 | 1.1 | GO:0008090 | retrograde axonal transport(GO:0008090) |
| 0.1 | 3.8 | GO:0042347 | negative regulation of NF-kappaB import into nucleus(GO:0042347) |
| 0.1 | 1.1 | GO:0045338 | farnesyl diphosphate metabolic process(GO:0045338) |
| 0.1 | 0.1 | GO:1900223 | positive regulation of beta-amyloid clearance(GO:1900223) |
| 0.1 | 0.7 | GO:0051122 | hepoxilin metabolic process(GO:0051121) hepoxilin biosynthetic process(GO:0051122) |
| 0.1 | 0.2 | GO:0021836 | cerebral cortex tangential migration using cell-cell interactions(GO:0021823) postnatal olfactory bulb interneuron migration(GO:0021827) chemorepulsion involved in postnatal olfactory bulb interneuron migration(GO:0021836) regulation of negative chemotaxis(GO:0050923) |
| 0.1 | 1.0 | GO:0060670 | branching involved in labyrinthine layer morphogenesis(GO:0060670) |
| 0.1 | 0.2 | GO:0070434 | positive regulation of nucleotide-binding oligomerization domain containing signaling pathway(GO:0070426) positive regulation of nucleotide-binding oligomerization domain containing 2 signaling pathway(GO:0070434) |
| 0.1 | 1.3 | GO:0061000 | negative regulation of dendritic spine development(GO:0061000) |
| 0.1 | 0.2 | GO:0006788 | heme oxidation(GO:0006788) |
| 0.1 | 1.6 | GO:0060315 | negative regulation of ryanodine-sensitive calcium-release channel activity(GO:0060315) |
| 0.1 | 1.5 | GO:0010839 | negative regulation of keratinocyte proliferation(GO:0010839) |
| 0.1 | 0.3 | GO:0036353 | histone H2A-K119 monoubiquitination(GO:0036353) |
| 0.1 | 0.8 | GO:0021740 | trigeminal sensory nucleus development(GO:0021730) principal sensory nucleus of trigeminal nerve development(GO:0021740) negative regulation of epithelial cell proliferation involved in lung morphogenesis(GO:2000795) |
| 0.1 | 3.2 | GO:0032331 | negative regulation of chondrocyte differentiation(GO:0032331) |
| 0.1 | 0.1 | GO:1901491 | negative regulation of lymphangiogenesis(GO:1901491) |
| 0.1 | 0.3 | GO:0044209 | AMP salvage(GO:0044209) |
| 0.1 | 0.1 | GO:0097491 | sympathetic neuron projection extension(GO:0097490) sympathetic neuron projection guidance(GO:0097491) |
| 0.1 | 0.4 | GO:0036510 | trimming of terminal mannose on C branch(GO:0036510) |
| 0.1 | 0.5 | GO:0010286 | heat acclimation(GO:0010286) cellular heat acclimation(GO:0070370) |
| 0.1 | 0.6 | GO:0055129 | proline biosynthetic process(GO:0006561) L-proline biosynthetic process(GO:0055129) |
| 0.1 | 0.9 | GO:1902455 | negative regulation of stem cell population maintenance(GO:1902455) |
| 0.1 | 0.4 | GO:0002317 | plasma cell differentiation(GO:0002317) |
| 0.1 | 0.2 | GO:0032621 | interleukin-18 production(GO:0032621) regulation of interleukin-18 production(GO:0032661) |
| 0.1 | 0.1 | GO:0071494 | cellular response to UV-C(GO:0071494) |
| 0.1 | 0.5 | GO:0035926 | chemokine (C-C motif) ligand 2 secretion(GO:0035926) regulation of chemokine (C-C motif) ligand 2 secretion(GO:1904207) positive regulation of chemokine (C-C motif) ligand 2 secretion(GO:1904209) |
| 0.1 | 0.8 | GO:0052697 | flavonoid glucuronidation(GO:0052696) xenobiotic glucuronidation(GO:0052697) |
| 0.1 | 0.9 | GO:0030091 | protein repair(GO:0030091) |
| 0.1 | 1.1 | GO:0050703 | interleukin-1 alpha secretion(GO:0050703) |
| 0.1 | 0.3 | GO:0060448 | dichotomous subdivision of terminal units involved in lung branching(GO:0060448) |
| 0.1 | 1.1 | GO:0035986 | senescence-associated heterochromatin focus assembly(GO:0035986) |
| 0.1 | 5.3 | GO:0007157 | heterophilic cell-cell adhesion via plasma membrane cell adhesion molecules(GO:0007157) |
| 0.1 | 0.4 | GO:0045743 | positive regulation of fibroblast growth factor receptor signaling pathway(GO:0045743) |
| 0.1 | 2.3 | GO:0007250 | activation of NF-kappaB-inducing kinase activity(GO:0007250) |
| 0.1 | 1.3 | GO:0006516 | glycoprotein catabolic process(GO:0006516) |
| 0.1 | 0.3 | GO:0006427 | histidyl-tRNA aminoacylation(GO:0006427) |
| 0.1 | 0.5 | GO:1904693 | midbrain morphogenesis(GO:1904693) |
| 0.1 | 0.3 | GO:0098904 | regulation of cell communication by chemical coupling(GO:0010645) positive regulation of cell communication by chemical coupling(GO:0010652) regulation of AV node cell action potential(GO:0098904) regulation of bundle of His cell action potential(GO:0098905) |
| 0.1 | 2.2 | GO:0097067 | cellular response to thyroid hormone stimulus(GO:0097067) |
| 0.1 | 0.7 | GO:1900029 | positive regulation of ruffle assembly(GO:1900029) |
| 0.1 | 1.0 | GO:0002480 | antigen processing and presentation of exogenous peptide antigen via MHC class I, TAP-independent(GO:0002480) |
| 0.1 | 0.4 | GO:0099640 | axo-dendritic protein transport(GO:0099640) |
| 0.1 | 0.3 | GO:0046166 | glyceraldehyde-3-phosphate biosynthetic process(GO:0046166) |
| 0.1 | 0.2 | GO:1903977 | positive regulation of glial cell migration(GO:1903977) |
| 0.1 | 0.3 | GO:0032804 | negative regulation of low-density lipoprotein particle receptor catabolic process(GO:0032804) |
| 0.1 | 1.5 | GO:0043616 | keratinocyte proliferation(GO:0043616) |
| 0.1 | 0.4 | GO:0001971 | negative regulation of activation of membrane attack complex(GO:0001971) |
| 0.1 | 0.3 | GO:2000777 | endomitotic cell cycle(GO:0007113) positive regulation of proteasomal ubiquitin-dependent protein catabolic process involved in cellular response to hypoxia(GO:2000777) |
| 0.1 | 0.9 | GO:2000601 | positive regulation of Arp2/3 complex-mediated actin nucleation(GO:2000601) |
| 0.1 | 0.7 | GO:0015866 | ADP transport(GO:0015866) ATP transport(GO:0015867) adenine nucleotide transport(GO:0051503) |
| 0.1 | 0.3 | GO:0018125 | peptidyl-cysteine methylation(GO:0018125) |
| 0.1 | 0.3 | GO:0030860 | regulation of polarized epithelial cell differentiation(GO:0030860) |
| 0.1 | 0.3 | GO:0090403 | oxidative stress-induced premature senescence(GO:0090403) |
| 0.1 | 0.5 | GO:1900748 | positive regulation of vascular endothelial growth factor signaling pathway(GO:1900748) |
| 0.1 | 0.6 | GO:0045647 | negative regulation of erythrocyte differentiation(GO:0045647) |
| 0.1 | 0.4 | GO:0061738 | late endosomal microautophagy(GO:0061738) |
| 0.1 | 0.1 | GO:0048203 | vesicle targeting, trans-Golgi to endosome(GO:0048203) |
| 0.1 | 0.2 | GO:0030997 | regulation of centriole-centriole cohesion(GO:0030997) |
| 0.1 | 0.1 | GO:0048073 | regulation of eye pigmentation(GO:0048073) |
| 0.1 | 0.2 | GO:1902630 | regulation of membrane hyperpolarization(GO:1902630) |
| 0.1 | 0.5 | GO:1904627 | response to phorbol 13-acetate 12-myristate(GO:1904627) cellular response to phorbol 13-acetate 12-myristate(GO:1904628) |
| 0.1 | 0.4 | GO:0046952 | ketone body catabolic process(GO:0046952) |
| 0.1 | 0.7 | GO:1902412 | regulation of mitotic cytokinesis(GO:1902412) |
| 0.1 | 7.8 | GO:0070268 | cornification(GO:0070268) |
| 0.1 | 0.5 | GO:0031914 | negative regulation of synaptic plasticity(GO:0031914) |
| 0.1 | 1.1 | GO:0051639 | actin filament network formation(GO:0051639) |
| 0.1 | 0.1 | GO:0031573 | intra-S DNA damage checkpoint(GO:0031573) |
| 0.1 | 0.7 | GO:0038145 | macrophage colony-stimulating factor signaling pathway(GO:0038145) |
| 0.1 | 0.1 | GO:0070585 | protein localization to mitochondrion(GO:0070585) |
| 0.1 | 1.1 | GO:0090168 | Golgi reassembly(GO:0090168) |
| 0.1 | 0.6 | GO:0001561 | fatty acid alpha-oxidation(GO:0001561) |
| 0.1 | 0.3 | GO:0019046 | release from viral latency(GO:0019046) |
| 0.1 | 0.6 | GO:0033327 | Leydig cell differentiation(GO:0033327) |
| 0.1 | 0.5 | GO:0098967 | exocytic insertion of neurotransmitter receptor to plasma membrane(GO:0098881) exocytic insertion of neurotransmitter receptor to postsynaptic membrane(GO:0098967) |
| 0.1 | 0.2 | GO:0030035 | microspike assembly(GO:0030035) |
| 0.1 | 0.1 | GO:1904636 | response to ionomycin(GO:1904636) cellular response to ionomycin(GO:1904637) |
| 0.1 | 0.2 | GO:0035329 | hippo signaling(GO:0035329) |
| 0.1 | 0.3 | GO:0018352 | protein-pyridoxal-5-phosphate linkage(GO:0018352) |
| 0.1 | 0.2 | GO:1903348 | positive regulation of bicellular tight junction assembly(GO:1903348) |
| 0.1 | 0.2 | GO:1903070 | negative regulation of ER-associated ubiquitin-dependent protein catabolic process(GO:1903070) |
| 0.1 | 0.4 | GO:0006931 | substrate-dependent cell migration, cell attachment to substrate(GO:0006931) |
| 0.1 | 0.3 | GO:0070527 | platelet aggregation(GO:0070527) |
| 0.1 | 0.1 | GO:1905244 | regulation of modification of synaptic structure(GO:1905244) |
| 0.1 | 0.3 | GO:0097091 | synaptic vesicle clustering(GO:0097091) |
| 0.1 | 0.4 | GO:0061343 | cell adhesion involved in heart morphogenesis(GO:0061343) |
| 0.1 | 0.3 | GO:0043353 | enucleate erythrocyte differentiation(GO:0043353) |
| 0.1 | 0.3 | GO:0097577 | intracellular sequestering of iron ion(GO:0006880) sequestering of iron ion(GO:0097577) |
| 0.1 | 0.3 | GO:0045065 | cytotoxic T cell differentiation(GO:0045065) |
| 0.1 | 0.8 | GO:0050774 | negative regulation of dendrite morphogenesis(GO:0050774) |
| 0.1 | 2.6 | GO:0032456 | endocytic recycling(GO:0032456) |
| 0.1 | 0.2 | GO:0008355 | olfactory learning(GO:0008355) |
| 0.1 | 0.2 | GO:0003099 | positive regulation of the force of heart contraction by chemical signal(GO:0003099) |
| 0.1 | 0.4 | GO:0046618 | drug export(GO:0046618) |
| 0.1 | 0.4 | GO:0072595 | maintenance of protein localization in organelle(GO:0072595) |
| 0.1 | 0.2 | GO:0021633 | optic nerve structural organization(GO:0021633) |
| 0.1 | 0.3 | GO:0010519 | negative regulation of phospholipase activity(GO:0010519) |
| 0.1 | 0.2 | GO:1902954 | regulation of early endosome to recycling endosome transport(GO:1902954) |
| 0.1 | 1.1 | GO:0015732 | prostaglandin transport(GO:0015732) |
| 0.1 | 1.2 | GO:0035589 | G-protein coupled purinergic nucleotide receptor signaling pathway(GO:0035589) |
| 0.1 | 0.1 | GO:2000182 | regulation of progesterone biosynthetic process(GO:2000182) |
| 0.1 | 0.2 | GO:0072385 | minus-end-directed organelle transport along microtubule(GO:0072385) |
| 0.1 | 1.1 | GO:0007213 | G-protein coupled acetylcholine receptor signaling pathway(GO:0007213) |
| 0.1 | 0.2 | GO:0006990 | positive regulation of transcription from RNA polymerase II promoter involved in unfolded protein response(GO:0006990) |
| 0.1 | 1.4 | GO:0001829 | trophectodermal cell differentiation(GO:0001829) |
| 0.1 | 0.2 | GO:0070317 | negative regulation of G0 to G1 transition(GO:0070317) |
| 0.1 | 0.6 | GO:1904754 | positive regulation of vascular associated smooth muscle cell migration(GO:1904754) |
| 0.1 | 0.1 | GO:0035994 | response to muscle stretch(GO:0035994) detection of muscle stretch(GO:0035995) |
| 0.1 | 0.2 | GO:0071048 | nuclear mRNA surveillance of spliceosomal pre-mRNA splicing(GO:0071030) CUT catabolic process(GO:0071034) CUT metabolic process(GO:0071043) nuclear retention of unspliced pre-mRNA at the site of transcription(GO:0071048) |
| 0.1 | 0.1 | GO:0036093 | male germ cell proliferation(GO:0002176) germ cell proliferation(GO:0036093) |
| 0.1 | 0.2 | GO:1901339 | activation of store-operated calcium channel activity(GO:0032237) regulation of store-operated calcium channel activity(GO:1901339) positive regulation of store-operated calcium channel activity(GO:1901341) |
| 0.1 | 0.4 | GO:0034316 | negative regulation of Arp2/3 complex-mediated actin nucleation(GO:0034316) |
| 0.1 | 0.4 | GO:0007008 | outer mitochondrial membrane organization(GO:0007008) protein import into mitochondrial outer membrane(GO:0045040) |
| 0.1 | 0.1 | GO:0021759 | globus pallidus development(GO:0021759) |
| 0.1 | 0.7 | GO:0009629 | response to gravity(GO:0009629) |
| 0.1 | 0.2 | GO:1903362 | regulation of cellular protein catabolic process(GO:1903362) |
| 0.1 | 0.4 | GO:0051415 | interphase microtubule nucleation by interphase microtubule organizing center(GO:0051415) microtubule nucleation by microtubule organizing center(GO:0051418) |
| 0.1 | 0.1 | GO:0035521 | monoubiquitinated histone deubiquitination(GO:0035521) monoubiquitinated histone H2A deubiquitination(GO:0035522) |
| 0.1 | 0.6 | GO:0060712 | spongiotrophoblast layer development(GO:0060712) |
| 0.1 | 0.2 | GO:0019072 | viral genome packaging(GO:0019072) viral RNA genome packaging(GO:0019074) |
| 0.1 | 1.7 | GO:0010591 | regulation of lamellipodium assembly(GO:0010591) |
| 0.1 | 0.9 | GO:0010801 | negative regulation of peptidyl-threonine phosphorylation(GO:0010801) |
| 0.1 | 0.6 | GO:2000786 | positive regulation of autophagosome assembly(GO:2000786) |
| 0.1 | 0.1 | GO:0002415 | immunoglobulin transcytosis in epithelial cells mediated by polymeric immunoglobulin receptor(GO:0002415) |
| 0.1 | 0.2 | GO:0033484 | nitric oxide homeostasis(GO:0033484) |
| 0.1 | 0.1 | GO:1901727 | positive regulation of histone deacetylase activity(GO:1901727) |
| 0.1 | 0.2 | GO:0042369 | vitamin D catabolic process(GO:0042369) |
| 0.1 | 0.2 | GO:0010936 | negative regulation of macrophage cytokine production(GO:0010936) |
| 0.1 | 0.7 | GO:0070389 | chaperone cofactor-dependent protein refolding(GO:0070389) |
| 0.1 | 1.1 | GO:0042753 | positive regulation of circadian rhythm(GO:0042753) |
| 0.1 | 0.3 | GO:0015691 | cadmium ion transport(GO:0015691) cadmium ion transmembrane transport(GO:0070574) |
| 0.1 | 0.3 | GO:0046391 | 5-phosphoribose 1-diphosphate biosynthetic process(GO:0006015) 5-phosphoribose 1-diphosphate metabolic process(GO:0046391) |
| 0.1 | 0.2 | GO:0042167 | porphyrin-containing compound catabolic process(GO:0006787) tetrapyrrole catabolic process(GO:0033015) heme catabolic process(GO:0042167) pigment catabolic process(GO:0046149) |
| 0.1 | 0.1 | GO:0019348 | dolichol metabolic process(GO:0019348) |
| 0.1 | 0.1 | GO:0019287 | isopentenyl diphosphate biosynthetic process, mevalonate pathway(GO:0019287) |
| 0.1 | 0.3 | GO:0051610 | negative regulation of neurotransmitter uptake(GO:0051581) serotonin uptake(GO:0051610) regulation of serotonin uptake(GO:0051611) negative regulation of serotonin uptake(GO:0051612) |
| 0.1 | 0.3 | GO:0002084 | protein depalmitoylation(GO:0002084) |
| 0.1 | 0.2 | GO:1902202 | regulation of hepatocyte growth factor receptor signaling pathway(GO:1902202) |
| 0.1 | 0.1 | GO:0051541 | elastin metabolic process(GO:0051541) |
| 0.1 | 0.1 | GO:0010726 | positive regulation of hydrogen peroxide metabolic process(GO:0010726) |
| 0.0 | 0.0 | GO:2001021 | negative regulation of response to DNA damage stimulus(GO:2001021) |
| 0.0 | 0.3 | GO:2001181 | positive regulation of interleukin-10 secretion(GO:2001181) |
| 0.0 | 0.2 | GO:0006542 | glutamine biosynthetic process(GO:0006542) |
| 0.0 | 0.0 | GO:0003433 | chondrocyte development involved in endochondral bone morphogenesis(GO:0003433) |
| 0.0 | 1.2 | GO:0007216 | G-protein coupled glutamate receptor signaling pathway(GO:0007216) |
| 0.0 | 0.2 | GO:0009149 | pyrimidine nucleoside triphosphate catabolic process(GO:0009149) pyrimidine deoxyribonucleoside triphosphate catabolic process(GO:0009213) |
| 0.0 | 0.3 | GO:2000568 | memory T cell activation(GO:0035709) regulation of memory T cell activation(GO:2000567) positive regulation of memory T cell activation(GO:2000568) |
| 0.0 | 0.1 | GO:0006106 | fumarate metabolic process(GO:0006106) aspartate catabolic process(GO:0006533) L-kynurenine metabolic process(GO:0097052) |
| 0.0 | 0.1 | GO:0060136 | embryonic process involved in female pregnancy(GO:0060136) |
| 0.0 | 0.8 | GO:0071803 | positive regulation of podosome assembly(GO:0071803) |
| 0.0 | 0.3 | GO:0034201 | response to oleic acid(GO:0034201) |
| 0.0 | 0.3 | GO:0033601 | positive regulation of mammary gland epithelial cell proliferation(GO:0033601) |
| 0.0 | 0.5 | GO:1900028 | negative regulation of ruffle assembly(GO:1900028) |
| 0.0 | 0.1 | GO:0003218 | cardiac left ventricle formation(GO:0003218) |
| 0.0 | 0.7 | GO:0003334 | keratinocyte development(GO:0003334) |
| 0.0 | 1.4 | GO:0042744 | hydrogen peroxide catabolic process(GO:0042744) |
| 0.0 | 0.4 | GO:0072319 | synaptic vesicle uncoating(GO:0016191) vesicle uncoating(GO:0072319) |
| 0.0 | 0.2 | GO:0097084 | vascular smooth muscle cell development(GO:0097084) |
| 0.0 | 0.5 | GO:2000580 | positive regulation of microtubule motor activity(GO:2000576) regulation of ATP-dependent microtubule motor activity, plus-end-directed(GO:2000580) positive regulation of ATP-dependent microtubule motor activity, plus-end-directed(GO:2000582) |
| 0.0 | 0.2 | GO:0097338 | response to clozapine(GO:0097338) |
| 0.0 | 0.0 | GO:0043449 | cellular alkene metabolic process(GO:0043449) |
| 0.0 | 0.2 | GO:1904715 | negative regulation of chaperone-mediated autophagy(GO:1904715) |
| 0.0 | 0.1 | GO:1990164 | histone H2A phosphorylation(GO:1990164) |
| 0.0 | 0.6 | GO:0030150 | protein import into mitochondrial matrix(GO:0030150) |
| 0.0 | 0.3 | GO:0051902 | negative regulation of mitochondrial depolarization(GO:0051902) |
| 0.0 | 0.1 | GO:0034088 | maintenance of sister chromatid cohesion(GO:0034086) maintenance of mitotic sister chromatid cohesion(GO:0034088) |
| 0.0 | 0.0 | GO:0033861 | negative regulation of NAD(P)H oxidase activity(GO:0033861) |
| 0.0 | 0.1 | GO:0015698 | inorganic anion transport(GO:0015698) |
| 0.0 | 0.2 | GO:0006049 | UDP-N-acetylglucosamine catabolic process(GO:0006049) |
| 0.0 | 0.1 | GO:0090045 | positive regulation of deacetylase activity(GO:0090045) |
| 0.0 | 1.4 | GO:0000188 | inactivation of MAPK activity(GO:0000188) |
| 0.0 | 0.1 | GO:0061092 | regulation of phospholipid translocation(GO:0061091) positive regulation of phospholipid translocation(GO:0061092) |
| 0.0 | 0.1 | GO:0010940 | positive regulation of necrotic cell death(GO:0010940) |
| 0.0 | 0.4 | GO:0015014 | heparan sulfate proteoglycan biosynthetic process, polysaccharide chain biosynthetic process(GO:0015014) |
| 0.0 | 0.4 | GO:0016559 | peroxisome fission(GO:0016559) |
| 0.0 | 0.4 | GO:1903025 | regulation of RNA polymerase II regulatory region sequence-specific DNA binding(GO:1903025) |
| 0.0 | 0.1 | GO:0051037 | histone displacement(GO:0001207) regulation of transcription involved in meiotic cell cycle(GO:0051037) positive regulation of transcription involved in meiotic cell cycle(GO:0051039) |
| 0.0 | 0.1 | GO:0099563 | modification of synaptic structure(GO:0099563) |
| 0.0 | 0.3 | GO:0006290 | pyrimidine dimer repair(GO:0006290) |
| 0.0 | 0.1 | GO:0015813 | L-glutamate transport(GO:0015813) |
| 0.0 | 0.3 | GO:0017182 | peptidyl-diphthamide metabolic process(GO:0017182) peptidyl-diphthamide biosynthetic process from peptidyl-histidine(GO:0017183) |
| 0.0 | 0.2 | GO:0030202 | heparin metabolic process(GO:0030202) heparin biosynthetic process(GO:0030210) |
| 0.0 | 0.2 | GO:0032957 | inositol trisphosphate metabolic process(GO:0032957) |
| 0.0 | 0.2 | GO:0090050 | positive regulation of cell migration involved in sprouting angiogenesis(GO:0090050) |
| 0.0 | 0.1 | GO:0071109 | superior temporal gyrus development(GO:0071109) |
| 0.0 | 0.6 | GO:0000920 | cell separation after cytokinesis(GO:0000920) |
| 0.0 | 0.3 | GO:0043374 | CD8-positive, alpha-beta T cell differentiation(GO:0043374) |
| 0.0 | 0.2 | GO:0033138 | positive regulation of peptidyl-serine phosphorylation(GO:0033138) |
| 0.0 | 0.2 | GO:0010724 | regulation of definitive erythrocyte differentiation(GO:0010724) |
| 0.0 | 0.4 | GO:0070973 | protein localization to endoplasmic reticulum exit site(GO:0070973) |
| 0.0 | 0.6 | GO:0032060 | bleb assembly(GO:0032060) |
| 0.0 | 0.5 | GO:0006183 | GTP biosynthetic process(GO:0006183) |
| 0.0 | 0.2 | GO:0016199 | axon midline choice point recognition(GO:0016199) response to norepinephrine(GO:0071873) cellular response to norepinephrine stimulus(GO:0071874) |
| 0.0 | 1.0 | GO:0051290 | protein heterotetramerization(GO:0051290) |
| 0.0 | 0.1 | GO:0043012 | regulation of fusion of sperm to egg plasma membrane(GO:0043012) |
| 0.0 | 0.1 | GO:0072014 | proximal tubule development(GO:0072014) |
| 0.0 | 0.2 | GO:0006307 | DNA dealkylation involved in DNA repair(GO:0006307) |
| 0.0 | 0.1 | GO:0016334 | morphogenesis of follicular epithelium(GO:0016333) establishment or maintenance of polarity of follicular epithelium(GO:0016334) establishment of planar polarity of follicular epithelium(GO:0042247) |
| 0.0 | 0.1 | GO:0016476 | regulation of embryonic cell shape(GO:0016476) |
| 0.0 | 0.0 | GO:0090149 | mitochondrial membrane fission(GO:0090149) |
| 0.0 | 0.2 | GO:0035063 | nuclear speck organization(GO:0035063) |
| 0.0 | 0.3 | GO:0045176 | apical protein localization(GO:0045176) |
| 0.0 | 0.2 | GO:0006489 | dolichyl diphosphate biosynthetic process(GO:0006489) dolichyl diphosphate metabolic process(GO:0046465) |
| 0.0 | 0.3 | GO:0050862 | positive regulation of T cell receptor signaling pathway(GO:0050862) |
| 0.0 | 0.1 | GO:0006420 | arginyl-tRNA aminoacylation(GO:0006420) |
| 0.0 | 0.2 | GO:0050856 | regulation of T cell receptor signaling pathway(GO:0050856) negative regulation of T cell receptor signaling pathway(GO:0050860) |
| 0.0 | 0.1 | GO:0021979 | hypothalamus cell differentiation(GO:0021979) |
| 0.0 | 0.8 | GO:0035635 | entry of bacterium into host cell(GO:0035635) |
| 0.0 | 0.2 | GO:0051694 | pointed-end actin filament capping(GO:0051694) |
| 0.0 | 0.2 | GO:0034625 | fatty acid elongation, saturated fatty acid(GO:0019367) fatty acid elongation, unsaturated fatty acid(GO:0019368) fatty acid elongation, monounsaturated fatty acid(GO:0034625) fatty acid elongation, polyunsaturated fatty acid(GO:0034626) |
| 0.0 | 0.5 | GO:0045741 | positive regulation of epidermal growth factor-activated receptor activity(GO:0045741) |
| 0.0 | 0.2 | GO:0048680 | positive regulation of axon regeneration(GO:0048680) |
| 0.0 | 0.4 | GO:0051775 | response to redox state(GO:0051775) |
| 0.0 | 0.3 | GO:0033234 | negative regulation of protein sumoylation(GO:0033234) |
| 0.0 | 0.4 | GO:0030854 | positive regulation of granulocyte differentiation(GO:0030854) |
| 0.0 | 0.1 | GO:0090675 | intermicrovillar adhesion(GO:0090675) |
| 0.0 | 0.4 | GO:0035024 | negative regulation of Rho protein signal transduction(GO:0035024) |
| 0.0 | 0.1 | GO:0001732 | formation of cytoplasmic translation initiation complex(GO:0001732) |
| 0.0 | 0.2 | GO:1900121 | negative regulation of receptor binding(GO:1900121) |
| 0.0 | 0.1 | GO:0060796 | regulation of transcription involved in primary germ layer cell fate commitment(GO:0060796) |
| 0.0 | 0.1 | GO:0008333 | endosome to lysosome transport(GO:0008333) |
| 0.0 | 0.3 | GO:0007175 | negative regulation of epidermal growth factor-activated receptor activity(GO:0007175) |
| 0.0 | 0.2 | GO:0007386 | compartment pattern specification(GO:0007386) |
| 0.0 | 0.6 | GO:0003215 | cardiac right ventricle morphogenesis(GO:0003215) |
| 0.0 | 0.1 | GO:0018153 | isopeptide cross-linking via N6-(L-isoglutamyl)-L-lysine(GO:0018153) isopeptide cross-linking(GO:0018262) |
| 0.0 | 0.1 | GO:0000294 | nuclear-transcribed mRNA catabolic process, endonucleolytic cleavage-dependent decay(GO:0000294) |
| 0.0 | 0.1 | GO:0045869 | negative regulation of single stranded viral RNA replication via double stranded DNA intermediate(GO:0045869) |
| 0.0 | 0.1 | GO:1902626 | assembly of large subunit precursor of preribosome(GO:1902626) |
| 0.0 | 0.8 | GO:0043567 | regulation of insulin-like growth factor receptor signaling pathway(GO:0043567) |
| 0.0 | 0.5 | GO:0060441 | epithelial tube branching involved in lung morphogenesis(GO:0060441) |
| 0.0 | 0.1 | GO:2000825 | regulation of androgen receptor activity(GO:2000823) positive regulation of androgen receptor activity(GO:2000825) |
| 0.0 | 0.0 | GO:0060023 | soft palate development(GO:0060023) |
| 0.0 | 0.3 | GO:0006930 | substrate-dependent cell migration, cell extension(GO:0006930) |
| 0.0 | 0.1 | GO:0042796 | snRNA transcription from RNA polymerase III promoter(GO:0042796) |
| 0.0 | 0.1 | GO:0035307 | positive regulation of dephosphorylation(GO:0035306) positive regulation of protein dephosphorylation(GO:0035307) |
| 0.0 | 0.1 | GO:0060040 | retinal bipolar neuron differentiation(GO:0060040) |
| 0.0 | 0.2 | GO:0006449 | regulation of translational termination(GO:0006449) |
| 0.0 | 0.2 | GO:0048102 | autophagic cell death(GO:0048102) |
| 0.0 | 0.2 | GO:0035331 | negative regulation of hippo signaling(GO:0035331) |
| 0.0 | 0.1 | GO:0002949 | tRNA threonylcarbamoyladenosine modification(GO:0002949) |
| 0.0 | 0.1 | GO:0007621 | negative regulation of female receptivity(GO:0007621) female courtship behavior(GO:0008050) |
| 0.0 | 0.1 | GO:1900738 | regulation of phospholipase C-activating G-protein coupled receptor signaling pathway(GO:1900736) positive regulation of phospholipase C-activating G-protein coupled receptor signaling pathway(GO:1900738) |
| 0.0 | 0.1 | GO:0003358 | noradrenergic neuron development(GO:0003358) |
| 0.0 | 0.3 | GO:0019068 | virion assembly(GO:0019068) |
| 0.0 | 0.1 | GO:0090500 | endocardial cushion to mesenchymal transition(GO:0090500) |
| 0.0 | 0.1 | GO:0018002 | N-terminal peptidyl-serine acetylation(GO:0017198) N-terminal peptidyl-glutamic acid acetylation(GO:0018002) peptidyl-serine acetylation(GO:0030920) |
| 0.0 | 0.9 | GO:2000352 | negative regulation of endothelial cell apoptotic process(GO:2000352) |
| 0.0 | 0.6 | GO:0035435 | phosphate ion transmembrane transport(GO:0035435) |
| 0.0 | 0.1 | GO:0033387 | putrescine biosynthetic process from ornithine(GO:0033387) |
| 0.0 | 0.4 | GO:0010739 | positive regulation of protein kinase A signaling(GO:0010739) |
| 0.0 | 0.1 | GO:0035330 | regulation of hippo signaling(GO:0035330) |
| 0.0 | 0.3 | GO:0090527 | actin filament reorganization(GO:0090527) |
| 0.0 | 0.1 | GO:0002384 | hepatic immune response(GO:0002384) |
| 0.0 | 0.1 | GO:0006878 | cellular copper ion homeostasis(GO:0006878) |
| 0.0 | 0.5 | GO:0045746 | negative regulation of Notch signaling pathway(GO:0045746) |
| 0.0 | 0.1 | GO:0046121 | deoxyribonucleoside catabolic process(GO:0046121) |
| 0.0 | 0.1 | GO:0007198 | adenylate cyclase-inhibiting serotonin receptor signaling pathway(GO:0007198) |
| 0.0 | 0.1 | GO:0046104 | thymidine metabolic process(GO:0046104) pyrimidine deoxyribonucleoside metabolic process(GO:0046125) |
| 0.0 | 0.2 | GO:0021819 | layer formation in cerebral cortex(GO:0021819) |
| 0.0 | 0.1 | GO:0046900 | tetrahydrofolylpolyglutamate metabolic process(GO:0046900) |
| 0.0 | 0.1 | GO:1903960 | regulation of plasma membrane long-chain fatty acid transport(GO:0010746) negative regulation of plasma membrane long-chain fatty acid transport(GO:0010748) negative regulation of anion transmembrane transport(GO:1903960) |
| 0.0 | 0.2 | GO:0061469 | regulation of type B pancreatic cell proliferation(GO:0061469) |
| 0.0 | 0.1 | GO:0060088 | auditory receptor cell stereocilium organization(GO:0060088) |
| 0.0 | 0.1 | GO:1905232 | cellular response to L-glutamate(GO:1905232) |
| 0.0 | 0.4 | GO:0018345 | protein palmitoylation(GO:0018345) |
| 0.0 | 0.1 | GO:0018095 | protein polyglutamylation(GO:0018095) |
| 0.0 | 0.3 | GO:0002483 | antigen processing and presentation of endogenous peptide antigen(GO:0002483) antigen processing and presentation of endogenous peptide antigen via MHC class I(GO:0019885) |
| 0.0 | 0.8 | GO:0006376 | mRNA splice site selection(GO:0006376) |
| 0.0 | 0.1 | GO:0051012 | microtubule sliding(GO:0051012) |
| 0.0 | 0.0 | GO:0030259 | lipid glycosylation(GO:0030259) |
| 0.0 | 0.1 | GO:2001245 | regulation of phosphatidylcholine biosynthetic process(GO:2001245) |
| 0.0 | 0.1 | GO:0071344 | diphosphate metabolic process(GO:0071344) |
| 0.0 | 0.4 | GO:0006744 | ubiquinone biosynthetic process(GO:0006744) quinone biosynthetic process(GO:1901663) |
| 0.0 | 0.3 | GO:0043981 | histone H4-K5 acetylation(GO:0043981) histone H4-K8 acetylation(GO:0043982) |
| 0.0 | 0.6 | GO:0090162 | establishment of epithelial cell polarity(GO:0090162) |
| 0.0 | 0.2 | GO:0032526 | response to retinoic acid(GO:0032526) |
| 0.0 | 0.1 | GO:0032929 | negative regulation of superoxide anion generation(GO:0032929) |
| 0.0 | 0.1 | GO:0002674 | negative regulation of acute inflammatory response(GO:0002674) |
| 0.0 | 0.1 | GO:2000860 | positive regulation of mineralocorticoid secretion(GO:2000857) positive regulation of aldosterone secretion(GO:2000860) |
| 0.0 | 0.1 | GO:0014859 | negative regulation of skeletal muscle cell proliferation(GO:0014859) negative regulation of skeletal muscle satellite cell proliferation(GO:1902723) |
| 0.0 | 0.1 | GO:0021797 | forebrain anterior/posterior pattern specification(GO:0021797) |
| 0.0 | 0.3 | GO:0036295 | cellular response to increased oxygen levels(GO:0036295) |
| 0.0 | 0.2 | GO:1904354 | negative regulation of telomere capping(GO:1904354) |
| 0.0 | 0.1 | GO:0018343 | protein farnesylation(GO:0018343) |
| 0.0 | 0.1 | GO:0045903 | positive regulation of translational fidelity(GO:0045903) |
| 0.0 | 0.6 | GO:0034314 | Arp2/3 complex-mediated actin nucleation(GO:0034314) |
| 0.0 | 0.1 | GO:0016560 | protein import into peroxisome matrix, docking(GO:0016560) |
| 0.0 | 0.2 | GO:0050709 | negative regulation of protein secretion(GO:0050709) |
| 0.0 | 0.1 | GO:1902177 | positive regulation of oxidative stress-induced intrinsic apoptotic signaling pathway(GO:1902177) |
| 0.0 | 0.4 | GO:0046688 | response to copper ion(GO:0046688) |
| 0.0 | 0.1 | GO:0044571 | [2Fe-2S] cluster assembly(GO:0044571) |
| 0.0 | 0.1 | GO:0018195 | peptidyl-arginine modification(GO:0018195) |
| 0.0 | 0.1 | GO:0046785 | microtubule polymerization(GO:0046785) |
| 0.0 | 0.3 | GO:0010457 | centriole-centriole cohesion(GO:0010457) |
| 0.0 | 0.0 | GO:0015670 | carbon dioxide transport(GO:0015670) |
| 0.0 | 0.2 | GO:0097500 | receptor localization to nonmotile primary cilium(GO:0097500) |
| 0.0 | 0.2 | GO:0048298 | positive regulation of isotype switching to IgA isotypes(GO:0048298) |
| 0.0 | 0.1 | GO:0045074 | interleukin-10 biosynthetic process(GO:0042091) regulation of interleukin-10 biosynthetic process(GO:0045074) |
| 0.0 | 0.1 | GO:0071786 | endoplasmic reticulum tubular network organization(GO:0071786) |
| 0.0 | 0.0 | GO:0036118 | hyaluranon cable assembly(GO:0036118) regulation of hyaluranon cable assembly(GO:1900104) positive regulation of hyaluranon cable assembly(GO:1900106) |
| 0.0 | 0.1 | GO:0032510 | endosome to lysosome transport via multivesicular body sorting pathway(GO:0032510) |
| 0.0 | 0.5 | GO:0036150 | phosphatidylserine acyl-chain remodeling(GO:0036150) |
| 0.0 | 0.1 | GO:0060158 | phospholipase C-activating dopamine receptor signaling pathway(GO:0060158) |
| 0.0 | 0.1 | GO:0052027 | modulation of signal transduction in other organism(GO:0044501) modulation by symbiont of host signal transduction pathway(GO:0052027) modulation of signal transduction in other organism involved in symbiotic interaction(GO:0052250) modulation by symbiont of host I-kappaB kinase/NF-kappaB cascade(GO:0085032) |
| 0.0 | 0.3 | GO:1903830 | magnesium ion transmembrane transport(GO:1903830) |
| 0.0 | 0.1 | GO:0046604 | positive regulation of mitotic centrosome separation(GO:0046604) |
| 0.0 | 0.2 | GO:0090161 | Golgi ribbon formation(GO:0090161) |
| 0.0 | 0.1 | GO:0003322 | pancreatic A cell development(GO:0003322) |
| 0.0 | 0.2 | GO:0048096 | chromatin-mediated maintenance of transcription(GO:0048096) |
| 0.0 | 0.4 | GO:0048873 | homeostasis of number of cells within a tissue(GO:0048873) |
| 0.0 | 0.1 | GO:0001878 | response to yeast(GO:0001878) |
| 0.0 | 0.1 | GO:1904885 | beta-catenin destruction complex assembly(GO:1904885) |
| 0.0 | 0.2 | GO:0097264 | self proteolysis(GO:0097264) |
| 0.0 | 0.1 | GO:0045212 | negative regulation of synaptic transmission, cholinergic(GO:0032223) neurotransmitter receptor biosynthetic process(GO:0045212) |
| 0.0 | 0.1 | GO:0018242 | protein O-linked glycosylation via serine(GO:0018242) |
| 0.0 | 0.2 | GO:1904262 | negative regulation of TORC1 signaling(GO:1904262) |
| 0.0 | 0.1 | GO:1905247 | regulation of aspartic-type endopeptidase activity involved in amyloid precursor protein catabolic process(GO:1902959) positive regulation of aspartic-type endopeptidase activity involved in amyloid precursor protein catabolic process(GO:1902961) regulation of aspartic-type peptidase activity(GO:1905245) positive regulation of aspartic-type peptidase activity(GO:1905247) |
| 0.0 | 0.1 | GO:0048842 | positive regulation of axon extension involved in axon guidance(GO:0048842) |
| 0.0 | 0.1 | GO:0060800 | regulation of cell differentiation involved in embryonic placenta development(GO:0060800) |
| 0.0 | 0.2 | GO:0060391 | positive regulation of SMAD protein import into nucleus(GO:0060391) |
| 0.0 | 0.0 | GO:0042226 | interleukin-6 biosynthetic process(GO:0042226) |
| 0.0 | 0.1 | GO:0034334 | adherens junction maintenance(GO:0034334) |
| 0.0 | 0.1 | GO:0032418 | lysosome localization(GO:0032418) |
| 0.0 | 0.2 | GO:0002244 | hematopoietic progenitor cell differentiation(GO:0002244) |
| 0.0 | 0.1 | GO:0071283 | cellular response to iron(III) ion(GO:0071283) |
| 0.0 | 1.0 | GO:0016266 | O-glycan processing(GO:0016266) |
| 0.0 | 0.1 | GO:1901315 | negative regulation of histone ubiquitination(GO:0033183) negative regulation of protein K63-linked ubiquitination(GO:1900045) regulation of histone H2A K63-linked ubiquitination(GO:1901314) negative regulation of histone H2A K63-linked ubiquitination(GO:1901315) negative regulation of protein polyubiquitination(GO:1902915) |
| 0.0 | 0.1 | GO:0002884 | type IV hypersensitivity(GO:0001806) regulation of type IV hypersensitivity(GO:0001807) negative regulation of hypersensitivity(GO:0002884) |
| 0.0 | 0.2 | GO:0015012 | heparan sulfate proteoglycan biosynthetic process(GO:0015012) |
| 0.0 | 0.3 | GO:1990118 | sodium ion import across plasma membrane(GO:0098719) sodium ion import into cell(GO:1990118) |
| 0.0 | 0.1 | GO:0006308 | DNA catabolic process(GO:0006308) |
| 0.0 | 0.1 | GO:0033314 | mitotic DNA replication checkpoint(GO:0033314) |
| 0.0 | 0.1 | GO:0001992 | regulation of systemic arterial blood pressure by vasopressin(GO:0001992) |
| 0.0 | 0.0 | GO:2000660 | negative regulation of interleukin-1-mediated signaling pathway(GO:2000660) |
| 0.0 | 0.0 | GO:1990637 | response to prolactin(GO:1990637) |
| 0.0 | 0.1 | GO:2000774 | positive regulation of cellular senescence(GO:2000774) |
| 0.0 | 0.2 | GO:0034380 | high-density lipoprotein particle assembly(GO:0034380) |
| 0.0 | 0.4 | GO:0071294 | cellular response to zinc ion(GO:0071294) |
| 0.0 | 0.1 | GO:0038026 | reelin-mediated signaling pathway(GO:0038026) |
| 0.0 | 0.2 | GO:1901879 | regulation of protein depolymerization(GO:1901879) |
| 0.0 | 0.2 | GO:0098903 | regulation of membrane repolarization during action potential(GO:0098903) |
| 0.0 | 0.1 | GO:0000379 | tRNA-type intron splice site recognition and cleavage(GO:0000379) |
| 0.0 | 0.3 | GO:0001682 | tRNA 5'-leader removal(GO:0001682) |
| 0.0 | 0.0 | GO:2000374 | regulation of oxygen metabolic process(GO:2000374) |
| 0.0 | 0.1 | GO:0035093 | spermatogenesis, exchange of chromosomal proteins(GO:0035093) |
| 0.0 | 0.3 | GO:0010745 | negative regulation of macrophage derived foam cell differentiation(GO:0010745) |
| 0.0 | 0.1 | GO:0001714 | endodermal cell fate specification(GO:0001714) |
| 0.0 | 0.2 | GO:0045187 | regulation of circadian sleep/wake cycle, sleep(GO:0045187) |
| 0.0 | 0.0 | GO:0008354 | germ cell migration(GO:0008354) |
| 0.0 | 0.3 | GO:0030214 | hyaluronan catabolic process(GO:0030214) |
| 0.0 | 0.2 | GO:0007220 | Notch receptor processing(GO:0007220) |
| 0.0 | 0.3 | GO:0002089 | lens morphogenesis in camera-type eye(GO:0002089) |
| 0.0 | 0.1 | GO:0030238 | male sex determination(GO:0030238) |
| 0.0 | 0.2 | GO:0019371 | cyclooxygenase pathway(GO:0019371) |
| 0.0 | 0.5 | GO:0046949 | fatty-acyl-CoA biosynthetic process(GO:0046949) |
| 0.0 | 0.2 | GO:0035826 | rubidium ion transport(GO:0035826) regulation of rubidium ion transport(GO:2000680) |
| 0.0 | 0.1 | GO:0006954 | inflammatory response(GO:0006954) |
| 0.0 | 0.0 | GO:0030718 | germ-line stem cell population maintenance(GO:0030718) |
| 0.0 | 0.0 | GO:0002370 | natural killer cell cytokine production(GO:0002370) regulation of natural killer cell cytokine production(GO:0002727) |
| 0.0 | 0.2 | GO:0036120 | response to platelet-derived growth factor(GO:0036119) cellular response to platelet-derived growth factor stimulus(GO:0036120) |
| 0.0 | 0.0 | GO:0042727 | flavin-containing compound biosynthetic process(GO:0042727) |
| 0.0 | 0.2 | GO:0034498 | early endosome to Golgi transport(GO:0034498) |
| 0.0 | 0.0 | GO:0070940 | dephosphorylation of RNA polymerase II C-terminal domain(GO:0070940) |
| 0.0 | 0.2 | GO:0071420 | cellular response to histamine(GO:0071420) |
| 0.0 | 0.4 | GO:0060384 | innervation(GO:0060384) |
| 0.0 | 0.0 | GO:0038129 | ERBB3 signaling pathway(GO:0038129) |
| 0.0 | 0.2 | GO:0002042 | cell migration involved in sprouting angiogenesis(GO:0002042) |
| 0.0 | 0.1 | GO:1901164 | negative regulation of trophoblast cell migration(GO:1901164) |
| 0.0 | 0.1 | GO:0002315 | marginal zone B cell differentiation(GO:0002315) |
| 0.0 | 0.1 | GO:0010585 | glutamine secretion(GO:0010585) L-glutamine import(GO:0036229) L-glutamine import into cell(GO:1903803) |
| 0.0 | 0.0 | GO:0070253 | somatostatin secretion(GO:0070253) |
| 0.0 | 0.3 | GO:0030835 | negative regulation of actin filament depolymerization(GO:0030835) |
| 0.0 | 0.2 | GO:0045919 | positive regulation of cytolysis(GO:0045919) |
| 0.0 | 0.1 | GO:0002051 | osteoblast fate commitment(GO:0002051) |
| 0.0 | 0.1 | GO:0090344 | negative regulation of cell aging(GO:0090344) |
| 0.0 | 0.5 | GO:0071377 | cellular response to glucagon stimulus(GO:0071377) |
| 0.0 | 0.1 | GO:0043653 | mitochondrial fragmentation involved in apoptotic process(GO:0043653) |
| 0.0 | 0.1 | GO:0035752 | lysosomal lumen pH elevation(GO:0035752) |
| 0.0 | 1.5 | GO:0007156 | homophilic cell adhesion via plasma membrane adhesion molecules(GO:0007156) |
| 0.0 | 0.1 | GO:1904098 | regulation of protein O-linked glycosylation(GO:1904098) positive regulation of protein O-linked glycosylation(GO:1904100) |
| 0.0 | 0.1 | GO:1904738 | vascular associated smooth muscle cell migration(GO:1904738) regulation of vascular associated smooth muscle cell migration(GO:1904752) |
| 0.0 | 0.2 | GO:0031441 | negative regulation of mRNA 3'-end processing(GO:0031441) |
| 0.0 | 0.2 | GO:0007130 | synaptonemal complex assembly(GO:0007130) |
| 0.0 | 0.1 | GO:0071763 | nuclear membrane organization(GO:0071763) |
| 0.0 | 0.0 | GO:0055096 | lipoprotein particle mediated signaling(GO:0055095) low-density lipoprotein particle mediated signaling(GO:0055096) |
| 0.0 | 0.0 | GO:0030205 | dermatan sulfate metabolic process(GO:0030205) dermatan sulfate proteoglycan metabolic process(GO:0050655) |
| 0.0 | 0.1 | GO:0033299 | secretion of lysosomal enzymes(GO:0033299) |
| 0.0 | 0.1 | GO:0050689 | negative regulation of defense response to virus by host(GO:0050689) |
| 0.0 | 0.1 | GO:0009635 | response to herbicide(GO:0009635) |
| 0.0 | 0.4 | GO:0030224 | monocyte differentiation(GO:0030224) |
| 0.0 | 0.0 | GO:0042700 | luteinizing hormone signaling pathway(GO:0042700) cellular response to luteinizing hormone stimulus(GO:0071373) |
| 0.0 | 0.1 | GO:0090136 | epithelial cell-cell adhesion(GO:0090136) |
| 0.0 | 0.0 | GO:0006780 | uroporphyrinogen III biosynthetic process(GO:0006780) uroporphyrinogen III metabolic process(GO:0046502) |
| 0.0 | 0.0 | GO:1900042 | positive regulation of interleukin-2 secretion(GO:1900042) |
| 0.0 | 0.1 | GO:0010792 | DNA double-strand break processing involved in repair via single-strand annealing(GO:0010792) |
| 0.0 | 0.2 | GO:1902221 | L-phenylalanine metabolic process(GO:0006558) L-phenylalanine catabolic process(GO:0006559) erythrose 4-phosphate/phosphoenolpyruvate family amino acid metabolic process(GO:1902221) erythrose 4-phosphate/phosphoenolpyruvate family amino acid catabolic process(GO:1902222) |
| 0.0 | 0.1 | GO:0019064 | fusion of virus membrane with host plasma membrane(GO:0019064) membrane fusion involved in viral entry into host cell(GO:0039663) multi-organism membrane fusion(GO:0044800) |
| 0.0 | 0.0 | GO:0050821 | protein stabilization(GO:0050821) |
| 0.0 | 0.1 | GO:0071352 | interleukin-2-mediated signaling pathway(GO:0038110) response to interleukin-2(GO:0070669) cellular response to interleukin-2(GO:0071352) |
| 0.0 | 0.1 | GO:0042267 | natural killer cell mediated cytotoxicity(GO:0042267) |
| 0.0 | 0.4 | GO:0000266 | mitochondrial fission(GO:0000266) |
| 0.0 | 0.4 | GO:0007032 | endosome organization(GO:0007032) |
| 0.0 | 0.2 | GO:0009312 | oligosaccharide biosynthetic process(GO:0009312) |
| 0.0 | 0.0 | GO:1903862 | positive regulation of oxidative phosphorylation(GO:1903862) |
| 0.0 | 0.1 | GO:0044705 | mating behavior(GO:0007617) multi-organism reproductive behavior(GO:0044705) |
| 0.0 | 0.0 | GO:0098759 | response to interleukin-8(GO:0098758) cellular response to interleukin-8(GO:0098759) |
| 0.0 | 0.0 | GO:0000350 | generation of catalytic spliceosome for second transesterification step(GO:0000350) |
| 0.0 | 0.1 | GO:0006659 | phosphatidylserine biosynthetic process(GO:0006659) |
| 0.0 | 0.0 | GO:0015793 | glycerol transport(GO:0015793) |
| 0.0 | 0.0 | GO:0007144 | female meiosis I(GO:0007144) |
| 0.0 | 0.1 | GO:0035609 | C-terminal protein deglutamylation(GO:0035609) |
| 0.0 | 0.0 | GO:0043622 | cortical microtubule organization(GO:0043622) |
| 0.0 | 0.0 | GO:0032747 | positive regulation of interleukin-23 production(GO:0032747) |
| 0.0 | 0.8 | GO:0006023 | aminoglycan biosynthetic process(GO:0006023) glycosaminoglycan biosynthetic process(GO:0006024) |
| 0.0 | 0.1 | GO:0006383 | transcription from RNA polymerase III promoter(GO:0006383) |
| 0.0 | 0.1 | GO:0006451 | selenocysteine incorporation(GO:0001514) translational readthrough(GO:0006451) |
Gene overrepresentation in C2:CP category:
| Log-likelihood per target | Total log-likelihood | Term | Description |
|---|---|---|---|
| 0.2 | 4.7 | PID INTEGRIN4 PATHWAY | Alpha6 beta4 integrin-ligand interactions |
| 0.1 | 6.8 | PID A6B1 A6B4 INTEGRIN PATHWAY | a6b1 and a6b4 Integrin signaling |
| 0.1 | 3.0 | PID HEDGEHOG 2PATHWAY | Signaling events mediated by the Hedgehog family |
| 0.1 | 0.7 | ST G ALPHA S PATHWAY | G alpha s Pathway |
| 0.1 | 1.9 | PID ERBB NETWORK PATHWAY | ErbB receptor signaling network |
| 0.1 | 2.3 | PID EPHA2 FWD PATHWAY | EPHA2 forward signaling |
| 0.1 | 2.4 | PID S1P META PATHWAY | Sphingosine 1-phosphate (S1P) pathway |
| 0.1 | 2.4 | PID LYMPH ANGIOGENESIS PATHWAY | VEGFR3 signaling in lymphatic endothelium |
| 0.1 | 1.5 | PID IL8 CXCR2 PATHWAY | IL8- and CXCR2-mediated signaling events |
| 0.1 | 3.3 | PID AVB3 OPN PATHWAY | Osteopontin-mediated events |
| 0.1 | 1.4 | PID ECADHERIN KERATINOCYTE PATHWAY | E-cadherin signaling in keratinocytes |
| 0.1 | 2.2 | PID ALK1 PATHWAY | ALK1 signaling events |
| 0.1 | 6.9 | WNT SIGNALING | Genes related to Wnt-mediated signal transduction |
| 0.1 | 1.5 | ST ERK1 ERK2 MAPK PATHWAY | ERK1/ERK2 MAPK Pathway |
| 0.1 | 8.5 | NABA ECM AFFILIATED | Genes encoding proteins affiliated structurally or functionally to extracellular matrix proteins |
| 0.0 | 4.2 | PID NOTCH PATHWAY | Notch signaling pathway |
| 0.0 | 0.4 | PID GLYPICAN 1PATHWAY | Glypican 1 network |
| 0.0 | 0.9 | ST GA12 PATHWAY | G alpha 12 Pathway |
| 0.0 | 1.4 | PID TOLL ENDOGENOUS PATHWAY | Endogenous TLR signaling |
| 0.0 | 1.5 | ST PHOSPHOINOSITIDE 3 KINASE PATHWAY | PI3K Pathway |
| 0.0 | 0.7 | PID VEGF VEGFR PATHWAY | VEGF and VEGFR signaling network |
| 0.0 | 1.8 | NABA COLLAGENS | Genes encoding collagen proteins |
| 0.0 | 0.6 | PID SYNDECAN 3 PATHWAY | Syndecan-3-mediated signaling events |
| 0.0 | 0.7 | PID LPA4 PATHWAY | LPA4-mediated signaling events |
| 0.0 | 0.6 | PID P38 MKK3 6PATHWAY | p38 MAPK signaling pathway |
| 0.0 | 2.1 | PID DELTA NP63 PATHWAY | Validated transcriptional targets of deltaNp63 isoforms |
| 0.0 | 1.2 | ST G ALPHA I PATHWAY | G alpha i Pathway |
| 0.0 | 0.4 | PID WNT CANONICAL PATHWAY | Canonical Wnt signaling pathway |
| 0.0 | 1.1 | PID EPHRINB REV PATHWAY | Ephrin B reverse signaling |
| 0.0 | 0.1 | PID NECTIN PATHWAY | Nectin adhesion pathway |
| 0.0 | 2.5 | PID PDGFRB PATHWAY | PDGFR-beta signaling pathway |
| 0.0 | 0.6 | PID TRAIL PATHWAY | TRAIL signaling pathway |
| 0.0 | 0.7 | PID NEPHRIN NEPH1 PATHWAY | Nephrin/Neph1 signaling in the kidney podocyte |
| 0.0 | 0.7 | ST P38 MAPK PATHWAY | p38 MAPK Pathway |
| 0.0 | 0.3 | PID HEDGEHOG GLI PATHWAY | Hedgehog signaling events mediated by Gli proteins |
| 0.0 | 0.5 | PID ENDOTHELIN PATHWAY | Endothelins |
| 0.0 | 0.3 | PID SYNDECAN 2 PATHWAY | Syndecan-2-mediated signaling events |
| 0.0 | 0.1 | ST STAT3 PATHWAY | STAT3 Pathway |
| 0.0 | 0.8 | PID TAP63 PATHWAY | Validated transcriptional targets of TAp63 isoforms |
| 0.0 | 0.9 | PID ECADHERIN STABILIZATION PATHWAY | Stabilization and expansion of the E-cadherin adherens junction |
| 0.0 | 0.4 | PID LYSOPHOSPHOLIPID PATHWAY | LPA receptor mediated events |
| 0.0 | 0.9 | SIG REGULATION OF THE ACTIN CYTOSKELETON BY RHO GTPASES | Genes related to regulation of the actin cytoskeleton |
| 0.0 | 1.1 | PID P53 REGULATION PATHWAY | p53 pathway |
| 0.0 | 1.6 | PID CASPASE PATHWAY | Caspase cascade in apoptosis |
| 0.0 | 0.1 | PID INTEGRIN3 PATHWAY | Beta3 integrin cell surface interactions |
| 0.0 | 0.5 | PID LIS1 PATHWAY | Lissencephaly gene (LIS1) in neuronal migration and development |
| 0.0 | 0.0 | PID RANBP2 PATHWAY | Sumoylation by RanBP2 regulates transcriptional repression |
| 0.0 | 4.0 | NABA ECM REGULATORS | Genes encoding enzymes and their regulators involved in the remodeling of the extracellular matrix |
| 0.0 | 1.2 | PID HDAC CLASSI PATHWAY | Signaling events mediated by HDAC Class I |
| 0.0 | 0.2 | ST WNT BETA CATENIN PATHWAY | Wnt/beta-catenin Pathway |
| 0.0 | 0.2 | PID ANTHRAX PATHWAY | Cellular roles of Anthrax toxin |
| 0.0 | 0.5 | PID FGF PATHWAY | FGF signaling pathway |
| 0.0 | 0.6 | PID LKB1 PATHWAY | LKB1 signaling events |
| 0.0 | 0.4 | PID CDC42 REG PATHWAY | Regulation of CDC42 activity |
| 0.0 | 0.4 | PID ERBB1 INTERNALIZATION PATHWAY | Internalization of ErbB1 |
| 0.0 | 0.2 | PID IL3 PATHWAY | IL3-mediated signaling events |
Gene overrepresentation in C2:CP:REACTOME category:
| Log-likelihood per target | Total log-likelihood | Term | Description |
|---|---|---|---|
| 0.2 | 2.5 | REACTOME RECEPTOR LIGAND BINDING INITIATES THE SECOND PROTEOLYTIC CLEAVAGE OF NOTCH RECEPTOR | Genes involved in Receptor-ligand binding initiates the second proteolytic cleavage of Notch receptor |
| 0.2 | 0.2 | REACTOME ALPHA LINOLENIC ACID ALA METABOLISM | Genes involved in alpha-linolenic acid (ALA) metabolism |
| 0.1 | 2.8 | REACTOME HORMONE SENSITIVE LIPASE HSL MEDIATED TRIACYLGLYCEROL HYDROLYSIS | Genes involved in Hormone-sensitive lipase (HSL)-mediated triacylglycerol hydrolysis |
| 0.1 | 3.4 | REACTOME ADHERENS JUNCTIONS INTERACTIONS | Genes involved in Adherens junctions interactions |
| 0.1 | 4.4 | REACTOME TGF BETA RECEPTOR SIGNALING ACTIVATES SMADS | Genes involved in TGF-beta receptor signaling activates SMADs |
| 0.1 | 1.9 | REACTOME HYALURONAN UPTAKE AND DEGRADATION | Genes involved in Hyaluronan uptake and degradation |
| 0.1 | 2.4 | REACTOME NUCLEOTIDE LIKE PURINERGIC RECEPTORS | Genes involved in Nucleotide-like (purinergic) receptors |
| 0.1 | 1.0 | REACTOME ENDOSOMAL VACUOLAR PATHWAY | Genes involved in Endosomal/Vacuolar pathway |
| 0.1 | 1.5 | REACTOME PLATELET ADHESION TO EXPOSED COLLAGEN | Genes involved in Platelet Adhesion to exposed collagen |
| 0.1 | 3.1 | REACTOME HS GAG BIOSYNTHESIS | Genes involved in HS-GAG biosynthesis |
| 0.1 | 1.0 | REACTOME PURINE CATABOLISM | Genes involved in Purine catabolism |
| 0.1 | 7.4 | REACTOME CELL JUNCTION ORGANIZATION | Genes involved in Cell junction organization |
| 0.1 | 0.2 | REACTOME PECAM1 INTERACTIONS | Genes involved in PECAM1 interactions |
| 0.1 | 1.8 | REACTOME DOWNREGULATION OF ERBB2 ERBB3 SIGNALING | Genes involved in Downregulation of ERBB2:ERBB3 signaling |
| 0.1 | 1.2 | REACTOME REGULATION OF PYRUVATE DEHYDROGENASE PDH COMPLEX | Genes involved in Regulation of pyruvate dehydrogenase (PDH) complex |
| 0.1 | 0.3 | REACTOME ADENYLATE CYCLASE ACTIVATING PATHWAY | Genes involved in Adenylate cyclase activating pathway |
| 0.1 | 2.3 | REACTOME ASSOCIATION OF TRIC CCT WITH TARGET PROTEINS DURING BIOSYNTHESIS | Genes involved in Association of TriC/CCT with target proteins during biosynthesis |
| 0.1 | 0.7 | REACTOME VEGF LIGAND RECEPTOR INTERACTIONS | Genes involved in VEGF ligand-receptor interactions |
| 0.1 | 0.4 | REACTOME CIRCADIAN REPRESSION OF EXPRESSION BY REV ERBA | Genes involved in Circadian Repression of Expression by REV-ERBA |
| 0.1 | 0.2 | REACTOME CROSS PRESENTATION OF SOLUBLE EXOGENOUS ANTIGENS ENDOSOMES | Genes involved in Cross-presentation of soluble exogenous antigens (endosomes) |
| 0.1 | 2.8 | REACTOME GPVI MEDIATED ACTIVATION CASCADE | Genes involved in GPVI-mediated activation cascade |
| 0.1 | 1.4 | REACTOME ADP SIGNALLING THROUGH P2RY12 | Genes involved in ADP signalling through P2Y purinoceptor 12 |
| 0.1 | 1.5 | REACTOME GLUCURONIDATION | Genes involved in Glucuronidation |
| 0.1 | 2.1 | REACTOME G ALPHA Z SIGNALLING EVENTS | Genes involved in G alpha (z) signalling events |
| 0.1 | 0.8 | REACTOME REVERSIBLE HYDRATION OF CARBON DIOXIDE | Genes involved in Reversible Hydration of Carbon Dioxide |
| 0.1 | 0.3 | REACTOME ADP SIGNALLING THROUGH P2RY1 | Genes involved in ADP signalling through P2Y purinoceptor 1 |
| 0.0 | 1.4 | REACTOME GLYCOGEN BREAKDOWN GLYCOGENOLYSIS | Genes involved in Glycogen breakdown (glycogenolysis) |
| 0.0 | 0.6 | REACTOME ELEVATION OF CYTOSOLIC CA2 LEVELS | Genes involved in Elevation of cytosolic Ca2+ levels |
| 0.0 | 1.6 | REACTOME RECYCLING PATHWAY OF L1 | Genes involved in Recycling pathway of L1 |
| 0.0 | 1.0 | REACTOME TRANSPORT OF ORGANIC ANIONS | Genes involved in Transport of organic anions |
| 0.0 | 0.8 | REACTOME DSCAM INTERACTIONS | Genes involved in DSCAM interactions |
| 0.0 | 1.8 | REACTOME NETRIN1 SIGNALING | Genes involved in Netrin-1 signaling |
| 0.0 | 0.8 | REACTOME THE NLRP3 INFLAMMASOME | Genes involved in The NLRP3 inflammasome |
| 0.0 | 0.6 | REACTOME TRAFFICKING AND PROCESSING OF ENDOSOMAL TLR | Genes involved in Trafficking and processing of endosomal TLR |
| 0.0 | 3.2 | REACTOME APOPTOTIC CLEAVAGE OF CELLULAR PROTEINS | Genes involved in Apoptotic cleavage of cellular proteins |
| 0.0 | 0.7 | REACTOME GAP JUNCTION DEGRADATION | Genes involved in Gap junction degradation |
| 0.0 | 1.1 | REACTOME FATTY ACYL COA BIOSYNTHESIS | Genes involved in Fatty Acyl-CoA Biosynthesis |
| 0.0 | 0.6 | REACTOME FGFR2C LIGAND BINDING AND ACTIVATION | Genes involved in FGFR2c ligand binding and activation |
| 0.0 | 5.0 | REACTOME RESPONSE TO ELEVATED PLATELET CYTOSOLIC CA2 | Genes involved in Response to elevated platelet cytosolic Ca2+ |
| 0.0 | 0.5 | REACTOME REGULATION OF WATER BALANCE BY RENAL AQUAPORINS | Genes involved in Regulation of Water Balance by Renal Aquaporins |
| 0.0 | 2.7 | REACTOME GOLGI ASSOCIATED VESICLE BIOGENESIS | Genes involved in Golgi Associated Vesicle Biogenesis |
| 0.0 | 0.8 | REACTOME PROTEOLYTIC CLEAVAGE OF SNARE COMPLEX PROTEINS | Genes involved in Proteolytic cleavage of SNARE complex proteins |
| 0.0 | 0.7 | REACTOME DESTABILIZATION OF MRNA BY KSRP | Genes involved in Destabilization of mRNA by KSRP |
| 0.0 | 0.5 | REACTOME SYNTHESIS OF PIPS AT THE EARLY ENDOSOME MEMBRANE | Genes involved in Synthesis of PIPs at the early endosome membrane |
| 0.0 | 0.7 | REACTOME FORMATION OF FIBRIN CLOT CLOTTING CASCADE | Genes involved in Formation of Fibrin Clot (Clotting Cascade) |
| 0.0 | 0.2 | REACTOME FORMATION OF THE HIV1 EARLY ELONGATION COMPLEX | Genes involved in Formation of the HIV-1 Early Elongation Complex |
| 0.0 | 0.9 | REACTOME FORMATION OF INCISION COMPLEX IN GG NER | Genes involved in Formation of incision complex in GG-NER |
| 0.0 | 0.1 | REACTOME P130CAS LINKAGE TO MAPK SIGNALING FOR INTEGRINS | Genes involved in p130Cas linkage to MAPK signaling for integrins |
| 0.0 | 0.6 | REACTOME SIGNAL TRANSDUCTION BY L1 | Genes involved in Signal transduction by L1 |
| 0.0 | 1.0 | REACTOME PEROXISOMAL LIPID METABOLISM | Genes involved in Peroxisomal lipid metabolism |
| 0.0 | 0.3 | REACTOME SIGNALING BY NOTCH3 | Genes involved in Signaling by NOTCH3 |
| 0.0 | 0.4 | REACTOME RECRUITMENT OF NUMA TO MITOTIC CENTROSOMES | Genes involved in Recruitment of NuMA to mitotic centrosomes |
| 0.0 | 0.3 | REACTOME CTNNB1 PHOSPHORYLATION CASCADE | Genes involved in Beta-catenin phosphorylation cascade |
| 0.0 | 2.5 | REACTOME CLASS B 2 SECRETIN FAMILY RECEPTORS | Genes involved in Class B/2 (Secretin family receptors) |
| 0.0 | 0.2 | REACTOME CYCLIN E ASSOCIATED EVENTS DURING G1 S TRANSITION | Genes involved in Cyclin E associated events during G1/S transition |
| 0.0 | 0.8 | REACTOME CHOLESTEROL BIOSYNTHESIS | Genes involved in Cholesterol biosynthesis |
| 0.0 | 2.1 | REACTOME INTERFERON ALPHA BETA SIGNALING | Genes involved in Interferon alpha/beta signaling |
| 0.0 | 0.3 | REACTOME ERKS ARE INACTIVATED | Genes involved in ERKs are inactivated |
| 0.0 | 0.5 | REACTOME ENDOSOMAL SORTING COMPLEX REQUIRED FOR TRANSPORT ESCRT | Genes involved in Endosomal Sorting Complex Required For Transport (ESCRT) |
| 0.0 | 1.4 | REACTOME NCAM1 INTERACTIONS | Genes involved in NCAM1 interactions |
| 0.0 | 0.5 | REACTOME BMAL1 CLOCK NPAS2 ACTIVATES CIRCADIAN EXPRESSION | Genes involved in BMAL1:CLOCK/NPAS2 Activates Circadian Expression |
| 0.0 | 1.4 | REACTOME MITOCHONDRIAL PROTEIN IMPORT | Genes involved in Mitochondrial Protein Import |
| 0.0 | 0.2 | REACTOME BIOLOGICAL OXIDATIONS | Genes involved in Biological oxidations |
| 0.0 | 0.2 | REACTOME TRAF6 MEDIATED INDUCTION OF TAK1 COMPLEX | Genes involved in TRAF6 mediated induction of TAK1 complex |
| 0.0 | 0.5 | REACTOME EXTRINSIC PATHWAY FOR APOPTOSIS | Genes involved in Extrinsic Pathway for Apoptosis |
| 0.0 | 0.8 | REACTOME SIGNALING BY BMP | Genes involved in Signaling by BMP |
| 0.0 | 0.4 | REACTOME ORGANIC CATION ANION ZWITTERION TRANSPORT | Genes involved in Organic cation/anion/zwitterion transport |
| 0.0 | 3.0 | REACTOME G ALPHA Q SIGNALLING EVENTS | Genes involved in G alpha (q) signalling events |
| 0.0 | 0.6 | REACTOME RNA POL III TRANSCRIPTION TERMINATION | Genes involved in RNA Polymerase III Transcription Termination |
| 0.0 | 0.4 | REACTOME MTORC1 MEDIATED SIGNALLING | Genes involved in mTORC1-mediated signalling |
| 0.0 | 0.1 | REACTOME APOBEC3G MEDIATED RESISTANCE TO HIV1 INFECTION | Genes involved in APOBEC3G mediated resistance to HIV-1 infection |
| 0.0 | 0.1 | REACTOME TANDEM PORE DOMAIN POTASSIUM CHANNELS | Genes involved in Tandem pore domain potassium channels |
| 0.0 | 0.5 | REACTOME SIGNALING BY ROBO RECEPTOR | Genes involved in Signaling by Robo receptor |
| 0.0 | 0.7 | REACTOME O LINKED GLYCOSYLATION OF MUCINS | Genes involved in O-linked glycosylation of mucins |
| 0.0 | 0.1 | REACTOME THROMBIN SIGNALLING THROUGH PROTEINASE ACTIVATED RECEPTORS PARS | Genes involved in Thrombin signalling through proteinase activated receptors (PARs) |
| 0.0 | 0.0 | REACTOME CLEAVAGE OF GROWING TRANSCRIPT IN THE TERMINATION REGION | Genes involved in Cleavage of Growing Transcript in the Termination Region |
| 0.0 | 0.0 | REACTOME SIGNALING BY FGFR3 MUTANTS | Genes involved in Signaling by FGFR3 mutants |
| 0.0 | 0.4 | REACTOME KINESINS | Genes involved in Kinesins |
| 0.0 | 0.8 | REACTOME G1 PHASE | Genes involved in G1 Phase |
| 0.0 | 0.4 | REACTOME REGULATION OF INSULIN SECRETION BY GLUCAGON LIKE PEPTIDE1 | Genes involved in Regulation of Insulin Secretion by Glucagon-like Peptide-1 |
| 0.0 | 0.3 | REACTOME CALNEXIN CALRETICULIN CYCLE | Genes involved in Calnexin/calreticulin cycle |
| 0.0 | 0.1 | REACTOME BINDING AND ENTRY OF HIV VIRION | Genes involved in Binding and entry of HIV virion |
| 0.0 | 0.1 | REACTOME ER PHAGOSOME PATHWAY | Genes involved in ER-Phagosome pathway |
| 0.0 | 0.5 | REACTOME NEGATIVE REGULATORS OF RIG I MDA5 SIGNALING | Genes involved in Negative regulators of RIG-I/MDA5 signaling |
| 0.0 | 0.3 | REACTOME SIGNALING BY HIPPO | Genes involved in Signaling by Hippo |
| 0.0 | 0.2 | REACTOME INFLAMMASOMES | Genes involved in Inflammasomes |
| 0.0 | 0.4 | REACTOME MHC CLASS II ANTIGEN PRESENTATION | Genes involved in MHC class II antigen presentation |
| 0.0 | 0.1 | REACTOME PASSIVE TRANSPORT BY AQUAPORINS | Genes involved in Passive Transport by Aquaporins |
| 0.0 | 0.3 | REACTOME GABA A RECEPTOR ACTIVATION | Genes involved in GABA A receptor activation |
| 0.0 | 0.9 | REACTOME LOSS OF NLP FROM MITOTIC CENTROSOMES | Genes involved in Loss of Nlp from mitotic centrosomes |
| 0.0 | 0.1 | REACTOME ACTIVATED NOTCH1 TRANSMITS SIGNAL TO THE NUCLEUS | Genes involved in Activated NOTCH1 Transmits Signal to the Nucleus |
| 0.0 | 0.2 | REACTOME GAP JUNCTION ASSEMBLY | Genes involved in Gap junction assembly |
| 0.0 | 0.1 | REACTOME REGULATION OF ORNITHINE DECARBOXYLASE ODC | Genes involved in Regulation of ornithine decarboxylase (ODC) |
| 0.0 | 0.2 | REACTOME METABOLISM OF PORPHYRINS | Genes involved in Metabolism of porphyrins |
| 0.0 | 0.2 | REACTOME G0 AND EARLY G1 | Genes involved in G0 and Early G1 |
Gene overrepresentation in cellular_component category:
| Log-likelihood per target | Total log-likelihood | Term | Description |
|---|---|---|---|
| 0.8 | 5.6 | GO:0097209 | epidermal lamellar body(GO:0097209) |
| 0.7 | 4.0 | GO:0098560 | cytoplasmic side of late endosome membrane(GO:0098560) |
| 0.5 | 4.3 | GO:0005610 | laminin-5 complex(GO:0005610) |
| 0.5 | 6.1 | GO:0097470 | ribbon synapse(GO:0097470) |
| 0.4 | 2.2 | GO:0032449 | CBM complex(GO:0032449) |
| 0.4 | 2.0 | GO:0045323 | interleukin-1 receptor complex(GO:0045323) |
| 0.4 | 1.8 | GO:0031905 | early endosome lumen(GO:0031905) |
| 0.4 | 1.1 | GO:0016938 | kinesin I complex(GO:0016938) |
| 0.3 | 1.6 | GO:0034666 | integrin alpha2-beta1 complex(GO:0034666) |
| 0.3 | 9.7 | GO:0030057 | desmosome(GO:0030057) |
| 0.3 | 2.3 | GO:0098845 | postsynaptic endosome(GO:0098845) |
| 0.2 | 1.7 | GO:0035692 | macrophage migration inhibitory factor receptor complex(GO:0035692) |
| 0.2 | 1.0 | GO:0032937 | SREBP-SCAP-Insig complex(GO:0032937) |
| 0.2 | 1.1 | GO:1990425 | ryanodine receptor complex(GO:1990425) |
| 0.2 | 1.6 | GO:0005587 | collagen type IV trimer(GO:0005587) |
| 0.2 | 6.1 | GO:0031092 | platelet alpha granule membrane(GO:0031092) |
| 0.2 | 0.4 | GO:0098576 | lumenal side of membrane(GO:0098576) |
| 0.2 | 0.5 | GO:0060053 | neurofilament cytoskeleton(GO:0060053) |
| 0.2 | 1.3 | GO:0031233 | intrinsic component of external side of plasma membrane(GO:0031233) |
| 0.2 | 0.5 | GO:0071062 | alphav-beta3 integrin-vitronectin complex(GO:0071062) |
| 0.2 | 3.3 | GO:0030056 | hemidesmosome(GO:0030056) |
| 0.2 | 2.0 | GO:0097433 | dense body(GO:0097433) |
| 0.1 | 0.6 | GO:0035838 | growing cell tip(GO:0035838) |
| 0.1 | 0.9 | GO:0031232 | extrinsic component of external side of plasma membrane(GO:0031232) |
| 0.1 | 0.4 | GO:0044393 | microspike(GO:0044393) |
| 0.1 | 0.5 | GO:0045160 | myosin I complex(GO:0045160) |
| 0.1 | 0.5 | GO:0043541 | UDP-N-acetylglucosamine transferase complex(GO:0043541) |
| 0.1 | 0.7 | GO:0034274 | Atg12-Atg5-Atg16 complex(GO:0034274) |
| 0.1 | 1.3 | GO:0097443 | sorting endosome(GO:0097443) |
| 0.1 | 0.8 | GO:0070522 | ERCC4-ERCC1 complex(GO:0070522) |
| 0.1 | 1.1 | GO:0035985 | senescence-associated heterochromatin focus(GO:0035985) |
| 0.1 | 0.7 | GO:0033269 | internode region of axon(GO:0033269) |
| 0.1 | 0.1 | GO:0036513 | Derlin-1 retrotranslocation complex(GO:0036513) |
| 0.1 | 1.0 | GO:0036454 | insulin-like growth factor binding protein complex(GO:0016942) growth factor complex(GO:0036454) |
| 0.1 | 1.1 | GO:0005916 | fascia adherens(GO:0005916) |
| 0.1 | 0.7 | GO:0036021 | endolysosome lumen(GO:0036021) |
| 0.1 | 0.7 | GO:0000235 | astral microtubule(GO:0000235) aster(GO:0005818) |
| 0.1 | 0.3 | GO:0044423 | virion(GO:0019012) virion part(GO:0044423) |
| 0.1 | 0.5 | GO:0071986 | Ragulator complex(GO:0071986) |
| 0.1 | 2.8 | GO:0031258 | lamellipodium membrane(GO:0031258) |
| 0.1 | 1.3 | GO:0090543 | Flemming body(GO:0090543) |
| 0.1 | 2.7 | GO:0046658 | anchored component of plasma membrane(GO:0046658) |
| 0.1 | 1.1 | GO:0034098 | VCP-NPL4-UFD1 AAA ATPase complex(GO:0034098) |
| 0.1 | 0.7 | GO:0005642 | annulate lamellae(GO:0005642) |
| 0.1 | 0.2 | GO:0046696 | lipopolysaccharide receptor complex(GO:0046696) |
| 0.1 | 0.4 | GO:0008275 | gamma-tubulin small complex(GO:0008275) |
| 0.1 | 0.7 | GO:0042612 | MHC class I protein complex(GO:0042612) |
| 0.1 | 0.8 | GO:0098799 | outer mitochondrial membrane protein complex(GO:0098799) |
| 0.1 | 0.4 | GO:0032444 | activin responsive factor complex(GO:0032444) |
| 0.1 | 0.2 | GO:0005826 | actomyosin contractile ring(GO:0005826) |
| 0.1 | 2.0 | GO:0001533 | cornified envelope(GO:0001533) |
| 0.1 | 0.3 | GO:0008043 | intracellular ferritin complex(GO:0008043) ferritin complex(GO:0070288) |
| 0.1 | 0.1 | GO:0048237 | rough endoplasmic reticulum lumen(GO:0048237) |
| 0.1 | 0.2 | GO:0030895 | apolipoprotein B mRNA editing enzyme complex(GO:0030895) |
| 0.1 | 0.7 | GO:0060077 | inhibitory synapse(GO:0060077) |
| 0.1 | 0.4 | GO:0098575 | lumenal side of lysosomal membrane(GO:0098575) |
| 0.1 | 2.3 | GO:0045095 | keratin filament(GO:0045095) |
| 0.1 | 0.3 | GO:0044352 | pinosome(GO:0044352) macropinosome(GO:0044354) |
| 0.1 | 0.7 | GO:0044300 | cerebellar mossy fiber(GO:0044300) |
| 0.1 | 0.5 | GO:0001527 | microfibril(GO:0001527) fibril(GO:0043205) |
| 0.1 | 0.3 | GO:0005602 | complement component C1 complex(GO:0005602) |
| 0.1 | 0.2 | GO:0036398 | TCR signalosome(GO:0036398) |
| 0.1 | 0.4 | GO:0033391 | chromatoid body(GO:0033391) |
| 0.1 | 1.0 | GO:0005885 | Arp2/3 protein complex(GO:0005885) |
| 0.0 | 1.5 | GO:0032420 | stereocilium(GO:0032420) |
| 0.0 | 0.9 | GO:0034663 | endoplasmic reticulum chaperone complex(GO:0034663) |
| 0.0 | 0.6 | GO:0030130 | clathrin coat of trans-Golgi network vesicle(GO:0030130) |
| 0.0 | 0.3 | GO:0097197 | tetraspanin-enriched microdomain(GO:0097197) |
| 0.0 | 0.4 | GO:0034464 | BBSome(GO:0034464) |
| 0.0 | 1.1 | GO:0042629 | mast cell granule(GO:0042629) |
| 0.0 | 0.3 | GO:0005956 | protein kinase CK2 complex(GO:0005956) |
| 0.0 | 0.3 | GO:1990023 | mitotic spindle midzone(GO:1990023) |
| 0.0 | 0.5 | GO:0005577 | fibrinogen complex(GO:0005577) |
| 0.0 | 0.0 | GO:0031205 | endoplasmic reticulum Sec complex(GO:0031205) |
| 0.0 | 0.0 | GO:0002139 | stereocilia coupling link(GO:0002139) |
| 0.0 | 0.3 | GO:0044194 | cytolytic granule(GO:0044194) |
| 0.0 | 0.1 | GO:0033010 | paranodal junction(GO:0033010) |
| 0.0 | 1.1 | GO:0005868 | cytoplasmic dynein complex(GO:0005868) |
| 0.0 | 0.3 | GO:0045179 | apical cortex(GO:0045179) |
| 0.0 | 0.3 | GO:0030285 | integral component of synaptic vesicle membrane(GO:0030285) intrinsic component of synaptic vesicle membrane(GO:0098563) |
| 0.0 | 0.3 | GO:0070022 | transforming growth factor beta receptor homodimeric complex(GO:0070022) |
| 0.0 | 0.4 | GO:0097136 | Bcl-2 family protein complex(GO:0097136) |
| 0.0 | 0.2 | GO:0016327 | apicolateral plasma membrane(GO:0016327) |
| 0.0 | 0.2 | GO:0071203 | WASH complex(GO:0071203) |
| 0.0 | 0.1 | GO:0042643 | actomyosin, actin portion(GO:0042643) |
| 0.0 | 0.1 | GO:0000333 | telomerase catalytic core complex(GO:0000333) |
| 0.0 | 0.9 | GO:0031143 | pseudopodium(GO:0031143) |
| 0.0 | 0.1 | GO:0033185 | dolichol-phosphate-mannose synthase complex(GO:0033185) |
| 0.0 | 0.3 | GO:0031465 | Cul4B-RING E3 ubiquitin ligase complex(GO:0031465) |
| 0.0 | 0.2 | GO:0097123 | cyclin A1-CDK2 complex(GO:0097123) |
| 0.0 | 0.2 | GO:0045252 | oxoglutarate dehydrogenase complex(GO:0045252) |
| 0.0 | 0.4 | GO:0031209 | SCAR complex(GO:0031209) |
| 0.0 | 0.3 | GO:0005579 | membrane attack complex(GO:0005579) |
| 0.0 | 0.1 | GO:0044214 | spanning component of plasma membrane(GO:0044214) spanning component of membrane(GO:0089717) |
| 0.0 | 1.6 | GO:0005834 | heterotrimeric G-protein complex(GO:0005834) |
| 0.0 | 0.3 | GO:0005655 | nucleolar ribonuclease P complex(GO:0005655) |
| 0.0 | 0.2 | GO:0097449 | astrocyte projection(GO:0097449) |
| 0.0 | 3.1 | GO:0045111 | intermediate filament cytoskeleton(GO:0045111) |
| 0.0 | 2.4 | GO:0043195 | terminal bouton(GO:0043195) |
| 0.0 | 0.8 | GO:0031231 | integral component of peroxisomal membrane(GO:0005779) intrinsic component of peroxisomal membrane(GO:0031231) |
| 0.0 | 0.3 | GO:0035579 | specific granule membrane(GO:0035579) |
| 0.0 | 0.3 | GO:0070765 | gamma-secretase complex(GO:0070765) |
| 0.0 | 0.1 | GO:0005850 | eukaryotic translation initiation factor 2 complex(GO:0005850) |
| 0.0 | 2.8 | GO:0005913 | cell-cell adherens junction(GO:0005913) |
| 0.0 | 0.2 | GO:0072558 | NLRP1 inflammasome complex(GO:0072558) |
| 0.0 | 2.5 | GO:0035578 | azurophil granule lumen(GO:0035578) |
| 0.0 | 0.2 | GO:0005844 | polysome(GO:0005844) |
| 0.0 | 0.1 | GO:0034457 | Mpp10 complex(GO:0034457) |
| 0.0 | 0.1 | GO:0032044 | DSIF complex(GO:0032044) |
| 0.0 | 0.9 | GO:0044322 | endoplasmic reticulum quality control compartment(GO:0044322) |
| 0.0 | 0.2 | GO:1990130 | Iml1 complex(GO:1990130) |
| 0.0 | 0.3 | GO:0042588 | zymogen granule(GO:0042588) |
| 0.0 | 0.7 | GO:0035098 | ESC/E(Z) complex(GO:0035098) |
| 0.0 | 0.9 | GO:0031941 | filamentous actin(GO:0031941) |
| 0.0 | 0.2 | GO:0097386 | glial cell projection(GO:0097386) |
| 0.0 | 1.1 | GO:0045178 | basal part of cell(GO:0045178) |
| 0.0 | 0.2 | GO:0097487 | multivesicular body, internal vesicle(GO:0097487) |
| 0.0 | 0.5 | GO:0030427 | site of polarized growth(GO:0030427) |
| 0.0 | 0.2 | GO:0016011 | dystroglycan complex(GO:0016011) sarcoglycan complex(GO:0016012) |
| 0.0 | 0.6 | GO:0097228 | sperm principal piece(GO:0097228) |
| 0.0 | 0.1 | GO:0005853 | eukaryotic translation elongation factor 1 complex(GO:0005853) |
| 0.0 | 0.3 | GO:0030478 | actin cap(GO:0030478) |
| 0.0 | 0.0 | GO:0070381 | endosome to plasma membrane transport vesicle(GO:0070381) |
| 0.0 | 0.2 | GO:0031371 | ubiquitin conjugating enzyme complex(GO:0031371) |
| 0.0 | 0.7 | GO:0005685 | U1 snRNP(GO:0005685) |
| 0.0 | 0.1 | GO:0071817 | MMXD complex(GO:0071817) |
| 0.0 | 2.6 | GO:0031901 | early endosome membrane(GO:0031901) |
| 0.0 | 0.1 | GO:0034388 | Pwp2p-containing subcomplex of 90S preribosome(GO:0034388) |
| 0.0 | 0.6 | GO:0000159 | protein phosphatase type 2A complex(GO:0000159) |
| 0.0 | 0.2 | GO:0042599 | lamellar body(GO:0042599) |
| 0.0 | 0.1 | GO:0000793 | condensed chromosome(GO:0000793) |
| 0.0 | 0.1 | GO:0072487 | MSL complex(GO:0072487) |
| 0.0 | 0.1 | GO:0097361 | CIA complex(GO:0097361) |
| 0.0 | 0.3 | GO:0030014 | CCR4-NOT complex(GO:0030014) |
| 0.0 | 0.2 | GO:0000815 | ESCRT III complex(GO:0000815) |
| 0.0 | 0.1 | GO:0001917 | photoreceptor inner segment(GO:0001917) |
| 0.0 | 1.1 | GO:0097610 | cleavage furrow(GO:0032154) cell surface furrow(GO:0097610) |
| 0.0 | 0.1 | GO:0005640 | nuclear outer membrane(GO:0005640) |
| 0.0 | 0.1 | GO:0000153 | cytoplasmic ubiquitin ligase complex(GO:0000153) |
| 0.0 | 0.3 | GO:0005736 | DNA-directed RNA polymerase I complex(GO:0005736) |
| 0.0 | 0.3 | GO:0034045 | pre-autophagosomal structure membrane(GO:0034045) |
| 0.0 | 0.2 | GO:0033643 | host cell part(GO:0033643) |
| 0.0 | 0.1 | GO:0071159 | NF-kappaB complex(GO:0071159) |
| 0.0 | 0.1 | GO:0034751 | aryl hydrocarbon receptor complex(GO:0034751) |
| 0.0 | 0.0 | GO:0005683 | U7 snRNP(GO:0005683) |
| 0.0 | 0.0 | GO:0031213 | RSF complex(GO:0031213) |
| 0.0 | 0.2 | GO:0036038 | MKS complex(GO:0036038) |
| 0.0 | 0.1 | GO:0031415 | NatA complex(GO:0031415) |
| 0.0 | 1.2 | GO:0048471 | perinuclear region of cytoplasm(GO:0048471) |
| 0.0 | 0.2 | GO:0000176 | nuclear exosome (RNase complex)(GO:0000176) |
| 0.0 | 0.0 | GO:0000835 | ER ubiquitin ligase complex(GO:0000835) Hrd1p ubiquitin ligase complex(GO:0000836) |
| 0.0 | 0.1 | GO:0071541 | eukaryotic translation initiation factor 3 complex, eIF3m(GO:0071541) |
| 0.0 | 0.1 | GO:0044530 | supraspliceosomal complex(GO:0044530) |
| 0.0 | 0.1 | GO:0032541 | cortical endoplasmic reticulum(GO:0032541) |
| 0.0 | 0.2 | GO:0005832 | chaperonin-containing T-complex(GO:0005832) |
| 0.0 | 0.7 | GO:0043679 | axon terminus(GO:0043679) |
| 0.0 | 0.0 | GO:1990075 | periciliary membrane compartment(GO:1990075) |
| 0.0 | 0.8 | GO:0045171 | intercellular bridge(GO:0045171) |
| 0.0 | 0.1 | GO:0017146 | NMDA selective glutamate receptor complex(GO:0017146) |
| 0.0 | 0.1 | GO:0000214 | tRNA-intron endonuclease complex(GO:0000214) |
| 0.0 | 0.1 | GO:0072546 | ER membrane protein complex(GO:0072546) |
| 0.0 | 0.2 | GO:0034451 | centriolar satellite(GO:0034451) |
| 0.0 | 0.1 | GO:0051233 | spindle midzone(GO:0051233) |
| 0.0 | 0.0 | GO:0045298 | tubulin complex(GO:0045298) |
| 0.0 | 0.2 | GO:0000800 | lateral element(GO:0000800) |
| 0.0 | 0.1 | GO:0035976 | AP1 complex(GO:0035976) |
| 0.0 | 0.2 | GO:0016281 | eukaryotic translation initiation factor 4F complex(GO:0016281) |
| 0.0 | 0.1 | GO:0032839 | dendrite cytoplasm(GO:0032839) |
| 0.0 | 6.3 | GO:0005912 | adherens junction(GO:0005912) anchoring junction(GO:0070161) |
| 0.0 | 0.4 | GO:0071339 | MLL1/2 complex(GO:0044665) MLL1 complex(GO:0071339) |
| 0.0 | 0.2 | GO:0008021 | synaptic vesicle(GO:0008021) exocytic vesicle(GO:0070382) |
| 0.0 | 0.1 | GO:0097125 | condensed nuclear chromosome outer kinetochore(GO:0000942) cyclin B1-CDK1 complex(GO:0097125) |
| 0.0 | 0.0 | GO:0043260 | laminin-11 complex(GO:0043260) |
| 0.0 | 0.1 | GO:0005688 | U6 snRNP(GO:0005688) |
| 0.0 | 0.3 | GO:0030131 | clathrin adaptor complex(GO:0030131) |
| 0.0 | 0.3 | GO:0030673 | axolemma(GO:0030673) |
| 0.0 | 0.2 | GO:0005922 | connexon complex(GO:0005922) |
| 0.0 | 0.1 | GO:0042382 | paraspeckles(GO:0042382) |
| 0.0 | 0.1 | GO:1903293 | protein serine/threonine phosphatase complex(GO:0008287) phosphatase complex(GO:1903293) |
| 0.0 | 0.1 | GO:0042788 | polysomal ribosome(GO:0042788) |
| 0.0 | 0.2 | GO:0005942 | phosphatidylinositol 3-kinase complex(GO:0005942) |
| 0.0 | 0.2 | GO:0071011 | precatalytic spliceosome(GO:0071011) |
| 0.0 | 0.5 | GO:0019005 | SCF ubiquitin ligase complex(GO:0019005) |