Project
ENCODE cell lines, expression (Ernst 2011)
Navigation
Downloads
Results for TLX1_NFIC
Z-value: 2.44
Motif logo
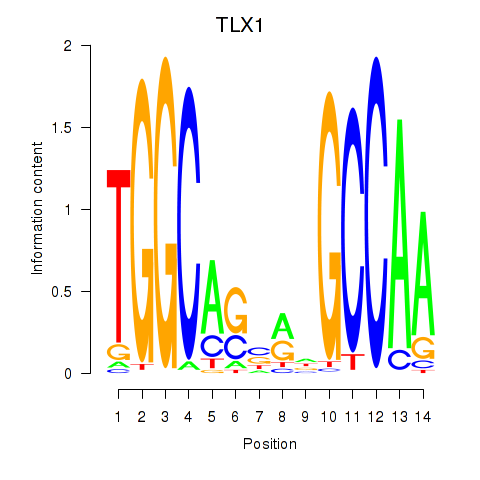
Transcription factors associated with TLX1_NFIC
| Gene Symbol | Gene ID | Gene Info |
|---|---|---|
|
TLX1
|
ENSG00000107807.8 | TLX1 |
|
NFIC
|
ENSG00000141905.13 | NFIC |
Activity-expression correlation:
| Gene | Promoter | Pearson corr. coef. | P-value | Plot |
|---|---|---|---|---|
| NFIC | hg19_v2_chr19_+_3359561_3359681 | 0.77 | 4.8e-04 | Click! |
| TLX1 | hg19_v2_chr10_+_102891048_102891078 | -0.39 | 1.3e-01 | Click! |
Activity profile of TLX1_NFIC motif
Sorted Z-values of TLX1_NFIC motif
Network of associatons between targets according to the STRING database.

First level regulatory network of TLX1_NFIC
| Promoter | Score | Transcript | Gene | Gene Info |
|---|---|---|---|---|
| chr7_+_116165038 | 11.91 |
ENST00000393470.1 |
CAV1 |
caveolin 1, caveolae protein, 22kDa |
| chr12_+_13349650 | 10.51 |
ENST00000256951.5 ENST00000431267.2 ENST00000542474.1 ENST00000544053.1 |
EMP1 |
epithelial membrane protein 1 |
| chr8_-_42065187 | 9.02 |
ENST00000270189.6 ENST00000352041.3 ENST00000220809.4 |
PLAT |
plasminogen activator, tissue |
| chr8_-_42065075 | 7.90 |
ENST00000429089.2 ENST00000519510.1 ENST00000429710.2 ENST00000524009.1 |
PLAT |
plasminogen activator, tissue |
| chrX_+_102631844 | 7.28 |
ENST00000372634.1 ENST00000299872.7 |
NGFRAP1 |
nerve growth factor receptor (TNFRSF16) associated protein 1 |
| chrX_+_102631248 | 7.01 |
ENST00000361298.4 ENST00000372645.3 ENST00000372635.1 |
NGFRAP1 |
nerve growth factor receptor (TNFRSF16) associated protein 1 |
| chr7_+_102553430 | 6.87 |
ENST00000339431.4 ENST00000249377.4 |
LRRC17 |
leucine rich repeat containing 17 |
| chr1_+_151512775 | 6.39 |
ENST00000368849.3 ENST00000392712.3 ENST00000353024.3 ENST00000368848.2 ENST00000538902.1 |
TUFT1 |
tuftelin 1 |
| chr14_+_85996471 | 5.64 |
ENST00000330753.4 |
FLRT2 |
fibronectin leucine rich transmembrane protein 2 |
| chr7_+_143079000 | 5.45 |
ENST00000392910.2 |
ZYX |
zyxin |
| chr20_+_19867150 | 5.33 |
ENST00000255006.6 |
RIN2 |
Ras and Rab interactor 2 |
| chr8_-_27468842 | 5.31 |
ENST00000523500.1 |
CLU |
clusterin |
| chr14_+_105939276 | 5.23 |
ENST00000483017.3 |
CRIP2 |
cysteine-rich protein 2 |
| chr12_-_56106060 | 5.04 |
ENST00000452168.2 |
ITGA7 |
integrin, alpha 7 |
| chr8_-_27469196 | 5.04 |
ENST00000546343.1 ENST00000560566.1 |
CLU |
clusterin |
| chr5_-_111092930 | 4.91 |
ENST00000257435.7 |
NREP |
neuronal regeneration related protein |
| chr10_+_17272608 | 4.85 |
ENST00000421459.2 |
VIM |
vimentin |
| chr7_+_143078652 | 4.79 |
ENST00000354434.4 ENST00000449423.2 |
ZYX |
zyxin |
| chr8_-_27468945 | 4.75 |
ENST00000405140.3 |
CLU |
clusterin |
| chr5_-_111093406 | 4.64 |
ENST00000379671.3 |
NREP |
neuronal regeneration related protein |
| chr5_-_111093167 | 4.37 |
ENST00000446294.2 ENST00000419114.2 |
NREP |
neuronal regeneration related protein |
| chr12_+_66217911 | 4.36 |
ENST00000403681.2 |
HMGA2 |
high mobility group AT-hook 2 |
| chr12_-_54813229 | 4.27 |
ENST00000293379.4 |
ITGA5 |
integrin, alpha 5 (fibronectin receptor, alpha polypeptide) |
| chr5_-_111092873 | 4.24 |
ENST00000509025.1 ENST00000515855.1 |
NREP |
neuronal regeneration related protein |
| chr5_-_111093081 | 4.06 |
ENST00000453526.2 ENST00000509427.1 |
NREP |
neuronal regeneration related protein |
| chr11_-_111783919 | 3.91 |
ENST00000531198.1 ENST00000533879.1 |
CRYAB |
crystallin, alpha B |
| chr8_-_18541603 | 3.71 |
ENST00000428502.2 |
PSD3 |
pleckstrin and Sec7 domain containing 3 |
| chr20_-_60942361 | 3.48 |
ENST00000252999.3 |
LAMA5 |
laminin, alpha 5 |
| chr14_+_85996507 | 3.46 |
ENST00000554746.1 |
FLRT2 |
fibronectin leucine rich transmembrane protein 2 |
| chr1_-_153517473 | 3.46 |
ENST00000368715.1 |
S100A4 |
S100 calcium binding protein A4 |
| chrX_-_102319092 | 3.45 |
ENST00000372728.3 |
BEX1 |
brain expressed, X-linked 1 |
| chr5_+_92919043 | 3.41 |
ENST00000327111.3 |
NR2F1 |
nuclear receptor subfamily 2, group F, member 1 |
| chr5_-_111093340 | 3.36 |
ENST00000508870.1 |
NREP |
neuronal regeneration related protein |
| chr21_-_28217721 | 3.36 |
ENST00000284984.3 |
ADAMTS1 |
ADAM metallopeptidase with thrombospondin type 1 motif, 1 |
| chr9_-_130617029 | 3.35 |
ENST00000373203.4 |
ENG |
endoglin |
| chr2_-_217560248 | 3.19 |
ENST00000233813.4 |
IGFBP5 |
insulin-like growth factor binding protein 5 |
| chr11_-_111784005 | 3.12 |
ENST00000527899.1 |
CRYAB |
crystallin, alpha B |
| chr9_-_130616915 | 3.11 |
ENST00000344849.3 |
ENG |
endoglin |
| chr15_-_35088340 | 3.07 |
ENST00000290378.4 |
ACTC1 |
actin, alpha, cardiac muscle 1 |
| chr9_+_139871948 | 3.06 |
ENST00000224167.2 ENST00000457950.1 ENST00000371625.3 ENST00000371623.3 |
PTGDS |
prostaglandin D2 synthase 21kDa (brain) |
| chr1_-_173174681 | 2.92 |
ENST00000367718.1 |
TNFSF4 |
tumor necrosis factor (ligand) superfamily, member 4 |
| chr7_+_22766766 | 2.88 |
ENST00000426291.1 ENST00000401651.1 ENST00000258743.5 ENST00000420258.2 ENST00000407492.1 ENST00000401630.3 ENST00000406575.1 |
IL6 |
interleukin 6 (interferon, beta 2) |
| chr1_-_153538292 | 2.87 |
ENST00000497140.1 ENST00000368708.3 |
S100A2 |
S100 calcium binding protein A2 |
| chr10_+_17271266 | 2.83 |
ENST00000224237.5 |
VIM |
vimentin |
| chr11_-_111781454 | 2.83 |
ENST00000533280.1 |
CRYAB |
crystallin, alpha B |
| chr1_-_95392635 | 2.83 |
ENST00000538964.1 ENST00000394202.4 ENST00000370206.4 |
CNN3 |
calponin 3, acidic |
| chr8_-_13134045 | 2.82 |
ENST00000512044.2 |
DLC1 |
deleted in liver cancer 1 |
| chr9_-_14180778 | 2.75 |
ENST00000380924.1 ENST00000543693.1 |
NFIB |
nuclear factor I/B |
| chrX_+_99899180 | 2.73 |
ENST00000373004.3 |
SRPX2 |
sushi-repeat containing protein, X-linked 2 |
| chr9_+_124030338 | 2.69 |
ENST00000449773.1 ENST00000432226.1 ENST00000436847.1 ENST00000394353.2 ENST00000449733.1 ENST00000412819.1 ENST00000341272.2 ENST00000373808.2 |
GSN |
gelsolin |
| chr2_-_238322770 | 2.67 |
ENST00000472056.1 |
COL6A3 |
collagen, type VI, alpha 3 |
| chr2_-_192711968 | 2.66 |
ENST00000304141.4 |
SDPR |
serum deprivation response |
| chr2_-_238323007 | 2.64 |
ENST00000295550.4 |
COL6A3 |
collagen, type VI, alpha 3 |
| chr17_+_38599693 | 2.64 |
ENST00000542955.1 ENST00000269593.4 |
IGFBP4 |
insulin-like growth factor binding protein 4 |
| chr20_+_33759854 | 2.63 |
ENST00000216968.4 |
PROCR |
protein C receptor, endothelial |
| chr2_-_238322800 | 2.62 |
ENST00000392004.3 ENST00000433762.1 ENST00000347401.3 ENST00000353578.4 ENST00000346358.4 ENST00000392003.2 |
COL6A3 |
collagen, type VI, alpha 3 |
| chr17_-_76921459 | 2.44 |
ENST00000262768.7 |
TIMP2 |
TIMP metallopeptidase inhibitor 2 |
| chr7_-_81399329 | 2.41 |
ENST00000453411.1 ENST00000444829.2 |
HGF |
hepatocyte growth factor (hepapoietin A; scatter factor) |
| chr21_+_46875424 | 2.40 |
ENST00000359759.4 |
COL18A1 |
collagen, type XVIII, alpha 1 |
| chr21_+_46875395 | 2.39 |
ENST00000355480.5 |
COL18A1 |
collagen, type XVIII, alpha 1 |
| chr1_+_156095951 | 2.35 |
ENST00000448611.2 ENST00000368297.1 |
LMNA |
lamin A/C |
| chr2_+_102721023 | 2.34 |
ENST00000409589.1 ENST00000409329.1 |
IL1R1 |
interleukin 1 receptor, type I |
| chr12_+_53491220 | 2.34 |
ENST00000548547.1 ENST00000301464.3 |
IGFBP6 |
insulin-like growth factor binding protein 6 |
| chr14_+_24867992 | 2.25 |
ENST00000382554.3 |
NYNRIN |
NYN domain and retroviral integrase containing |
| chr6_-_46922659 | 2.23 |
ENST00000265417.7 |
GPR116 |
G protein-coupled receptor 116 |
| chr1_+_203595689 | 2.21 |
ENST00000357681.5 |
ATP2B4 |
ATPase, Ca++ transporting, plasma membrane 4 |
| chr12_+_119616447 | 2.14 |
ENST00000281938.2 |
HSPB8 |
heat shock 22kDa protein 8 |
| chr12_-_56122124 | 2.11 |
ENST00000552754.1 |
CD63 |
CD63 molecule |
| chr11_-_117186946 | 2.10 |
ENST00000313005.6 ENST00000528053.1 |
BACE1 |
beta-site APP-cleaving enzyme 1 |
| chr3_-_52486841 | 2.09 |
ENST00000496590.1 |
TNNC1 |
troponin C type 1 (slow) |
| chr12_-_56122220 | 2.03 |
ENST00000552692.1 |
CD63 |
CD63 molecule |
| chr20_+_9049682 | 1.99 |
ENST00000334005.3 ENST00000378473.3 |
PLCB4 |
phospholipase C, beta 4 |
| chr10_+_124320156 | 1.97 |
ENST00000338354.3 ENST00000344338.3 ENST00000330163.4 ENST00000368909.3 ENST00000368955.3 ENST00000368956.2 |
DMBT1 |
deleted in malignant brain tumors 1 |
| chr15_-_40213080 | 1.92 |
ENST00000561100.1 |
GPR176 |
G protein-coupled receptor 176 |
| chr9_+_470288 | 1.84 |
ENST00000382303.1 |
KANK1 |
KN motif and ankyrin repeat domains 1 |
| chr15_-_77363441 | 1.81 |
ENST00000346495.2 ENST00000424443.3 ENST00000561277.1 |
TSPAN3 |
tetraspanin 3 |
| chr10_+_124320195 | 1.77 |
ENST00000359586.6 |
DMBT1 |
deleted in malignant brain tumors 1 |
| chr9_-_79520989 | 1.74 |
ENST00000376713.3 ENST00000376718.3 ENST00000428286.1 |
PRUNE2 |
prune homolog 2 (Drosophila) |
| chr15_-_77363375 | 1.69 |
ENST00000559494.1 |
TSPAN3 |
tetraspanin 3 |
| chr9_-_13279589 | 1.69 |
ENST00000319217.7 |
MPDZ |
multiple PDZ domain protein |
| chr9_-_13279563 | 1.66 |
ENST00000541718.1 |
MPDZ |
multiple PDZ domain protein |
| chr13_+_113622757 | 1.63 |
ENST00000375604.2 |
MCF2L |
MCF.2 cell line derived transforming sequence-like |
| chr1_-_153538011 | 1.61 |
ENST00000368707.4 |
S100A2 |
S100 calcium binding protein A2 |
| chr1_+_156096336 | 1.56 |
ENST00000504687.1 ENST00000473598.2 |
LMNA |
lamin A/C |
| chr1_+_203595903 | 1.55 |
ENST00000367218.3 ENST00000367219.3 ENST00000391954.2 |
ATP2B4 |
ATPase, Ca++ transporting, plasma membrane 4 |
| chr7_-_151433393 | 1.54 |
ENST00000492843.1 |
PRKAG2 |
protein kinase, AMP-activated, gamma 2 non-catalytic subunit |
| chr7_-_151433342 | 1.54 |
ENST00000433631.2 |
PRKAG2 |
protein kinase, AMP-activated, gamma 2 non-catalytic subunit |
| chr7_+_128470431 | 1.49 |
ENST00000325888.8 ENST00000346177.6 |
FLNC |
filamin C, gamma |
| chr11_-_65325664 | 1.44 |
ENST00000301873.5 |
LTBP3 |
latent transforming growth factor beta binding protein 3 |
| chr16_-_19896220 | 1.43 |
ENST00000562469.1 ENST00000300571.2 |
GPRC5B |
G protein-coupled receptor, family C, group 5, member B |
| chrX_-_154688276 | 1.42 |
ENST00000369445.2 |
F8A3 |
coagulation factor VIII-associated 3 |
| chr11_+_67776012 | 1.40 |
ENST00000539229.1 |
ALDH3B1 |
aldehyde dehydrogenase 3 family, member B1 |
| chr7_-_81399438 | 1.39 |
ENST00000222390.5 |
HGF |
hepatocyte growth factor (hepapoietin A; scatter factor) |
| chr9_-_23821842 | 1.36 |
ENST00000544538.1 |
ELAVL2 |
ELAV like neuron-specific RNA binding protein 2 |
| chr12_-_124457371 | 1.33 |
ENST00000238156.3 ENST00000545037.1 |
CCDC92 |
coiled-coil domain containing 92 |
| chr6_+_132129151 | 1.32 |
ENST00000360971.2 |
ENPP1 |
ectonucleotide pyrophosphatase/phosphodiesterase 1 |
| chr13_+_113622810 | 1.31 |
ENST00000397030.1 |
MCF2L |
MCF.2 cell line derived transforming sequence-like |
| chr3_-_114866084 | 1.29 |
ENST00000357258.3 |
ZBTB20 |
zinc finger and BTB domain containing 20 |
| chr3_+_8775466 | 1.28 |
ENST00000343849.2 ENST00000397368.2 |
CAV3 |
caveolin 3 |
| chr16_+_30387141 | 1.24 |
ENST00000566955.1 |
MYLPF |
myosin light chain, phosphorylatable, fast skeletal muscle |
| chr5_-_73937244 | 1.22 |
ENST00000302351.4 ENST00000510316.1 ENST00000508331.1 |
ENC1 |
ectodermal-neural cortex 1 (with BTB domain) |
| chr2_+_66662690 | 1.20 |
ENST00000488550.1 |
MEIS1 |
Meis homeobox 1 |
| chr8_+_24772455 | 1.18 |
ENST00000433454.2 |
NEFM |
neurofilament, medium polypeptide |
| chr12_-_56121612 | 1.17 |
ENST00000546939.1 |
CD63 |
CD63 molecule |
| chr2_+_66662510 | 1.15 |
ENST00000272369.9 ENST00000407092.2 |
MEIS1 |
Meis homeobox 1 |
| chr12_-_56121580 | 1.14 |
ENST00000550776.1 |
CD63 |
CD63 molecule |
| chr16_+_57662419 | 1.11 |
ENST00000388812.4 ENST00000538815.1 ENST00000456916.1 ENST00000567154.1 ENST00000388813.5 ENST00000562558.1 ENST00000566271.2 |
GPR56 |
G protein-coupled receptor 56 |
| chr13_-_96705624 | 1.10 |
ENST00000376747.3 ENST00000376712.4 ENST00000397618.3 ENST00000376714.3 |
UGGT2 |
UDP-glucose glycoprotein glucosyltransferase 2 |
| chrX_+_154114635 | 1.10 |
ENST00000369446.2 |
F8A1 |
coagulation factor VIII-associated 1 |
| chr1_-_229569834 | 1.09 |
ENST00000366684.3 ENST00000366683.2 |
ACTA1 |
actin, alpha 1, skeletal muscle |
| chr12_+_57522258 | 1.08 |
ENST00000553277.1 ENST00000243077.3 |
LRP1 |
low density lipoprotein receptor-related protein 1 |
| chr11_-_65325430 | 1.06 |
ENST00000322147.4 |
LTBP3 |
latent transforming growth factor beta binding protein 3 |
| chr5_-_176923846 | 1.04 |
ENST00000506537.1 |
PDLIM7 |
PDZ and LIM domain 7 (enigma) |
| chr7_-_81399411 | 1.04 |
ENST00000423064.2 |
HGF |
hepatocyte growth factor (hepapoietin A; scatter factor) |
| chr16_+_57662138 | 1.03 |
ENST00000562414.1 ENST00000561969.1 ENST00000562631.1 ENST00000563445.1 ENST00000565338.1 ENST00000567702.1 |
GPR56 |
G protein-coupled receptor 56 |
| chr5_-_176923803 | 1.03 |
ENST00000506161.1 |
PDLIM7 |
PDZ and LIM domain 7 (enigma) |
| chr2_-_37899323 | 1.02 |
ENST00000295324.3 ENST00000457889.1 |
CDC42EP3 |
CDC42 effector protein (Rho GTPase binding) 3 |
| chr22_-_39640756 | 1.00 |
ENST00000331163.6 |
PDGFB |
platelet-derived growth factor beta polypeptide |
| chr2_+_109237717 | 1.00 |
ENST00000409441.1 |
LIMS1 |
LIM and senescent cell antigen-like domains 1 |
| chr1_-_243418621 | 0.96 |
ENST00000366544.1 ENST00000366543.1 |
CEP170 |
centrosomal protein 170kDa |
| chr14_+_73704201 | 0.95 |
ENST00000340738.5 ENST00000427855.1 ENST00000381166.3 |
PAPLN |
papilin, proteoglycan-like sulfated glycoprotein |
| chr19_+_36606354 | 0.93 |
ENST00000589996.1 ENST00000591296.1 |
TBCB |
tubulin folding cofactor B |
| chr17_-_48474828 | 0.88 |
ENST00000576448.1 ENST00000225972.7 |
LRRC59 |
leucine rich repeat containing 59 |
| chr11_+_71938925 | 0.88 |
ENST00000538751.1 |
INPPL1 |
inositol polyphosphate phosphatase-like 1 |
| chr1_-_151345159 | 0.88 |
ENST00000458566.1 ENST00000447402.3 ENST00000426705.2 ENST00000435071.1 ENST00000368868.5 |
SELENBP1 |
selenium binding protein 1 |
| chrX_-_13956737 | 0.87 |
ENST00000454189.2 |
GPM6B |
glycoprotein M6B |
| chr6_+_39760783 | 0.87 |
ENST00000398904.2 ENST00000538976.1 |
DAAM2 |
dishevelled associated activator of morphogenesis 2 |
| chrX_+_154611749 | 0.87 |
ENST00000369505.3 |
F8A2 |
coagulation factor VIII-associated 2 |
| chr8_+_120428546 | 0.85 |
ENST00000259526.3 |
NOV |
nephroblastoma overexpressed |
| chr17_+_42429493 | 0.85 |
ENST00000586242.1 |
GRN |
granulin |
| chr11_-_66313699 | 0.84 |
ENST00000526986.1 ENST00000310442.3 |
ZDHHC24 |
zinc finger, DHHC-type containing 24 |
| chr20_-_34025999 | 0.83 |
ENST00000374369.3 |
GDF5 |
growth differentiation factor 5 |
| chr2_-_219151487 | 0.83 |
ENST00000444881.1 |
TMBIM1 |
transmembrane BAX inhibitor motif containing 1 |
| chr15_+_71228826 | 0.83 |
ENST00000558456.1 ENST00000560158.2 ENST00000558808.1 ENST00000559806.1 ENST00000559069.1 |
LRRC49 |
leucine rich repeat containing 49 |
| chr16_+_57653854 | 0.81 |
ENST00000568908.1 ENST00000568909.1 ENST00000566778.1 ENST00000561988.1 |
GPR56 |
G protein-coupled receptor 56 |
| chr2_-_47142884 | 0.79 |
ENST00000409105.1 ENST00000409973.1 ENST00000409913.1 ENST00000319466.4 |
MCFD2 |
multiple coagulation factor deficiency 2 |
| chr14_-_50999307 | 0.79 |
ENST00000013125.4 |
MAP4K5 |
mitogen-activated protein kinase kinase kinase kinase 5 |
| chr5_-_114880533 | 0.77 |
ENST00000274457.3 |
FEM1C |
fem-1 homolog c (C. elegans) |
| chr17_-_42277203 | 0.75 |
ENST00000587097.1 |
ATXN7L3 |
ataxin 7-like 3 |
| chr14_-_50999190 | 0.74 |
ENST00000557390.1 |
MAP4K5 |
mitogen-activated protein kinase kinase kinase kinase 5 |
| chr1_+_110453203 | 0.73 |
ENST00000357302.4 ENST00000344188.5 ENST00000329608.6 |
CSF1 |
colony stimulating factor 1 (macrophage) |
| chr11_+_27062502 | 0.73 |
ENST00000263182.3 |
BBOX1 |
butyrobetaine (gamma), 2-oxoglutarate dioxygenase (gamma-butyrobetaine hydroxylase) 1 |
| chr4_-_110723335 | 0.72 |
ENST00000394634.2 |
CFI |
complement factor I |
| chr19_+_4304632 | 0.72 |
ENST00000597590.1 |
FSD1 |
fibronectin type III and SPRY domain containing 1 |
| chr1_-_115300579 | 0.72 |
ENST00000358528.4 ENST00000525132.1 |
CSDE1 |
cold shock domain containing E1, RNA-binding |
| chr8_+_22022653 | 0.71 |
ENST00000354870.5 ENST00000397816.3 ENST00000306349.8 |
BMP1 |
bone morphogenetic protein 1 |
| chr1_+_64059332 | 0.70 |
ENST00000540265.1 |
PGM1 |
phosphoglucomutase 1 |
| chr4_-_120549163 | 0.70 |
ENST00000394439.1 ENST00000420633.1 |
PDE5A |
phosphodiesterase 5A, cGMP-specific |
| chr4_-_110723194 | 0.68 |
ENST00000394635.3 |
CFI |
complement factor I |
| chr4_-_110723134 | 0.67 |
ENST00000510800.1 ENST00000512148.1 |
CFI |
complement factor I |
| chr15_-_59665062 | 0.66 |
ENST00000288235.4 |
MYO1E |
myosin IE |
| chr7_-_81399355 | 0.65 |
ENST00000457544.2 |
HGF |
hepatocyte growth factor (hepapoietin A; scatter factor) |
| chr19_+_45312347 | 0.65 |
ENST00000270233.6 ENST00000591520.1 |
BCAM |
basal cell adhesion molecule (Lutheran blood group) |
| chr8_+_98881268 | 0.64 |
ENST00000254898.5 ENST00000524308.1 ENST00000522025.2 |
MATN2 |
matrilin 2 |
| chr22_+_41763274 | 0.63 |
ENST00000406644.3 |
TEF |
thyrotrophic embryonic factor |
| chr20_+_43343517 | 0.62 |
ENST00000372865.4 |
WISP2 |
WNT1 inducible signaling pathway protein 2 |
| chr1_-_113247543 | 0.61 |
ENST00000414971.1 ENST00000534717.1 |
RHOC |
ras homolog family member C |
| chr17_+_57642886 | 0.61 |
ENST00000251241.4 ENST00000451169.2 ENST00000425628.3 ENST00000584385.1 ENST00000580030.1 |
DHX40 |
DEAH (Asp-Glu-Ala-His) box polypeptide 40 |
| chr5_+_150020214 | 0.60 |
ENST00000307662.4 |
SYNPO |
synaptopodin |
| chr20_+_43343886 | 0.59 |
ENST00000190983.4 |
WISP2 |
WNT1 inducible signaling pathway protein 2 |
| chr11_+_1244288 | 0.59 |
ENST00000529681.1 ENST00000447027.1 |
MUC5B |
mucin 5B, oligomeric mucus/gel-forming |
| chr8_-_82395461 | 0.58 |
ENST00000256104.4 |
FABP4 |
fatty acid binding protein 4, adipocyte |
| chr18_-_52989217 | 0.57 |
ENST00000570287.2 |
TCF4 |
transcription factor 4 |
| chr3_-_58613323 | 0.57 |
ENST00000474531.1 ENST00000465970.1 |
FAM107A |
family with sequence similarity 107, member A |
| chr1_-_32169761 | 0.57 |
ENST00000271069.6 |
COL16A1 |
collagen, type XVI, alpha 1 |
| chr20_+_43343476 | 0.57 |
ENST00000372868.2 |
WISP2 |
WNT1 inducible signaling pathway protein 2 |
| chr19_-_36247910 | 0.57 |
ENST00000587965.1 ENST00000004982.3 |
HSPB6 |
heat shock protein, alpha-crystallin-related, B6 |
| chr2_-_47143160 | 0.55 |
ENST00000409800.1 ENST00000409218.1 |
MCFD2 |
multiple coagulation factor deficiency 2 |
| chrX_+_153770421 | 0.55 |
ENST00000369609.5 ENST00000369607.1 |
IKBKG |
inhibitor of kappa light polypeptide gene enhancer in B-cells, kinase gamma |
| chr1_-_32169920 | 0.54 |
ENST00000373672.3 ENST00000373668.3 |
COL16A1 |
collagen, type XVI, alpha 1 |
| chr22_-_37213554 | 0.54 |
ENST00000443735.1 |
PVALB |
parvalbumin |
| chrX_+_46937745 | 0.54 |
ENST00000397180.1 ENST00000457380.1 ENST00000352078.4 |
RGN |
regucalcin |
| chr11_+_74862140 | 0.54 |
ENST00000525650.1 ENST00000454962.2 |
SLCO2B1 |
solute carrier organic anion transporter family, member 2B1 |
| chr18_+_33877654 | 0.52 |
ENST00000257209.4 ENST00000445677.1 ENST00000590592.1 ENST00000359247.4 |
FHOD3 |
formin homology 2 domain containing 3 |
| chr1_-_243418344 | 0.52 |
ENST00000366542.1 |
CEP170 |
centrosomal protein 170kDa |
| chr17_+_27369918 | 0.52 |
ENST00000323372.4 |
PIPOX |
pipecolic acid oxidase |
| chrX_+_2746850 | 0.52 |
ENST00000381163.3 ENST00000338623.5 ENST00000542787.1 |
GYG2 |
glycogenin 2 |
| chr1_-_115300592 | 0.52 |
ENST00000261443.5 ENST00000534699.1 ENST00000339438.6 ENST00000529046.1 ENST00000525970.1 ENST00000369530.1 ENST00000530886.1 |
CSDE1 |
cold shock domain containing E1, RNA-binding |
| chr9_-_132515302 | 0.51 |
ENST00000340607.4 |
PTGES |
prostaglandin E synthase |
| chr3_-_98620500 | 0.50 |
ENST00000326840.6 |
DCBLD2 |
discoidin, CUB and LCCL domain containing 2 |
| chr3_+_9791731 | 0.50 |
ENST00000449570.2 ENST00000302008.8 ENST00000383826.5 |
OGG1 |
8-oxoguanine DNA glycosylase |
| chr1_+_101185290 | 0.49 |
ENST00000370119.4 ENST00000347652.2 ENST00000294728.2 ENST00000370115.1 |
VCAM1 |
vascular cell adhesion molecule 1 |
| chr22_-_30960876 | 0.47 |
ENST00000401975.1 ENST00000428682.1 ENST00000423299.1 |
GAL3ST1 |
galactose-3-O-sulfotransferase 1 |
| chr16_-_2264779 | 0.47 |
ENST00000333503.7 |
PGP |
phosphoglycolate phosphatase |
| chr18_-_52989525 | 0.45 |
ENST00000457482.3 |
TCF4 |
transcription factor 4 |
| chr3_-_12200851 | 0.45 |
ENST00000287814.4 |
TIMP4 |
TIMP metallopeptidase inhibitor 4 |
| chr6_-_28321971 | 0.44 |
ENST00000396838.2 ENST00000426434.1 ENST00000434036.1 ENST00000439628.1 |
ZSCAN31 |
zinc finger and SCAN domain containing 31 |
| chr2_+_185463093 | 0.44 |
ENST00000302277.6 |
ZNF804A |
zinc finger protein 804A |
| chr11_-_63536113 | 0.44 |
ENST00000433688.1 ENST00000546282.2 |
C11orf95 RP11-466C23.4 |
chromosome 11 open reading frame 95 RP11-466C23.4 |
| chrX_-_54522558 | 0.43 |
ENST00000375135.3 |
FGD1 |
FYVE, RhoGEF and PH domain containing 1 |
| chr1_-_231114542 | 0.43 |
ENST00000522821.1 ENST00000366661.4 ENST00000366662.4 ENST00000414259.1 ENST00000522399.1 |
TTC13 |
tetratricopeptide repeat domain 13 |
| chr3_-_155572164 | 0.41 |
ENST00000392845.3 ENST00000359479.3 |
SLC33A1 |
solute carrier family 33 (acetyl-CoA transporter), member 1 |
| chr19_+_42788172 | 0.40 |
ENST00000160740.3 |
CIC |
capicua transcriptional repressor |
| chr2_+_10442993 | 0.40 |
ENST00000423674.1 ENST00000307845.3 |
HPCAL1 |
hippocalcin-like 1 |
| chr7_+_75931861 | 0.40 |
ENST00000248553.6 |
HSPB1 |
heat shock 27kDa protein 1 |
| chr1_+_110453462 | 0.39 |
ENST00000488198.1 |
CSF1 |
colony stimulating factor 1 (macrophage) |
| chr9_+_34646651 | 0.38 |
ENST00000378842.3 |
GALT |
galactose-1-phosphate uridylyltransferase |
| chr9_+_34646624 | 0.38 |
ENST00000450095.2 ENST00000556278.1 |
GALT GALT |
galactose-1-phosphate uridylyltransferase Uncharacterized protein |
| chr1_+_172422026 | 0.37 |
ENST00000367725.4 |
C1orf105 |
chromosome 1 open reading frame 105 |
| chr17_+_48503603 | 0.37 |
ENST00000502667.1 |
ACSF2 |
acyl-CoA synthetase family member 2 |
Gene Ontology Analysis
Gene overrepresentation in biological_process category:
| Log-likelihood per target | Total log-likelihood | Term | Description |
|---|---|---|---|
| 4.0 | 11.9 | GO:1903609 | negative regulation of peptidyl-tyrosine autophosphorylation(GO:1900085) negative regulation of inward rectifier potassium channel activity(GO:1903609) |
| 2.5 | 15.1 | GO:0061518 | macrophage proliferation(GO:0061517) microglial cell proliferation(GO:0061518) regulation of neuronal signal transduction(GO:1902847) positive regulation of neurofibrillary tangle assembly(GO:1902998) |
| 2.2 | 6.5 | GO:0001300 | chronological cell aging(GO:0001300) |
| 1.5 | 9.1 | GO:0061343 | cell adhesion involved in heart morphogenesis(GO:0061343) |
| 1.5 | 4.5 | GO:2000685 | mesodermal-endodermal cell signaling(GO:0003131) programmed DNA elimination(GO:0031049) chromosome breakage(GO:0031052) histone H2A-S139 phosphorylation(GO:0035978) positive regulation of cellular response to X-ray(GO:2000685) |
| 1.4 | 6.9 | GO:0048539 | bone marrow development(GO:0048539) |
| 1.3 | 3.8 | GO:0033241 | regulation of cellular amine catabolic process(GO:0033241) negative regulation of cellular amine catabolic process(GO:0033242) negative regulation of the force of heart contraction(GO:0098736) regulation of arginine catabolic process(GO:1900081) negative regulation of arginine catabolic process(GO:1900082) regulation of citrulline biosynthetic process(GO:1903248) negative regulation of citrulline biosynthetic process(GO:1903249) negative regulation of cellular amino acid biosynthetic process(GO:2000283) |
| 1.1 | 3.2 | GO:1904204 | regulation of skeletal muscle hypertrophy(GO:1904204) |
| 1.0 | 2.9 | GO:2000523 | regulation of T cell costimulation(GO:2000523) positive regulation of T cell costimulation(GO:2000525) |
| 1.0 | 2.9 | GO:2000364 | response to prolactin(GO:1990637) regulation of STAT protein import into nucleus(GO:2000364) positive regulation of STAT protein import into nucleus(GO:2000366) |
| 0.8 | 3.9 | GO:0035105 | sterol regulatory element binding protein import into nucleus(GO:0035105) |
| 0.8 | 2.3 | GO:2000661 | positive regulation of interleukin-1-mediated signaling pathway(GO:2000661) |
| 0.7 | 7.7 | GO:0060020 | Bergmann glial cell differentiation(GO:0060020) |
| 0.7 | 4.2 | GO:0090131 | mesenchyme migration(GO:0090131) |
| 0.7 | 5.5 | GO:0060665 | regulation of branching involved in salivary gland morphogenesis by mesenchymal-epithelial signaling(GO:0060665) |
| 0.6 | 16.9 | GO:0031639 | plasminogen activation(GO:0031639) |
| 0.6 | 2.5 | GO:1902460 | regulation of mesenchymal stem cell proliferation(GO:1902460) positive regulation of mesenchymal stem cell proliferation(GO:1902462) |
| 0.6 | 1.8 | GO:2000393 | negative regulation of lamellipodium morphogenesis(GO:2000393) |
| 0.5 | 9.9 | GO:0007021 | tubulin complex assembly(GO:0007021) |
| 0.5 | 2.7 | GO:0044858 | plasma membrane raft distribution(GO:0044855) plasma membrane raft localization(GO:0044856) plasma membrane raft polarization(GO:0044858) regulation of plasma membrane raft polarization(GO:1903906) |
| 0.5 | 3.7 | GO:0043152 | induction of bacterial agglutination(GO:0043152) |
| 0.5 | 10.5 | GO:0032060 | bleb assembly(GO:0032060) |
| 0.5 | 2.1 | GO:0032972 | diaphragm contraction(GO:0002086) regulation of muscle filament sliding speed(GO:0032972) |
| 0.5 | 6.5 | GO:0035826 | rubidium ion transport(GO:0035826) regulation of rubidium ion transport(GO:2000680) |
| 0.5 | 2.4 | GO:0032487 | regulation of Rap protein signal transduction(GO:0032487) |
| 0.5 | 5.0 | GO:0001886 | endothelial cell morphogenesis(GO:0001886) |
| 0.4 | 2.8 | GO:2000795 | trigeminal sensory nucleus development(GO:0021730) principal sensory nucleus of trigeminal nerve development(GO:0021740) negative regulation of epithelial cell proliferation involved in lung morphogenesis(GO:2000795) |
| 0.4 | 1.2 | GO:0033693 | neurofilament bundle assembly(GO:0033693) |
| 0.4 | 1.1 | GO:0097359 | UDP-glucosylation(GO:0097359) |
| 0.4 | 1.1 | GO:1905167 | positive regulation of lysosomal protein catabolic process(GO:1905167) |
| 0.4 | 4.3 | GO:0033631 | cell-cell adhesion mediated by integrin(GO:0033631) |
| 0.3 | 1.0 | GO:1905064 | positive regulation of metanephric mesenchymal cell migration by platelet-derived growth factor receptor-beta signaling pathway(GO:0035793) phenotypic switching(GO:0036166) negative regulation of phospholipid biosynthetic process(GO:0071072) regulation of metanephric mesenchymal cell migration by platelet-derived growth factor receptor-beta signaling pathway(GO:1900238) regulation of phenotypic switching(GO:1900239) negative regulation of vascular smooth muscle cell differentiation(GO:1905064) positive regulation of metanephric mesenchymal cell migration(GO:2000591) |
| 0.3 | 1.3 | GO:0035995 | detection of muscle stretch(GO:0035995) |
| 0.3 | 1.5 | GO:1904141 | positive regulation of odontogenesis of dentin-containing tooth(GO:0042488) mammary gland fat development(GO:0060611) positive regulation of macrophage colony-stimulating factor signaling pathway(GO:1902228) positive regulation of response to macrophage colony-stimulating factor(GO:1903971) positive regulation of cellular response to macrophage colony-stimulating factor stimulus(GO:1903974) positive regulation of microglial cell migration(GO:1904141) |
| 0.3 | 0.8 | GO:1990523 | bone regeneration(GO:1990523) |
| 0.3 | 2.7 | GO:0090050 | positive regulation of cell migration involved in sprouting angiogenesis(GO:0090050) |
| 0.3 | 0.8 | GO:0006258 | UDP-glucose catabolic process(GO:0006258) galactose catabolic process via UDP-galactose(GO:0033499) |
| 0.2 | 1.0 | GO:0043932 | ossification involved in bone remodeling(GO:0043932) |
| 0.2 | 3.4 | GO:0001542 | ovulation from ovarian follicle(GO:0001542) |
| 0.2 | 3.6 | GO:0019371 | cyclooxygenase pathway(GO:0019371) |
| 0.2 | 0.8 | GO:1902044 | regulation of Fas signaling pathway(GO:1902044) |
| 0.2 | 2.8 | GO:1900119 | positive regulation of execution phase of apoptosis(GO:1900119) |
| 0.2 | 1.3 | GO:0072502 | cellular phosphate ion homeostasis(GO:0030643) cellular trivalent inorganic anion homeostasis(GO:0072502) |
| 0.2 | 1.1 | GO:0070966 | nuclear-transcribed mRNA catabolic process, no-go decay(GO:0070966) |
| 0.2 | 2.2 | GO:0015074 | DNA integration(GO:0015074) |
| 0.2 | 3.7 | GO:0032012 | regulation of ARF protein signal transduction(GO:0032012) |
| 0.2 | 0.5 | GO:0019853 | L-ascorbic acid biosynthetic process(GO:0019853) negative regulation of DNA catabolic process(GO:1903625) regulation of aminoacyl-tRNA ligase activity(GO:1903630) |
| 0.2 | 0.7 | GO:0060282 | positive regulation of oocyte development(GO:0060282) |
| 0.2 | 0.5 | GO:0046440 | L-lysine catabolic process to acetyl-CoA(GO:0019474) L-lysine catabolic process(GO:0019477) L-lysine metabolic process(GO:0046440) |
| 0.2 | 0.5 | GO:0036079 | GDP-fucose transport(GO:0015783) purine nucleotide-sugar transport(GO:0036079) |
| 0.2 | 0.6 | GO:0072180 | mesonephric duct morphogenesis(GO:0072180) |
| 0.2 | 3.1 | GO:0006853 | carnitine shuttle(GO:0006853) |
| 0.1 | 2.8 | GO:0032780 | negative regulation of ATPase activity(GO:0032780) |
| 0.1 | 2.4 | GO:0060044 | negative regulation of cardiac muscle cell proliferation(GO:0060044) |
| 0.1 | 1.4 | GO:0046185 | aldehyde catabolic process(GO:0046185) |
| 0.1 | 3.5 | GO:0060445 | branching involved in salivary gland morphogenesis(GO:0060445) |
| 0.1 | 2.6 | GO:0043568 | positive regulation of insulin-like growth factor receptor signaling pathway(GO:0043568) |
| 0.1 | 1.2 | GO:0010499 | proteasomal ubiquitin-independent protein catabolic process(GO:0010499) |
| 0.1 | 0.3 | GO:0035606 | peptidyl-cysteine S-trans-nitrosylation(GO:0035606) |
| 0.1 | 0.8 | GO:0045007 | depurination(GO:0045007) |
| 0.1 | 7.9 | GO:0030574 | collagen catabolic process(GO:0030574) |
| 0.1 | 14.9 | GO:0007229 | integrin-mediated signaling pathway(GO:0007229) |
| 0.1 | 0.6 | GO:1902766 | skeletal muscle satellite cell migration(GO:1902766) |
| 0.1 | 1.4 | GO:0060907 | positive regulation of macrophage cytokine production(GO:0060907) |
| 0.1 | 0.4 | GO:0099640 | positive regulation of endothelial cell chemotaxis by VEGF-activated vascular endothelial growth factor receptor signaling pathway(GO:0038033) axo-dendritic protein transport(GO:0099640) |
| 0.1 | 0.5 | GO:0022614 | membrane to membrane docking(GO:0022614) |
| 0.1 | 0.7 | GO:0035166 | post-embryonic hemopoiesis(GO:0035166) |
| 0.1 | 0.4 | GO:0051045 | negative regulation of membrane protein ectodomain proteolysis(GO:0051045) |
| 0.1 | 0.9 | GO:0051611 | negative regulation of neurotransmitter uptake(GO:0051581) serotonin uptake(GO:0051610) regulation of serotonin uptake(GO:0051611) negative regulation of serotonin uptake(GO:0051612) |
| 0.1 | 0.6 | GO:0099563 | modification of synaptic structure(GO:0099563) |
| 0.1 | 1.0 | GO:0031274 | positive regulation of pseudopodium assembly(GO:0031274) |
| 0.1 | 0.4 | GO:0051182 | coenzyme transport(GO:0051182) |
| 0.1 | 0.2 | GO:0009407 | toxin catabolic process(GO:0009407) secondary metabolite catabolic process(GO:0090487) |
| 0.1 | 0.4 | GO:0071918 | urea transmembrane transport(GO:0071918) |
| 0.1 | 0.3 | GO:2000320 | negative regulation of T-helper 17 type immune response(GO:2000317) negative regulation of T-helper 17 cell differentiation(GO:2000320) |
| 0.1 | 0.7 | GO:0045329 | carnitine biosynthetic process(GO:0045329) |
| 0.1 | 0.3 | GO:0042986 | positive regulation of amyloid precursor protein biosynthetic process(GO:0042986) |
| 0.1 | 0.7 | GO:0019388 | galactose catabolic process(GO:0019388) |
| 0.1 | 1.5 | GO:0000185 | activation of MAPKKK activity(GO:0000185) |
| 0.1 | 2.1 | GO:0006509 | membrane protein ectodomain proteolysis(GO:0006509) |
| 0.1 | 0.6 | GO:0007160 | cell-matrix adhesion(GO:0007160) |
| 0.1 | 6.4 | GO:0030282 | bone mineralization(GO:0030282) |
| 0.1 | 2.6 | GO:0050819 | negative regulation of coagulation(GO:0050819) |
| 0.1 | 0.5 | GO:0006682 | galactosylceramide biosynthetic process(GO:0006682) galactolipid biosynthetic process(GO:0019375) |
| 0.1 | 0.3 | GO:0042866 | pyruvate biosynthetic process(GO:0042866) |
| 0.0 | 0.4 | GO:0001661 | conditioned taste aversion(GO:0001661) |
| 0.0 | 1.1 | GO:0051894 | positive regulation of focal adhesion assembly(GO:0051894) |
| 0.0 | 0.9 | GO:0001958 | endochondral ossification(GO:0001958) replacement ossification(GO:0036075) |
| 0.0 | 0.6 | GO:0071285 | cellular response to lithium ion(GO:0071285) |
| 0.0 | 0.5 | GO:2000427 | positive regulation of apoptotic cell clearance(GO:2000427) |
| 0.0 | 1.9 | GO:0048512 | circadian behavior(GO:0048512) |
| 0.0 | 0.5 | GO:0055003 | cardiac myofibril assembly(GO:0055003) |
| 0.0 | 0.1 | GO:0019605 | benzoate metabolic process(GO:0018874) butyrate metabolic process(GO:0019605) |
| 0.0 | 2.0 | GO:0045669 | positive regulation of osteoblast differentiation(GO:0045669) |
| 0.0 | 0.1 | GO:0006114 | glycerol biosynthetic process(GO:0006114) |
| 0.0 | 0.2 | GO:0034165 | positive regulation of toll-like receptor 9 signaling pathway(GO:0034165) |
| 0.0 | 1.5 | GO:0048747 | muscle fiber development(GO:0048747) |
| 0.0 | 1.3 | GO:0032728 | positive regulation of interferon-beta production(GO:0032728) |
| 0.0 | 0.3 | GO:0030321 | transepithelial chloride transport(GO:0030321) |
| 0.0 | 0.1 | GO:1902715 | positive regulation of interferon-gamma secretion(GO:1902715) |
| 0.0 | 1.2 | GO:0060548 | negative regulation of cell death(GO:0060548) |
| 0.0 | 3.5 | GO:0043542 | endothelial cell migration(GO:0043542) |
| 0.0 | 1.9 | GO:0043647 | inositol phosphate metabolic process(GO:0043647) |
| 0.0 | 0.6 | GO:0010667 | negative regulation of cardiac muscle cell apoptotic process(GO:0010667) |
| 0.0 | 0.2 | GO:0038203 | TORC2 signaling(GO:0038203) |
| 0.0 | 0.7 | GO:0043276 | anoikis(GO:0043276) |
| 0.0 | 0.3 | GO:0001711 | endodermal cell fate commitment(GO:0001711) |
| 0.0 | 0.6 | GO:0043488 | regulation of mRNA stability(GO:0043488) |
| 0.0 | 0.1 | GO:0042126 | nitrate metabolic process(GO:0042126) |
| 0.0 | 0.9 | GO:0018279 | protein N-linked glycosylation via asparagine(GO:0018279) |
| 0.0 | 0.3 | GO:0071340 | skeletal muscle acetylcholine-gated channel clustering(GO:0071340) |
| 0.0 | 0.6 | GO:0031102 | neuron projection regeneration(GO:0031102) |
| 0.0 | 2.2 | GO:0010977 | negative regulation of neuron projection development(GO:0010977) |
| 0.0 | 2.2 | GO:0090090 | negative regulation of canonical Wnt signaling pathway(GO:0090090) |
| 0.0 | 1.5 | GO:1900034 | regulation of cellular response to heat(GO:1900034) |
| 0.0 | 0.6 | GO:0016266 | O-glycan processing(GO:0016266) |
| 0.0 | 0.3 | GO:0007520 | myoblast fusion(GO:0007520) |
| 0.0 | 0.1 | GO:0042276 | error-prone translesion synthesis(GO:0042276) |
| 0.0 | 0.6 | GO:0005978 | glycogen biosynthetic process(GO:0005978) glucan biosynthetic process(GO:0009250) |
| 0.0 | 0.3 | GO:0006884 | cell volume homeostasis(GO:0006884) |
| 0.0 | 1.3 | GO:0030449 | regulation of complement activation(GO:0030449) |
| 0.0 | 0.0 | GO:0048009 | regulation of insulin-like growth factor receptor signaling pathway(GO:0043567) insulin-like growth factor receptor signaling pathway(GO:0048009) |
| 0.0 | 1.2 | GO:0007519 | skeletal muscle tissue development(GO:0007519) |
| 0.0 | 0.1 | GO:0006621 | protein retention in ER lumen(GO:0006621) |
Gene overrepresentation in molecular_function category:
| Log-likelihood per target | Total log-likelihood | Term | Description |
|---|---|---|---|
| 4.0 | 11.9 | GO:0070320 | inward rectifier potassium channel inhibitor activity(GO:0070320) |
| 1.5 | 4.5 | GO:0035501 | MH1 domain binding(GO:0035501) |
| 1.3 | 7.7 | GO:1990254 | keratin filament binding(GO:1990254) |
| 1.3 | 3.8 | GO:0036487 | nitric-oxide synthase inhibitor activity(GO:0036487) |
| 0.9 | 6.4 | GO:0030021 | extracellular matrix structural constituent conferring compression resistance(GO:0030021) structural constituent of tooth enamel(GO:0030345) |
| 0.8 | 6.5 | GO:0005534 | galactose binding(GO:0005534) |
| 0.8 | 3.1 | GO:0004667 | prostaglandin-D synthase activity(GO:0004667) |
| 0.7 | 14.9 | GO:0051787 | misfolded protein binding(GO:0051787) |
| 0.7 | 8.2 | GO:0031995 | insulin-like growth factor II binding(GO:0031995) |
| 0.7 | 2.1 | GO:0008798 | beta-aspartyl-peptidase activity(GO:0008798) |
| 0.6 | 2.3 | GO:0004909 | interleukin-1, Type I, activating receptor activity(GO:0004909) |
| 0.6 | 9.1 | GO:0045499 | chemorepellent activity(GO:0045499) |
| 0.4 | 1.3 | GO:0035529 | NADH pyrophosphatase activity(GO:0035529) |
| 0.4 | 3.4 | GO:0044323 | retinoic acid-responsive element binding(GO:0044323) |
| 0.4 | 4.2 | GO:0043184 | vascular endothelial growth factor receptor 2 binding(GO:0043184) |
| 0.4 | 10.4 | GO:0005212 | structural constituent of eye lens(GO:0005212) |
| 0.4 | 1.1 | GO:0003980 | UDP-glucose:glycoprotein glucosyltransferase activity(GO:0003980) |
| 0.3 | 2.8 | GO:0005138 | interleukin-6 receptor binding(GO:0005138) |
| 0.3 | 3.1 | GO:0008607 | phosphorylase kinase regulator activity(GO:0008607) |
| 0.3 | 1.1 | GO:0042954 | apolipoprotein receptor activity(GO:0030226) lipoprotein transporter activity(GO:0042954) |
| 0.2 | 1.5 | GO:0005157 | macrophage colony-stimulating factor receptor binding(GO:0005157) |
| 0.2 | 2.7 | GO:0045159 | myosin II binding(GO:0045159) |
| 0.2 | 2.5 | GO:0050786 | RAGE receptor binding(GO:0050786) |
| 0.2 | 2.1 | GO:0031013 | troponin I binding(GO:0031013) |
| 0.2 | 1.3 | GO:0071253 | connexin binding(GO:0071253) |
| 0.2 | 0.7 | GO:0008336 | gamma-butyrobetaine dioxygenase activity(GO:0008336) |
| 0.2 | 6.8 | GO:0042056 | chemoattractant activity(GO:0042056) |
| 0.2 | 0.5 | GO:0005457 | GDP-fucose transmembrane transporter activity(GO:0005457) purine nucleotide-sugar transmembrane transporter activity(GO:0036080) |
| 0.2 | 0.5 | GO:0098519 | nucleotide phosphatase activity, acting on free nucleotides(GO:0098519) |
| 0.2 | 0.6 | GO:0060422 | peptidyl-dipeptidase inhibitor activity(GO:0060422) |
| 0.1 | 3.7 | GO:0008329 | signaling pattern recognition receptor activity(GO:0008329) pattern recognition receptor activity(GO:0038187) |
| 0.1 | 0.6 | GO:0008466 | glycogenin glucosyltransferase activity(GO:0008466) |
| 0.1 | 3.7 | GO:0005086 | ARF guanyl-nucleotide exchange factor activity(GO:0005086) |
| 0.1 | 0.4 | GO:0051185 | coenzyme transporter activity(GO:0051185) |
| 0.1 | 0.4 | GO:0008426 | protein kinase C inhibitor activity(GO:0008426) |
| 0.1 | 1.4 | GO:0004030 | aldehyde dehydrogenase [NAD(P)+] activity(GO:0004030) |
| 0.1 | 0.5 | GO:0050220 | prostaglandin-E synthase activity(GO:0050220) |
| 0.1 | 15.7 | GO:0051219 | phosphoprotein binding(GO:0051219) |
| 0.1 | 0.7 | GO:0004614 | phosphoglucomutase activity(GO:0004614) |
| 0.1 | 2.9 | GO:0008191 | metalloendopeptidase inhibitor activity(GO:0008191) |
| 0.1 | 2.6 | GO:0005520 | insulin-like growth factor binding(GO:0005520) |
| 0.1 | 2.8 | GO:0098641 | cadherin binding involved in cell-cell adhesion(GO:0098641) |
| 0.1 | 2.6 | GO:0050431 | transforming growth factor beta binding(GO:0050431) |
| 0.1 | 5.3 | GO:0017112 | Rab guanyl-nucleotide exchange factor activity(GO:0017112) |
| 0.1 | 0.4 | GO:0015265 | urea channel activity(GO:0015265) |
| 0.1 | 0.8 | GO:0036122 | BMP binding(GO:0036122) |
| 0.1 | 0.5 | GO:0016647 | oxidoreductase activity, acting on the CH-NH group of donors, oxygen as acceptor(GO:0016647) |
| 0.1 | 1.5 | GO:0008349 | MAP kinase kinase kinase kinase activity(GO:0008349) |
| 0.1 | 0.8 | GO:0032357 | oxidized purine DNA binding(GO:0032357) |
| 0.1 | 0.3 | GO:0004365 | glyceraldehyde-3-phosphate dehydrogenase (NAD+) (phosphorylating) activity(GO:0004365) aspartic-type endopeptidase inhibitor activity(GO:0019828) glyceraldehyde-3-phosphate dehydrogenase (NAD(P)+) (phosphorylating) activity(GO:0043891) |
| 0.1 | 8.5 | GO:0004867 | serine-type endopeptidase inhibitor activity(GO:0004867) |
| 0.1 | 0.9 | GO:0008430 | selenium binding(GO:0008430) |
| 0.1 | 0.8 | GO:0034485 | phosphatidylinositol-3,4,5-trisphosphate 5-phosphatase activity(GO:0034485) |
| 0.1 | 0.2 | GO:0050610 | oxidoreductase activity, acting on a sulfur group of donors, quinone or similar compound as acceptor(GO:0016672) glutathione dehydrogenase (ascorbate) activity(GO:0045174) methylarsonate reductase activity(GO:0050610) |
| 0.1 | 1.0 | GO:0001011 | transcription factor activity, sequence-specific DNA binding, RNA polymerase recruiting(GO:0001011) transcription factor activity, TFIIB-class binding(GO:0001087) |
| 0.1 | 2.0 | GO:0004435 | phosphatidylinositol phospholipase C activity(GO:0004435) |
| 0.1 | 0.8 | GO:0070569 | uridylyltransferase activity(GO:0070569) |
| 0.1 | 0.5 | GO:0050694 | galactosylceramide sulfotransferase activity(GO:0001733) galactose 3-O-sulfotransferase activity(GO:0050694) |
| 0.1 | 0.3 | GO:0004743 | pyruvate kinase activity(GO:0004743) |
| 0.1 | 0.5 | GO:0008131 | primary amine oxidase activity(GO:0008131) |
| 0.1 | 0.2 | GO:0033878 | hormone-sensitive lipase activity(GO:0033878) |
| 0.1 | 2.2 | GO:0042169 | SH2 domain binding(GO:0042169) |
| 0.1 | 0.6 | GO:0003996 | acyl-CoA ligase activity(GO:0003996) |
| 0.0 | 4.0 | GO:0017022 | myosin binding(GO:0017022) |
| 0.0 | 0.4 | GO:0001849 | complement component C1q binding(GO:0001849) |
| 0.0 | 2.1 | GO:0005044 | scavenger receptor activity(GO:0005044) |
| 0.0 | 1.2 | GO:0030506 | ankyrin binding(GO:0030506) |
| 0.0 | 2.1 | GO:0001102 | RNA polymerase II activating transcription factor binding(GO:0001102) |
| 0.0 | 0.1 | GO:0008940 | nitrate reductase activity(GO:0008940) |
| 0.0 | 0.3 | GO:0022820 | potassium:chloride symporter activity(GO:0015379) potassium ion symporter activity(GO:0022820) |
| 0.0 | 0.5 | GO:0070530 | K63-linked polyubiquitin binding(GO:0070530) |
| 0.0 | 0.8 | GO:0005123 | death receptor binding(GO:0005123) |
| 0.0 | 3.4 | GO:0008201 | heparin binding(GO:0008201) |
| 0.0 | 0.6 | GO:0043236 | laminin binding(GO:0043236) |
| 0.0 | 0.7 | GO:0047555 | 3',5'-cyclic-GMP phosphodiesterase activity(GO:0047555) |
| 0.0 | 2.5 | GO:0019838 | growth factor binding(GO:0019838) |
| 0.0 | 0.3 | GO:0005229 | intracellular calcium activated chloride channel activity(GO:0005229) |
| 0.0 | 0.1 | GO:0008553 | hydrogen-exporting ATPase activity, phosphorylative mechanism(GO:0008553) |
| 0.0 | 0.7 | GO:0000146 | microfilament motor activity(GO:0000146) |
| 0.0 | 0.3 | GO:0033130 | acetylcholine receptor binding(GO:0033130) |
| 0.0 | 1.6 | GO:0003730 | mRNA 3'-UTR binding(GO:0003730) |
| 0.0 | 0.6 | GO:0032813 | tumor necrosis factor receptor superfamily binding(GO:0032813) |
| 0.0 | 0.3 | GO:0000062 | fatty-acyl-CoA binding(GO:0000062) |
| 0.0 | 0.6 | GO:0005504 | fatty acid binding(GO:0005504) |
| 0.0 | 0.2 | GO:0015280 | ligand-gated sodium channel activity(GO:0015280) |
| 0.0 | 1.0 | GO:0030295 | protein kinase activator activity(GO:0030295) |
| 0.0 | 0.3 | GO:0000993 | RNA polymerase II core binding(GO:0000993) |
Gene overrepresentation in cellular_component category:
| Log-likelihood per target | Total log-likelihood | Term | Description |
|---|---|---|---|
| 2.2 | 6.5 | GO:0072563 | endothelial microparticle(GO:0072563) |
| 1.1 | 4.3 | GO:0071062 | alphav-beta3 integrin-vitronectin complex(GO:0071062) |
| 1.0 | 2.1 | GO:1990584 | cardiac Troponin complex(GO:1990584) |
| 1.0 | 16.3 | GO:0097418 | neurofibrillary tangle(GO:0097418) |
| 0.9 | 3.5 | GO:0043259 | laminin-10 complex(GO:0043259) laminin-11 complex(GO:0043260) |
| 0.9 | 11.9 | GO:0034098 | VCP-NPL4-UFD1 AAA ATPase complex(GO:0034098) |
| 0.7 | 2.8 | GO:0005896 | interleukin-6 receptor complex(GO:0005896) |
| 0.6 | 9.9 | GO:0097512 | cardiac myofibril(GO:0097512) |
| 0.6 | 3.1 | GO:0042643 | actomyosin, actin portion(GO:0042643) |
| 0.6 | 7.9 | GO:0098647 | collagen type VI trimer(GO:0005589) collagen beaded filament(GO:0098647) |
| 0.6 | 5.5 | GO:0016942 | insulin-like growth factor binding protein complex(GO:0016942) growth factor complex(GO:0036454) |
| 0.5 | 6.5 | GO:0097487 | multivesicular body, internal vesicle(GO:0097487) |
| 0.4 | 3.9 | GO:0005638 | lamin filament(GO:0005638) |
| 0.4 | 4.1 | GO:0035985 | senescence-associated heterochromatin focus(GO:0035985) |
| 0.2 | 1.5 | GO:1990682 | CSF1-CSF1R complex(GO:1990682) |
| 0.2 | 2.8 | GO:0044300 | cerebellar mossy fiber(GO:0044300) |
| 0.2 | 3.7 | GO:0042589 | zymogen granule membrane(GO:0042589) |
| 0.2 | 2.7 | GO:0030478 | actin cap(GO:0030478) |
| 0.2 | 3.3 | GO:0043220 | Schmidt-Lanterman incisure(GO:0043220) |
| 0.2 | 0.5 | GO:0071065 | alpha9-beta1 integrin-vascular cell adhesion molecule-1 complex(GO:0071065) |
| 0.2 | 3.1 | GO:0031588 | nucleotide-activated protein kinase complex(GO:0031588) |
| 0.1 | 1.1 | GO:0005593 | FACIT collagen trimer(GO:0005593) |
| 0.1 | 1.2 | GO:0070937 | CRD-mediated mRNA stability complex(GO:0070937) |
| 0.1 | 4.9 | GO:0008305 | integrin complex(GO:0008305) |
| 0.1 | 14.9 | GO:0005913 | cell-cell adherens junction(GO:0005913) |
| 0.1 | 3.0 | GO:0097228 | sperm principal piece(GO:0097228) |
| 0.1 | 52.8 | GO:0031012 | extracellular matrix(GO:0031012) |
| 0.1 | 0.5 | GO:0005641 | nuclear envelope lumen(GO:0005641) |
| 0.1 | 8.4 | GO:0032587 | ruffle membrane(GO:0032587) |
| 0.1 | 1.5 | GO:0043034 | costamere(GO:0043034) |
| 0.1 | 2.0 | GO:0005790 | smooth endoplasmic reticulum(GO:0005790) |
| 0.1 | 0.8 | GO:0000124 | SAGA complex(GO:0000124) |
| 0.0 | 0.5 | GO:0008385 | IkappaB kinase complex(GO:0008385) |
| 0.0 | 1.6 | GO:0005865 | striated muscle thin filament(GO:0005865) |
| 0.0 | 0.4 | GO:0035976 | AP1 complex(GO:0035976) |
| 0.0 | 1.9 | GO:0005771 | multivesicular body(GO:0005771) |
| 0.0 | 0.6 | GO:0043186 | P granule(GO:0043186) pole plasm(GO:0045495) germ plasm(GO:0060293) |
| 0.0 | 1.3 | GO:0090665 | dystrophin-associated glycoprotein complex(GO:0016010) glycoprotein complex(GO:0090665) |
| 0.0 | 0.2 | GO:0033596 | TSC1-TSC2 complex(GO:0033596) |
| 0.0 | 3.1 | GO:0031093 | platelet alpha granule lumen(GO:0031093) |
| 0.0 | 1.1 | GO:0044322 | endoplasmic reticulum quality control compartment(GO:0044322) |
| 0.0 | 0.2 | GO:0005854 | nascent polypeptide-associated complex(GO:0005854) |
| 0.0 | 2.1 | GO:0005791 | rough endoplasmic reticulum(GO:0005791) |
| 0.0 | 0.3 | GO:0016593 | Cdc73/Paf1 complex(GO:0016593) |
| 0.0 | 2.2 | GO:0035579 | specific granule membrane(GO:0035579) |
| 0.0 | 1.2 | GO:0031463 | Cul3-RING ubiquitin ligase complex(GO:0031463) |
| 0.0 | 1.2 | GO:0032154 | cleavage furrow(GO:0032154) cell surface furrow(GO:0097610) |
| 0.0 | 1.3 | GO:0012507 | ER to Golgi transport vesicle membrane(GO:0012507) |
| 0.0 | 1.9 | GO:0005814 | centriole(GO:0005814) |
| 0.0 | 0.3 | GO:0001726 | ruffle(GO:0001726) |
| 0.0 | 1.0 | GO:0005811 | lipid particle(GO:0005811) |
| 0.0 | 17.5 | GO:0005615 | extracellular space(GO:0005615) |
| 0.0 | 0.8 | GO:0035578 | azurophil granule lumen(GO:0035578) |
| 0.0 | 0.2 | GO:0031932 | TORC2 complex(GO:0031932) |
| 0.0 | 1.1 | GO:0005905 | clathrin-coated pit(GO:0005905) |
| 0.0 | 0.1 | GO:0042575 | DNA polymerase complex(GO:0042575) |
| 0.0 | 0.6 | GO:0042645 | nucleoid(GO:0009295) mitochondrial nucleoid(GO:0042645) |
| 0.0 | 0.6 | GO:0043202 | lysosomal lumen(GO:0043202) |
| 0.0 | 0.3 | GO:0045334 | clathrin-coated endocytic vesicle(GO:0045334) |
| 0.0 | 0.7 | GO:0043195 | terminal bouton(GO:0043195) |
| 0.0 | 0.9 | GO:0030175 | filopodium(GO:0030175) |
Gene overrepresentation in C2:CP category:
| Log-likelihood per target | Total log-likelihood | Term | Description |
|---|---|---|---|
| 0.4 | 18.5 | PID ALK1 PATHWAY | ALK1 signaling events |
| 0.3 | 9.1 | PID ECADHERIN KERATINOCYTE PATHWAY | E-cadherin signaling in keratinocytes |
| 0.3 | 15.4 | NABA BASEMENT MEMBRANES | Genes encoding structural components of basement membranes |
| 0.3 | 19.2 | PID AMB2 NEUTROPHILS PATHWAY | amb2 Integrin signaling |
| 0.3 | 9.2 | PID INTEGRIN CS PATHWAY | Integrin family cell surface interactions |
| 0.2 | 18.9 | PID P75 NTR PATHWAY | p75(NTR)-mediated signaling |
| 0.2 | 5.5 | PID UPA UPAR PATHWAY | Urokinase-type plasminogen activator (uPA) and uPAR-mediated signaling |
| 0.1 | 7.7 | PID AURORA B PATHWAY | Aurora B signaling |
| 0.1 | 19.5 | NABA ECM GLYCOPROTEINS | Genes encoding structural ECM glycoproteins |
| 0.1 | 13.5 | PID MYC REPRESS PATHWAY | Validated targets of C-MYC transcriptional repression |
| 0.1 | 3.0 | PID AVB3 OPN PATHWAY | Osteopontin-mediated events |
| 0.1 | 4.9 | PID AJDISS 2PATHWAY | Posttranslational regulation of adherens junction stability and dissassembly |
| 0.1 | 0.4 | PID INTEGRIN5 PATHWAY | Beta5 beta6 beta7 and beta8 integrin cell surface interactions |
| 0.1 | 5.2 | PID TAP63 PATHWAY | Validated transcriptional targets of TAp63 isoforms |
| 0.1 | 2.0 | PID IL1 PATHWAY | IL1-mediated signaling events |
| 0.1 | 1.3 | PID PDGFRA PATHWAY | PDGFR-alpha signaling pathway |
| 0.1 | 1.4 | SA MMP CYTOKINE CONNECTION | Cytokines can induce activation of matrix metalloproteinases, which degrade extracellular matrix. |
| 0.0 | 0.9 | SIG CHEMOTAXIS | Genes related to chemotaxis |
| 0.0 | 2.0 | ST G ALPHA I PATHWAY | G alpha i Pathway |
| 0.0 | 1.0 | PID S1P S1P3 PATHWAY | S1P3 pathway |
| 0.0 | 1.1 | NABA COLLAGENS | Genes encoding collagen proteins |
| 0.0 | 1.5 | SIG REGULATION OF THE ACTIN CYTOSKELETON BY RHO GTPASES | Genes related to regulation of the actin cytoskeleton |
| 0.0 | 0.3 | ST JAK STAT PATHWAY | Jak-STAT Pathway |
| 0.0 | 1.5 | PID TNF PATHWAY | TNF receptor signaling pathway |
| 0.0 | 1.8 | PID HNF3A PATHWAY | FOXA1 transcription factor network |
| 0.0 | 1.1 | PID RHOA PATHWAY | RhoA signaling pathway |
| 0.0 | 0.6 | PID AP1 PATHWAY | AP-1 transcription factor network |
| 0.0 | 1.1 | PID RHOA REG PATHWAY | Regulation of RhoA activity |
| 0.0 | 0.0 | PID S1P S1P4 PATHWAY | S1P4 pathway |
| 0.0 | 1.0 | PID ILK PATHWAY | Integrin-linked kinase signaling |
| 0.0 | 0.7 | PID CDC42 REG PATHWAY | Regulation of CDC42 activity |
| 0.0 | 0.3 | PID RET PATHWAY | Signaling events regulated by Ret tyrosine kinase |
| 0.0 | 0.4 | PID P38 MK2 PATHWAY | p38 signaling mediated by MAPKAP kinases |
| 0.0 | 2.6 | NABA ECM REGULATORS | Genes encoding enzymes and their regulators involved in the remodeling of the extracellular matrix |
| 0.0 | 1.0 | PID BETA CATENIN NUC PATHWAY | Regulation of nuclear beta catenin signaling and target gene transcription |
Gene overrepresentation in C2:CP:REACTOME category:
| Log-likelihood per target | Total log-likelihood | Term | Description |
|---|---|---|---|
| 0.4 | 12.7 | REACTOME HORMONE SENSITIVE LIPASE HSL MEDIATED TRIACYLGLYCEROL HYDROLYSIS | Genes involved in Hormone-sensitive lipase (HSL)-mediated triacylglycerol hydrolysis |
| 0.3 | 8.2 | REACTOME REGULATION OF INSULIN LIKE GROWTH FACTOR IGF ACTIVITY BY INSULIN LIKE GROWTH FACTOR BINDING PROTEINS IGFBPS | Genes involved in Regulation of Insulin-like Growth Factor (IGF) Activity by Insulin-like Growth Factor Binding Proteins (IGFBPs) |
| 0.3 | 10.4 | REACTOME CASPASE MEDIATED CLEAVAGE OF CYTOSKELETAL PROTEINS | Genes involved in Caspase-mediated cleavage of cytoskeletal proteins |
| 0.2 | 4.3 | REACTOME IL 7 SIGNALING | Genes involved in Interleukin-7 signaling |
| 0.2 | 3.5 | REACTOME INTEGRIN CELL SURFACE INTERACTIONS | Genes involved in Integrin cell surface interactions |
| 0.2 | 2.8 | REACTOME IL 6 SIGNALING | Genes involved in Interleukin-6 signaling |
| 0.2 | 3.2 | REACTOME REGULATION OF RHEB GTPASE ACTIVITY BY AMPK | Genes involved in Regulation of Rheb GTPase activity by AMPK |
| 0.2 | 13.0 | REACTOME CELL DEATH SIGNALLING VIA NRAGE NRIF AND NADE | Genes involved in Cell death signalling via NRAGE, NRIF and NADE |
| 0.2 | 21.2 | REACTOME RESPONSE TO ELEVATED PLATELET CYTOSOLIC CA2 | Genes involved in Response to elevated platelet cytosolic Ca2+ |
| 0.1 | 24.1 | REACTOME SIGNALING BY PDGF | Genes involved in Signaling by PDGF |
| 0.1 | 2.0 | REACTOME PLC BETA MEDIATED EVENTS | Genes involved in PLC beta mediated events |
| 0.1 | 2.5 | REACTOME CELL EXTRACELLULAR MATRIX INTERACTIONS | Genes involved in Cell-extracellular matrix interactions |
| 0.1 | 2.4 | REACTOME REGULATION OF COMPLEMENT CASCADE | Genes involved in Regulation of Complement cascade |
| 0.1 | 2.4 | REACTOME DEGRADATION OF THE EXTRACELLULAR MATRIX | Genes involved in Degradation of the extracellular matrix |
| 0.1 | 0.4 | REACTOME DESTABILIZATION OF MRNA BY AUF1 HNRNP D0 | Genes involved in Destabilization of mRNA by AUF1 (hnRNP D0) |
| 0.1 | 4.1 | REACTOME SIGNAL TRANSDUCTION BY L1 | Genes involved in Signal transduction by L1 |
| 0.1 | 1.1 | REACTOME CALNEXIN CALRETICULIN CYCLE | Genes involved in Calnexin/calreticulin cycle |
| 0.1 | 0.3 | REACTOME SIGNALING BY NOTCH4 | Genes involved in Signaling by NOTCH4 |
| 0.1 | 3.3 | REACTOME APOPTOTIC CLEAVAGE OF CELLULAR PROTEINS | Genes involved in Apoptotic cleavage of cellular proteins |
| 0.1 | 1.3 | REACTOME GLYCOGEN BREAKDOWN GLYCOGENOLYSIS | Genes involved in Glycogen breakdown (glycogenolysis) |
| 0.1 | 0.5 | REACTOME IRAK1 RECRUITS IKK COMPLEX | Genes involved in IRAK1 recruits IKK complex |
| 0.0 | 1.8 | REACTOME IL1 SIGNALING | Genes involved in Interleukin-1 signaling |
| 0.0 | 1.0 | REACTOME POST CHAPERONIN TUBULIN FOLDING PATHWAY | Genes involved in Post-chaperonin tubulin folding pathway |
| 0.0 | 0.9 | REACTOME IL RECEPTOR SHC SIGNALING | Genes involved in Interleukin receptor SHC signaling |
| 0.0 | 1.1 | REACTOME RNA POL III TRANSCRIPTION TERMINATION | Genes involved in RNA Polymerase III Transcription Termination |
| 0.0 | 0.6 | REACTOME TERMINATION OF O GLYCAN BIOSYNTHESIS | Genes involved in Termination of O-glycan biosynthesis |
| 0.0 | 0.2 | REACTOME TANDEM PORE DOMAIN POTASSIUM CHANNELS | Genes involved in Tandem pore domain potassium channels |
| 0.0 | 0.4 | REACTOME ACTIVATION OF THE AP1 FAMILY OF TRANSCRIPTION FACTORS | Genes involved in Activation of the AP-1 family of transcription factors |
| 0.0 | 1.0 | REACTOME COLLAGEN FORMATION | Genes involved in Collagen formation |
| 0.0 | 1.3 | REACTOME TRANSPORT TO THE GOLGI AND SUBSEQUENT MODIFICATION | Genes involved in Transport to the Golgi and subsequent modification |
| 0.0 | 1.0 | REACTOME MYOGENESIS | Genes involved in Myogenesis |
| 0.0 | 0.7 | REACTOME CGMP EFFECTS | Genes involved in cGMP effects |
| 0.0 | 1.6 | REACTOME NUCLEAR RECEPTOR TRANSCRIPTION PATHWAY | Genes involved in Nuclear Receptor transcription pathway |
| 0.0 | 0.6 | REACTOME HS GAG BIOSYNTHESIS | Genes involved in HS-GAG biosynthesis |
| 0.0 | 0.6 | REACTOME SEMA4D INDUCED CELL MIGRATION AND GROWTH CONE COLLAPSE | Genes involved in Sema4D induced cell migration and growth-cone collapse |
| 0.0 | 1.1 | REACTOME STRIATED MUSCLE CONTRACTION | Genes involved in Striated Muscle Contraction |
| 0.0 | 0.5 | REACTOME AMINE COMPOUND SLC TRANSPORTERS | Genes involved in Amine compound SLC transporters |
| 0.0 | 0.1 | REACTOME TIE2 SIGNALING | Genes involved in Tie2 Signaling |
| 0.0 | 0.5 | REACTOME GLYCOSPHINGOLIPID METABOLISM | Genes involved in Glycosphingolipid metabolism |