Project
ENCODE cell lines, expression (Ernst 2011)
Navigation
Downloads
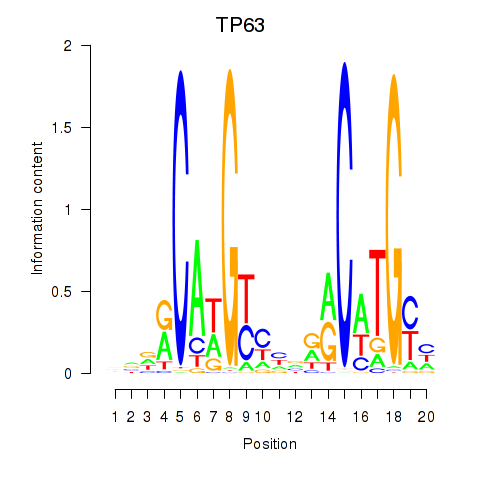
Results for TP63
Z-value: 1.90
Motif logo
Transcription factors associated with TP63
| Gene Symbol | Gene ID | Gene Info |
|---|---|---|
|
TP63
|
ENSG00000073282.8 | TP63 |
Activity-expression correlation:
| Gene | Promoter | Pearson corr. coef. | P-value | Plot |
|---|---|---|---|---|
| TP63 | hg19_v2_chr3_+_189349162_189349305 | 0.71 | 2.3e-03 | Click! |
Activity profile of TP63 motif
Sorted Z-values of TP63 motif
Network of associatons between targets according to the STRING database.

First level regulatory network of TP63
| Promoter | Score | Transcript | Gene | Gene Info |
|---|---|---|---|---|
| chr19_-_51504411 | 7.62 |
ENST00000593490.1 |
KLK8 |
kallikrein-related peptidase 8 |
| chr6_+_121756809 | 7.13 |
ENST00000282561.3 |
GJA1 |
gap junction protein, alpha 1, 43kDa |
| chr12_-_52887034 | 6.95 |
ENST00000330722.6 |
KRT6A |
keratin 6A |
| chr18_+_61143994 | 6.74 |
ENST00000382771.4 |
SERPINB5 |
serpin peptidase inhibitor, clade B (ovalbumin), member 5 |
| chr1_-_209824643 | 6.34 |
ENST00000391911.1 ENST00000415782.1 |
LAMB3 |
laminin, beta 3 |
| chr3_+_122044084 | 6.17 |
ENST00000264474.3 ENST00000479204.1 |
CSTA |
cystatin A (stefin A) |
| chr12_-_52845910 | 6.06 |
ENST00000252252.3 |
KRT6B |
keratin 6B |
| chr2_-_151344172 | 5.37 |
ENST00000375734.2 ENST00000263895.4 ENST00000454202.1 |
RND3 |
Rho family GTPase 3 |
| chr16_+_57653989 | 5.03 |
ENST00000567835.1 ENST00000569372.1 ENST00000563548.1 ENST00000562003.1 |
GPR56 |
G protein-coupled receptor 56 |
| chr1_-_153588334 | 4.99 |
ENST00000476873.1 |
S100A14 |
S100 calcium binding protein A14 |
| chr16_+_57653854 | 4.84 |
ENST00000568908.1 ENST00000568909.1 ENST00000566778.1 ENST00000561988.1 |
GPR56 |
G protein-coupled receptor 56 |
| chr1_+_86889769 | 4.74 |
ENST00000370565.4 |
CLCA2 |
chloride channel accessory 2 |
| chrX_+_152086373 | 3.90 |
ENST00000318529.8 |
ZNF185 |
zinc finger protein 185 (LIM domain) |
| chr12_-_15114603 | 3.79 |
ENST00000228945.4 |
ARHGDIB |
Rho GDP dissociation inhibitor (GDI) beta |
| chr2_+_217524323 | 3.79 |
ENST00000456764.1 |
IGFBP2 |
insulin-like growth factor binding protein 2, 36kDa |
| chr19_-_19051103 | 3.45 |
ENST00000542541.2 ENST00000433218.2 |
HOMER3 |
homer homolog 3 (Drosophila) |
| chr9_+_124088860 | 3.30 |
ENST00000373806.1 |
GSN |
gelsolin |
| chr8_-_49833978 | 3.25 |
ENST00000020945.1 |
SNAI2 |
snail family zinc finger 2 |
| chr10_+_124134201 | 3.02 |
ENST00000368990.3 ENST00000368988.1 ENST00000368989.2 ENST00000463663.2 |
PLEKHA1 |
pleckstrin homology domain containing, family A (phosphoinositide binding specific) member 1 |
| chr1_+_158979792 | 3.01 |
ENST00000359709.3 ENST00000430894.2 |
IFI16 |
interferon, gamma-inducible protein 16 |
| chr2_+_234600253 | 2.89 |
ENST00000373424.1 ENST00000441351.1 |
UGT1A6 |
UDP glucuronosyltransferase 1 family, polypeptide A6 |
| chr1_+_158979680 | 2.86 |
ENST00000368131.4 ENST00000340979.6 |
IFI16 |
interferon, gamma-inducible protein 16 |
| chr1_+_158979686 | 2.81 |
ENST00000368132.3 ENST00000295809.7 |
IFI16 |
interferon, gamma-inducible protein 16 |
| chr22_+_38302285 | 2.72 |
ENST00000215957.6 |
MICALL1 |
MICAL-like 1 |
| chr4_-_10023095 | 2.67 |
ENST00000264784.3 |
SLC2A9 |
solute carrier family 2 (facilitated glucose transporter), member 9 |
| chr3_-_49395892 | 2.52 |
ENST00000419783.1 |
GPX1 |
glutathione peroxidase 1 |
| chr15_+_41136216 | 2.46 |
ENST00000562057.1 ENST00000344051.4 |
SPINT1 |
serine peptidase inhibitor, Kunitz type 1 |
| chr3_-_49395705 | 2.43 |
ENST00000419349.1 |
GPX1 |
glutathione peroxidase 1 |
| chr1_+_35220613 | 2.43 |
ENST00000338513.1 |
GJB5 |
gap junction protein, beta 5, 31.1kDa |
| chr2_-_31361543 | 2.35 |
ENST00000349752.5 |
GALNT14 |
UDP-N-acetyl-alpha-D-galactosamine:polypeptide N-acetylgalactosaminyltransferase 14 (GalNAc-T14) |
| chr17_+_26662730 | 2.29 |
ENST00000226225.2 |
TNFAIP1 |
tumor necrosis factor, alpha-induced protein 1 (endothelial) |
| chr1_-_94312706 | 2.15 |
ENST00000370244.1 |
BCAR3 |
breast cancer anti-estrogen resistance 3 |
| chr11_-_104972158 | 2.13 |
ENST00000598974.1 ENST00000593315.1 ENST00000594519.1 ENST00000415981.2 ENST00000525374.1 ENST00000375707.1 |
CASP1 CARD16 CARD17 |
caspase 1, apoptosis-related cysteine peptidase caspase recruitment domain family, member 16 caspase recruitment domain family, member 17 |
| chr11_+_18287721 | 2.08 |
ENST00000356524.4 |
SAA1 |
serum amyloid A1 |
| chr11_+_18287801 | 1.99 |
ENST00000532858.1 ENST00000405158.2 |
SAA1 |
serum amyloid A1 |
| chr3_-_57113314 | 1.99 |
ENST00000338458.4 ENST00000468727.1 |
ARHGEF3 |
Rho guanine nucleotide exchange factor (GEF) 3 |
| chr9_+_116298778 | 1.92 |
ENST00000462143.1 |
RGS3 |
regulator of G-protein signaling 3 |
| chr19_+_8483272 | 1.91 |
ENST00000602117.1 |
MARCH2 |
membrane-associated ring finger (C3HC4) 2, E3 ubiquitin protein ligase |
| chr17_+_26662597 | 1.87 |
ENST00000544907.2 |
TNFAIP1 |
tumor necrosis factor, alpha-induced protein 1 (endothelial) |
| chr8_+_22437965 | 1.84 |
ENST00000409141.1 ENST00000265810.4 |
PDLIM2 |
PDZ and LIM domain 2 (mystique) |
| chr6_-_30712313 | 1.80 |
ENST00000376377.2 ENST00000259874.5 |
IER3 |
immediate early response 3 |
| chr12_-_15942503 | 1.76 |
ENST00000281172.5 |
EPS8 |
epidermal growth factor receptor pathway substrate 8 |
| chr11_+_832804 | 1.76 |
ENST00000397420.3 ENST00000525718.1 |
CD151 |
CD151 molecule (Raph blood group) |
| chr12_-_15114492 | 1.73 |
ENST00000541546.1 |
ARHGDIB |
Rho GDP dissociation inhibitor (GDI) beta |
| chr17_-_74707037 | 1.71 |
ENST00000355797.3 ENST00000375036.2 ENST00000449428.2 |
MXRA7 |
matrix-remodelling associated 7 |
| chr1_+_151030234 | 1.68 |
ENST00000368921.3 |
MLLT11 |
myeloid/lymphoid or mixed-lineage leukemia (trithorax homolog, Drosophila); translocated to, 11 |
| chrX_-_8700171 | 1.67 |
ENST00000262648.3 |
KAL1 |
Kallmann syndrome 1 sequence |
| chr22_+_31489344 | 1.66 |
ENST00000404574.1 |
SMTN |
smoothelin |
| chr10_+_90750493 | 1.65 |
ENST00000357339.2 ENST00000355279.2 |
FAS |
Fas cell surface death receptor |
| chr1_+_20959943 | 1.51 |
ENST00000321556.4 |
PINK1 |
PTEN induced putative kinase 1 |
| chr7_+_100466433 | 1.47 |
ENST00000429658.1 |
TRIP6 |
thyroid hormone receptor interactor 6 |
| chr11_+_65686728 | 1.39 |
ENST00000312515.2 ENST00000525501.1 |
DRAP1 |
DR1-associated protein 1 (negative cofactor 2 alpha) |
| chrX_+_150148976 | 1.37 |
ENST00000419110.1 |
HMGB3 |
high mobility group box 3 |
| chr12_-_6233828 | 1.26 |
ENST00000572068.1 ENST00000261405.5 |
VWF |
von Willebrand factor |
| chr11_-_104905840 | 1.25 |
ENST00000526568.1 ENST00000393136.4 ENST00000531166.1 ENST00000534497.1 ENST00000527979.1 ENST00000446369.1 ENST00000353247.5 ENST00000528974.1 ENST00000533400.1 ENST00000525825.1 ENST00000436863.3 |
CASP1 |
caspase 1, apoptosis-related cysteine peptidase |
| chr3_-_149375783 | 1.14 |
ENST00000467467.1 ENST00000460517.1 ENST00000360632.3 |
WWTR1 |
WW domain containing transcription regulator 1 |
| chrX_-_153637612 | 1.12 |
ENST00000369807.1 ENST00000369808.3 |
DNASE1L1 |
deoxyribonuclease I-like 1 |
| chr8_-_22926623 | 1.09 |
ENST00000276431.4 |
TNFRSF10B |
tumor necrosis factor receptor superfamily, member 10b |
| chr11_-_1330834 | 1.00 |
ENST00000525159.1 ENST00000317204.6 ENST00000542915.1 ENST00000527938.1 ENST00000530541.1 ENST00000263646.7 |
TOLLIP |
toll interacting protein |
| chr19_+_48824711 | 0.97 |
ENST00000599704.1 |
EMP3 |
epithelial membrane protein 3 |
| chr1_-_185286461 | 0.93 |
ENST00000367498.3 |
IVNS1ABP |
influenza virus NS1A binding protein |
| chr8_-_22926526 | 0.93 |
ENST00000347739.3 ENST00000542226.1 |
TNFRSF10B |
tumor necrosis factor receptor superfamily, member 10b |
| chr19_-_51530916 | 0.93 |
ENST00000594768.1 |
KLK11 |
kallikrein-related peptidase 11 |
| chr10_+_102106829 | 0.91 |
ENST00000370355.2 |
SCD |
stearoyl-CoA desaturase (delta-9-desaturase) |
| chr18_+_34124507 | 0.90 |
ENST00000591635.1 |
FHOD3 |
formin homology 2 domain containing 3 |
| chr21_-_27462351 | 0.89 |
ENST00000448850.1 |
APP |
amyloid beta (A4) precursor protein |
| chr5_-_94417339 | 0.83 |
ENST00000429576.2 ENST00000508509.1 ENST00000510732.1 |
MCTP1 |
multiple C2 domains, transmembrane 1 |
| chr12_+_119616447 | 0.79 |
ENST00000281938.2 |
HSPB8 |
heat shock 22kDa protein 8 |
| chr15_-_72523924 | 0.77 |
ENST00000566809.1 ENST00000567087.1 ENST00000569050.1 ENST00000568883.1 |
PKM |
pyruvate kinase, muscle |
| chr11_+_64073699 | 0.75 |
ENST00000405666.1 ENST00000468670.1 |
ESRRA |
estrogen-related receptor alpha |
| chr19_-_51471381 | 0.74 |
ENST00000594641.1 |
KLK6 |
kallikrein-related peptidase 6 |
| chr15_-_63448973 | 0.72 |
ENST00000462430.1 |
RPS27L |
ribosomal protein S27-like |
| chr9_+_119449576 | 0.71 |
ENST00000450136.1 ENST00000373983.2 ENST00000411410.1 |
TRIM32 |
tripartite motif containing 32 |
| chrX_+_48334549 | 0.69 |
ENST00000019019.2 ENST00000348411.2 ENST00000396894.4 |
FTSJ1 |
FtsJ RNA methyltransferase homolog 1 (E. coli) |
| chr2_-_178257401 | 0.69 |
ENST00000464747.1 |
NFE2L2 |
nuclear factor, erythroid 2-like 2 |
| chr19_+_49458107 | 0.69 |
ENST00000539787.1 ENST00000345358.7 ENST00000391871.3 ENST00000415969.2 ENST00000354470.3 ENST00000506183.1 ENST00000293288.8 |
BAX |
BCL2-associated X protein |
| chr14_-_73925225 | 0.69 |
ENST00000356296.4 ENST00000355058.3 ENST00000359560.3 ENST00000557597.1 ENST00000554394.1 ENST00000555238.1 ENST00000535282.1 ENST00000555987.1 ENST00000555394.1 ENST00000554546.1 |
NUMB |
numb homolog (Drosophila) |
| chr19_-_17375541 | 0.67 |
ENST00000252597.3 |
USHBP1 |
Usher syndrome 1C binding protein 1 |
| chr12_+_3186521 | 0.64 |
ENST00000537971.1 ENST00000011898.5 |
TSPAN9 |
tetraspanin 9 |
| chr3_-_45017609 | 0.63 |
ENST00000342790.4 ENST00000424952.2 ENST00000296127.3 ENST00000455235.1 |
ZDHHC3 |
zinc finger, DHHC-type containing 3 |
| chr14_+_19553365 | 0.62 |
ENST00000409832.3 |
POTEG |
POTE ankyrin domain family, member G |
| chr11_-_111782696 | 0.62 |
ENST00000227251.3 ENST00000526180.1 |
CRYAB |
crystallin, alpha B |
| chr11_+_18433840 | 0.59 |
ENST00000541669.1 ENST00000280704.4 |
LDHC |
lactate dehydrogenase C |
| chr17_-_26662440 | 0.59 |
ENST00000578122.1 |
IFT20 |
intraflagellar transport 20 homolog (Chlamydomonas) |
| chr1_+_153747746 | 0.59 |
ENST00000368661.3 |
SLC27A3 |
solute carrier family 27 (fatty acid transporter), member 3 |
| chr6_-_46922659 | 0.57 |
ENST00000265417.7 |
GPR116 |
G protein-coupled receptor 116 |
| chr1_-_93426998 | 0.55 |
ENST00000370310.4 |
FAM69A |
family with sequence similarity 69, member A |
| chr1_+_15764931 | 0.53 |
ENST00000375949.4 ENST00000375943.2 |
CTRC |
chymotrypsin C (caldecrin) |
| chr7_-_142232071 | 0.52 |
ENST00000390364.3 |
TRBV10-1 |
T cell receptor beta variable 10-1(gene/pseudogene) |
| chr3_+_138066539 | 0.51 |
ENST00000289104.4 |
MRAS |
muscle RAS oncogene homolog |
| chr13_+_27825706 | 0.51 |
ENST00000272274.4 ENST00000319826.4 ENST00000326092.4 |
RPL21 |
ribosomal protein L21 |
| chr11_-_71823266 | 0.51 |
ENST00000538919.1 ENST00000539395.1 ENST00000542531.1 |
ANAPC15 |
anaphase promoting complex subunit 15 |
| chr13_+_27825446 | 0.49 |
ENST00000311549.6 |
RPL21 |
ribosomal protein L21 |
| chr10_+_103113840 | 0.48 |
ENST00000393441.4 ENST00000408038.2 |
BTRC |
beta-transducin repeat containing E3 ubiquitin protein ligase |
| chr17_-_26662464 | 0.46 |
ENST00000579419.1 ENST00000585313.1 ENST00000395418.3 ENST00000578985.1 ENST00000577498.1 ENST00000585089.1 ENST00000357896.3 |
IFT20 |
intraflagellar transport 20 homolog (Chlamydomonas) |
| chr7_+_140396946 | 0.46 |
ENST00000476470.1 ENST00000471136.1 |
NDUFB2 |
NADH dehydrogenase (ubiquinone) 1 beta subcomplex, 2, 8kDa |
| chr1_-_38157877 | 0.46 |
ENST00000477060.1 ENST00000491981.1 ENST00000488137.1 |
C1orf109 |
chromosome 1 open reading frame 109 |
| chr6_-_101329191 | 0.46 |
ENST00000324723.6 ENST00000369162.2 ENST00000522650.1 |
ASCC3 |
activating signal cointegrator 1 complex subunit 3 |
| chr13_-_50367057 | 0.45 |
ENST00000261667.3 |
KPNA3 |
karyopherin alpha 3 (importin alpha 4) |
| chr10_-_90751038 | 0.44 |
ENST00000458159.1 ENST00000415557.1 ENST00000458208.1 |
ACTA2 |
actin, alpha 2, smooth muscle, aorta |
| chr22_+_36044411 | 0.43 |
ENST00000409652.4 |
APOL6 |
apolipoprotein L, 6 |
| chr2_+_169312725 | 0.43 |
ENST00000392687.4 |
CERS6 |
ceramide synthase 6 |
| chrX_-_153602991 | 0.42 |
ENST00000369850.3 ENST00000422373.1 |
FLNA |
filamin A, alpha |
| chr19_+_35849362 | 0.41 |
ENST00000327809.4 |
FFAR3 |
free fatty acid receptor 3 |
| chr10_+_103113802 | 0.40 |
ENST00000370187.3 |
BTRC |
beta-transducin repeat containing E3 ubiquitin protein ligase |
| chr11_-_65686586 | 0.40 |
ENST00000438576.2 |
C11orf68 |
chromosome 11 open reading frame 68 |
| chr10_+_99344104 | 0.39 |
ENST00000555577.1 ENST00000370649.3 |
PI4K2A PI4K2A |
phosphatidylinositol 4-kinase type 2 alpha Phosphatidylinositol 4-kinase type 2-alpha; Uncharacterized protein |
| chr19_+_44081344 | 0.39 |
ENST00000599207.1 |
PINLYP |
phospholipase A2 inhibitor and LY6/PLAUR domain containing |
| chr1_-_201398985 | 0.38 |
ENST00000336092.4 |
TNNI1 |
troponin I type 1 (skeletal, slow) |
| chr1_+_17575584 | 0.38 |
ENST00000375460.3 |
PADI3 |
peptidyl arginine deiminase, type III |
| chr6_+_148663729 | 0.37 |
ENST00000367467.3 |
SASH1 |
SAM and SH3 domain containing 1 |
| chr8_+_22853345 | 0.37 |
ENST00000522948.1 |
RHOBTB2 |
Rho-related BTB domain containing 2 |
| chr11_-_8190534 | 0.37 |
ENST00000309737.6 ENST00000425599.2 ENST00000539720.1 ENST00000531450.1 ENST00000419822.2 ENST00000335425.7 ENST00000343202.4 |
RIC3 |
RIC3 acetylcholine receptor chaperone |
| chr2_+_166150541 | 0.37 |
ENST00000283256.6 |
SCN2A |
sodium channel, voltage-gated, type II, alpha subunit |
| chr2_-_130878140 | 0.36 |
ENST00000360967.5 ENST00000361163.4 ENST00000357462.5 |
POTEF |
POTE ankyrin domain family, member F |
| chr11_-_65686496 | 0.36 |
ENST00000449692.3 |
C11orf68 |
chromosome 11 open reading frame 68 |
| chr3_+_137717571 | 0.35 |
ENST00000343735.4 |
CLDN18 |
claudin 18 |
| chr13_+_48611665 | 0.35 |
ENST00000258662.2 |
NUDT15 |
nudix (nucleoside diphosphate linked moiety X)-type motif 15 |
| chr17_-_12921270 | 0.35 |
ENST00000578071.1 ENST00000426905.3 ENST00000395962.2 ENST00000583371.1 ENST00000338034.4 |
ELAC2 |
elaC ribonuclease Z 2 |
| chr2_-_74618964 | 0.35 |
ENST00000417090.1 ENST00000409868.1 |
DCTN1 |
dynactin 1 |
| chr12_+_108956355 | 0.35 |
ENST00000535729.1 ENST00000431221.2 ENST00000547005.1 ENST00000311893.9 ENST00000392807.4 ENST00000338291.4 ENST00000539593.1 |
ISCU |
iron-sulfur cluster assembly enzyme |
| chr22_-_36925186 | 0.34 |
ENST00000541106.1 ENST00000455547.1 ENST00000432675.1 |
EIF3D |
eukaryotic translation initiation factor 3, subunit D |
| chr15_-_90233866 | 0.34 |
ENST00000561257.1 |
PEX11A |
peroxisomal biogenesis factor 11 alpha |
| chr15_+_42697065 | 0.33 |
ENST00000565559.1 |
CAPN3 |
calpain 3, (p94) |
| chr17_-_79818354 | 0.33 |
ENST00000576541.1 ENST00000576380.1 ENST00000571617.1 ENST00000576052.1 ENST00000576390.1 ENST00000573778.2 ENST00000439918.2 ENST00000574914.1 ENST00000331483.4 |
P4HB |
prolyl 4-hydroxylase, beta polypeptide |
| chr2_+_131369054 | 0.33 |
ENST00000409602.1 |
POTEJ |
POTE ankyrin domain family, member J |
| chr8_+_67341239 | 0.32 |
ENST00000320270.2 |
RRS1 |
RRS1 ribosome biogenesis regulator homolog (S. cerevisiae) |
| chr22_-_36924944 | 0.29 |
ENST00000405442.1 ENST00000402116.1 |
EIF3D |
eukaryotic translation initiation factor 3, subunit D |
| chr1_+_17906970 | 0.28 |
ENST00000375415.1 |
ARHGEF10L |
Rho guanine nucleotide exchange factor (GEF) 10-like |
| chr16_-_1020849 | 0.28 |
ENST00000568897.1 |
LMF1 |
lipase maturation factor 1 |
| chr11_+_62009653 | 0.27 |
ENST00000244926.3 |
SCGB1D2 |
secretoglobin, family 1D, member 2 |
| chr22_+_38201114 | 0.27 |
ENST00000340857.2 |
H1F0 |
H1 histone family, member 0 |
| chr10_+_5726764 | 0.27 |
ENST00000328090.5 ENST00000496681.1 |
FAM208B |
family with sequence similarity 208, member B |
| chr20_+_57264187 | 0.27 |
ENST00000525967.1 ENST00000525817.1 |
NPEPL1 |
aminopeptidase-like 1 |
| chr11_+_19138670 | 0.27 |
ENST00000446113.2 ENST00000399351.3 |
ZDHHC13 |
zinc finger, DHHC-type containing 13 |
| chr6_-_109330702 | 0.26 |
ENST00000356644.7 |
SESN1 |
sestrin 1 |
| chr12_-_126467906 | 0.25 |
ENST00000507313.1 ENST00000545784.1 |
LINC00939 |
long intergenic non-protein coding RNA 939 |
| chr7_-_142207004 | 0.25 |
ENST00000426318.2 |
TRBV10-2 |
T cell receptor beta variable 10-2 |
| chr7_+_140396756 | 0.25 |
ENST00000460088.1 ENST00000472695.1 |
NDUFB2 |
NADH dehydrogenase (ubiquinone) 1 beta subcomplex, 2, 8kDa |
| chr10_+_23384435 | 0.24 |
ENST00000376510.3 |
MSRB2 |
methionine sulfoxide reductase B2 |
| chr9_+_139553306 | 0.24 |
ENST00000371699.1 |
EGFL7 |
EGF-like-domain, multiple 7 |
| chr19_-_58400148 | 0.23 |
ENST00000595048.1 ENST00000600634.1 ENST00000595295.1 ENST00000596604.1 ENST00000597342.1 ENST00000597807.1 |
ZNF814 |
zinc finger protein 814 |
| chr15_-_89456593 | 0.22 |
ENST00000558029.1 ENST00000539437.1 ENST00000542878.1 ENST00000268151.7 ENST00000566497.1 |
MFGE8 |
milk fat globule-EGF factor 8 protein |
| chr19_+_8509842 | 0.22 |
ENST00000325495.4 ENST00000600092.1 ENST00000594907.1 ENST00000596984.1 ENST00000601645.1 |
HNRNPM |
heterogeneous nuclear ribonucleoprotein M |
| chr2_-_165698521 | 0.22 |
ENST00000409184.3 ENST00000392717.2 ENST00000456693.1 |
COBLL1 |
cordon-bleu WH2 repeat protein-like 1 |
| chr19_-_4454081 | 0.22 |
ENST00000591919.1 |
UBXN6 |
UBX domain protein 6 |
| chr15_+_40532058 | 0.22 |
ENST00000260404.4 |
PAK6 |
p21 protein (Cdc42/Rac)-activated kinase 6 |
| chr8_-_74206133 | 0.21 |
ENST00000352983.2 |
RPL7 |
ribosomal protein L7 |
| chr2_+_169312350 | 0.20 |
ENST00000305747.6 |
CERS6 |
ceramide synthase 6 |
| chr7_+_72742178 | 0.20 |
ENST00000442793.1 ENST00000413573.2 ENST00000252037.4 |
FKBP6 |
FK506 binding protein 6, 36kDa |
| chr8_-_67341208 | 0.19 |
ENST00000499642.1 |
RP11-346I3.4 |
RP11-346I3.4 |
| chr11_+_27062272 | 0.19 |
ENST00000529202.1 ENST00000533566.1 |
BBOX1 |
butyrobetaine (gamma), 2-oxoglutarate dioxygenase (gamma-butyrobetaine hydroxylase) 1 |
| chr7_+_140396465 | 0.19 |
ENST00000476279.1 ENST00000247866.4 ENST00000461457.1 ENST00000465506.1 ENST00000204307.5 ENST00000464566.1 |
NDUFB2 |
NADH dehydrogenase (ubiquinone) 1 beta subcomplex, 2, 8kDa |
| chr6_+_55039050 | 0.19 |
ENST00000370862.3 |
HCRTR2 |
hypocretin (orexin) receptor 2 |
| chr18_+_57567180 | 0.18 |
ENST00000316660.6 ENST00000269518.9 |
PMAIP1 |
phorbol-12-myristate-13-acetate-induced protein 1 |
| chr7_+_72742162 | 0.18 |
ENST00000431982.2 |
FKBP6 |
FK506 binding protein 6, 36kDa |
| chr11_-_111782484 | 0.18 |
ENST00000533971.1 |
CRYAB |
crystallin, alpha B |
| chr11_+_61891445 | 0.18 |
ENST00000394818.3 ENST00000533896.1 ENST00000278849.4 |
INCENP |
inner centromere protein antigens 135/155kDa |
| chr2_+_98986400 | 0.17 |
ENST00000272602.2 |
CNGA3 |
cyclic nucleotide gated channel alpha 3 |
| chr20_+_48807351 | 0.16 |
ENST00000303004.3 |
CEBPB |
CCAAT/enhancer binding protein (C/EBP), beta |
| chr17_+_8191815 | 0.16 |
ENST00000226105.6 ENST00000407006.4 ENST00000580434.1 ENST00000439238.3 |
RANGRF |
RAN guanine nucleotide release factor |
| chr16_+_28834531 | 0.15 |
ENST00000570200.1 |
ATXN2L |
ataxin 2-like |
| chr9_+_71944241 | 0.15 |
ENST00000257515.8 |
FAM189A2 |
family with sequence similarity 189, member A2 |
| chr19_-_12662240 | 0.15 |
ENST00000416136.1 ENST00000428311.1 |
ZNF564 ZNF709 |
zinc finger protein 564 ZNF709 |
| chr4_+_71554196 | 0.15 |
ENST00000254803.2 |
UTP3 |
UTP3, small subunit (SSU) processome component, homolog (S. cerevisiae) |
| chr20_+_35234137 | 0.14 |
ENST00000344795.3 ENST00000373852.5 |
C20orf24 |
chromosome 20 open reading frame 24 |
| chr20_+_35234223 | 0.14 |
ENST00000342422.3 |
C20orf24 |
chromosome 20 open reading frame 24 |
| chr16_+_1832902 | 0.14 |
ENST00000262302.9 ENST00000563136.1 ENST00000565987.1 ENST00000543305.1 ENST00000568287.1 ENST00000565134.1 |
NUBP2 |
nucleotide binding protein 2 |
| chr8_-_117778494 | 0.13 |
ENST00000276682.4 |
EIF3H |
eukaryotic translation initiation factor 3, subunit H |
| chr13_-_78492955 | 0.13 |
ENST00000446573.1 |
EDNRB |
endothelin receptor type B |
| chr12_+_52306113 | 0.12 |
ENST00000547400.1 ENST00000550683.1 ENST00000419526.2 |
ACVRL1 |
activin A receptor type II-like 1 |
| chr16_-_70729496 | 0.12 |
ENST00000567648.1 |
VAC14 |
Vac14 homolog (S. cerevisiae) |
| chr13_-_96296944 | 0.12 |
ENST00000361396.2 ENST00000376829.2 |
DZIP1 |
DAZ interacting zinc finger protein 1 |
| chr19_+_42364313 | 0.11 |
ENST00000601492.1 ENST00000600467.1 ENST00000221975.2 |
RPS19 |
ribosomal protein S19 |
| chr11_+_64889773 | 0.11 |
ENST00000534078.1 ENST00000526171.1 ENST00000279242.2 ENST00000531705.1 ENST00000533943.1 |
MRPL49 |
mitochondrial ribosomal protein L49 |
| chr4_-_186317034 | 0.10 |
ENST00000505916.1 |
LRP2BP |
LRP2 binding protein |
| chr1_-_47655686 | 0.10 |
ENST00000294338.2 |
PDZK1IP1 |
PDZK1 interacting protein 1 |
| chr9_-_136605042 | 0.09 |
ENST00000371872.4 ENST00000298628.5 ENST00000422262.2 |
SARDH |
sarcosine dehydrogenase |
| chr22_-_38577782 | 0.09 |
ENST00000430886.1 ENST00000332509.3 ENST00000447598.2 ENST00000435484.1 ENST00000402064.1 ENST00000436218.1 |
PLA2G6 |
phospholipase A2, group VI (cytosolic, calcium-independent) |
| chr17_+_21279509 | 0.09 |
ENST00000583088.1 |
KCNJ12 |
potassium inwardly-rectifying channel, subfamily J, member 12 |
| chr15_+_42697018 | 0.08 |
ENST00000397204.4 |
CAPN3 |
calpain 3, (p94) |
| chr2_+_198365122 | 0.08 |
ENST00000604458.1 |
HSPE1-MOB4 |
HSPE1-MOB4 readthrough |
| chr14_+_52456193 | 0.08 |
ENST00000261700.3 |
C14orf166 |
chromosome 14 open reading frame 166 |
| chr15_-_31393910 | 0.08 |
ENST00000397795.2 ENST00000256552.6 ENST00000559179.1 |
TRPM1 |
transient receptor potential cation channel, subfamily M, member 1 |
| chr1_-_20987982 | 0.07 |
ENST00000375048.3 |
DDOST |
dolichyl-diphosphooligosaccharide--protein glycosyltransferase subunit (non-catalytic) |
| chr11_+_111783450 | 0.07 |
ENST00000537382.1 |
HSPB2 |
Homo sapiens heat shock 27kDa protein 2 (HSPB2), mRNA. |
| chr18_+_55018044 | 0.06 |
ENST00000324000.3 |
ST8SIA3 |
ST8 alpha-N-acetyl-neuraminide alpha-2,8-sialyltransferase 3 |
| chr15_+_42696992 | 0.06 |
ENST00000561817.1 |
CAPN3 |
calpain 3, (p94) |
| chr14_+_24779376 | 0.06 |
ENST00000530080.1 |
LTB4R2 |
leukotriene B4 receptor 2 |
| chr13_-_78492927 | 0.06 |
ENST00000334286.5 |
EDNRB |
endothelin receptor type B |
| chr20_+_34894247 | 0.05 |
ENST00000373913.3 |
DLGAP4 |
discs, large (Drosophila) homolog-associated protein 4 |
| chr8_+_22960426 | 0.05 |
ENST00000540813.1 |
TNFRSF10C |
tumor necrosis factor receptor superfamily, member 10c, decoy without an intracellular domain |
| chr17_-_4938712 | 0.05 |
ENST00000254853.5 ENST00000424747.1 |
SLC52A1 |
solute carrier family 52 (riboflavin transporter), member 1 |
| chr7_+_80267973 | 0.04 |
ENST00000394788.3 ENST00000447544.2 |
CD36 |
CD36 molecule (thrombospondin receptor) |
| chr1_+_22328144 | 0.04 |
ENST00000290122.3 ENST00000374663.1 |
CELA3A |
chymotrypsin-like elastase family, member 3A |
| chr22_-_50946113 | 0.04 |
ENST00000216080.5 ENST00000474879.2 ENST00000380796.3 |
LMF2 |
lipase maturation factor 2 |
| chr2_+_101179152 | 0.04 |
ENST00000264254.6 |
PDCL3 |
phosducin-like 3 |
| chr11_+_24518723 | 0.04 |
ENST00000336930.6 ENST00000529015.1 ENST00000533227.1 |
LUZP2 |
leucine zipper protein 2 |
| chr19_-_11688447 | 0.04 |
ENST00000590420.1 |
ACP5 |
acid phosphatase 5, tartrate resistant |
| chr22_-_38577731 | 0.02 |
ENST00000335539.3 |
PLA2G6 |
phospholipase A2, group VI (cytosolic, calcium-independent) |
Gene Ontology Analysis
Gene overrepresentation in C2:CP category:
| Log-likelihood per target | Total log-likelihood | Term | Description |
|---|---|---|---|
| 0.3 | 6.3 | PID INTEGRIN4 PATHWAY | Alpha6 beta4 integrin-ligand interactions |
| 0.2 | 10.8 | PID NCADHERIN PATHWAY | N-cadherin signaling events |
| 0.1 | 4.1 | PID TOLL ENDOGENOUS PATHWAY | Endogenous TLR signaling |
| 0.1 | 3.4 | PID ANTHRAX PATHWAY | Cellular roles of Anthrax toxin |
| 0.1 | 10.2 | PID TAP63 PATHWAY | Validated transcriptional targets of TAp63 isoforms |
| 0.1 | 5.1 | PID RHOA REG PATHWAY | Regulation of RhoA activity |
| 0.1 | 1.6 | PID CDC42 REG PATHWAY | Regulation of CDC42 activity |
| 0.0 | 1.4 | PID TRAIL PATHWAY | TRAIL signaling pathway |
| 0.0 | 2.4 | PID PI3KCI PATHWAY | Class I PI3K signaling events |
| 0.0 | 1.8 | PID EPHRINB REV PATHWAY | Ephrin B reverse signaling |
| 0.0 | 2.7 | PID KIT PATHWAY | Signaling events mediated by Stem cell factor receptor (c-Kit) |
| 0.0 | 1.8 | PID RAC1 REG PATHWAY | Regulation of RAC1 activity |
| 0.0 | 0.9 | PID GLYPICAN 1PATHWAY | Glypican 1 network |
| 0.0 | 0.8 | PID IL1 PATHWAY | IL1-mediated signaling events |
| 0.0 | 1.5 | PID LYSOPHOSPHOLIPID PATHWAY | LPA receptor mediated events |
| 0.0 | 0.7 | PID ALPHA SYNUCLEIN PATHWAY | Alpha-synuclein signaling |
| 0.0 | 3.4 | NABA ECM GLYCOPROTEINS | Genes encoding structural ECM glycoproteins |
| 0.0 | 0.4 | PID WNT CANONICAL PATHWAY | Canonical Wnt signaling pathway |
| 0.0 | 0.4 | SIG REGULATION OF THE ACTIN CYTOSKELETON BY RHO GTPASES | Genes related to regulation of the actin cytoskeleton |
| 0.0 | 1.1 | ST INTEGRIN SIGNALING PATHWAY | Integrin Signaling Pathway |
| 0.0 | 0.5 | PID UPA UPAR PATHWAY | Urokinase-type plasminogen activator (uPA) and uPAR-mediated signaling |
| 0.0 | 0.7 | PID MET PATHWAY | Signaling events mediated by Hepatocyte Growth Factor Receptor (c-Met) |
| 0.0 | 3.1 | NABA ECM REGULATORS | Genes encoding enzymes and their regulators involved in the remodeling of the extracellular matrix |
| 0.0 | 4.4 | NABA SECRETED FACTORS | Genes encoding secreted soluble factors |
| 0.0 | 0.9 | WNT SIGNALING | Genes related to Wnt-mediated signal transduction |
Gene overrepresentation in cellular_component category:
| Log-likelihood per target | Total log-likelihood | Term | Description |
|---|---|---|---|
| 0.8 | 6.3 | GO:0005610 | laminin-5 complex(GO:0005610) |
| 0.7 | 3.4 | GO:0097179 | protease inhibitor complex(GO:0097179) |
| 0.6 | 6.5 | GO:0097413 | Lewy body(GO:0097413) |
| 0.6 | 9.6 | GO:0005922 | connexon complex(GO:0005922) |
| 0.5 | 2.5 | GO:0045323 | interleukin-1 receptor complex(GO:0045323) |
| 0.4 | 1.1 | GO:1902636 | kinociliary basal body(GO:1902636) |
| 0.3 | 12.7 | GO:0045095 | keratin filament(GO:0045095) |
| 0.2 | 3.3 | GO:0030478 | actin cap(GO:0030478) |
| 0.2 | 0.7 | GO:0005863 | striated muscle myosin thick filament(GO:0005863) |
| 0.1 | 4.1 | GO:0071682 | endocytic vesicle lumen(GO:0071682) |
| 0.1 | 0.4 | GO:0031523 | Myb complex(GO:0031523) |
| 0.1 | 0.5 | GO:0035838 | growing cell tip(GO:0035838) |
| 0.1 | 1.3 | GO:0033093 | Weibel-Palade body(GO:0033093) |
| 0.1 | 0.3 | GO:0016222 | procollagen-proline 4-dioxygenase complex(GO:0016222) |
| 0.1 | 5.7 | GO:0001533 | cornified envelope(GO:0001533) |
| 0.1 | 0.4 | GO:0030485 | smooth muscle contractile fiber(GO:0030485) |
| 0.1 | 1.6 | GO:0017146 | NMDA selective glutamate receptor complex(GO:0017146) |
| 0.1 | 8.0 | GO:0045178 | basal part of cell(GO:0045178) |
| 0.1 | 0.9 | GO:1990761 | growth cone lamellipodium(GO:1990761) growth cone filopodium(GO:1990812) |
| 0.1 | 0.8 | GO:0071541 | eukaryotic translation initiation factor 3 complex, eIF3m(GO:0071541) |
| 0.1 | 1.7 | GO:0031265 | CD95 death-inducing signaling complex(GO:0031265) |
| 0.1 | 0.6 | GO:0097197 | tetraspanin-enriched microdomain(GO:0097197) |
| 0.1 | 0.8 | GO:0097512 | cardiac myofibril(GO:0097512) |
| 0.1 | 0.7 | GO:0097136 | Bcl-2 family protein complex(GO:0097136) |
| 0.0 | 0.3 | GO:0061700 | GATOR2 complex(GO:0061700) |
| 0.0 | 2.5 | GO:0031463 | Cul3-RING ubiquitin ligase complex(GO:0031463) |
| 0.0 | 2.7 | GO:0055038 | recycling endosome membrane(GO:0055038) |
| 0.0 | 0.2 | GO:0000801 | central element(GO:0000801) |
| 0.0 | 0.2 | GO:0042382 | paraspeckles(GO:0042382) |
| 0.0 | 1.3 | GO:0036379 | myofilament(GO:0036379) |
| 0.0 | 0.3 | GO:0005869 | dynactin complex(GO:0005869) |
| 0.0 | 0.4 | GO:0033270 | voltage-gated sodium channel complex(GO:0001518) paranode region of axon(GO:0033270) |
| 0.0 | 2.5 | GO:0032587 | ruffle membrane(GO:0032587) |
| 0.0 | 0.9 | GO:0019005 | SCF ubiquitin ligase complex(GO:0019005) |
| 0.0 | 8.1 | GO:0016607 | nuclear speck(GO:0016607) |
| 0.0 | 0.1 | GO:0035032 | phosphatidylinositol 3-kinase complex, class III(GO:0035032) |
| 0.0 | 1.0 | GO:0022625 | cytosolic large ribosomal subunit(GO:0022625) |
| 0.0 | 1.1 | GO:0035580 | specific granule lumen(GO:0035580) |
| 0.0 | 0.2 | GO:0042622 | photoreceptor outer segment membrane(GO:0042622) |
| 0.0 | 4.6 | GO:0016324 | apical plasma membrane(GO:0016324) |
| 0.0 | 8.6 | GO:0005925 | focal adhesion(GO:0005925) |
| 0.0 | 0.3 | GO:0031231 | integral component of peroxisomal membrane(GO:0005779) intrinsic component of peroxisomal membrane(GO:0031231) |
| 0.0 | 0.3 | GO:0030687 | preribosome, large subunit precursor(GO:0030687) |
Gene overrepresentation in biological_process category:
| Log-likelihood per target | Total log-likelihood | Term | Description |
|---|---|---|---|
| 2.4 | 7.1 | GO:0010652 | regulation of cell communication by chemical coupling(GO:0010645) positive regulation of cell communication by chemical coupling(GO:0010652) |
| 2.3 | 6.9 | GO:0051710 | regulation of cytolysis in other organism(GO:0051710) |
| 1.4 | 5.5 | GO:0071461 | cellular response to redox state(GO:0071461) |
| 1.1 | 3.2 | GO:0070563 | negative regulation of vitamin D receptor signaling pathway(GO:0070563) |
| 1.0 | 5.0 | GO:0009608 | response to symbiont(GO:0009608) response to symbiotic bacterium(GO:0009609) |
| 1.0 | 7.6 | GO:0031642 | negative regulation of myelination(GO:0031642) |
| 0.8 | 3.4 | GO:0050717 | positive regulation of interleukin-1 alpha secretion(GO:0050717) |
| 0.7 | 3.3 | GO:0044858 | plasma membrane raft distribution(GO:0044855) plasma membrane raft localization(GO:0044856) plasma membrane raft polarization(GO:0044858) regulation of plasma membrane raft polarization(GO:1903906) |
| 0.6 | 2.4 | GO:0060708 | spongiotrophoblast differentiation(GO:0060708) |
| 0.5 | 1.5 | GO:1902958 | neuron intrinsic apoptotic signaling pathway in response to hydrogen peroxide(GO:0036482) positive regulation of mitochondrial electron transport, NADH to ubiquinone(GO:1902958) regulation of hydrogen peroxide-induced neuron intrinsic apoptotic signaling pathway(GO:1903383) negative regulation of hydrogen peroxide-induced neuron intrinsic apoptotic signaling pathway(GO:1903384) |
| 0.4 | 1.8 | GO:0070358 | actin polymerization-dependent cell motility(GO:0070358) |
| 0.3 | 1.5 | GO:0008588 | release of cytoplasmic sequestered NF-kappaB(GO:0008588) |
| 0.3 | 8.1 | GO:0031581 | hemidesmosome assembly(GO:0031581) |
| 0.3 | 1.7 | GO:0036337 | Fas signaling pathway(GO:0036337) |
| 0.3 | 5.0 | GO:0090026 | positive regulation of monocyte chemotaxis(GO:0090026) |
| 0.2 | 0.7 | GO:1902445 | B cell negative selection(GO:0002352) post-embryonic camera-type eye morphogenesis(GO:0048597) apoptotic process involved in mammary gland involution(GO:0060057) positive regulation of apoptotic process involved in mammary gland involution(GO:0060058) apoptotic process involved in embryonic digit morphogenesis(GO:1902263) positive regulation of apoptotic process involved in morphogenesis(GO:1902339) regulation of mitochondrial membrane permeability involved in programmed necrotic cell death(GO:1902445) positive regulation of apoptotic DNA fragmentation(GO:1902512) regulation of mammary gland involution(GO:1903519) positive regulation of mammary gland involution(GO:1903521) positive regulation of apoptotic process involved in development(GO:1904747) |
| 0.2 | 0.7 | GO:0030860 | regulation of polarized epithelial cell differentiation(GO:0030860) |
| 0.2 | 2.5 | GO:0033327 | Leydig cell differentiation(GO:0033327) |
| 0.2 | 2.9 | GO:0052696 | flavonoid glucuronidation(GO:0052696) xenobiotic glucuronidation(GO:0052697) |
| 0.2 | 12.8 | GO:0032732 | positive regulation of interleukin-1 production(GO:0032732) |
| 0.2 | 0.6 | GO:0001732 | formation of cytoplasmic translation initiation complex(GO:0001732) |
| 0.2 | 1.7 | GO:0051901 | positive regulation of mitochondrial depolarization(GO:0051901) |
| 0.2 | 0.8 | GO:0042866 | pyruvate biosynthetic process(GO:0042866) |
| 0.2 | 2.7 | GO:0046415 | urate metabolic process(GO:0046415) |
| 0.2 | 5.7 | GO:0007398 | ectoderm development(GO:0007398) |
| 0.2 | 0.9 | GO:0071874 | cellular response to norepinephrine stimulus(GO:0071874) |
| 0.2 | 0.7 | GO:1901377 | mycotoxin catabolic process(GO:0043387) aflatoxin catabolic process(GO:0046223) organic heteropentacyclic compound catabolic process(GO:1901377) regulation of glutathione biosynthetic process(GO:1903786) positive regulation of glutathione biosynthetic process(GO:1903788) |
| 0.2 | 0.2 | GO:0098905 | regulation of bundle of His cell action potential(GO:0098905) |
| 0.2 | 3.7 | GO:0036010 | protein localization to endosome(GO:0036010) |
| 0.2 | 2.0 | GO:0097296 | activation of cysteine-type endopeptidase activity involved in apoptotic signaling pathway(GO:0097296) |
| 0.2 | 4.2 | GO:0035024 | negative regulation of Rho protein signal transduction(GO:0035024) |
| 0.2 | 6.0 | GO:0060512 | prostate gland morphogenesis(GO:0060512) |
| 0.1 | 0.6 | GO:0019249 | lactate biosynthetic process(GO:0019249) |
| 0.1 | 2.5 | GO:0060670 | branching involved in labyrinthine layer morphogenesis(GO:0060670) |
| 0.1 | 0.7 | GO:0030047 | actin modification(GO:0030047) |
| 0.1 | 3.5 | GO:0007216 | G-protein coupled glutamate receptor signaling pathway(GO:0007216) |
| 0.1 | 3.8 | GO:0010226 | response to lithium ion(GO:0010226) |
| 0.1 | 0.4 | GO:0002276 | basophil activation involved in immune response(GO:0002276) |
| 0.1 | 1.1 | GO:0035414 | negative regulation of catenin import into nucleus(GO:0035414) |
| 0.1 | 0.4 | GO:0000965 | mitochondrial RNA 3'-end processing(GO:0000965) |
| 0.1 | 1.1 | GO:0035845 | photoreceptor cell outer segment organization(GO:0035845) |
| 0.1 | 6.2 | GO:0018149 | peptide cross-linking(GO:0018149) |
| 0.1 | 2.1 | GO:0002089 | lens morphogenesis in camera-type eye(GO:0002089) |
| 0.1 | 0.4 | GO:1902498 | regulation of protein autoubiquitination(GO:1902498) |
| 0.1 | 0.4 | GO:0006203 | dGTP catabolic process(GO:0006203) |
| 0.1 | 0.4 | GO:0090131 | mesangial cell development(GO:0072143) glomerular mesangial cell development(GO:0072144) mesenchyme migration(GO:0090131) |
| 0.1 | 0.3 | GO:0044375 | regulation of peroxisome size(GO:0044375) |
| 0.1 | 0.5 | GO:0070315 | G1 to G0 transition involved in cell differentiation(GO:0070315) |
| 0.1 | 0.4 | GO:0036414 | protein citrullination(GO:0018101) histone citrullination(GO:0036414) |
| 0.1 | 0.4 | GO:0016479 | negative regulation of transcription from RNA polymerase I promoter(GO:0016479) formation of radial glial scaffolds(GO:0021943) |
| 0.1 | 0.5 | GO:0006307 | DNA dealkylation involved in DNA repair(GO:0006307) |
| 0.1 | 0.2 | GO:0007497 | posterior midgut development(GO:0007497) endothelin receptor signaling pathway(GO:0086100) |
| 0.1 | 1.0 | GO:0051639 | actin filament network formation(GO:0051639) |
| 0.1 | 0.3 | GO:0097428 | protein maturation by iron-sulfur cluster transfer(GO:0097428) |
| 0.1 | 1.3 | GO:0007597 | blood coagulation, intrinsic pathway(GO:0007597) |
| 0.1 | 1.0 | GO:0032060 | bleb assembly(GO:0032060) |
| 0.0 | 0.4 | GO:0034587 | piRNA metabolic process(GO:0034587) |
| 0.0 | 0.3 | GO:0046598 | positive regulation of viral entry into host cell(GO:0046598) |
| 0.0 | 0.7 | GO:0016540 | protein autoprocessing(GO:0016540) |
| 0.0 | 1.9 | GO:0000188 | inactivation of MAPK activity(GO:0000188) |
| 0.0 | 0.8 | GO:0007021 | tubulin complex assembly(GO:0007021) |
| 0.0 | 0.3 | GO:0090063 | positive regulation of microtubule nucleation(GO:0090063) |
| 0.0 | 0.9 | GO:2001243 | negative regulation of intrinsic apoptotic signaling pathway(GO:2001243) |
| 0.0 | 0.3 | GO:0000055 | ribosomal large subunit export from nucleus(GO:0000055) protein localization to nucleolus(GO:1902570) |
| 0.0 | 0.6 | GO:0018345 | protein palmitoylation(GO:0018345) |
| 0.0 | 0.9 | GO:0042753 | positive regulation of circadian rhythm(GO:0042753) |
| 0.0 | 0.2 | GO:0042746 | regulation of circadian sleep/wake cycle, wakefulness(GO:0010840) circadian sleep/wake cycle, wakefulness(GO:0042746) |
| 0.0 | 0.4 | GO:0071847 | TNFSF11-mediated signaling pathway(GO:0071847) |
| 0.0 | 0.3 | GO:0033578 | protein glycosylation in Golgi(GO:0033578) |
| 0.0 | 0.4 | GO:0008627 | intrinsic apoptotic signaling pathway in response to osmotic stress(GO:0008627) |
| 0.0 | 1.4 | GO:0006308 | DNA catabolic process(GO:0006308) |
| 0.0 | 0.3 | GO:1904262 | negative regulation of TORC1 signaling(GO:1904262) |
| 0.0 | 0.1 | GO:1901052 | sarcosine metabolic process(GO:1901052) sarcosine catabolic process(GO:1901053) |
| 0.0 | 3.9 | GO:1902476 | chloride transmembrane transport(GO:1902476) |
| 0.0 | 0.1 | GO:0032049 | cardiolipin biosynthetic process(GO:0032049) |
| 0.0 | 0.5 | GO:1903504 | regulation of mitotic cell cycle spindle assembly checkpoint(GO:0090266) regulation of mitotic spindle checkpoint(GO:1903504) |
| 0.0 | 0.2 | GO:0032510 | endosome to lysosome transport via multivesicular body sorting pathway(GO:0032510) |
| 0.0 | 0.2 | GO:0030091 | protein repair(GO:0030091) |
| 0.0 | 0.7 | GO:0030488 | tRNA methylation(GO:0030488) |
| 0.0 | 0.9 | GO:0046949 | fatty-acyl-CoA biosynthetic process(GO:0046949) |
| 0.0 | 0.3 | GO:1903830 | magnesium ion transmembrane transport(GO:1903830) |
| 0.0 | 0.5 | GO:0019054 | modulation by virus of host process(GO:0019054) |
| 0.0 | 0.2 | GO:2000427 | positive regulation of apoptotic cell clearance(GO:2000427) |
| 0.0 | 0.5 | GO:0009235 | cobalamin metabolic process(GO:0009235) |
| 0.0 | 0.2 | GO:0045329 | carnitine biosynthetic process(GO:0045329) |
| 0.0 | 0.2 | GO:0010917 | negative regulation of mitochondrial membrane potential(GO:0010917) |
| 0.0 | 0.8 | GO:1900078 | positive regulation of cellular response to insulin stimulus(GO:1900078) |
| 0.0 | 0.2 | GO:0045408 | regulation of interleukin-6 biosynthetic process(GO:0045408) |
| 0.0 | 0.1 | GO:0001955 | blood vessel maturation(GO:0001955) dorsal aorta development(GO:0035907) dorsal aorta morphogenesis(GO:0035912) |
| 0.0 | 0.1 | GO:0000463 | maturation of LSU-rRNA from tricistronic rRNA transcript (SSU-rRNA, 5.8S rRNA, LSU-rRNA)(GO:0000463) |
| 0.0 | 0.7 | GO:0046513 | ceramide biosynthetic process(GO:0046513) |
| 0.0 | 0.2 | GO:0014883 | transition between fast and slow fiber(GO:0014883) |
| 0.0 | 0.3 | GO:0000028 | ribosomal small subunit assembly(GO:0000028) |
| 0.0 | 0.0 | GO:0032218 | riboflavin transport(GO:0032218) |
| 0.0 | 0.4 | GO:0007271 | synaptic transmission, cholinergic(GO:0007271) |
Gene overrepresentation in C2:CP:REACTOME category:
| Log-likelihood per target | Total log-likelihood | Term | Description |
|---|---|---|---|
| 0.6 | 9.6 | REACTOME GAP JUNCTION ASSEMBLY | Genes involved in Gap junction assembly |
| 0.5 | 5.0 | REACTOME PURINE CATABOLISM | Genes involved in Purine catabolism |
| 0.2 | 4.3 | REACTOME THE NLRP3 INFLAMMASOME | Genes involved in The NLRP3 inflammasome |
| 0.2 | 4.1 | REACTOME RIP MEDIATED NFKB ACTIVATION VIA DAI | Genes involved in RIP-mediated NFkB activation via DAI |
| 0.1 | 3.7 | REACTOME EXTRINSIC PATHWAY FOR APOPTOSIS | Genes involved in Extrinsic Pathway for Apoptosis |
| 0.1 | 2.7 | REACTOME FACILITATIVE NA INDEPENDENT GLUCOSE TRANSPORTERS | Genes involved in Facilitative Na+-independent glucose transporters |
| 0.1 | 2.9 | REACTOME GLUCURONIDATION | Genes involved in Glucuronidation |
| 0.1 | 3.3 | REACTOME CASPASE MEDIATED CLEAVAGE OF CYTOSKELETAL PROTEINS | Genes involved in Caspase-mediated cleavage of cytoskeletal proteins |
| 0.1 | 1.3 | REACTOME PLATELET ADHESION TO EXPOSED COLLAGEN | Genes involved in Platelet Adhesion to exposed collagen |
| 0.1 | 8.5 | REACTOME CELL JUNCTION ORGANIZATION | Genes involved in Cell junction organization |
| 0.1 | 1.6 | REACTOME REGULATION OF INSULIN LIKE GROWTH FACTOR IGF ACTIVITY BY INSULIN LIKE GROWTH FACTOR BINDING PROTEINS IGFBPS | Genes involved in Regulation of Insulin-like Growth Factor (IGF) Activity by Insulin-like Growth Factor Binding Proteins (IGFBPs) |
| 0.0 | 1.4 | REACTOME SIGNALING BY NODAL | Genes involved in Signaling by NODAL |
| 0.0 | 1.1 | REACTOME SIGNALING BY HIPPO | Genes involved in Signaling by Hippo |
| 0.0 | 0.5 | REACTOME SYNTHESIS OF PIPS AT THE EARLY ENDOSOME MEMBRANE | Genes involved in Synthesis of PIPs at the early endosome membrane |
| 0.0 | 1.7 | REACTOME IL1 SIGNALING | Genes involved in Interleukin-1 signaling |
| 0.0 | 5.0 | REACTOME SIGNALING BY RHO GTPASES | Genes involved in Signaling by Rho GTPases |
| 0.0 | 0.6 | REACTOME SPHINGOLIPID DE NOVO BIOSYNTHESIS | Genes involved in Sphingolipid de novo biosynthesis |
| 0.0 | 0.3 | REACTOME APOPTOSIS INDUCED DNA FRAGMENTATION | Genes involved in Apoptosis induced DNA fragmentation |
| 0.0 | 0.3 | REACTOME CHYLOMICRON MEDIATED LIPID TRANSPORT | Genes involved in Chylomicron-mediated lipid transport |
| 0.0 | 0.7 | REACTOME RECYCLING PATHWAY OF L1 | Genes involved in Recycling pathway of L1 |
| 0.0 | 0.4 | REACTOME INTERACTION BETWEEN L1 AND ANKYRINS | Genes involved in Interaction between L1 and Ankyrins |
| 0.0 | 0.2 | REACTOME ACTIVATION OF RAC | Genes involved in Activation of Rac |
Gene overrepresentation in molecular_function category:
| Log-likelihood per target | Total log-likelihood | Term | Description |
|---|---|---|---|
| 1.4 | 7.1 | GO:0086075 | gap junction channel activity involved in cardiac conduction electrical coupling(GO:0086075) |
| 0.6 | 5.5 | GO:0005094 | Rho GDP-dissociation inhibitor activity(GO:0005094) |
| 0.3 | 1.0 | GO:0005150 | interleukin-1, Type I receptor binding(GO:0005150) |
| 0.3 | 1.7 | GO:0043120 | tumor necrosis factor binding(GO:0043120) |
| 0.3 | 4.7 | GO:0005229 | intracellular calcium activated chloride channel activity(GO:0005229) |
| 0.3 | 0.9 | GO:0016215 | stearoyl-CoA 9-desaturase activity(GO:0004768) acyl-CoA desaturase activity(GO:0016215) |
| 0.3 | 1.7 | GO:0045569 | TRAIL binding(GO:0045569) |
| 0.3 | 3.3 | GO:0045159 | myosin II binding(GO:0045159) |
| 0.3 | 2.7 | GO:1901702 | urate transmembrane transporter activity(GO:0015143) salt transmembrane transporter activity(GO:1901702) |
| 0.3 | 4.2 | GO:0017049 | GTP-Rho binding(GO:0017049) |
| 0.2 | 3.4 | GO:0050700 | CARD domain binding(GO:0050700) |
| 0.2 | 3.4 | GO:0035256 | G-protein coupled glutamate receptor binding(GO:0035256) |
| 0.2 | 1.1 | GO:0002046 | opsin binding(GO:0002046) |
| 0.2 | 0.8 | GO:0004743 | pyruvate kinase activity(GO:0004743) |
| 0.2 | 5.0 | GO:0004602 | glutathione peroxidase activity(GO:0004602) |
| 0.1 | 1.6 | GO:0031995 | insulin-like growth factor II binding(GO:0031995) |
| 0.1 | 0.7 | GO:0016427 | tRNA (cytosine) methyltransferase activity(GO:0016427) |
| 0.1 | 3.0 | GO:0043325 | phosphatidylinositol-3,4-bisphosphate binding(GO:0043325) |
| 0.1 | 1.5 | GO:0055131 | C3HC4-type RING finger domain binding(GO:0055131) |
| 0.1 | 2.7 | GO:0070300 | phosphatidic acid binding(GO:0070300) |
| 0.1 | 0.4 | GO:0035539 | 8-oxo-7,8-dihydroguanosine triphosphate pyrophosphatase activity(GO:0008413) NADH pyrophosphatase activity(GO:0035529) 8-oxo-7,8-dihydrodeoxyguanosine triphosphate pyrophosphatase activity(GO:0035539) |
| 0.1 | 0.3 | GO:0008097 | 5S rRNA binding(GO:0008097) |
| 0.1 | 0.4 | GO:0034988 | Fc-gamma receptor I complex binding(GO:0034988) |
| 0.1 | 0.6 | GO:0050291 | sphingosine N-acyltransferase activity(GO:0050291) |
| 0.1 | 0.9 | GO:0051425 | PTB domain binding(GO:0051425) |
| 0.1 | 0.4 | GO:0035651 | AP-3 adaptor complex binding(GO:0035651) |
| 0.1 | 4.1 | GO:0042056 | chemoattractant activity(GO:0042056) |
| 0.1 | 1.5 | GO:0005149 | interleukin-1 receptor binding(GO:0005149) |
| 0.1 | 0.6 | GO:0004459 | lactate dehydrogenase activity(GO:0004457) L-lactate dehydrogenase activity(GO:0004459) |
| 0.1 | 5.0 | GO:0042379 | chemokine receptor binding(GO:0042379) |
| 0.1 | 8.4 | GO:0004867 | serine-type endopeptidase inhibitor activity(GO:0004867) |
| 0.1 | 2.9 | GO:0001972 | retinoic acid binding(GO:0001972) |
| 0.1 | 0.5 | GO:0043140 | ATP-dependent 3'-5' DNA helicase activity(GO:0043140) |
| 0.1 | 0.4 | GO:0004668 | protein-arginine deiminase activity(GO:0004668) |
| 0.1 | 1.4 | GO:0000400 | four-way junction DNA binding(GO:0000400) |
| 0.1 | 11.8 | GO:0005200 | structural constituent of cytoskeleton(GO:0005200) |
| 0.1 | 0.3 | GO:0004656 | procollagen-proline 4-dioxygenase activity(GO:0004656) procollagen-proline dioxygenase activity(GO:0019798) |
| 0.1 | 0.7 | GO:0051434 | BH3 domain binding(GO:0051434) |
| 0.1 | 10.7 | GO:0001078 | transcriptional repressor activity, RNA polymerase II core promoter proximal region sequence-specific binding(GO:0001078) |
| 0.1 | 4.7 | GO:0004869 | cysteine-type endopeptidase inhibitor activity(GO:0004869) |
| 0.1 | 0.2 | GO:0004962 | endothelin receptor activity(GO:0004962) |
| 0.1 | 0.2 | GO:0033743 | peptide-methionine (R)-S-oxide reductase activity(GO:0033743) |
| 0.1 | 0.9 | GO:0019706 | protein-cysteine S-palmitoyltransferase activity(GO:0019706) protein-cysteine S-acyltransferase activity(GO:0019707) |
| 0.1 | 0.7 | GO:0045294 | alpha-catenin binding(GO:0045294) |
| 0.1 | 0.3 | GO:0070728 | leucine binding(GO:0070728) |
| 0.0 | 1.3 | GO:0019865 | immunoglobulin binding(GO:0019865) |
| 0.0 | 0.2 | GO:0008336 | gamma-butyrobetaine dioxygenase activity(GO:0008336) |
| 0.0 | 0.5 | GO:0030957 | Tat protein binding(GO:0030957) |
| 0.0 | 0.2 | GO:0016499 | orexin receptor activity(GO:0016499) |
| 0.0 | 0.6 | GO:0031957 | very long-chain fatty acid-CoA ligase activity(GO:0031957) |
| 0.0 | 1.6 | GO:0008307 | structural constituent of muscle(GO:0008307) |
| 0.0 | 0.5 | GO:0031432 | titin binding(GO:0031432) |
| 0.0 | 3.8 | GO:0005070 | SH3/SH2 adaptor activity(GO:0005070) |
| 0.0 | 0.8 | GO:0005212 | structural constituent of eye lens(GO:0005212) |
| 0.0 | 0.1 | GO:0016361 | activin receptor activity, type I(GO:0016361) |
| 0.0 | 0.1 | GO:0008480 | sarcosine dehydrogenase activity(GO:0008480) oxidoreductase activity, acting on the CH-NH group of donors, flavin as acceptor(GO:0046997) |
| 0.0 | 0.6 | GO:0000339 | RNA cap binding(GO:0000339) |
| 0.0 | 7.5 | GO:0004252 | serine-type endopeptidase activity(GO:0004252) |
| 0.0 | 0.2 | GO:0005223 | intracellular cGMP activated cation channel activity(GO:0005223) |
| 0.0 | 0.3 | GO:0008656 | cysteine-type endopeptidase activator activity involved in apoptotic process(GO:0008656) |
| 0.0 | 0.2 | GO:0008429 | phosphatidylethanolamine binding(GO:0008429) |
| 0.0 | 0.4 | GO:0031435 | mitogen-activated protein kinase kinase kinase binding(GO:0031435) |
| 0.0 | 0.4 | GO:0033130 | acetylcholine receptor binding(GO:0033130) |
| 0.0 | 0.3 | GO:0003680 | AT DNA binding(GO:0003680) |
| 0.0 | 0.4 | GO:0004859 | phospholipase inhibitor activity(GO:0004859) |
| 0.0 | 0.8 | GO:0005544 | calcium-dependent phospholipid binding(GO:0005544) |
| 0.0 | 0.7 | GO:0001205 | transcriptional activator activity, RNA polymerase II distal enhancer sequence-specific binding(GO:0001205) |
| 0.0 | 0.4 | GO:0004549 | tRNA-specific ribonuclease activity(GO:0004549) |
| 0.0 | 0.3 | GO:0051537 | 2 iron, 2 sulfur cluster binding(GO:0051537) |
| 0.0 | 5.1 | GO:0003924 | GTPase activity(GO:0003924) |
| 0.0 | 0.4 | GO:0005248 | voltage-gated sodium channel activity(GO:0005248) voltage-gated ion channel activity involved in regulation of postsynaptic membrane potential(GO:1905030) |
| 0.0 | 0.4 | GO:0005528 | macrolide binding(GO:0005527) FK506 binding(GO:0005528) |
| 0.0 | 0.1 | GO:0047499 | calcium-independent phospholipase A2 activity(GO:0047499) |
| 0.0 | 2.7 | GO:0051015 | actin filament binding(GO:0051015) |
| 0.0 | 0.0 | GO:0032217 | riboflavin transporter activity(GO:0032217) |
| 0.0 | 1.1 | GO:0004519 | endonuclease activity(GO:0004519) |