|
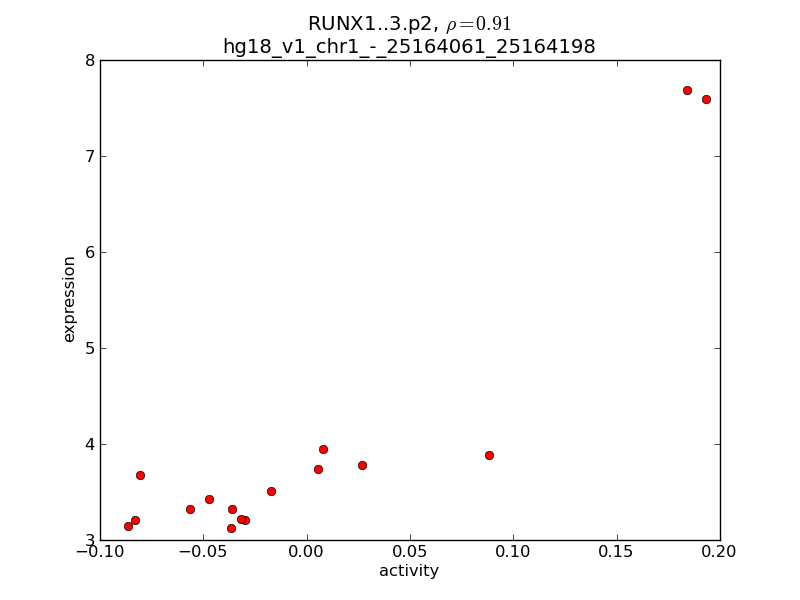
chr1_-_25164061
|
21.007
|
NM_001031680
|
RUNX3
|
runt-related transcription factor 3
|
|
chr9_-_129580732
|
14.199
|
NM_170600
|
SH2D3C
|
SH2 domain containing 3C
|
|
chr14_+_92188329
|
13.272
|
|
RIN3
|
Ras and Rab interactor 3
|
|
chr1_-_114215768
|
12.966
|
NM_001193431
NM_012411
NM_015967
|
PTPN22
|
protein tyrosine phosphatase, non-receptor type 22 (lymphoid)
|
|
chr16_+_29582069
|
11.761
|
NM_003123
|
SPN
|
sialophorin
|
|
chr1_+_207995999
|
11.483
|
NM_025228
|
TRAF3IP3
|
TRAF3 interacting protein 3
|
|
chr17_-_31441390
|
10.479
|
NM_002983
|
CCL3
|
chemokine (C-C motif) ligand 3
|
|
chr4_-_1185144
|
10.462
|
|
LOC100130872
|
hypothetical LOC100130872
|
|
chr2_-_158008763
|
10.323
|
NM_004288
|
CYTIP
|
cytohesin 1 interacting protein
|
|
chrX_-_30505804
|
9.992
|
NM_025159
|
CXorf21
|
chromosome X open reading frame 21
|
|
chr12_+_45896511
|
9.758
|
|
FAM113B
|
family with sequence similarity 113, member B
|
|
chr6_-_41276901
|
9.350
|
NM_024807
|
TREML2
|
triggering receptor expressed on myeloid cells-like 2
|
|
chr16_+_29582065
|
9.277
|
|
SPN
|
sialophorin
|
|
chr12_-_101396459
|
9.273
|
NM_001111284
|
IGF1
|
insulin-like growth factor 1 (somatomedin C)
|
|
chr16_+_28413421
|
9.106
|
NM_018690
|
APOBR
|
apolipoprotein B receptor
|
|
chr21_-_35343448
|
8.921
|
|
RUNX1
|
runt-related transcription factor 1
|
|
chr1_-_205012348
|
8.880
|
NM_000572
|
IL10
|
interleukin 10
|
|
chr21_-_35343331
|
8.667
|
|
RUNX1
|
runt-related transcription factor 1
|
|
chr21_-_35343456
|
8.606
|
NM_001754
|
RUNX1
|
runt-related transcription factor 1
|
|
chr9_-_122728173
|
8.453
|
|
TRAF1
|
TNF receptor-associated factor 1
|
|
chr21_-_35343500
|
8.323
|
|
RUNX1
|
runt-related transcription factor 1
|
|
chr1_+_190811479
|
8.182
|
NM_002922
|
RGS1
|
regulator of G-protein signaling 1
|
|
chr8_-_21827057
|
8.116
|
NM_003974
|
DOK2
|
docking protein 2, 56kDa
|
|
chr11_-_66961709
|
7.711
|
NM_005608
|
PTPRCAP
|
protein tyrosine phosphatase, receptor type, C-associated protein
|
|
chr22_+_38627031
|
7.601
|
NM_004810
|
GRAP2
|
GRB2-related adaptor protein 2
|
|
chr14_+_99601517
|
7.504
|
|
EVL
|
Enah/Vasp-like
|
|
chr19_-_40925151
|
7.448
|
NM_024660
|
TMEM149
|
transmembrane protein 149
|
|
chr15_-_75259714
|
7.349
|
|
PEAK1
|
NKF3 kinase family member
|
|
chr22_+_38627129
|
7.339
|
|
GRAP2
|
GRB2-related adaptor protein 2
|
|
chr14_+_99601498
|
7.334
|
NM_016337
|
EVL
|
Enah/Vasp-like
|
|
chr21_-_35343428
|
7.212
|
|
RUNX1
|
runt-related transcription factor 1
|
|
chr4_-_10295412
|
7.098
|
NM_052964
|
CLNK
|
cytokine-dependent hematopoietic cell linker
|
|
chr3_+_99733432
|
7.097
|
NM_005290
|
GPR15
|
G protein-coupled receptor 15
|
|
chr19_-_55560686
|
7.080
|
NM_004851
|
NAPSA
|
napsin A aspartic peptidase
|
|
chr14_+_92188546
|
7.038
|
|
RIN3
|
Ras and Rab interactor 3
|
|
chr5_-_88155360
|
7.026
|
NM_001193348
NM_001193349
|
MEF2C
|
myocyte enhancer factor 2C
|
|
chr6_-_11490487
|
7.023
|
NM_001142393
|
NEDD9
|
neural precursor cell expressed, developmentally down-regulated 9
|
|
chr1_+_202000906
|
6.873
|
NM_001136190
NM_017773
|
LAX1
|
lymphocyte transmembrane adaptor 1
|
|
chr8_-_102872354
|
6.799
|
|
NCALD
|
neurocalcin delta
|
|
chr1_+_204797516
|
6.767
|
|
RASSF5
|
Ras association (RalGDS/AF-6) domain family member 5
|
|
chr1_-_205161821
|
6.633
|
NM_001193338
NM_001142473
NM_005449
|
FAIM3
|
Fas apoptotic inhibitory molecule 3
|
|
chr5_+_140870881
|
6.503
|
|
|
|
|
chr8_-_102872372
|
6.501
|
|
NCALD
|
neurocalcin delta
|
|
chr19_+_17923110
|
6.422
|
NM_002248
|
KCNN1
|
potassium intermediate/small conductance calcium-activated channel, subfamily N, member 1
|
|
chr1_+_32489426
|
6.404
|
NM_005356
|
LCK
|
lymphocyte-specific protein tyrosine kinase
|
|
chrX_-_70755023
|
6.263
|
NM_001142797
NM_001504
|
CXCR3
|
chemokine (C-X-C motif) receptor 3
|
|
chr1_+_26744929
|
6.202
|
NM_001006665
|
RPS6KA1
|
ribosomal protein S6 kinase, 90kDa, polypeptide 1
|
|
chr6_+_31647854
|
6.114
|
NM_001159740
|
LTA
|
lymphotoxin alpha (TNF superfamily, member 1)
|
|
chr5_+_156628929
|
6.114
|
NM_014376
|
CYFIP2
|
cytoplasmic FMR1 interacting protein 2
|
|
chr14_-_93493519
|
6.111
|
NM_016150
|
ASB2
|
ankyrin repeat and SOCS box containing 2
|
|
chr4_+_76700281
|
6.088
|
NM_178497
|
C4orf26
|
chromosome 4 open reading frame 26
|
|
chr11_+_63864263
|
6.077
|
NM_032251
|
CCDC88B
|
coiled-coil domain containing 88B
|
|
chr17_-_31548167
|
6.021
|
NM_001001437
NM_021006
|
CCL3L3
CCL3
CCL3L1
|
chemokine (C-C motif) ligand 3-like 3
chemokine (C-C motif) ligand 3
chemokine (C-C motif) ligand 3-like 1
|
|
chr1_+_26744893
|
6.007
|
|
RPS6KA1
|
ribosomal protein S6 kinase, 90kDa, polypeptide 1
|
|
chr5_+_140871107
|
5.971
|
|
|
|
|
chr1_+_196874867
|
5.942
|
|
PTPRC
|
protein tyrosine phosphatase, receptor type, C
|
|
chr6_+_31648071
|
5.932
|
NM_000595
|
LTA
|
lymphotoxin alpha (TNF superfamily, member 1)
|
|
chr1_-_155788775
|
5.838
|
NM_001195388
NM_031281
|
FCRL5
|
Fc receptor-like 5
|
|
chr5_+_125723686
|
5.812
|
NM_001146319
|
GRAMD3
|
GRAM domain containing 3
|
|
chr8_-_102872614
|
5.766
|
NM_032041
|
NCALD
|
neurocalcin delta
|
|
chr20_-_1548589
|
5.711
|
NM_001083910
NM_001135844
NM_006065
|
SIRPB1
|
signal-regulatory protein beta 1
|
|
chr12_+_25096472
|
5.707
|
NM_006152
|
LRMP
|
lymphoid-restricted membrane protein
|
|
chr11_+_46339691
|
5.675
|
NM_001105540
|
DGKZ
|
diacylglycerol kinase, zeta
|
|
chr14_+_75058518
|
5.668
|
NM_006399
|
BATF
|
basic leucine zipper transcription factor, ATF-like
|
|
chr6_+_31651319
|
5.587
|
NM_000594
|
TNF
|
tumor necrosis factor
|
|
chr11_+_60495690
|
5.582
|
NM_006725
|
CD6
|
CD6 molecule
|
|
chr3_-_152403636
|
5.501
|
NM_013308
|
GPR171
|
G protein-coupled receptor 171
|
|
chr14_+_75058591
|
5.404
|
|
BATF
|
basic leucine zipper transcription factor, ATF-like
|
|
chr17_-_71352090
|
5.367
|
|
UNC13D
|
unc-13 homolog D (C. elegans)
|
|
chr16_+_29581783
|
5.361
|
NM_001030288
|
SPN
|
sialophorin
|
|
chr1_+_196874839
|
5.323
|
|
PTPRC
|
protein tyrosine phosphatase, receptor type, C
|
|
chr6_-_36412562
|
5.272
|
NM_001010903
|
C6orf222
|
chromosome 6 open reading frame 222
|
|
chr17_-_71352017
|
5.170
|
|
UNC13D
|
unc-13 homolog D (C. elegans)
|
|
chr1_+_196874759
|
5.105
|
NM_002838
NM_080921
NM_080923
|
PTPRC
|
protein tyrosine phosphatase, receptor type, C
|
|
chr18_+_59726183
|
5.080
|
|
SERPINB10
|
serpin peptidase inhibitor, clade B (ovalbumin), member 10
|
|
chr7_+_149761674
|
5.043
|
|
LOC285972
|
hypothetical LOC285972
|
|
chr6_+_52159143
|
5.001
|
NM_002190
|
IL17A
|
interleukin 17A
|
|
chr10_-_6144119
|
4.994
|
NM_000417
|
IL2RA
|
interleukin 2 receptor, alpha
|
|
chr12_-_66839589
|
4.909
|
NM_000619
|
IFNG
|
interferon, gamma
|
|
chr1_-_159306037
|
4.904
|
|
ARHGAP30
|
Rho GTPase activating protein 30
|
|
chrX_+_48427137
|
4.896
|
|
WAS
|
Wiskott-Aldrich syndrome (eczema-thrombocytopenia)
|
|
chr4_+_38740246
|
4.869
|
NM_015990
NM_199039
|
KLHL5
|
kelch-like 5 (Drosophila)
|
|
chr6_+_37511383
|
4.818
|
|
|
|
|
chr3_+_142587973
|
4.809
|
|
|
|
|
chr2_+_102401580
|
4.742
|
NM_003853
|
IL18RAP
|
interleukin 18 receptor accessory protein
|
|
chr16_-_66590856
|
4.679
|
NM_022355
|
DPEP2
|
dipeptidase 2
|
|
chr9_-_99740243
|
4.649
|
NM_197978
|
HEMGN
|
hemogen
|
|
chrX_+_78087484
|
4.621
|
NM_014499
NM_198333
|
P2RY10
|
purinergic receptor P2Y, G-protein coupled, 10
|
|
chr7_+_45033757
|
4.619
|
NM_001029835
|
CCM2
|
cerebral cavernous malformation 2
|
|
chrX_+_48427103
|
4.613
|
NM_000377
|
WAS
|
Wiskott-Aldrich syndrome (eczema-thrombocytopenia)
|
|
chr21_-_35343065
|
4.503
|
|
RUNX1
|
runt-related transcription factor 1
|
|
chr19_+_17495109
|
4.500
|
NM_001098524
NM_173544
|
FAM129C
|
family with sequence similarity 129, member C
|
|
chr22_+_23333610
|
4.482
|
NM_001032365
|
GGT1
|
gamma-glutamyltransferase 1
|
|
chr7_+_37689903
|
4.476
|
|
|
|
|
chr11_-_56761250
|
4.340
|
NM_005161
|
APLNR
|
apelin receptor
|
|
chr15_+_36776090
|
4.339
|
NM_207444
|
C15orf53
|
chromosome 15 open reading frame 53
|
|
chr1_-_159099090
|
4.313
|
NM_001166663
NM_001166664
NM_016382
|
CD244
|
CD244 molecule, natural killer cell receptor 2B4
|
|
chr14_-_105900687
|
4.308
|
|
IGHA1
IGHD
IGHG3
IGHM
SKAP2
|
immunoglobulin heavy constant alpha 1
immunoglobulin heavy constant delta
immunoglobulin heavy constant gamma 3 (G3m marker)
immunoglobulin heavy constant mu
src kinase associated phosphoprotein 2
|
|
chr16_-_66075216
|
4.300
|
NM_001138
|
AGRP
|
agouti related protein homolog (mouse)
|
|
chr1_-_159306210
|
4.270
|
|
ARHGAP30
|
Rho GTPase activating protein 30
|
|
chr10_-_11614279
|
4.168
|
NM_001080491
|
USP6NL
|
USP6 N-terminal like
|
|
chr11_-_31782169
|
4.167
|
|
PAX6
|
paired box 6
|
|
chr2_-_88946767
|
4.155
|
|
|
|
|
chr6_-_31853027
|
4.102
|
NM_025258
|
C6orf27
|
chromosome 6 open reading frame 27
|
|
chrX_-_77801480
|
4.064
|
NM_152694
|
ZCCHC5
|
zinc finger, CCHC domain containing 5
|
|
chr14_-_106154332
|
4.008
|
|
LOC100126583
IGHG1
|
hypothetical LOC100126583
immunoglobulin heavy constant gamma 1 (G1m marker)
|
|
chr1_-_157313179
|
4.005
|
NM_004833
|
AIM2
|
absent in melanoma 2
|
|
chr19_+_60109319
|
3.958
|
NM_001145457
NM_001145458
NM_004829
|
NCR1
|
natural cytotoxicity triggering receptor 1
|
|
chr17_+_69974116
|
3.934
|
NM_007261
|
CD300A
|
CD300a molecule
|
|
chr20_+_54420574
|
3.847
|
NM_001164116
NM_001164114
NM_001164115
NM_020356
|
CASS4
|
Cas scaffolding protein family member 4
|
|
chr1_-_159306273
|
3.835
|
|
ARHGAP30
|
Rho GTPase activating protein 30
|
|
chrX_-_48655978
|
3.834
|
|
PIM2
|
pim-2 oncogene
|
|
chr16_+_28797309
|
3.818
|
NM_004320
NM_173201
|
ATP2A1
|
ATPase, Ca++ transporting, cardiac muscle, fast twitch 1
|
|
chr16_+_31273969
|
3.814
|
NM_000887
|
ITGAX
|
integrin, alpha X (complement component 3 receptor 4 subunit)
|
|
chr12_+_9713472
|
3.807
|
NM_001197318
NM_013269
NM_001004419
NM_001197317
NM_001197319
|
CLEC2D
|
C-type lectin domain family 2, member D
|
|
chr20_+_44070946
|
3.761
|
NM_004994
|
MMP9
|
matrix metallopeptidase 9 (gelatinase B, 92kDa gelatinase, 92kDa type IV collagenase)
|
|
chr3_+_47004457
|
3.757
|
|
NBEAL2
|
neurobeachin-like 2
|
|
chr18_+_19826734
|
3.751
|
NM_153211
|
TTC39C
|
tetratricopeptide repeat domain 39C
|
|
chr6_-_149847809
|
3.704
|
NM_207360
|
ZC3H12D
|
zinc finger CCCH-type containing 12D
|
|
chr13_-_45654296
|
3.701
|
|
LCP1
|
lymphocyte cytosolic protein 1 (L-plastin)
|
|
chr19_+_2240996
|
3.695
|
|
|
|
|
chr19_-_60458915
|
3.638
|
|
PPP6R1
|
protein phosphatase 6, regulatory subunit 1
|
|
chr1_+_149395728
|
3.615
|
NM_024575
|
TNFAIP8L2
|
tumor necrosis factor, alpha-induced protein 8-like 2
|
|
chr20_-_61669550
|
3.611
|
NM_033405
|
PRIC285
|
peroxisomal proliferator-activated receptor A interacting complex 285
|
|
chr4_-_71751205
|
3.608
|
NM_144646
|
IGJ
|
immunoglobulin J polypeptide, linker protein for immunoglobulin alpha and mu polypeptides
|
|
chr4_-_71751070
|
3.565
|
|
IGJ
|
immunoglobulin J polypeptide, linker protein for immunoglobulin alpha and mu polypeptides
|
|
chr14_-_104602784
|
3.533
|
NM_013345
|
GPR132
|
G protein-coupled receptor 132
|
|
chr16_+_27346079
|
3.517
|
NM_021798
|
IL21R
|
interleukin 21 receptor
|
|
chr12_+_25096755
|
3.471
|
|
LRMP
|
lymphoid-restricted membrane protein
|
|
chrX_-_135690699
|
3.468
|
|
ARHGEF6
|
Rac/Cdc42 guanine nucleotide exchange factor (GEF) 6
|
|
chrX_+_154880439
|
3.468
|
NM_002186
|
IL9R
|
interleukin 9 receptor
|
|
chr8_+_144173674
|
3.452
|
|
LY6E
|
lymphocyte antigen 6 complex, locus E
|
|
chr18_+_70317802
|
3.420
|
NM_001168499
|
CNDP2
|
CNDP dipeptidase 2 (metallopeptidase M20 family)
|
|
chr17_+_23818922
|
3.420
|
|
|
|
|
chr19_-_4131778
|
3.415
|
|
SIRT6
|
sirtuin 6
|
|
chr1_-_159306327
|
3.413
|
|
ARHGAP30
|
Rho GTPase activating protein 30
|
|
chr22_+_35586950
|
3.407
|
NM_000631
NM_013416
|
NCF4
|
neutrophil cytosolic factor 4, 40kDa
|
|
chrX_-_135690770
|
3.383
|
|
ARHGEF6
|
Rac/Cdc42 guanine nucleotide exchange factor (GEF) 6
|
|
chr11_+_36379122
|
3.353
|
NM_001160169
|
PRR5L
|
proline rich 5 like
|
|
chr1_+_204797214
|
3.347
|
|
RASSF5
|
Ras association (RalGDS/AF-6) domain family member 5
|
|
chr2_-_29150630
|
3.334
|
NM_001029883
|
C2orf71
|
chromosome 2 open reading frame 71
|
|
chr9_-_122728993
|
3.334
|
NM_005658
|
TRAF1
|
TNF receptor-associated factor 1
|
|
chr12_+_52696908
|
3.316
|
NM_014620
NM_153693
|
HOXC4
HOXC6
|
homeobox C4
homeobox C6
|
|
chr19_-_18058632
|
3.285
|
NM_005535
NM_153701
|
IL12RB1
|
interleukin 12 receptor, beta 1
|
|
chr22_-_36305883
|
3.262
|
NM_006498
|
LGALS2
|
lectin, galactoside-binding, soluble, 2
|
|
chr19_-_48976852
|
3.259
|
|
KCNN4
|
potassium intermediate/small conductance calcium-activated channel, subfamily N, member 4
|
|
chr13_-_45654292
|
3.257
|
|
LCP1
|
lymphocyte cytosolic protein 1 (L-plastin)
|
|
chr19_+_16115454
|
3.235
|
|
HSH2D
|
hematopoietic SH2 domain containing
|
|
chr17_-_59363352
|
3.211
|
NM_000626
NM_001039933
NM_021602
|
CD79B
|
CD79b molecule, immunoglobulin-associated beta
|
|
chr1_-_159306369
|
3.194
|
NM_001025598
NM_181720
|
ARHGAP30
|
Rho GTPase activating protein 30
|
|
chr6_-_32892705
|
3.180
|
NM_002120
|
HLA-DOB
|
major histocompatibility complex, class II, DO beta
|
|
chr14_-_104602809
|
3.162
|
|
GPR132
|
G protein-coupled receptor 132
|
|
chr8_-_101384633
|
3.119
|
NM_015435
|
RNF19A
|
ring finger protein 19A
|
|
chr19_+_8023887
|
3.084
|
NM_005624
|
CCL25
|
chemokine (C-C motif) ligand 25
|
|
chr16_+_23754772
|
3.044
|
NM_002738
NM_212535
|
PRKCB
|
protein kinase C, beta
|
|
chr19_-_16111695
|
3.042
|
|
|
|
|
chr4_-_38482805
|
3.037
|
NM_003263
|
TLR1
|
toll-like receptor 1
|
|
chr6_+_158654464
|
3.037
|
|
TULP4
|
tubby like protein 4
|
|
chrX_+_9391314
|
3.024
|
NM_001139466
NM_001139467
NM_001139468
|
TBL1X
|
transducin (beta)-like 1X-linked
|
|
chr2_-_175170674
|
3.024
|
|
WIPF1
|
WAS/WASL interacting protein family, member 1
|
|
chr5_-_76970129
|
2.990
|
|
OTP
|
orthopedia homeobox
|
|
chr4_-_113656762
|
2.988
|
NM_024019
|
NEUROG2
|
neurogenin 2
|
|
chr1_+_40631603
|
2.987
|
NM_001198979
|
SMAP2
|
small ArfGAP2
|
|
chr5_-_76970264
|
2.982
|
NM_032109
|
OTP
|
orthopedia homeobox
|
|
chr5_-_39238818
|
2.973
|
|
FYB
|
FYN binding protein
|
|
chr11_-_58099884
|
2.945
|
NM_004811
|
LPXN
|
leupaxin
|
|
chr19_-_46504831
|
2.920
|
|
|
|
|
chr12_-_102413875
|
2.910
|
NM_198521
NM_001099336
|
C12orf42
|
chromosome 12 open reading frame 42
|
|
chrX_-_135691168
|
2.904
|
NM_004840
|
ARHGEF6
|
Rac/Cdc42 guanine nucleotide exchange factor (GEF) 6
|
|
chr16_+_31105579
|
2.904
|
|
|
|
|
chr6_-_149847718
|
2.877
|
|
ZC3H12D
|
zinc finger CCCH-type containing 12D
|
|
chr17_-_71352182
|
2.873
|
NM_199242
|
UNC13D
|
unc-13 homolog D (C. elegans)
|
|
chr11_+_71388619
|
2.849
|
NM_001145055
|
IL18BP
|
interleukin 18 binding protein
|
|
chr5_-_140875591
|
2.830
|
|
DIAPH1
|
diaphanous homolog 1 (Drosophila)
|
|
chr2_+_68445936
|
2.821
|
|
PLEK
|
pleckstrin
|
|
chr6_+_28032997
|
2.820
|
NM_012367
|
OR2B6
|
olfactory receptor, family 2, subfamily B, member 6
|
|
chr1_+_158063102
|
2.809
|
NM_020125
|
SLAMF8
|
SLAM family member 8
|
|
chr15_+_64481270
|
2.803
|
|
MAP2K1
|
mitogen-activated protein kinase kinase 1
|
|
chr16_+_51690564
|
2.788
|
|
CHD9
|
chromodomain helicase DNA binding protein 9
|
|
chr1_+_205068844
|
2.778
|
NM_013371
|
IL19
|
interleukin 19
|
|
chr1_+_234624266
|
2.762
|
NM_145861
|
EDARADD
|
EDAR-associated death domain
|
|
chr22_-_16080265
|
2.746
|
|
CECR1
|
cat eye syndrome chromosome region, candidate 1
|
|
chr16_+_55523248
|
2.734
|
NM_001010989
NM_001010990
NM_014685
|
HERPUD1
|
homocysteine-inducible, endoplasmic reticulum stress-inducible, ubiquitin-like domain member 1
|
|
chr16_+_23754822
|
2.729
|
|
PRKCB
|
protein kinase C, beta
|
|
chr19_-_16111594
|
2.706
|
|
|
|
|
chr1_+_154386358
|
2.691
|
NM_001193301
|
SEMA4A
|
sema domain, immunoglobulin domain (Ig), transmembrane domain (TM) and short cytoplasmic domain, (semaphorin) 4A
|
|
chr19_+_55627971
|
2.689
|
NM_004533
|
MYBPC2
|
myosin binding protein C, fast type
|
|
chr22_+_21384862
|
2.688
|
|
IGLV3-21
IGLJ3
IGLC1
|
immunoglobulin lambda variable 3-21
immunoglobulin lambda joining 3
immunoglobulin lambda constant 1 (Mcg marker)
|
|
chr8_+_39890484
|
2.677
|
NM_002164
|
IDO1
|
indoleamine 2,3-dioxygenase 1
|
|
chr22_-_22426551
|
2.650
|
NM_013378
|
VPREB3
|
pre-B lymphocyte 3
|
|
chr5_+_176717553
|
2.633
|
|
|
|
|
chr8_-_127032577
|
2.632
|
|
LOC100130231
|
similar to hCG1814455
|
|
chr11_+_123986661
|
2.610
|
NM_052959
|
PANX3
|
pannexin 3
|
|
chr12_+_6751930
|
2.610
|
NM_002286
|
LAG3
|
lymphocyte-activation gene 3
|
|
chr12_-_4624536
|
2.554
|
NM_006422
|
AKAP3
|
A kinase (PRKA) anchor protein 3
|
|
chr19_-_47328399
|
2.538
|
NM_002698
|
POU2F2
|
POU class 2 homeobox 2
|
|
chr16_+_48857962
|
2.529
|
|
ADCY7
|
adenylate cyclase 7
|
|
chr12_+_52697160
|
2.516
|
|
HOXC5
HOXC6
|
homeobox C5
homeobox C6
|
|
chr1_+_52871603
|
2.515
|
NM_001042693
|
FAM159A
|
family with sequence similarity 159, member A
|
|
chr6_-_68655708
|
2.481
|
|
|
|