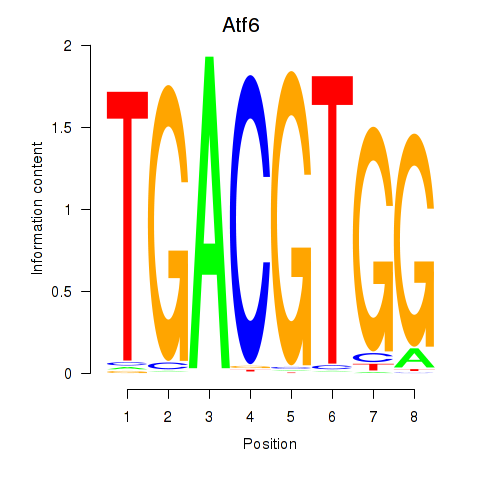
Motif ID: Atf6
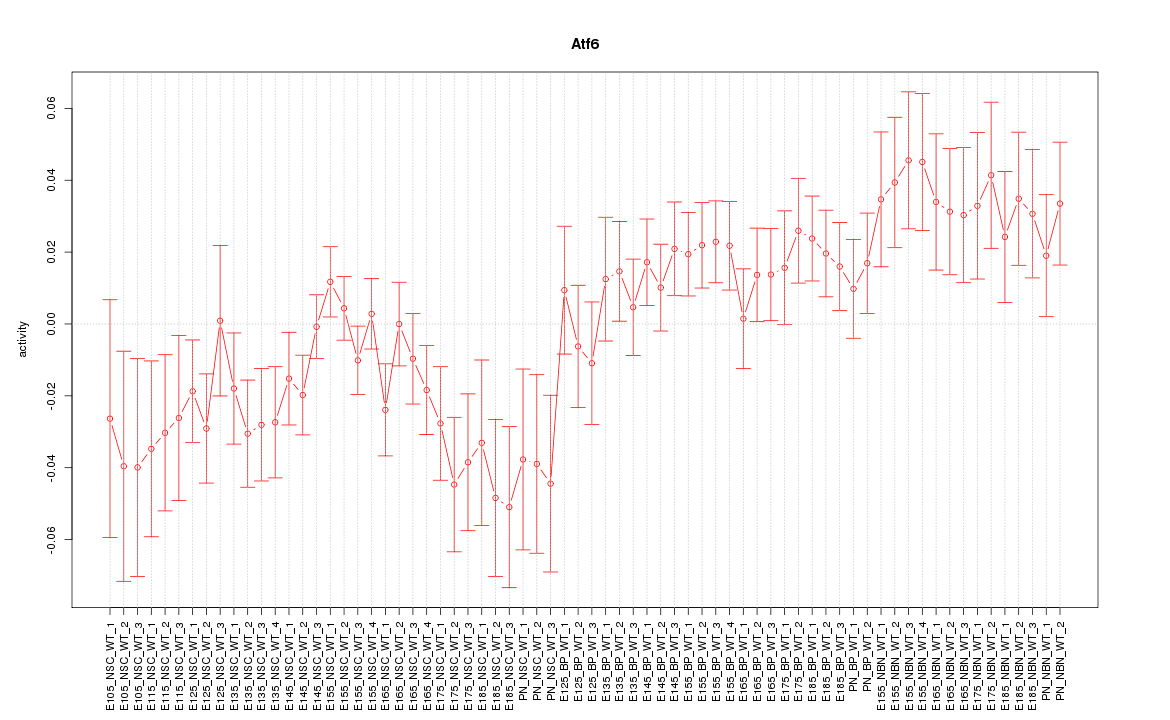
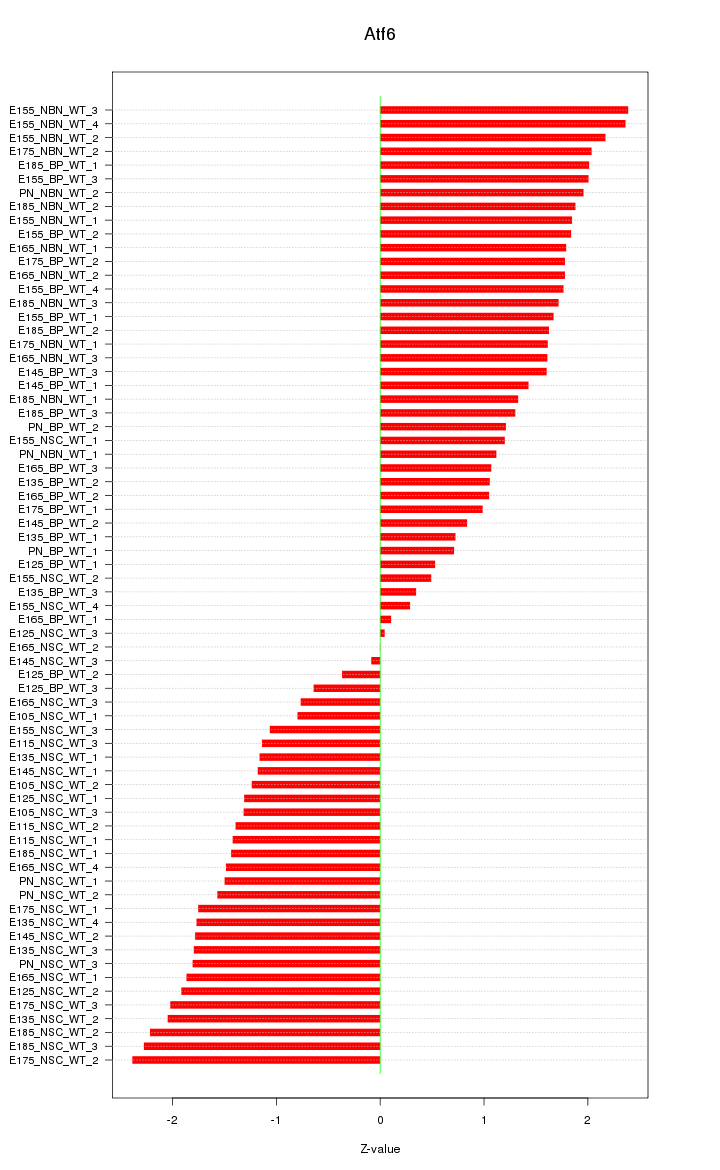
Z-value: 1.510
Transcription factors associated with Atf6:
| Gene Symbol | Entrez ID | Gene Name |
|---|---|---|
| Atf6 | ENSMUSG00000026663.6 | Atf6 |
Activity-expression correlation:
| Gene Symbol | Promoter | Pearson corr. coef. | P-value | Plot |
|---|---|---|---|---|
| Atf6 | mm10_v2_chr1_-_170867761_170867784 | -0.05 | 6.9e-01 | Click! |

Top targets:
Gene overrepresentation in biological_process category:
| Log-likelihood per target | Total log-likelihood | Term | Description |
|---|---|---|---|
| 5.8 | 17.3 | GO:0043379 | memory T cell differentiation(GO:0043379) negative regulation of isotype switching to IgE isotypes(GO:0048294) |
| 2.5 | 2.5 | GO:1900170 | negative regulation of glucocorticoid mediated signaling pathway(GO:1900170) |
| 2.3 | 6.8 | GO:0002159 | desmosome assembly(GO:0002159) |
| 1.9 | 5.7 | GO:0032513 | negative regulation of protein phosphatase type 2B activity(GO:0032513) |
| 1.8 | 16.3 | GO:0090166 | Golgi disassembly(GO:0090166) |
| 1.8 | 5.3 | GO:0060478 | acrosomal vesicle exocytosis(GO:0060478) |
| 1.8 | 10.5 | GO:1902474 | positive regulation of protein localization to synapse(GO:1902474) |
| 1.7 | 6.9 | GO:0035609 | C-terminal protein deglutamylation(GO:0035609) |
| 1.6 | 8.2 | GO:0021993 | initiation of neural tube closure(GO:0021993) |
| 1.6 | 12.9 | GO:0016338 | calcium-independent cell-cell adhesion via plasma membrane cell-adhesion molecules(GO:0016338) |
| 1.6 | 4.7 | GO:0070375 | ERK5 cascade(GO:0070375) |
| 1.6 | 36.0 | GO:0090036 | regulation of protein kinase C signaling(GO:0090036) |
| 1.5 | 4.6 | GO:0060067 | cervix development(GO:0060067) comma-shaped body morphogenesis(GO:0072049) S-shaped body morphogenesis(GO:0072050) anterior head development(GO:0097065) regulation of anterior head development(GO:2000742) positive regulation of anterior head development(GO:2000744) |
| 1.5 | 7.3 | GO:1900748 | positive regulation of vascular endothelial growth factor signaling pathway(GO:1900748) |
| 1.4 | 11.5 | GO:2000301 | negative regulation of synaptic vesicle exocytosis(GO:2000301) |
| 1.4 | 4.1 | GO:0003195 | tricuspid valve development(GO:0003175) tricuspid valve morphogenesis(GO:0003186) tricuspid valve formation(GO:0003195) right ventricular cardiac muscle tissue morphogenesis(GO:0003221) |
| 1.3 | 6.7 | GO:0060075 | regulation of resting membrane potential(GO:0060075) |
| 1.3 | 14.3 | GO:0006995 | cellular response to nitrogen starvation(GO:0006995) cellular response to nitrogen levels(GO:0043562) |
| 1.3 | 19.4 | GO:0002115 | store-operated calcium entry(GO:0002115) |
| 1.3 | 3.8 | GO:0071336 | lung growth(GO:0060437) positive regulation of fat cell proliferation(GO:0070346) regulation of hair follicle cell proliferation(GO:0071336) positive regulation of hair follicle cell proliferation(GO:0071338) |
| 1.2 | 11.1 | GO:0071569 | protein ufmylation(GO:0071569) |
| 1.2 | 7.3 | GO:0019695 | choline metabolic process(GO:0019695) |
| 1.2 | 4.8 | GO:0070358 | actin polymerization-dependent cell motility(GO:0070358) |
| 1.1 | 3.3 | GO:0072531 | pyrimidine-containing compound transmembrane transport(GO:0072531) |
| 1.1 | 9.8 | GO:0036371 | protein localization to M-band(GO:0036309) protein localization to T-tubule(GO:0036371) |
| 1.0 | 2.9 | GO:1902219 | regulation of intrinsic apoptotic signaling pathway in response to osmotic stress(GO:1902218) negative regulation of intrinsic apoptotic signaling pathway in response to osmotic stress(GO:1902219) |
| 0.9 | 22.0 | GO:0002091 | negative regulation of receptor internalization(GO:0002091) |
| 0.9 | 12.4 | GO:0009312 | oligosaccharide biosynthetic process(GO:0009312) |
| 0.9 | 2.6 | GO:1901984 | negative regulation of histone acetylation(GO:0035067) negative regulation of protein acetylation(GO:1901984) negative regulation of peptidyl-lysine acetylation(GO:2000757) |
| 0.8 | 2.5 | GO:0009405 | pathogenesis(GO:0009405) |
| 0.8 | 3.3 | GO:0010891 | negative regulation of sequestering of triglyceride(GO:0010891) |
| 0.8 | 13.9 | GO:0014049 | positive regulation of glutamate secretion(GO:0014049) |
| 0.8 | 4.1 | GO:0071947 | protein deubiquitination involved in ubiquitin-dependent protein catabolic process(GO:0071947) |
| 0.7 | 2.9 | GO:0060729 | intestinal epithelial structure maintenance(GO:0060729) |
| 0.7 | 4.3 | GO:2000672 | negative regulation of motor neuron apoptotic process(GO:2000672) |
| 0.7 | 9.8 | GO:0045176 | apical protein localization(GO:0045176) |
| 0.7 | 4.1 | GO:0071638 | positive regulation of T-helper 1 cell differentiation(GO:0045627) negative regulation of monocyte chemotactic protein-1 production(GO:0071638) |
| 0.7 | 2.7 | GO:0045113 | regulation of integrin biosynthetic process(GO:0045113) |
| 0.6 | 3.2 | GO:1901843 | positive regulation of high voltage-gated calcium channel activity(GO:1901843) |
| 0.6 | 3.8 | GO:0006488 | dolichol-linked oligosaccharide biosynthetic process(GO:0006488) |
| 0.6 | 3.7 | GO:0030397 | membrane disassembly(GO:0030397) nuclear envelope disassembly(GO:0051081) |
| 0.6 | 4.9 | GO:0000395 | mRNA 5'-splice site recognition(GO:0000395) |
| 0.6 | 4.0 | GO:0021937 | cerebellar Purkinje cell-granule cell precursor cell signaling involved in regulation of granule cell precursor cell proliferation(GO:0021937) |
| 0.6 | 3.4 | GO:0002904 | positive regulation of B cell apoptotic process(GO:0002904) |
| 0.6 | 2.3 | GO:0030539 | male genitalia development(GO:0030539) |
| 0.6 | 15.6 | GO:0043496 | regulation of protein homodimerization activity(GO:0043496) |
| 0.5 | 2.2 | GO:0060266 | positive regulation of respiratory burst involved in inflammatory response(GO:0060265) negative regulation of respiratory burst involved in inflammatory response(GO:0060266) negative regulation of respiratory burst(GO:0060268) |
| 0.5 | 5.4 | GO:0043084 | penile erection(GO:0043084) |
| 0.5 | 2.4 | GO:0006646 | phosphatidylethanolamine biosynthetic process(GO:0006646) |
| 0.5 | 6.6 | GO:0032808 | lacrimal gland development(GO:0032808) |
| 0.5 | 2.3 | GO:1901678 | iron coordination entity transport(GO:1901678) |
| 0.4 | 5.8 | GO:0007252 | I-kappaB phosphorylation(GO:0007252) |
| 0.4 | 4.4 | GO:0060081 | membrane hyperpolarization(GO:0060081) |
| 0.4 | 3.4 | GO:0006620 | posttranslational protein targeting to membrane(GO:0006620) |
| 0.4 | 1.2 | GO:1903599 | positive regulation of mitophagy(GO:1903599) |
| 0.4 | 2.8 | GO:0006102 | isocitrate metabolic process(GO:0006102) |
| 0.4 | 1.2 | GO:0071492 | cellular response to UV-A(GO:0071492) |
| 0.4 | 8.4 | GO:0060416 | response to growth hormone(GO:0060416) |
| 0.4 | 0.8 | GO:0051495 | positive regulation of cytoskeleton organization(GO:0051495) |
| 0.4 | 7.2 | GO:0007289 | spermatid nucleus differentiation(GO:0007289) |
| 0.4 | 2.2 | GO:0031642 | negative regulation of myelination(GO:0031642) negative regulation of translation in response to stress(GO:0032055) cellular response to cold(GO:0070417) |
| 0.4 | 0.7 | GO:0048496 | maintenance of organ identity(GO:0048496) |
| 0.3 | 4.1 | GO:0044144 | regulation of growth of symbiont in host(GO:0044126) modulation of growth of symbiont involved in interaction with host(GO:0044144) |
| 0.3 | 2.6 | GO:0071557 | histone H3-K27 demethylation(GO:0071557) |
| 0.3 | 3.7 | GO:0033572 | transferrin transport(GO:0033572) |
| 0.3 | 7.1 | GO:0010107 | potassium ion import(GO:0010107) |
| 0.3 | 5.1 | GO:0035641 | locomotory exploration behavior(GO:0035641) |
| 0.3 | 4.8 | GO:0000188 | inactivation of MAPK activity(GO:0000188) |
| 0.3 | 1.4 | GO:1903025 | regulation of RNA polymerase II regulatory region sequence-specific DNA binding(GO:1903025) |
| 0.2 | 8.7 | GO:0007094 | mitotic spindle assembly checkpoint(GO:0007094) |
| 0.2 | 1.7 | GO:0000103 | sulfate assimilation(GO:0000103) |
| 0.2 | 5.2 | GO:0035025 | positive regulation of Rho protein signal transduction(GO:0035025) |
| 0.2 | 3.1 | GO:0043982 | histone H4-K5 acetylation(GO:0043981) histone H4-K8 acetylation(GO:0043982) |
| 0.2 | 1.2 | GO:0019348 | dolichol metabolic process(GO:0019348) |
| 0.2 | 2.8 | GO:0021527 | spinal cord association neuron differentiation(GO:0021527) |
| 0.2 | 3.8 | GO:2000696 | regulation of epithelial cell differentiation involved in kidney development(GO:2000696) |
| 0.2 | 8.4 | GO:0061098 | positive regulation of protein tyrosine kinase activity(GO:0061098) |
| 0.2 | 2.9 | GO:0043252 | sodium-independent organic anion transport(GO:0043252) |
| 0.2 | 3.8 | GO:2000311 | regulation of alpha-amino-3-hydroxy-5-methyl-4-isoxazole propionate selective glutamate receptor activity(GO:2000311) |
| 0.2 | 2.0 | GO:0045217 | cell-cell junction maintenance(GO:0045217) |
| 0.2 | 1.1 | GO:1902255 | positive regulation of intrinsic apoptotic signaling pathway by p53 class mediator(GO:1902255) |
| 0.2 | 0.6 | GO:1903862 | flavin-containing compound metabolic process(GO:0042726) positive regulation of oxidative phosphorylation(GO:1903862) regulation of ubiquitin-specific protease activity(GO:2000152) |
| 0.2 | 3.0 | GO:0030157 | pancreatic juice secretion(GO:0030157) |
| 0.2 | 1.1 | GO:0048934 | peripheral nervous system neuron differentiation(GO:0048934) peripheral nervous system neuron development(GO:0048935) |
| 0.2 | 0.6 | GO:0060800 | regulation of cell differentiation involved in embryonic placenta development(GO:0060800) |
| 0.2 | 0.2 | GO:0090298 | negative regulation of mitochondrial DNA replication(GO:0090298) |
| 0.2 | 13.0 | GO:0070936 | protein K48-linked ubiquitination(GO:0070936) |
| 0.2 | 3.1 | GO:0010758 | regulation of macrophage chemotaxis(GO:0010758) |
| 0.2 | 0.5 | GO:0051151 | negative regulation of smooth muscle cell differentiation(GO:0051151) |
| 0.2 | 0.5 | GO:0010756 | positive regulation of plasminogen activation(GO:0010756) |
| 0.2 | 2.8 | GO:0043552 | positive regulation of phosphatidylinositol 3-kinase activity(GO:0043552) |
| 0.2 | 0.3 | GO:0060018 | astrocyte fate commitment(GO:0060018) |
| 0.2 | 1.3 | GO:0007220 | Notch receptor processing(GO:0007220) |
| 0.2 | 11.7 | GO:0030433 | ER-associated ubiquitin-dependent protein catabolic process(GO:0030433) |
| 0.2 | 2.2 | GO:0014898 | muscle hypertrophy in response to stress(GO:0003299) cardiac muscle hypertrophy in response to stress(GO:0014898) |
| 0.2 | 1.0 | GO:0061635 | regulation of protein complex stability(GO:0061635) |
| 0.2 | 1.4 | GO:0000712 | resolution of meiotic recombination intermediates(GO:0000712) |
| 0.2 | 0.5 | GO:0032916 | transforming growth factor beta3 production(GO:0032907) regulation of transforming growth factor beta3 production(GO:0032910) positive regulation of transforming growth factor beta3 production(GO:0032916) |
| 0.2 | 6.3 | GO:0036465 | synaptic vesicle recycling(GO:0036465) |
| 0.2 | 1.1 | GO:0051611 | negative regulation of neurotransmitter uptake(GO:0051581) serotonin uptake(GO:0051610) regulation of serotonin uptake(GO:0051611) negative regulation of serotonin uptake(GO:0051612) |
| 0.2 | 5.6 | GO:0001919 | regulation of receptor recycling(GO:0001919) |
| 0.1 | 3.1 | GO:0006828 | manganese ion transport(GO:0006828) |
| 0.1 | 0.4 | GO:0090529 | barrier septum assembly(GO:0000917) cell septum assembly(GO:0090529) |
| 0.1 | 6.0 | GO:0006891 | intra-Golgi vesicle-mediated transport(GO:0006891) |
| 0.1 | 1.9 | GO:0050774 | negative regulation of dendrite morphogenesis(GO:0050774) |
| 0.1 | 5.8 | GO:0071300 | cellular response to retinoic acid(GO:0071300) |
| 0.1 | 4.2 | GO:0016578 | histone deubiquitination(GO:0016578) |
| 0.1 | 0.6 | GO:0044828 | negative regulation by host of viral genome replication(GO:0044828) |
| 0.1 | 1.7 | GO:0030828 | positive regulation of cGMP biosynthetic process(GO:0030828) |
| 0.1 | 1.9 | GO:0060628 | regulation of ER to Golgi vesicle-mediated transport(GO:0060628) |
| 0.1 | 1.1 | GO:0015074 | DNA integration(GO:0015074) |
| 0.1 | 0.8 | GO:0030578 | PML body organization(GO:0030578) |
| 0.1 | 0.7 | GO:0006689 | ganglioside catabolic process(GO:0006689) |
| 0.1 | 5.9 | GO:0000381 | regulation of alternative mRNA splicing, via spliceosome(GO:0000381) |
| 0.1 | 1.2 | GO:1901409 | regulation of phosphorylation of RNA polymerase II C-terminal domain(GO:1901407) positive regulation of phosphorylation of RNA polymerase II C-terminal domain(GO:1901409) |
| 0.1 | 0.6 | GO:0046600 | negative regulation of centriole replication(GO:0046600) |
| 0.1 | 0.2 | GO:0016340 | calcium-dependent cell-matrix adhesion(GO:0016340) |
| 0.1 | 2.1 | GO:0060080 | inhibitory postsynaptic potential(GO:0060080) |
| 0.1 | 0.7 | GO:0060770 | negative regulation of epithelial cell proliferation involved in prostate gland development(GO:0060770) |
| 0.1 | 0.3 | GO:1902358 | sulfate transmembrane transport(GO:1902358) |
| 0.1 | 3.0 | GO:0015991 | energy coupled proton transmembrane transport, against electrochemical gradient(GO:0015988) ATP hydrolysis coupled proton transport(GO:0015991) ATP hydrolysis coupled transmembrane transport(GO:0090662) |
| 0.1 | 1.7 | GO:0007614 | short-term memory(GO:0007614) |
| 0.1 | 1.7 | GO:0043968 | histone H2A acetylation(GO:0043968) |
| 0.1 | 0.1 | GO:0045716 | positive regulation of low-density lipoprotein particle receptor biosynthetic process(GO:0045716) |
| 0.1 | 3.2 | GO:0032292 | myelination in peripheral nervous system(GO:0022011) peripheral nervous system axon ensheathment(GO:0032292) |
| 0.1 | 0.4 | GO:0045347 | negative regulation of MHC class II biosynthetic process(GO:0045347) |
| 0.1 | 0.5 | GO:0090091 | positive regulation of extracellular matrix disassembly(GO:0090091) |
| 0.1 | 2.7 | GO:0070830 | bicellular tight junction assembly(GO:0070830) |
| 0.1 | 2.4 | GO:0000027 | ribosomal large subunit assembly(GO:0000027) |
| 0.1 | 4.5 | GO:0060291 | long-term synaptic potentiation(GO:0060291) |
| 0.1 | 0.3 | GO:0002553 | histamine production involved in inflammatory response(GO:0002349) histamine secretion involved in inflammatory response(GO:0002441) histamine secretion by mast cell(GO:0002553) |
| 0.1 | 0.7 | GO:0048742 | regulation of skeletal muscle fiber development(GO:0048742) |
| 0.1 | 3.5 | GO:0006506 | GPI anchor biosynthetic process(GO:0006506) |
| 0.1 | 5.0 | GO:0010923 | negative regulation of phosphatase activity(GO:0010923) |
| 0.1 | 2.0 | GO:0031146 | SCF-dependent proteasomal ubiquitin-dependent protein catabolic process(GO:0031146) |
| 0.1 | 4.6 | GO:0000045 | autophagosome assembly(GO:0000045) |
| 0.1 | 1.8 | GO:0070534 | protein K63-linked ubiquitination(GO:0070534) |
| 0.1 | 0.7 | GO:1990403 | embryonic brain development(GO:1990403) |
| 0.1 | 1.8 | GO:0030501 | positive regulation of bone mineralization(GO:0030501) |
| 0.1 | 9.3 | GO:0032869 | cellular response to insulin stimulus(GO:0032869) |
| 0.1 | 2.5 | GO:0001707 | mesoderm formation(GO:0001707) |
| 0.1 | 6.5 | GO:0061025 | membrane fusion(GO:0061025) |
| 0.1 | 1.4 | GO:0015813 | L-glutamate transport(GO:0015813) |
| 0.1 | 1.3 | GO:0001829 | trophectodermal cell differentiation(GO:0001829) |
| 0.1 | 1.5 | GO:0009268 | response to pH(GO:0009268) |
| 0.1 | 0.4 | GO:0002862 | negative regulation of inflammatory response to antigenic stimulus(GO:0002862) |
| 0.1 | 1.6 | GO:0005978 | glycogen biosynthetic process(GO:0005978) glucan biosynthetic process(GO:0009250) |
| 0.1 | 3.6 | GO:0031929 | TOR signaling(GO:0031929) |
| 0.0 | 2.4 | GO:0006418 | tRNA aminoacylation for protein translation(GO:0006418) |
| 0.0 | 3.5 | GO:1903169 | regulation of calcium ion transmembrane transport(GO:1903169) |
| 0.0 | 0.9 | GO:0003333 | amino acid transmembrane transport(GO:0003333) |
| 0.0 | 0.1 | GO:2000819 | regulation of nucleotide-excision repair(GO:2000819) |
| 0.0 | 1.1 | GO:0043666 | regulation of phosphoprotein phosphatase activity(GO:0043666) |
| 0.0 | 7.6 | GO:0043547 | positive regulation of GTPase activity(GO:0043547) |
| 0.0 | 2.3 | GO:0071774 | response to fibroblast growth factor(GO:0071774) |
| 0.0 | 0.6 | GO:2001222 | regulation of neuron migration(GO:2001222) |
| 0.0 | 1.0 | GO:0045669 | positive regulation of osteoblast differentiation(GO:0045669) |
| 0.0 | 0.6 | GO:0048147 | negative regulation of fibroblast proliferation(GO:0048147) |
| 0.0 | 0.1 | GO:2000643 | positive regulation of early endosome to late endosome transport(GO:2000643) |
| 0.0 | 0.6 | GO:0003016 | respiratory system process(GO:0003016) |
| 0.0 | 0.3 | GO:0002385 | mucosal immune response(GO:0002385) |
| 0.0 | 0.8 | GO:0030488 | tRNA methylation(GO:0030488) |
| 0.0 | 2.2 | GO:0045598 | regulation of fat cell differentiation(GO:0045598) |
| 0.0 | 4.3 | GO:0030308 | negative regulation of cell growth(GO:0030308) |
| 0.0 | 2.4 | GO:0006334 | nucleosome assembly(GO:0006334) |
| 0.0 | 0.1 | GO:0006824 | cobalt ion transport(GO:0006824) |
| 0.0 | 2.0 | GO:1990138 | neuron projection extension(GO:1990138) |
| 0.0 | 0.1 | GO:0033169 | histone H3-K9 demethylation(GO:0033169) regulation of histone H3-K9 trimethylation(GO:1900112) negative regulation of histone H3-K9 trimethylation(GO:1900113) |
| 0.0 | 1.0 | GO:0046513 | ceramide biosynthetic process(GO:0046513) |
| 0.0 | 0.2 | GO:0006614 | SRP-dependent cotranslational protein targeting to membrane(GO:0006614) |
| 0.0 | 1.6 | GO:0030518 | intracellular steroid hormone receptor signaling pathway(GO:0030518) |
| 0.0 | 0.2 | GO:0030836 | positive regulation of actin filament depolymerization(GO:0030836) |
| 0.0 | 0.6 | GO:0045761 | regulation of adenylate cyclase activity(GO:0045761) |
| 0.0 | 0.4 | GO:0030318 | melanocyte differentiation(GO:0030318) |
| 0.0 | 0.2 | GO:0033866 | coenzyme A biosynthetic process(GO:0015937) nucleoside bisphosphate biosynthetic process(GO:0033866) ribonucleoside bisphosphate biosynthetic process(GO:0034030) purine nucleoside bisphosphate biosynthetic process(GO:0034033) |
| 0.0 | 0.2 | GO:0009191 | ribonucleoside diphosphate catabolic process(GO:0009191) |
| 0.0 | 1.5 | GO:0050727 | regulation of inflammatory response(GO:0050727) |
| 0.0 | 0.6 | GO:0051568 | histone H3-K4 methylation(GO:0051568) |
Gene overrepresentation in cellular_component category:
| Log-likelihood per target | Total log-likelihood | Term | Description |
|---|---|---|---|
| 1.8 | 20.3 | GO:0043083 | synaptic cleft(GO:0043083) |
| 1.4 | 10.0 | GO:0005827 | polar microtubule(GO:0005827) |
| 1.0 | 5.0 | GO:0005784 | Sec61 translocon complex(GO:0005784) translocon complex(GO:0071256) |
| 0.8 | 14.3 | GO:0000421 | autophagosome membrane(GO:0000421) |
| 0.7 | 2.2 | GO:1990316 | ATG1/ULK1 kinase complex(GO:1990316) |
| 0.7 | 3.5 | GO:0070044 | synaptobrevin 2-SNAP-25-syntaxin-1a complex(GO:0070044) |
| 0.7 | 3.3 | GO:0032541 | cortical endoplasmic reticulum(GO:0032541) |
| 0.6 | 12.9 | GO:0016327 | apicolateral plasma membrane(GO:0016327) |
| 0.6 | 3.2 | GO:0038039 | G-protein coupled receptor heterodimeric complex(GO:0038039) |
| 0.6 | 8.6 | GO:0031045 | dense core granule(GO:0031045) |
| 0.5 | 19.7 | GO:0043034 | costamere(GO:0043034) |
| 0.5 | 26.2 | GO:0005834 | heterotrimeric G-protein complex(GO:0005834) |
| 0.5 | 3.7 | GO:0060053 | neurofilament cytoskeleton(GO:0060053) |
| 0.5 | 3.1 | GO:0030127 | COPII vesicle coat(GO:0030127) |
| 0.5 | 1.4 | GO:0071821 | FANCM-MHF complex(GO:0071821) |
| 0.4 | 5.8 | GO:0008385 | IkappaB kinase complex(GO:0008385) |
| 0.4 | 4.0 | GO:0001739 | sex chromatin(GO:0001739) |
| 0.4 | 17.6 | GO:0030672 | synaptic vesicle membrane(GO:0030672) exocytic vesicle membrane(GO:0099501) |
| 0.4 | 18.8 | GO:0031201 | SNARE complex(GO:0031201) |
| 0.4 | 4.0 | GO:0000137 | Golgi cis cisterna(GO:0000137) |
| 0.4 | 4.2 | GO:0000124 | SAGA complex(GO:0000124) |
| 0.3 | 4.6 | GO:0030126 | COPI vesicle coat(GO:0030126) |
| 0.3 | 2.9 | GO:0000813 | ESCRT I complex(GO:0000813) |
| 0.3 | 3.9 | GO:0005801 | cis-Golgi network(GO:0005801) |
| 0.3 | 4.7 | GO:0000506 | glycosylphosphatidylinositol-N-acetylglucosaminyltransferase (GPI-GnT) complex(GO:0000506) |
| 0.3 | 6.8 | GO:0005605 | basal lamina(GO:0005605) |
| 0.3 | 3.0 | GO:0033179 | proton-transporting V-type ATPase, V0 domain(GO:0033179) |
| 0.2 | 3.8 | GO:0032279 | asymmetric synapse(GO:0032279) |
| 0.2 | 5.3 | GO:0097038 | perinuclear endoplasmic reticulum(GO:0097038) |
| 0.2 | 2.5 | GO:0030130 | clathrin coat of trans-Golgi network vesicle(GO:0030130) |
| 0.2 | 0.6 | GO:1990730 | VCP-NSFL1C complex(GO:1990730) |
| 0.2 | 1.5 | GO:0072357 | PTW/PP1 phosphatase complex(GO:0072357) |
| 0.2 | 6.5 | GO:0035371 | microtubule plus-end(GO:0035371) |
| 0.2 | 14.8 | GO:0005657 | replication fork(GO:0005657) |
| 0.2 | 2.7 | GO:0017119 | Golgi transport complex(GO:0017119) |
| 0.2 | 14.3 | GO:0008076 | voltage-gated potassium channel complex(GO:0008076) |
| 0.2 | 5.1 | GO:0031225 | anchored component of membrane(GO:0031225) |
| 0.2 | 1.2 | GO:0019907 | cyclin-dependent protein kinase activating kinase holoenzyme complex(GO:0019907) |
| 0.2 | 1.3 | GO:0071541 | eukaryotic translation initiation factor 3 complex, eIF3m(GO:0071541) |
| 0.2 | 5.7 | GO:0035145 | exon-exon junction complex(GO:0035145) |
| 0.2 | 34.2 | GO:0030426 | growth cone(GO:0030426) |
| 0.1 | 1.0 | GO:0005964 | phosphorylase kinase complex(GO:0005964) |
| 0.1 | 0.7 | GO:0042582 | primary lysosome(GO:0005766) azurophil granule(GO:0042582) |
| 0.1 | 0.6 | GO:0072487 | MSL complex(GO:0072487) |
| 0.1 | 5.7 | GO:0034704 | calcium channel complex(GO:0034704) |
| 0.1 | 4.8 | GO:0031594 | neuromuscular junction(GO:0031594) |
| 0.1 | 5.4 | GO:0001750 | photoreceptor outer segment(GO:0001750) |
| 0.1 | 3.3 | GO:0016235 | aggresome(GO:0016235) |
| 0.1 | 3.6 | GO:0071339 | MLL1/2 complex(GO:0044665) MLL1 complex(GO:0071339) |
| 0.1 | 2.3 | GO:0043189 | NuA4 histone acetyltransferase complex(GO:0035267) H4/H2A histone acetyltransferase complex(GO:0043189) H4 histone acetyltransferase complex(GO:1902562) |
| 0.1 | 0.6 | GO:0070847 | core mediator complex(GO:0070847) |
| 0.1 | 7.6 | GO:0030315 | T-tubule(GO:0030315) |
| 0.1 | 0.5 | GO:0001652 | granular component(GO:0001652) |
| 0.1 | 3.9 | GO:0005811 | lipid particle(GO:0005811) |
| 0.1 | 0.3 | GO:0097433 | dense body(GO:0097433) |
| 0.1 | 0.4 | GO:0042827 | platelet dense granule(GO:0042827) |
| 0.1 | 8.2 | GO:0030117 | membrane coat(GO:0030117) coated membrane(GO:0048475) |
| 0.1 | 3.7 | GO:0042734 | presynaptic membrane(GO:0042734) |
| 0.1 | 4.8 | GO:0031519 | PcG protein complex(GO:0031519) |
| 0.1 | 3.2 | GO:0005776 | autophagosome(GO:0005776) |
| 0.1 | 2.1 | GO:0060077 | inhibitory synapse(GO:0060077) |
| 0.1 | 5.2 | GO:0031234 | extrinsic component of cytoplasmic side of plasma membrane(GO:0031234) |
| 0.1 | 14.4 | GO:0043209 | myelin sheath(GO:0043209) |
| 0.1 | 2.7 | GO:0016459 | myosin complex(GO:0016459) |
| 0.1 | 0.8 | GO:0016272 | prefoldin complex(GO:0016272) |
| 0.1 | 3.3 | GO:0005788 | endoplasmic reticulum lumen(GO:0005788) |
| 0.1 | 5.8 | GO:0032587 | ruffle membrane(GO:0032587) |
| 0.1 | 1.6 | GO:0032281 | AMPA glutamate receptor complex(GO:0032281) |
| 0.1 | 13.6 | GO:0097060 | synaptic membrane(GO:0097060) |
| 0.1 | 28.5 | GO:0043025 | neuronal cell body(GO:0043025) |
| 0.1 | 0.7 | GO:0097542 | ciliary tip(GO:0097542) |
| 0.1 | 0.6 | GO:0019773 | proteasome core complex, alpha-subunit complex(GO:0019773) |
| 0.0 | 1.3 | GO:0005844 | polysome(GO:0005844) |
| 0.0 | 2.2 | GO:0022627 | cytosolic small ribosomal subunit(GO:0022627) |
| 0.0 | 4.9 | GO:0090575 | RNA polymerase II transcription factor complex(GO:0090575) |
| 0.0 | 14.3 | GO:0005874 | microtubule(GO:0005874) |
| 0.0 | 0.8 | GO:0030877 | beta-catenin destruction complex(GO:0030877) |
| 0.0 | 5.2 | GO:0009986 | cell surface(GO:0009986) |
| 0.0 | 0.9 | GO:0035097 | histone methyltransferase complex(GO:0035097) |
| 0.0 | 0.3 | GO:0042571 | immunoglobulin complex, circulating(GO:0042571) |
| 0.0 | 0.3 | GO:0030008 | TRAPP complex(GO:0030008) |
| 0.0 | 2.0 | GO:0019005 | SCF ubiquitin ligase complex(GO:0019005) |
| 0.0 | 0.2 | GO:0005786 | signal recognition particle, endoplasmic reticulum targeting(GO:0005786) signal recognition particle(GO:0048500) |
| 0.0 | 0.8 | GO:0016592 | mediator complex(GO:0016592) |
| 0.0 | 2.0 | GO:0022625 | cytosolic large ribosomal subunit(GO:0022625) |
| 0.0 | 1.3 | GO:0031463 | Cul3-RING ubiquitin ligase complex(GO:0031463) |
| 0.0 | 0.2 | GO:0046930 | pore complex(GO:0046930) |
| 0.0 | 2.9 | GO:0016323 | basolateral plasma membrane(GO:0016323) |
| 0.0 | 4.1 | GO:0000139 | Golgi membrane(GO:0000139) |
| 0.0 | 2.0 | GO:0016324 | apical plasma membrane(GO:0016324) |
| 0.0 | 0.1 | GO:0031464 | Cul4A-RING E3 ubiquitin ligase complex(GO:0031464) |
| 0.0 | 0.6 | GO:0030864 | cortical actin cytoskeleton(GO:0030864) |
| 0.0 | 0.7 | GO:0008023 | transcription elongation factor complex(GO:0008023) |
| 0.0 | 0.2 | GO:0000795 | synaptonemal complex(GO:0000795) |
| 0.0 | 0.3 | GO:0005795 | Golgi stack(GO:0005795) |
Gene overrepresentation in molecular_function category:
| Log-likelihood per target | Total log-likelihood | Term | Description |
|---|---|---|---|
| 3.0 | 11.9 | GO:0005483 | soluble NSF attachment protein activity(GO:0005483) |
| 1.8 | 7.3 | GO:0004104 | cholinesterase activity(GO:0004104) choline binding(GO:0033265) |
| 1.5 | 7.7 | GO:0008269 | JAK pathway signal transduction adaptor activity(GO:0008269) |
| 1.5 | 7.6 | GO:0015467 | G-protein activated inward rectifier potassium channel activity(GO:0015467) |
| 1.4 | 17.3 | GO:0001161 | intronic transcription regulatory region sequence-specific DNA binding(GO:0001161) |
| 1.4 | 11.4 | GO:0008499 | UDP-galactose:beta-N-acetylglucosamine beta-1,3-galactosyltransferase activity(GO:0008499) |
| 1.4 | 9.5 | GO:0004971 | AMPA glutamate receptor activity(GO:0004971) |
| 1.3 | 15.6 | GO:0015279 | store-operated calcium channel activity(GO:0015279) |
| 1.2 | 2.4 | GO:0004103 | choline kinase activity(GO:0004103) |
| 1.1 | 10.7 | GO:0031749 | D2 dopamine receptor binding(GO:0031749) |
| 1.0 | 8.2 | GO:0008429 | phosphatidylethanolamine binding(GO:0008429) |
| 1.0 | 2.9 | GO:0005128 | erythropoietin receptor binding(GO:0005128) |
| 1.0 | 6.9 | GO:0031802 | type 5 metabotropic glutamate receptor binding(GO:0031802) |
| 1.0 | 3.8 | GO:0005111 | type 2 fibroblast growth factor receptor binding(GO:0005111) |
| 0.9 | 2.8 | GO:0004449 | isocitrate dehydrogenase (NAD+) activity(GO:0004449) |
| 0.9 | 3.7 | GO:0070012 | oligopeptidase activity(GO:0070012) |
| 0.9 | 2.7 | GO:0005436 | sodium:phosphate symporter activity(GO:0005436) sodium:inorganic phosphate symporter activity(GO:0015319) |
| 0.9 | 14.6 | GO:0097371 | MDM2/MDM4 family protein binding(GO:0097371) |
| 0.9 | 6.8 | GO:0035184 | histone threonine kinase activity(GO:0035184) |
| 0.8 | 4.0 | GO:0061676 | importin-alpha family protein binding(GO:0061676) |
| 0.7 | 11.3 | GO:0051864 | histone demethylase activity (H3-K36 specific)(GO:0051864) |
| 0.6 | 3.8 | GO:0004691 | cAMP-dependent protein kinase activity(GO:0004691) |
| 0.6 | 6.7 | GO:0022841 | potassium ion leak channel activity(GO:0022841) |
| 0.6 | 1.7 | GO:0030249 | guanylate cyclase regulator activity(GO:0030249) |
| 0.5 | 14.8 | GO:0001786 | phosphatidylserine binding(GO:0001786) |
| 0.5 | 3.2 | GO:0004965 | G-protein coupled GABA receptor activity(GO:0004965) |
| 0.5 | 2.5 | GO:0045545 | syndecan binding(GO:0045545) |
| 0.5 | 4.9 | GO:0050733 | RS domain binding(GO:0050733) |
| 0.4 | 4.4 | GO:0008140 | cAMP response element binding protein binding(GO:0008140) |
| 0.4 | 3.2 | GO:0031811 | G-protein coupled nucleotide receptor binding(GO:0031811) P2Y1 nucleotide receptor binding(GO:0031812) |
| 0.4 | 3.5 | GO:0017176 | phosphatidylinositol N-acetylglucosaminyltransferase activity(GO:0017176) |
| 0.4 | 5.7 | GO:0019855 | calcium channel inhibitor activity(GO:0019855) |
| 0.4 | 2.2 | GO:0071074 | eukaryotic initiation factor eIF2 binding(GO:0071074) |
| 0.4 | 2.2 | GO:0030375 | thyroid hormone receptor coactivator activity(GO:0030375) |
| 0.4 | 6.4 | GO:0004190 | aspartic-type endopeptidase activity(GO:0004190) aspartic-type peptidase activity(GO:0070001) |
| 0.3 | 3.1 | GO:0043995 | histone acetyltransferase activity (H4-K5 specific)(GO:0043995) histone acetyltransferase activity (H4-K8 specific)(GO:0043996) histone acetyltransferase activity (H4-K16 specific)(GO:0046972) |
| 0.3 | 6.2 | GO:0050811 | GABA receptor binding(GO:0050811) |
| 0.3 | 10.3 | GO:0005158 | insulin receptor binding(GO:0005158) |
| 0.3 | 9.8 | GO:0008093 | cytoskeletal adaptor activity(GO:0008093) |
| 0.3 | 11.3 | GO:0005154 | epidermal growth factor receptor binding(GO:0005154) |
| 0.3 | 5.4 | GO:0003924 | GTPase activity(GO:0003924) |
| 0.3 | 1.2 | GO:0016018 | cyclosporin A binding(GO:0016018) |
| 0.3 | 6.2 | GO:0005159 | insulin-like growth factor receptor binding(GO:0005159) |
| 0.3 | 2.5 | GO:0015643 | toxic substance binding(GO:0015643) |
| 0.3 | 1.7 | GO:0008597 | calcium-dependent protein serine/threonine phosphatase regulator activity(GO:0008597) |
| 0.3 | 5.2 | GO:0005545 | 1-phosphatidylinositol binding(GO:0005545) |
| 0.3 | 4.1 | GO:0015248 | sterol transporter activity(GO:0015248) |
| 0.3 | 2.9 | GO:0015347 | sodium-independent organic anion transmembrane transporter activity(GO:0015347) |
| 0.3 | 2.1 | GO:0042043 | neurexin family protein binding(GO:0042043) |
| 0.3 | 5.4 | GO:0005184 | neuropeptide hormone activity(GO:0005184) |
| 0.2 | 10.5 | GO:0005484 | SNAP receptor activity(GO:0005484) |
| 0.2 | 1.2 | GO:0004582 | dolichyl-phosphate beta-D-mannosyltransferase activity(GO:0004582) |
| 0.2 | 1.4 | GO:0046975 | histone methyltransferase activity (H3-K36 specific)(GO:0046975) |
| 0.2 | 4.0 | GO:0004181 | metallocarboxypeptidase activity(GO:0004181) |
| 0.2 | 1.1 | GO:0005030 | neurotrophin receptor activity(GO:0005030) |
| 0.2 | 3.2 | GO:0005104 | fibroblast growth factor receptor binding(GO:0005104) |
| 0.2 | 7.0 | GO:0005246 | calcium channel regulator activity(GO:0005246) |
| 0.2 | 4.8 | GO:0008330 | protein tyrosine/threonine phosphatase activity(GO:0008330) |
| 0.2 | 18.8 | GO:0004860 | protein kinase inhibitor activity(GO:0004860) |
| 0.2 | 0.9 | GO:0002094 | polyprenyltransferase activity(GO:0002094) |
| 0.2 | 4.1 | GO:0070530 | K63-linked polyubiquitin binding(GO:0070530) |
| 0.2 | 5.3 | GO:0005544 | calcium-dependent phospholipid binding(GO:0005544) |
| 0.1 | 0.4 | GO:0042289 | MHC class II protein binding(GO:0042289) |
| 0.1 | 1.0 | GO:0004689 | phosphorylase kinase activity(GO:0004689) |
| 0.1 | 4.2 | GO:0005251 | delayed rectifier potassium channel activity(GO:0005251) |
| 0.1 | 2.8 | GO:0004707 | MAP kinase activity(GO:0004707) |
| 0.1 | 0.5 | GO:0003976 | UDP-N-acetylglucosamine-lysosomal-enzyme N-acetylglucosaminephosphotransferase activity(GO:0003976) |
| 0.1 | 0.7 | GO:0004563 | beta-N-acetylhexosaminidase activity(GO:0004563) |
| 0.1 | 0.6 | GO:0036435 | K48-linked polyubiquitin binding(GO:0036435) BAT3 complex binding(GO:1904288) |
| 0.1 | 7.1 | GO:0004497 | monooxygenase activity(GO:0004497) |
| 0.1 | 3.0 | GO:0080025 | phosphatidylinositol-3,5-bisphosphate binding(GO:0080025) |
| 0.1 | 4.3 | GO:0004709 | MAP kinase kinase kinase activity(GO:0004709) |
| 0.1 | 2.4 | GO:0070577 | lysine-acetylated histone binding(GO:0070577) |
| 0.1 | 3.0 | GO:0046961 | proton-transporting ATPase activity, rotational mechanism(GO:0046961) |
| 0.1 | 1.0 | GO:0050291 | sphingosine N-acyltransferase activity(GO:0050291) |
| 0.1 | 1.5 | GO:0005247 | voltage-gated chloride channel activity(GO:0005247) |
| 0.1 | 5.6 | GO:0004376 | glycolipid mannosyltransferase activity(GO:0004376) |
| 0.1 | 3.7 | GO:0004864 | protein phosphatase inhibitor activity(GO:0004864) |
| 0.1 | 3.0 | GO:0005179 | hormone activity(GO:0005179) |
| 0.1 | 1.5 | GO:0005035 | tumor necrosis factor-activated receptor activity(GO:0005031) death receptor activity(GO:0005035) |
| 0.1 | 2.0 | GO:0030742 | GTP-dependent protein binding(GO:0030742) |
| 0.1 | 8.2 | GO:0008565 | protein transporter activity(GO:0008565) |
| 0.1 | 1.4 | GO:0005313 | L-glutamate transmembrane transporter activity(GO:0005313) |
| 0.1 | 1.2 | GO:0008353 | RNA polymerase II carboxy-terminal domain kinase activity(GO:0008353) |
| 0.1 | 1.4 | GO:0035380 | C-3 sterol dehydrogenase (C-4 sterol decarboxylase) activity(GO:0000252) mevaldate reductase activity(GO:0004495) gluconate dehydrogenase activity(GO:0008875) epoxide dehydrogenase activity(GO:0018451) 5-exo-hydroxycamphor dehydrogenase activity(GO:0018452) 2-hydroxytetrahydrofuran dehydrogenase activity(GO:0018453) acetoin dehydrogenase activity(GO:0019152) phenylcoumaran benzylic ether reductase activity(GO:0032442) D-xylose:NADP reductase activity(GO:0032866) L-arabinose:NADP reductase activity(GO:0032867) D-arabinitol dehydrogenase, D-ribulose forming (NADP+) activity(GO:0033709) (R)-(-)-1,2,3,4-tetrahydronaphthol dehydrogenase activity(GO:0034831) 3-hydroxymenthone dehydrogenase activity(GO:0034840) very long-chain-3-hydroxyacyl-CoA dehydrogenase activity(GO:0035380) dihydrotestosterone 17-beta-dehydrogenase activity(GO:0035410) (R)-2-hydroxyisocaproate dehydrogenase activity(GO:0043713) L-arabinose 1-dehydrogenase (NADP+) activity(GO:0044103) L-xylulose reductase (NAD+) activity(GO:0044105) 3-ketoglucose-reductase activity(GO:0048258) D-arabinitol dehydrogenase, D-xylulose forming (NADP+) activity(GO:0052677) |
| 0.1 | 3.5 | GO:0001105 | RNA polymerase II transcription coactivator activity(GO:0001105) |
| 0.1 | 2.1 | GO:0004027 | alcohol sulfotransferase activity(GO:0004027) |
| 0.1 | 4.1 | GO:0016765 | transferase activity, transferring alkyl or aryl (other than methyl) groups(GO:0016765) |
| 0.1 | 8.3 | GO:0017137 | Rab GTPase binding(GO:0017137) |
| 0.1 | 1.9 | GO:0017134 | fibroblast growth factor binding(GO:0017134) |
| 0.1 | 1.0 | GO:0042800 | histone methyltransferase activity (H3-K4 specific)(GO:0042800) |
| 0.0 | 2.4 | GO:0004812 | aminoacyl-tRNA ligase activity(GO:0004812) |
| 0.0 | 0.2 | GO:0004594 | pantothenate kinase activity(GO:0004594) |
| 0.0 | 0.4 | GO:0097027 | ubiquitin-protein transferase activator activity(GO:0097027) |
| 0.0 | 0.8 | GO:0044183 | protein binding involved in protein folding(GO:0044183) |
| 0.0 | 0.2 | GO:0004382 | guanosine-diphosphatase activity(GO:0004382) |
| 0.0 | 10.8 | GO:0005096 | GTPase activator activity(GO:0005096) |
| 0.0 | 1.0 | GO:0030695 | GTPase regulator activity(GO:0030695) |
| 0.0 | 1.2 | GO:0070566 | adenylyltransferase activity(GO:0070566) |
| 0.0 | 0.6 | GO:0008179 | adenylate cyclase binding(GO:0008179) |
| 0.0 | 20.1 | GO:0004842 | ubiquitin-protein transferase activity(GO:0004842) |
| 0.0 | 0.6 | GO:0001530 | lipopolysaccharide binding(GO:0001530) |
| 0.0 | 0.2 | GO:0008312 | 7S RNA binding(GO:0008312) |
| 0.0 | 7.7 | GO:0004175 | endopeptidase activity(GO:0004175) |
| 0.0 | 1.2 | GO:0051879 | Hsp90 protein binding(GO:0051879) |
| 0.0 | 2.1 | GO:0019003 | GDP binding(GO:0019003) |
| 0.0 | 3.3 | GO:0005089 | Rho guanyl-nucleotide exchange factor activity(GO:0005089) |
| 0.0 | 0.5 | GO:0035497 | cAMP response element binding(GO:0035497) |
| 0.0 | 0.2 | GO:0003910 | DNA ligase activity(GO:0003909) DNA ligase (ATP) activity(GO:0003910) |
| 0.0 | 7.6 | GO:0008017 | microtubule binding(GO:0008017) |
| 0.0 | 0.3 | GO:0019531 | oxalate transmembrane transporter activity(GO:0019531) |
| 0.0 | 1.0 | GO:0008375 | acetylglucosaminyltransferase activity(GO:0008375) |
| 0.0 | 1.9 | GO:0003730 | mRNA 3'-UTR binding(GO:0003730) |
| 0.0 | 1.0 | GO:0097472 | cyclin-dependent protein serine/threonine kinase activity(GO:0004693) cyclin-dependent protein kinase activity(GO:0097472) |
| 0.0 | 1.6 | GO:0004879 | RNA polymerase II transcription factor activity, ligand-activated sequence-specific DNA binding(GO:0004879) transcription factor activity, direct ligand regulated sequence-specific DNA binding(GO:0098531) |
| 0.0 | 2.6 | GO:0101005 | thiol-dependent ubiquitinyl hydrolase activity(GO:0036459) ubiquitinyl hydrolase activity(GO:0101005) |
| 0.0 | 5.3 | GO:0003735 | structural constituent of ribosome(GO:0003735) |
| 0.0 | 15.6 | GO:0008270 | zinc ion binding(GO:0008270) |
| 0.0 | 3.0 | GO:0004519 | endonuclease activity(GO:0004519) |
| 0.0 | 0.9 | GO:0015179 | L-amino acid transmembrane transporter activity(GO:0015179) |
| 0.0 | 1.9 | GO:0001085 | RNA polymerase II transcription factor binding(GO:0001085) |
| 0.0 | 0.1 | GO:0070290 | N-acylphosphatidylethanolamine-specific phospholipase D activity(GO:0070290) |
| 0.0 | 1.1 | GO:0019903 | protein phosphatase binding(GO:0019903) |
| 0.0 | 0.5 | GO:0030674 | protein binding, bridging(GO:0030674) |