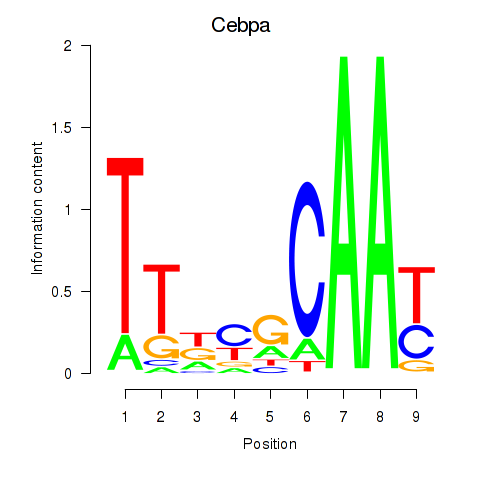
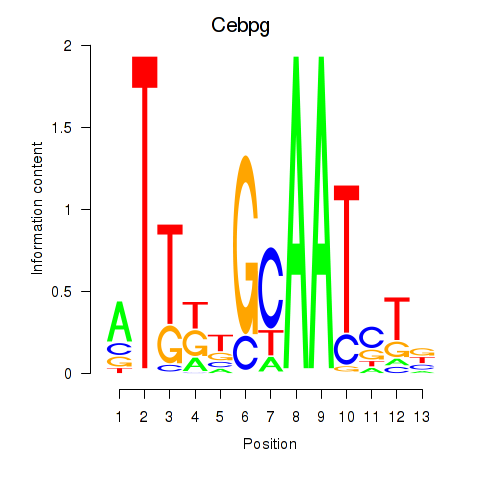
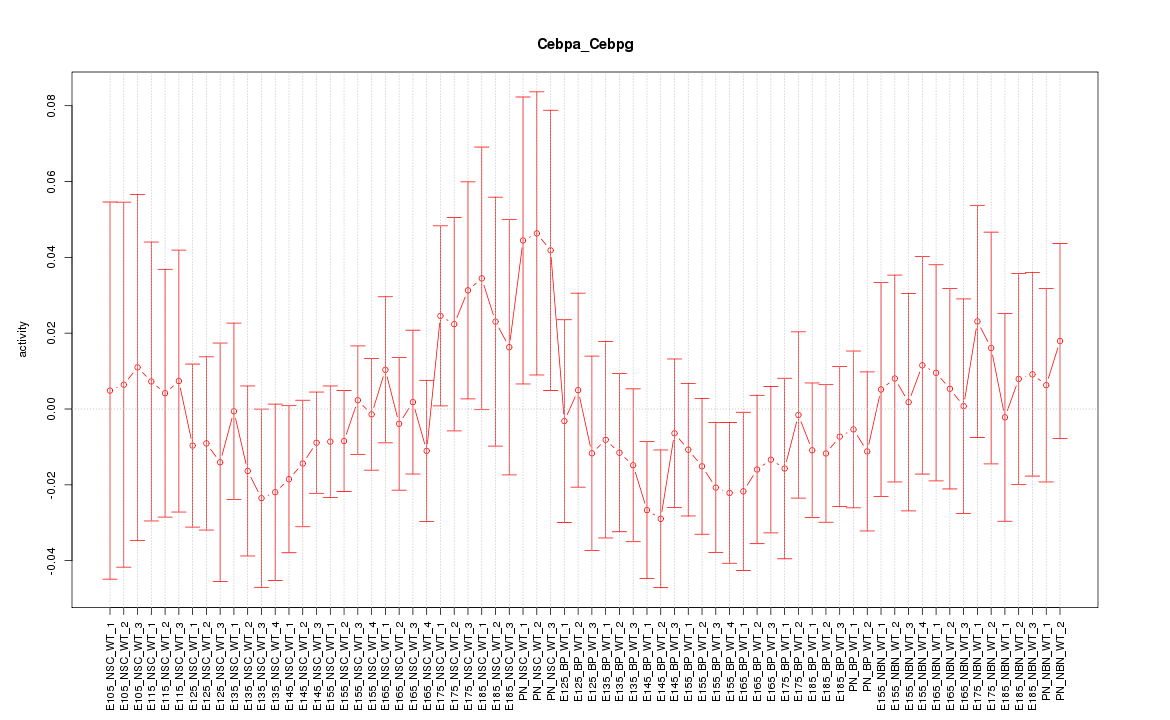
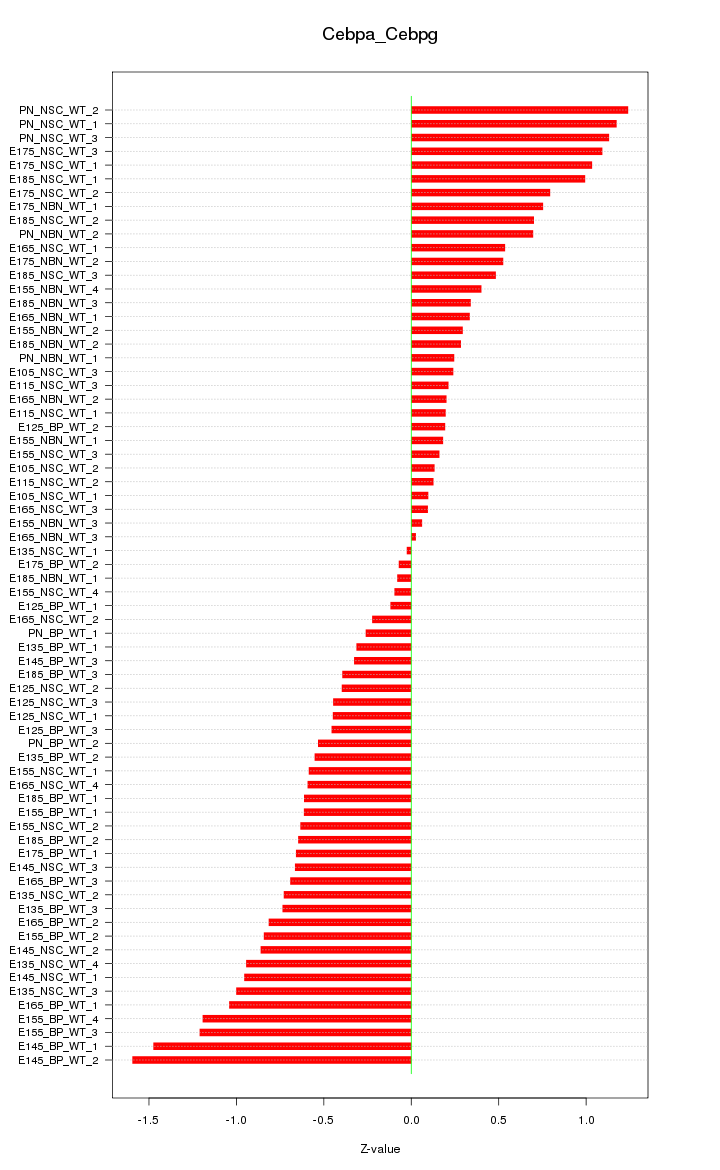
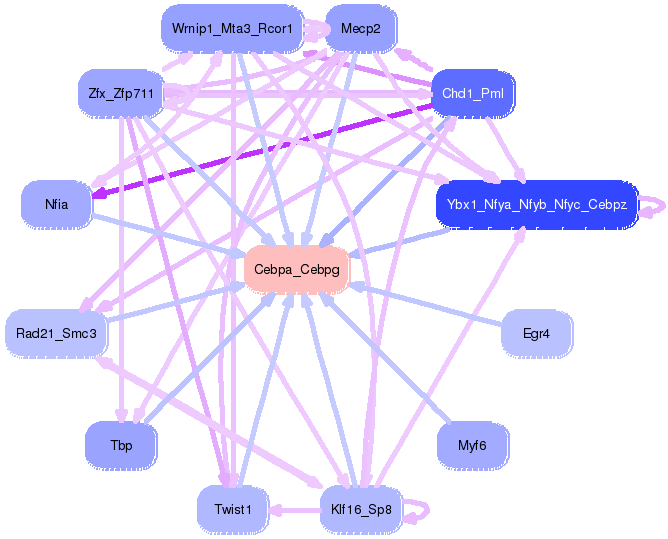
Motif ID: Cebpa_Cebpg
Z-value: 0.672
Transcription factors associated with Cebpa_Cebpg:
| Gene Symbol | Entrez ID | Gene Name |
|---|---|---|
| Cebpa | ENSMUSG00000034957.9 | Cebpa |
| Cebpg | ENSMUSG00000056216.8 | Cebpg |
Activity-expression correlation:
| Gene Symbol | Promoter | Pearson corr. coef. | P-value | Plot |
|---|---|---|---|---|
| Cebpg | mm10_v2_chr7_-_35056467_35056556 | -0.55 | 1.1e-06 | Click! |
| Cebpa | mm10_v2_chr7_+_35119285_35119301 | 0.48 | 3.0e-05 | Click! |

Top targets:
Gene overrepresentation in biological_process category:
| Log-likelihood per target | Total log-likelihood | Term | Description |
|---|---|---|---|
| 5.0 | 30.0 | GO:1902847 | macrophage proliferation(GO:0061517) microglial cell proliferation(GO:0061518) regulation of neuronal signal transduction(GO:1902847) positive regulation of tau-protein kinase activity(GO:1902949) |
| 2.2 | 6.6 | GO:0008228 | opsonization(GO:0008228) modulation of molecular function in other organism(GO:0044359) negative regulation of molecular function in other organism(GO:0044362) negative regulation of molecular function in other organism involved in symbiotic interaction(GO:0052204) modulation of molecular function in other organism involved in symbiotic interaction(GO:0052205) negative regulation by host of symbiont molecular function(GO:0052405) modification by host of symbiont molecular function(GO:0052428) |
| 1.1 | 4.2 | GO:2000427 | positive regulation of apoptotic cell clearance(GO:2000427) |
| 0.9 | 2.8 | GO:0090258 | negative regulation of mitochondrial fission(GO:0090258) |
| 0.9 | 4.6 | GO:0047484 | regulation of response to osmotic stress(GO:0047484) |
| 0.7 | 2.8 | GO:0001550 | ovarian cumulus expansion(GO:0001550) fused antrum stage(GO:0048165) |
| 0.6 | 3.0 | GO:0042167 | heme catabolic process(GO:0042167) pigment catabolic process(GO:0046149) |
| 0.5 | 2.1 | GO:0072675 | osteoclast fusion(GO:0072675) |
| 0.5 | 1.6 | GO:0021759 | globus pallidus development(GO:0021759) |
| 0.4 | 3.1 | GO:1990118 | sodium ion import across plasma membrane(GO:0098719) sodium ion import into cell(GO:1990118) |
| 0.4 | 1.8 | GO:0006564 | L-serine biosynthetic process(GO:0006564) |
| 0.3 | 2.3 | GO:0070458 | detoxification of nitrogen compound(GO:0051410) cellular detoxification of nitrogen compound(GO:0070458) |
| 0.3 | 5.8 | GO:0046688 | response to copper ion(GO:0046688) |
| 0.3 | 1.1 | GO:0019287 | isopentenyl diphosphate biosynthetic process(GO:0009240) isopentenyl diphosphate biosynthetic process, mevalonate pathway(GO:0019287) isopentenyl diphosphate metabolic process(GO:0046490) |
| 0.3 | 1.9 | GO:0070779 | D-aspartate transport(GO:0070777) D-aspartate import(GO:0070779) |
| 0.2 | 6.4 | GO:0071398 | cellular response to fatty acid(GO:0071398) |
| 0.2 | 0.7 | GO:0036292 | DNA rewinding(GO:0036292) |
| 0.2 | 0.6 | GO:0002184 | cytoplasmic translational termination(GO:0002184) |
| 0.2 | 0.9 | GO:0097527 | necroptotic signaling pathway(GO:0097527) |
| 0.2 | 1.4 | GO:0032264 | IMP salvage(GO:0032264) |
| 0.1 | 0.4 | GO:0006065 | UDP-glucuronate biosynthetic process(GO:0006065) |
| 0.1 | 0.6 | GO:0042701 | progesterone secretion(GO:0042701) |
| 0.1 | 0.4 | GO:0003278 | apoptotic process involved in heart morphogenesis(GO:0003278) |
| 0.1 | 1.0 | GO:1902993 | positive regulation of beta-amyloid formation(GO:1902004) positive regulation of amyloid precursor protein catabolic process(GO:1902993) |
| 0.1 | 1.0 | GO:1902916 | positive regulation of protein polyubiquitination(GO:1902916) |
| 0.1 | 0.7 | GO:0048251 | elastic fiber assembly(GO:0048251) |
| 0.1 | 0.3 | GO:0006931 | substrate-dependent cell migration, cell attachment to substrate(GO:0006931) calcium-independent cell-matrix adhesion(GO:0007161) |
| 0.1 | 0.2 | GO:0006421 | asparaginyl-tRNA aminoacylation(GO:0006421) |
| 0.1 | 1.8 | GO:0046039 | GTP metabolic process(GO:0046039) |
| 0.1 | 0.8 | GO:0006983 | ER overload response(GO:0006983) |
| 0.1 | 0.4 | GO:2000049 | positive regulation of cell-cell adhesion mediated by cadherin(GO:2000049) |
| 0.1 | 0.9 | GO:0045217 | cell-cell junction maintenance(GO:0045217) |
| 0.1 | 1.5 | GO:0033622 | integrin activation(GO:0033622) |
| 0.1 | 0.3 | GO:0046668 | regulation of retinal cell programmed cell death(GO:0046668) astrocyte activation(GO:0048143) regulation of resting membrane potential(GO:0060075) |
| 0.1 | 0.4 | GO:1902261 | positive regulation of delayed rectifier potassium channel activity(GO:1902261) positive regulation of voltage-gated potassium channel activity(GO:1903818) |
| 0.1 | 0.4 | GO:0030643 | cellular phosphate ion homeostasis(GO:0030643) cellular trivalent inorganic anion homeostasis(GO:0072502) |
| 0.1 | 0.7 | GO:0000185 | activation of MAPKKK activity(GO:0000185) |
| 0.1 | 0.6 | GO:2000741 | positive regulation of mesenchymal stem cell differentiation(GO:2000741) |
| 0.1 | 0.2 | GO:1903903 | regulation of establishment of T cell polarity(GO:1903903) |
| 0.1 | 0.2 | GO:1901165 | positive regulation of trophoblast cell migration(GO:1901165) |
| 0.1 | 2.5 | GO:0045744 | negative regulation of G-protein coupled receptor protein signaling pathway(GO:0045744) |
| 0.1 | 0.2 | GO:0000715 | nucleotide-excision repair, DNA damage recognition(GO:0000715) |
| 0.0 | 1.2 | GO:0032331 | negative regulation of chondrocyte differentiation(GO:0032331) |
| 0.0 | 0.3 | GO:0016557 | peroxisome membrane biogenesis(GO:0016557) |
| 0.0 | 0.3 | GO:0005513 | detection of calcium ion(GO:0005513) |
| 0.0 | 0.2 | GO:0071883 | activation of MAPK activity by adrenergic receptor signaling pathway(GO:0071883) |
| 0.0 | 0.2 | GO:0051684 | maintenance of Golgi location(GO:0051684) |
| 0.0 | 5.0 | GO:0007050 | cell cycle arrest(GO:0007050) |
| 0.0 | 0.2 | GO:0016127 | cholesterol catabolic process(GO:0006707) sterol catabolic process(GO:0016127) |
| 0.0 | 0.1 | GO:1902309 | negative regulation of peptidyl-serine dephosphorylation(GO:1902309) |
| 0.0 | 0.1 | GO:0006529 | asparagine biosynthetic process(GO:0006529) |
| 0.0 | 0.2 | GO:0032020 | ISG15-protein conjugation(GO:0032020) |
| 0.0 | 0.7 | GO:0032728 | positive regulation of interferon-beta production(GO:0032728) |
| 0.0 | 0.5 | GO:0007340 | acrosome reaction(GO:0007340) |
| 0.0 | 0.1 | GO:1903887 | motile primary cilium assembly(GO:1903887) |
| 0.0 | 0.2 | GO:0015937 | coenzyme A biosynthetic process(GO:0015937) |
| 0.0 | 1.0 | GO:0046847 | filopodium assembly(GO:0046847) |
| 0.0 | 0.4 | GO:0051497 | negative regulation of stress fiber assembly(GO:0051497) |
| 0.0 | 0.6 | GO:0060395 | SMAD protein signal transduction(GO:0060395) |
Gene overrepresentation in cellular_component category:
| Log-likelihood per target | Total log-likelihood | Term | Description |
|---|---|---|---|
| 4.3 | 30.0 | GO:0034366 | spherical high-density lipoprotein particle(GO:0034366) neurofibrillary tangle(GO:0097418) |
| 0.4 | 1.5 | GO:0031838 | haptoglobin-hemoglobin complex(GO:0031838) |
| 0.3 | 0.9 | GO:1990075 | stereocilia ankle link complex(GO:0002142) periciliary membrane compartment(GO:1990075) |
| 0.2 | 0.6 | GO:0018444 | translation release factor complex(GO:0018444) |
| 0.2 | 5.8 | GO:0046658 | anchored component of plasma membrane(GO:0046658) |
| 0.2 | 0.9 | GO:0031265 | CD95 death-inducing signaling complex(GO:0031265) |
| 0.1 | 0.3 | GO:0097058 | CRLF-CLCF1 complex(GO:0097058) |
| 0.1 | 2.8 | GO:0097440 | apical dendrite(GO:0097440) |
| 0.1 | 0.3 | GO:0005577 | fibrinogen complex(GO:0005577) |
| 0.1 | 0.6 | GO:0031254 | uropod(GO:0001931) cell trailing edge(GO:0031254) |
| 0.1 | 1.9 | GO:0030673 | axolemma(GO:0030673) |
| 0.1 | 7.9 | GO:0055037 | recycling endosome(GO:0055037) |
| 0.0 | 0.2 | GO:0071942 | XPC complex(GO:0071942) |
| 0.0 | 5.5 | GO:0019897 | extrinsic component of plasma membrane(GO:0019897) |
| 0.0 | 2.5 | GO:0031225 | anchored component of membrane(GO:0031225) |
| 0.0 | 0.7 | GO:0043596 | nuclear replication fork(GO:0043596) |
| 0.0 | 1.6 | GO:0030054 | cell junction(GO:0030054) |
| 0.0 | 0.1 | GO:0005742 | mitochondrial outer membrane translocase complex(GO:0005742) |
| 0.0 | 2.7 | GO:0031965 | nuclear membrane(GO:0031965) |
| 0.0 | 1.5 | GO:0005884 | actin filament(GO:0005884) |
| 0.0 | 0.3 | GO:0005779 | integral component of peroxisomal membrane(GO:0005779) |
Gene overrepresentation in molecular_function category:
| Log-likelihood per target | Total log-likelihood | Term | Description |
|---|---|---|---|
| 1.3 | 6.6 | GO:0001849 | complement component C1q binding(GO:0001849) |
| 1.3 | 30.0 | GO:0051787 | misfolded protein binding(GO:0051787) |
| 1.2 | 5.8 | GO:0016724 | ferroxidase activity(GO:0004322) oxidoreductase activity, oxidizing metal ions, oxygen as acceptor(GO:0016724) |
| 0.8 | 3.0 | GO:0004074 | biliverdin reductase activity(GO:0004074) |
| 0.5 | 4.2 | GO:0008429 | phosphatidylethanolamine binding(GO:0008429) |
| 0.5 | 1.9 | GO:0015501 | glutamate:sodium symporter activity(GO:0015501) |
| 0.4 | 3.1 | GO:0005451 | monovalent cation:proton antiporter activity(GO:0005451) sodium:proton antiporter activity(GO:0015385) potassium:proton antiporter activity(GO:0015386) |
| 0.4 | 1.5 | GO:0031721 | haptoglobin binding(GO:0031720) hemoglobin alpha binding(GO:0031721) |
| 0.3 | 2.8 | GO:0005025 | transforming growth factor beta receptor activity, type I(GO:0005025) |
| 0.2 | 0.7 | GO:0004720 | protein-lysine 6-oxidase activity(GO:0004720) |
| 0.2 | 1.4 | GO:0003876 | AMP deaminase activity(GO:0003876) adenosine-phosphate deaminase activity(GO:0047623) |
| 0.2 | 0.6 | GO:0008521 | acetyl-CoA transporter activity(GO:0008521) |
| 0.2 | 2.8 | GO:1990841 | promoter-specific chromatin binding(GO:1990841) |
| 0.2 | 6.4 | GO:0005504 | fatty acid binding(GO:0005504) |
| 0.1 | 1.6 | GO:0001161 | intronic transcription regulatory region sequence-specific DNA binding(GO:0001161) |
| 0.1 | 1.8 | GO:0005522 | profilin binding(GO:0005522) |
| 0.1 | 0.4 | GO:0003979 | UDP-glucose 6-dehydrogenase activity(GO:0003979) |
| 0.1 | 2.1 | GO:0050431 | transforming growth factor beta binding(GO:0050431) |
| 0.1 | 2.1 | GO:0003950 | NAD+ ADP-ribosyltransferase activity(GO:0003950) |
| 0.1 | 1.9 | GO:0004435 | phosphatidylinositol phospholipase C activity(GO:0004435) |
| 0.1 | 0.4 | GO:0047389 | glycerophosphocholine phosphodiesterase activity(GO:0047389) |
| 0.1 | 2.3 | GO:1900750 | glutathione binding(GO:0043295) oligopeptide binding(GO:1900750) |
| 0.1 | 0.2 | GO:0004816 | asparagine-tRNA ligase activity(GO:0004816) |
| 0.1 | 1.9 | GO:0008483 | transaminase activity(GO:0008483) |
| 0.1 | 0.5 | GO:0003747 | translation release factor activity(GO:0003747) translation termination factor activity(GO:0008079) |
| 0.1 | 0.7 | GO:0036310 | annealing helicase activity(GO:0036310) |
| 0.1 | 0.9 | GO:0005035 | tumor necrosis factor-activated receptor activity(GO:0005031) death receptor activity(GO:0005035) |
| 0.0 | 0.3 | GO:0042296 | ISG15 transferase activity(GO:0042296) |
| 0.0 | 0.2 | GO:0004594 | pantothenate kinase activity(GO:0004594) |
| 0.0 | 0.3 | GO:0005127 | ciliary neurotrophic factor receptor binding(GO:0005127) |
| 0.0 | 0.3 | GO:0045340 | mercury ion binding(GO:0045340) |
| 0.0 | 4.7 | GO:0008565 | protein transporter activity(GO:0008565) |
| 0.0 | 0.2 | GO:0003854 | 3-beta-hydroxy-delta5-steroid dehydrogenase activity(GO:0003854) |
| 0.0 | 0.4 | GO:0004185 | serine-type carboxypeptidase activity(GO:0004185) |
| 0.0 | 0.5 | GO:0005540 | hyaluronic acid binding(GO:0005540) |
| 0.0 | 1.5 | GO:0005547 | phosphatidylinositol-3,4,5-trisphosphate binding(GO:0005547) |
| 0.0 | 1.2 | GO:0005109 | frizzled binding(GO:0005109) |
| 0.0 | 0.4 | GO:0008301 | DNA binding, bending(GO:0008301) |
| 0.0 | 1.5 | GO:0004497 | monooxygenase activity(GO:0004497) |
| 0.0 | 0.1 | GO:0016018 | cyclosporin A binding(GO:0016018) |
| 0.0 | 0.1 | GO:0004066 | asparagine synthase (glutamine-hydrolyzing) activity(GO:0004066) |
| 0.0 | 0.9 | GO:0031624 | ubiquitin conjugating enzyme binding(GO:0031624) |
| 0.0 | 0.3 | GO:0015269 | calcium-activated potassium channel activity(GO:0015269) |
| 0.0 | 0.4 | GO:0016208 | AMP binding(GO:0016208) |
| 0.0 | 0.1 | GO:0047256 | beta-galactosyl-N-acetylglucosaminylgalactosylglucosyl-ceramide beta-1,3-acetylglucosaminyltransferase activity(GO:0008457) lactosylceramide 1,3-N-acetyl-beta-D-glucosaminyltransferase activity(GO:0047256) |
| 0.0 | 0.1 | GO:0050815 | phosphoserine binding(GO:0050815) |
| 0.0 | 1.7 | GO:0015399 | primary active transmembrane transporter activity(GO:0015399) P-P-bond-hydrolysis-driven transmembrane transporter activity(GO:0015405) ATPase activity, coupled to transmembrane movement of substances(GO:0042626) |
| 0.0 | 0.2 | GO:0005078 | MAP-kinase scaffold activity(GO:0005078) |
| 0.0 | 0.6 | GO:0035255 | ionotropic glutamate receptor binding(GO:0035255) |
|
|
|
|