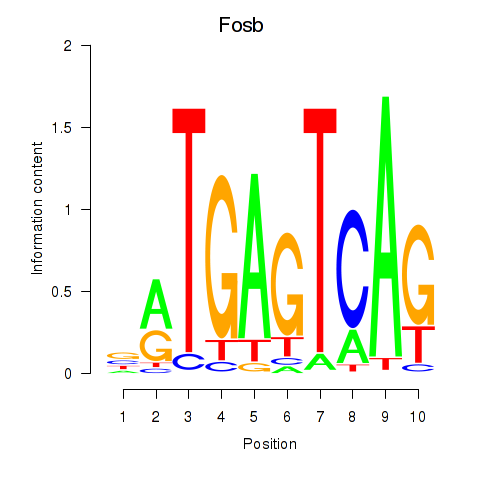
Motif ID: Fosb
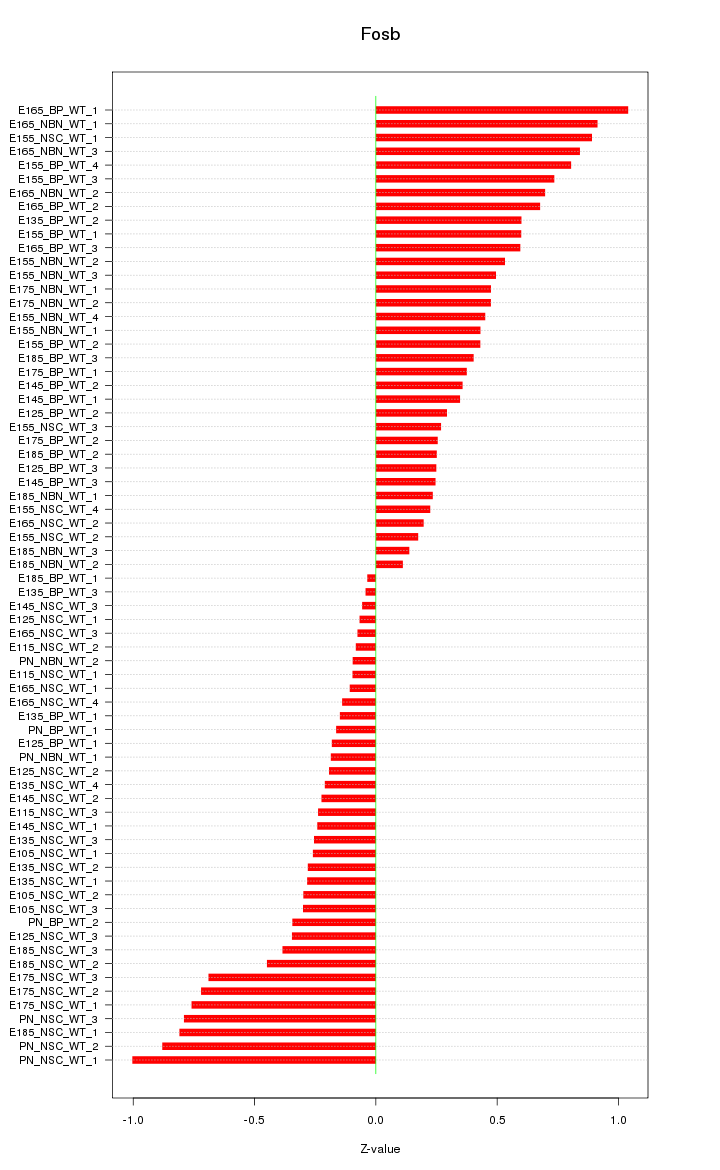
Z-value: 0.470
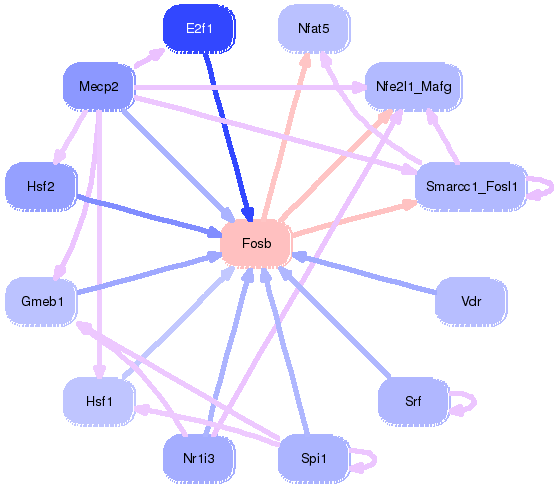
Transcription factors associated with Fosb:
| Gene Symbol | Entrez ID | Gene Name |
|---|---|---|
| Fosb | ENSMUSG00000003545.2 | Fosb |
Activity-expression correlation:
| Gene Symbol | Promoter | Pearson corr. coef. | P-value | Plot |
|---|---|---|---|---|
| Fosb | mm10_v2_chr7_-_19310035_19310050 | -0.68 | 1.1e-10 | Click! |


Top targets:
Gene overrepresentation in biological_process category:
| Log-likelihood per target | Total log-likelihood | Term | Description |
|---|---|---|---|
| 1.0 | 3.0 | GO:0002159 | desmosome assembly(GO:0002159) |
| 0.5 | 2.0 | GO:1904177 | regulation of adipose tissue development(GO:1904177) |
| 0.5 | 3.8 | GO:0034720 | positive regulation of mammary gland epithelial cell proliferation(GO:0033601) histone H3-K4 demethylation(GO:0034720) mammary duct terminal end bud growth(GO:0060763) |
| 0.5 | 1.9 | GO:2000774 | positive regulation of cellular senescence(GO:2000774) |
| 0.5 | 4.2 | GO:0060665 | regulation of branching involved in salivary gland morphogenesis by mesenchymal-epithelial signaling(GO:0060665) |
| 0.4 | 1.5 | GO:0003430 | growth plate cartilage chondrocyte growth(GO:0003430) Harderian gland development(GO:0070384) |
| 0.3 | 2.0 | GO:0048840 | otolith development(GO:0048840) |
| 0.3 | 2.5 | GO:1903847 | regulation of aorta morphogenesis(GO:1903847) positive regulation of aorta morphogenesis(GO:1903849) |
| 0.3 | 1.1 | GO:0038128 | ERBB2 signaling pathway(GO:0038128) |
| 0.3 | 1.4 | GO:0090164 | asymmetric Golgi ribbon formation(GO:0090164) |
| 0.2 | 1.6 | GO:0007296 | vitellogenesis(GO:0007296) |
| 0.2 | 1.4 | GO:1903056 | regulation of lens fiber cell differentiation(GO:1902746) positive regulation of lens fiber cell differentiation(GO:1902748) regulation of melanosome organization(GO:1903056) |
| 0.2 | 2.4 | GO:0043252 | sodium-independent organic anion transport(GO:0043252) |
| 0.2 | 1.2 | GO:0015862 | uridine transport(GO:0015862) |
| 0.1 | 0.6 | GO:0072344 | rescue of stalled ribosome(GO:0072344) |
| 0.1 | 0.8 | GO:0097368 | establishment of Sertoli cell barrier(GO:0097368) |
| 0.1 | 4.0 | GO:0021952 | central nervous system projection neuron axonogenesis(GO:0021952) |
| 0.1 | 0.8 | GO:0061635 | regulation of protein complex stability(GO:0061635) |
| 0.1 | 2.1 | GO:2000369 | regulation of clathrin-mediated endocytosis(GO:2000369) |
| 0.1 | 4.4 | GO:1900026 | positive regulation of substrate adhesion-dependent cell spreading(GO:1900026) |
| 0.1 | 0.5 | GO:2001204 | regulation of osteoclast development(GO:2001204) |
| 0.1 | 2.3 | GO:0035458 | cellular response to interferon-beta(GO:0035458) |
| 0.1 | 0.9 | GO:1902993 | positive regulation of beta-amyloid formation(GO:1902004) positive regulation of amyloid precursor protein catabolic process(GO:1902993) |
| 0.1 | 1.2 | GO:0070884 | regulation of calcineurin-NFAT signaling cascade(GO:0070884) |
| 0.1 | 2.8 | GO:0072583 | clathrin-mediated endocytosis(GO:0072583) |
| 0.0 | 1.2 | GO:0043552 | positive regulation of phosphatidylinositol 3-kinase activity(GO:0043552) |
| 0.0 | 0.5 | GO:0030836 | positive regulation of actin filament depolymerization(GO:0030836) actin filament severing(GO:0051014) |
| 0.0 | 0.2 | GO:0031915 | positive regulation of synaptic plasticity(GO:0031915) regulation of keratinocyte migration(GO:0051547) positive regulation of keratinocyte migration(GO:0051549) positive regulation of receptor binding(GO:1900122) |
| 0.0 | 4.8 | GO:0007613 | memory(GO:0007613) |
| 0.0 | 2.8 | GO:0006096 | glycolytic process(GO:0006096) ATP generation from ADP(GO:0006757) |
| 0.0 | 1.6 | GO:0045806 | negative regulation of endocytosis(GO:0045806) |
| 0.0 | 0.8 | GO:0035335 | peptidyl-tyrosine dephosphorylation(GO:0035335) |
| 0.0 | 0.5 | GO:0033198 | response to ATP(GO:0033198) |
| 0.0 | 2.3 | GO:0001701 | in utero embryonic development(GO:0001701) |
| 0.0 | 0.4 | GO:0043248 | proteasome assembly(GO:0043248) |
| 0.0 | 1.6 | GO:0046888 | negative regulation of hormone secretion(GO:0046888) |
| 0.0 | 0.6 | GO:0015985 | energy coupled proton transport, down electrochemical gradient(GO:0015985) ATP synthesis coupled proton transport(GO:0015986) |
| 0.0 | 0.7 | GO:0045104 | intermediate filament cytoskeleton organization(GO:0045104) |
| 0.0 | 0.5 | GO:0072337 | modified amino acid transport(GO:0072337) |
| 0.0 | 0.5 | GO:2000279 | negative regulation of DNA biosynthetic process(GO:2000279) |
| 0.0 | 0.5 | GO:0090162 | establishment of epithelial cell polarity(GO:0090162) |
Gene overrepresentation in cellular_component category:
| Log-likelihood per target | Total log-likelihood | Term | Description |
|---|---|---|---|
| 0.6 | 2.8 | GO:0000015 | phosphopyruvate hydratase complex(GO:0000015) |
| 0.3 | 2.1 | GO:0071439 | clathrin complex(GO:0071439) |
| 0.3 | 4.4 | GO:0042581 | specific granule(GO:0042581) |
| 0.3 | 3.0 | GO:0071664 | catenin-TCF7L2 complex(GO:0071664) |
| 0.3 | 2.0 | GO:0005638 | lamin filament(GO:0005638) |
| 0.3 | 0.8 | GO:0044754 | amphisome(GO:0044753) autolysosome(GO:0044754) |
| 0.3 | 2.8 | GO:0030130 | clathrin coat of trans-Golgi network vesicle(GO:0030130) |
| 0.1 | 4.4 | GO:0048786 | presynaptic active zone(GO:0048786) |
| 0.1 | 0.5 | GO:0061689 | tricellular tight junction(GO:0061689) |
| 0.1 | 2.4 | GO:0046658 | anchored component of plasma membrane(GO:0046658) |
| 0.1 | 0.7 | GO:0045095 | keratin filament(GO:0045095) |
| 0.1 | 3.7 | GO:0042734 | presynaptic membrane(GO:0042734) |
| 0.1 | 4.2 | GO:0009925 | basal plasma membrane(GO:0009925) |
| 0.1 | 2.0 | GO:0032809 | neuronal cell body membrane(GO:0032809) |
| 0.0 | 0.6 | GO:0000276 | mitochondrial proton-transporting ATP synthase complex, coupling factor F(o)(GO:0000276) |
| 0.0 | 2.2 | GO:0016459 | myosin complex(GO:0016459) |
| 0.0 | 0.5 | GO:0031229 | integral component of nuclear inner membrane(GO:0005639) intrinsic component of nuclear inner membrane(GO:0031229) |
| 0.0 | 0.4 | GO:0005838 | proteasome regulatory particle(GO:0005838) |
| 0.0 | 4.0 | GO:0014069 | postsynaptic density(GO:0014069) postsynaptic specialization(GO:0099572) |
Gene overrepresentation in molecular_function category:
| Log-likelihood per target | Total log-likelihood | Term | Description |
|---|---|---|---|
| 1.3 | 3.8 | GO:0034647 | histone demethylase activity (H3-trimethyl-K4 specific)(GO:0034647) |
| 1.0 | 4.2 | GO:0005008 | hepatocyte growth factor-activated receptor activity(GO:0005008) |
| 0.6 | 2.3 | GO:0008853 | exodeoxyribonuclease III activity(GO:0008853) |
| 0.3 | 2.8 | GO:0032050 | clathrin heavy chain binding(GO:0032050) |
| 0.3 | 2.8 | GO:0004634 | phosphopyruvate hydratase activity(GO:0004634) |
| 0.2 | 3.0 | GO:0045294 | alpha-catenin binding(GO:0045294) |
| 0.2 | 2.4 | GO:0015347 | sodium-independent organic anion transmembrane transporter activity(GO:0015347) |
| 0.2 | 0.7 | GO:1990254 | keratin filament binding(GO:1990254) |
| 0.2 | 0.7 | GO:0003998 | acylphosphatase activity(GO:0003998) |
| 0.2 | 2.0 | GO:0005388 | calcium-transporting ATPase activity(GO:0005388) |
| 0.1 | 2.1 | GO:0035612 | AP-2 adaptor complex binding(GO:0035612) |
| 0.1 | 0.5 | GO:0015220 | choline transmembrane transporter activity(GO:0015220) |
| 0.1 | 4.4 | GO:0045296 | cadherin binding(GO:0045296) |
| 0.1 | 0.5 | GO:0035381 | extracellular ATP-gated cation channel activity(GO:0004931) ATP-gated ion channel activity(GO:0035381) |
| 0.1 | 1.5 | GO:0003708 | retinoic acid receptor activity(GO:0003708) |
| 0.1 | 2.0 | GO:0008157 | protein phosphatase 1 binding(GO:0008157) |
| 0.1 | 1.6 | GO:0017075 | syntaxin-1 binding(GO:0017075) |
| 0.1 | 1.2 | GO:0005337 | nucleoside transmembrane transporter activity(GO:0005337) |
| 0.1 | 1.2 | GO:0030676 | Rac guanyl-nucleotide exchange factor activity(GO:0030676) |
| 0.1 | 0.8 | GO:0030898 | actin-dependent ATPase activity(GO:0030898) |
| 0.0 | 2.5 | GO:0046875 | ephrin receptor binding(GO:0046875) |
| 0.0 | 0.5 | GO:0005225 | volume-sensitive anion channel activity(GO:0005225) |
| 0.0 | 1.0 | GO:0031489 | myosin V binding(GO:0031489) |
| 0.0 | 1.4 | GO:0070412 | R-SMAD binding(GO:0070412) |
| 0.0 | 4.8 | GO:0004702 | receptor signaling protein serine/threonine kinase activity(GO:0004702) |
| 0.0 | 0.8 | GO:0070530 | K63-linked polyubiquitin binding(GO:0070530) |
| 0.0 | 1.4 | GO:0043531 | ADP binding(GO:0043531) |
| 0.0 | 4.4 | GO:0030165 | PDZ domain binding(GO:0030165) |
| 0.0 | 0.8 | GO:0017017 | MAP kinase tyrosine/serine/threonine phosphatase activity(GO:0017017) |
| 0.0 | 0.6 | GO:0003746 | translation elongation factor activity(GO:0003746) |
| 0.0 | 1.6 | GO:0005125 | cytokine activity(GO:0005125) growth factor activity(GO:0008083) |
| 0.0 | 1.2 | GO:0043851 | rRNA (adenine-N6,N6-)-dimethyltransferase activity(GO:0000179) rRNA (uridine-2'-O-)-methyltransferase activity(GO:0008650) rRNA (adenine-N6-)-methyltransferase activity(GO:0008988) rRNA (cytosine-C5-)-methyltransferase activity(GO:0009383) selenocysteine methyltransferase activity(GO:0016205) rRNA (adenine) methyltransferase activity(GO:0016433) rRNA (cytosine) methyltransferase activity(GO:0016434) rRNA (guanine) methyltransferase activity(GO:0016435) 1-phenanthrol methyltransferase activity(GO:0018707) protein-arginine N5-methyltransferase activity(GO:0019702) dimethylarsinite methyltransferase activity(GO:0034541) 4,5-dihydroxybenzo(a)pyrene methyltransferase activity(GO:0034807) 1-hydroxypyrene methyltransferase activity(GO:0034931) 1-hydroxy-6-methoxypyrene methyltransferase activity(GO:0034933) demethylmenaquinone methyltransferase activity(GO:0043770) cobalt-precorrin-6B C5-methyltransferase activity(GO:0043776) cobalt-precorrin-7 C15-methyltransferase activity(GO:0043777) cobalt-precorrin-5B C1-methyltransferase activity(GO:0043780) cobalt-precorrin-3 C17-methyltransferase activity(GO:0043782) dimethylamine methyltransferase activity(GO:0043791) hydroxyneurosporene-O-methyltransferase activity(GO:0043803) tRNA (adenine-57, 58-N(1)-) methyltransferase activity(GO:0043827) methylamine-specific methylcobalamin:coenzyme M methyltransferase activity(GO:0043833) trimethylamine methyltransferase activity(GO:0043834) methanol-specific methylcobalamin:coenzyme M methyltransferase activity(GO:0043851) monomethylamine methyltransferase activity(GO:0043852) P-methyltransferase activity(GO:0051994) Se-methyltransferase activity(GO:0051995) 2-phytyl-1,4-naphthoquinone methyltransferase activity(GO:0052624) tRNA (uracil-2'-O-)-methyltransferase activity(GO:0052665) tRNA (cytosine-2'-O-)-methyltransferase activity(GO:0052666) phosphomethylethanolamine N-methyltransferase activity(GO:0052667) tRNA (cytosine-3-)-methyltransferase activity(GO:0052735) rRNA (cytosine-2'-O-)-methyltransferase activity(GO:0070677) rRNA (cytosine-N4-)-methyltransferase activity(GO:0071424) trihydroxyferuloyl spermidine O-methyltransferase activity(GO:0080012) |
| 0.0 | 2.6 | GO:0030246 | carbohydrate binding(GO:0030246) |
| 0.0 | 1.1 | GO:0004725 | protein tyrosine phosphatase activity(GO:0004725) |
| 0.0 | 0.5 | GO:0030544 | Hsp70 protein binding(GO:0030544) |